mineral resource estimate great victoria gold … jorc resource.pdf · mineral resource estimate...
TRANSCRIPT
RUNGE L IMITED abn 17 010 672 321
MINERAL RESOURCE ESTIMATE GREAT VICTORIA GOLD PROJECT
MARVEL LOCH, WESTERN AUSTRALIA
St Barbara Limited
August, 2008
Mineral Resource Estimate Great Victoria Gold Project
Marvel Loch, Western Australia
Project Team: Robert Williams Ian O’Grady
Runge Limited St Barbara Limited GVG Resource Report
Page ii
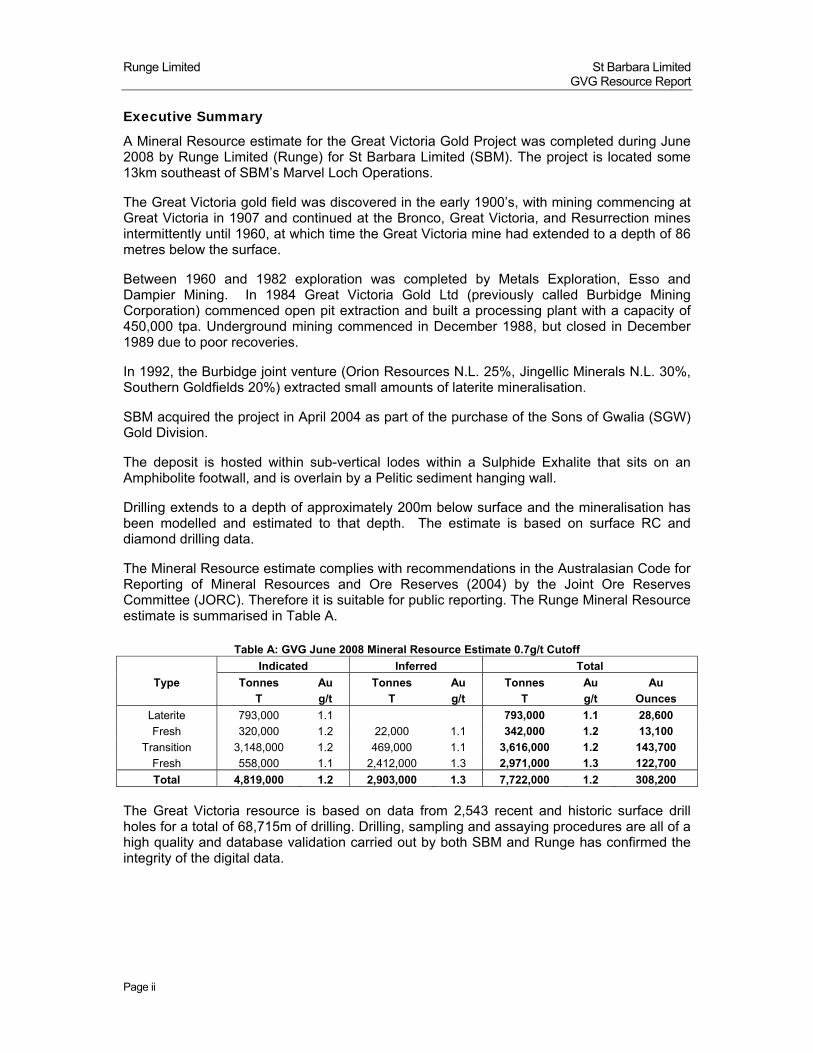
Executive Summary
A Mineral Resource estimate for the Great Victoria Gold Project was completed during June 2008 by Runge Limited (Runge) for St Barbara Limited (SBM). The project is located some 13km southeast of SBM’s Marvel Loch Operations.
The Great Victoria gold field was discovered in the early 1900’s, with mining commencing at Great Victoria in 1907 and continued at the Bronco, Great Victoria, and Resurrection mines intermittently until 1960, at which time the Great Victoria mine had extended to a depth of 86 metres below the surface.
Between 1960 and 1982 exploration was completed by Metals Exploration, Esso and Dampier Mining. In 1984 Great Victoria Gold Ltd (previously called Burbidge Mining Corporation) commenced open pit extraction and built a processing plant with a capacity of 450,000 tpa. Underground mining commenced in December 1988, but closed in December 1989 due to poor recoveries.
In 1992, the Burbidge joint venture (Orion Resources N.L. 25%, Jingellic Minerals N.L. 30%, Southern Goldfields 20%) extracted small amounts of laterite mineralisation.
SBM acquired the project in April 2004 as part of the purchase of the Sons of Gwalia (SGW) Gold Division.
The deposit is hosted within sub-vertical lodes within a Sulphide Exhalite that sits on an Amphibolite footwall, and is overlain by a Pelitic sediment hanging wall.
Drilling extends to a depth of approximately 200m below surface and the mineralisation has been modelled and estimated to that depth. The estimate is based on surface RC and diamond drilling data.
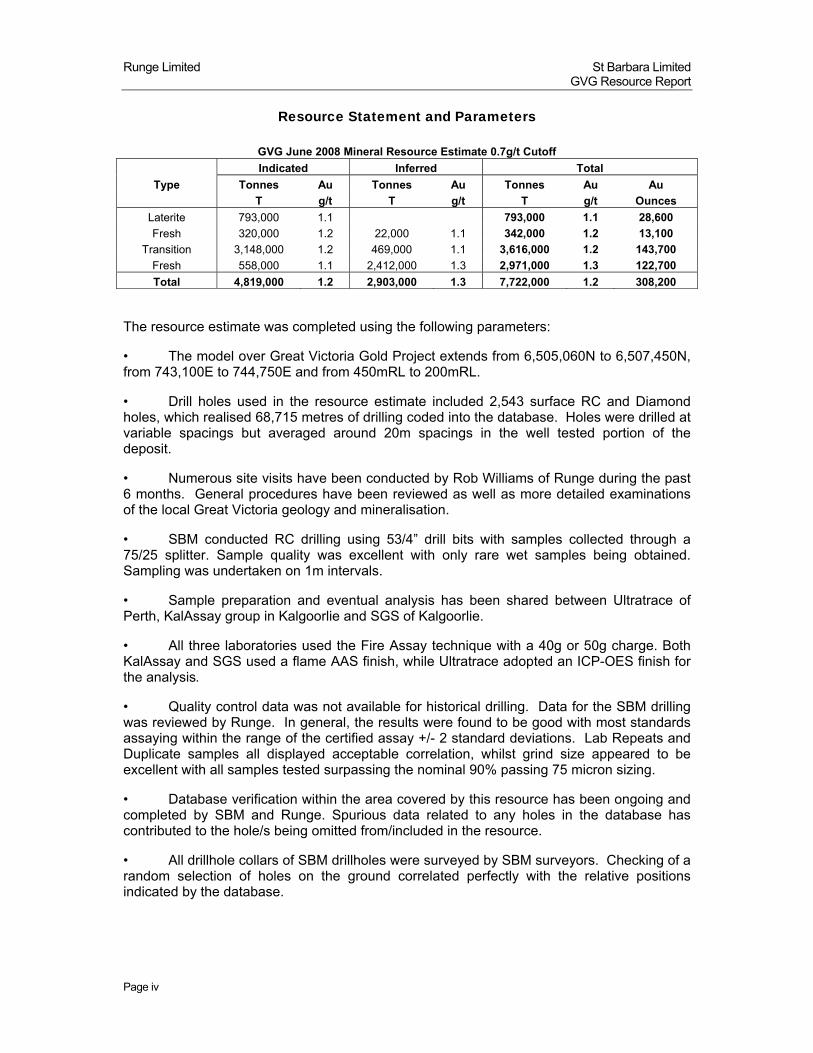
The Mineral Resource estimate complies with recommendations in the Australasian Code for Reporting of Mineral Resources and Ore Reserves (2004) by the Joint Ore Reserves Committee (JORC). Therefore it is suitable for public reporting. The Runge Mineral Resource estimate is summarised in Table A.
Table A: GVG June 2008 Mineral Resource Estimate 0.7g/t Cutoff
Indicated Inferred Total
Type Tonnes Au Tonnes Au Tonnes Au Au
T g/t T g/t T g/t Ounces
Laterite 793,000 1.1 793,000 1.1 28,600
Fresh 320,000 1.2 22,000 1.1 342,000 1.2 13,100
Transition 3,148,000 1.2 469,000 1.1 3,616,000 1.2 143,700
Fresh 558,000 1.1 2,412,000 1.3 2,971,000 1.3 122,700
Total 4,819,000 1.2 2,903,000 1.3 7,722,000 1.2 308,200
The Great Victoria resource is based on data from 2,543 recent and historic surface drill holes for a total of 68,715m of drilling. Drilling, sampling and assaying procedures are all of a high quality and database validation carried out by both SBM and Runge has confirmed the integrity of the digital data.
Runge Limited St Barbara Limited GVG Resource Report
Page iii
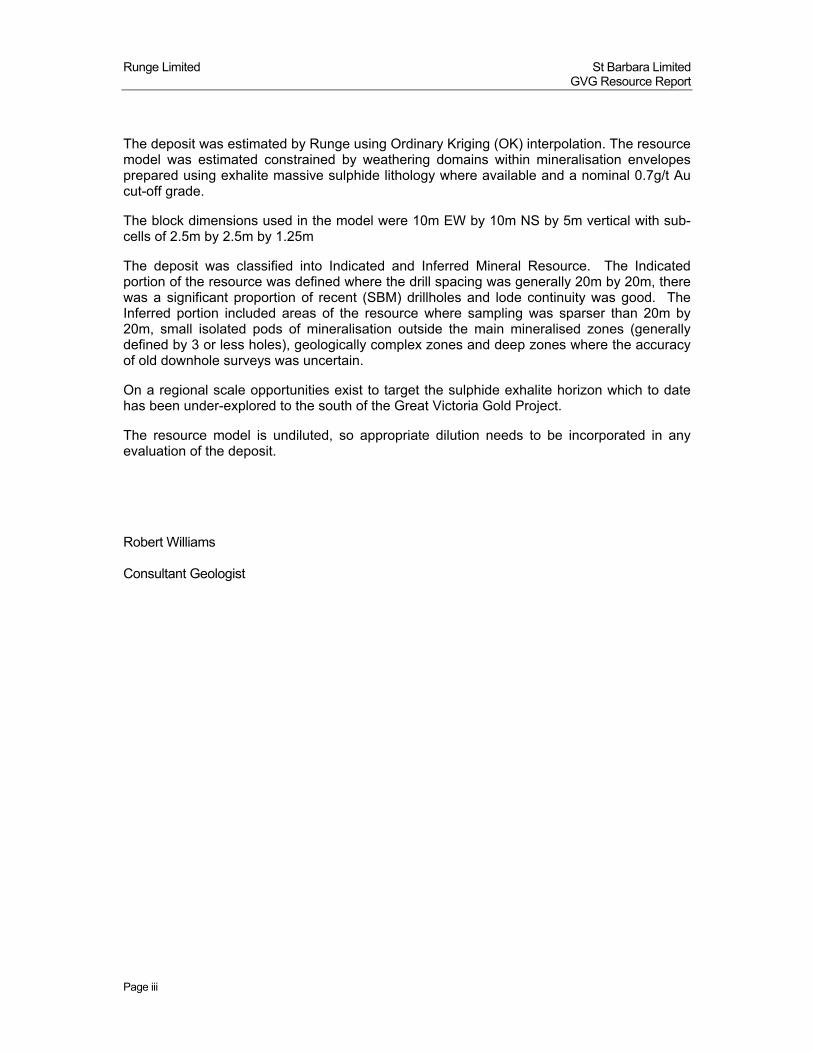
The deposit was estimated by Runge using Ordinary Kriging (OK) interpolation. The resource model was estimated constrained by weathering domains within mineralisation envelopes prepared using exhalite massive sulphide lithology where available and a nominal 0.7g/t Au cut-off grade.
The block dimensions used in the model were 10m EW by 10m NS by 5m vertical with sub-cells of 2.5m by 2.5m by 1.25m
The deposit was classified into Indicated and Inferred Mineral Resource. The Indicated portion of the resource was defined where the drill spacing was generally 20m by 20m, there was a significant proportion of recent (SBM) drillholes and lode continuity was good. The Inferred portion included areas of the resource where sampling was sparser than 20m by 20m, small isolated pods of mineralisation outside the main mineralised zones (generally defined by 3 or less holes), geologically complex zones and deep zones where the accuracy of old downhole surveys was uncertain.
On a regional scale opportunities exist to target the sulphide exhalite horizon which to date has been under-explored to the south of the Great Victoria Gold Project.
The resource model is undiluted, so appropriate dilution needs to be incorporated in any evaluation of the deposit.
Robert Williams Consultant Geologist
Runge Limited St Barbara Limited GVG Resource Report
Page iv
Resource Statement and Parameters
GVG June 2008 Mineral Resource Estimate 0.7g/t Cutoff
Indicated Inferred Total
Type Tonnes Au Tonnes Au Tonnes Au Au
T g/t T g/t T g/t Ounces
Laterite 793,000 1.1 793,000 1.1 28,600
Fresh 320,000 1.2 22,000 1.1 342,000 1.2 13,100
Transition 3,148,000 1.2 469,000 1.1 3,616,000 1.2 143,700
Fresh 558,000 1.1 2,412,000 1.3 2,971,000 1.3 122,700
Total 4,819,000 1.2 2,903,000 1.3 7,722,000 1.2 308,200
The resource estimate was completed using the following parameters:
• The model over Great Victoria Gold Project extends from 6,505,060N to 6,507,450N, from 743,100E to 744,750E and from 450mRL to 200mRL.
• Drill holes used in the resource estimate included 2,543 surface RC and Diamond holes, which realised 68,715 metres of drilling coded into the database. Holes were drilled at variable spacings but averaged around 20m spacings in the well tested portion of the deposit.
• Numerous site visits have been conducted by Rob Williams of Runge during the past 6 months. General procedures have been reviewed as well as more detailed examinations of the local Great Victoria geology and mineralisation.
• SBM conducted RC drilling using 53/4” drill bits with samples collected through a 75/25 splitter. Sample quality was excellent with only rare wet samples being obtained. Sampling was undertaken on 1m intervals.
• Sample preparation and eventual analysis has been shared between Ultratrace of Perth, KalAssay group in Kalgoorlie and SGS of Kalgoorlie.
• All three laboratories used the Fire Assay technique with a 40g or 50g charge. Both KalAssay and SGS used a flame AAS finish, while Ultratrace adopted an ICP-OES finish for the analysis.
• Quality control data was not available for historical drilling. Data for the SBM drilling was reviewed by Runge. In general, the results were found to be good with most standards assaying within the range of the certified assay +/- 2 standard deviations. Lab Repeats and Duplicate samples all displayed acceptable correlation, whilst grind size appeared to be excellent with all samples tested surpassing the nominal 90% passing 75 micron sizing.
• Database verification within the area covered by this resource has been ongoing and completed by SBM and Runge. Spurious data related to any holes in the database has contributed to the hole/s being omitted from/included in the resource.
• All drillhole collars of SBM drillholes were surveyed by SBM surveyors. Checking of a random selection of holes on the ground correlated perfectly with the relative positions indicated by the database.
Runge Limited St Barbara Limited GVG Resource Report
Page v
• Downhole surveys were conducted by both Ausmines using an Electronic Multishot (EMS) and Downhole Surveys with a Gyro tool.
• The mineralisation wireframe was constructed using cross sectional interpretation based on a 0.7g/t Au cut-off grade. A minimum down hole length of 3m was used with no edge dilution. Generally up to 3-4m of internal dilution was included. Resource outlines were generally extrapolated to half the distance of the nearest drillhole.
• Samples within the wireframes were composited to even 1.0m intervals based on analysis of the sample lengths in the database. Various single high grade cuts were used for each domain.
• Ordinary Kriging (OK) interpolation with an oriented ‘ellipsoid’ search was used to estimate Au. Greater than 95% of the blocks were filled in the first two passes. A third pass was used to fill any unestimated blocks.
• The Surpac block dimensions used in the model were 10m EW by 10m NS by 5m vertical with sub-cells of 2.5m by 2.5m by 1.25m.
• Bulk density values of 2.71t/m3 for Laterite, 1.84t/m3 for Upper Saprolite, 2t/m3 for Lower Saprolite and 3.70t/m3 for Fresh rock was used throughout the model. Various bulk densities were used for Saprock ranging from 2.86t/m3 in the Phoenix and Bronco South areas, 2.99t/m3 at Flying Pig, Tenacious Pig, Bronco, Resurrection and Vintage Crop and 3.41t/m3 in the Grand National area. Density values were derived from SBM testwork on 241 samples, which involved wax-coated rock samples and pycnometer readings of sample pulps.
• The resource was classified as Indicated and Inferred Mineral Resource. The Indicated portion of the resource was defined where the drill spacing was generally less than 30m by 30m, there was a significant proportion of new drillholes and lode continuity was good. The Inferred included areas of the resource where sampling was greater than 30m by 30m, small isolated pods of mineralisation outside the main mineralised zones or geologically complex zones.
Runge Limited St Barbara Limited GVG Resource Report
Page vi
IMPORTANT INFORMATION ABOUT THIS DOCUMENT Confidentiality This document and all information contained herein are confidential and intended for St Barbara Limited (SBM) use only. It shall not be disclosed, in part or full, to any third party, without Runge Limited’s (Runge) prior written consent to the form and context of the disclosure and the identity of the person(s) to whom it is to be disclosed. Limited purpose and context of Information
The opinions expressed in this document are addressed only to SBM for its benefit with respect to this project. Runge accepts no liability whatsoever for any loss or damage (including consequential or economic loss or damage) arising as a result of reliance on the information presented herein for any party other than SBM.
Responsibility
Runge has exercised reasonable care in accordance with standards normally exercised within our profession in the completion of this document.
Runge has relied on information provided by SBM. Although Runge has exercised reasonable care in reviewing this data, Runge makes no representation or warranty with respect to the accuracy or veracity of the data that it has relied upon.
Currency of Information This document has been prepared as at the date stated on the cover page. Given the nature of this document and the opinions expressed within, developments after the date of this document are likely. This document takes no account of such potential future developments. Therefore Runge recommends that SBM seek advice from Runge in the future to ascertain whether any such events have occurred or updated information has become available and should be considered.
Runge Limited St Barbara Limited GVG Resource Report
Page vii
Table of Contents
Executive Summary ................................................................................................................................................ ii Resource Statement and Parameters .................................................................................................................. iv 1 Introduction and Project Summary ............................................................................................................... 1
1.1 General ..................................................................................................................................................... 1 1.2 Competent Persons and Responsibilities .............................................................................................. 2
2 Geology and Mineralisation ........................................................................................................................... 3 2.1 Regional Geology .................................................................................................................................... 3 2.2 Local Geology .......................................................................................................................................... 4
3 Mining Status .................................................................................................................................................. 4 3.1 Historical Production ................................................................................................................................ 4 3.2 Current Mining ......................................................................................................................................... 5
4 Previous Estimates ........................................................................................................................................ 5 5 Drilling Data .................................................................................................................................................... 6
5.1 Summary .................................................................................................................................................. 6 5.2 Drill Methods ............................................................................................................................................ 6 5.3 Collar and Down Hole Surveys ............................................................................................................... 6 5.4 Geological Logging .................................................................................................................................. 6 5.5 Sampling .................................................................................................................................................. 6
5.5.1 Sampling Methodology .............................................................................................................. 6 5.5.2 Sample Preparation ................................................................................................................... 7
5.6 Data Excluded From Estimate ................................................................................................................ 7 6 Methodology ................................................................................................................................................... 7
6.1 Assay Methodology ................................................................................................................................. 7 6.2 Quality Control ......................................................................................................................................... 7
6.2.1 Protocol ....................................................................................................................................... 7 6.2.2 Standards.................................................................................................................................... 8 6.2.3 Internal Laboratory Repeats ...................................................................................................... 9 6.2.4 Secondary Pulp Analysis ........................................................................................................ 10 6.2.5 Field Duplicates ....................................................................................................................... 11 6.2.6 Lab Check Assays .................................................................................................................. 11 6.2.7 Sizing Analysis ........................................................................................................................ 12
7 Density Data ................................................................................................................................................. 13 7.1 Methodology .......................................................................................................................................... 13 7.2 Results ................................................................................................................................................... 13
8 Metallurgical Test Work ............................................................................................................................... 14 9 Data Verification ........................................................................................................................................... 14 10 Interpretation and Deposit Statistics ..................................................................................................... 14
10.1 Geology and Resource Interpretation ............................................................................................. 14 10.2 Preparation of Wireframes ............................................................................................................... 15
10.2.1 Resource ................................................................................................................................. 15 10.3 Sample Statistics .............................................................................................................................. 16
10.3.1 General .................................................................................................................................... 16 10.4 Deposit Statistics ............................................................................................................................... 17
10.4.1 Composite Statistics ................................................................................................................ 17 10.4.2 High Grade Cuts ...................................................................................................................... 20
10.5 Geostatistical Analysis ...................................................................................................................... 21 10.5.1 Variography ............................................................................................................................. 21
11 Resource Estimate ................................................................................................................................ 23 11.1 Block Model ....................................................................................................................................... 23 11.2 Grade Interpolation ........................................................................................................................... 24 11.3 Density and Material Type ................................................................................................................ 24 11.4 Resource Classification .................................................................................................................... 25 11.5 Results ............................................................................................................................................... 27 11.6 Model Validation ............................................................................................................................... 28
12 Reconciliation ......................................................................................................................................... 30 12.1 Mining ................................................................................................................................................ 30
Runge Limited St Barbara Limited GVG Resource Report
Page viii
13 Risk and Opportunities .......................................................................................................................... 31 14 Conclusion and Recommendations ..................................................................................................... 31 15 References ............................................................................................................................................. 32
Table of Figures
Figure 1-1 Great Victoria Regional Setting ........................................................................................................................... 1 Figure 1-2 Great Victoria Gold Project – All Resource Drilling and Open Pits ................................................................ 2 Figure 2-1 Regional Geology of the Marvel Loch area ........................................................................................................ 3 Figure 3-1 View of Cutback on the Lode 2 Pit, Great Victoria ............................................................................................. 5 Figure 6-1 GVG Drilling Campaign Standard Analysis....................................................................................................... 9 Figure 6-2 Scatter Plot of Internal Lab Repeats .................................................................................................................. 10 Figure 6-3 Secondary Pulp Analysis .................................................................................................................................... 10 Figure 6-4 Duplicate Sample Analysis ................................................................................................................................. 11 Figure 6-5 Check Assay Analysis ......................................................................................................................................... 12 Figure 6-6 GVG Sizing Analysis ........................................................................................................................................... 12 Figure 10-1 Plan View of the GVG Resource Wireframes .................................................................................................. 15 Figure 10-2 Sample Length Histogram Within the Resource Wireframes ........................................................................ 17 Figure 10-3 Omnidirectional Variograms for Grand National - laterite (L), Grand National – sap (M) and Bronco - fresh (R) ................................................................................................................................................................................... 21 Figure 11-1 Resource Classification Indicated (green); Inferred (red); Mined areas in blue ......................................... 26 Figure 11-2 Great Victoria Resource Estimate June 2008 (0.7g/t Au Cut Off) ................................................................. 27 Figure 11-3 Great Victoria Mineral Resource (10m Bench Breakdown) .......................................................................... 27 Figure 11-4 Great Victoria Mineral Resource Grade-Tonnage Curve ............................................................................. 28 Figure 11-5 Grand National Laterites Mineral Resource Validation Plot by 20m Northing........................................... 28 Figure 11-6 Grand National (Object8) Mineral Resource Validation Plot by 20m Northing ......................................... 29 Figure 11-7 Grand National (Obj8) Mineral Resource Validation Plot by 10m Elevation ............................................. 29 Figure 11-8 Great Victoria Mineral Resource Composite and Global Resource Grade Comparison ........................... 30
Runge Limited St Barbara Limited GVG Resource Report
Page ix
Index of tables
Table 5-1 Summary of Drilling ................................................................................................................................................ 6 Table 6-1 Tabulated Standard Results of the GVG Drilling Campaign .............................................................................. 8 Table 6-2 Summary of Internal Laboratory Repeats ............................................................................................................. 9 Table 6-3 Great Victoria Check Assay Results .................................................................................................................... 11 Table 7-1 Bulk Density Results for Great Victoria Testwork .............................................................................................. 13 Table 9-1 Drillholes Checked for Sample Integrity ............................................................................................................. 14 Table 9-2 Drillholes Checked for Assay Integrity ............................................................................................................... 14 Table 9-3 Drillholes Checked for Ground Location ........................................................................................................... 14 Table 10-1 Wireframe Object Number, Lode Name and Model Attribute Relationship ................................................... 16 Table 10-2 Great Victoria Regolith Wireframes and Database Coding ............................................................................ 16 Table 10-3 Basic Statistics for all Laterite Objects in the GVG Estimate ........................................................................... 18 Table 10-4 Basic Statistics for all Sap Domains in the GVG Estimate .............................................................................. 19 Table 10-5 Basic Statistics for all Fresh Domains in the GVG Estimate ........................................................................... 20 Table 10-6 Kriging Parameters for Various Domains ........................................................................................................ 22 Table 11-1 Block Model Parameters .................................................................................................................................... 23 Table 11-2 Interpolation parameters (pass1,pass2,pass3) ................................................................................................. 24 Table 11-3 Material Type and Density Used in Resource .................................................................................................. 25
List of Appendices
Appendix 1: Great Victoria June 2008 Resource Tables Appendix 2: Great Victoria June 2008 Resource Validation Tables Appendix 3: Great Victoria June 2008 Statistics and Histograms Appendix 4: Great Victoria June 2008 Variography Appendix 5: Surpac String File Descriptions
Runge Limited St Barbara Limited GVG Resource Report
Page 1 March 2008
1 Introduction and Project Summary
1.1 General
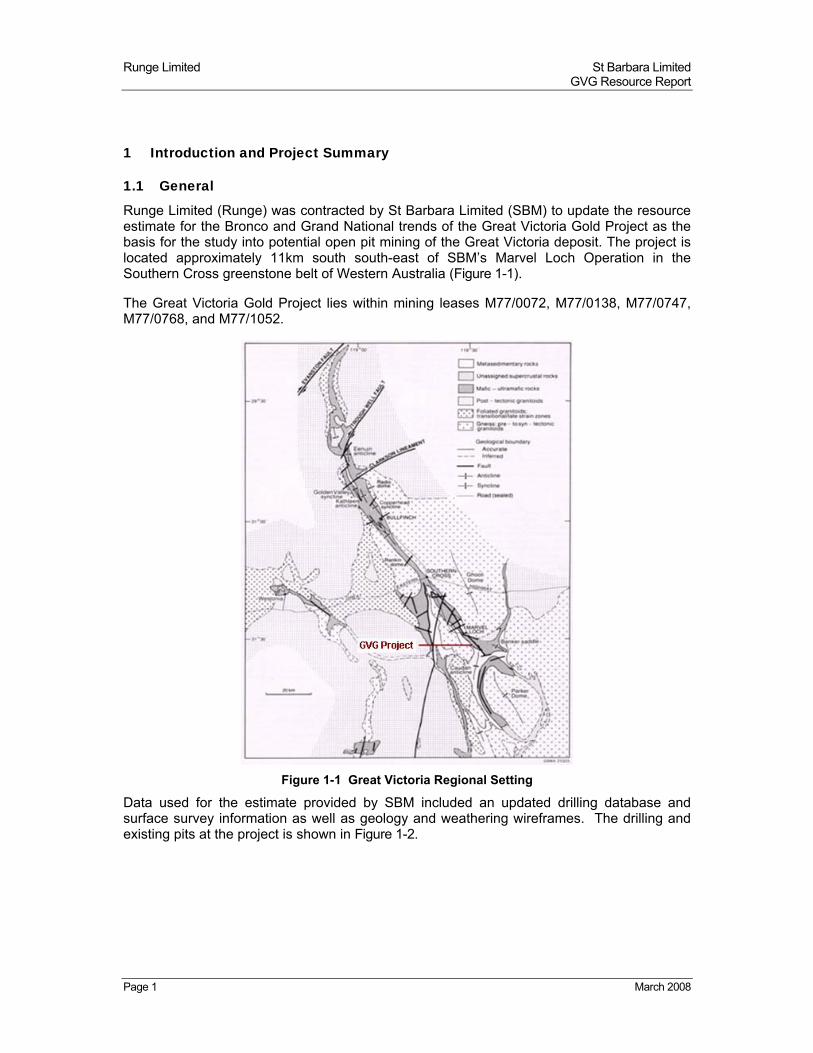
Runge Limited (Runge) was contracted by St Barbara Limited (SBM) to update the resource estimate for the Bronco and Grand National trends of the Great Victoria Gold Project as the basis for the study into potential open pit mining of the Great Victoria deposit. The project is located approximately 11km south south-east of SBM’s Marvel Loch Operation in the Southern Cross greenstone belt of Western Australia (Figure 1-1).
The Great Victoria Gold Project lies within mining leases M77/0072, M77/0138, M77/0747, M77/0768, and M77/1052.
Figure 1-1 Great Victoria Regional Setting
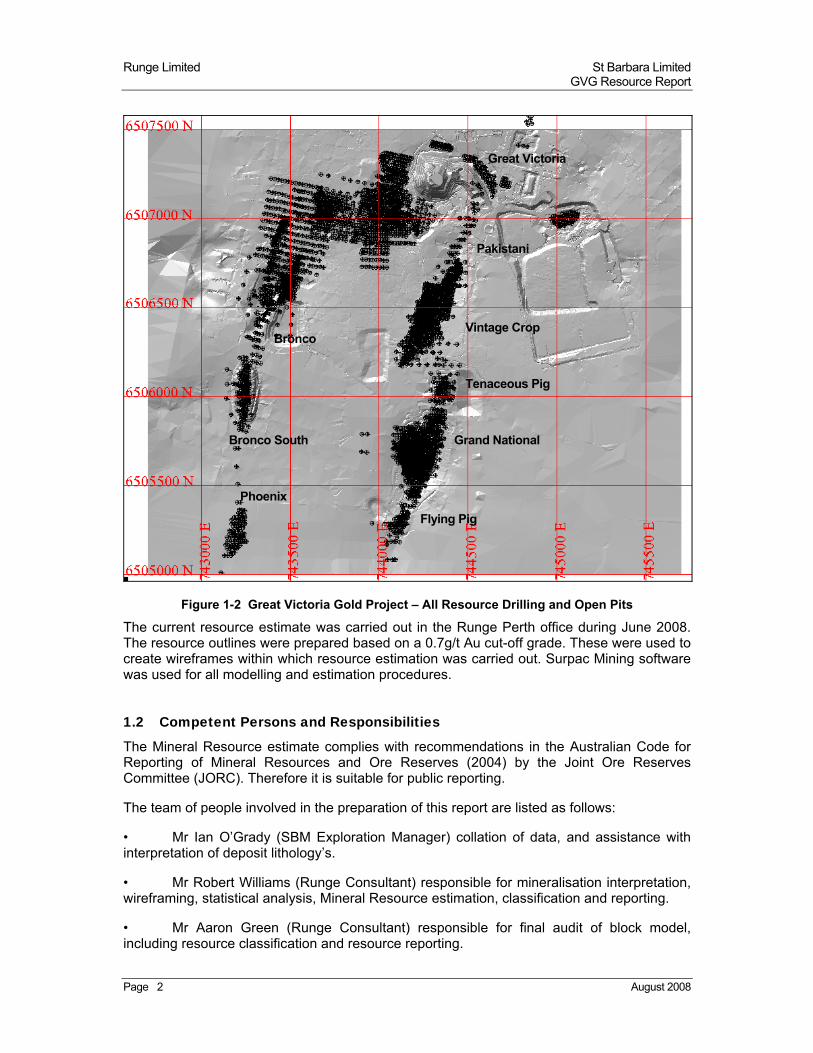
Data used for the estimate provided by SBM included an updated drilling database and surface survey information as well as geology and weathering wireframes. The drilling and existing pits at the project is shown in Figure 1-2.
Runge Limited St Barbara Limited GVG Resource Report
Page 2 August 2008
Figure 1-2 Great Victoria Gold Project – All Resource Drilling and Open Pits
The current resource estimate was carried out in the Runge Perth office during June 2008. The resource outlines were prepared based on a 0.7g/t Au cut-off grade. These were used to create wireframes within which resource estimation was carried out. Surpac Mining software was used for all modelling and estimation procedures.
1.2 Competent Persons and Responsibilities
The Mineral Resource estimate complies with recommendations in the Australian Code for Reporting of Mineral Resources and Ore Reserves (2004) by the Joint Ore Reserves Committee (JORC). Therefore it is suitable for public reporting.
The team of people involved in the preparation of this report are listed as follows:
• Mr Ian O’Grady (SBM Exploration Manager) collation of data, and assistance with interpretation of deposit lithology’s.
• Mr Robert Williams (Runge Consultant) responsible for mineralisation interpretation, wireframing, statistical analysis, Mineral Resource estimation, classification and reporting.
• Mr Aaron Green (Runge Consultant) responsible for final audit of block model, including resource classification and resource reporting.
Grand National
Vintage Crop
Flying Pig
Phoenix
Great Victoria
Bronco South
Bronco
Pakistani
Tenaceous Pig
Runge Limited St Barbara Limited GVG Resource Report
Page 3 August 2008
• Mr Ben Bartlett (SBM Resource Manager) statistical review and Competent Person for the GVG estimate.
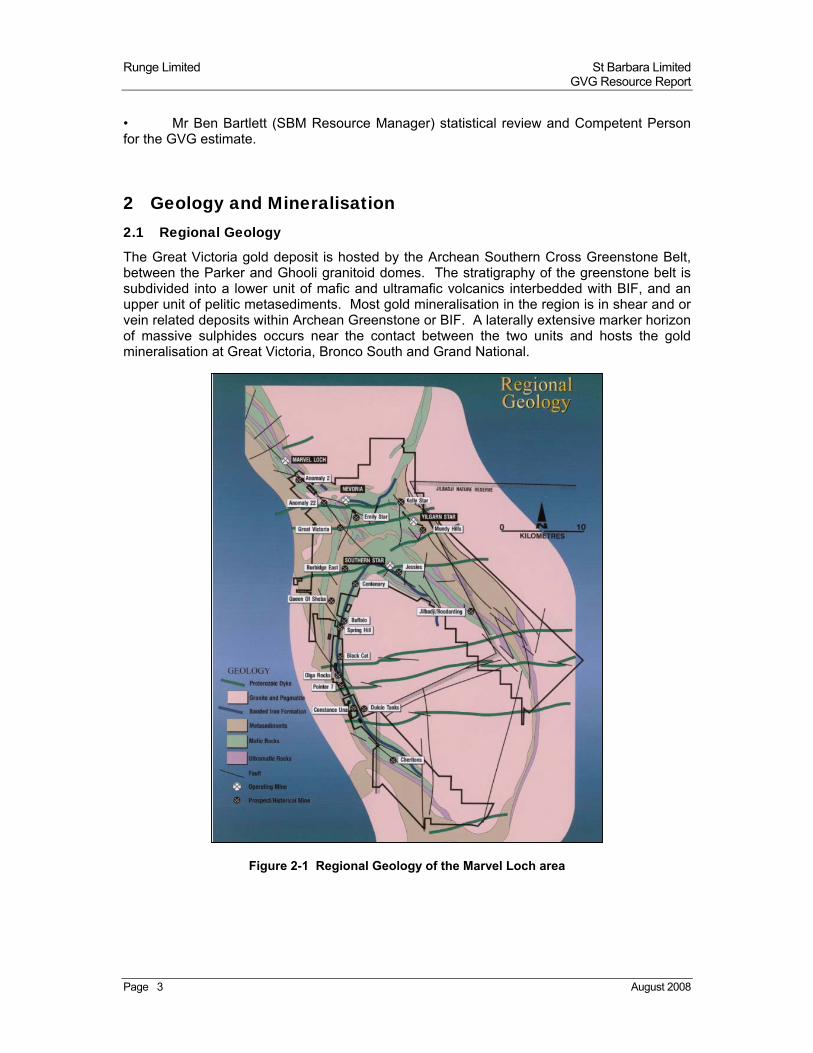
2 Geology and Mineralisation 2.1 Regional Geology
The Great Victoria gold deposit is hosted by the Archean Southern Cross Greenstone Belt, between the Parker and Ghooli granitoid domes. The stratigraphy of the greenstone belt is subdivided into a lower unit of mafic and ultramafic volcanics interbedded with BIF, and an upper unit of pelitic metasediments. Most gold mineralisation in the region is in shear and or vein related deposits within Archean Greenstone or BIF. A laterally extensive marker horizon of massive sulphides occurs near the contact between the two units and hosts the gold mineralisation at Great Victoria, Bronco South and Grand National.
Figure 2-1 Regional Geology of the Marvel Loch area
Runge Limited St Barbara Limited GVG Resource Report
Page 4 August 2008
2.2 Local Geology
The Great Victoria Gold Project is located in the Banker Saddle region of the Southern Cross greenstone belt on the western flank of the Parker Dome within a NNW trending sequence of metasediments and amphibolites, known as the Burbidge mining group (Figure 2-1)
The Burbidge mining group occurs around the north plunging closure of the Caudan anticline (Keats, 1991).
Primary gold mineralisation in the Burbidge mining group is hosted within the Sulphide Exhalite unit which is bounded between the underlying footwall amphibolite and the overlying Metapelite schist.
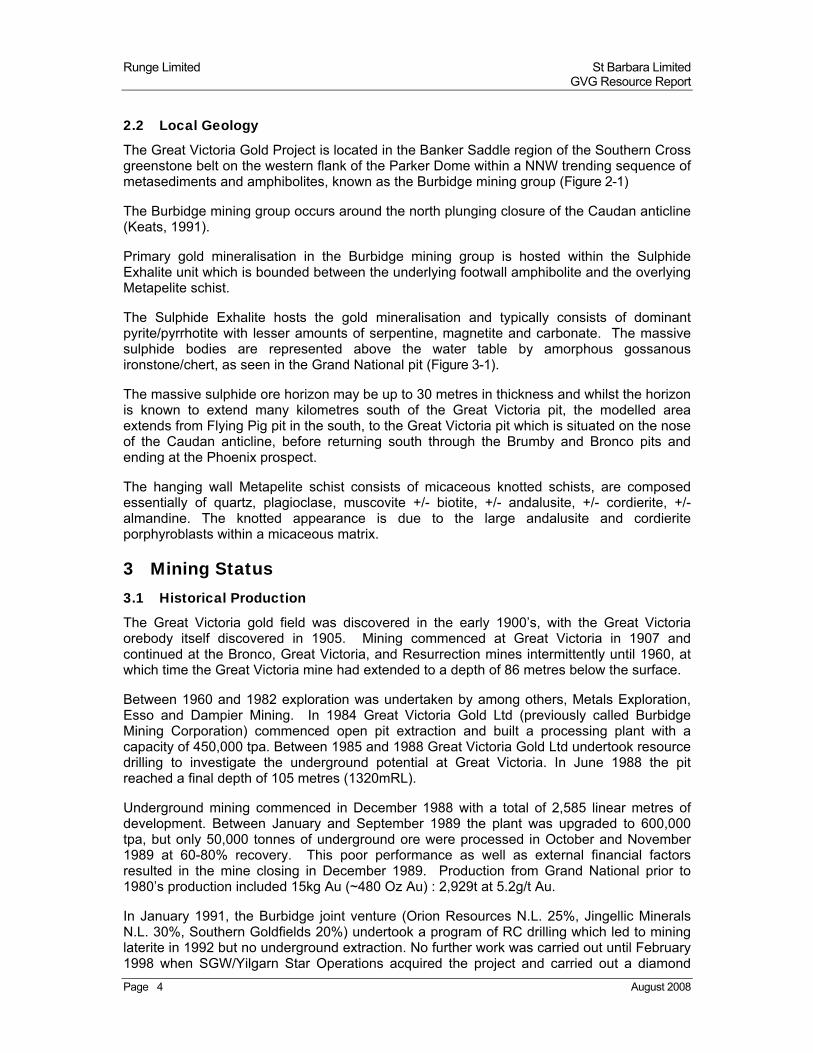
The Sulphide Exhalite hosts the gold mineralisation and typically consists of dominant pyrite/pyrrhotite with lesser amounts of serpentine, magnetite and carbonate. The massive sulphide bodies are represented above the water table by amorphous gossanous ironstone/chert, as seen in the Grand National pit (Figure 3-1).
The massive sulphide ore horizon may be up to 30 metres in thickness and whilst the horizon is known to extend many kilometres south of the Great Victoria pit, the modelled area extends from Flying Pig pit in the south, to the Great Victoria pit which is situated on the nose of the Caudan anticline, before returning south through the Brumby and Bronco pits and ending at the Phoenix prospect.
The hanging wall Metapelite schist consists of micaceous knotted schists, are composed essentially of quartz, plagioclase, muscovite +/- biotite, +/- andalusite, +/- cordierite, +/- almandine. The knotted appearance is due to the large andalusite and cordierite porphyroblasts within a micaceous matrix.
3 Mining Status 3.1 Historical Production
The Great Victoria gold field was discovered in the early 1900’s, with the Great Victoria orebody itself discovered in 1905. Mining commenced at Great Victoria in 1907 and continued at the Bronco, Great Victoria, and Resurrection mines intermittently until 1960, at which time the Great Victoria mine had extended to a depth of 86 metres below the surface.
Between 1960 and 1982 exploration was undertaken by among others, Metals Exploration, Esso and Dampier Mining. In 1984 Great Victoria Gold Ltd (previously called Burbidge Mining Corporation) commenced open pit extraction and built a processing plant with a capacity of 450,000 tpa. Between 1985 and 1988 Great Victoria Gold Ltd undertook resource drilling to investigate the underground potential at Great Victoria. In June 1988 the pit reached a final depth of 105 metres (1320mRL).
Underground mining commenced in December 1988 with a total of 2,585 linear metres of development. Between January and September 1989 the plant was upgraded to 600,000 tpa, but only 50,000 tonnes of underground ore were processed in October and November 1989 at 60-80% recovery. This poor performance as well as external financial factors resulted in the mine closing in December 1989. Production from Grand National prior to 1980’s production included 15kg Au (~480 Oz Au) : 2,929t at 5.2g/t Au.
In January 1991, the Burbidge joint venture (Orion Resources N.L. 25%, Jingellic Minerals N.L. 30%, Southern Goldfields 20%) undertook a program of RC drilling which led to mining laterite in 1992 but no underground extraction. No further work was carried out until February 1998 when SGW/Yilgarn Star Operations acquired the project and carried out a diamond
Runge Limited St Barbara Limited GVG Resource Report
Page 5 August 2008
drilling program in December 1998. In May 2000 rehabilitation of the underground operation began. Previous development levels from 1295mRL (Level 1) to 1245 mRL (Level 4) were dewatered and rehabilitated. Development commenced on 1225mRL (Level 5) down to 1205mRL (Level 6) at 420mbs.
SBM acquired the project in April 2004 as part of the purchase of the Sons of Gwalia (SGW) Gold Division.
Figure 3-1 View of Cutback on the Lode 2 Pit, Great Victoria
3.2 Current Mining
SBM recommenced open pit mining of the Tenaceous Pig, Bronco South and Grand National orebodies in May 2008. Reserves in Tenaceous Pig and Bronco South pits have since been exhausted.
4 Previous Estimates The Runge June 2008 resource estimate is the first estimate that has amalgamated the areas of Flying Pig, Grand National, Tenacious Pig, Vintage Crop, Pakistani, Brumby, Bronco, Bronco South, Resurrection and Phoenix into a single resource model. In the past these pits were mined by various companies and as such no comparable resource estimate has been available.
Runge Limited St Barbara Limited GVG Resource Report
Page 6 August 2008
5 Drilling Data 5.1 Summary
Data supplied to Runge by SBM consisted of two partially validated databases, named valid_db, and current_db. The valid_db contained historical drilling records dating back to 1984 (earlier dates do exist in the database, however concern over the veracity of these dates is noted), whilst the current_db contained records for holes from the latest round of drilling completed by SBM since March of 2007.
Data from both databases were appended into single Surpac database and validated.
5.2 Drill Methods
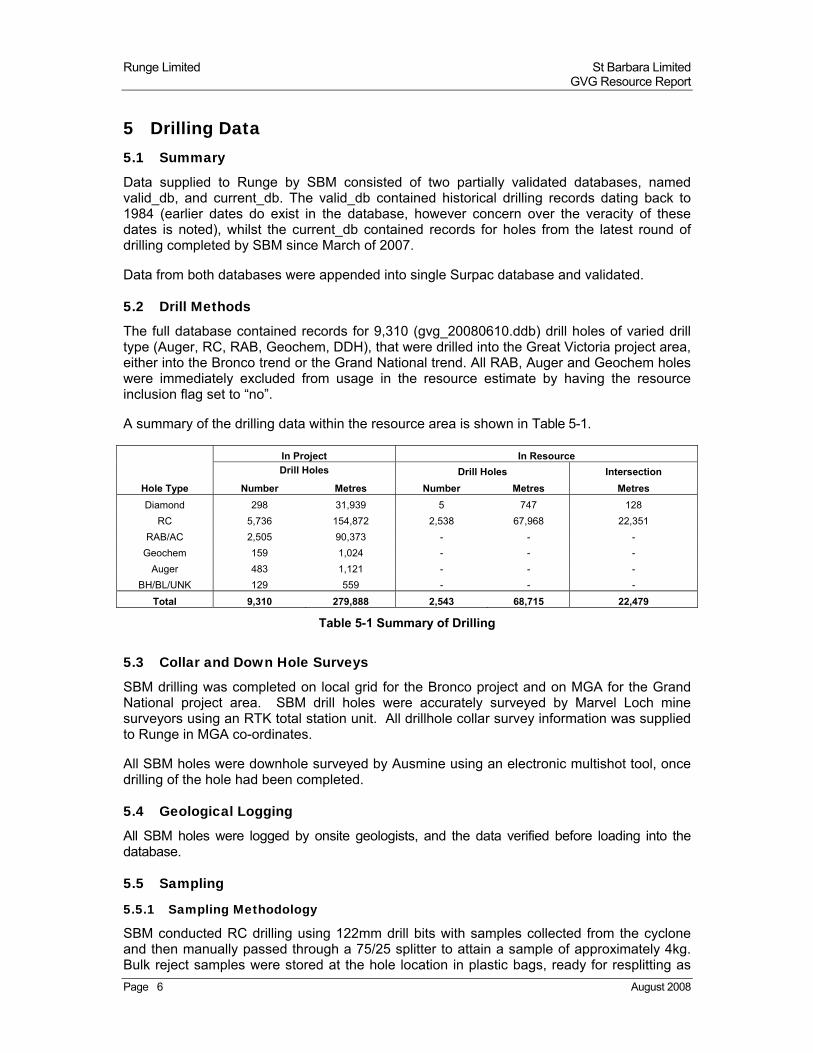
The full database contained records for 9,310 (gvg_20080610.ddb) drill holes of varied drill type (Auger, RC, RAB, Geochem, DDH), that were drilled into the Great Victoria project area, either into the Bronco trend or the Grand National trend. All RAB, Auger and Geochem holes were immediately excluded from usage in the resource estimate by having the resource inclusion flag set to “no”.
A summary of the drilling data within the resource area is shown in Table 5-1.
Hole Type
In Project In Resource
Drill Holes Drill Holes Intersection
Number Metres Number Metres Metres
Diamond 298 31,939 5 747 128
RC 5,736 154,872 2,538 67,968 22,351
RAB/AC 2,505 90,373 - - -
Geochem 159 1,024 - - -
Auger 483 1,121 - - -
BH/BL/UNK 129 559 - - -
Total 9,310 279,888 2,543 68,715 22,479
Table 5-1 Summary of Drilling
5.3 Collar and Down Hole Surveys
SBM drilling was completed on local grid for the Bronco project and on MGA for the Grand National project area. SBM drill holes were accurately surveyed by Marvel Loch mine surveyors using an RTK total station unit. All drillhole collar survey information was supplied to Runge in MGA co-ordinates.
All SBM holes were downhole surveyed by Ausmine using an electronic multishot tool, once drilling of the hole had been completed.
5.4 Geological Logging
All SBM holes were logged by onsite geologists, and the data verified before loading into the database.
5.5 Sampling
5.5.1 Sampling Methodology
SBM conducted RC drilling using 122mm drill bits with samples collected from the cyclone and then manually passed through a 75/25 splitter to attain a sample of approximately 4kg. Bulk reject samples were stored at the hole location in plastic bags, ready for resplitting as
Runge Limited St Barbara Limited GVG Resource Report
Page 7 August 2008
was deemed necessary by SBM geologists. Resplit samples were taken firstly to replace samples that had either been lost in transit during the submission process, or had been destroyed during the sample preparation process, and secondly as a check for the presence of any splitter bias against the original sample. Sample quality was excellent with only rare wet samples being obtained.
RC drilling was completed using Leon Marsh Drilling, a contractor local to Marvel Loch. SBM holes ranged in dip from -50° to vertical.
No documentation on sampling procedures for historical drilling was provided to Runge.
5.5.2 Sample Preparation
Sample preparation and eventual analysis of SBM samples was shared between 3 laboratories; SGS Laboratories in Kalgoorlie, KalAssay and UltraTrace. All three laboratories adopted similar sample preparation techniques using a Boyd/Jaques jaw crusher to crush the sample to approximately ~2mm size product, before being pulverised using a Labtechnics LM5 to attain a pulp with ~90% passing -75µm. Approximately 250 grams of pulverised material is then selected and transferred to a pulp packet. SGS alone select a second pulp from the pulverised material at a frequency of 1 in 25 samples.
5.6 Data Excluded From Estimate
All RAB/AC, Auger, Geochem, BH/BL/UNK holes were immediately excluded from use in the estimate. During the interpretation stage an extra 5 recent RC holes were excluded from the resource estimate, generally due to conflicting information or unsampled zones. Omitted holes are GNGC0082, GNGC0092, GNGC0228, MLGC0020 and RRGC0055. These holes have been flagged “no”, in the collar table field ‘res_incl_flag’.
6 Methodology 6.1 Assay Methodology
No documentation on assaying procedures for drilling undertaken prior to the SBM drilling was provided to Runge, although in conversation with SBM geologists, it is believed all historical drill samples were analysed by aqua regia methods.
SBM samples were assayed either by SGS Kalgoorlie, KalAssay or UltraTrace Laboratories. Au grade was determined via Fire Assay with AAS finish (FA50) to a detection limit of 0.01ppm.
6.2 Quality Control
6.2.1 Protocol
The QAQC protocols implemented for the GVG drilling program (SBM) included a minimum of:
• Insertion of certified standard samples at a rate at least one per drillhole to assess assay accuracy of the laboratory.
• Re-numbered sample pulp residues re-submitted to an umpire laboratory for checking of the initial assay.
• Laboratory repeats were performed at a frequency of 1 per 25 samples.
Runge Limited St Barbara Limited GVG Resource Report
Page 8 August 2008
• Secondary pulps were collected from the bowl of the LM5 at a frequency of approximately 1 in every 30 samples (for SGS only). These secondary pulps were assayed and reported. Assessment of the gold assay for the original pulp, and the secondary pulp, provides an insight into homogeneity of the pulverised sample.
• Field duplicate samples were not taken at the time of drilling, rather upon the return of assays of the original samples the SBM geologist would prepare a list of downhole zones that would require re-splitting, to achieve a duplicate sample which was compared to the original sample.
• Grindsize analysis was conducted on the pulps at a frequency of 1 in 30 samples.
6.2.2 Standards
All standards were reviewed by Runge in conjunction with SBM staff.
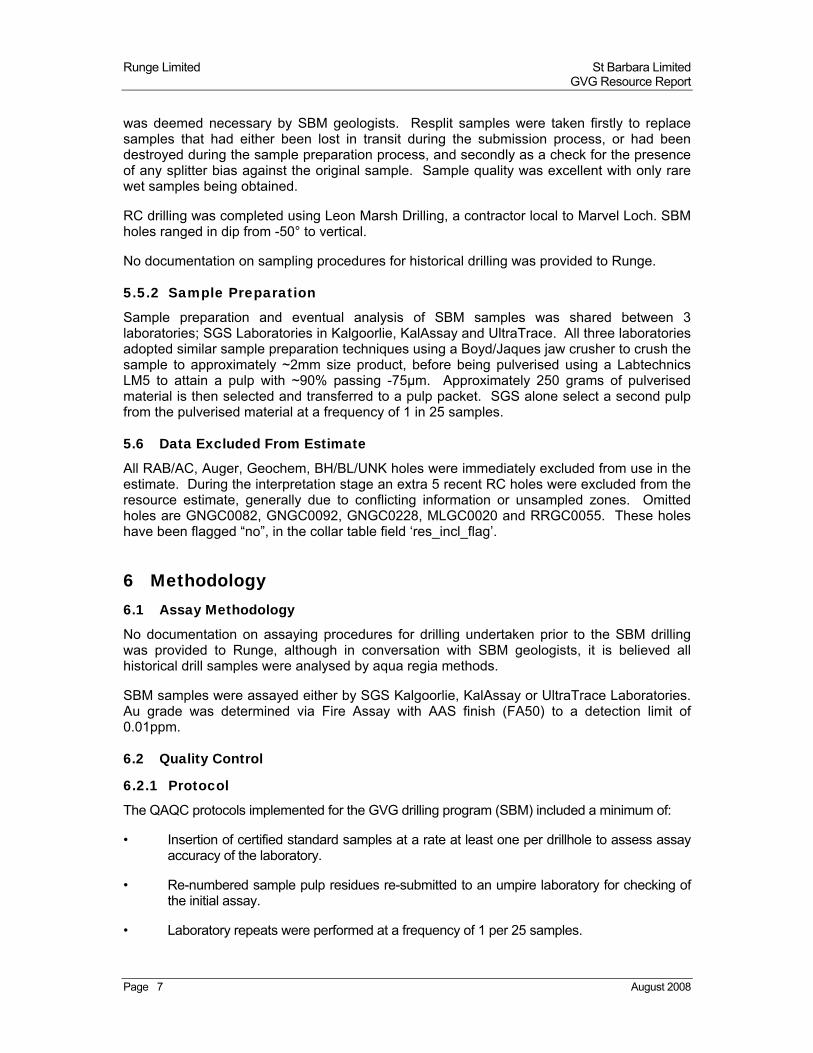
In total 946 standard samples representing 21 different standards were analysed during the GVG drilling campaign. Runge has reviewed the 16 most numerous standards as this represents 901 of the total standards. Results of the standards analysed are tabulated in Table 6-1.
Certified Standard Summary SBM Standard Data Summary
Standard Au Value Std Deviation Au - 2SD Au + 2SD No. Samples Minimum Maximum Mean Std Deviation
G301-3 1.96 0.08 1.80 2.12 51 1.70 2.08 1.92 0.08
G301-5 4.29 0.21 3.87 4.71 49 3.30 4.72 4.04 0.28
G305-1 0.21 0.01 0.18 0.24 47 0.14 0.27 0.20 0.03
G305-5 2.43 0.12 2.19 2.67 28 1.92 2.91 2.41 0.22
G306-1 0.41 0.03 0.35 0.47 39 0.25 0.69 0.39 0.06
G398-4 0.66 0.05 0.56 0.76 51 0.44 0.80 0.64 0.05
G900-2 1.48 0.06 1.36 1.60 154 1.09 1.75 1.43 0.11
G900-5 3.21 0.13 2.95 3.47 84 2.63 4.10 3.13 0.21
G900-8C 2.47 0.12 2.23 2.71 25 2.20 2.54 2.36 0.09
G901-9 0.69 0.04 0.61 0.77 63 0.62 0.81 0.70 0.04
G902-4 3.39 0.18 3.03 3.75 54 2.76 3.79 3.20 0.22
G904-3 13.66 0.62 12.42 14.90 9 12.50 14.10 13.22 0.63
G905-7 3.91 0.14 3.63 4.19 38 3.37 4.43 3.89 0.23
G996-7C 5.99 0.39 5.21 6.77 43 4.78 7.02 5.97 0.44
G997-1 0.41 0.04 0.33 0.49 107 0.22 0.65 0.39 0.05
G998-9 0.38 0.03 0.32 0.44 59 0.22 0.54 0.37 0.04
Table 6-1 Tabulated Standard Results of the GVG Drilling Campaign
Figure 6-1 graphically displays the results of the standards assessed.
Runge Limited St Barbara Limited GVG Resource Report
Page 9 August 2008
Great Victoria Gold Project: All Standards
0
3
6
9
12
15
Assyed Standard
Au
As
sa
y (g
/t)
Figure 6-1 GVG Drilling Campaign Standard Analysis
Assessment of the standards in Figure 6-1 show a fairly tight grouping for lower grade standards, which reflects little deviation away from the expected value. As expected the spread of data increases as the standard assay increases.
Runge considers the number of different certified standards (21) used throughout the program to be excessive, and recommends that the number be reduced to possibly ten, which will allow a greater number of samples of each standard to be submitted and in doing so allowing a more accurate assessment of laboratory performance. Care should also be taken to eliminate the use of standards which have identical expected values, as in the case of G306-1, G997-1 and G998-9, where all standards have near identical expected values.
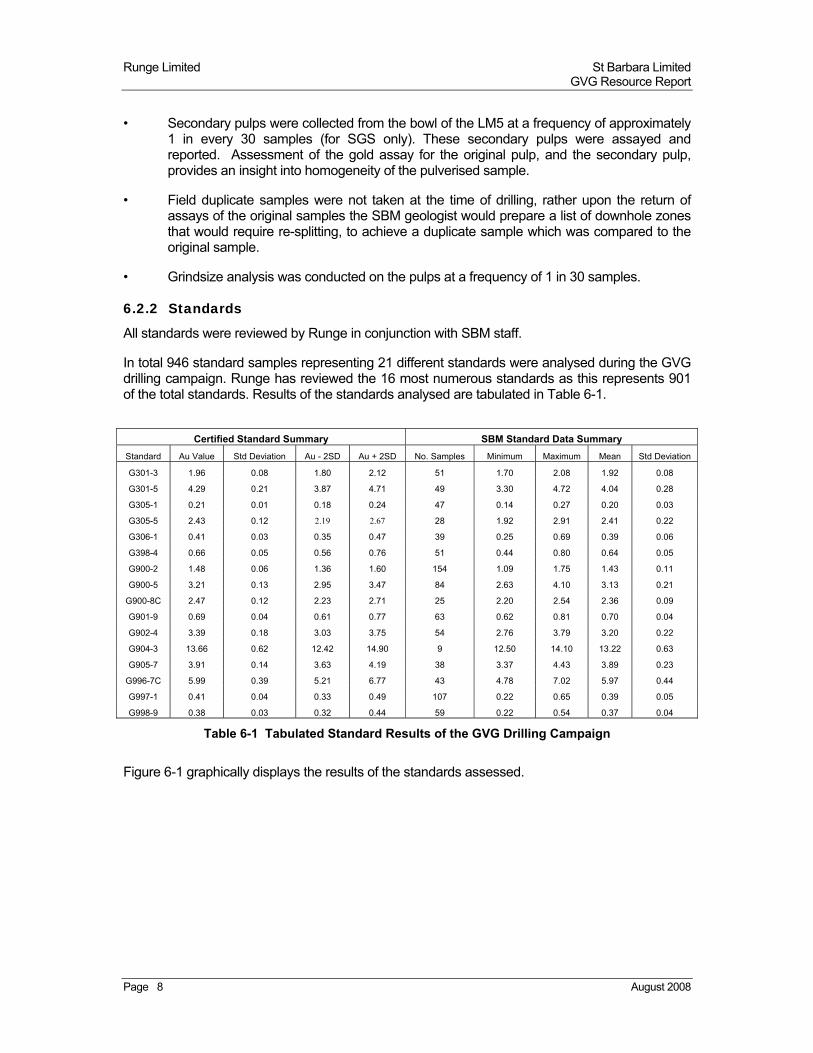
6.2.3 Internal Laboratory Repeats
The results of 3,111 internal laboratory repeats from the GVG campaign drilling are shown below in Table 6-2, and Figure 6-2. Repeatability appears poor in the 0.0 to 0.7g/t grade range, which is surprising considering the number of sample assays. At higher grade ranges there is an excellent correlation between the original and repeated assay.
Au range Count Ave Au Orig. Ave Au-Rp
0-0.7 2,119 0.15 0.29
0.7-1.0 199 0.83 0.83
1.0-5.0 726 1.96 1.98
5.0-10.0 44 6.49 6.55
>10 23 22.27 22.00
Total 3,111 0.87 0.97
Table 6-2 Summary of Internal Laboratory Repeats

Runge Limited St Barbara Limited GVG Resource Report
Page 10 August 2008
Great Victoria Gold Project: Repeats Analysis
y = x
0
2
4
6
8
10
0 2 4 6 8 10
Au Original (g/t Au)
Au
Rep
eat
(g/t
Au
)
Figure 6-2 Scatter Plot of Internal Lab Repeats
6.2.4 Secondary Pulp Analysis
The practice of taking a secondary pulp (at a frequency of one per 25 samples), from the pulverised sample is a procedure adopted by SGS laboratories to assess the homogeneity of the pulp. Secondary pulps were taken for 1,980 samples and the assays returned were compared with the assay from the primary pulp. Figure 6-3 indicates a fair correlation between assays for the primary pulp and secondary pulp, which would suggest the pulverisation process being performed by SGS is suitable for the GVG samples.
Great Victoria Gold Project: Secondary Pulp Analysis
y = x
0
5
10
15
20
25
0 5 10 15 20 25
Original Pulp: Au Original
Sec
on
dar
y P
ulp
Figure 6-3 Secondary Pulp Analysis
Runge Limited St Barbara Limited GVG Resource Report
Page 11 August 2008
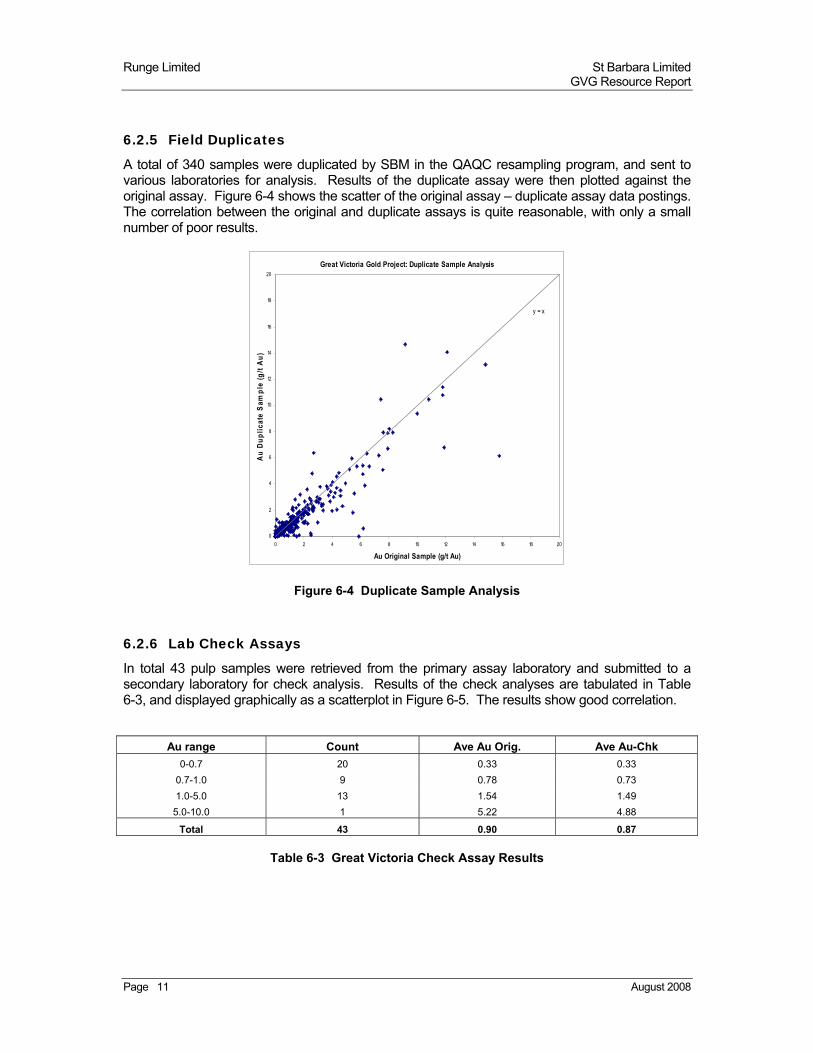
6.2.5 Field Duplicates
A total of 340 samples were duplicated by SBM in the QAQC resampling program, and sent to various laboratories for analysis. Results of the duplicate assay were then plotted against the original assay. Figure 6-4 shows the scatter of the original assay – duplicate assay data postings. The correlation between the original and duplicate assays is quite reasonable, with only a small number of poor results.
Great Victoria Gold Project: Duplicate Sample Analysis
y = x
0
2
4
6
8
10
12
14
16
18
20
0 2 4 6 8 10 12 14 16 18 20
Au Original Sample (g/t Au)
Au
Du
pli
cate
Sam
ple
(g
/t A
u)
Figure 6-4 Duplicate Sample Analysis
6.2.6 Lab Check Assays
In total 43 pulp samples were retrieved from the primary assay laboratory and submitted to a secondary laboratory for check analysis. Results of the check analyses are tabulated in Table 6-3, and displayed graphically as a scatterplot in Figure 6-5. The results show good correlation.
Au range Count Ave Au Orig. Ave Au-Chk
0-0.7 20 0.33 0.33
0.7-1.0 9 0.78 0.73
1.0-5.0 13 1.54 1.49
5.0-10.0 1 5.22 4.88
Total 43 0.90 0.87
Table 6-3 Great Victoria Check Assay Results
Runge Limited St Barbara Limited GVG Resource Report
Page 12 August 2008
Great Victoria Gold Project: Check Assay Analysis
y = x
0
1
2
3
4
5
6
0 1 2 3 4 5 6
Au Duplicate Sample (g/t Au)
Au
Ch
eck
Sam
ple
(g
/t A
u)
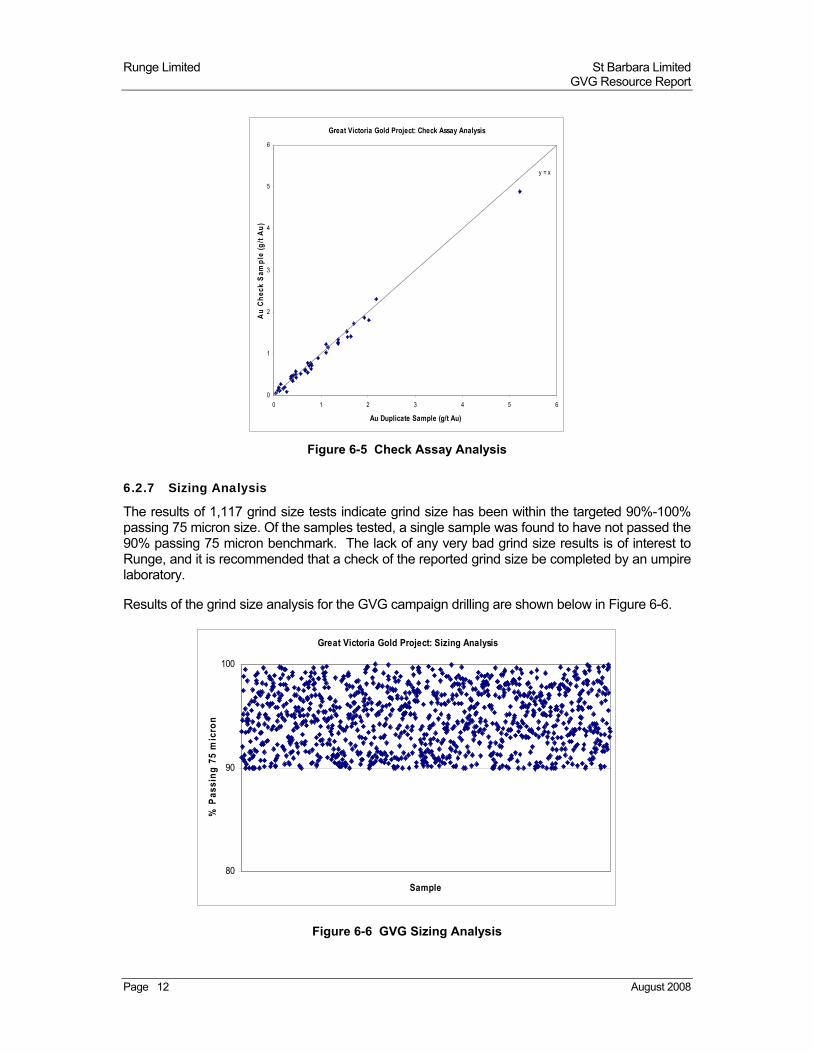
Figure 6-5 Check Assay Analysis
6.2.7 Sizing Analysis
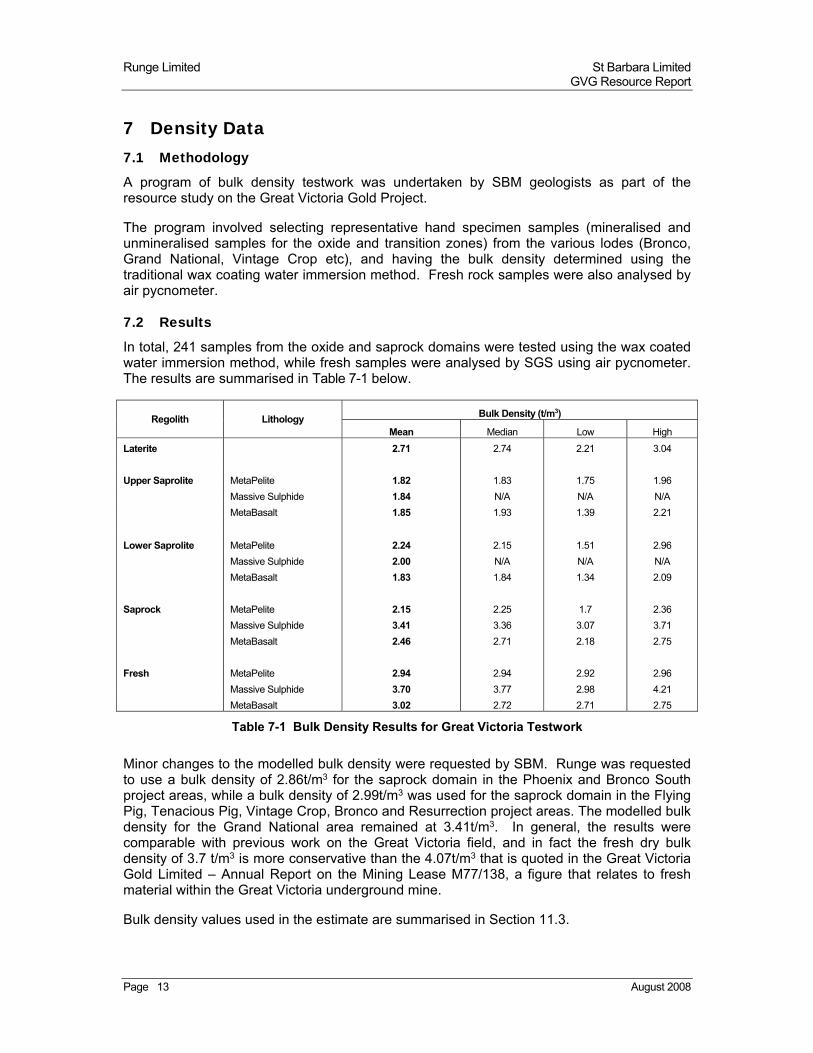
The results of 1,117 grind size tests indicate grind size has been within the targeted 90%-100% passing 75 micron size. Of the samples tested, a single sample was found to have not passed the 90% passing 75 micron benchmark. The lack of any very bad grind size results is of interest to Runge, and it is recommended that a check of the reported grind size be completed by an umpire laboratory.
Results of the grind size analysis for the GVG campaign drilling are shown below in Figure 6-6.
Great Victoria Gold Project: Sizing Analysis
80
90
100
Sample
% P
assi
ng
75
mic
ron
Figure 6-6 GVG Sizing Analysis
Runge Limited St Barbara Limited GVG Resource Report
Page 13 August 2008
7 Density Data 7.1 Methodology
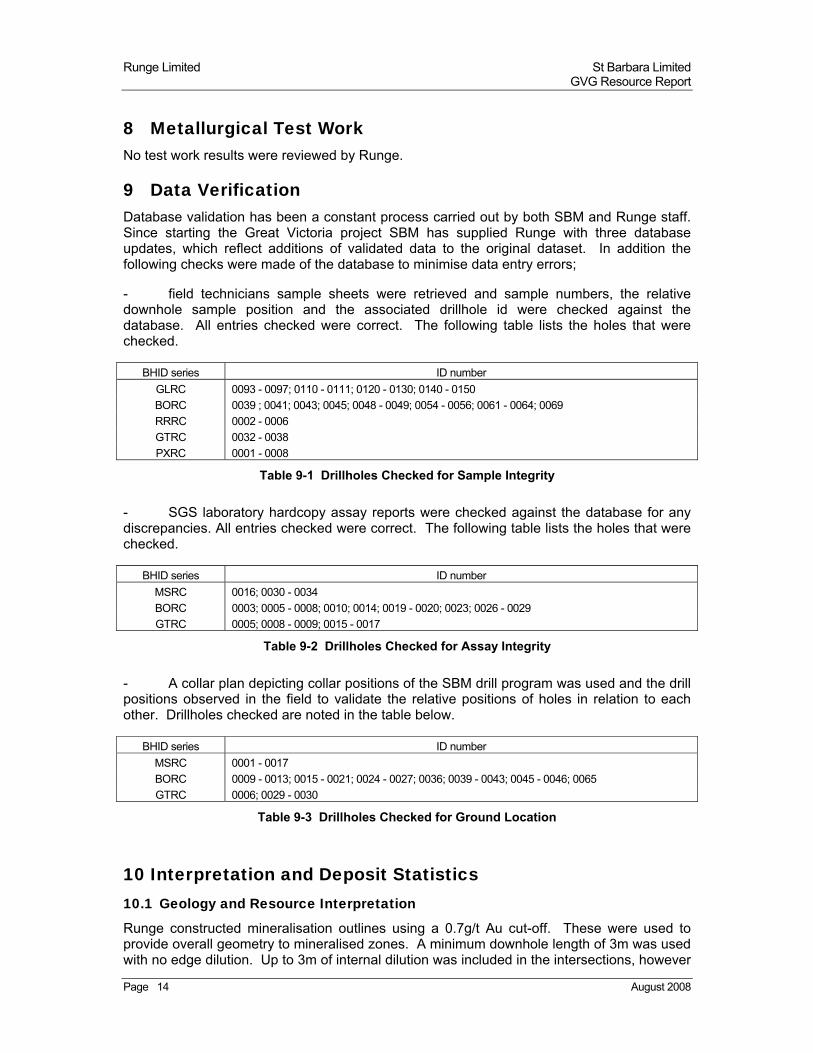
A program of bulk density testwork was undertaken by SBM geologists as part of the resource study on the Great Victoria Gold Project.
The program involved selecting representative hand specimen samples (mineralised and unmineralised samples for the oxide and transition zones) from the various lodes (Bronco, Grand National, Vintage Crop etc), and having the bulk density determined using the traditional wax coating water immersion method. Fresh rock samples were also analysed by air pycnometer.
7.2 Results
In total, 241 samples from the oxide and saprock domains were tested using the wax coated water immersion method, while fresh samples were analysed by SGS using air pycnometer. The results are summarised in Table 7-1 below.
Regolith Lithology Bulk Density (t/m3)
Mean Median Low High
Laterite 2.71 2.74 2.21 3.04
Upper Saprolite MetaPelite 1.82 1.83 1.75 1.96
Massive Sulphide 1.84 N/A N/A N/A
MetaBasalt 1.85 1.93 1.39 2.21
Lower Saprolite MetaPelite 2.24 2.15 1.51 2.96
Massive Sulphide 2.00 N/A N/A N/A
MetaBasalt 1.83 1.84 1.34 2.09
Saprock MetaPelite 2.15 2.25 1.7 2.36
Massive Sulphide 3.41 3.36 3.07 3.71
MetaBasalt 2.46 2.71 2.18 2.75
Fresh MetaPelite 2.94 2.94 2.92 2.96
Massive Sulphide 3.70 3.77 2.98 4.21
MetaBasalt 3.02 2.72 2.71 2.75
Table 7-1 Bulk Density Results for Great Victoria Testwork
Minor changes to the modelled bulk density were requested by SBM. Runge was requested to use a bulk density of 2.86t/m3 for the saprock domain in the Phoenix and Bronco South project areas, while a bulk density of 2.99t/m3 was used for the saprock domain in the Flying Pig, Tenacious Pig, Vintage Crop, Bronco and Resurrection project areas. The modelled bulk density for the Grand National area remained at 3.41t/m3. In general, the results were comparable with previous work on the Great Victoria field, and in fact the fresh dry bulk density of 3.7 t/m3 is more conservative than the 4.07t/m3 that is quoted in the Great Victoria Gold Limited – Annual Report on the Mining Lease M77/138, a figure that relates to fresh material within the Great Victoria underground mine.
Bulk density values used in the estimate are summarised in Section 11.3.
Runge Limited St Barbara Limited GVG Resource Report
Page 14 August 2008
8 Metallurgical Test Work No test work results were reviewed by Runge.
9 Data Verification Database validation has been a constant process carried out by both SBM and Runge staff. Since starting the Great Victoria project SBM has supplied Runge with three database updates, which reflect additions of validated data to the original dataset. In addition the following checks were made of the database to minimise data entry errors;
- field technicians sample sheets were retrieved and sample numbers, the relative downhole sample position and the associated drillhole id were checked against the database. All entries checked were correct. The following table lists the holes that were checked.
BHID series ID number
GLRC 0093 - 0097; 0110 - 0111; 0120 - 0130; 0140 - 0150
BORC 0039 ; 0041; 0043; 0045; 0048 - 0049; 0054 - 0056; 0061 - 0064; 0069
RRRC 0002 - 0006
GTRC 0032 - 0038
PXRC 0001 - 0008
Table 9-1 Drillholes Checked for Sample Integrity
- SGS laboratory hardcopy assay reports were checked against the database for any discrepancies. All entries checked were correct. The following table lists the holes that were checked.
BHID series ID number
MSRC 0016; 0030 - 0034
BORC 0003; 0005 - 0008; 0010; 0014; 0019 - 0020; 0023; 0026 - 0029
GTRC 0005; 0008 - 0009; 0015 - 0017
Table 9-2 Drillholes Checked for Assay Integrity
- A collar plan depicting collar positions of the SBM drill program was used and the drill positions observed in the field to validate the relative positions of holes in relation to each other. Drillholes checked are noted in the table below.
BHID series ID number
MSRC 0001 - 0017
BORC 0009 - 0013; 0015 - 0021; 0024 - 0027; 0036; 0039 - 0043; 0045 - 0046; 0065
GTRC 0006; 0029 - 0030
Table 9-3 Drillholes Checked for Ground Location
10 Interpretation and Deposit Statistics 10.1 Geology and Resource Interpretation
Runge constructed mineralisation outlines using a 0.7g/t Au cut-off. These were used to provide overall geometry to mineralised zones. A minimum downhole length of 3m was used with no edge dilution. Up to 3m of internal dilution was included in the intersections, however
Runge Limited St Barbara Limited GVG Resource Report
Page 15 August 2008
in some cases larger areas of anomalous mineralisation were included to provide continuity to interpretations.
Resource outlines were generally extrapolated to halfway between a mineralised and non-mineralised drill section.
Natural surface (surface230807.dtm), and weathering profiles (bolat230807.dtm – bottom of laterite, redox230807.dtm – bottom of upper saprolite, boco230807.dtm – bottom of lower saprolite & tofr230807.dtm – top of fresh rock), were constructed using Micromine DXF files supplied by SBM, and converted to a Surpac string file which was then wireframed. Positions of the regolith blankets were located using exposures of the pits rather than the positions within drillholes, hence the snapping of the regolith wireframe strings to drillholes has not occurred.
10.2 Preparation of Wireframes
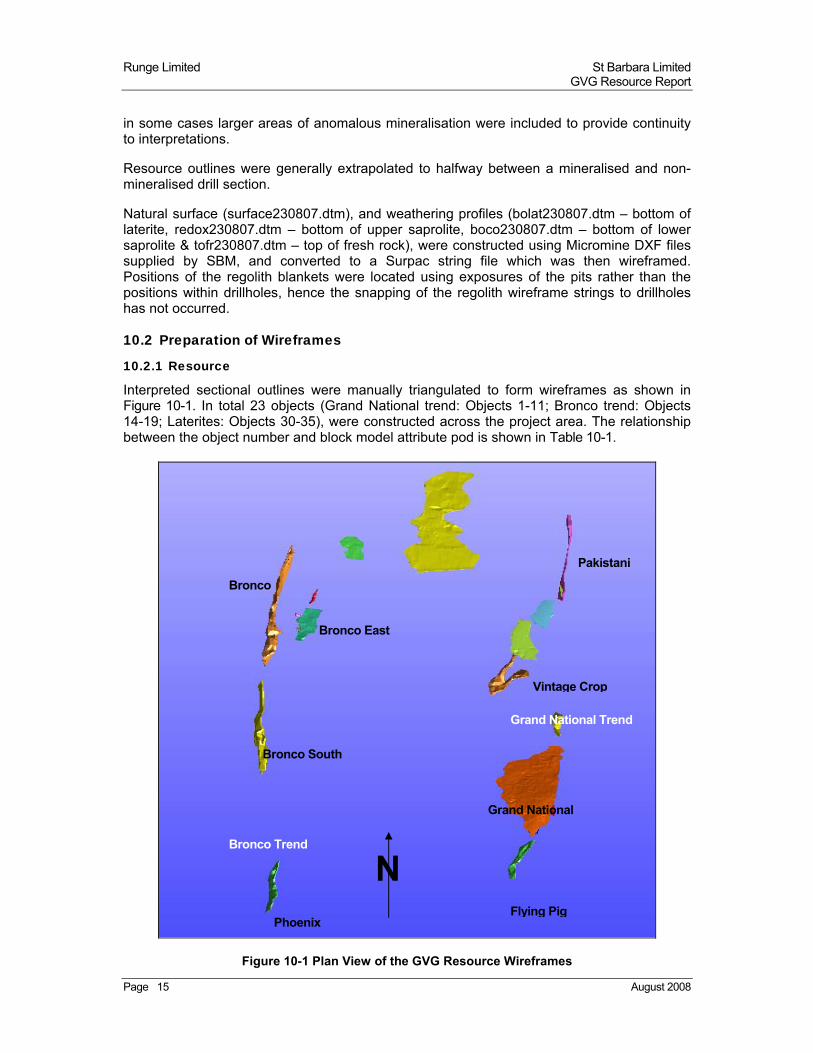
10.2.1 Resource
Interpreted sectional outlines were manually triangulated to form wireframes as shown in Figure 10-1. In total 23 objects (Grand National trend: Objects 1-11; Bronco trend: Objects 14-19; Laterites: Objects 30-35), were constructed across the project area. The relationship between the object number and block model attribute pod is shown in Table 10-1.
Figure 10-1 Plan View of the GVG Resource Wireframes
NBronco Trend
Grand National Trend
Pakistani
Bronco South
Bronco
Bronco East
Phoenix Flying Pig
Vintage Crop
Grand National
Runge Limited St Barbara Limited GVG Resource Report
Page 16 August 2008
Object No. Lode Name Attribute: Pod
1 Grand National 1
2 Grand National 2
3 Grand National 3
4 Grand National 4
5 Flying Pig 5
6 Tenaceous Pig 6
7 Vintage Crop 7
8 Grand National 8
9 Pakistani 9
10 Vintage Crop 10
11 Pakistani 11
14 Phoenix 14
15 Bronco South 15
16 Bronco 16
17 East Bronco 17
18 East Bronco 18
19 East Bronco 19
30 Grand National Laterite 30
31 Vintage Crop Laterite 31
32 Vintage Crop Laterite 32
33 East Bronco Laterite 33
34 East Bronco Laterite 34
35 GVG Laterite 35
Table 10-1 Wireframe Object Number, Lode Name and Model Attribute Relationship
To form ends to the wireframe, the end section strings were copied to a position midway to the next section or 10m and adjusted to match the dip, strike and plunge of the zone. The wireframed objects were validated using Surpac software and set as solids.
10.3 Sample Statistics
10.3.1 General
The wireframes of the mineralised zones were used to code the database to allow identification of the resource intersections. Coding of the database also occurred on a basis of regolith, with all regolith intercepts written to the ox_zone field of the ox_zone table within the database. Table 10-2 indicates the spatial location and the corresponding code that was assigned to the ox_zone table of the database.
Geological Domain Database Code (ox_zone) Comment
Laterite laterite Above bolat dtm
Upper Saprolite oxupsap Below bolat and above redox dtm’s
Lower Saprolite oxlowsap Below redox and above boco dtm’s
Transitional oxsaprock Below boco and above tofr dtm’s
Fresh fresh Below tofr dtm
Table 10-2 Great Victoria Regolith Wireframes and Database Coding
Runge Limited St Barbara Limited GVG Resource Report
Page 17 August 2008
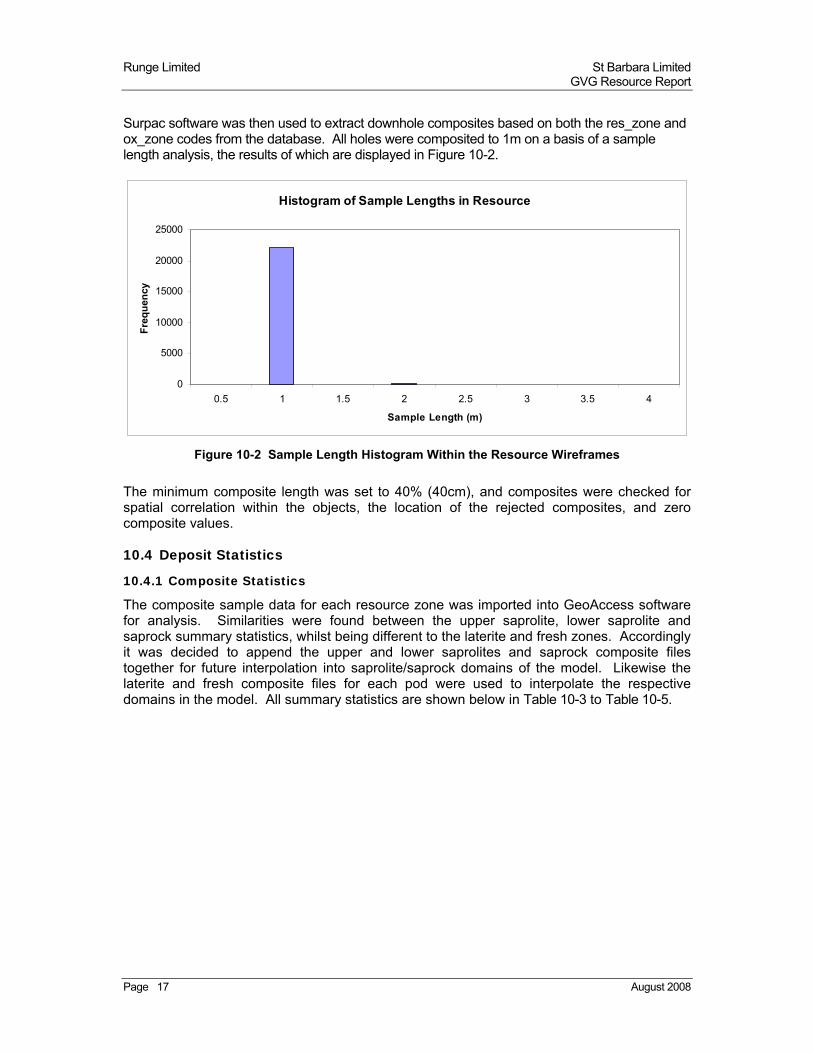
Surpac software was then used to extract downhole composites based on both the res_zone and ox_zone codes from the database. All holes were composited to 1m on a basis of a sample length analysis, the results of which are displayed in Figure 10-2.
Histogram of Sample Lengths in Resource
0
5000
10000
15000
20000
25000
0.5 1 1.5 2 2.5 3 3.5 4
Sample Length (m)
Fre
qu
ency
Figure 10-2 Sample Length Histogram Within the Resource Wireframes
The minimum composite length was set to 40% (40cm), and composites were checked for spatial correlation within the objects, the location of the rejected composites, and zero composite values.
10.4 Deposit Statistics
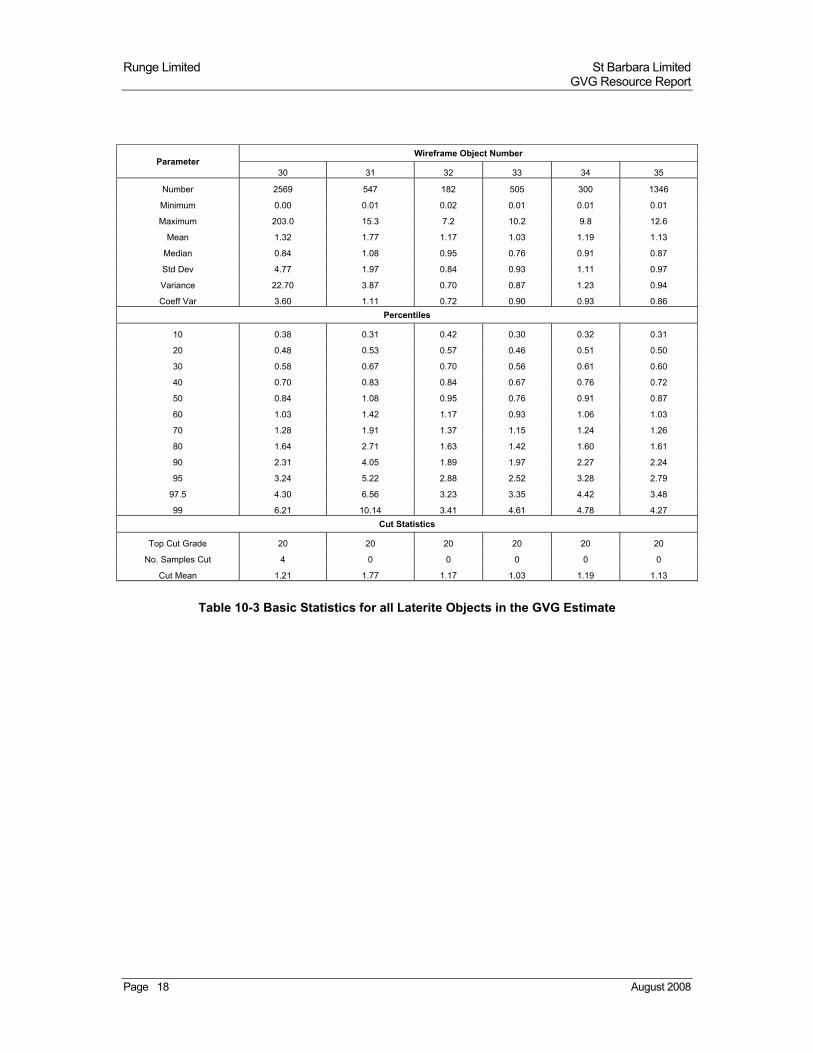
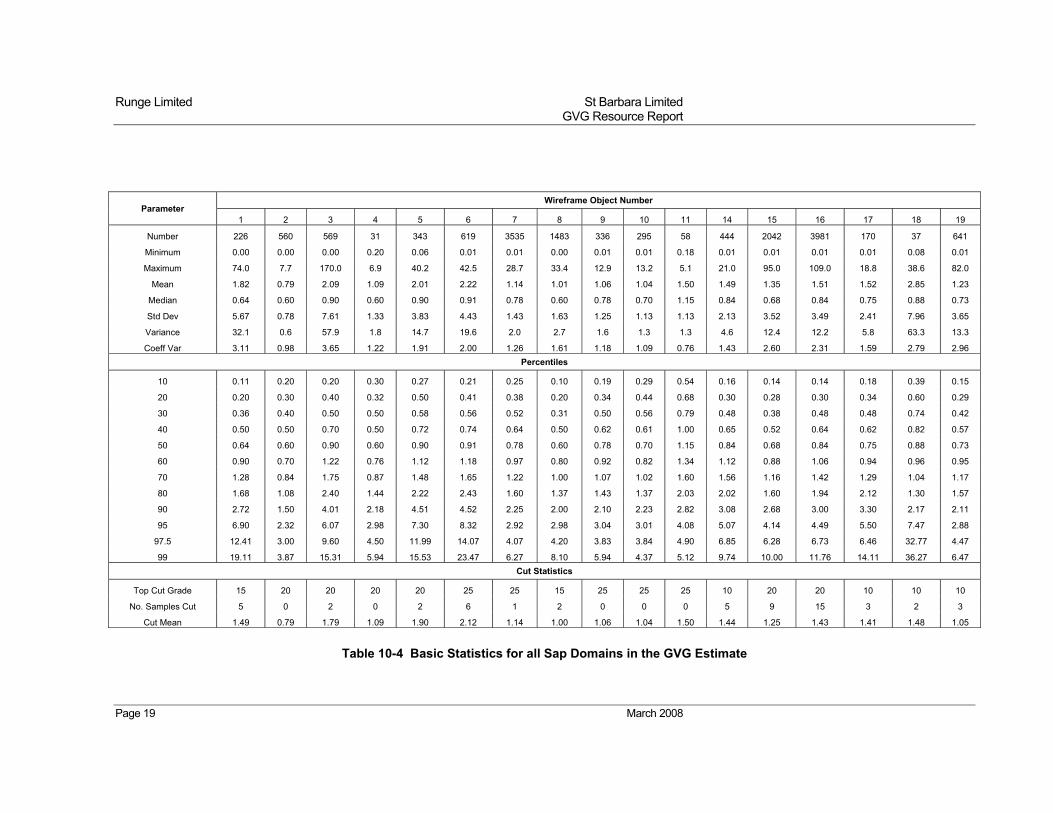
10.4.1 Composite Statistics
The composite sample data for each resource zone was imported into GeoAccess software for analysis. Similarities were found between the upper saprolite, lower saprolite and saprock summary statistics, whilst being different to the laterite and fresh zones. Accordingly it was decided to append the upper and lower saprolites and saprock composite files together for future interpolation into saprolite/saprock domains of the model. Likewise the laterite and fresh composite files for each pod were used to interpolate the respective domains in the model. All summary statistics are shown below in Table 10-3 to Table 10-5.
Runge Limited St Barbara Limited GVG Resource Report
Page 18 August 2008
Parameter Wireframe Object Number
30 31 32 33 34 35
Number 2569 547 182 505 300 1346
Minimum 0.00 0.01 0.02 0.01 0.01 0.01
Maximum 203.0 15.3 7.2 10.2 9.8 12.6
Mean 1.32 1.77 1.17 1.03 1.19 1.13
Median 0.84 1.08 0.95 0.76 0.91 0.87
Std Dev 4.77 1.97 0.84 0.93 1.11 0.97
Variance 22.70 3.87 0.70 0.87 1.23 0.94
Coeff Var 3.60 1.11 0.72 0.90 0.93 0.86
Percentiles
10 0.38 0.31 0.42 0.30 0.32 0.31
20 0.48 0.53 0.57 0.46 0.51 0.50
30 0.58 0.67 0.70 0.56 0.61 0.60
40 0.70 0.83 0.84 0.67 0.76 0.72
50 0.84 1.08 0.95 0.76 0.91 0.87
60 1.03 1.42 1.17 0.93 1.06 1.03
70 1.28 1.91 1.37 1.15 1.24 1.26
80 1.64 2.71 1.63 1.42 1.60 1.61
90 2.31 4.05 1.89 1.97 2.27 2.24
95 3.24 5.22 2.88 2.52 3.28 2.79
97.5 4.30 6.56 3.23 3.35 4.42 3.48
99 6.21 10.14 3.41 4.61 4.78 4.27
Cut Statistics
Top Cut Grade 20 20 20 20 20 20
No. Samples Cut 4 0 0 0 0 0
Cut Mean 1.21 1.77 1.17 1.03 1.19 1.13
Table 10-3 Basic Statistics for all Laterite Objects in the GVG Estimate
Runge Limited St Barbara Limited GVG Resource Report
Page 19 March 2008
Parameter Wireframe Object Number
1 2 3 4 5 6 7 8 9 10 11 14 15 16 17 18 19
Number 226 560 569 31 343 619 3535 1483 336 295 58 444 2042 3981 170 37 641
Minimum 0.00 0.00 0.00 0.20 0.06 0.01 0.01 0.00 0.01 0.01 0.18 0.01 0.01 0.01 0.01 0.08 0.01
Maximum 74.0 7.7 170.0 6.9 40.2 42.5 28.7 33.4 12.9 13.2 5.1 21.0 95.0 109.0 18.8 38.6 82.0
Mean 1.82 0.79 2.09 1.09 2.01 2.22 1.14 1.01 1.06 1.04 1.50 1.49 1.35 1.51 1.52 2.85 1.23
Median 0.64 0.60 0.90 0.60 0.90 0.91 0.78 0.60 0.78 0.70 1.15 0.84 0.68 0.84 0.75 0.88 0.73
Std Dev 5.67 0.78 7.61 1.33 3.83 4.43 1.43 1.63 1.25 1.13 1.13 2.13 3.52 3.49 2.41 7.96 3.65
Variance 32.1 0.6 57.9 1.8 14.7 19.6 2.0 2.7 1.6 1.3 1.3 4.6 12.4 12.2 5.8 63.3 13.3
Coeff Var 3.11 0.98 3.65 1.22 1.91 2.00 1.26 1.61 1.18 1.09 0.76 1.43 2.60 2.31 1.59 2.79 2.96
Percentiles
10 0.11 0.20 0.20 0.30 0.27 0.21 0.25 0.10 0.19 0.29 0.54 0.16 0.14 0.14 0.18 0.39 0.15
20 0.20 0.30 0.40 0.32 0.50 0.41 0.38 0.20 0.34 0.44 0.68 0.30 0.28 0.30 0.34 0.60 0.29
30 0.36 0.40 0.50 0.50 0.58 0.56 0.52 0.31 0.50 0.56 0.79 0.48 0.38 0.48 0.48 0.74 0.42
40 0.50 0.50 0.70 0.50 0.72 0.74 0.64 0.50 0.62 0.61 1.00 0.65 0.52 0.64 0.62 0.82 0.57
50 0.64 0.60 0.90 0.60 0.90 0.91 0.78 0.60 0.78 0.70 1.15 0.84 0.68 0.84 0.75 0.88 0.73
60 0.90 0.70 1.22 0.76 1.12 1.18 0.97 0.80 0.92 0.82 1.34 1.12 0.88 1.06 0.94 0.96 0.95
70 1.28 0.84 1.75 0.87 1.48 1.65 1.22 1.00 1.07 1.02 1.60 1.56 1.16 1.42 1.29 1.04 1.17
80 1.68 1.08 2.40 1.44 2.22 2.43 1.60 1.37 1.43 1.37 2.03 2.02 1.60 1.94 2.12 1.30 1.57
90 2.72 1.50 4.01 2.18 4.51 4.52 2.25 2.00 2.10 2.23 2.82 3.08 2.68 3.00 3.30 2.17 2.11
95 6.90 2.32 6.07 2.98 7.30 8.32 2.92 2.98 3.04 3.01 4.08 5.07 4.14 4.49 5.50 7.47 2.88
97.5 12.41 3.00 9.60 4.50 11.99 14.07 4.07 4.20 3.83 3.84 4.90 6.85 6.28 6.73 6.46 32.77 4.47
99 19.11 3.87 15.31 5.94 15.53 23.47 6.27 8.10 5.94 4.37 5.12 9.74 10.00 11.76 14.11 36.27 6.47
Cut Statistics
Top Cut Grade 15 20 20 20 20 25 25 15 25 25 25 10 20 20 10 10 10
No. Samples Cut 5 0 2 0 2 6 1 2 0 0 0 5 9 15 3 2 3
Cut Mean 1.49 0.79 1.79 1.09 1.90 2.12 1.14 1.00 1.06 1.04 1.50 1.44 1.25 1.43 1.41 1.48 1.05
Table 10-4 Basic Statistics for all Sap Domains in the GVG Estimate
Runge Limited St Barbara Limited GVG Resource Report
Page 20 March 2008
Parameter Wireframe Object Number
1 3 6 7 8 9 14 15 16
Number 226 150 68 92 335 344 46 102 822
Minimum 0.00 0.01 0.00 0.01 0.01 0.01 0.03 0.01 0.01
Maximum 74.0 11.8 4.3 9.0 14.0 12.9 2.7 12.8 47.6
Mean 1.82 1.73 0.52 0.90 1.40 1.06 0.72 0.70 0.95
Median 0.64 1.12 0.353 0.639 0.6 0.78 0.58 0.42 0.53
Std Dev 5.67 1.95 0.70 1.14 2.04 1.24 0.56 1.37 2.07
Variance 32.09 3.78 0.48 1.30 4.15 1.53 0.31 1.88 4.30
Coeff Var 3.11 1.12 1.35 1.26 1.46 1.16 0.78 1.95 2.19
Percentiles
10 0.11 0.18 0.10 0.24 0.15 0.19 0.21 0.14 0.19
20 0.20 0.45 0.17 0.31 0.23 0.36 0.29 0.26 0.29
30 0.36 0.58 0.25 0.47 0.32 0.50 0.36 0.33 0.36
40 0.50 0.87 0.30 0.57 0.46 0.64 0.38 0.35 0.44
50 0.64 1.12 0.35 0.64 0.60 0.78 0.58 0.42 0.53
60 0.90 1.38 0.41 0.70 0.88 0.92 0.64 0.48 0.65
70 1.28 1.80 0.47 0.91 1.29 1.09 0.77 0.55 0.78
80 1.68 2.51 0.55 1.07 2.00 1.43 1.05 0.70 1.05
90 2.72 4.31 0.81 1.54 3.45 2.06 1.46 0.99 1.78
95 6.90 5.67 1.67 2.14 5.62 3.00 1.75 2.00 2.77
97.5 12.41 6.51 2.49 2.77 7.59 3.83 1.96 3.35 4.73
99 19.11 9.51 3.73 6.30 10.49 5.89 2.35 4.03 8.39
Cut Statistics
Top Cut Grade 15 15 10 10 10 25 10 10 10
No. Samples Cut 5 0 0 0 4 0 0 1 3
Cut Mean 1.49 1.73 0.52 0.90 1.39 1.06 0.72 0.67 1.45
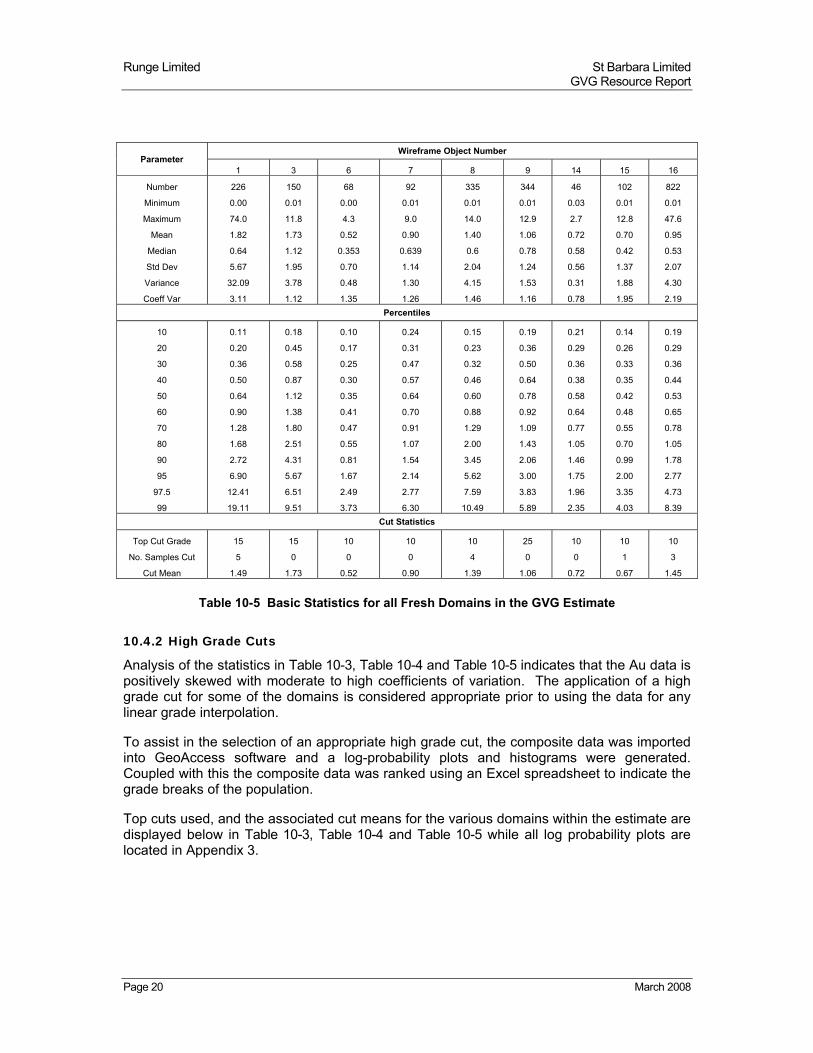
Table 10-5 Basic Statistics for all Fresh Domains in the GVG Estimate
10.4.2 High Grade Cuts
Analysis of the statistics in Table 10-3, Table 10-4 and Table 10-5 indicates that the Au data is positively skewed with moderate to high coefficients of variation. The application of a high grade cut for some of the domains is considered appropriate prior to using the data for any linear grade interpolation.
To assist in the selection of an appropriate high grade cut, the composite data was imported into GeoAccess software and a log-probability plots and histograms were generated. Coupled with this the composite data was ranked using an Excel spreadsheet to indicate the grade breaks of the population.
Top cuts used, and the associated cut means for the various domains within the estimate are displayed below in Table 10-3, Table 10-4 and Table 10-5 while all log probability plots are located in Appendix 3.
Runge Limited St Barbara Limited GVG Resource Report
Page 21 August 2008
10.5 Geostatistical Analysis
10.5.1 Variography
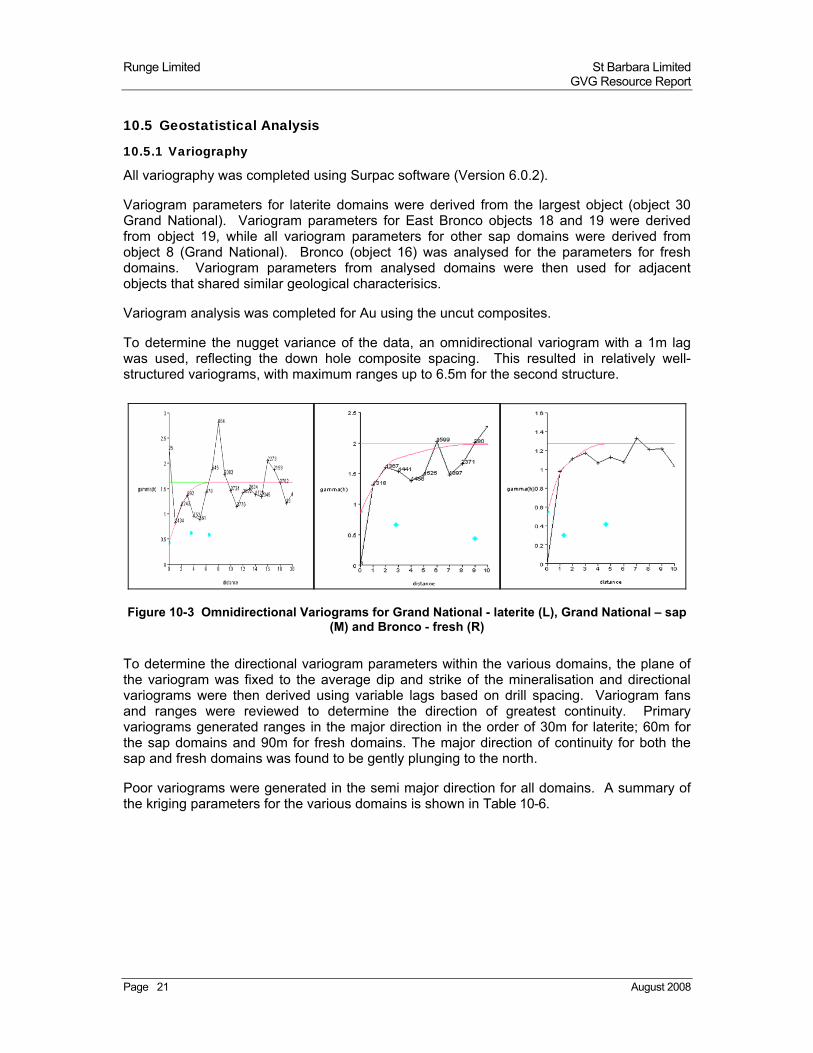
All variography was completed using Surpac software (Version 6.0.2).
Variogram parameters for laterite domains were derived from the largest object (object 30 Grand National). Variogram parameters for East Bronco objects 18 and 19 were derived from object 19, while all variogram parameters for other sap domains were derived from object 8 (Grand National). Bronco (object 16) was analysed for the parameters for fresh domains. Variogram parameters from analysed domains were then used for adjacent objects that shared similar geological characterisics.
Variogram analysis was completed for Au using the uncut composites.
To determine the nugget variance of the data, an omnidirectional variogram with a 1m lag was used, reflecting the down hole composite spacing. This resulted in relatively well-structured variograms, with maximum ranges up to 6.5m for the second structure.
Figure 10-3 Omnidirectional Variograms for Grand National - laterite (L), Grand National – sap (M) and Bronco - fresh (R)
To determine the directional variogram parameters within the various domains, the plane of the variogram was fixed to the average dip and strike of the mineralisation and directional variograms were then derived using variable lags based on drill spacing. Variogram fans and ranges were reviewed to determine the direction of greatest continuity. Primary variograms generated ranges in the major direction in the order of 30m for laterite; 60m for the sap domains and 90m for fresh domains. The major direction of continuity for both the sap and fresh domains was found to be gently plunging to the north.
Poor variograms were generated in the semi major direction for all domains. A summary of the kriging parameters for the various domains is shown in Table 10-6.
Runge Limited St Barbara Limited GVG Resource Report
Page 22 August 2008
Great Victoria Kriging Parameters - All Domains
Object Domain Major Major Direction Variable Lag Semi-Major Minor
Direction C0 C1 A1 C2 A2 A1 A2 A1 A2
1 Sap 40 -> 190 44% 28% 22.7 28% 59.8 18 42 2.8 9
2 Sap 40 -> 190 44% 28% 22.7 28% 59.8 18 42 2.8 9
3 Sap 40 -> 190 44% 28% 22.7 28% 59.8 18 42 2.8 9
4 Sap 40 -> 190 44% 28% 22.7 28% 59.8 18 42 2.8 9
5 Sap 40 -> 190 44% 28% 22.7 28% 59.8 18 42 2.8 9
6 Sap 40 -> 190 44% 28% 22.7 28% 59.8 18 42 2.8 9
7 Sap 40 -> 190 44% 28% 22.7 28% 59.8 18 42 2.8 9
7* Sap 0 -> 040 44% 28% 22.7 28% 59.8 18 42 2.8 9
8 Sap 40 -> 190 44% 28% 22.7 28% 59.8 18 42 2.8 9
9 Sap 40 -> 190 44% 28% 22.7 28% 59.8 18 42 2.8 9
10 Sap 40 -> 190 44% 28% 22.7 28% 59.8 18 42 2.8 9
11 Sap 40 -> 190 44% 28% 22.7 28% 59.8 18 42 2.8 9
14 Sap 40 -> 190 44% 28% 22.7 28% 59.8 18 42 2.8 9
15 Sap 40 -> 190 44% 28% 22.7 28% 59.8 18 42 2.8 9
16 Sap 40 -> 190 44% 28% 22.7 28% 59.8 18 42 2.8 9
17 Sap 40 -> 190 44% 28% 22.7 28% 59.8 18 42 2.8 9
18 Sap 0 -> 010 41% 25% 13.5 35% 23.4 12 20 3.3 11
19 Sap 0 -> 010 41% 25% 13.5 35% 23.4 12 20 3.3 11
1 Fresh 40 -> 195 44% 28% 22.7 28% 59.8 18 42.1 2.8 9
3 Fresh 40 -> 195 43% 15% 41.3 42% 93.4 29.9 63.1 1.3 4.6
6 Fresh 40 -> 195 43% 15% 41.3 42% 93.4 29.9 63.1 1.3 4.6
7 Fresh 40 -> 195 43% 15% 41.3 42% 93.4 29.9 63.1 1.3 4.6
8 Fresh 40 -> 195 43% 15% 41.3 42% 93.4 29.9 63.1 1.3 4.6
9 Fresh 40 -> 195 44% 28% 22.7 28% 59.8 18 42.1 2.8 9
14 Fresh 40 -> 195 43% 15% 41.3 42% 93.4 29.9 63.1 1.3 4.6
15 Fresh 40 -> 195 43% 15% 41.3 42% 93.4 29.9 63.1 1.3 4.6
16 Fresh 40 -> 195 43% 15% 41.3 42% 93.4 29.9 63.1 1.3 4.6
30 Laterite 0 -> 010 26% 28% 17 46% 29.7 10 18 4 6
31 Laterite 0 -> 010 26% 28% 17 46% 29.7 10 18 4 6
32 Laterite 0 -> 010 26% 28% 17 46% 29.7 10 18 4 6
33 Laterite 0 -> 010 26% 28% 17 46% 29.7 10 18 4 6
34 Laterite 0 -> 010 26% 28% 17 46% 29.7 10 18 4 6
35 Laterite 0 -> 010 26% 28% 17 46% 29.7 10 18 4 6
Table 10-6 Kriging Parameters for Various Domains
Runge Limited St Barbara Limited GVG Resource Report
Page 23 August 2008
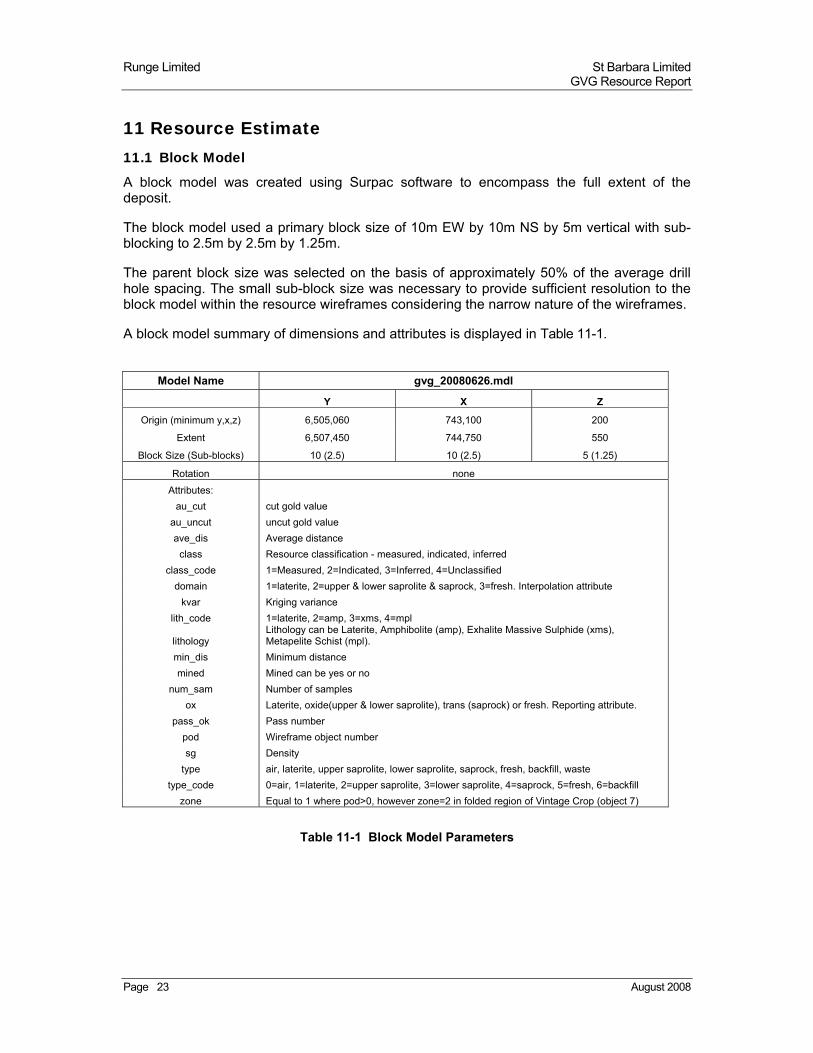
11 Resource Estimate 11.1 Block Model
A block model was created using Surpac software to encompass the full extent of the deposit.
The block model used a primary block size of 10m EW by 10m NS by 5m vertical with sub-blocking to 2.5m by 2.5m by 1.25m.
The parent block size was selected on the basis of approximately 50% of the average drill hole spacing. The small sub-block size was necessary to provide sufficient resolution to the block model within the resource wireframes considering the narrow nature of the wireframes.
A block model summary of dimensions and attributes is displayed in Table 11-1.
Model Name gvg_20080626.mdl
Y X Z
Origin (minimum y,x,z) 6,505,060 743,100 200
Extent 6,507,450 744,750 550
Block Size (Sub-blocks) 10 (2.5) 10 (2.5) 5 (1.25)
Rotation none
Attributes:
au_cut cut gold value
au_uncut uncut gold value
ave_dis Average distance
class Resource classification - measured, indicated, inferred
class_code 1=Measured, 2=Indicated, 3=Inferred, 4=Unclassified
domain 1=laterite, 2=upper & lower saprolite & saprock, 3=fresh. Interpolation attribute
kvar Kriging variance
lith_code 1=laterite, 2=amp, 3=xms, 4=mpl
lithology Lithology can be Laterite, Amphibolite (amp), Exhalite Massive Sulphide (xms), Metapelite Schist (mpl).
min_dis Minimum distance
mined Mined can be yes or no
num_sam Number of samples
ox Laterite, oxide(upper & lower saprolite), trans (saprock) or fresh. Reporting attribute.
pass_ok Pass number
pod Wireframe object number
sg Density
type air, laterite, upper saprolite, lower saprolite, saprock, fresh, backfill, waste
type_code 0=air, 1=laterite, 2=upper saprolite, 3=lower saprolite, 4=saprock, 5=fresh, 6=backfill
zone Equal to 1 where pod>0, however zone=2 in folded region of Vintage Crop (object 7)
Table 11-1 Block Model Parameters
Runge Limited St Barbara Limited GVG Resource Report
Page 24 August 2008
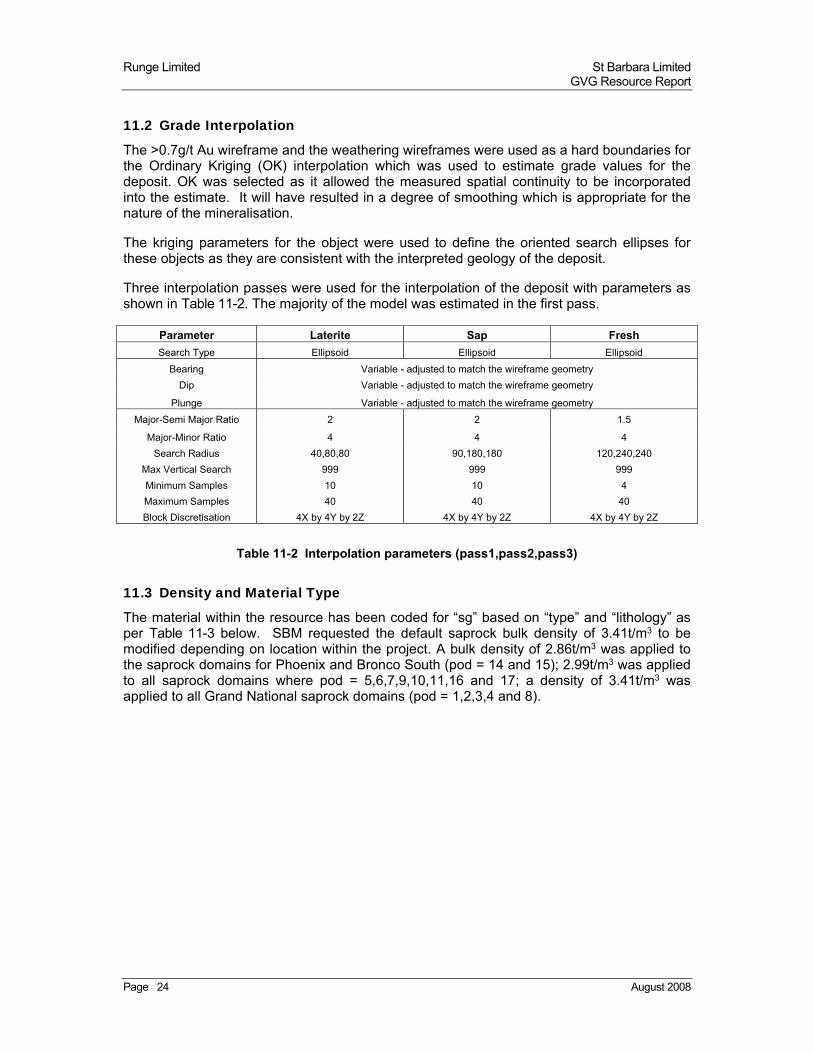
11.2 Grade Interpolation
The >0.7g/t Au wireframe and the weathering wireframes were used as a hard boundaries for the Ordinary Kriging (OK) interpolation which was used to estimate grade values for the deposit. OK was selected as it allowed the measured spatial continuity to be incorporated into the estimate. It will have resulted in a degree of smoothing which is appropriate for the nature of the mineralisation.
The kriging parameters for the object were used to define the oriented search ellipses for these objects as they are consistent with the interpreted geology of the deposit.
Three interpolation passes were used for the interpolation of the deposit with parameters as shown in Table 11-2. The majority of the model was estimated in the first pass.
Parameter Laterite Sap Fresh
Search Type Ellipsoid Ellipsoid Ellipsoid
Bearing Variable - adjusted to match the wireframe geometry
Dip Variable - adjusted to match the wireframe geometry
Plunge Variable - adjusted to match the wireframe geometry
Major-Semi Major Ratio 2 2 1.5
Major-Minor Ratio 4 4 4
Search Radius 40,80,80 90,180,180 120,240,240
Max Vertical Search 999 999 999
Minimum Samples 10 10 4
Maximum Samples 40 40 40
Block Discretisation 4X by 4Y by 2Z 4X by 4Y by 2Z 4X by 4Y by 2Z
Table 11-2 Interpolation parameters (pass1,pass2,pass3)
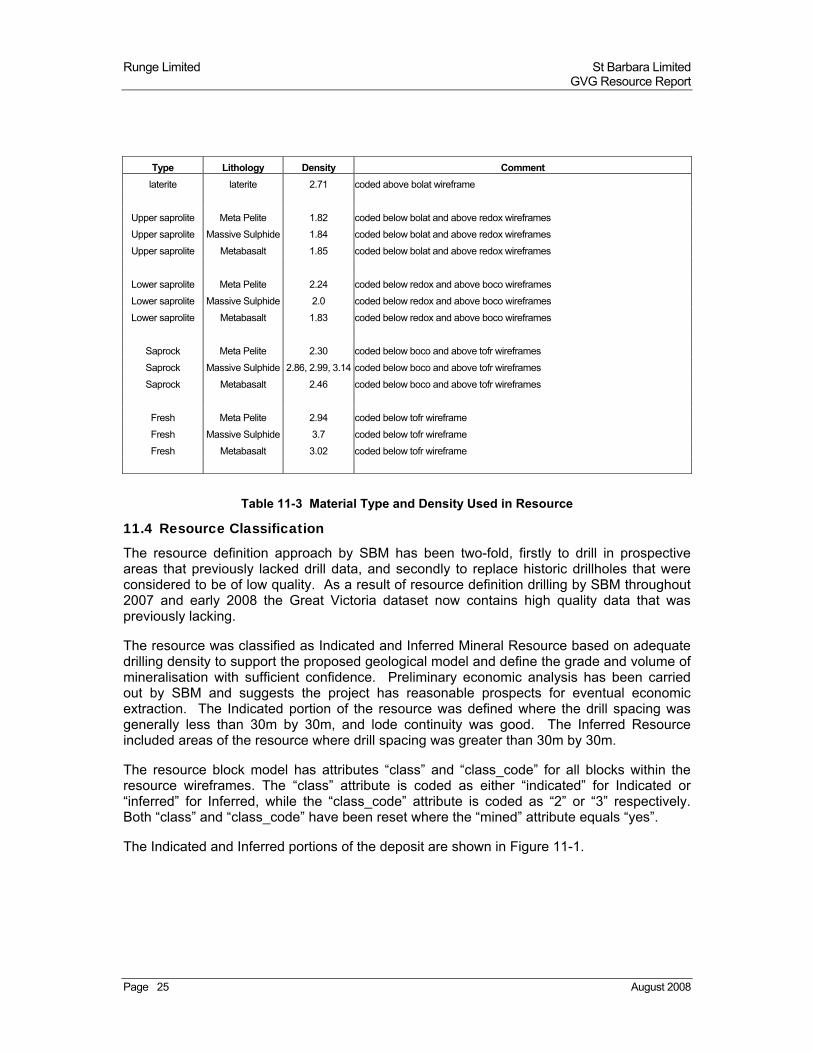
11.3 Density and Material Type
The material within the resource has been coded for “sg” based on “type” and “lithology” as per Table 11-3 below. SBM requested the default saprock bulk density of 3.41t/m3 to be modified depending on location within the project. A bulk density of 2.86t/m3 was applied to the saprock domains for Phoenix and Bronco South (pod = 14 and 15); 2.99t/m3 was applied to all saprock domains where pod = 5,6,7,9,10,11,16 and 17; a density of 3.41t/m3 was applied to all Grand National saprock domains (pod = 1,2,3,4 and 8).
Runge Limited St Barbara Limited GVG Resource Report
Page 25 August 2008
Type Lithology Density Comment
laterite laterite 2.71 coded above bolat wireframe
Upper saprolite Meta Pelite 1.82 coded below bolat and above redox wireframes
Upper saprolite Massive Sulphide 1.84 coded below bolat and above redox wireframes
Upper saprolite Metabasalt 1.85 coded below bolat and above redox wireframes
Lower saprolite Meta Pelite 2.24 coded below redox and above boco wireframes
Lower saprolite Massive Sulphide 2.0 coded below redox and above boco wireframes
Lower saprolite Metabasalt 1.83 coded below redox and above boco wireframes
Saprock Meta Pelite 2.30 coded below boco and above tofr wireframes
Saprock Massive Sulphide 2.86, 2.99, 3.14 coded below boco and above tofr wireframes
Saprock Metabasalt 2.46 coded below boco and above tofr wireframes
Fresh Meta Pelite 2.94 coded below tofr wireframe
Fresh Massive Sulphide 3.7 coded below tofr wireframe
Fresh Metabasalt 3.02 coded below tofr wireframe
Table 11-3 Material Type and Density Used in Resource
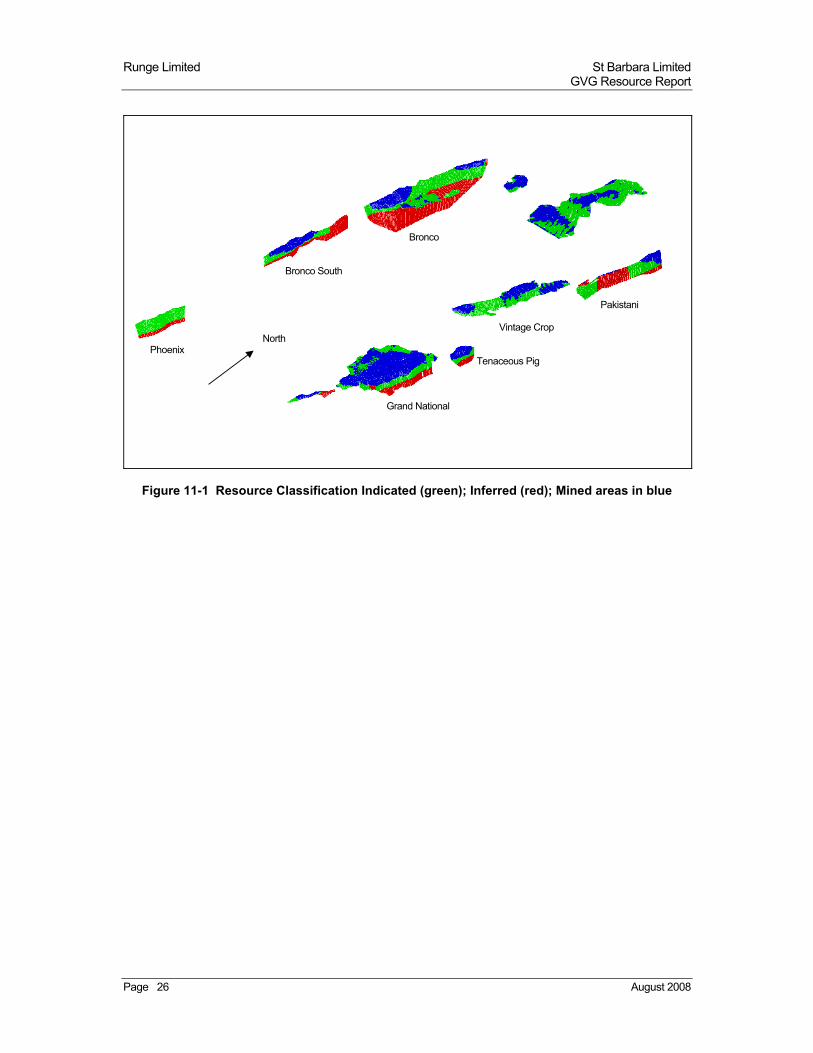
11.4 Resource Classification
The resource definition approach by SBM has been two-fold, firstly to drill in prospective areas that previously lacked drill data, and secondly to replace historic drillholes that were considered to be of low quality. As a result of resource definition drilling by SBM throughout 2007 and early 2008 the Great Victoria dataset now contains high quality data that was previously lacking.
The resource was classified as Indicated and Inferred Mineral Resource based on adequate drilling density to support the proposed geological model and define the grade and volume of mineralisation with sufficient confidence. Preliminary economic analysis has been carried out by SBM and suggests the project has reasonable prospects for eventual economic extraction. The Indicated portion of the resource was defined where the drill spacing was generally less than 30m by 30m, and lode continuity was good. The Inferred Resource included areas of the resource where drill spacing was greater than 30m by 30m.
The resource block model has attributes “class” and “class_code” for all blocks within the resource wireframes. The “class” attribute is coded as either “indicated” for Indicated or “inferred” for Inferred, while the “class_code” attribute is coded as “2” or “3” respectively. Both “class” and “class_code” have been reset where the “mined” attribute equals “yes”.
The Indicated and Inferred portions of the deposit are shown in Figure 11-1.
Runge Limited St Barbara Limited GVG Resource Report
Page 26 August 2008
Figure 11-1 Resource Classification Indicated (green); Inferred (red); Mined areas in blue
Vintage Crop
Phoenix
Bronco
Pakistani
Grand National
Bronco South
Tenaceous Pig
North
Runge Limited St Barbara Limited GVG Resource Report
Page 27 August 2008
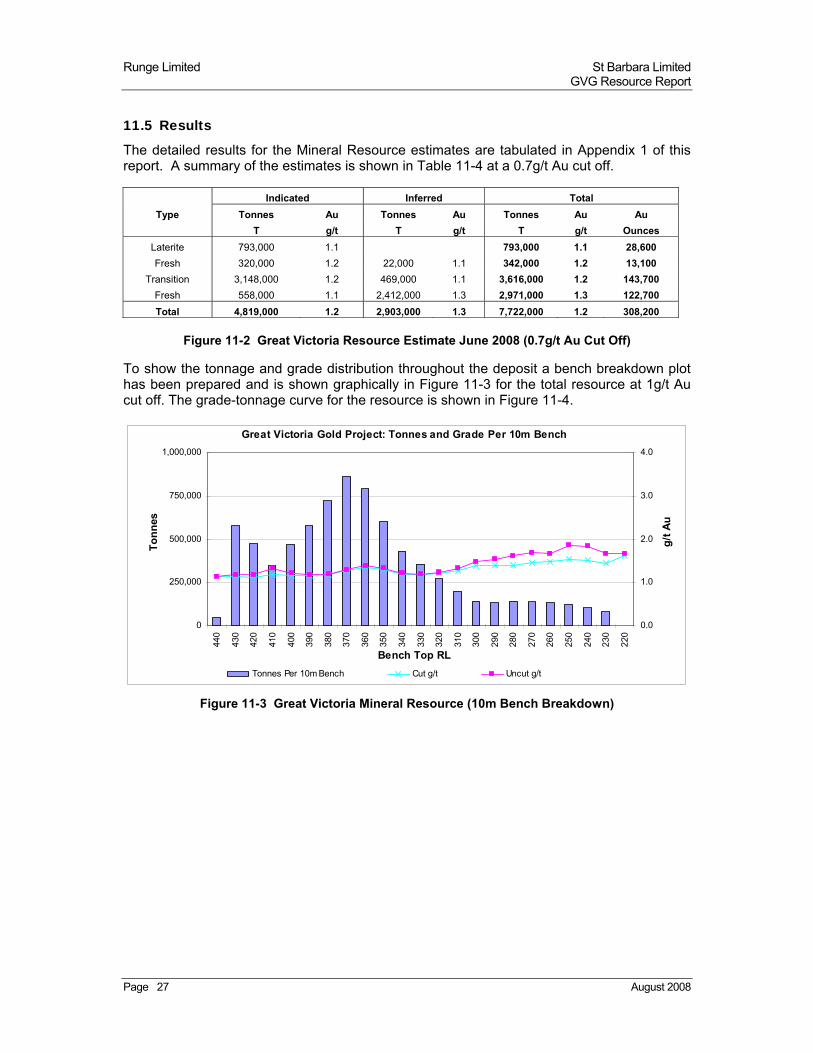
11.5 Results
The detailed results for the Mineral Resource estimates are tabulated in Appendix 1 of this report. A summary of the estimates is shown in Table 11-4 at a 0.7g/t Au cut off.
Indicated Inferred Total
Type Tonnes Au Tonnes Au Tonnes Au Au
T g/t T g/t T g/t Ounces
Laterite 793,000 1.1 793,000 1.1 28,600
Fresh 320,000 1.2 22,000 1.1 342,000 1.2 13,100
Transition 3,148,000 1.2 469,000 1.1 3,616,000 1.2 143,700
Fresh 558,000 1.1 2,412,000 1.3 2,971,000 1.3 122,700
Total 4,819,000 1.2 2,903,000 1.3 7,722,000 1.2 308,200
Figure 11-2 Great Victoria Resource Estimate June 2008 (0.7g/t Au Cut Off)
To show the tonnage and grade distribution throughout the deposit a bench breakdown plot has been prepared and is shown graphically in Figure 11-3 for the total resource at 1g/t Au cut off. The grade-tonnage curve for the resource is shown in Figure 11-4.
Great Victoria Gold Project: Tonnes and Grade Per 10m Bench
0
250,000
500,000
750,000
1,000,000
440
430
420
410
400
390
380
370
360
350
340
330
320
310
300
290
280
270
260
250
240
230
220
Bench Top RL
To
nn
es
0.0
1.0
2.0
3.0
4.0
g/t
Au
Tonnes Per 10m Bench Cut g/t Uncut g/t
Figure 11-3 Great Victoria Mineral Resource (10m Bench Breakdown)
Runge Limited St Barbara Limited GVG Resource Report
Page 28 August 2008
Great Victoria Gold Project Grade-Tonnage Curve
0
2,000,000
4,000,000
6,000,000
8,000,000
10,000,000
12,000,000
0.0
0.7
0.8
0.9
1.0
1.5
2.0
2.5
3.0
3.5
4.0
4.5
5.0
5.5
6.0
6.5
7.0
7.5
Cutoff Grade g/t
To
nn
es
0.0
2.0
4.0
6.0
8.0
10.0
12.0
Gra
de
g/t
Tonnes Cut g/t
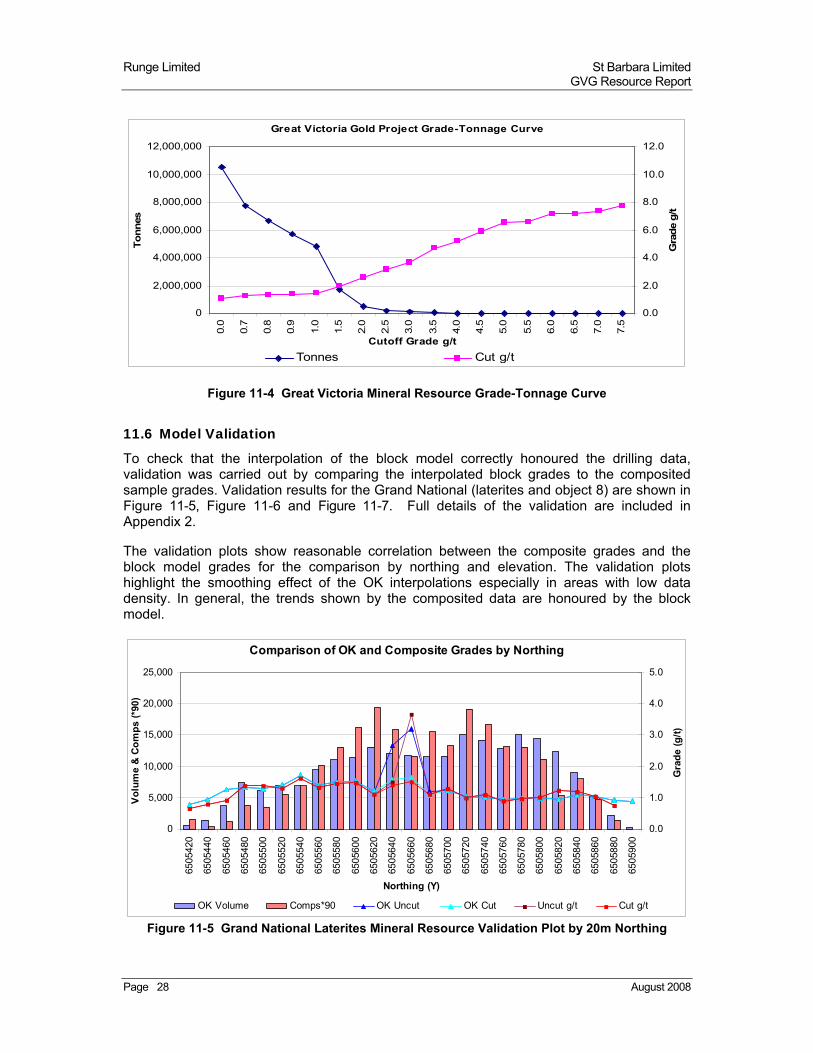
Figure 11-4 Great Victoria Mineral Resource Grade-Tonnage Curve
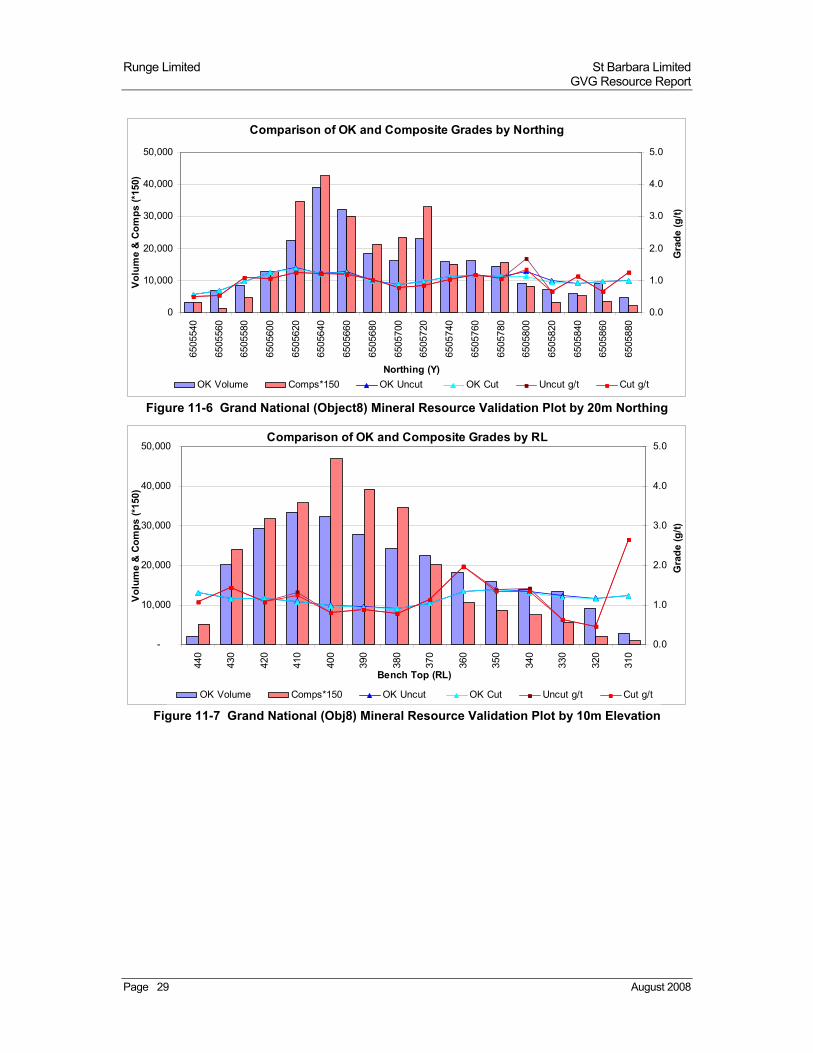
11.6 Model Validation
To check that the interpolation of the block model correctly honoured the drilling data, validation was carried out by comparing the interpolated block grades to the composited sample grades. Validation results for the Grand National (laterites and object 8) are shown in Figure 11-5, Figure 11-6 and Figure 11-7. Full details of the validation are included in Appendix 2.
The validation plots show reasonable correlation between the composite grades and the block model grades for the comparison by northing and elevation. The validation plots highlight the smoothing effect of the OK interpolations especially in areas with low data density. In general, the trends shown by the composited data are honoured by the block model.
Comparison of OK and Composite Grades by Northing
0
5,000
10,000
15,000
20,000
25,000
6505
420
6505
440
6505
460
6505
480
6505
500
6505
520
6505
540
6505
560
6505
580
6505
600
6505
620
6505
640
6505
660
6505
680
6505
700
6505
720
6505
740
6505
760
6505
780
6505
800
6505
820
6505
840
6505
860
6505
880
6505
900
Northing (Y)
Vo
lum
e &
Co
mp
s (*
90)
0.0
1.0
2.0
3.0
4.0
5.0G
rad
e (g
/t)
OK Volume Comps*90 OK Uncut OK Cut Uncut g/t Cut g/t
Figure 11-5 Grand National Laterites Mineral Resource Validation Plot by 20m Northing
Runge Limited St Barbara Limited GVG Resource Report
Page 29 August 2008
Comparison of OK and Composite Grades by Northing
0
10,000
20,000
30,000
40,000
50,000
6505
540
6505
560
6505
580
6505
600
6505
620
6505
640
6505
660
6505
680
6505
700
6505
720
6505
740
6505
760
6505
780
6505
800
6505
820
6505
840
6505
860
6505
880
Northing (Y)
Vo
lum
e &
Co
mp
s (*
150)
0.0
1.0
2.0
3.0
4.0
5.0
Gra
de
(g/t
)
OK Volume Comps*150 OK Uncut OK Cut Uncut g/t Cut g/t
Figure 11-6 Grand National (Object8) Mineral Resource Validation Plot by 20m Northing
Comparison of OK and Composite Grades by RL
-
10,000
20,000
30,000
40,000
50,000
440
430
420
410
400
390
380
370
360
350
340
330
320
310
Bench Top (RL)
Vo
lum
e &
Co
mp
s (*
150)
0.0
1.0
2.0
3.0
4.0
5.0
Gra
de
(g/t
)
OK Volume Comps*150 OK Uncut OK Cut Uncut g/t Cut g/t
Figure 11-7 Grand National (Obj8) Mineral Resource Validation Plot by 10m Elevation

Runge Limited St Barbara Limited GVG Resource Report
Page 30 August 2008
Volume validation of the model was completed by comparing the volume of the wireframe against the volume of the model. Overall an excellent correlation was achieved with a slight increase in model volume against the wireframe. Global averages for the composites and model by object are shown in Figure 11-8 and shows that the model slightly underestimates the cut composite grade.
Wireframe Block Model Composites
Object Lode Resource Ok Uncut Ok Cut Number of Uncut Cut
Number Volume Volume g/t g/t Comps g/t g/t
1 33,805 33,406 1.72 1.41 226 1.82 1.49
2 69,498 69,477 0.79 0.79 560 0.79 0.79
3 164,573 164,594 1.86 1.70 717 2.02 1.78
4 3,983 3,883 1.20 1.20 31 1.09 1.09
5 58,099 58,422 1.60 1.49 342 2.01 1.90
6 128,158 128,164 1.81 1.73 685 2.05 1.97
7 460,100 460,266 1.12 1.11 3,611 1.13 1.13
8 266,592 265,813 1.12 1.11 1,812 1.08 1.07
9 214,648 213,008 1.05 1.05 342 1.06 1.06
10 38,366 38,164 0.90 0.90 295 1.04 1.04
11 4,910 4,992 1.51 1.51 58 1.50 1.50
14 204,448 205,461 1.15 1.13 489 1.42 1.37
15 404,675 404,289 1.14 1.07 2,143 1.32 1.22
16 1,534,278 1,532,430 1.23 1.16 4,795 1.42 1.34
17 11,635 11,695 1.64 1.52 170 1.52 1.41
18 2,810 2,852 3.48 1.65 37 2.85 1.48
19 46,117 46,102 1.20 1.06 641 1.23 1.07
30 227,282 226,094 1.36 1.22 2,569 1.32 1.21
31 40,926 41,055 1.80 1.80 547 1.77 1.77
32 16,704 16,727 1.18 1.18 182 1.16 1.16
33 34,447 34,344 1.04 1.04 504 1.03 1.03
34 27,667 27,719 1.08 1.08 300 1.19 1.19
35 233,140 232,563 1.08 1.08 1,346 1.13 1.13
Total 4,226,861 4,221,520 1.23 1.18 22,402 1.32 1.26
Figure 11-8 Great Victoria Mineral Resource Composite and Global Resource Grade Comparison
12 Reconciliation 12.1 Mining
Detailed historical mining figures on a pit by pit basis were not supplied to Runge, therefore reconciliation of the model with historical mining has not been completed.
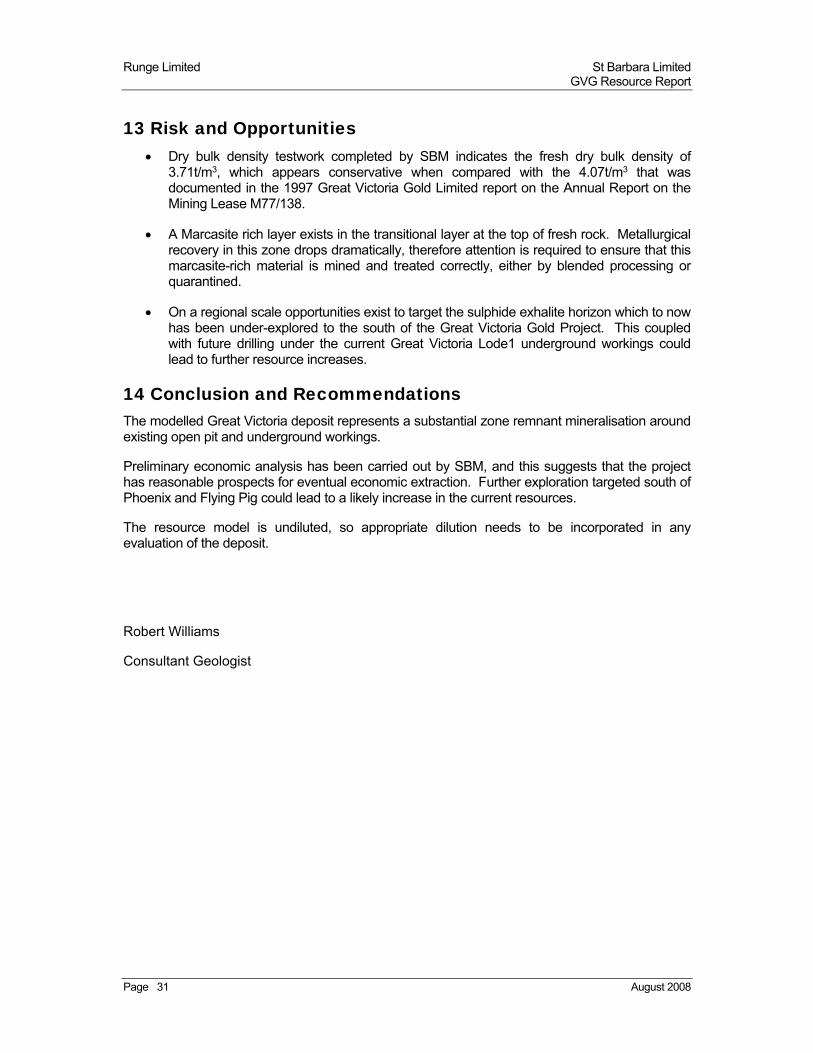
Runge Limited St Barbara Limited GVG Resource Report
Page 31 August 2008
13 Risk and Opportunities Dry bulk density testwork completed by SBM indicates the fresh dry bulk density of
3.71t/m3, which appears conservative when compared with the 4.07t/m3 that was documented in the 1997 Great Victoria Gold Limited report on the Annual Report on the Mining Lease M77/138.
A Marcasite rich layer exists in the transitional layer at the top of fresh rock. Metallurgical recovery in this zone drops dramatically, therefore attention is required to ensure that this marcasite-rich material is mined and treated correctly, either by blended processing or quarantined.
On a regional scale opportunities exist to target the sulphide exhalite horizon which to now has been under-explored to the south of the Great Victoria Gold Project. This coupled with future drilling under the current Great Victoria Lode1 underground workings could lead to further resource increases.
14 Conclusion and Recommendations The modelled Great Victoria deposit represents a substantial zone remnant mineralisation around existing open pit and underground workings.
Preliminary economic analysis has been carried out by SBM, and this suggests that the project has reasonable prospects for eventual economic extraction. Further exploration targeted south of Phoenix and Flying Pig could lead to a likely increase in the current resources.
The resource model is undiluted, so appropriate dilution needs to be incorporated in any evaluation of the deposit.
Robert Williams
Consultant Geologist
Runge Limited St Barbara Limited GVG Resource Report
Page 32 August 2008
15 References Keats, W., 1991. Geology and Gold Mines of the Bullfinch-Parker Range Region, Southern Cross Province, Western Australia, Geological Survey of Western Australia, Report 28.
Denig, W., 1988. Great Victoria Gold Limited. Annual Report on the Mining Lease M77/138. Yilgarn Mineral Field, Western Australia.
Drake-Brockman, J., 1989. Great Victoria Gold Limited. Grand National Completion Report
Great Victoria Gold Limited., 1989. Great Victoria Gold Limited. Annual Report on the Mining Lease M77/138. Yilgarn Mineral Field, Western Australia.
Runge Limited St Barbara Limited GVG Resource Report
Page 33 August 2008
Appendix 1
Great Victoria Gold Project
June 2008 Resource Tables
Runge Limited St Barbara Limited GVG Resource Report
Page 34 March 2008
Type Tonnes Au Uncut Au Cut Tonnes Au Uncut Au Cut Tonnes Au Uncut Au Cut Au CutT g/t g/t T g/t g/t T g/t g/t Ounces
Laterite 793,000 1.1 1.1 793,000 1.1 1.1 28,600Fresh 320,000 1.3 1.2 22,000 1.1 1.1 342,000 1.3 1.2 13,100
Transition 3,148,000 1.3 1.2 469,000 1.2 1.1 3,616,000 1.3 1.2 143,700Fresh 558,000 1.1 1.1 2,412,000 1.4 1.3 2,971,000 1.4 1.3 122,700Total 4,819,000 1.3 1.2 2,903,000 1.4 1.3 7,722,000 1.3 1.2 308,200
TotalGreat Victoria June 2008 Mineral Resource Estimate 0.7g/t Cutoff
Indicated Inferred
Page 35 August 2008
IndicatedBench
Top Tonnes Au Uncut Au Cut Tonnes Au Uncut Au Cut Tonnes Au Uncut Au Cut Tonnes Au Uncut Au Cut Tonnes Au Uncut Au Cut Au CutRL T g/t g/t T g/t g/t T g/t g/t T g/t g/t T g/t g/t Ounces440 48,039 1.13 1.13 48,039 1.13 1.13 1,748430 510,814 1.18 1.14 29,431 1.41 1.27 32,072 0.97 0.93 572,317 1.18 1.14 20,944420 217,414 1.09 1.08 104,855 1.28 1.18 133,998 1.25 1.12 456,267 1.18 1.11 16,352410 16,620 1.04 1.04 81,619 1.50 1.27 218,893 1.34 1.18 317,132 1.36 1.20 12,214400 46,083 1.13 1.10 383,604 1.25 1.19 429,687 1.24 1.18 16,261390 48,579 1.23 1.23 484,529 1.19 1.16 533,108 1.20 1.16 19,934380 9,406 1.12 1.12 611,576 1.21 1.18 54,286 1.12 1.12 675,268 1.20 1.18 25,528370 78 1.13 1.13 669,460 1.31 1.27 141,005 1.18 1.18 810,543 1.29 1.26 32,737360 508,628 1.48 1.42 222,058 1.16 1.16 730,686 1.38 1.34 31,561350 88,209 1.76 1.66 62,900 0.95 0.95 151,109 1.42 1.36 6,628340 15,137 2.00 1.92 48,591 0.91 0.91 63,728 1.17 1.15 2,357330 1,495 1.90 1.86 29,629 0.91 0.91 31,124 0.95 0.95 954
Total 792,887 1.15 1.12 320,051 1.31 1.20 3,147,601 1.31 1.25 558,469 1.10 1.10 4,819,008 1.26 1.21 187,217
InferredBench
Top Tonnes Au Uncut Au Cut Tonnes Au Uncut Au Cut Tonnes Au Uncut Au Cut Tonnes Au Uncut Au Cut Tonnes Au Uncut Au Cut Au CutRL T g/t g/t T g/t g/t T g/t g/t T g/t g/t T g/t g/t Ounces430 4,273 1.30 1.30 1,682 0.89 0.89 5,955 1.19 1.19 227420 4,813 1.07 1.07 15,139 1.10 1.10 19,952 1.09 1.09 701410 1,625 1.03 1.03 31,724 1.01 1.01 33,349 1.01 1.01 1,087400 4,827 1.09 1.09 35,416 0.97 0.97 40,243 0.99 0.99 1,279390 4,141 0.99 0.99 39,768 0.98 0.98 43,909 0.98 0.98 1,387380 2,344 0.94 0.94 40,643 1.00 1.00 2,284 2.95 2.95 45,271 1.09 1.09 1,594370 16 0.99 0.99 40,328 1.00 1.00 12,401 2.43 2.43 52,745 1.34 1.34 2,267360 36,077 1.03 1.03 23,703 1.84 1.84 59,780 1.35 1.35 2,595350 182,237 1.38 1.34 268,279 1.22 1.21 450,516 1.28 1.26 18,289340 44,761 1.20 1.16 321,929 1.22 1.20 366,690 1.22 1.20 14,102330 876 1.02 1.00 324,848 1.22 1.20 325,724 1.22 1.20 12,582320 270,245 1.23 1.22 270,245 1.23 1.22 10,597310 198,615 1.32 1.28 198,615 1.32 1.28 8,159300 140,860 1.48 1.38 140,860 1.48 1.38 6,227290 131,205 1.53 1.40 131,205 1.53 1.40 5,897280 139,848 1.61 1.41 139,848 1.61 1.41 6,320270 138,259 1.68 1.46 138,259 1.68 1.46 6,499260 133,142 1.66 1.47 133,142 1.66 1.47 6,304250 121,984 1.86 1.53 121,984 1.86 1.53 6,006240 103,253 1.83 1.52 103,253 1.83 1.52 5,055230 79,261 1.67 1.45 79,261 1.67 1.45 3,685220 2,081 1.67 1.61 2,081 1.67 1.61 107
Total 22,039 1.09 1.09 468,651 1.17 1.15 2,412,197 1.42 1.33 2,902,887 1.38 1.30 120,966
BenchTop Tonnes Au Uncut Au Cut Tonnes Au Uncut Au Cut Tonnes Au Uncut Au Cut Tonnes Au Uncut Au Cut Tonnes Au Uncut Au Cut Au CutRL T g/t g/t T g/t g/t T g/t g/t T g/t g/t T g/t g/t Ounces440 48,039 1.13 1.13 48,039 1.13 1.13 1,748430 510,814 1.18 1.14 33,704 1.40 1.27 33,754 0.97 0.93 578,272 1.18 1.14 21,171420 217,414 1.09 1.08 109,668 1.27 1.17 149,137 1.24 1.12 476,219 1.18 1.11 17,053410 16,620 1.04 1.04 83,244 1.49 1.26 250,617 1.30 1.16 350,481 1.33 1.18 13,300400 50,910 1.12 1.10 419,020 1.23 1.17 469,930 1.22 1.16 17,540390 52,720 1.21 1.21 524,297 1.18 1.14 577,017 1.18 1.15 21,321380 11,750 1.08 1.08 652,219 1.20 1.17 56,570 1.20 1.20 720,539 1.20 1.17 27,122370 94 1.10 1.10 709,788 1.29 1.26 153,406 1.28 1.28 863,288 1.29 1.26 35,004360 544,705 1.45 1.40 245,761 1.23 1.22 790,466 1.38 1.34 34,156350 270,446 1.50 1.44 331,179 1.17 1.16 601,625 1.32 1.29 24,917340 59,898 1.40 1.35 370,520 1.18 1.16 430,418 1.21 1.19 16,458330 2,371 1.57 1.54 354,477 1.19 1.18 356,848 1.19 1.18 13,535320 270,245 1.23 1.22 270,245 1.23 1.22 10,597310 198,615 1.32 1.28 198,615 1.32 1.28 8,159300 140,860 1.48 1.38 140,860 1.48 1.38 6,227290 131,205 1.53 1.40 131,205 1.53 1.40 5,897280 139,848 1.61 1.41 139,848 1.61 1.41 6,320270 138,259 1.68 1.46 138,259 1.68 1.46 6,499260 133,142 1.66 1.47 133,142 1.66 1.47 6,304250 121,984 1.86 1.53 121,984 1.86 1.53 6,006240 103,253 1.83 1.52 103,253 1.83 1.52 5,055230 79,261 1.67 1.45 79,261 1.67 1.45 3,685220 2,081 1.67 1.61 2,081 1.67 1.61 107
Total 792,887 1.15 1.12 342,090 1.30 1.20 3,616,252 1.29 1.24 2,970,666 1.36 1.28 7,721,895 1.30 1.24 308,182
Transitional
Total
Laterite Oxide Fresh TotalTotal Great Victoria Gold Project - Indicated and Inferred >0.7g/t
Laterite Oxide FreshTransitional
Great Victoria June 2008 Mineral Resource Estimate 0.7g/t Cutoff
Laterite Oxide Fresh TotalTransitional
Page 36 August 2008
BenchTop Tonnes Au Uncut Au Cut Au Uncut Au CutRL T g/t g/t Ounces Ounces Tonnes Uncut Oz Cut Oz440 48,039 1.1 1.1 1,748 1,748 4,804 175 175430 578,272 1.2 1.1 21,979 21,171 57,827 2,198 2,117420 476,219 1.2 1.1 17,999 17,053 47,622 1,800 1,705410 350,481 1.3 1.2 15,003 13,300 35,048 1,500 1,330400 469,930 1.2 1.2 18,376 17,540 46,993 1,838 1,754390 577,017 1.2 1.1 21,925 21,321 57,702 2,192 2,132380 720,539 1.2 1.2 27,694 27,122 72,054 2,769 2,712370 863,288 1.3 1.3 35,842 35,004 86,329 3,584 3,500360 790,466 1.4 1.3 35,099 34,156 79,047 3,510 3,416350 601,625 1.3 1.3 25,501 24,917 60,163 2,550 2,492340 430,418 1.2 1.2 16,734 16,458 43,042 1,673 1,646330 356,848 1.2 1.2 13,696 13,535 35,685 1,370 1,354320 270,245 1.2 1.2 10,660 10,597 27,025 1,066 1,060310 198,615 1.3 1.3 8,426 8,159 19,862 843 816300 140,860 1.5 1.4 6,707 6,227 14,086 671 623290 131,205 1.5 1.4 6,475 5,897 13,121 648 590280 139,848 1.6 1.4 7,250 6,320 13,985 725 632270 138,259 1.7 1.5 7,465 6,499 13,826 747 650260 133,142 1.7 1.5 7,120 6,304 13,314 712 630250 121,984 1.9 1.5 7,303 6,006 12,198 730 601240 103,253 1.8 1.5 6,073 5,055 10,325 607 506230 79,261 1.7 1.4 4,268 3,685 7,926 427 369220 2,081 1.7 1.6 112 107 208 11 11
Total 7,721,895 1.3 1.2 323,455 308,182 1,544,379 64,691 61,636
Indicated and Inferred Resources 0.7g/t CutoffGreat Victoria June 2008 Mineral Resource Estimate 0.7g/t Cutoff
Per Vertical Metre
Great Victoria Gold Project: Tonnes and Grade Per 10m Bench
0
250,000
500,000
750,000
1,000,000
440
430
420
410
400
390
380
370
360
350
340
330
320
310
300
290
280
270
260
250
240
230
220
Bench Top RL
To
nn
es
0.0
1.0
2.0
3.0
4.0
g/t
Au
Tonnes Per 10m Bench Au Cut g/t Au Uncut g/t
Great Victoria Gold Project: Tonnes and Ounces Per Vertical Metre
0
25,000
50,000
75,000
100,000
440
430
420
410
400
390
380
370
360
350
340
330
320
310
300
290
280
270
260
250
240
230
220
Bench Top RL
To
nn
es/V
m
0
1,000
2,000
3,000
4,000
Ou
nce
/Vm
TVM OVM Cut OVM Uncut
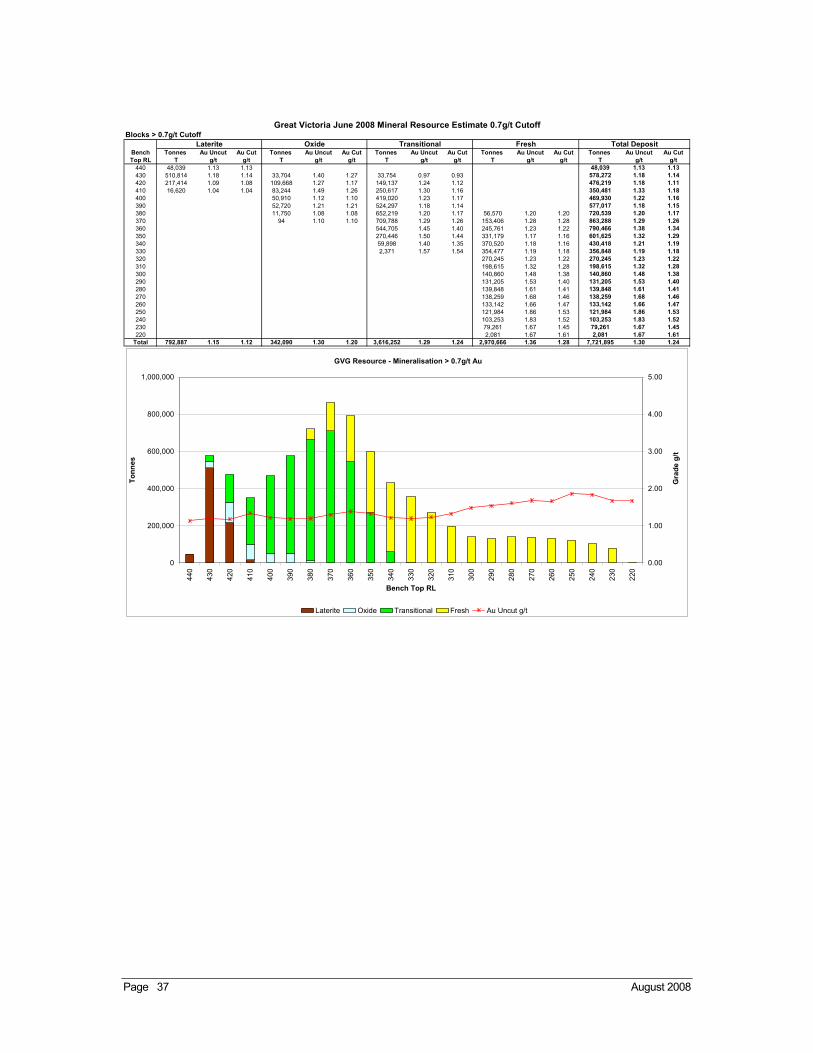
Page 37 August 2008
Blocks > 0.7g/t Cutoff
Bench Tonnes Au Uncut Au Cut Tonnes Au Uncut Au Cut Tonnes Au Uncut Au Cut Tonnes Au Uncut Au Cut Tonnes Au Uncut Au CutTop RL T g/t g/t T g/t g/t T g/t g/t T g/t g/t T g/t g/t
440 48,039 1.13 1.13 0 0.00 0.00 0 0.00 0.00 0 0.00 0.00 48,039 1.13 1.13430 510,814 1.18 1.14 33,704 1.40 1.27 33,754 0.97 0.93 0 0.00 0.00 578,272 1.18 1.14420 217,414 1.09 1.08 109,668 1.27 1.17 149,137 1.24 1.12 0 0.00 0.00 476,219 1.18 1.11410 16,620 1.04 1.04 83,244 1.49 1.26 250,617 1.30 1.16 0 0.00 0.00 350,481 1.33 1.18400 0 0.00 0.00 50,910 1.12 1.10 419,020 1.23 1.17 0 0.00 0.00 469,930 1.22 1.16390 0 0.00 0.00 52,720 1.21 1.21 524,297 1.18 1.14 0 0.00 0.00 577,017 1.18 1.15380 0 0.00 0.00 11,750 1.08 1.08 652,219 1.20 1.17 56,570 1.20 1.20 720,539 1.20 1.17370 0 0.00 0.00 94 1.10 1.10 709,788 1.29 1.26 153,406 1.28 1.28 863,288 1.29 1.26360 0 0.00 0.00 0 0.00 0.00 544,705 1.45 1.40 245,761 1.23 1.22 790,466 1.38 1.34350 0 0.00 0.00 0 0.00 0.00 270,446 1.50 1.44 331,179 1.17 1.16 601,625 1.32 1.29340 0 0.00 0.00 0 0.00 0.00 59,898 1.40 1.35 370,520 1.18 1.16 430,418 1.21 1.19330 0 0.00 0.00 0 0.00 0.00 2,371 1.57 1.54 354,477 1.19 1.18 356,848 1.19 1.18320 0 0.00 0.00 0 0.00 0.00 0 0.00 0.00 270,245 1.23 1.22 270,245 1.23 1.22310 0 0.00 0.00 0 0.00 0.00 0 0.00 0.00 198,615 1.32 1.28 198,615 1.32 1.28300 0 0.00 0.00 0 0.00 0.00 0 0.00 0.00 140,860 1.48 1.38 140,860 1.48 1.38290 0 0.00 0.00 0 0.00 0.00 0 0.00 0.00 131,205 1.53 1.40 131,205 1.53 1.40280 0 0.00 0.00 0 0.00 0.00 0 0.00 0.00 139,848 1.61 1.41 139,848 1.61 1.41270 0 0.00 0.00 0 0.00 0.00 0 0.00 0.00 138,259 1.68 1.46 138,259 1.68 1.46260 0 0.00 0.00 0 0.00 0.00 0 0.00 0.00 133,142 1.66 1.47 133,142 1.66 1.47250 0 0.00 0.00 0 0.00 0.00 0 0.00 0.00 121,984 1.86 1.53 121,984 1.86 1.53240 0 0.00 0.00 0 0.00 0.00 0 0.00 0.00 103,253 1.83 1.52 103,253 1.83 1.52230 0 0.00 0.00 0 0.00 0.00 0 0.00 0.00 79,261 1.67 1.45 79,261 1.67 1.45220 0 0.00 0.00 0 0.00 0.00 0 0.00 0.00 2,081 1.67 1.61 2,081 1.67 1.61
Total 792,887 1.15 1.12 342,090 1.30 1.20 3,616,252 1.29 1.24 2,970,666 1.36 1.28 7,721,895 1.30 1.24
Great Victoria June 2008 Mineral Resource Estimate 0.7g/t Cutoff
Total DepositLaterite Transitional FreshOxide
GVG Resource - Mineralisation > 0.7g/t Au
0
200,000
400,000
600,000
800,000
1,000,000
440
430
420
410
400
390
380
370
360
350
340
330
320
310
300
290
280
270
260
250
240
230
220
Bench Top RL
To
nn
es
0.00
1.00
2.00
3.00
4.00
5.00
Gra
de
g/t
Laterite Oxide Transitional Fresh Au Uncut g/t
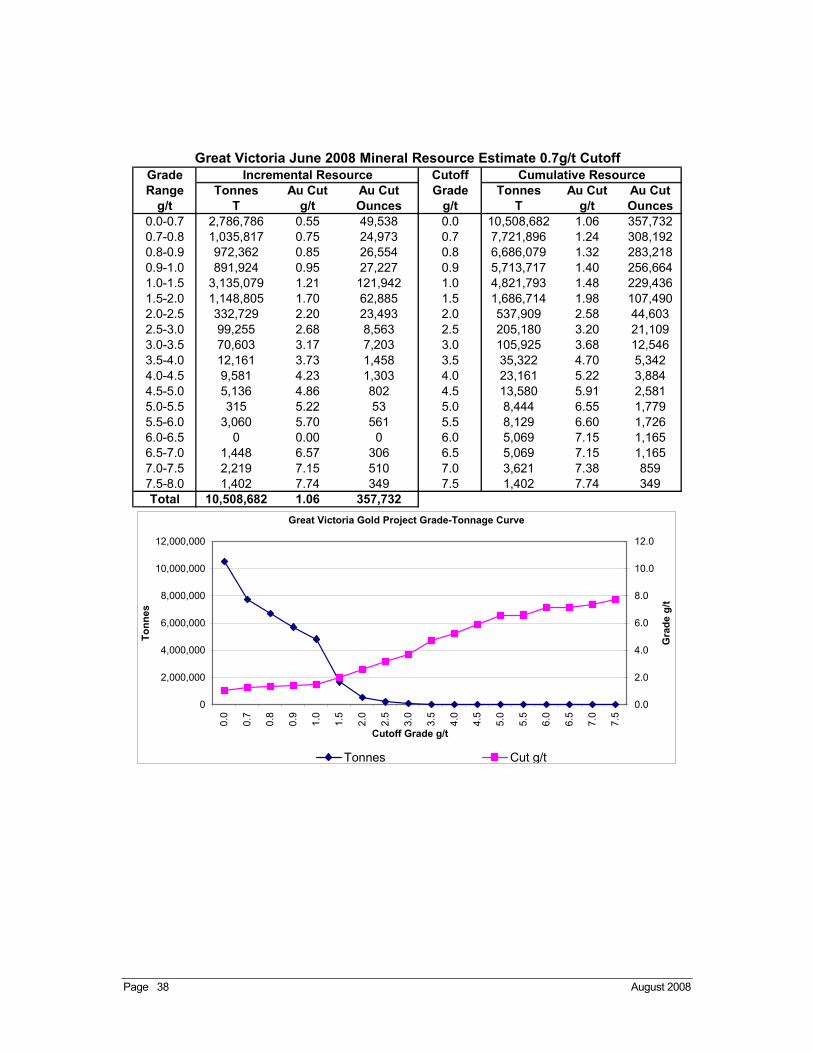
Page 38 August 2008
Grade CutoffRange Tonnes Au Cut Au Cut Grade Tonnes Au Cut Au Cut
g/t T g/t Ounces g/t T g/t Ounces0.0-0.7 2,786,786 0.55 49,538 0.0 10,508,682 1.06 357,7320.7-0.8 1,035,817 0.75 24,973 0.7 7,721,896 1.24 308,1920.8-0.9 972,362 0.85 26,554 0.8 6,686,079 1.32 283,2180.9-1.0 891,924 0.95 27,227 0.9 5,713,717 1.40 256,6641.0-1.5 3,135,079 1.21 121,942 1.0 4,821,793 1.48 229,4361.5-2.0 1,148,805 1.70 62,885 1.5 1,686,714 1.98 107,4902.0-2.5 332,729 2.20 23,493 2.0 537,909 2.58 44,6032.5-3.0 99,255 2.68 8,563 2.5 205,180 3.20 21,1093.0-3.5 70,603 3.17 7,203 3.0 105,925 3.68 12,5463.5-4.0 12,161 3.73 1,458 3.5 35,322 4.70 5,3424.0-4.5 9,581 4.23 1,303 4.0 23,161 5.22 3,8844.5-5.0 5,136 4.86 802 4.5 13,580 5.91 2,5815.0-5.5 315 5.22 53 5.0 8,444 6.55 1,7795.5-6.0 3,060 5.70 561 5.5 8,129 6.60 1,7266.0-6.5 0 0.00 0 6.0 5,069 7.15 1,1656.5-7.0 1,448 6.57 306 6.5 5,069 7.15 1,1657.0-7.5 2,219 7.15 510 7.0 3,621 7.38 8597.5-8.0 1,402 7.74 349 7.5 1,402 7.74 349Total 10,508,682 1.06 357,732
Incremental Resource Cumulative ResourceGreat Victoria June 2008 Mineral Resource Estimate 0.7g/t Cutoff
Great Victoria Gold Project Grade-Tonnage Curve
0
2,000,000
4,000,000
6,000,000
8,000,000
10,000,000
12,000,000
0.0
0.7
0.8
0.9
1.0
1.5
2.0
2.5
3.0
3.5
4.0
4.5
5.0
5.5
6.0
6.5
7.0
7.5
Cutoff Grade g/t
To
nn
es
0.0
2.0
4.0
6.0
8.0
10.0
12.0
Gra
de
g/t
Tonnes Cut g/t
Page 39 August 2008
Appendix 2
Great Victoria Gold Project
June 2008 Validation Plots
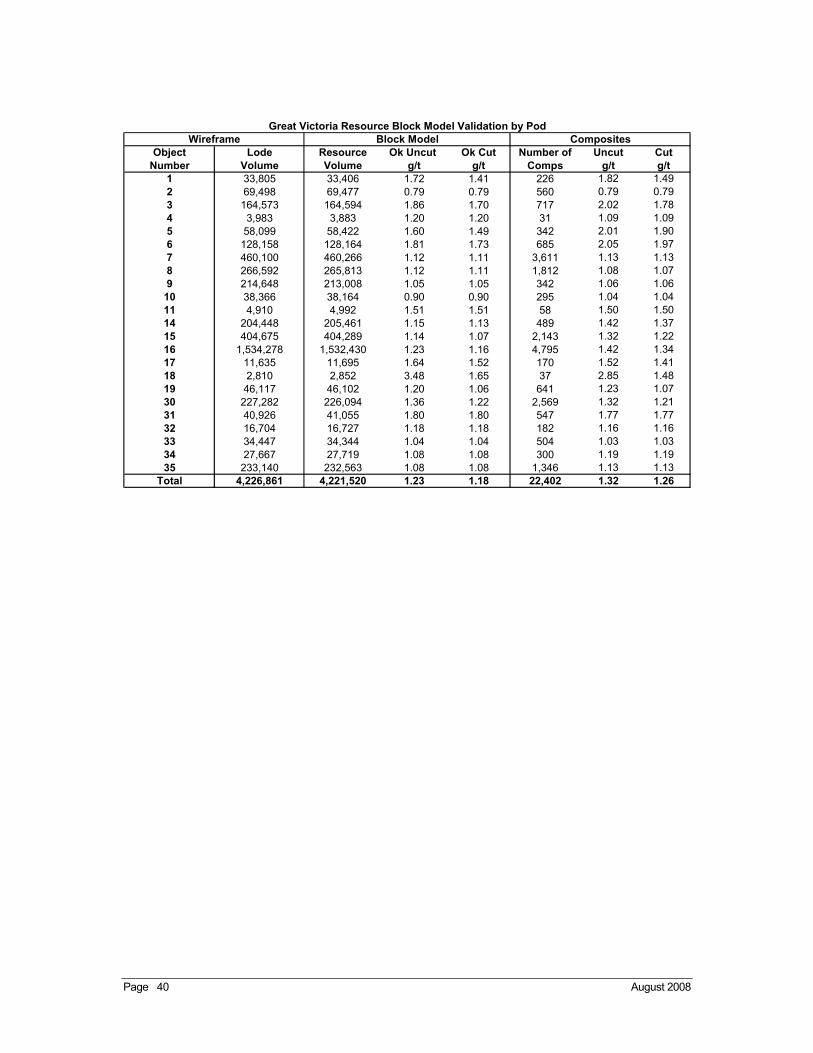
Page 40 August 2008
Object Lode Resource Ok Uncut Ok Cut Number of Uncut CutNumber Volume Volume g/t g/t Comps g/t g/t
1 33,805 33,406 1.72 1.41 226 1.82 1.492 69,498 69,477 0.79 0.79 560 0.79 0.793 164,573 164,594 1.86 1.70 717 2.02 1.784 3,983 3,883 1.20 1.20 31 1.09 1.095 58,099 58,422 1.60 1.49 342 2.01 1.906 128,158 128,164 1.81 1.73 685 2.05 1.977 460,100 460,266 1.12 1.11 3,611 1.13 1.138 266,592 265,813 1.12 1.11 1,812 1.08 1.079 214,648 213,008 1.05 1.05 342 1.06 1.06
10 38,366 38,164 0.90 0.90 295 1.04 1.0411 4,910 4,992 1.51 1.51 58 1.50 1.5014 204,448 205,461 1.15 1.13 489 1.42 1.3715 404,675 404,289 1.14 1.07 2,143 1.32 1.2216 1,534,278 1,532,430 1.23 1.16 4,795 1.42 1.3417 11,635 11,695 1.64 1.52 170 1.52 1.4118 2,810 2,852 3.48 1.65 37 2.85 1.4819 46,117 46,102 1.20 1.06 641 1.23 1.0730 227,282 226,094 1.36 1.22 2,569 1.32 1.2131 40,926 41,055 1.80 1.80 547 1.77 1.7732 16,704 16,727 1.18 1.18 182 1.16 1.1633 34,447 34,344 1.04 1.04 504 1.03 1.0334 27,667 27,719 1.08 1.08 300 1.19 1.1935 233,140 232,563 1.08 1.08 1,346 1.13 1.13
Total 4,226,861 4,221,520 1.23 1.18 22,402 1.32 1.26
Great Victoria Resource Block Model Validation by PodBlock Model CompositesWireframe
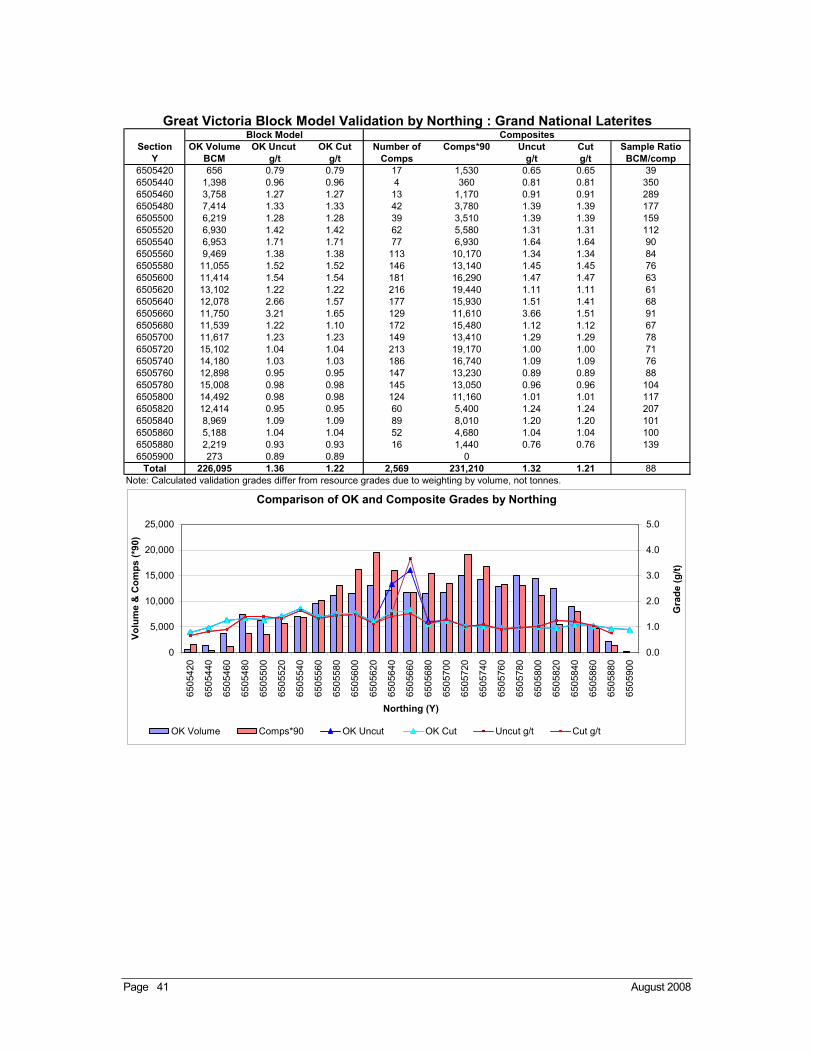
Page 41 August 2008
Section OK Volume OK Uncut OK Cut Number of Comps*90 Uncut Cut Sample RatioY BCM g/t g/t Comps g/t g/t BCM/comp
6505420 656 0.79 0.79 17 1,530 0.65 0.65 396505440 1,398 0.96 0.96 4 360 0.81 0.81 3506505460 3,758 1.27 1.27 13 1,170 0.91 0.91 2896505480 7,414 1.33 1.33 42 3,780 1.39 1.39 1776505500 6,219 1.28 1.28 39 3,510 1.39 1.39 1596505520 6,930 1.42 1.42 62 5,580 1.31 1.31 1126505540 6,953 1.71 1.71 77 6,930 1.64 1.64 906505560 9,469 1.38 1.38 113 10,170 1.34 1.34 846505580 11,055 1.52 1.52 146 13,140 1.45 1.45 766505600 11,414 1.54 1.54 181 16,290 1.47 1.47 636505620 13,102 1.22 1.22 216 19,440 1.11 1.11 616505640 12,078 2.66 1.57 177 15,930 1.51 1.41 686505660 11,750 3.21 1.65 129 11,610 3.66 1.51 916505680 11,539 1.22 1.10 172 15,480 1.12 1.12 676505700 11,617 1.23 1.23 149 13,410 1.29 1.29 786505720 15,102 1.04 1.04 213 19,170 1.00 1.00 716505740 14,180 1.03 1.03 186 16,740 1.09 1.09 766505760 12,898 0.95 0.95 147 13,230 0.89 0.89 886505780 15,008 0.98 0.98 145 13,050 0.96 0.96 1046505800 14,492 0.98 0.98 124 11,160 1.01 1.01 1176505820 12,414 0.95 0.95 60 5,400 1.24 1.24 2076505840 8,969 1.09 1.09 89 8,010 1.20 1.20 1016505860 5,188 1.04 1.04 52 4,680 1.04 1.04 1006505880 2,219 0.93 0.93 16 1,440 0.76 0.76 1396505900 273 0.89 0.89 0
Total 226,095 1.36 1.22 2,569 231,210 1.32 1.21 88Note: Calculated validation grades differ from resource grades due to weighting by volume, not tonnes.
Block Model CompositesGreat Victoria Block Model Validation by Northing : Grand National Laterites
Comparison of OK and Composite Grades by Northing
0
5,000
10,000
15,000
20,000
25,000
6505
420
6505
440
6505
460
6505
480
6505
500
6505
520
6505
540
6505
560
6505
580
6505
600
6505
620
6505
640
6505
660
6505
680
6505
700
6505
720
6505
740
6505
760
6505
780
6505
800
6505
820
6505
840
6505
860
6505
880
6505
900
Northing (Y)
Vo
lum
e &
Co
mp
s (*
90)
0.0
1.0
2.0
3.0
4.0
5.0
Gra
de
(g/t
)
OK Volume Comps*90 OK Uncut OK Cut Uncut g/t Cut g/t
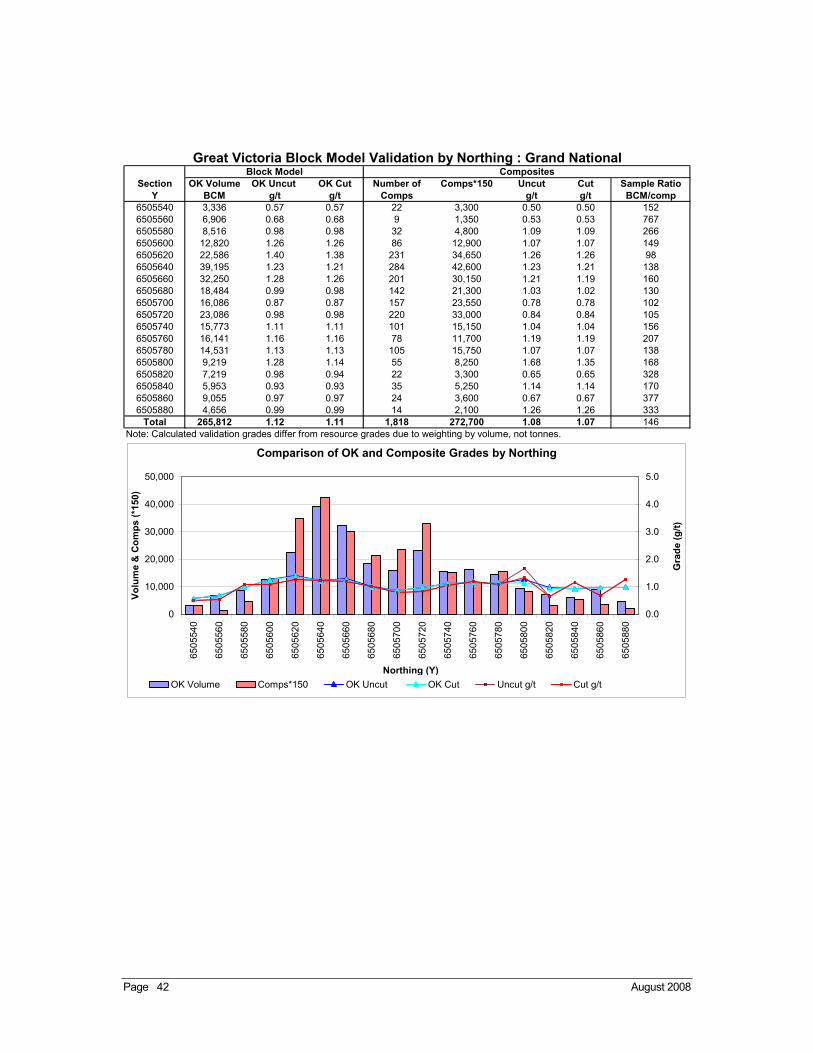
Page 42 August 2008
Section OK Volume OK Uncut OK Cut Number of Comps*150 Uncut Cut Sample RatioY BCM g/t g/t Comps g/t g/t BCM/comp
6505540 3,336 0.57 0.57 22 3,300 0.50 0.50 1526505560 6,906 0.68 0.68 9 1,350 0.53 0.53 7676505580 8,516 0.98 0.98 32 4,800 1.09 1.09 2666505600 12,820 1.26 1.26 86 12,900 1.07 1.07 1496505620 22,586 1.40 1.38 231 34,650 1.26 1.26 986505640 39,195 1.23 1.21 284 42,600 1.23 1.21 1386505660 32,250 1.28 1.26 201 30,150 1.21 1.19 1606505680 18,484 0.99 0.98 142 21,300 1.03 1.02 1306505700 16,086 0.87 0.87 157 23,550 0.78 0.78 1026505720 23,086 0.98 0.98 220 33,000 0.84 0.84 1056505740 15,773 1.11 1.11 101 15,150 1.04 1.04 1566505760 16,141 1.16 1.16 78 11,700 1.19 1.19 2076505780 14,531 1.13 1.13 105 15,750 1.07 1.07 1386505800 9,219 1.28 1.14 55 8,250 1.68 1.35 1686505820 7,219 0.98 0.94 22 3,300 0.65 0.65 3286505840 5,953 0.93 0.93 35 5,250 1.14 1.14 1706505860 9,055 0.97 0.97 24 3,600 0.67 0.67 3776505880 4,656 0.99 0.99 14 2,100 1.26 1.26 333
Total 265,812 1.12 1.11 1,818 272,700 1.08 1.07 146Note: Calculated validation grades differ from resource grades due to weighting by volume, not tonnes.
Block Model CompositesGreat Victoria Block Model Validation by Northing : Grand National
Comparison of OK and Composite Grades by Northing
0
10,000
20,000
30,000
40,000
50,000
6505
540
6505
560
6505
580
6505
600
6505
620
6505
640
6505
660
6505
680
6505
700
6505
720
6505
740
6505
760
6505
780
6505
800
6505
820
6505
840
6505
860
6505
880
Northing (Y)
Vo
lum
e &
Co
mp
s (*
150)
0.0
1.0
2.0
3.0
4.0
5.0
Gra
de
(g/t
)OK Volume Comps*150 OK Uncut OK Cut Uncut g/t Cut g/t
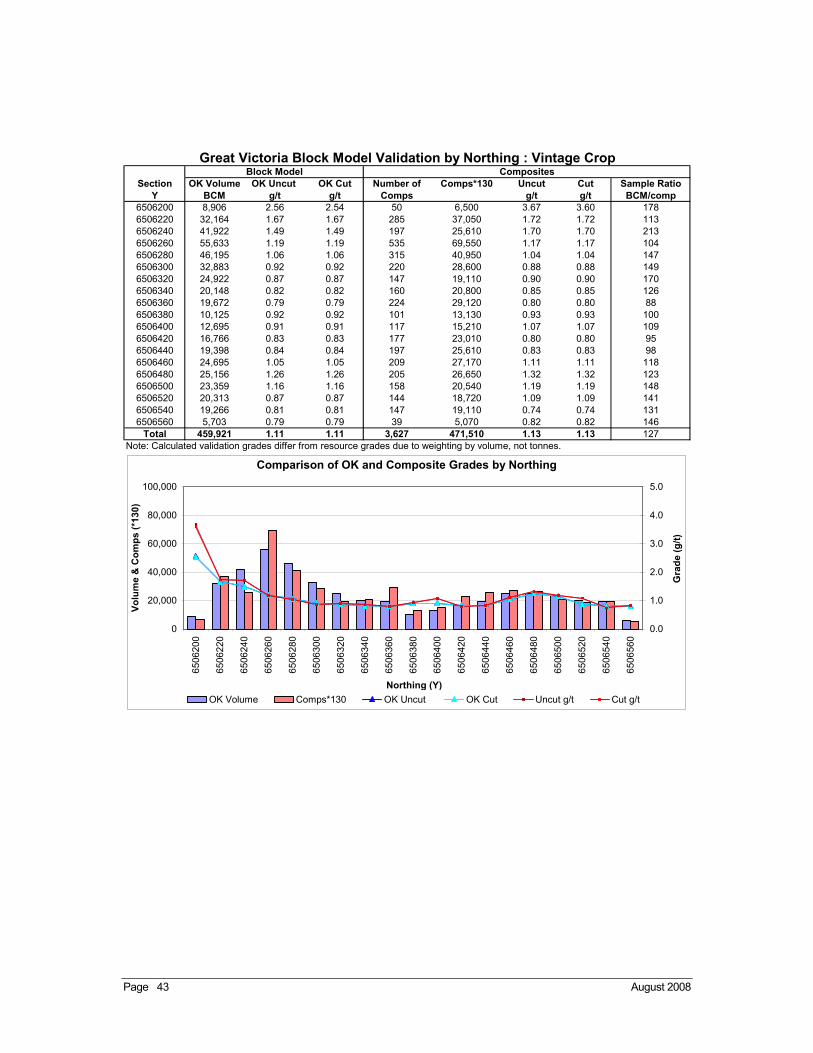
Page 43 August 2008
Section OK Volume OK Uncut OK Cut Number of Comps*130 Uncut Cut Sample RatioY BCM g/t g/t Comps g/t g/t BCM/comp
6506200 8,906 2.56 2.54 50 6,500 3.67 3.60 1786506220 32,164 1.67 1.67 285 37,050 1.72 1.72 1136506240 41,922 1.49 1.49 197 25,610 1.70 1.70 2136506260 55,633 1.19 1.19 535 69,550 1.17 1.17 1046506280 46,195 1.06 1.06 315 40,950 1.04 1.04 1476506300 32,883 0.92 0.92 220 28,600 0.88 0.88 1496506320 24,922 0.87 0.87 147 19,110 0.90 0.90 1706506340 20,148 0.82 0.82 160 20,800 0.85 0.85 1266506360 19,672 0.79 0.79 224 29,120 0.80 0.80 886506380 10,125 0.92 0.92 101 13,130 0.93 0.93 1006506400 12,695 0.91 0.91 117 15,210 1.07 1.07 1096506420 16,766 0.83 0.83 177 23,010 0.80 0.80 956506440 19,398 0.84 0.84 197 25,610 0.83 0.83 986506460 24,695 1.05 1.05 209 27,170 1.11 1.11 1186506480 25,156 1.26 1.26 205 26,650 1.32 1.32 1236506500 23,359 1.16 1.16 158 20,540 1.19 1.19 1486506520 20,313 0.87 0.87 144 18,720 1.09 1.09 1416506540 19,266 0.81 0.81 147 19,110 0.74 0.74 1316506560 5,703 0.79 0.79 39 5,070 0.82 0.82 146
Total 459,921 1.11 1.11 3,627 471,510 1.13 1.13 127Note: Calculated validation grades differ from resource grades due to weighting by volume, not tonnes.
Block Model CompositesGreat Victoria Block Model Validation by Northing : Vintage Crop
Comparison of OK and Composite Grades by Northing
0
20,000
40,000
60,000
80,000
100,000
6506
200
6506
220
6506
240
6506
260
6506
280
6506
300
6506
320
6506
340
6506
360
6506
380
6506
400
6506
420
6506
440
6506
460
6506
480
6506
500
6506
520
6506
540
6506
560
Northing (Y)
Vo
lum
e &
Co
mp
s (*
130)
0.0
1.0
2.0
3.0
4.0
5.0
Gra
de
(g/t
)
OK Volume Comps*130 OK Uncut OK Cut Uncut g/t Cut g/t
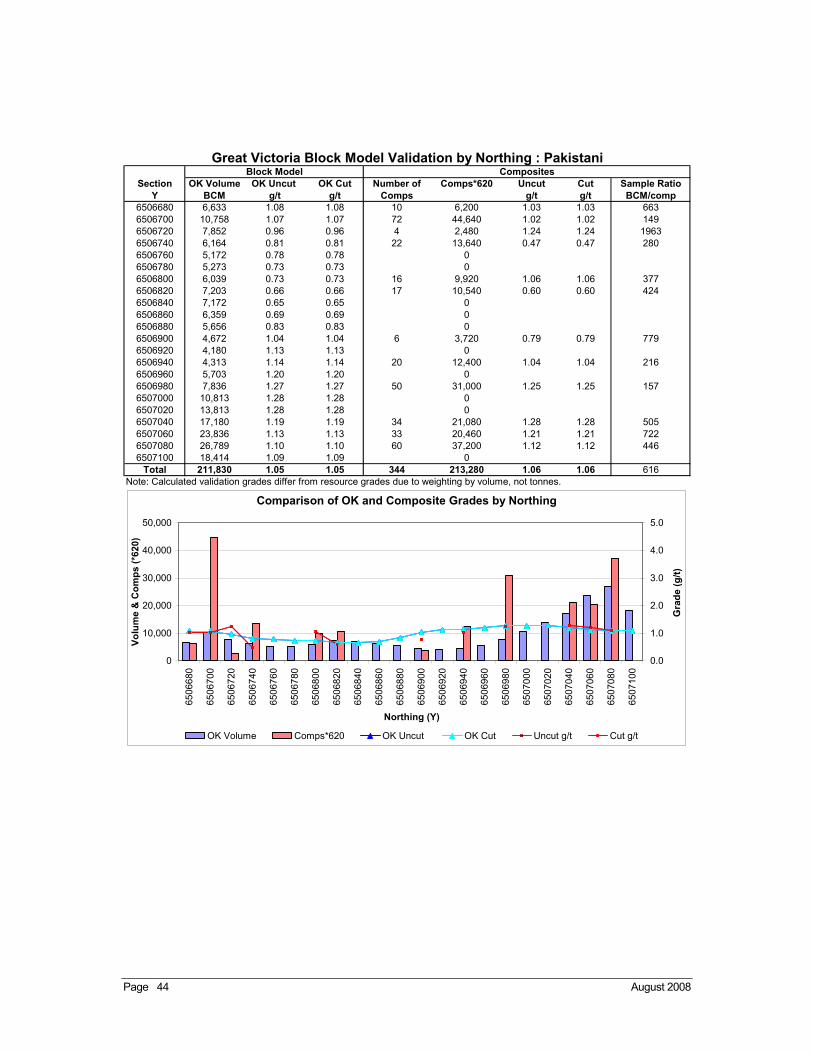
Page 44 August 2008
Section OK Volume OK Uncut OK Cut Number of Comps*620 Uncut Cut Sample RatioY BCM g/t g/t Comps g/t g/t BCM/comp
6506680 6,633 1.08 1.08 10 6,200 1.03 1.03 6636506700 10,758 1.07 1.07 72 44,640 1.02 1.02 1496506720 7,852 0.96 0.96 4 2,480 1.24 1.24 19636506740 6,164 0.81 0.81 22 13,640 0.47 0.47 2806506760 5,172 0.78 0.78 0 6506780 5,273 0.73 0.73 0 6506800 6,039 0.73 0.73 16 9,920 1.06 1.06 3776506820 7,203 0.66 0.66 17 10,540 0.60 0.60 4246506840 7,172 0.65 0.65 0 6506860 6,359 0.69 0.69 0 6506880 5,656 0.83 0.83 0 6506900 4,672 1.04 1.04 6 3,720 0.79 0.79 7796506920 4,180 1.13 1.13 0 6506940 4,313 1.14 1.14 20 12,400 1.04 1.04 2166506960 5,703 1.20 1.20 0 6506980 7,836 1.27 1.27 50 31,000 1.25 1.25 1576507000 10,813 1.28 1.28 0 6507020 13,813 1.28 1.28 0 6507040 17,180 1.19 1.19 34 21,080 1.28 1.28 5056507060 23,836 1.13 1.13 33 20,460 1.21 1.21 7226507080 26,789 1.10 1.10 60 37,200 1.12 1.12 4466507100 18,414 1.09 1.09 0
Total 211,830 1.05 1.05 344 213,280 1.06 1.06 616Note: Calculated validation grades differ from resource grades due to weighting by volume, not tonnes.
Block Model CompositesGreat Victoria Block Model Validation by Northing : Pakistani
Comparison of OK and Composite Grades by Northing
0
10,000
20,000
30,000
40,000
50,000
6506
680
6506
700
6506
720
6506
740
6506
760
6506
780
6506
800
6506
820
6506
840
6506
860
6506
880
6506
900
6506
920
6506
940
6506
960
6506
980
6507
000
6507
020
6507
040
6507
060
6507
080
6507
100
Northing (Y)
Vo
lum
e &
Co
mp
s (*
620)
0.0
1.0
2.0
3.0
4.0
5.0
Gra
de
(g
/t)
OK Volume Comps*620 OK Uncut OK Cut Uncut g/t Cut g/t
Page 45 August 2008
Section OK Volume OK Uncut OK Cut Number of Comps*190 Uncut Cut Sample RatioY BCM g/t g/t Comps g/t g/t BCM/comp
6505840 1,555 0.88 0.88 0 6505860 11,883 0.81 0.81 41 7,790 0.89 0.89 2906505880 16,719 0.60 0.60 68 12,920 0.57 0.57 2466505900 21,617 0.62 0.62 99 18,810 0.64 0.64 2186505920 23,602 0.64 0.64 114 21,660 0.57 0.57 2076505940 23,961 0.81 0.80 65 12,350 0.97 0.97 3696505960 23,484 1.11 1.06 197 37,430 1.03 0.98 1196505980 21,992 1.20 1.19 180 34,200 1.17 1.17 1226506000 29,727 0.96 0.95 112 21,280 1.29 1.29 2656506020 31,953 1.77 1.58 267 50,730 2.18 1.87 1206506040 27,008 1.85 1.68 242 45,980 2.01 1.85 1126506060 24,500 1.09 1.06 177 33,630 0.81 0.81 1386506080 18,938 1.21 1.11 82 15,580 1.19 1.13 2316506100 17,531 1.88 1.42 195 37,050 1.76 1.37 906506120 10,258 1.26 1.08 28 5,320 1.10 1.10 3666506140 7,898 1.13 1.13 45 8,550 0.92 0.92 1766506160 6,375 1.18 1.18 44 8,360 1.75 1.75 1456506180 8,375 1.24 1.24 20 3,800 1.23 1.23 4196506200 10,734 1.15 1.15 35 6,650 1.26 1.26 3076506220 11,531 0.86 0.86 36 6,840 0.73 0.73 3206506240 12,063 0.83 0.82 7 1,330 0.47 0.47 17236506260 12,758 0.88 0.87 0 6506280 13,039 1.11 1.07 48 9,120 0.95 0.95 2726506300 14,914 1.38 1.32 42 7,980 1.54 1.47 3556506320 1,875 1.37 1.31 0
Total 404,290 1.14 1.07 2,144 407,360 1.32 1.22 189Note: Calculated validation grades differ from resource grades due to weighting by volume, not tonnes.
Block Model CompositesGreat Victoria Block Model Validation by Northing : Bronco South
Comparison of OK and Composite Grades by Northing
0
10,000
20,000
30,000
40,000
50,000
6505
840
6505
860
6505
880
6505
900
6505
920
6505
940
6505
960
6505
980
6506
000
6506
020
6506
040
6506
060
6506
080
6506
100
6506
120
6506
140
6506
160
6506
180
6506
200
6506
220
6506
240
6506
260
6506
280
6506
300
6506
320
Northing (Y)
Vo
lum
e &
Co
mp
s (*
190)
0.0
1.0
2.0
3.0
4.0
5.0
Gra
de
(g/t
)
OK Volume Comps*190 OK Uncut OK Cut Uncut g/t Cut g/t
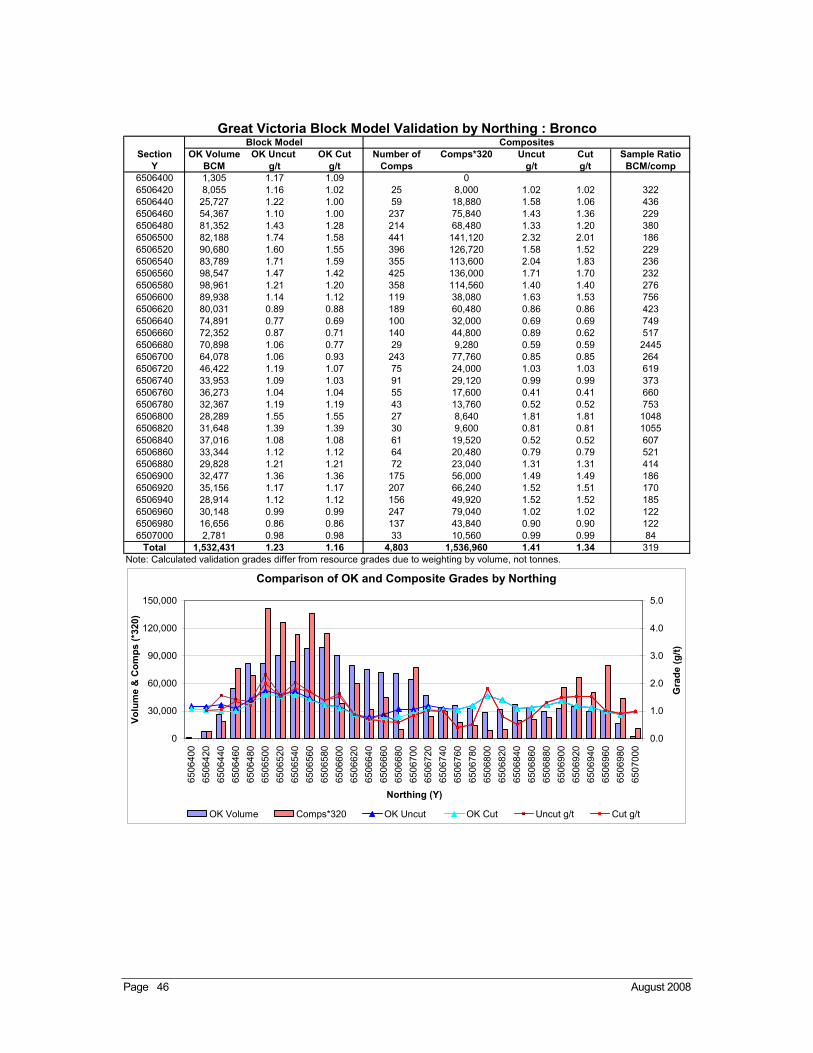
Page 46 August 2008
Section OK Volume OK Uncut OK Cut Number of Comps*320 Uncut Cut Sample RatioY BCM g/t g/t Comps g/t g/t BCM/comp
6506400 1,305 1.17 1.09 0 6506420 8,055 1.16 1.02 25 8,000 1.02 1.02 3226506440 25,727 1.22 1.00 59 18,880 1.58 1.06 4366506460 54,367 1.10 1.00 237 75,840 1.43 1.36 2296506480 81,352 1.43 1.28 214 68,480 1.33 1.20 3806506500 82,188 1.74 1.58 441 141,120 2.32 2.01 1866506520 90,680 1.60 1.55 396 126,720 1.58 1.52 2296506540 83,789 1.71 1.59 355 113,600 2.04 1.83 2366506560 98,547 1.47 1.42 425 136,000 1.71 1.70 2326506580 98,961 1.21 1.20 358 114,560 1.40 1.40 2766506600 89,938 1.14 1.12 119 38,080 1.63 1.53 7566506620 80,031 0.89 0.88 189 60,480 0.86 0.86 4236506640 74,891 0.77 0.69 100 32,000 0.69 0.69 7496506660 72,352 0.87 0.71 140 44,800 0.89 0.62 5176506680 70,898 1.06 0.77 29 9,280 0.59 0.59 24456506700 64,078 1.06 0.93 243 77,760 0.85 0.85 2646506720 46,422 1.19 1.07 75 24,000 1.03 1.03 6196506740 33,953 1.09 1.03 91 29,120 0.99 0.99 3736506760 36,273 1.04 1.04 55 17,600 0.41 0.41 6606506780 32,367 1.19 1.19 43 13,760 0.52 0.52 7536506800 28,289 1.55 1.55 27 8,640 1.81 1.81 10486506820 31,648 1.39 1.39 30 9,600 0.81 0.81 10556506840 37,016 1.08 1.08 61 19,520 0.52 0.52 6076506860 33,344 1.12 1.12 64 20,480 0.79 0.79 5216506880 29,828 1.21 1.21 72 23,040 1.31 1.31 4146506900 32,477 1.36 1.36 175 56,000 1.49 1.49 1866506920 35,156 1.17 1.17 207 66,240 1.52 1.51 1706506940 28,914 1.12 1.12 156 49,920 1.52 1.52 1856506960 30,148 0.99 0.99 247 79,040 1.02 1.02 1226506980 16,656 0.86 0.86 137 43,840 0.90 0.90 1226507000 2,781 0.98 0.98 33 10,560 0.99 0.99 84
Total 1,532,431 1.23 1.16 4,803 1,536,960 1.41 1.34 319Note: Calculated validation grades differ from resource grades due to weighting by volume, not tonnes.
Block Model CompositesGreat Victoria Block Model Validation by Northing : Bronco
Comparison of OK and Composite Grades by Northing
0
30,000
60,000
90,000
120,000
150,000
6506
400
6506
420
6506
440
6506
460
6506
480
6506
500
6506
520
6506
540
6506
560
6506
580
6506
600
6506
620
6506
640
6506
660
6506
680
6506
700
6506
720
6506
740
6506
760
6506
780
6506
800
6506
820
6506
840
6506
860
6506
880
6506
900
6506
920
6506
940
6506
960
6506
980
6507
000
Northing (Y)
Vo
lum
e &
Co
mp
s (*
320)
0.0
1.0
2.0
3.0
4.0
5.0
Gra
de
(g/t
)
OK Volume Comps*320 OK Uncut OK Cut Uncut g/t Cut g/t
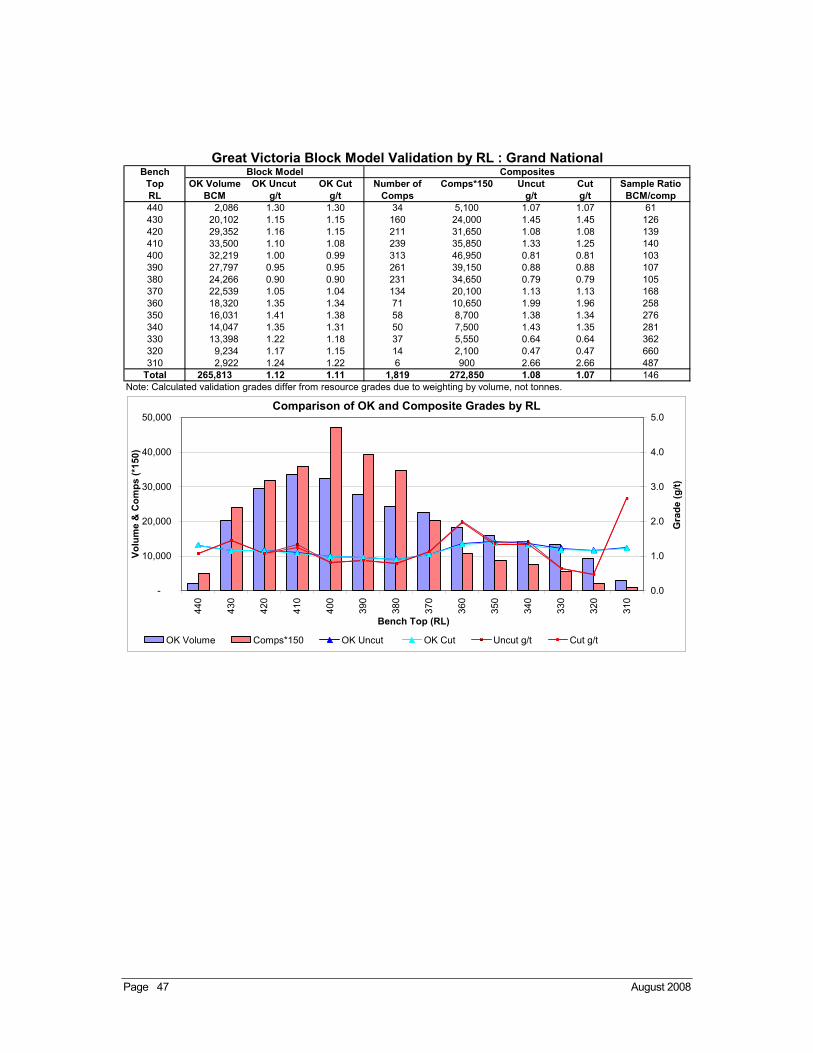
Page 47 August 2008
BenchTop OK Volume OK Uncut OK Cut Number of Comps*150 Uncut Cut Sample RatioRL BCM g/t g/t Comps g/t g/t BCM/comp440 2,086 1.30 1.30 34 5,100 1.07 1.07 61430 20,102 1.15 1.15 160 24,000 1.45 1.45 126420 29,352 1.16 1.15 211 31,650 1.08 1.08 139410 33,500 1.10 1.08 239 35,850 1.33 1.25 140400 32,219 1.00 0.99 313 46,950 0.81 0.81 103390 27,797 0.95 0.95 261 39,150 0.88 0.88 107380 24,266 0.90 0.90 231 34,650 0.79 0.79 105370 22,539 1.05 1.04 134 20,100 1.13 1.13 168360 18,320 1.35 1.34 71 10,650 1.99 1.96 258350 16,031 1.41 1.38 58 8,700 1.38 1.34 276340 14,047 1.35 1.31 50 7,500 1.43 1.35 281330 13,398 1.22 1.18 37 5,550 0.64 0.64 362320 9,234 1.17 1.15 14 2,100 0.47 0.47 660310 2,922 1.24 1.22 6 900 2.66 2.66 487
Total 265,813 1.12 1.11 1,819 272,850 1.08 1.07 146Note: Calculated validation grades differ from resource grades due to weighting by volume, not tonnes.
Block Model CompositesGreat Victoria Block Model Validation by RL : Grand National
Comparison of OK and Composite Grades by RL
-
10,000
20,000
30,000
40,000
50,000
440
430
420
410
400
390
380
370
360
350
340
330
320
310
Bench Top (RL)
Vo
lum
e &
Co
mp
s (*
150)
0.0
1.0
2.0
3.0
4.0
5.0
Gra
de
(g/t
)
OK Volume Comps*150 OK Uncut OK Cut Uncut g/t Cut g/t
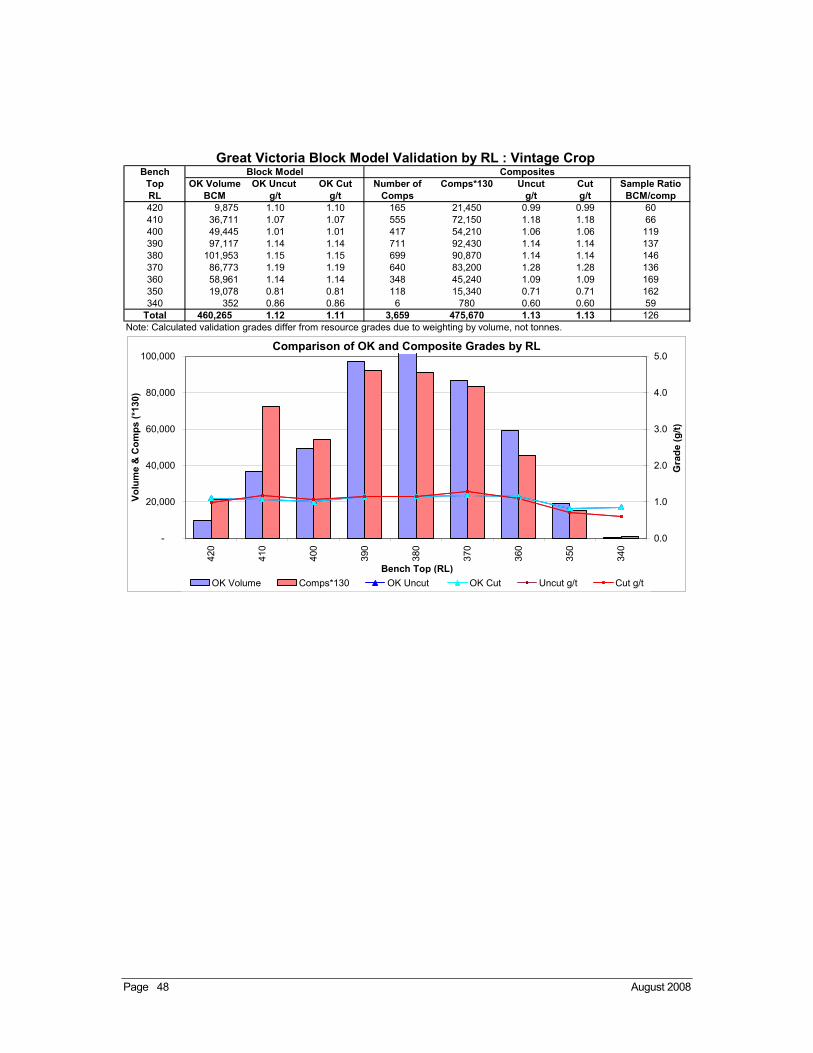
Page 48 August 2008
BenchTop OK Volume OK Uncut OK Cut Number of Comps*130 Uncut Cut Sample RatioRL BCM g/t g/t Comps g/t g/t BCM/comp420 9,875 1.10 1.10 165 21,450 0.99 0.99 60410 36,711 1.07 1.07 555 72,150 1.18 1.18 66400 49,445 1.01 1.01 417 54,210 1.06 1.06 119390 97,117 1.14 1.14 711 92,430 1.14 1.14 137380 101,953 1.15 1.15 699 90,870 1.14 1.14 146370 86,773 1.19 1.19 640 83,200 1.28 1.28 136360 58,961 1.14 1.14 348 45,240 1.09 1.09 169350 19,078 0.81 0.81 118 15,340 0.71 0.71 162340 352 0.86 0.86 6 780 0.60 0.60 59
Total 460,265 1.12 1.11 3,659 475,670 1.13 1.13 126Note: Calculated validation grades differ from resource grades due to weighting by volume, not tonnes.
Block Model CompositesGreat Victoria Block Model Validation by RL : Vintage Crop
Comparison of OK and Composite Grades by RL
-
20,000
40,000
60,000
80,000
100,000
420
410
400
390
380
370
360
350
340
Bench Top (RL)
Vo
lum
e &
Co
mp
s (*
130)
0.0
1.0
2.0
3.0
4.0
5.0
Gra
de
(g/t
)
OK Volume Comps*130 OK Uncut OK Cut Uncut g/t Cut g/t
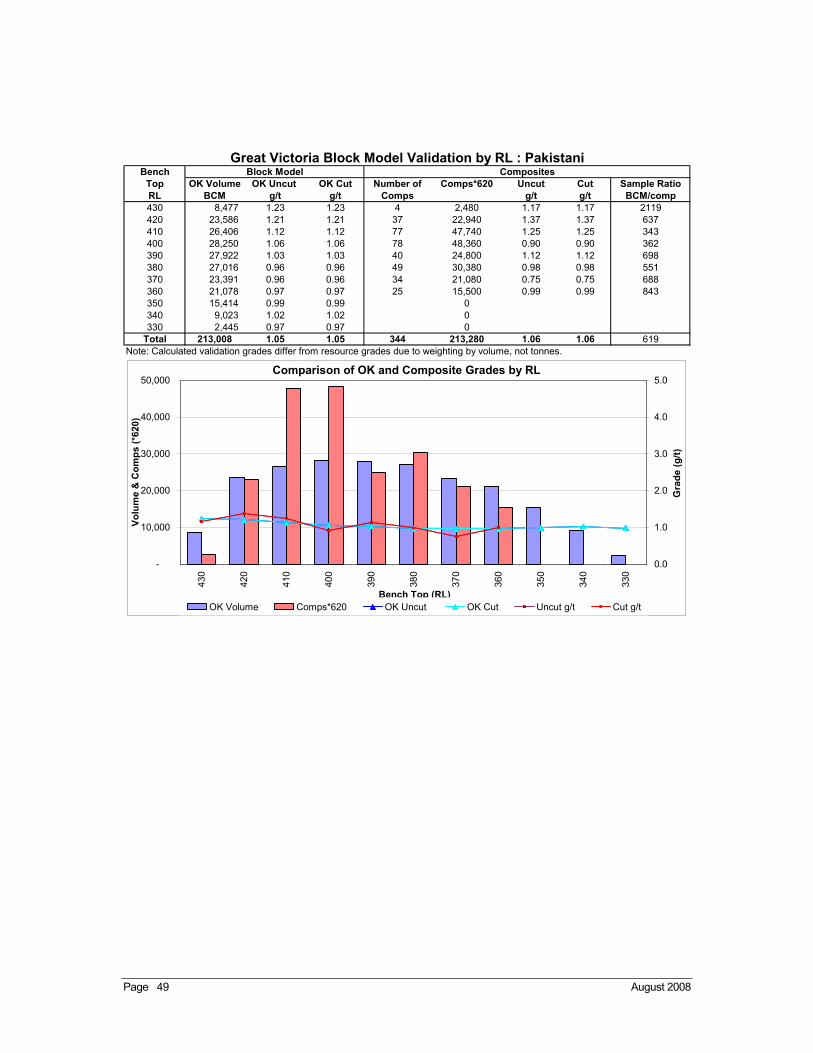
Page 49 August 2008
BenchTop OK Volume OK Uncut OK Cut Number of Comps*620 Uncut Cut Sample RatioRL BCM g/t g/t Comps g/t g/t BCM/comp430 8,477 1.23 1.23 4 2,480 1.17 1.17 2119420 23,586 1.21 1.21 37 22,940 1.37 1.37 637410 26,406 1.12 1.12 77 47,740 1.25 1.25 343400 28,250 1.06 1.06 78 48,360 0.90 0.90 362390 27,922 1.03 1.03 40 24,800 1.12 1.12 698380 27,016 0.96 0.96 49 30,380 0.98 0.98 551370 23,391 0.96 0.96 34 21,080 0.75 0.75 688360 21,078 0.97 0.97 25 15,500 0.99 0.99 843350 15,414 0.99 0.99 0 340 9,023 1.02 1.02 0 330 2,445 0.97 0.97 0
Total 213,008 1.05 1.05 344 213,280 1.06 1.06 619Note: Calculated validation grades differ from resource grades due to weighting by volume, not tonnes.
Block Model CompositesGreat Victoria Block Model Validation by RL : Pakistani
Comparison of OK and Composite Grades by RL
-
10,000
20,000
30,000
40,000
50,000
430
420
410
400
390
380
370
360
350
340
330
Bench Top (RL)
Vo
lum
e &
Co
mp
s (*
620)
0.0
1.0
2.0
3.0
4.0
5.0
Gra
de
(g/t
)
OK Volume Comps*620 OK Uncut OK Cut Uncut g/t Cut g/t
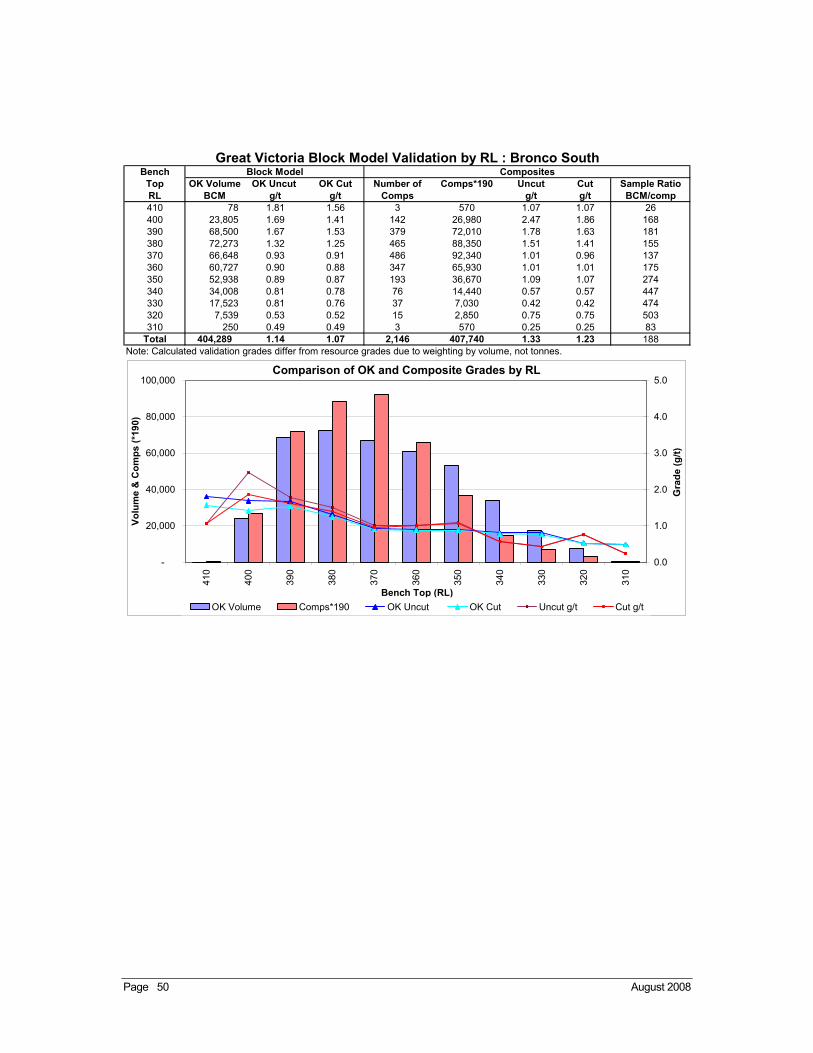
Page 50 August 2008
BenchTop OK Volume OK Uncut OK Cut Number of Comps*190 Uncut Cut Sample RatioRL BCM g/t g/t Comps g/t g/t BCM/comp410 78 1.81 1.56 3 570 1.07 1.07 26400 23,805 1.69 1.41 142 26,980 2.47 1.86 168390 68,500 1.67 1.53 379 72,010 1.78 1.63 181380 72,273 1.32 1.25 465 88,350 1.51 1.41 155370 66,648 0.93 0.91 486 92,340 1.01 0.96 137360 60,727 0.90 0.88 347 65,930 1.01 1.01 175350 52,938 0.89 0.87 193 36,670 1.09 1.07 274340 34,008 0.81 0.78 76 14,440 0.57 0.57 447330 17,523 0.81 0.76 37 7,030 0.42 0.42 474320 7,539 0.53 0.52 15 2,850 0.75 0.75 503310 250 0.49 0.49 3 570 0.25 0.25 83
Total 404,289 1.14 1.07 2,146 407,740 1.33 1.23 188Note: Calculated validation grades differ from resource grades due to weighting by volume, not tonnes.
Block Model CompositesGreat Victoria Block Model Validation by RL : Bronco South
Comparison of OK and Composite Grades by RL
-
20,000
40,000
60,000
80,000
100,000
410
400
390
380
370
360
350
340
330
320
310
Bench Top (RL)
Vo
lum
e &
Co
mp
s (*
190)
0.0
1.0
2.0
3.0
4.0
5.0
Gra
de
(g/t
)
OK Volume Comps*190 OK Uncut OK Cut Uncut g/t Cut g/t
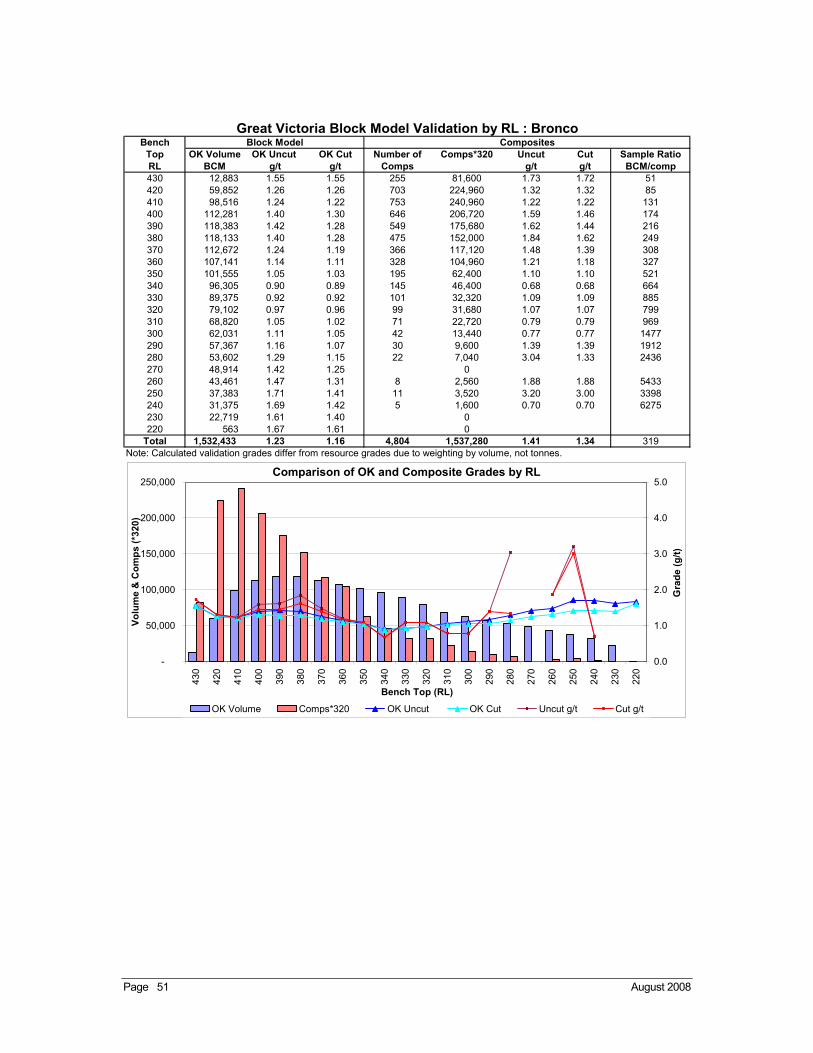
Page 51 August 2008
BenchTop OK Volume OK Uncut OK Cut Number of Comps*320 Uncut Cut Sample RatioRL BCM g/t g/t Comps g/t g/t BCM/comp430 12,883 1.55 1.55 255 81,600 1.73 1.72 51420 59,852 1.26 1.26 703 224,960 1.32 1.32 85410 98,516 1.24 1.22 753 240,960 1.22 1.22 131400 112,281 1.40 1.30 646 206,720 1.59 1.46 174390 118,383 1.42 1.28 549 175,680 1.62 1.44 216380 118,133 1.40 1.28 475 152,000 1.84 1.62 249370 112,672 1.24 1.19 366 117,120 1.48 1.39 308360 107,141 1.14 1.11 328 104,960 1.21 1.18 327350 101,555 1.05 1.03 195 62,400 1.10 1.10 521340 96,305 0.90 0.89 145 46,400 0.68 0.68 664330 89,375 0.92 0.92 101 32,320 1.09 1.09 885320 79,102 0.97 0.96 99 31,680 1.07 1.07 799310 68,820 1.05 1.02 71 22,720 0.79 0.79 969300 62,031 1.11 1.05 42 13,440 0.77 0.77 1477290 57,367 1.16 1.07 30 9,600 1.39 1.39 1912280 53,602 1.29 1.15 22 7,040 3.04 1.33 2436270 48,914 1.42 1.25 0 260 43,461 1.47 1.31 8 2,560 1.88 1.88 5433250 37,383 1.71 1.41 11 3,520 3.20 3.00 3398240 31,375 1.69 1.42 5 1,600 0.70 0.70 6275230 22,719 1.61 1.40 0 220 563 1.67 1.61 0
Total 1,532,433 1.23 1.16 4,804 1,537,280 1.41 1.34 319Note: Calculated validation grades differ from resource grades due to weighting by volume, not tonnes.
Block Model CompositesGreat Victoria Block Model Validation by RL : Bronco
Comparison of OK and Composite Grades by RL
-
50,000
100,000
150,000
200,000
250,000
430
420
410
400
390
380
370
360
350
340
330
320
310
300
290
280
270
260
250
240
230
220
Bench Top (RL)
Vo
lum
e &
Co
mp
s (*
320)
0.0
1.0
2.0
3.0
4.0
5.0
Gra
de
(g/t
)
OK Volume Comps*320 OK Uncut OK Cut Uncut g/t Cut g/t
Page 52 August 2008
Appendix 3
Great Victoria Gold Project
Statistics and Log Probability Plots
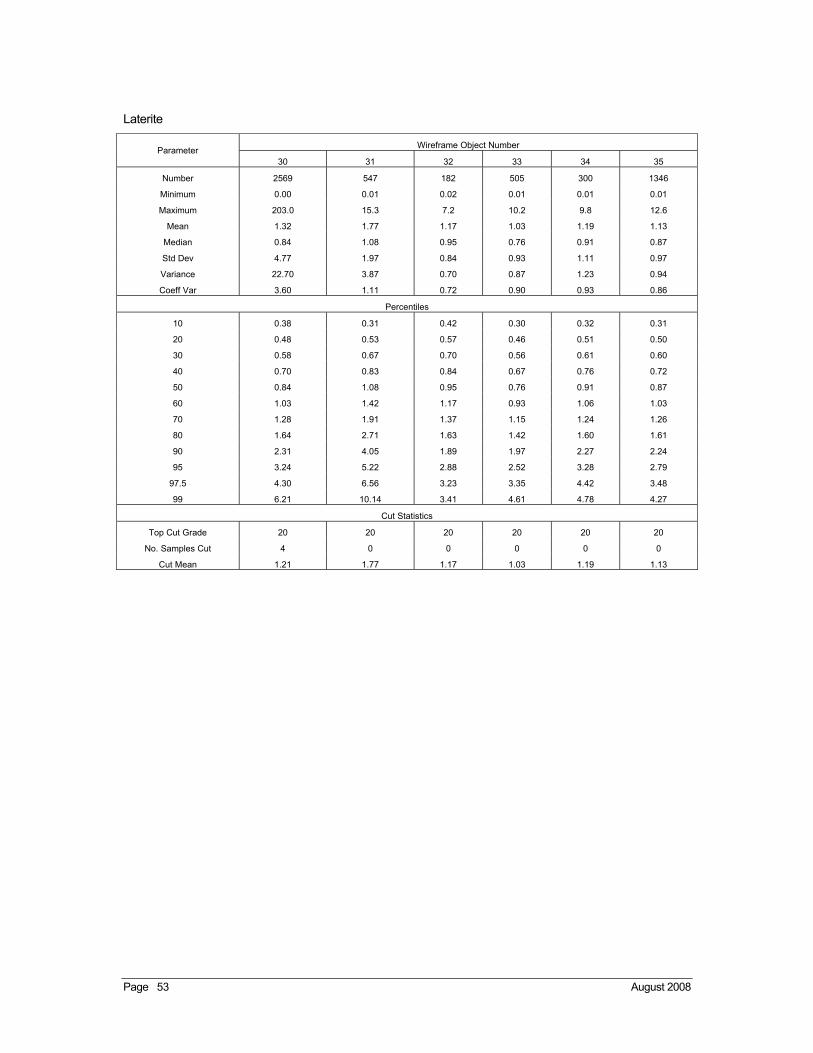
Page 53 August 2008
Laterite
Parameter Wireframe Object Number
30 31 32 33 34 35
Number 2569 547 182 505 300 1346
Minimum 0.00 0.01 0.02 0.01 0.01 0.01
Maximum 203.0 15.3 7.2 10.2 9.8 12.6
Mean 1.32 1.77 1.17 1.03 1.19 1.13
Median 0.84 1.08 0.95 0.76 0.91 0.87
Std Dev 4.77 1.97 0.84 0.93 1.11 0.97
Variance 22.70 3.87 0.70 0.87 1.23 0.94
Coeff Var 3.60 1.11 0.72 0.90 0.93 0.86
Percentiles
10 0.38 0.31 0.42 0.30 0.32 0.31
20 0.48 0.53 0.57 0.46 0.51 0.50
30 0.58 0.67 0.70 0.56 0.61 0.60
40 0.70 0.83 0.84 0.67 0.76 0.72
50 0.84 1.08 0.95 0.76 0.91 0.87
60 1.03 1.42 1.17 0.93 1.06 1.03
70 1.28 1.91 1.37 1.15 1.24 1.26
80 1.64 2.71 1.63 1.42 1.60 1.61
90 2.31 4.05 1.89 1.97 2.27 2.24
95 3.24 5.22 2.88 2.52 3.28 2.79
97.5 4.30 6.56 3.23 3.35 4.42 3.48
99 6.21 10.14 3.41 4.61 4.78 4.27
Cut Statistics
Top Cut Grade 20 20 20 20 20 20
No. Samples Cut 4 0 0 0 0 0
Cut Mean 1.21 1.77 1.17 1.03 1.19 1.13
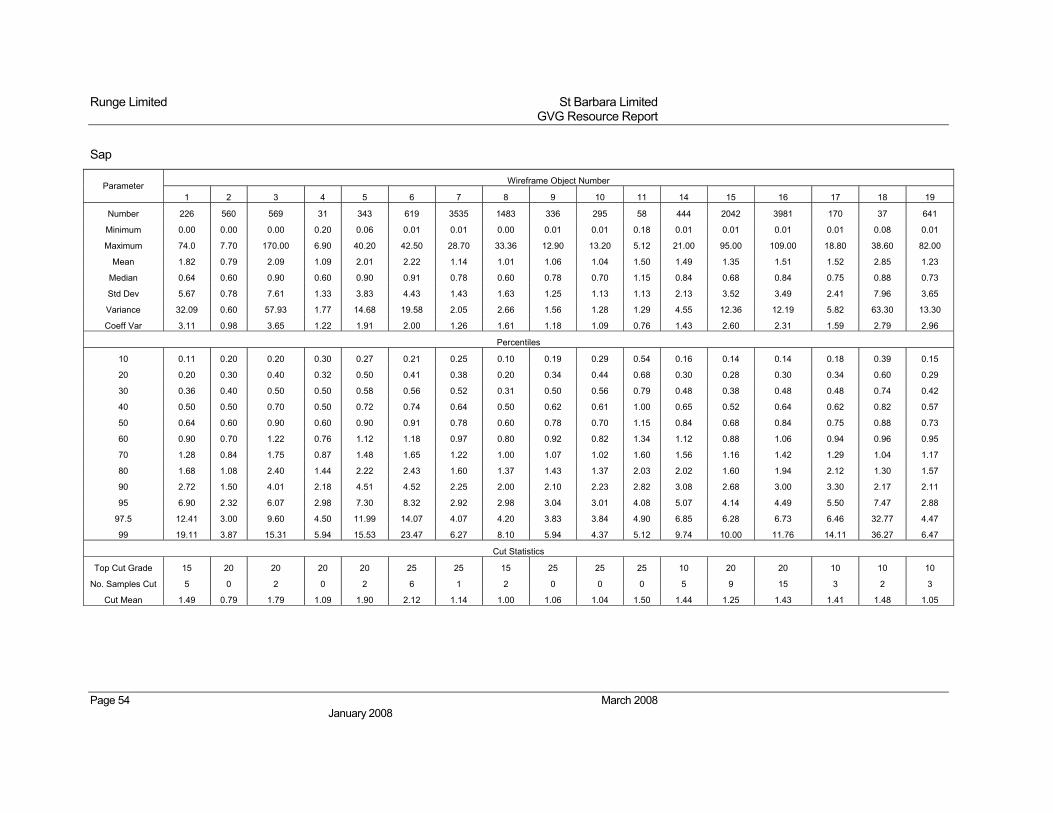
Runge Limited St Barbara Limited GVG Resource Report
Page 54 March 2008 January 2008
Sap
Parameter Wireframe Object Number
1 2 3 4 5 6 7 8 9 10 11 14 15 16 17 18 19
Number 226 560 569 31 343 619 3535 1483 336 295 58 444 2042 3981 170 37 641
Minimum 0.00 0.00 0.00 0.20 0.06 0.01 0.01 0.00 0.01 0.01 0.18 0.01 0.01 0.01 0.01 0.08 0.01
Maximum 74.0 7.70 170.00 6.90 40.20 42.50 28.70 33.36 12.90 13.20 5.12 21.00 95.00 109.00 18.80 38.60 82.00
Mean 1.82 0.79 2.09 1.09 2.01 2.22 1.14 1.01 1.06 1.04 1.50 1.49 1.35 1.51 1.52 2.85 1.23
Median 0.64 0.60 0.90 0.60 0.90 0.91 0.78 0.60 0.78 0.70 1.15 0.84 0.68 0.84 0.75 0.88 0.73
Std Dev 5.67 0.78 7.61 1.33 3.83 4.43 1.43 1.63 1.25 1.13 1.13 2.13 3.52 3.49 2.41 7.96 3.65
Variance 32.09 0.60 57.93 1.77 14.68 19.58 2.05 2.66 1.56 1.28 1.29 4.55 12.36 12.19 5.82 63.30 13.30
Coeff Var 3.11 0.98 3.65 1.22 1.91 2.00 1.26 1.61 1.18 1.09 0.76 1.43 2.60 2.31 1.59 2.79 2.96
Percentiles
10 0.11 0.20 0.20 0.30 0.27 0.21 0.25 0.10 0.19 0.29 0.54 0.16 0.14 0.14 0.18 0.39 0.15
20 0.20 0.30 0.40 0.32 0.50 0.41 0.38 0.20 0.34 0.44 0.68 0.30 0.28 0.30 0.34 0.60 0.29
30 0.36 0.40 0.50 0.50 0.58 0.56 0.52 0.31 0.50 0.56 0.79 0.48 0.38 0.48 0.48 0.74 0.42
40 0.50 0.50 0.70 0.50 0.72 0.74 0.64 0.50 0.62 0.61 1.00 0.65 0.52 0.64 0.62 0.82 0.57
50 0.64 0.60 0.90 0.60 0.90 0.91 0.78 0.60 0.78 0.70 1.15 0.84 0.68 0.84 0.75 0.88 0.73
60 0.90 0.70 1.22 0.76 1.12 1.18 0.97 0.80 0.92 0.82 1.34 1.12 0.88 1.06 0.94 0.96 0.95
70 1.28 0.84 1.75 0.87 1.48 1.65 1.22 1.00 1.07 1.02 1.60 1.56 1.16 1.42 1.29 1.04 1.17
80 1.68 1.08 2.40 1.44 2.22 2.43 1.60 1.37 1.43 1.37 2.03 2.02 1.60 1.94 2.12 1.30 1.57
90 2.72 1.50 4.01 2.18 4.51 4.52 2.25 2.00 2.10 2.23 2.82 3.08 2.68 3.00 3.30 2.17 2.11
95 6.90 2.32 6.07 2.98 7.30 8.32 2.92 2.98 3.04 3.01 4.08 5.07 4.14 4.49 5.50 7.47 2.88
97.5 12.41 3.00 9.60 4.50 11.99 14.07 4.07 4.20 3.83 3.84 4.90 6.85 6.28 6.73 6.46 32.77 4.47
99 19.11 3.87 15.31 5.94 15.53 23.47 6.27 8.10 5.94 4.37 5.12 9.74 10.00 11.76 14.11 36.27 6.47
Cut Statistics
Top Cut Grade 15 20 20 20 20 25 25 15 25 25 25 10 20 20 10 10 10
No. Samples Cut 5 0 2 0 2 6 1 2 0 0 0 5 9 15 3 2 3
Cut Mean 1.49 0.79 1.79 1.09 1.90 2.12 1.14 1.00 1.06 1.04 1.50 1.44 1.25 1.43 1.41 1.48 1.05
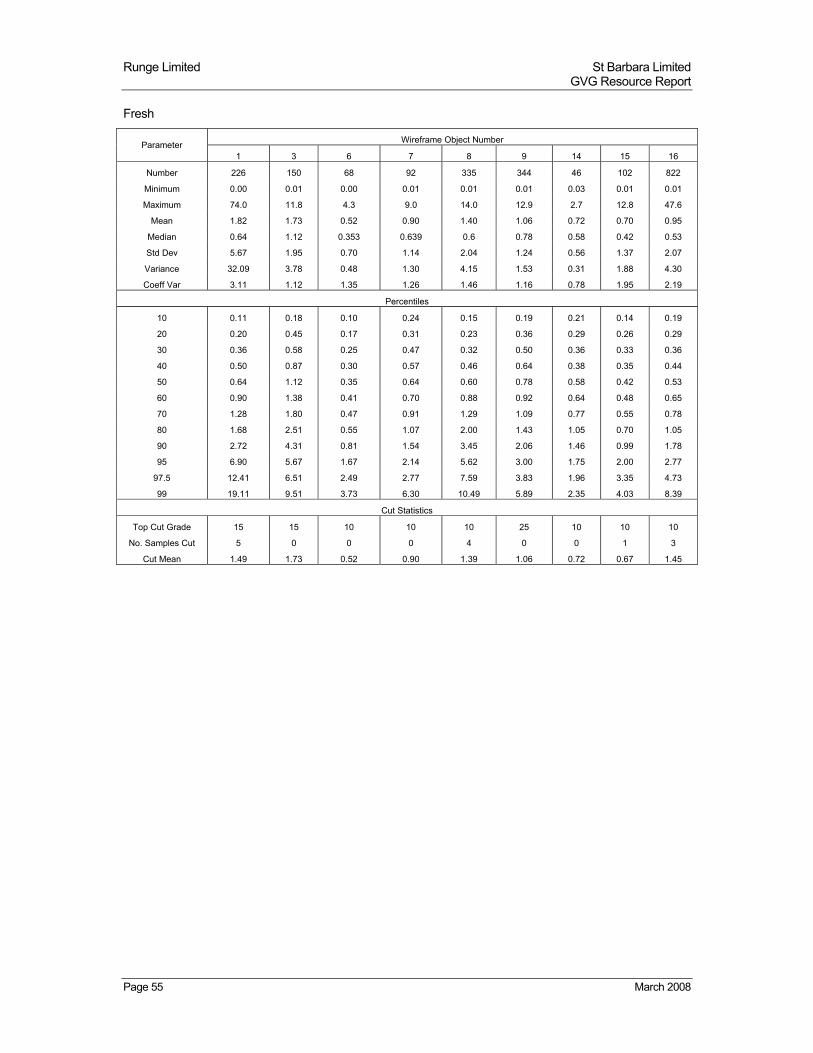
Runge Limited St Barbara Limited GVG Resource Report
Page 55 March 2008
Fresh
Parameter Wireframe Object Number
1 3 6 7 8 9 14 15 16
Number 226 150 68 92 335 344 46 102 822
Minimum 0.00 0.01 0.00 0.01 0.01 0.01 0.03 0.01 0.01
Maximum 74.0 11.8 4.3 9.0 14.0 12.9 2.7 12.8 47.6
Mean 1.82 1.73 0.52 0.90 1.40 1.06 0.72 0.70 0.95
Median 0.64 1.12 0.353 0.639 0.6 0.78 0.58 0.42 0.53
Std Dev 5.67 1.95 0.70 1.14 2.04 1.24 0.56 1.37 2.07
Variance 32.09 3.78 0.48 1.30 4.15 1.53 0.31 1.88 4.30
Coeff Var 3.11 1.12 1.35 1.26 1.46 1.16 0.78 1.95 2.19
Percentiles
10 0.11 0.18 0.10 0.24 0.15 0.19 0.21 0.14 0.19
20 0.20 0.45 0.17 0.31 0.23 0.36 0.29 0.26 0.29
30 0.36 0.58 0.25 0.47 0.32 0.50 0.36 0.33 0.36
40 0.50 0.87 0.30 0.57 0.46 0.64 0.38 0.35 0.44
50 0.64 1.12 0.35 0.64 0.60 0.78 0.58 0.42 0.53
60 0.90 1.38 0.41 0.70 0.88 0.92 0.64 0.48 0.65
70 1.28 1.80 0.47 0.91 1.29 1.09 0.77 0.55 0.78
80 1.68 2.51 0.55 1.07 2.00 1.43 1.05 0.70 1.05
90 2.72 4.31 0.81 1.54 3.45 2.06 1.46 0.99 1.78
95 6.90 5.67 1.67 2.14 5.62 3.00 1.75 2.00 2.77
97.5 12.41 6.51 2.49 2.77 7.59 3.83 1.96 3.35 4.73
99 19.11 9.51 3.73 6.30 10.49 5.89 2.35 4.03 8.39
Cut Statistics
Top Cut Grade 15 15 10 10 10 25 10 10 10
No. Samples Cut 5 0 0 0 4 0 0 1 3
Cut Mean 1.49 1.73 0.52 0.90 1.39 1.06 0.72 0.67 1.45
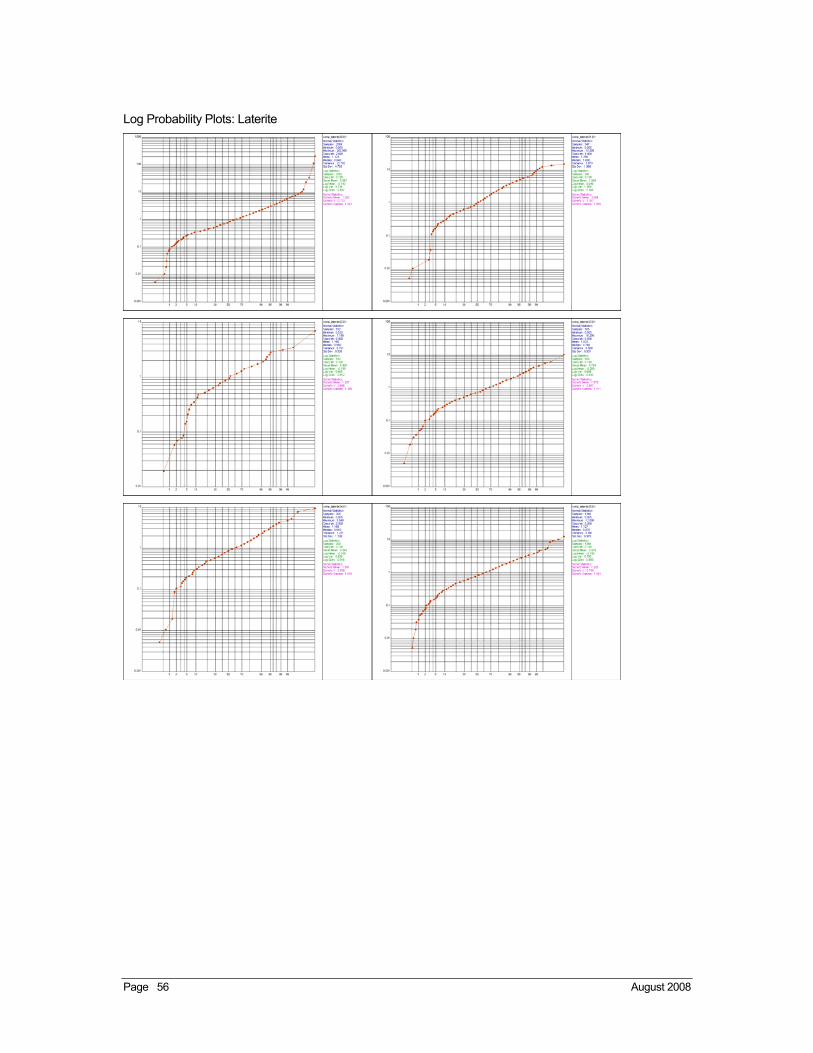
Page 56 August 2008
Log Probability Plots: Laterite
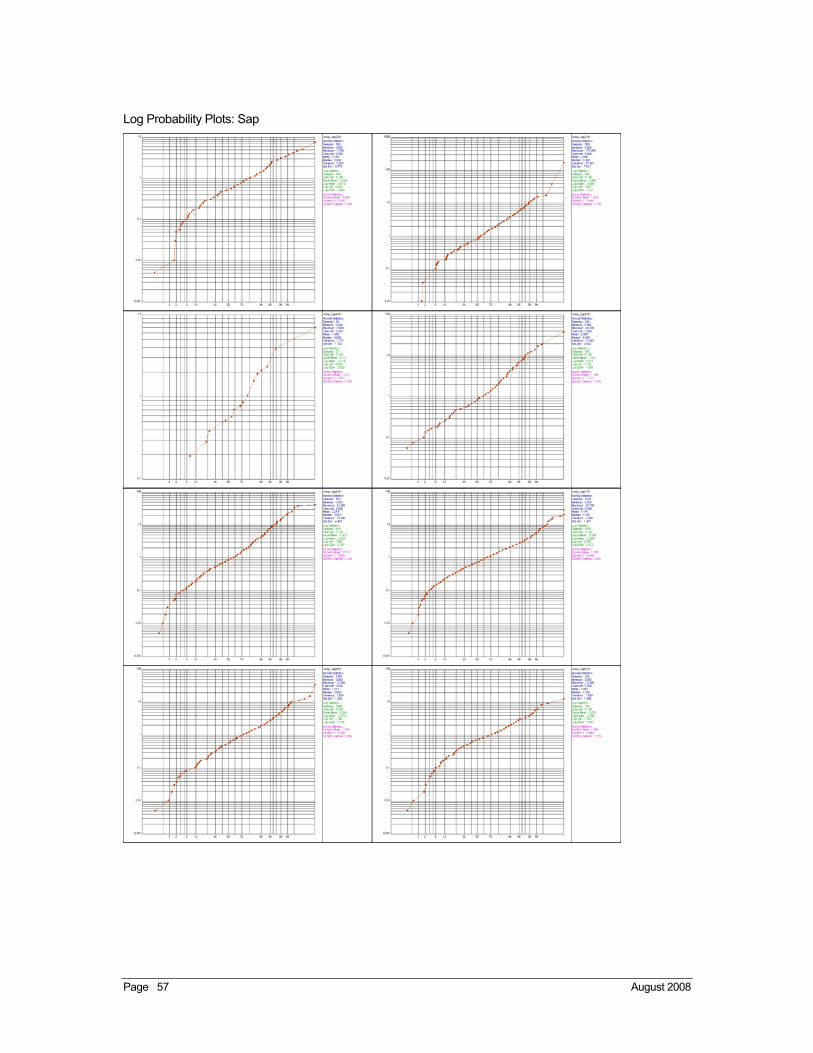
Page 57 August 2008
Log Probability Plots: Sap
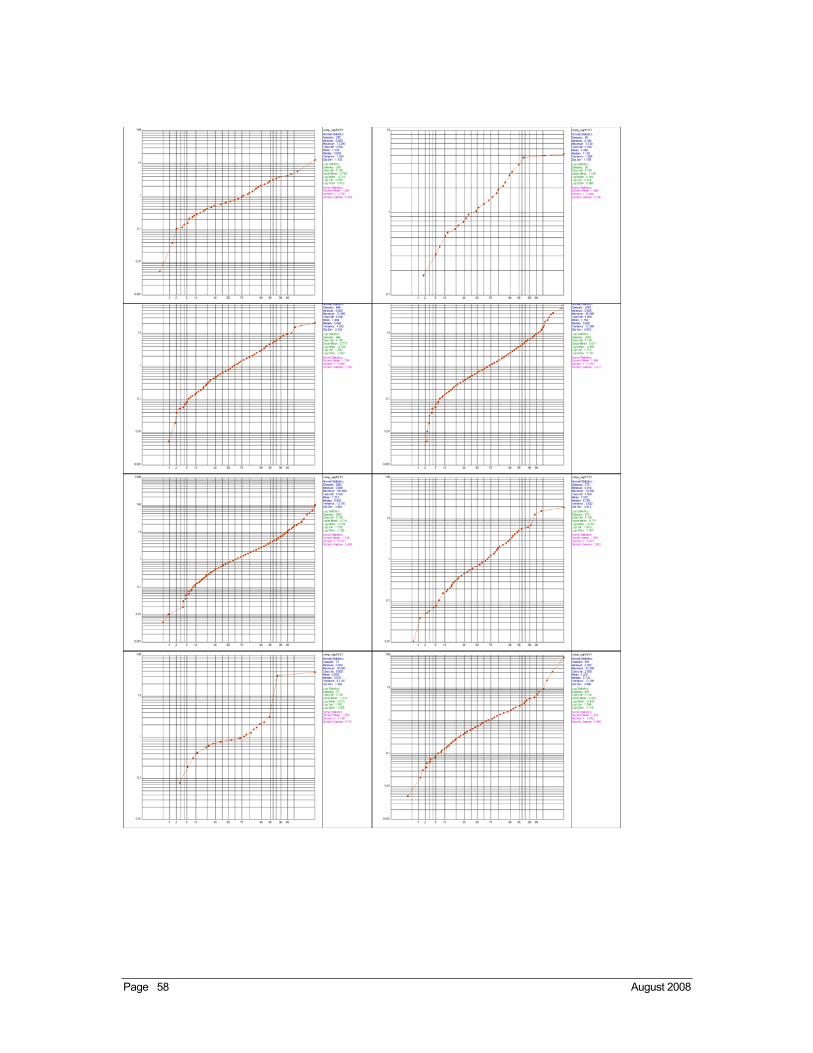
Page 58 August 2008

Page 59 August 2008
Log Probability Plots: Fresh
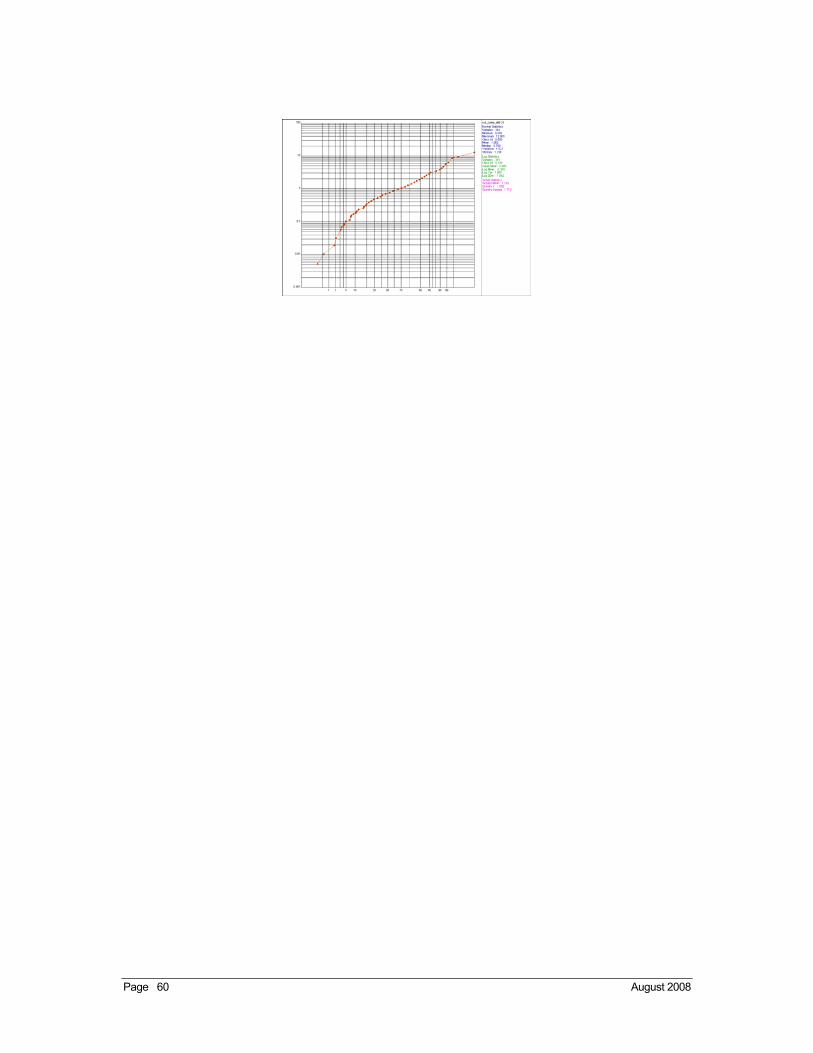
Page 60 August 2008
Page 61 August 2008
Appendix 4
Great Victoria Gold Project
June 2008 Variography
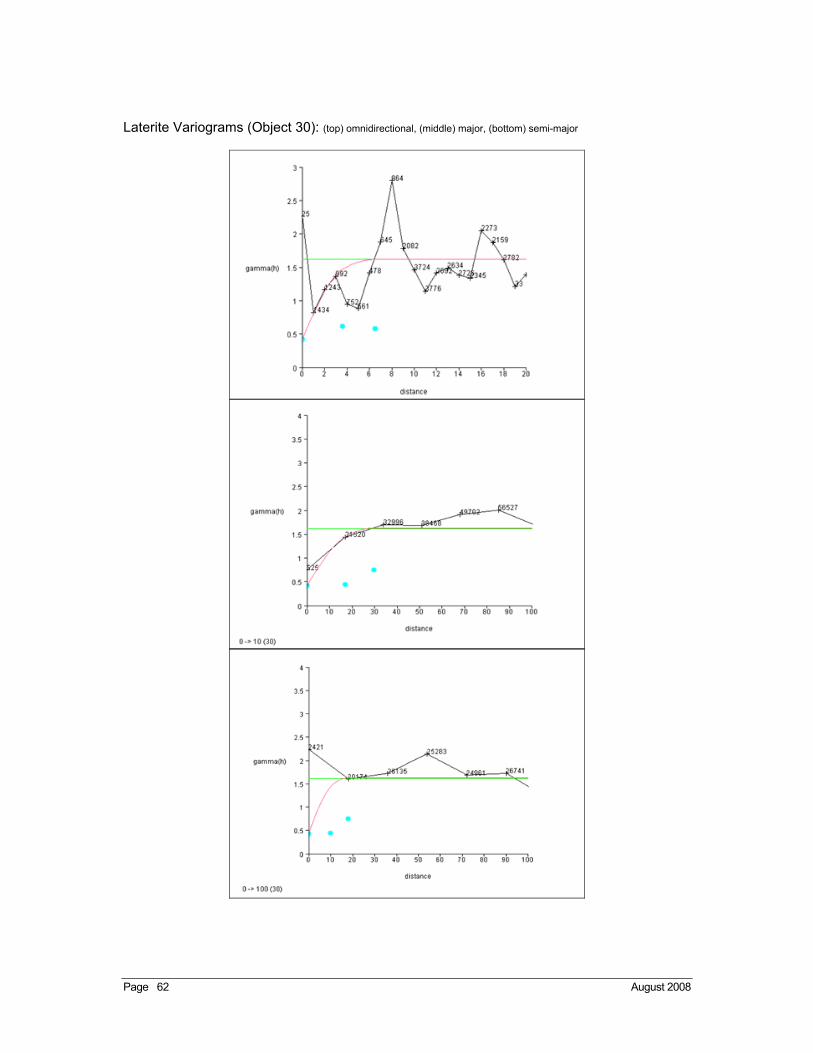
Page 62 August 2008
Laterite Variograms (Object 30): (top) omnidirectional, (middle) major, (bottom) semi-major
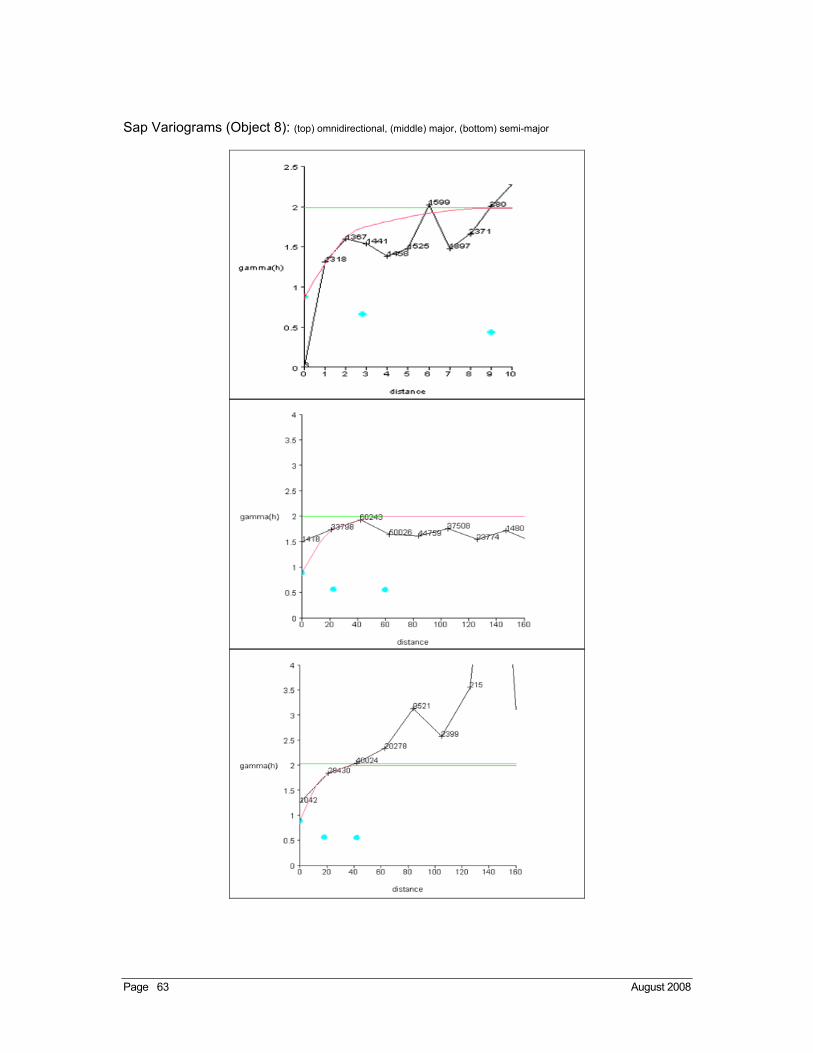
Page 63 August 2008
Sap Variograms (Object 8): (top) omnidirectional, (middle) major, (bottom) semi-major
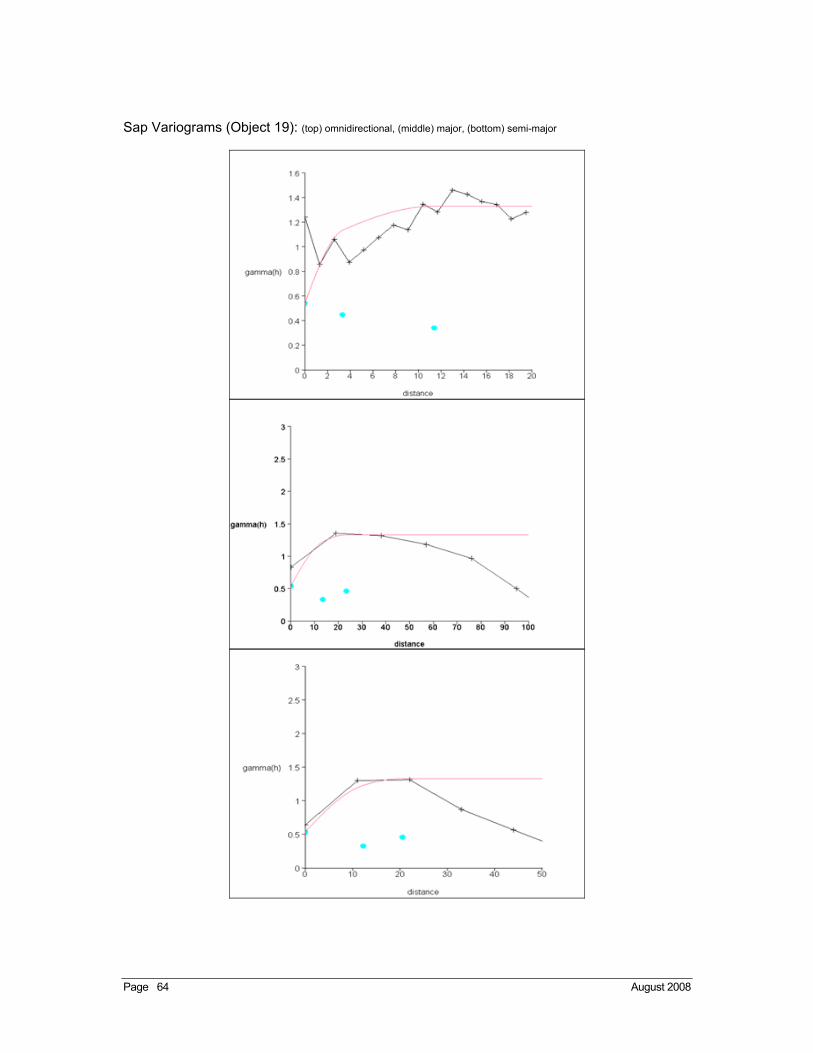
Page 64 August 2008
Sap Variograms (Object 19): (top) omnidirectional, (middle) major, (bottom) semi-major
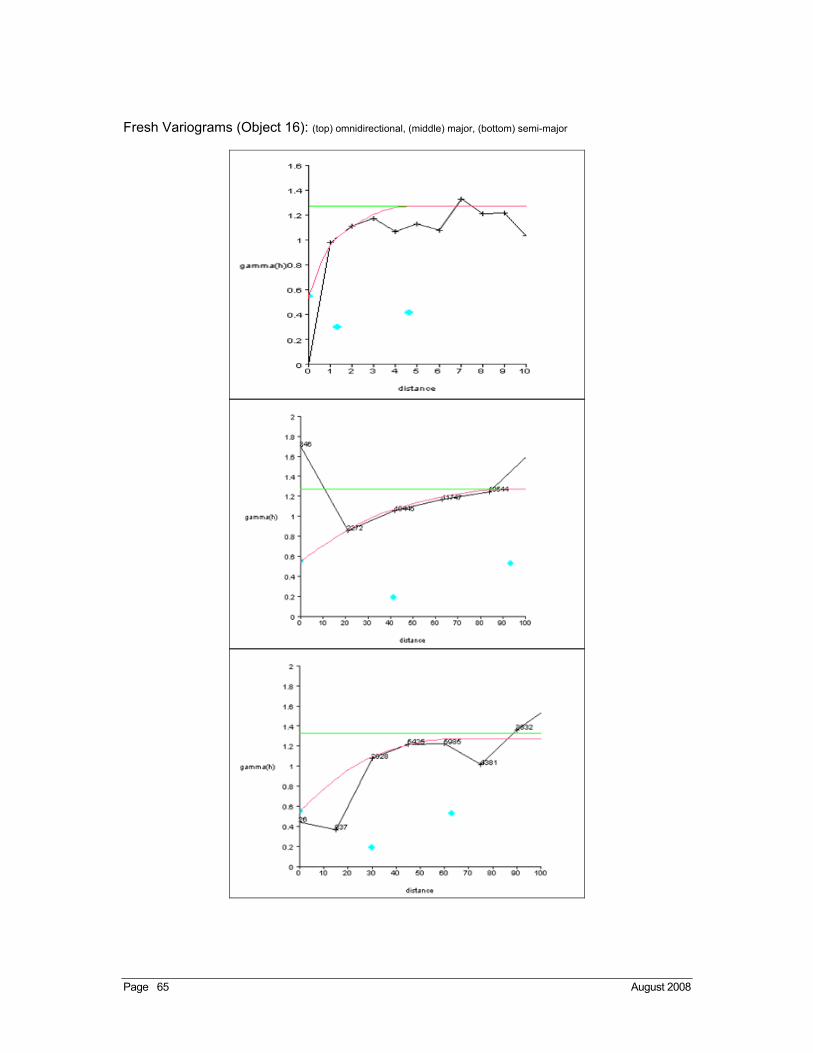
Page 65 August 2008
Fresh Variograms (Object 16): (top) omnidirectional, (middle) major, (bottom) semi-major
Page 66 August 2008
Appendix 5
Great Victoria Gold Project
Surpac String File Descriptions
(All relevant files are included on the Compact Disc
Inside the back cover of this report)
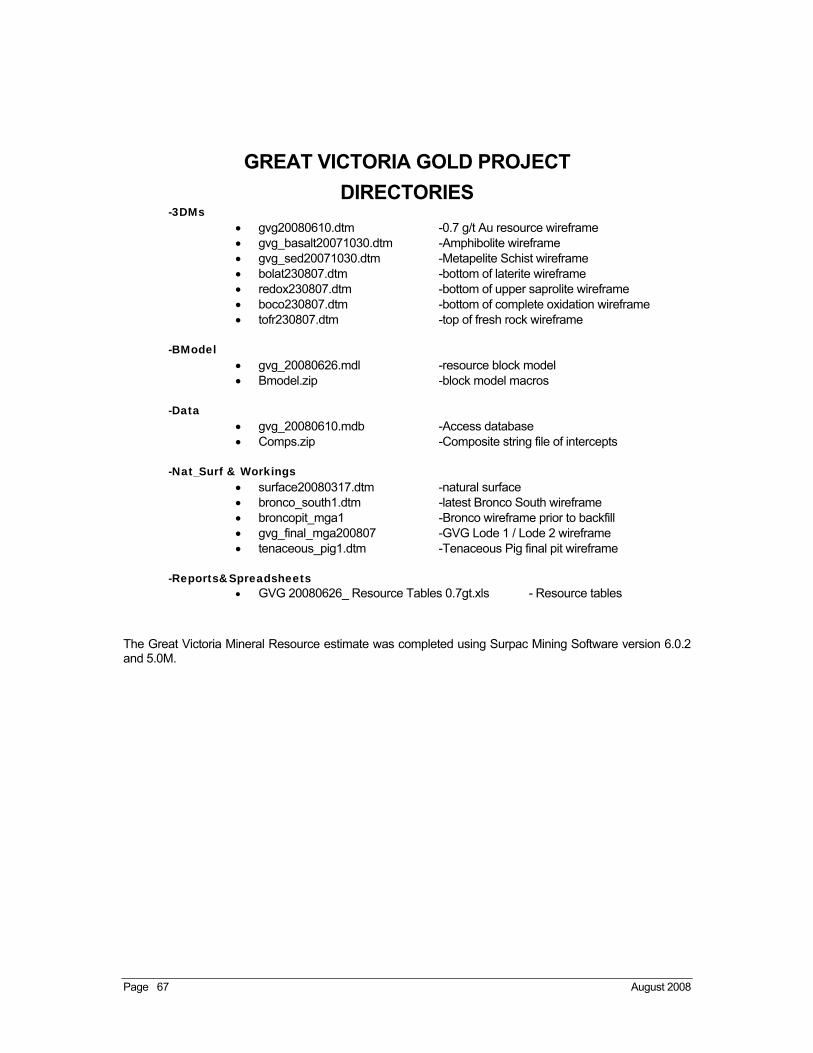
Page 67 August 2008
GREAT VICTORIA GOLD PROJECT
DIRECTORIES -3DMs
gvg20080610.dtm -0.7 g/t Au resource wireframe gvg_basalt20071030.dtm -Amphibolite wireframe gvg_sed20071030.dtm -Metapelite Schist wireframe bolat230807.dtm -bottom of laterite wireframe redox230807.dtm -bottom of upper saprolite wireframe boco230807.dtm -bottom of complete oxidation wireframe tofr230807.dtm -top of fresh rock wireframe
-BModel
gvg_20080626.mdl -resource block model Bmodel.zip -block model macros
-Data
gvg_20080610.mdb -Access database Comps.zip -Composite string file of intercepts
-Nat_Surf & Workings surface20080317.dtm -natural surface bronco_south1.dtm -latest Bronco South wireframe broncopit_mga1 -Bronco wireframe prior to backfill gvg_final_mga200807 -GVG Lode 1 / Lode 2 wireframe tenaceous_pig1.dtm -Tenaceous Pig final pit wireframe
-Reports&Spreadsheets
GVG 20080626_ Resource Tables 0.7gt.xls - Resource tables
The Great Victoria Mineral Resource estimate was completed using Surpac Mining Software version 6.0.2 and 5.0M.