technical report on the current status of the takata root
TRANSCRIPT

TAKATA CONFIDENTIAL AND PROPRIETARY
Technical Report on the Current Status of the Takata Root Cause
Evaluation Effort
July 22, 2016
I. Introduction
This technical report summarizes Takata’s current understanding of the cause of the inflator field
ruptures involving non-desiccated phase-stabilized ammonium nitrate (PSAN) propellant. It summarizes
the status of the understanding as of the spring of 2016.
II. Statement of Root Cause
The research and evaluations to date continue to support the root cause that propellant degradation
is caused by moisture exposure with long-term thermal cycling as a necessary element.
Elements in the underlying cause of the observed field events include:
• A decade-scale moisture migration into the inflator driven by local high absolute humidity conditions.
• A slow change in the propellant physical conditions as evidenced by internal PSAN grain growth, pore agglomeration and potentially ionic migrations in the presence of elevated internal moisture and high temperature conditions, which vary by vehicle platform.
• A resulting threshold-based porous burning phenomenon related to the change in propellant physical conditions which causes high pressures, occasionally resulting in ruptures.
In addition, there may be instances of manufacturing variability involved in certain rupture events, including isolated instances of manufacturing departures related to pressing issues, seal integrity, and others. Such manufacturing variability may contribute to moisture intrusion and accelerated aging in some inflators and subsequent performance degradation.
TK HOLDINGS INC.
2500 Takata Drive
Auburn Hills, MI 48326 USA
TEL 248-373-8040
FAX 248-377-2040

TAKATA CONFIDENTIAL AND PROPRIETARY 2
A version of the statement above was made by Takata in a meeting with engineering representatives of
multiple vehicle manufacturers in March 2015. Research conducted in the last 15 months has continued
to support the original statement. Further, other outside investigators conducting their own
independent research into the field rupture issue have come to essentially the same conclusion as
Takata.
III. Description of the Pyrotechnics
The propellant formulations used in the investigated Takata airbag gas generators are the phases-
stabilized ammonium nitrate based (PSAN) 2004 propellant as the main generant and strontium nitrate
based (SrN) 3110 propellant as the booster generant. The 2004 propellant components are ammonium
nitrate (AN), potassium nitrate (KN), strontium nitrate, 5,5’-Bi-1H-tetrazole diammonium salt (BHT) and
clay. The 3110 propellant components are strontium nitrate, 5-amino-1H-tetrazole (5-AT), potassium
salt of 5-amino-1H-tetrazole (K5-AT) and clay. BHT, 5-AT and K5-AT act as fuel, while AN, KN and SrN act
as oxidizer. Clay is used as a combustion modifier.
Ammonium nitrate is used in fertilizers, industrial explosives, rocket propellants and pyrotechnics.
Within pyrotechnics, phase-stabilized ammonium nitrate acts as an oxidizer. It is hygroscopic and readily
soluble in water. In solid state ammonium nitrate can be found in 5 different crystal structures or phases
– numbered labeled by roman numerals from I to V. It performs transitions in crystal structure at given
temperatures as depicted in Figure 1. These transitions are accompanied by changes in density. These
phase changes caused by temperature cycling could compromise the mechanical integrity of propellant
grains by shrinking and swelling of AN crystals over time.
Figure 1: Phase transitions of ammonium nitrate
The science and process of phase stabilization of ammonium nitrate is well established. Phase
stabilization means that no phase transition takes place in a certain temperature range. The 2004
propellant is phase stabilized by incorporating 10 weight % of potassium nitrate. The presence of the
V IV II I Liq.
III *
-18 °C 55 °C 125 °C 168 °C
32 °C 84 °C * AN humid
(ρ=1,55g/cc) (ρ=1,60g/cc)
(ρ=1,68g/cc)
(ρ=1,70g/cc) (ρ=1,76 g / cc)
TAKATA CONFIDENTIAL AND PROPRIETARY 3
potassium prevents the ammonium nitrate from undergoing damaging crystalline phase changes in the
normal automotive temperature environment.
IV. Investigation of Returned Propellant – Items Eliminated as
Potential Causes
A. Phase stabilization of PSAN
The above mentioned loss in mechanical integrity of propellant grains could be caused by a reduced
phase stabilization of the ammonium nitrate. Phase transitions of AN could result in a breakdown of
mechanical integrity due to significant volume change of the AN crystals during temperature cycling.
Takata has conducted DSC analysis on manufacturing lots since the inception of the propellant launch,
as well as thousands of DSC analyses on field return inflators, with no indication of the loss of phase
stabilization.
In addition, X-Ray diffraction (XRD) analysis was done on new and returned propellant retrieved from
field recalled generators. XRD is the appropriate analysis method to determine crystal structures and
phases of pure substances and mixtures. Measurements were made at ambient temperature and
temperature resolved from ambient temperature up to 100 °C. Results of the measurement at ambient
temperature of original and field return propellant show no evidence of a loss in phase stabilization.
B. Chemical Stability
Chemical stability of 2004 propellant has also been investigated independently by Fraunhofer Institute
for Chemical Technology (Fraunhofer) using 4 different methods – gas chromatography, heat of
explosion, chlorine content and thermal analysis. Gas chromatography of gas composition inside the gas
generators was conducted to identify possible gaseous products of propellant degradation. Heat of
explosion is a measure for the energetic performance of the propellant. Any decomposition of fuel or
oxidizer would lead to a reduction of this value. Chlorine could affect the chemical stability of propellant
by reacting with other propellant components. Differences in the signals of thermal analysis on new and
field return propellant would reveal changes in the physical or chemical state of propellant. Methods of
thermal analysis used during investigations were differential scanning calorimetry (DSC) and
thermogravimetry (TG).
Results of gas chromatography on recalled inflator propellant are plotted in Figure 2. Shift in gas
concentrations of nitrogen and oxygen – compared to atmospheric composition – is caused by injection
of helium during inflator manufacturing for leak rate measurements. Gas components indicating a

TAKATA CONFIDENTIAL AND PROPRIETARY 4
chemical decomposition of the propellant are carbon monoxide (CO), nitrous oxide (N2O) and carbon
dioxide (CO2). The results of the internal gas composition showed no anomalies. The content of 1 to 3
Vol.% of nitrous oxide is not critical. Taking into account the small free internal volume of the inflator
(approx. 6 cm³ for primary and 3 cm³ for secondary chamber) this corresponds to a decomposition of
about 0.6 mg of ammonium nitrate (calculated for primary chamber with 3 Vol.% of N2O.
U004 U014 U024 U034 U044 N011 N014 N017 N020 N023 Air
0
10
20
80
90
100
N2 O
2 CO N
2O CO
2
N2-
an
d O
2-c
on
ce
ntr
atio
ns /
vo
l.%
0,0
0,5
1,0
2,0
2,5
3,0
3,5
CO
-, CO
2 an
d N
2 O c
on
ce
ntra
tion
s / v
ol.%
Figure 2: Gas concentrations in field return inflators and new inflators
Heat of explosion was determined with samples from new propellant and samples recovered from 20
field return inflators. Mean value for new propellant was 4321.33 J/g with a deviation of 0.13 % and
mean value for recovered propellant was 4322.18 J/g with a deviation of 0.59 %. So no change in
energetic performance could be determined and therefore chemical degradation cannot be identified.
The chlorine content of field return 2004 propellant was well below specification.
Finally, DSC and TG tests were performed with new propellant and as well as 20 samples from field
return inflators. For comparison, DSC-signals and TG-signals of new propellant and samples taken from
field return inflator are shown in the following figures. Despite light shifts in the peak positions, which
results from different heat rates applied to new and recovered propellant, there is no change in thermal
behavior. Especially, there are no vanishing or new peaks visible. Any change in number of peaks would
be a clue to a major change in physical or chemical properties.

TAKATA CONFIDENTIAL AND PROPRIETARY 5
Figure 3: DSC-signal of new 2004 propellant
Figure 4: DSC-signal of field return 2004 propellant

TAKATA CONFIDENTIAL AND PROPRIETARY 6
Figure 5: TG- and DTG-signal of new 2004 propellant
Figure 6: TG-and DTG-signals of field return 2004 propellant
TAKATA CONFIDENTIAL AND PROPRIETARY 7
C. Summary of Studies
Summarizing all results mentioned above, there is no indication for a chemical degradation found
either in the crystal or chemical structure of the propellant nor is there any indication of a significant
loss in mechanical properties of the propellant. This means that the basic propellant formulation and
associated propellant manufacturing processes are sound.
V. Key Elements Identified as Root Cause Contributors
A. Time
One clear characteristic of the Takata field events is that the ruptures occur predominately after many
years in a car in certain environments. While there have been a small handful of field events involving
young inflators, these events have been traced to build errors, such as using the wrong component, or
loading too much propellant in the inflator. For the issues related to propellant degradation (and not
those due to an identified manufacturing departures), the minimum observed field exposure resulting in
rupture is about 7 years, with the vast majority of field ruptures occurring after 10 or more years of
exposure.
Observations of the performance characteristics of the inflators clearly show that although time is a
necessary element of the process, the degradation progress is non-linear. The performance of the
inflators appears normal, with even a slight downward trend in max pressure with time and wafer
diameter which has been used as a proxy for the state of degradation of the propellant. It is only after
some threshold is passed that the destructive pressurization rates emerge in the data.
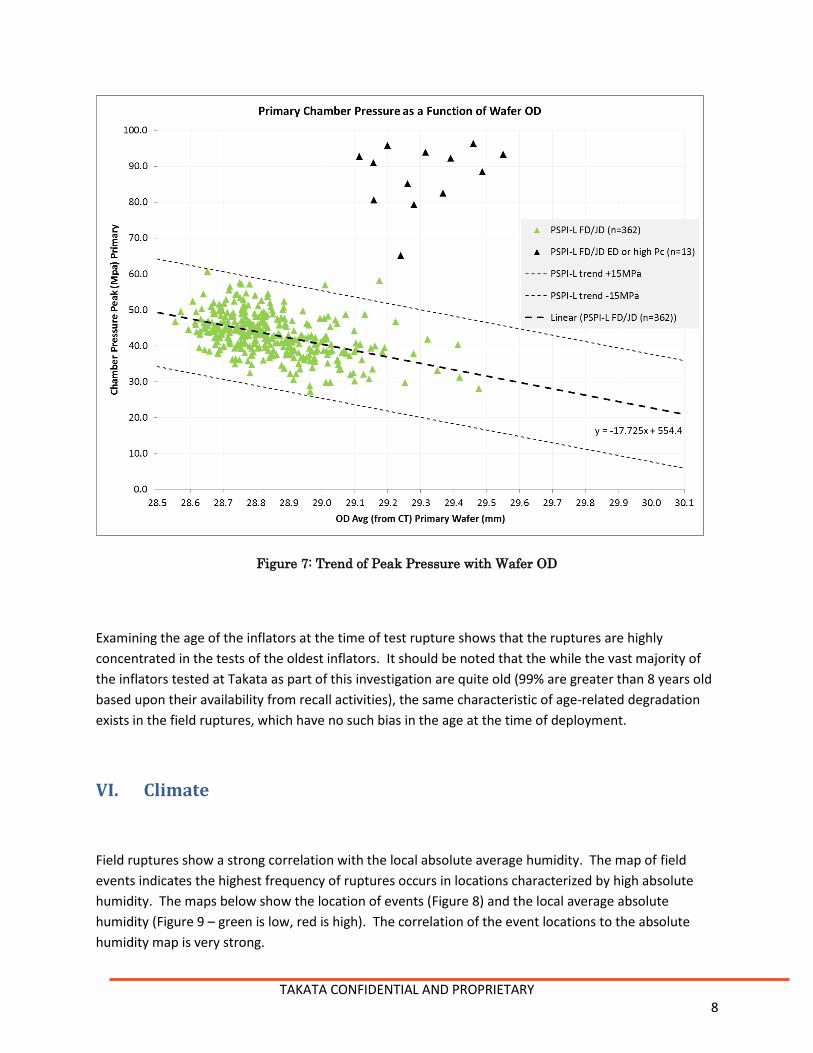
The March 2015 presentation, as shown in Figure 7, clearly shows a slow downward progression in peak
inflator pressure with increasing wafer diameter (a measure of the progress of the degradation),
followed by a sudden occurrence of high pressures and ruptures. This characteristic points to the
existence of a threshold-based phenomenon before which no adverse performance change is observed.
TAKATA CONFIDENTIAL AND PROPRIETARY 8
Figure 7: Trend of Peak Pressure with Wafer OD
Examining the age of the inflators at the time of test rupture shows that the ruptures are highly
concentrated in the tests of the oldest inflators. It should be noted that the while the vast majority of
the inflators tested at Takata as part of this investigation are quite old (99% are greater than 8 years old
based upon their availability from recall activities), the same characteristic of age-related degradation
exists in the field ruptures, which have no such bias in the age at the time of deployment.
VI. Climate
Field ruptures show a strong correlation with the local absolute average humidity. The map of field
events indicates the highest frequency of ruptures occurs in locations characterized by high absolute
humidity. The maps below show the location of events (Figure 8) and the local average absolute
humidity (Figure 9 – green is low, red is high). The correlation of the event locations to the absolute
humidity map is very strong.

TAKATA CONFIDENTIAL AND PROPRIETARY 9
Figure 8 – Test Rupture Inflator Location Figure 9 – Absolute Humidity by County
In the early days of the field analysis, Takata defined four climate zones based on the maximum average
absolute humidity in any county in the state. The purpose of these zones was to segregate the
population for recall priority, and to provide convenient subgroups for analysis.
The map in Figure 10 shows the four zones.
Figure 10: Original Four Climate Zones

TAKATA CONFIDENTIAL AND PROPRIETARY 10
Based on data thru May 2016, Takata has conducted about 245,000 ballistic tests of field return
inflators. Of these, 660 have ruptured, representing 0.27% of all samples tested.
Using the location that the car was serviced as the vehicle location, Zone 1 suffered an overall rupture
rate of 0.58% of the units tested – Zone 2 Suffered an overall rate of 0.056%, while Zone 3 and Zone 4
suffered rupture rates of 0.033% and 0.0% (zero) respectively. The location where the car was serviced
may not be where the vehicle spent its useful life, but even accepting the rough assumption that
location of service equals location of vehicle use, approximately 90.1% of all ruptures could be expected
in Zone 1 or 2.
Using the field rupture data for the US, the Zone 1 prevalence is 81.9%, Zone 2 is 15.2%, Zone 3 is 1.2%
and Zone 4 is 1.8%. Excluding the PSDI events which have a known manufacturing defect resulting in
low initial propellant density, the prevalence of ruptures in Zone 1 is 87.5%, Zone 2 is 10.7%, Zone 3 is
0.0% and Zone 4 is 1.8%. So excluding the known-problematic PSDI from the field results, we can say
that 98.2% of the inflators that have ruptured in the field in the US are in Zones 1 or 2 which is
reasonably comparable to the 90.1% rate observed in lab testing.
VII. Moisture
A. Basic factors influencing water ingress and movement within
inflators
Field return studies have shown that, given enough time and the right environmental conditions,
moisture will migrate inside any inflator. O-rings, gaskets, tape seals, and plastic initiators can be paths
for moisture ingress. Even though inflators are sufficiently sealed to pass the industry-standard helium
leak test, they can still acquire moisture through very slow diffusion and permeation processes. The
moisture ingress rate depends on the difference between the moisture and temperature conditions
inside and outside the inflator. A gradient in the concentration of moisture between the outside and
inside of the inflator will allow moisture to migrate into an inflator. Certain moisture and temperature
conditions can actually create a reversal of the ingress process and drive moisture out of the inflator.
Moisture alone, at the values observed in field samples, does not cause a change in the propellant
performance sufficient to cause a rupture. Instead, moisture acts more as an enabler or accelerator of
the propellant degradation process in the presence of the other key contributors, particularly high
temperature and time. There are two main propellants inside Takata non-desiccated PSAN inflators -
the 2004 PSAN propellant, and the 3110 booster propellant, which tend to absorb moisture at different
levels. Our investigation has tentatively identified a critical level of internal moisture of 1% in the 3110
booster propellant that appears to be necessary before the propellant degradation process can begin.

TAKATA CONFIDENTIAL AND PROPRIETARY 11
B. Moisture Ingress Pathways
Three potential moisture ingress pathways in the inflator have been identified in testing: (i) initiator, (ii)
O-ring, and (iii) the nozzle tape seal (see Figure 11).
Nozzle O-ring
Initiator
Figure 11: Cross section view of a passenger inflator
C. Permeation and Diffusion
Investigations revealed two different water transport mechanisms – permeation and diffusion. Mass
transport by permeation is driven by pressure differences caused by daily temperature cycles inside
inflators. Mass transport by diffusion is driven by concentration gradient of absolute water
concentration between inflator and surrounding.
Therefore two different tests were performed. Diffusion mass transport was tested at constant
temperature and water concentration. Permeation mass transport was tested by temperature cycling to
generate pressure differences between test setup and surrounding. Tests were performed on virgin
parts for igniter, O-ring and tape seal assembly (10 test specimen per assembly and test (diffusion –
permeation)).
The results of the testing, conducted with a strong desiccant (13X) driving the moisture transfer, and a
sample of 2004 and 3110 driving the moisture transfer, show that moisture ingress is significantly faster
in the diffusion test than the permeation test. Unfortunately, the industry-standard helium leak test is
only suitable for identifying leak paths important in the permeation-driven transport mechanism.

TAKATA CONFIDENTIAL AND PROPRIETARY 12
Permeation tests, shown in Figure 12, exhibited a constant increase in moisture level of 13X over time
(with the O-ring specimen showing the quickest moisture gain).The specimens with a combination of
3110 and 2004 showed a behavior contrary to 13X specimen. Moisture level is remaining roughly
constant, and then decreasing which may be a result of an aging effect on the ignitor and O-ring
materials.
Diffusion tests, Figures 13 and 14, were performed at 45 % and 75 % relative humidity and a constant
temperature of 30 °C. Specimen filled with 13X exhibited higher moisture ingress compared to
3110/2004 combination due to different concentration gradients between outer atmosphere and inside
specimen for 13X and 3110/2004. O-ring specimens again were showing higher moisture ingress
compared to igniter and tape-seal specimens.
Figure 12: Results of permeation testing for O-ring, igniter and tape seal with 13X and 3110/2004

TAKATA CONFIDENTIAL AND PROPRIETARY 13
Figure 13: Mass gain by diffusion at 45 % relative humidity and 30 °C
Figure 14: Mass gain by diffusion at 75 % relative humidity and 75 °C

TAKATA CONFIDENTIAL AND PROPRIETARY 14
D. Moisture Transfer within the Inflator
One unique characteristic of the pyrotechnics in the PSAN inflator designs is that the booster propellant,
named 3110, is a strong desiccant when compared to the 2004 PSAN propellant. Even though
ammonium nitrate is known to quickly take up moisture in certain environments, in the inflator system,
the 3110 booster is the preferential absorber.
Experiments conducted independently at Takata and Fraunhofer have shown that the transfer of water
between the 3110 and 2004 propellant is a function of the total moisture available, and the
temperature. Takata observed what we’ve referred to as the “X-curve” phenomenon. The X-curve is a
characteristic description of the movement of water between the two propellants.
Figures 15 and 16 below show the transfer of water at 0% added moisture and 2.7% added moisture.
For the 0% case, there is no observed transfer up to the temperature limit of the test (80 C). Conversely,
the results from the tests with 2.7% added moisture show a clear increase in the uptake of the water by
the 2004 propellant at about 55 C while the water in the 3110 is decreasing.
Figure 15: Baseline Moisture X-curve Figure 16: 2.7% Added Moisture X-curve
What makes this study important is that it may help explain why some vehicles in some climates suffer
the degradation mechanism, while other vehicles in the same or other climates do not. Limited testing
by Takata shows different vehicles exhibit different peak inflator temperatures (in the same outside
environment) at or near the X curve transition zone (discussed in section IX). If the peak inflator
temperature remains below the “X” point, or the water level remains below some threshold value, then
the water is not presented to the 2004 propellant in any significant quantity. This will slow or eliminate
the degradation process.

TAKATA CONFIDENTIAL AND PROPRIETARY 15
E. High Temperature Cycling
Studies at both Takata and Fraunhofer have shown that prolonged high temperature cycling of the
inflator, in the presence of elevated moisture inside the inflator, is necessary to cause the propellant
degradation. Inflator temperatures in excess of approximately 50°C appear to be needed for this process
to occur. At temperatures below approximately 50-65°C moisture is primarily held within the 3110
material. As temperatures rise above approximately 50-65°C (depending on the internal moisture
content) a moisture migration process occurs where the moisture moves from the 3110 material to the
2004 material. This process reverses as temperatures decreases. This transfer process of moisture into
and out of the 2004 PSAN material over a prolonged period of time appears to create micro-pores
within the PSAN propellant. When these micro-pores reach a certain level a porous burning
phenomenon, as identified by Fraunhofer, occurs which can lead to a significantly increased burning
rate. The burning rate can reach a magnitude such that internal pressures are generated that exceed
the strength of the inflator vessel. This process can occur in both driver and passenger inflators and has
been observed in wafer, batwing, and tablet shaped propellant.
F. Summary of Moisture Ingress Studies
The results of the combined studies indicate the following:
1. The moisture ingress rate is a function of the internal environment of the inflator. Dryer internal
conditions lead to higher ingress rates.
2. The O-ring on passenger inflators is the most prominent path for moisture ingress, but the
ignitor and tape seal are also contributors.
3. Permeation tests tend to allow a drying effect on the propellant. Moisture is moving out of the
inflator faster than it is moving in. This is in contrast to the field observations.
4. Diffusion tests tend to result in monotonically increasing internal moisture, similar to that
observed in field samples.
5. The indications of 3 and 4 above point to diffusion as the dominant mechanism for moisture
transport, which is the mechanism not detected by the industry-standard helium leak test.
6. The existence of the “X-curve” may explain why some vehicles suffer more events that other,
even though they seem quite similar and have comparable inflators. We have seen that inflator
maximum temperatures vary from vehicle to vehicle.
7. Repeated exposure to the excess X-curve moisture is believed to drive the propellant to a
porous burning state, which can have a detrimental effect on the chamber pressure.
VIII. Burning Rate Characteristics
One of the key characteristics of any propellant system is the burning rate of the propellant. The
burning rate, along with the surface area and density of the propellant, determines the rate of gas

TAKATA CONFIDENTIAL AND PROPRIETARY 16
generation. The pressure reached in any pyrotechnic device is determined by the balance of the mass
generated by the propellant and the mass discharged from the nozzles. If more gas is generated than
can be discharged, the pressure goes up – if more mass is discharged than generated, the pressure goes
down. Should the burning rate of the propellant system change, then the pressure characteristics of the
device will also change with higher burning rates resulting in higher pressures.
One of the measurements conducted by Fraunhofer is known as a Closed-Vessel Burning Rate Test or
CVT. In this test protocol, a sample of the propellant, typically a single wafer or a sample of tablets is
combusted in a closed chamber of a known volume. The pressure curve, along with a knowledge of the
sample surface area progression and the propellant physical and thermochemical properties, can be
used to calculate what burning rate exists at any point in time in the test.
Based on the results from some early CVT’s conducted by Fraunhofer, Takata designed and
manufactured its own comparable device in order to increase the capacity to conduct this type of test.
The benefit of this test is the ability to obtain direct measurements of the level of moisture of the
propellant and the physical characteristics of the propellant sample (OD, ID, thickness, mass, density)
from a dissected inflator, and still conduct a test of the ballistic performance of that same sample of
propellant. In previous analysis, only a statistical comparison of the ballistic and physical property could
be obtained. The returned inflator could either be disassembled to conduct measurements, or
deployed to measure the ballistic performance, but not both. The CVT provides a far more detailed view
into the degradation state of the propellant than any other test conducted to date.
The results of these closed-vessel tests showed a pattern of performance degradation that helped
explain some of the observations from ballistic tests.
Takata has elected to use the Integrated Burning Rate (IBR) of the propellant as a measure of the state
of degradation. The IBR is the calculated area under the burning rate versus pressure curve over the
pressure range of 100 bar to 650 bar. This is shown graphically below in Figure 17. The blue area
represents the IBR for a normal propellant sample – the pink area represents the IBR for a degraded
sample. The IBR for a normal 10.8 gram wafer is about 18,800. The IBR for the degraded sample is
about 30,000.

TAKATA CONFIDENTIAL AND PROPRIETARY 17
Figure 17: Normal and Degraded Propellant IBR
Examining the IBR for various inflators and chambers revealed a dependence of IBR on the inflator
design and the chamber. Examining 10.8 gram passenger wafers, for which the greatest sample of data
is available, shows that the OD of the propellant grows well before there is any evidence of degradation.
Taking the “FD”-style inflator as an example, we can see the characteristic of the OD growth with no IBR
change, followed by a region of significant IBR change as shown in Figure 18. The wafer manufacturing
spec. is 28.5 +0.2 / -0.0 mm.
Figure 18: IBR versus Wafer OD for the FD Inflator

TAKATA CONFIDENTIAL AND PROPRIETARY 18
This same basic characteristic exists for other inflator designs (PSPI and SPI), but the point of IBR
departure from normal is different in the other inflators.
The family of CVT results has highlighted some important characteristics. The rate of OD growth,
termed OD Velocity, can be measured according to inflator type, climate zone and particular vehicle of
use. Temperature profile exposures for the inflator, particularly peak temperature, correlate with
observed rupture rates and provide insight into the degradation process. In this case, the peak
temperature that the vehicle normally sees can increase the rate of OD growth and change in propellant
properties.
IX. Manifestations in the Vehicle Population
A. Temperature Influence
One of the key observations in the analysis of the field return data is that there exists a strong
dependence on outcome based on the vehicle in which the inflator was installed. Limited vehicles
studies conducted by Takata show variation in inflator surface temperatures between different vehicle
types and models, given identical environmental exposure conditions. This temperature variation
appears to have some correlation with different field performance of those models, as shown in Figure
19 below. This is not to say that the vehicle is the cause of the issue- only that the vehicle type may
influence the rate that the inflator degrades.

TAKATA CONFIDENTIAL AND PROPRIETARY 19
Figure 19: Correlation of Field Rupture Rates to Measured Peak Inflator Temperature
B. Data Analysis Project (DAP)
Takata conceived and conducted an effort known as the Data Analysis Project (DAP). The purpose of the
Data Analysis Project (DAP) was to summarize the massive amounts of data gathered from the various
testing programs conducted on field return inflators, and provide a detailed analysis of the testing
results. To date, there have been over 245,000 ballistic tests, 35,000 live dissections with chemical and
dimensional analysis, and 15,000 CT scans. All of the data is gathered in a database named the Master
Engineering Analysis File (MEAF).
As part of the analysis, correlating factors that best predicted performance were determined. Once that
was complete thresholds were determined for each of these factors in order to create a predictive tool.
All information to date indicates that the probability of inflator rupture (independent of manufacturing
defect) is a function of temperature, moisture, and time. Since inflator temperature and moisture are a
function of the inflator type, geographic location, and platform, the behavior of an inflator may be
described as a function of:

TAKATA CONFIDENTIAL AND PROPRIETARY 20
• Type: SPI, PSPI, PSPI-L, PSDI, PSDI-4/K, PSDI-5 • Platform: Characteristics of vehicle type, i.e. vehicle mass • Manufacture Date: date inflator was manufactured • Zone: defined as 1, 2, 3, 4 based on the location at which the inflator was returned
There is a DAP presentation for each inflator family, OEM, and model that has a summary chart which
demonstrates inflator rupture confidence levels. There are also pages to show chamber pressure, wafer
diameter (passenger inflators only), propellant density, AI-1 color, and crimp OD (passenger inflators
only) by zone and inflator age.
In addition to the temperature differences measured at the inflator given identical environmental
exposures, variations in the day-to-day usage of vehicles can also affect inflator temperature. This
variability makes it impossible to quantify precisely the moisture and temperature factors needed for
degradation, since the actual decade-long environment for any particular vehicle cannot be determined.
X. Environmental Simulation Program Issues
The industry-standard validation programs do not sufficiently test for this slow water ingress/egress process affecting the 2004 PSAN propellant in the high absolute humidity environments. Research by both Takata and Fraunhofer indicate that a typical single run of a “high humidity cycle” exposure test will only move about one fortieth of the moisture into the inflator that is typical for field return measurements. Since only a small fraction of the moisture observed in the field is present in the validation tests, the degradation process taking place in the field is not examined by the OEM validation exposure tests.
XI. Summary
In conclusion, the unfortunate occurrence of field ruptures on non-desiccated Takata PSAN inflators is
due to an unanticipated long-term sensitivity to field environmental conditions. The degradation takes
nearly a decade to reveal itself, and principally occurs in areas characterized by a persistent high
absolute humidity environment.
Inflator-industry standard methods for validation and on-going quality control are incapable of
identifying the potential for this environmental sensitivity.
Several expert organizations around the world have come to similar conclusions after an exhaustive
analysis of the available data and science on the subject.
Takata continues to evaluate the performance of later generations of PSAN products and will continue
to cooperate with the OEM’s and government authorities in the resolution of this unfortunate issue.