technical report: values & ethics in management
TRANSCRIPT

1 of 68
Technical Report: Values & ethics in management Tom May & David Pardey

© 2013 ILM & BITC Page 2 of 68
Values & ethics in management: Technical report
Preface This report contains the detailed findings from a research project carried out by the Institute of Leadership & Management (ILM) and Business in the Community (BITC) in the first half of 2013.
ILM is the UK’s largest management body, combining industry-leading qualifications and specialist member services. It is founded on the principle that skilled managers and leaders hold the key to creating productive workforces that deliver organisational and economic success.
BITC is a unique business movement - the largest business-led charity of its kind - committed to building resilient communities, diverse workplaces and a more sustainable future. BITC believes that responsible leadership is the ability to balance doing both.
The principal outcome of the research is a report entitled Added values: The importance of ethical leadership which is available from both the ILM (www.i-l-m.com) and BITC (http://www.bitc.org.uk) websites. This technical report details the full findings from the research, with detailed tables of analysis, some comments about their meaning and suggestions as to conclusions that may be drawn. However, these comments and conclusions are the authors’ and not the considered opinion of either ILM or BITC.
Although copyright in the report rests with ILM and BITC, it may be copied freely and used for education, training and similar purposes. Extracts from the report may also be used, as long as the source is acknowledged. References to the report should be:
May T & Pardey D (2013) Values & ethics in management London: ILM and BITC

© 2013 ILM & BITC Page 3 of 68
Values & ethics in management: Technical report
Section A Methodology and the sample

© 2013 ILM & BITC Page 4 of 68
Values & ethics in management: Technical report
A1 Methodology A total of 1 BITC and ILM wanted to investigate values and ethics in leadership and management in organisations today and were curious to see what might have changed since the banking crisis in 2008.
For the purposes of this research we defined ethics or ethical standards as the set of moral principles that govern a person’s behaviour or the conduct of an activity. Values were treated as another way of describing those specific moral principles or standards of behaviour. We deliberately took a broad definition to avoid changing the preconceptions of those that took part in the research.
The aims of the research were to explore:
• The prevalence of explicitly stated values at work and how they are developed o The use of stated organisational or implicit values, (and individual’s own
values) at work their effect on employee behaviour and whether or not this varies by management level, gender or sector
• If perceptions of values and uses of stated values have changed since 2008 The research was in three stages, starting in December 2012 with a small number of semi-structured telephone interviews to explore the topic and establish the potential experiences that might be captured in the quantitative phase. This second phase, the main data collection, was conducted through an online survey of practising managers drawn from BITC and ILM membership. The survey was run during January and February 2013 and consisted of multiple choice and open response questions, with routing dependent on answers to previous questions; respondents were not presented every question. In total there were 1174 completed responses. To encourage participation, respondents were offered the opportunity to enter a prize draw to win one of five one hundred pound donations to the charity of their choice. The research was conducted in line with the Market Research Society (MRS) Code of Conduct. Respondents were also asked if they would be happy to provide any specific examples regarding their experience of the use or abuse of ethics and values at work.
Most of the variables analysed were categorical. Therefore descriptive statistical analysis, predominantly through chi-squared tests, was used to identify significant differences between groups in the responses to individual questions. Cramer’s V was also calculated for each chi-squared test. These are reported as footnotes to the text. The strength of association indicated by Cramer’s V is often quite modest (.1-.2) but nonetheless still significant. A qualitative coding approach was used to analyse the responses given to the open questions. The corresponding question numbers are also given as footnotes (the questions are listed in Annex A).
In the third and final phase, headline results were presented at a roundtable discussion in March. The participants were directors or senior managers from major organisations across a number of sectors including law, finance, construction and mining. They were

© 2013 ILM & BITC Page 5 of 68
Values & ethics in management: Technical report
invited to respond to the findings and make recommendations based on their experience. These responses were used to help inform the analysis, the conclusions drawn from them and the recommendations that appear in this report.
A2 Respondents A total of 1,174 managers and directors completed the survey1, divided across different levels of responsibility (see Table 1). The actual questions asked are listed in Annex A, the numbering is for reference as respondents were presented with difference questions depending on earlier answers, the relevant question numbers are listed as footnotes2.
With the exception of Non-Executive Directors, the number of respondents in each category is sufficient to be able to derive statistically confident conclusions about any differences. The largest group of managers was first line managers (FLM), at 37.5%, as might be expected. One fifth of managers were middle managers (MM - 20.4%), the same proportion as senior managers (SM - 19.9%) and those at Board level (22.2%).
The sample split more or less equally in the ratio of women to men, with a small majority of male respondents (56.4% to 43.1%; 0.6% did not state their sex). However, women were in the majority amongst FLM (53.4%), whereas men made up the majority at higher levels – at SM and above the ratio of men to women was roughly 2:1. This imbalance is no surprise; both BITC and ILM have previously published research regarding the difficulties women face reaching higher levels of leadership and management.
1Total responses vary by question, percentages are calculated from the total per question. 2 The questions eliciting information on role, age, gender, and ethnicity are 1, 2, 3 and 33 respectively.

© 2013 ILM & BITC Page 6 of 68
Values & ethics in management: Technical report
Table 1: Role and gender of respondents
Role Total Female Male Prefer not to say
No % No % No % No % First-line manager (FLM - managing people who are not managers themselves)
416 37.5% 222 46.6% 192 30.7% 2 28.6%
53.4%
46.2%
0.5%
Middle manager (MM - managing first-line managers or other middle managers)
226 20.4% 92 19.3% 133 21.3% 1 14.3%
40.7%
58.8%
0.4%
Senior manager (SM - managing middle or other senior managers)
221 19.9% 79 16.6% 140 22.4% 2 28.6%
35.7%
63.3%
0.9%
Executive Director (ED) 127 11.5% 43 9.0% 84 13.4% 0 0.0%
33.9%
66.1%
0.0%
CEO or equivalent (CEO) 96 8.7% 29 6.1% 65 10.4% 2 28.6%
30.2%
67.7%
2.1%
Non-Executive Director (NED) 22 2.0% 11 2.3% 11 1.8% 0 0.0%
50.0%
50.0%
0.0%
Total 1108 100.0% 476 100.0% 625 100.0% 7 100.0%
100.0%
43.0%
56.4%
0.6%
The approximate average age of respondents (see Table 2) was 47, slightly older than the UK management population (43.8), largely due to under-representation of managers under the age of 35 (11.4% compared to the national average of 21.8%). The female respondents were slightly younger than males (45 vs 48)3.
Table 2: Age and gender of respondents
Age
Total Female Male No % No % No %
18-24 14 1.2% 5 1.0% 9 1.4% 25-29 48 4.1% 30 6.3% 16 2.6% 30-34 71 6.1% 37 7.7% 28 4.5% 35-39 130 11.2% 58 12.1% 66 10.5% 40-44 172 14.8% 81 16.9% 81 12.9% 45-49 221 19.0% 98 20.5% 114 18.2% 50-54 257 22.1% 99 20.7% 146 23.3% 55-59 155 13.3% 45 9.4% 103 16.5%
3 Averages were calculated by averaging between the midpoint for each band.

© 2013 ILM & BITC Page 7 of 68
Values & ethics in management: Technical report
60-64 68 5.8% 17 3.6% 48 7.7% 65+ 16 1.4% 3 0.6% 13 2.1% Prefer not to say 11 0.9% 5 1.0% 2 0.3% Total 1163 100.0% 478 100.0% 626 100.0% Average age
46.8 45.0 48.6
As might be expected, the average age of the respondents increase with their level, Board level respondents being a little over 50, whereas FLMs were youngest, at 44.
Some 90% of respondents described themselves as ‘White’, predominantly (81.9%) of British origin, with Irish (2.6%) and ‘Other’ White background (5.3%) representing a significant minority. Of the remaining 10%, 2.4% chose not to give their ethnicity, and those of Indian origin were the most numerous minority group (at 1.5%). Given the sensitivity of the subject matter and the potential for ethnicity analysis being misrepresented, we guaranteed respondents that no analysis of answers would be done, based on ethnicity.
However, knowing respondents’ ethnicity helps to determine the representativeness of the sample. The 2011 Census showed the population of England and Wales as shown in Table 3, below (main groupings for the various categories):
Table 3: Ethnicity of respondents compared to 2011 Census (E&W only)
Ethnic group Census Sample White 86% 89.8% Asian/Asian British 7.5% 3.0% Black/African/Caribbean/Black British 3.3% 1.9% Mixed/ Multiple ethnic groups 2.2% 1.7%
0.0
10.0
20.0
30.0
40.0
50.0
60.0
FLM MM SM CEO ED NED
Chart 1: Average age, by role

© 2013 ILM & BITC Page 8 of 68
Values & ethics in management: Technical report
Other 1.0% 0.9% Chose not to say - 2.4%
What the census data don’t tell us (at present) is how occupational groups are split by ethnicity. Given this we can only speculate as to whether minority groups are under-represented against the wider manager population.
A2 Organisations The sample was drawn mainly from large (250+ employees) organisations, at 61.9%, compared to the national workforce . Table 4 shows the employment data by business size (Small <50; Medium 50-249; and Large >250). However, the sample was drawn from the employed labour force, including the public and third sectors, whereas the national data is for private and third sector only4.
Only 48.7% were employed in the private sector, with 36.4% in the public sector and 14.9% from the third (charity, social enterprise, or similar) sector. Nationally, the employed labour force (ie when the self-employed are excluded) splits 67:33 between the private and third sectors (combined) and the public sector. Therefore the sample does not significantly over-represent the public sector. However, the proportion in the third sector does seem to be slightly high; unfortunately it is very difficult to obtain accurate data on this sector, national employment data doesn’t distinguish between the two sectors.
Table 4: Respondents by organisation size compared to UK Business population
Organisation size (FTE) Sample UK Employment % No % %
Fewer than 20 159 13.8% 21.9% 36.6% Between 20 and 49 93 8.1%
Between 50 and 99 69 6.0% 14.7% 14.6%
Between 100 and 249 100 8.7% Between 250 and 499 95 8.3%
61.9% 48.8% Between 500 and 999 76 6.6% Over 1,000 541 47.0% Don’t know/Prefer not to say 17 1.5% 1.5% - Total 1,150 100.0% 100.0% 100.0%
More specifically, the breakdown of the sample by industry (Table 5), shows that, although there is good representation from across all industries, there is a over-representation from certain sectors and under-representation from others. However, there is no reason to believe that this will produce any significant bias in the results.
4 Organisation size 4, broad sector 32, detailed sector 35.

© 2013 ILM & BITC Page 9 of 68
Values & ethics in management: Technical report
Table 5: Respondents by industry compared to UK employment by industry
Specific sector Sample
UK Industry No %
Health 80 8.4% 12.9% Education 135 14.1% 8.7% Military/defence 58 6.1%
5.1% National / local government / other public sector 127 13.3% Charity 93 9.7% n/a Retail 28 2.9%
20.5% Wholesale, distribution, travel and transport 23 2.4% Catering and hospitality 11 1.2% 6.9% Financial services, banking and insurance 63 6.6% 3.6% Professional services and consultancy 141 14.7%
8.3% Media, PR and marketing 12 1.3% Leisure 16 1.7% 2.8% Engineering and manufacturing 89 9.3%
9.7% Utilities, oil, gas, mining, post and telecoms 44 4.6%
Construction 20 2.1% 6.4% Total 919 100%

© 2013 ILM & BITC Page 10 of 68
Values & ethics in management: Technical report
Section B Organisational statements of values

© 2013 ILM & BITC Page 11 of 68
Values & ethics in management: Technical report
B1 How prevalent are explicitly stated sets of values? 83.1% of respondents said that their organisation had an explicitly stated set of values and/or ethics, with 11.5% saying ‘No’ and 5.5% ‘Not sure/Don’t know’5. However, there are some significant differences in responses due to the size of the organisation (see Chart 2). Managers and directors of larger organisations are generally more likely to say that they have statement of values or ethics, although with one exception – those in organisations employing 250-499 people are significantly less certain about the existence of such a statement. Small organisations are significantly less likely to have a statement and those with a thousand or more staff are significantly more likely6. Perhaps of interest is that of the latter group 5% (27 people) responded that their organisation did not have an explicit statement of values/ethics.
There are few differences by broad sector (private, public, third). Private sector respondents were significantly less likely to be unsure if their organisation had explicitly stated values and those from third sector organisations were significantly more likely to be unsure7. There are a few industry sectors represented in the sample that show some variation; organisations in construction are significantly more likely to have a statement of values and organisations in professional services and consultancy or
5 Question 5. 6X2(8, N=1138) = 71.403, p<.001. Cramer’s V = .177 (Chi Square test of association, 8 degrees of freedom, 1138 people, test value of 71.403, very statistically significant. Cramer’s V shows degree of association between 0-1, .177 indicates low association). 7 X2(4, N=947) = 10.687, p<.030. Cramer’s V = .075.
0.00% 10.00% 20.00% 30.00% 40.00% 50.00% 60.00% 70.00% 80.00% 90.00% 100.00%
<50
50-249
250-999
>999
Size
of o
rgan
isat
ion
Chart 2: Does your current employer have an explicitly stated set of values and/or ethics? Yes

© 2013 ILM & BITC Page 12 of 68
Values & ethics in management: Technical report
education are significantly less likely to do so8. These findings are interesting though further sampling would be required to support wider generalisation.
B2 How were the set of values and/or ethics arrived at?
The most common response to the question ‘How have the set of values and/or ethics been arrived at?’9 was that they were developed by the senior management and/or board of directors – see Chart 3.
The pattern of responses across organisations of different sizes, across different sectors and different industries, was highly consistent, with ‘senior managers/directors’, followed by ‘cross-departmental project teams’ and ‘don’t know/already existed’ as the top three responses, in similar proportions10.
Nevertheless, the process of developing the statement of values or ethics was not done in a vacuum. Half the respondents (49.7%) said that employees had been consulted, a quarter (25.6%) also said shareholders or owners had had a chance to express their views, and one in five said other external stakeholders (21.9%) were also involved. Only 11.2% of respondents (less than one in eight) said that there was no consultation.
There is clear evidence that the size of the organisation is a significant factor in consultation (see Chart 4); the larger the organisation, the less likely it is that there will
8 X2(30, N=946) = 44.677, p<.041.Cramer’s V = .154. 9 Question 6. 10 Question 7.
0.00% 10.00% 20.00% 30.00% 40.00% 50.00% 60.00%
They were developed by the Senior Managementand/or Board of Directors
They were developed by a cross-departmentalproject team
I don’t know/they existed when I joined
Other
They were developed by the HR team
They were developed by theMarketing/Communications team
Chart 3: How were the set of values and/or ethics arrived at?

© 2013 ILM & BITC Page 13 of 68
Values & ethics in management: Technical report
be consultation with employees11 or shareholders/owners12 and more likely that there was no consultation and, most significantly, that the respondents are unsure as to whether or not there was any consultation at all. If, as we might hypothesise, consultation is likely to increase both awareness and ownership of the values, the absence or lack of awareness of any consultation is likely to reduce the knowledge or sense of commitment to any statement of values.
11 X2(4, N=912) = 17.458, p<.002. Cramer’s V = .138. 12 X2(4, N=912) = 13.324, p<.010. Cramer’s V = .120
0.00% 10.00% 20.00% 30.00% 40.00% 50.00% 60.00% 70.00%
<50
50-249
250-999
>1000
Size
of o
rgan
isat
ion
(em
ploy
ees)
Chart 4: Was there any consultation with the following groups in the process of developing the set of values and/or ethics? by size of organisation
Not sure/ Don’t know No consultation Other
Other external stakeholders Shareholders/Owners Employees

© 2013 ILM & BITC Page 14 of 68
Values & ethics in management: Technical report
Consultation was highest in the Third sector, compared to the Public or Private sectors (see Table 6), though not significantly so. This is true for employees, external stakeholders and ‘others’, with a correspondingly smaller proportion saying no consultation took place. Perhaps not surprisingly, private sector organisations are most likely to have consulted shareholders or owners but least likely to have consulted external stakeholders or others, are most likely not to have consulted at all, although this is still a fairly low 14.2%.NB: Given that the Third sector organisations tend to be smaller, the higher level of consultation may be a consequence of size as well as sector.
Table 6: Was there any consultation with the following groups in the process of developing the set of values and/or ethics?, by sector
Consultees Sector
Private Public Third
Employees 49.7% 47.6% 57.9% Shareholders/Owners 32.1% 19.0% 23.7% Other external stakeholders 19.4% 24.1% 28.9% Other 3.6% 6.1% 12.3%
No consultation 14.2% 9.2% 7.0% Not sure/ Don’t know 26.7% 36.4% 23.7%
B3 Has this statement of values and/or ethics changed since 2008? More than half the respondents (54.0%) said that the statement of values or ethics had been changed in the last five years (since the banking crisis that instigated the recession)13. Only a third (33.1%) said that it hadn’t changed, and one in eight (12.9%) either didn’t know or preferred not to say.
Respondents in smallest organisations (fewer than 20 employees) are significantly most likely to say that the statement hasn’t changed (see Table 7), with nearly half (45.6%) saying it was unchanged14. Conversely, respondents from medium (50-249 employees) and large (250+ employees) organisations are more likely to say it has changed, with one exception – those from the ‘smallest large’ organisations (250-499 employees), who recorded the smallest positive responses. However, this group also
13 Question 8. 14 X2(8, N=912) = 24.427, p<.002. Cramer’s V = .116.

© 2013 ILM & BITC Page 15 of 68
Values & ethics in management: Technical report
recorded the highest proportion of ‘Don’t know/Prefer no to say’ responses, and their definite ‘No’ response rate aligns with the other larger organisations.
Table 7: ‘Has this statement of values and/or ethics changed since 2008?’, by size
Size of organisation (number of employees)
<50 50-249 250-999 >999 Yes 49.7% 57.3% 50.0% 55.9% No 45.6.% 30.5% 34.1% 29.3% Don’t know/prefer not to say 4.7% 12.2% 15.9% 14.8%
Interestingly, respondents from private sector organisations were least likely to say that the statement of values or ethics had changed (at 49%), most likely to say it hadn’t changed (at 39.8%) and least likely to not know or not want to say (11.2%) – see Table 8. By contrast, public sector respondents were the reverse of this, most definitive it had changed, but most likely to not know or prefer not to say.
Table 8: ‘Has this statement of values and/or ethics changed since 2008?’, by sector
Sector
Private Public Third
Yes 47.9% 59.2% 56.1% No 41.2% 25.5% 31.6% Don’t know/prefer not to say 10.9% 15.3% 12.3%
slightly less likely and the largest slightly more likely to have changed their statements of values, but these are only marginal differences.
B4 What has driven the change in stated values? Those respondents who reported a change in their statement of values or ethics were asked what had driven that change15. The most commonly cited factor was the changing external economic, social and political context, with 54.2% of respondents choosing this option. (NB: Respondents could choose multiple options.)
15 Question 9.

© 2013 ILM & BITC Page 16 of 68
Values & ethics in management: Technical report
Of the 64 respondents (13% of the sample) choosing ‘Other’, 17 put it down to significant changes to the business (merger, growth or restructuring, etc), and 18 to a desire to use the revision as a vehicle for bringing about some change in the way the business worked. Nine respondents said that it was at least in part due to pressure from, or a desire on the part of, employees, to review and update them. Seven mentioned regular review, and in one case, as a response to a major incident.
Larger firms were very much more likely to cite a change of CEO of Board Chair, whereas smallest organisations were much less likely to do so. Mid-sized organisations were marginally less likely to mention the external environment and the Third sector was much less likely to cite regulatory conditions than the other two sectors.
B5 Conscious reference to the stated set of values or ethics More than two-thirds of respondents (69.2%) whose organisation has a stated set of values or ethics has consciously referred to them when deciding what to do at some time16. This is more likely to occur amongst more senior managers, with 84% of CEOs and Executive Directors saying they have done so at some time, compared to 78% of other senior managers, 62% of middle managers, and only 60% of first line managers. First line and middle managers are significantly less likely to have consciously referred to their organisation’s statement of values than senior managers, executive directors and CEOs17. (NB: The number of Non-Executive Directors is too low for the data to be reliable.)
16 Question 10. 17 X2(10, N=892) = 47.519, p<.001. Cramer’s V = .163.
0.00% 10.00% 20.00% 30.00% 40.00% 50.00% 60.00%
The changing external economic, social and politicalcontext
Need to respond to market pressure or expectations
A new CEO, Chair of the Board or similar
The need to meet regulatory conditions
Other
I don’t know/prefer not to say
Chart 4: How have the set of ethics/values been arrived at?

© 2013 ILM & BITC Page 17 of 68
Values & ethics in management: Technical report
There is also evidence of variation by size of organisation (Chart 6), with managers and directors in the largest and smallest organisations being significantly more likely to refer to their statement of values and ethics18. Why this should happen is intriguing and it is hard to come up with a convincing explanation.
18 X2(8, N=893) = 30.562, p<.001. Cramer’s V = .131.
40.00% 50.00% 60.00% 70.00% 80.00% 90.00% 100.00%
First-line manager
Middle manager
Senior manager
Executive Director
CEO or equivalent
Non-Executive Director
Chart 5: 'Have you ever consciously referred to the statement of values and/or ethics when deciding what to do?' 'Yes' by level
0.00% 10.00% 20.00% 30.00% 40.00% 50.00% 60.00% 70.00% 80.00% 90.00%
<50
50-249
250-999
>999
Chart 6: 'Have you ever consciously referred to the statement of values and/or ethics when deciding what to do?' 'Yes', by size of organisation
Yes

© 2013 ILM & BITC Page 18 of 68
Values & ethics in management: Technical report
Although there appears to be variation by sector (Chart 7), regarding referring to the organisation’s stated values, the differences are not statistically significant.
B6 Colleagues’ conscious reference to the stated set of values or ethics Respondents whose organisations had a stated set of values or ethics were also asked if their colleagues referenced to them19; their responses are interesting to compare with their self-reporting (Chart 8). There was a high level of association between an individual consciously referring to their organisation’s stated values and colleagues also referring to them20.
19 Question 11. 20 X2(4, N=899) = 471.048, p<.001. Cramer’s V = .512
58.00% 60.00% 62.00% 64.00% 66.00% 68.00% 70.00% 72.00%
Public
Private
Third
Chart 7: 'Have you ever consciously referred to the statement of values and/or ethics when deciding what to do?' 'Yes', by sector

© 2013 ILM & BITC Page 19 of 68
Values & ethics in management: Technical report
This also relates to level, with those in more senior positions being significantly much more likely to say that colleagues refer to the stated values (Chart 9)21. Around three-quarters of CEOs and Non-Executive Directors responded ‘Yes’ compared to just under half of First Line Managers, and were also more confident in their responses (ie low levels of Don’t know/Prefer not to say).
A similar pattern appears as with the previous question, on self referencing to values, statements when analysed by age. Younger respondents are least likely to respond ‘Yes’ (that colleagues have consciously referred to the statement of values or ethics) and most likely to respond ‘No’, the reverse to older respondents. Clearly, the more experience someone has, the more likely they are to encounter such events, as well as
21 X2(10, N=892) = 51.796, p<.001. Cramer’s V = .170
0.0% 10.0% 20.0% 30.0% 40.0% 50.0% 60.0% 70.0% 80.0%
Yes
No
DK/prefer not to say
Chart 8: Own and colleagues' reference to the statement of values and/or ethics when deciding what to do?
Self Colleagues
0.00% 10.00% 20.00% 30.00% 40.00% 50.00% 60.00% 70.00% 80.00% 90.00% 100.00%
FLM
MM
SM
ED
CEO
NED
Chart 9: Colleagues' reference to the statement of values and/or ethics when deciding what to do, by level
Don’t know/prefer not to say No Yes

© 2013 ILM & BITC Page 20 of 68
Values & ethics in management: Technical report
being more senior (as above). The data suggests that it is this experience that is the likely explanation for the difference.
A slight pattern emerges with size of organisation to the response to the previous question, with managers in larger and smaller organisations more likely to say that they are aware of colleagues referring to the organisation’s statement of values or ethics. Although the only statistically significant difference is that those from organisations with 250-999 staff are slightly more likely to respond ‘no’22.
There were no statistically significant differences by sector.
22 X2(8, N=893) = 15.642, p<.048. Cramer’s V = .94.
0.00% 10.00% 20.00% 30.00% 40.00% 50.00% 60.00% 70.00%
<35
35-44
45-54
>54
Chart 10: Colleagues' reference to the statement of values and/or ethics when deciding what to do, by age
DK/prefer not to say No Yes
48.00% 50.00% 52.00% 54.00% 56.00% 58.00% 60.00% 62.00% 64.00%
<50
50-249
250-999
>999
Chart 11: Colleagues' reference to the statement of values and/or ethics when deciding what to do, by size of organisation

© 2013 ILM & BITC Page 21 of 68
Values & ethics in management: Technical report
B7 The match between fellow employees’ behaviour and decisions and the organisation’s stated values Respondents were asked ‘In general, how closely do you believe your fellow employees’ behaviour and decisions match the stated values?’23. Overall, there seems to be a reasonably close correlation between behaviour and the stated values. Only 12.4 % chose the two ‘Not closely’ options, and only 7.7% said that they had ‘never experienced any decision of behaviour not in line with’ those values. The vast majority chose the two options ‘Very closely’ (36.8%) and ‘Quite closely’ (40.4%).
An optimistic interpretation is that nearly half the respondents (44.5%) said that the values were adhered to more or less all the time (‘Extremely’ and ‘Very closely’); a pessimistic interpretation is that more than half (52.8%) said that decisions are likely to made, or behaviour is likely to be observed that is out of line with the organisation's stated values, at least occasionally.
There is a clear difference between the responses based on the level of the respondent in the organisation. 38% of managers felt that employees followed extremely/very closely in contrast to 68% of directors who were also significantly less likely to say that behaviour did not closely follow stated values24.
23 Question 12. 24 X2(5, N=892) = 50.905, p<.001. Cramer’s V = .239.
7.70%
36.80%
40.40%
9.10%
3.30%
2.70%
0.00% 10.00% 20.00% 30.00% 40.00% 50.00%
Extremely - I have never experienced any decision orbehaviour not fully in line with them
Very closely – it is rare to experience any decision or behaviour not in line with them
Quite closely – sometimes I experience decisions or behaviour not in line with them
Not that closely – I quite often experience decisions or behaviour not in line with them
Not closely at all – I frequently experience decisions or behaviour not in line with them
Don’t know/prefer not to say
Chart 12: How closely does employees' behaviour and decisions match the stated values?
44.5%
52.8%

© 2013 ILM & BITC Page 22 of 68
Values & ethics in management: Technical report
Around two-thirds of CEOs and Directors report that decisions and behaviour are ‘Extremely’ or ‘Very closely’ in line with the organisation’s values, whereas fewer than two in five Middle and First Line Managers do, and more FLM s describe the general behaviour and decision-making as being ‘Not that closely’ or ‘Not closely at all’ in line with them. This is reveals an emerging disconnect between the different levels of management around the awareness of the organisation’s values and ethical stance.
There is no significant variation, based on age or sex (there are small differences but these are not significant). However, managers working in smaller organisations are significantly more likely to say that employees’ behaviour and decisions are ‘Extremely’ or ‘Very closely’ aligned with the organisation’s stated values, whereas managers in larger organisations are more cautious, tending more towards saying they are ‘Quite closely’ aligned (see Chart 14)25.
25 X2(20, N=893) = 78.982, p<.001. Cramer’s V = .149.
0.00% 10.00% 20.00% 30.00% 40.00% 50.00% 60.00% 70.00% 80.00%
Manager
Director
Chart 13: How closely does employees' behaviour and decisions match the stated values? By seniority
Not that closely/Not closely at all Quite closely Extremely/very closely

© 2013 ILM & BITC Page 23 of 68
Values & ethics in management: Technical report
There are also obvious differences in the responses by sector, with managers in Private sector organisations being much more and significantly positive about the alignment of decisions and behaviour with the organisation’s stated values, with Public sector managers being the least confident (see Chart 15)26. There are many managers in the public sector who feel that the behaviour and decisions of many people in their organisations are not aligned with the statements of values and ethics. This may reflect behaviour of others, but equally the higher expectations of managers in the public sector.
26 X2(10, N=794) = 27.198, p<.002. Cramer’s V = .131.
0.00% 10.00% 20.00% 30.00% 40.00% 50.00% 60.00% 70.00%
<50
50-249
250-999
>999
Chart 14: How closely does employees' behaviour and decisions match the stated values? By size of organisation (number of employees)
Don’t know/prefer not to say Not that closely/Not closely at all Quite closely Extremely/very closely
0.00% 10.00% 20.00% 30.00% 40.00% 50.00% 60.00%
Private
Public
Third
Chart 15: How closely does employees' behaviour and decisions match the stated values? By sector
Don’t know/prefer not to say Not that closely/Not closely at all Quite closely Extremely/very closely

© 2013 ILM & BITC Page 24 of 68
Values & ethics in management: Technical report
B8 The personal importance of the organisation’s stated values being in line with your own values In response to the question ‘How important is it to you, personally, for the organisation’s stated values to be in line with your own personal values?’27 61.6% of respondents described it as ‘Very important’, and 31.6% as ‘Quite important’. 5% said it was ‘Neither important nor unimportant’, 0.9% ‘Quite unimportant’ and 0.6% ‘Very unimportant’.
The importance of this correspondence is significantly and positively associated with level; 81.8% of Directors said it was ‘Very important’, compared with 56.2% of Managers (see Chart 16)28. No directors and only a handful of managers said that it was unimportant.
Those in smaller organisations are significantly more likely to say it is very important and those in larger (250-999 employees) are significantly less likely to say so29. There were no significant differences by sector or by gender.
27 Question 13. 28 X2(5, N=871) = 62.250, p<.001. Cramer’s V = .267. 29 X2(20, N=872) = 36.138, p<.015. Cramer’s V = .102.
0.00% 10.00% 20.00% 30.00% 40.00% 50.00% 60.00% 70.00% 80.00% 90.00%
Manager
Director
Chart 16: The personal importance of personal and organisational values being aligned, by level
Don't know Very unimportant
Quite unimportant Neither important nor unimportant
Quite important Very important

© 2013 ILM & BITC Page 25 of 68
Values & ethics in management: Technical report
B9 Conflict between personal and organisational values
Respondents were asked ‘Have you ever felt any conflict between your own personal values and your organisation's stated values?’30. 41.1% said ‘No, never’ and 45.1% said ’Occasionally, but not any serious conflict’. However, 6.9% reported ‘Occasionally, sometimes serious conflict’, 3.0% said ‘Frequently, but not any serious conflict’ and 2.8% reported ‘Frequently, often serious conflict’.
There were some significant difference in the response of managers compared with directors; 38% of managers responded that they had never had any conflict, compared with 53% of Directors saying the same thing. Similarly, managers were significantly more likely, while directors were significantly less likely to reply that they had ‘occasionally but not serious’31.
30 Question 14. 31 X2(5, N=869) = 19.350, p<.002. Cramer’s V = .149.
0.00% 10.00% 20.00% 30.00% 40.00% 50.00% 60.00% 70.00% 80.00%
<50
50-249
250-999
>999
Chart 17: The importance of personal and organisational values being aligned, by organisation size (number of employees)
Neither important nor unimportant Quite important Very important

© 2013 ILM & BITC Page 26 of 68
Values & ethics in management: Technical report
Table 9: Conflict between personal and organisational values
Managers Directors No, never 38.0% 53.3% Occasionally, but not serious 47.5% 37.7% Occasionally, sometimes serious 7.7% 5.5% Frequently, but not serious 3.2% 0.7% Don’t know prefer not to say 3.0% 1.2%
Age and gender differences are not statistically significant and neither was organisation size. However, there were also a difference between sectors, with significantly higher proportion of managers in the Private sector choosing ‘No, never’, at 47.2%, compared to 36.8% for Public sector and respondents in the Public sector are also more likely to say that they had experienced frequent conflicts, both serious and not serious32. Again this may be due to greater problems in the Public sector or reflect different standards or expectations.
B10 Existence of implicit values where no statement of values or ethics Two-thirds (65.5%) of those saying there was no organisational statement of values or ethics said there were any implicit values33, with one in five (20.4%) saying there weren’t, and one in six (14.1%) not being able to say. The small sub-sample (206 respondents) makes analysis by any other characteristic difficult.
B11 The importance of implicit values being in line with personal values, where no statement of values or ethics exists
Those with no statement of values or ethics but with implicit organisational values answered this question34 (135 respondents), and for nearly all some alignment was important. 60% said it was ‘Very important’ and 36.3% said it was ‘Quite important’, which is much in line with the similar question about alignment between the stated
32 X2(10, N=784) = 22.143, p<.014. Cramer’s V = .119. 33 Question 17. 34 Question 18.

© 2013 ILM & BITC Page 27 of 68
Values & ethics in management: Technical report
vales and the person’ own (see B8). Directors were significantly more likely to say that it was very important for their organisation’s values to match their own, than managers who were significantly less likely to say so35.
B12 Conflict between implicit values and personal values, where no statement of values or ethics exists
Just over a quarter (27.6%) of the respondents answering this question36 (those without an organisational statement of values or ethics but with implicit values) said they had never experienced any conflict between their personal values and the implicit values of the organisation, and 47% said it had happened ‘Occasionally, but [was] not serious’, and 14.9% said ‘Occasionally, sometimes serious’. When compared with the same response in relation to an organisational statement of values or ethics, it shows that some conflict is slightly more likely to occur. Conversely those from organisations with stated values are significantly less likely to report occasional, sometimes serious conflict and significantly more likely to report that they have never experienced conflict between their own and their organisation’s values37.
Table 9: Conflict between personal and organisational stated and implicit values
Conflict between personal values and organisational values
Organisational statement of values/ethics
Implicit values only
No, never 41.1% 27.6% Occasionally, but not any serious conflict 45.1% 47.0% Occasionally, sometimes serious conflict 6.9% 14.9% Frequently, but not any serious conflict 3.0% 4.5% Frequently, often serious conflict 2.8% 6.0% Don’t know/prefer not to say 1.1% 0.0%
35 X2(2, N=133) = 17.288, p<.001. Cramer’s V = .361. 36 Question 19. 37 X2(10, N=1005) = 29.397, p<.001. Cramer’s V = .121.

© 2013 ILM & BITC Page 28 of 68
Values & ethics in management: Technical report
Section C Dealing with breaches of ethical standards
© 2013 ILM & BITC Page 29 of 68
Values & ethics in management: Technical report
C1 Reporting breaches of ethical standards
Over a quarter (28.8%) of respondents had reported breaches of ethical standards38, CEOs (22.2%) and NEDs (18.2% - but very small sample) being least likely to have done so. The other levels of management tended to be close to the average, 27.8% (FLM), 29.2% (MM) and 31.4% (ED); Senior Managers (33.2%) were the most likely to have reported an issue, although there were no statistically significant differences.
Younger people are less likely to say they have reported a breach of standards, with 23.6% of those under 35 saying they have, compared to 31.8% of 35-44 year olds, 29.7% of 45-54 year olds and 26.0% of those aged over 54 (these latter differences are not significant). Women are slightly less likely to say they have reported breaches (27.1% compared to 31.2% for men), but these differences are not significant.
Although there are variations based on size of organisation, none of these are significant. However, respondents in the Private sector are significantly less likely to say they have reported a breach (23.8%) compared to those in the Public sector at 36.5% (the likelihood in the Third sector is 30.1% which is not significantly different). We can conclude that managers in the public sector are 50% more likely to have reported a breach of ethical standards than those in the private sector. Is this due to higher standards, higher awareness, or more breaches?
Fewer respondents from organisations with explicitly stated ethics/values had reported an issue (29.0%) than those from organisations without (33.8%), although these differences were not statistically significant. The likelihood is that having a stated set of values makes it more likely that people adhere to ethical standards, whereas without one, it makes it hard for people to know what standards to work to, and more likely that managers will be concerned about behaviour they believe is unethical.
C2 The resolution of breaches of ethical standards More worryingly, little more than half those respondents who have reported a breach of ethical standards felt it was resolved satisfactorily39.
38 Question 15. 39 Question 16.

© 2013 ILM & BITC Page 30 of 68
Values & ethics in management: Technical report
Directors reported more successful resolutions to reported issues than managers (Chart 19), although these differences were not statistically significant, possibly due to the small number of directors responding to this question.
Similar problems exist with analysis by age; however, grouping (into three age bands and into two response options shows no differences at all). Similarly both men and women have no significant differences in their responses. Those responding from private sector organisations were significantly more likely to say that their reported issue was fully resolved (32.4%) and those from public sector organisations
0.00% 5.00% 10.00% 15.00% 20.00% 25.00% 30.00% 35.00% 40.00%
Fully
Reasonably well
Only Partially
Not at all
Don’t know/prefer not to say
Chart 18: To what extent do you feel that the issue was resolved satisfactorily?
0.00% 10.00% 20.00% 30.00% 40.00% 50.00% 60.00% 70.00% 80.00%
Manager
Director
Chart 19: To what extent do you feel that the issue was resolved satisfactorily? By level
Only partially/Not at all Fully/Reasonably well

© 2013 ILM & BITC Page 31 of 68
Values & ethics in management: Technical report
significantly less likely to say the same thing (13.4%)40. Those from private organisations are significantly less likely to say that their issue was ‘not at all’ resolved (10.8%) while those from third sector organisations were significantly more likely to say the same (30.2%). Broadly private organisations are associated with more positive resolutions compared to public and third sector organisations (chart 20).
Managers in organisations with stated values are significantly and much more likely to say that the issue they reported was fully resolved than those without statements, who were more likely to report that their issue was only partially or not at all resolved41.
40 X2(8, N=281) = 24.909, p<.002. Cramer’s V = .211. 41 X2(8, N=306) = 38.109, p<.001. Cramer’s V = .250
0.00% 10.00% 20.00% 30.00% 40.00% 50.00% 60.00% 70.00%
Private
Public
Third
Chart 20: To what extent do you feel that the issue was resolved satisfactorily? By sector
Only partially/Not at all Fully/Reasonably well

© 2013 ILM & BITC Page 32 of 68
Values & ethics in management: Technical report
C3 Confidence in reporting ethical breaches
All respondents were asked ‘How confident are you about being able to report an issue where you felt your organisation’s ethical standards had been breached?’42. Three-quarters responded positively, 41.8% were ‘Fully confident’ and 33.5% were ‘Quite confident it would be dealt with appropriately’. Nevertheless, one in six (15.8%) said they were not very confident and a small but significant minority (6.5%) were not at all confident (with 2.3% saying ‘Don’t know/prefer not to say’).
However, there are significant differences between managers at different levels (see Chart 22). Board level managers (perhaps unsurprisingly) report very much higher levels of confidence than managers at other levels. The 79.6% ‘Fully confident’ response rate for CEOs and 67.5% for executive directors are significantly higher and compares to only 27.1% for first line managers and 35.6% for middle managers, both of which are significantly lower43. Overall those at director level are significantly more likely to be ‘fully confident’ and significantly less likely to be ‘quite, or not very, or not at all confident’ and this is the opposite to those at manager level44. A similar pattern exists with men and women; 47.6% of male respondents report themselves to be ‘Fully confident’ compared with only 35.1% of women, a significant difference45. Although
42 Question 20. 43 X2(20, N=1064) = 156.709, p<.001. Cramer’s V = .192. 44 X2(4, N=1064) = 119.839, p<.001. Cramer’s V = .336. 45 X2(8, N=1022) = 22.642, p<.004. Cramer’s V = .105
0.00% 5.00% 10.00% 15.00% 20.00% 25.00% 30.00% 35.00% 40.00% 45.00%
Fully
Reasonably well
Only Partially
Not at all
Don’t know/prefer not to say
Chart 21: To what extent do you feel that the issue was resolved satisfactorily? By whether the organisation has stated values
No stated values Stated values

© 2013 ILM & BITC Page 33 of 68
Values & ethics in management: Technical report
when the top options (‘Fully confident’ and ‘Quite confident’) are aggregated, the gap narrows (73.5% for women, 77.0% for men) and is no longer significant. Although there are slightly more women than men FLMs, this difference doesn’t account for the difference in levels.
There are equally clear differences between respondents working in different size of organisation. Those in small organisations being significantly far more confident about being able to report a breach of ethical standards than those in organisations with more than 250 employees who were significantly less likely to be fully confident. Those from small organisations were also significantly less likely to be ‘not at all confident’ than those from organisations with 250-999 employees46.
46 X2(16, N=1066) = 56.604, p<.001. Cramer’s V = .115.
0.00% 10.00% 20.00% 30.00% 40.00% 50.00% 60.00% 70.00% 80.00% 90.00%
FLM
MM
SM
ED
CEO
NED
Chart 22: Confidence about being able to report a breach of ethical standards, by level
Not at all confident Not very confident Quite confident Fully confident

© 2013 ILM & BITC Page 34 of 68
Values & ethics in management: Technical report
Analysis by sector (Chart 24) shows that managers and directors in the private sector are significantly more confident, with 54.7% saying they are fully confident about reporting breaches of ethical standards, than those in the public sector (27.6%), although not statistically significantly different those in the third sector were somewhere between the two (at 38.5%)47.
Finally, on this question, the existence of a statement of values significantly increases the likelihood that managers will feel fully confident about reporting breaches of ethical
47 X2(8, N=957) = 65.066, p<.001. Cramer’s V = .184.
0.00% 10.00% 20.00% 30.00% 40.00% 50.00% 60.00% 70.00%
<50
50-249
250-999
>999
Chart 23: Confidence about being able to report a breach of ethical standards, by size of organisation
Not at all confident Not very confident Quite confident Fully confident
0.00% 10.00% 20.00% 30.00% 40.00% 50.00% 60.00%
Private
Public
Third
Chart 24: Confidence about being able to report a breach of ethical standards, by sector
Not at all confident Not very confident Quite confident Fully confident

© 2013 ILM & BITC Page 35 of 68
Values & ethics in management: Technical report
standards48. 44.2% of managers and directors in organisations with statements of values or ethics are ‘Fully confident’ and 34.6% are ‘Quite confident’ about reporting and issue, compared to 33.3% and 28.7% respectively of respondents in organisations without statements of values or ethics.
C4 Perceptions of negative consequences for reporting ethical breaches Less than three-quarters (72.4%) of respondents were reasonably confident there would be no negative consequences if they reported any ethical breaches49. 15.3% were definite that they would experience negative consequences, and 12.3% either didn’t know or preferred not to say.
There is a very clear pattern, based on level, with the more junior managers being significantly less positive than directors about the likely consequences50.
48 X2(8, N=1056) = 40.779, p<.001. Cramer’s V = .139. 49 Question 21. 50 X2(2, N=1064) = 30.030, p<.001. Cramer’s V = .168.
0.00% 5.00% 10.00% 15.00% 20.00% 25.00% 30.00% 35.00% 40.00% 45.00% 50.00%
Stated values
No stated values
Chart 25: Confidence in reporting a breach of ethical standards, by whether the organisation has a statement of values/ethics
Not at all confident Not very confident Quite confident Fully confident

© 2013 ILM & BITC Page 36 of 68
Values & ethics in management: Technical report
Women also seem less confident about the likely consequences, with only 68.8% of female respondents choosing 'No, probably' to the question, significantly fewer compared with 76.3% of men. There was no significant difference in choosing 'Yes, definitely' (14.9% of women compared with 15.7% of men), but women were significantly more likely to express uncertainty, with 16.3% saying 'Don't know/Prefer not to say' (men 8.0%)51.
It is also clear that managers and directors in larger organisations (250-999 employees) feel significantly less certain that reports of ethical breaches will be dealt with positively, 23.5% were certain of negative consequences while 58% replied ‘no’. In contrast 82.6% of respondents in organisations with fewer than 50 employees thought there probably wouldn’t be any negative consequences, only 8.3% said 'Yes, definitely' there will be, which is significantly more positive52.
51 X2(4, N=1022) = 17.708, p<.001. Cramer’s V = .093. 52 X2(8, N=1066) = 32.227, p<.001. Cramer’s V = .123.
0.00% 10.00% 20.00% 30.00% 40.00% 50.00% 60.00% 70.00% 80.00% 90.00% 100.00%
Managers
Directors
Chart 26: Do you think you would experience negative consequences if you reported an issue where you felt ethical standards had been breached? By level
Not sure No, probably not Yes definitely

© 2013 ILM & BITC Page 37 of 68
Values & ethics in management: Technical report
Managers and directors in public sector organisations are most likely to express certainty of negative consequences (20.4%) or doubt (15.5%) and least likely to respond ‘no, probably not’ (64.1%). Their views are significantly different from those in the private sector who are the most positive, only 9.7% were sure of negative consequences, 8.2% didn’t know and 82.2% thought that there probably wouldn’t53. The numbers of third sector respondents is too low to reveal statistically significant differences but their responses place them between the two other sectors (16.1% yes and 11.2% not sure and 72.7% thought there probably wouldn’t be negative consequences).
53 X2(4, N=957) = 34.545, p<.001. Cramer’s V = .134.
0.00% 10.00% 20.00% 30.00% 40.00% 50.00% 60.00% 70.00% 80.00% 90.00%
<50
50-249
250-999
>999
Chart 26: Do you think you would experience negative consequences if you reported an issue where you felt ethical standards had been breached? By organisation size
Don’t know/prefer not to say No Yes

© 2013 ILM & BITC Page 38 of 68
Values & ethics in management: Technical report
The organisation having a statement of values and ethics is also significantly associated with managers and directors having a more optimistic outlook on the consequences of reporting breaches of ethical standards, compared to those without one54.
Finally, there is a clear and significant link between respondents’ confidence about reporting ethical breaches (Q.20) and their perceptions of facing negative
54 X2(4, N=1056) = 13.831, p<.008. Cramer’s V = .081.
0.00% 10.00% 20.00% 30.00% 40.00% 50.00% 60.00% 70.00% 80.00% 90.00%
Private
Public
Third
Chart 27: Do you think you would experience negative consequences if you reported an issue where you felt ethical standards had been breached? By sector
Don’t know/prefer not to say No, probably not Yes, definitely
0.00% 10.00% 20.00% 30.00% 40.00% 50.00% 60.00% 70.00% 80.00%
Yes, definitely
No, probably not
Don’t know/prefer not to say
Chart 28: Do you think you would experience negative consequences if you reported an issues where you felt ethical standards had been breached? By whether the organisation has a statement of values/ethics
No stated values Stated values

© 2013 ILM & BITC Page 39 of 68
Values & ethics in management: Technical report
consequences if they do (chart 29)55. As might be expected, very few people who are confident about reporting an issue expect there to be negative consequences, whereas those who are not at all confident are very pessimistic about the consequences if they do. It is likely that it is the latter (the expectation of negative consequences) that creates the lack of confidence in reporting issues.
C5 Perceptions of ethical standards over time Respondents were asked to rate their agreement or disagreement with three statements regarding values/ ethics overtime:
• Over the last few years many organisations’ ethical standards have fallen
• Over the last few years the public’s expectations of organisations’ ethical behaviour have risen
• Over the last few years people have become more aware of organisations’ ethical behaviour56
The table below shows that over a third agree or strongly agree that many organisations’ ethical standards have fallen – although most are neutral or disagree, so that overall there is only 5.8% net agreement. In contrast respondents perceptions that public expectation and awareness of organisations’ ethical behaviour have risen is
55 X2(8, N=1069) = 502.703, p<.001. Cramer’s V = .485. 56 Question 22.
0.00% 10.00% 20.00% 30.00% 40.00% 50.00% 60.00%
Fully confident
Quite confident
Not very confident
Not at all confident
Chart 29: Do you think you would experience negative consequences if you reported an issues where you felt ethical standards had been breached? By confidence in reporting an issue
Don't know/prefer not to say (-ve consequences) No, probably not (-ve consequences)
Yes, definitely (-ve consequences)

© 2013 ILM & BITC Page 40 of 68
Values & ethics in management: Technical report
much more definite – over three quarters of respondents agree, of which more than a quarter strongly agree.
Table 10: ‘Perceptions of ethical standards over time
‘Over the last few years…
Response
Strongly agree
Agree Neither Disagree Strongly disagree
Don’t know
…many organisations’ ethical standards have fallen
7.5% 27.9% 28.8% 22.6% 7.0% 6.2%
…the public’s expectations of organisations’ ethical behaviour have risen
25.3% 51.7% 12.3% 6.8% 2.8% 1.1%
…people have become more aware of organisations’ ethical behaviour
25.8% 59.7% 9.4% 2.5% 1.5% 1.0%
There are a few notable differences in opinion by level, directors are significantly more likely to strongly disagree and managers less likely to disagree that organisations’ standards have fallen, although the level of association is very low57. The same pattern is evident by gender; women are less likely to strongly disagree than men who are more likely to strongly disagree58. There were few significant differences by sector other than that those in the public sector were significantly more likely to strongly agree and those in the private sector more likely to strongly disagree59. In terms of public expectation and awareness, directors are significantly more likely to strongly agree and managers significantly less likely to strongly agree that both are rising60.
57 X2(5, N=1048) = 12.448, p<.029. Cramer’s V: .109. Cramer’s V = .109. 58 X2(10, N=1006) = 23.162, p<.010. Cramer’s V: .107. Cramer’s V = .107. 59 X2(10, N=1006) = 27.085, p<.003. Cramer’s V: .119. Cramer’s V = .119. 60 Expectation X2(5, N=1048) = 30.036, p<.001. Cramer’s V = .169. Awareness X2(5, N=1048) = 13.845, p<.017. Cramer’s V = .115.

© 2013 ILM & BITC Page 41 of 68
Values & ethics in management: Technical report
Section D Experience of values and ethics at work
© 2013 ILM & BITC Page 42 of 68
Values & ethics in management: Technical report
D1 Expectation to behave contrary to own values or ethical standards
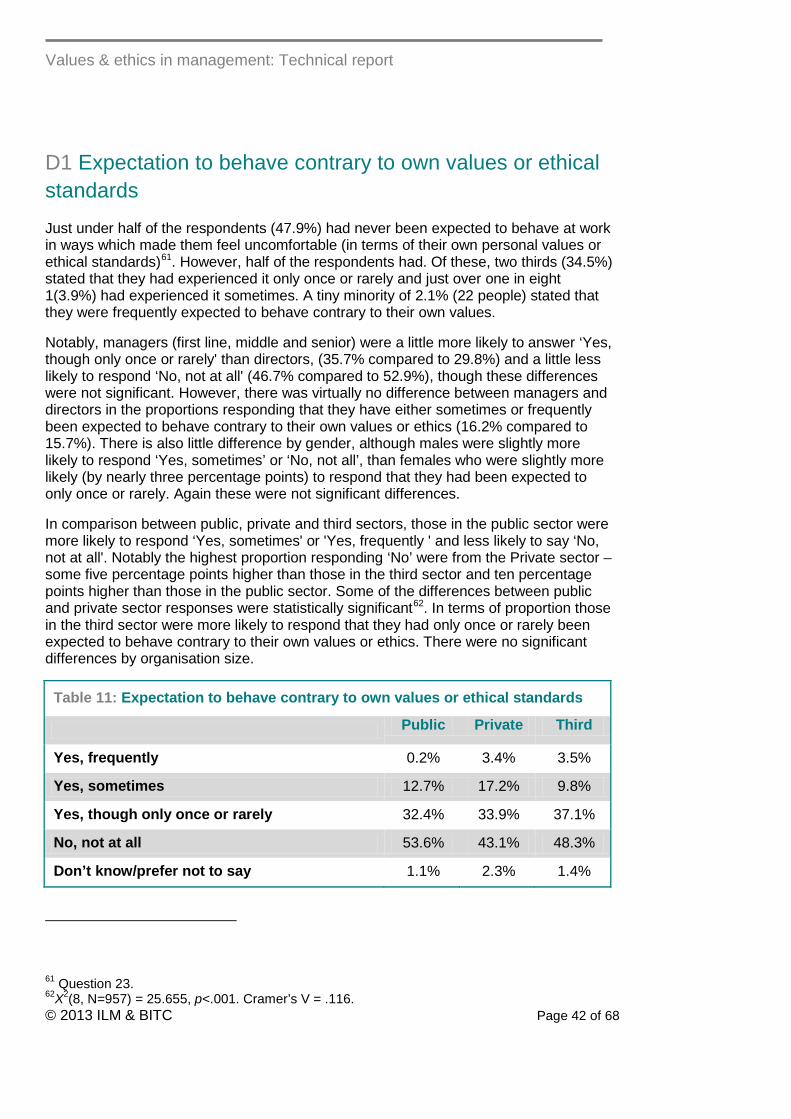
Just under half of the respondents (47.9%) had never been expected to behave at work in ways which made them feel uncomfortable (in terms of their own personal values or ethical standards)61. However, half of the respondents had. Of these, two thirds (34.5%) stated that they had experienced it only once or rarely and just over one in eight 1(3.9%) had experienced it sometimes. A tiny minority of 2.1% (22 people) stated that they were frequently expected to behave contrary to their own values.
Notably, managers (first line, middle and senior) were a little more likely to answer ‘Yes, though only once or rarely' than directors, (35.7% compared to 29.8%) and a little less likely to respond ‘No, not at all' (46.7% compared to 52.9%), though these differences were not significant. However, there was virtually no difference between managers and directors in the proportions responding that they have either sometimes or frequently been expected to behave contrary to their own values or ethics (16.2% compared to 15.7%). There is also little difference by gender, although males were slightly more likely to respond ‘Yes, sometimes’ or ‘No, not all’, than females who were slightly more likely (by nearly three percentage points) to respond that they had been expected to only once or rarely. Again these were not significant differences.
In comparison between public, private and third sectors, those in the public sector were more likely to respond ‘Yes, sometimes' or 'Yes, frequently ' and less likely to say ‘No, not at all'. Notably the highest proportion responding ‘No’ were from the Private sector – some five percentage points higher than those in the third sector and ten percentage points higher than those in the public sector. Some of the differences between public and private sector responses were statistically significant62. In terms of proportion those in the third sector were more likely to respond that they had only once or rarely been expected to behave contrary to their own values or ethics. There were no significant differences by organisation size.
Table 11: Expectation to behave contrary to own values or ethical standards
Public Private Third
Yes, frequently 0.2% 3.4% 3.5%
Yes, sometimes 12.7% 17.2% 9.8%
Yes, though only once or rarely 32.4% 33.9% 37.1%
No, not at all 53.6% 43.1% 48.3%
Don’t know/prefer not to say 1.1% 2.3% 1.4%
61 Question 23. 62X2(8, N=957) = 25.655, p<.001. Cramer’s V = .116.

© 2013 ILM & BITC Page 43 of 68
Values & ethics in management: Technical report
Interestingly, respondents from organisations which had clearly stated values were slightly less likely (but not significantly) to state that they had been expected to behave contrary to their own values (by around two percentage points). The difference is stronger compared to the responses of those from organisations with no clear statement of values.
D2 Direct requests to do things which feel or are wrong Just under two thirds (62.6%) had, at some point in their career, been directly asked to do something which they felt was against their own personal values, compared to slightly more than a quarter – 28.8% who hadn’t. The proportion who had been directly asked to do something that was against their organisation’s values was much lower (but still considerable) at 43.1%, though more (46.8%) replied that they hadn’t. been asked to do so Nearly three quarters (73.4%) had never been directly asked to break specific industry regulations – though nearly a fifth (18.8%) had. Four fifths (80.1%) had never been asked to break the law, though a small minority of 42 people (8.5%) stated that they had done so63.
63 Question 24.
0.00% 10.00% 20.00% 30.00% 40.00% 50.00% 60.00%
Yes, frequently
Yes, sometimes
Yes, though only once or rarely
No, not at all
Don’t know/prefer not to say
Chart 30: Expectation to behave unethically, by whether or not organisations has stated values
Don’t know/prefer not to say No Yes

© 2013 ILM & BITC Page 44 of 68
Values & ethics in management: Technical report
Examples of comments made by respondents:
• Colluding and fudging figures to get more bonuses • General Managers and Directors in one company putting in expense claims
for 'ladies of the night' during drunken conferences • Asked to dismiss a person because of their size and weight which did not
fit the 'image' of the customer facing staff • I used to work for somebody who expected me to report misleading figures
for delivery in order to maintain his bonus • Double counting revenues and allowing a bully to dismiss people at will at
very high financial cost on 3 occasions • Asked (by a client) to invoice in such a way that tax laws would have been
broken
For all of these questions, the ‘Yes’ responses from the directors were generally five to ten percentage points higher than those from managers (though the numbers for some categories are small). None of these differences were significant with the exception of being asked to break the law where directors were significantly more likely to respond ‘yes’64. While it cannot be proved from this data alone, it is plausible that this is related
64 X2(2, N=501) = 12.151, p<.002. Cramer’s V = .156.
0 10 20 30 40 50 60 70 80 90
Was against your own personal values?
Was against the organisation's values?
Broke specific industry regulations?
Broke the law?
Chart 31: Direct requests to do things which feel or are wrong, by nature of request
Not sure /Prefer not to say No Yes

© 2013 ILM & BITC Page 45 of 68
Values & ethics in management: Technical report
to the greater number of years that directors typically would have worked so far in comparison to managers. Directors therefore, will have had more years in which to have been asked to do something wrong.
Table 12: Direct requests to do things which feel or are wrong, by level (grouped)
Was against your own personal
values?
Was against the organisation's
values?
Broke specific industry
regulations? Broke the law?
Mgrs Dirs Mgrs Dirs Mgrs Dirs Mgrs Dirs
Yes 60.59% 69.52% 41.15% 51.46% 17.84% 19.61% 6.78% 15.53%
No 30.05% 24.76% 47.38% 43.69% 73.37% 76.47% 80.15%
79.61%
Not sure/Prefer not to say
9.36% 5.71% 11.47% 4.85% 8.79% 3.92% 13.07% 4.85%
There is little difference in responses between broad sectors with one exception. Those from public sector organisations are more likely to respond that they have been directly asked to do something against their organisation’s values (47.5%) compared to those from the private sector (39.8%). Although this is not significant.
There appears to be a slight pattern between the responses stating they have been directly asked to do something against their organisation’s values, and responses agreeing with the statement that ‘Over the last few years many organisations’ ethical standards have fallen’. Those agreeing or strongly agreeing with the latter have tended to replied ‘Yes’ to the former; those disagreeing/strongly disagreeing or replying neither have tended to respond ‘No’ to the former, although this isn’t statistically significant.
In terms of differences by gender, while not significant, for each of these questions female respondents were less likely to say ‘Yes’ and more likely to say ‘No’ than their male counterparts. These differences varied from a couple of percentage points to ten or more.
Survey respondents were asked if any instances of having to behave unethically had caused them to either resign or consider resigning65. Three quarters replied that they hadn’t. However, of that remaining quarter 16.0% had seriously considered resigning and nearly ten percent (9.7%) had subsequently resigned. Those from organisations with clearly stated values were slightly (up to three percentage points) less likely to
65 Question 25.

© 2013 ILM & BITC Page 46 of 68
Values & ethics in management: Technical report
resign or and significantly less likely to seriously consider it, compared to those from organisations without stated values66. There were no significant differences by gender, but directors were significantly more likely to have resigned over and ethical issue than managers67. Again this may be a result of longer careers to date and therefore increased likelihood for this to occur.
D3 Prioritising different ethical approaches Respondents were asked to choose between pairings of three statements:
• ‘I always try to do the right thing’ • ‘I always try to achieve the right outcome’ • ‘I will always follow the rules governing what I should do’68
Just over half (53.8%) preferred doing the right thing to either achieving the right outcome (19.5%) or following the rules (19.1%). This preferred ethical stance is known as ‘virtue ethics’ and originated with Aristotle; however by deciding on a course of action based on our beliefs about what is right we can often be faced with conflicts between alternative moral obligations. Achieving the right outcomes – ‘consequentialism’ – shifts the emphasis of the ethical decision from the rightness or wrongness of the action to the rightness or wrongness of the consequences Rule compliance may be seen as avoiding making moral judgements, but it has strong validity as an ethical stance, as it places the duty on the individual to obey by the values agreed by society generally, as enshrined in law and regulations.
No one ethical stance is inherently better than another, but most people tend towards ‘doing the right thing’ as a preferred choice, as in the survey.
While just over half of all respondents prioritised doing the right thing directors were significantly more likely than managers to prioritise achieving the right outcome and less likely to follow the rules. Managers followed the opposite pattern and were significantly more likely to prioritise following the rules than achieving the right outcome69.
66 X2(4, N=1002) = 20.949, p<.001. Cramer’s V = .102. 67 X2(2, N=1008) = 10.374, p<.006. Cramer’s V = .101. 68 Question 26. 69 X2(3, N=1013) = 13.931, p<.003. Cramer’s V = .117.

© 2013 ILM & BITC Page 47 of 68
Values & ethics in management: Technical report
D4 Hypothetical ethical dilemmas The survey presented five hypothetical situations of increasing ethical gravity:
1. A junior member of staff using the photocopier to copy material for use by a local charity, without permission
2. A colleague claiming mileage for a trip when you have a strong suspicion they were given a lift by someone else who is also claiming expenses
3. A colleague deciding not to report a minor infringement of regulations that apply because ‘The last time it was reported the regulator decided to take no action’
4. A more senior colleague accepting an invitation from a major supplier to a prestigious sporting event in Paris, with travel and accommodation paid for, and not declaring it as required by the organisation’s anti-bribery and corruption rules
5. A member of the organisation’s senior management telling one of their reports to make a fairly significant purchase from a market-leading supplier, where their spouse is in a senior position, without going out to tender70
In each they could choose one of the following responses:
• Do nothing • Warn them that what they are doing is wrong and not to repeat it • Warn them that what they are doing is wrong and they should rectify the
situation urgently • Report the incident to a responsible person or compliance officer
Table 13: Responding to ethical dilemmas
Photo-copying Mileage Rule-
breaking Corporate hospitality Purchase
Do nothing 26.9% 3.4% 3.3% 6.2% 4.5%
Warn them not to repeat it 55.3% 18.3% 15.0% 5.2% 3.3%
Warn them to rectify the situation urgently 15.2% 55.1% 49.0% 33.2% 23.9%
Report the incident 3.0% 23.2% 32.6% 55.4% 68.2%
70 Question 27.

© 2013 ILM & BITC Page 48 of 68
Values & ethics in management: Technical report
Broadly, as the seriousness increases with each hypothetical situation the proportion of those choosing the most serious response increases. For the first situation just over a quarter would do nothing, while the most preferred option is to warn not to repeat it. Clearly the scale of wrongdoing (making photocopies which are not for business purposes without permission) and its mitigating circumstances (for a charity) lead most to treat it as a minor ethical problem – although it is stealing the organisation’s resources. This acceptance demonstrates the extent to which people will apply their personal values to an ethical problem.
For the subsequent situations the percentage who would do nothing drops significantly; these are all clearly seen as situations where turning a blind eye is not acceptable to most people. By contrast, the number adopting the most serious option – reporting the incident – increases as the seriousness of the unethical behaviour increases. All in all, the responses to these five ethical dilemmas reinforces the strong tendency towards ‘values ethics’ (do the right thing), as respondents prefer to use their own ethical judgements about the rightness of the situation when choosing a course of action.
D5 Rating own ethical standards in comparison to others Respondents were asked to rate relative levels of ethical standards on a sematic differential-type scale between pairings of:
• Their own ethical standards • Those of most of society • Those of the organisation they work for71
71 Question 28.

© 2013 ILM & BITC Page 49 of 68
Values & ethics in management: Technical report
Table 14: Relative comparisons of ethical standards
I feel my own ethical standards are higher than those of many members of the general public
< > I feel most of society has higher ethical
standards than I do
14.7% 16.7% 30.5% 18.3% 18.3% 0.6% 0.6% 0.0% 0.3%
I feel my own ethical standards are higher than those of the organisation I work for < >
I feel the organisation I work for has higher ethical standards than I do
6.6% 8.8% 16.8% 21.0% 41.7% 3.6% 1.0% 0.1% 0.3%
I feel the organisation I work for has higher ethical standards than most of society
< > I feel most of society has higher ethical
standards than the organisation I work for
8.3% 11.7% 23.1% 22.8% 24.6% 5.2% 3.2% 0.6% 0.6%
The chart below illustrates the first set of data more clearly – there is a strong presumption that respondents’ own ethical standards are higher than that of the rest of society.
0.00%
5.00%
10.00%
15.00%
20.00%
25.00%
30.00%
35.00%
i <<< << < <> > >> >>> ii
Chart 32: i. 'I feel my own ethical standards are higher than many members of the general public' Vs ii. 'I feel most of society has higher ethical standards than I do'

© 2013 ILM & BITC Page 50 of 68
Values & ethics in management: Technical report
A much less marked skewness appears in this second chart, comparing respondents own and their organisation’s ethical standards. Although still perceiving themselves, generally as having higher standards than the organisation, a significant minority (41.7%) selected the central option, meaning that they saw them as being the same.
The final chart confirms the pattern with organisational ethic standards being seen as higher than those of the wider society, but in a less extreme way as the first, confirming the respondents’’ hierarchy of ethical standards:
1. Own ethical standards
2. Organisational ethical standards
3. General public’s ethical standards
0.00%5.00%
10.00%15.00%20.00%25.00%30.00%35.00%40.00%45.00%
i <<< << < <> > >> >>> ii
Chart 33: i. 'I feel my own ethical standards are higher than those of the organisation I work for' Vs ii. 'I feel the organisation I work for has higher ethical standards than I do'

© 2013 ILM & BITC Page 51 of 68
Values & ethics in management: Technical report
D5 Places where organisational values are discussed Respondents were asked where organisational values were highlighted/ discussed in their organisation72. The staff handbook/ intranet was most common (73.5%), followed by employee induction (70.1%). This was followed by their organisation’s website (59.1%) and just slightly less commonly as part of the appraisal/ performance management system (58.4%). Finally 6.9% stated that they didn’t know.
72 Question 29.
0.00%
5.00%
10.00%
15.00%
20.00%
25.00%
30.00%
i <<< << < <> > >> >>> ii
Chart 34: i. 'I feel the organisation I work for has higher ethical standards than most of society Vs ii. I feel most of society has higher ethical standards than the organisation I work for'

© 2013 ILM & BITC Page 52 of 68
Values & ethics in management: Technical report
D6 Awareness of unethical behaviour amongst different groups Respondents were asked if there had been any instances since 2008 of unethical behaviour (and whether such instances were frequent, occasional, rare, or had never happened) by any of the following:
• Direct reports • Peers (managers at the same level) • Immediate superior • CEO • Other parts of the organisation73
73 Question 30.
0.00% 20.00% 40.00% 60.00% 80.00%
On your organisation's website
On your organisation's intranet/staff handbook
As part of employee induction
As part of the appraisal/performance managementsystem
Don't know
Chart 35: Where are organisational values displayed/discussed?

© 2013 ILM & BITC Page 53 of 68
Values & ethics in management: Technical report
Table 15: Awareness of unethical behaviour
Frequently Occasion-ally Rarely Never
Your direct reports 1.4% 11.6% 33.2% 53.7%
Your peers (managers at the same level) 3.2% 18.1% 33.3% 45.4%
Your immediate superior 4.9% 15.4% 17.4% 62.2%
The CEO/Executive Officers (if applicable) 5.2% 13.9% 20.8% 60.1%
Other parts of my organisation 4.3% 21.8% 35.9% 38.0%
The percentages of frequent instances were small but increase with seniority (from 1.4% for direct reports to 5.2% for CEOs). Peers and other parts of the organisation seem to be less trusted than direct reports or immediate superior. Over half (53.7%) of respondents stated that their direct reports had never engaged in unethical behaviour (since 2008) and immediate superiors scored even higher with 62.2% as did CEO/Executive Officers at 60.1%. There were differences by level (table 15) some of which were significant. Directors were significantly more likely than managers to say that their peers never engaged in unethical behaviour and were significantly less likely to say that their peers occasionally were unethical74. The same pattern is true regarding awareness of unethical behaviour by an immediate superior75 and by the CEO or executive officers76 and by other parts of each respondent’s organisation77.
74 X2(3, N=968) = 16.922, p<.001. Cramer’s V = .132. 75 X2(3, N=968) = 12.978, p<.005. Cramer’s V = .116. 76 X2(3, N=968) = 20.803, p<.001. Cramer’s V = .147. 77 X2(3, N=968) = 9.923, p<.019. Cramer’s V = .101.

© 2013 ILM & BITC Page 54 of 68
Values & ethics in management: Technical report
Table 16: Awareness of unethical behaviour, by level
Frequently Occasionally Rarely Never
Mgrs Dirs Mgrs Dirs Mgrs Dirs Mgrs Dirs
Your direct reports 1.3% 1.8% 12.4% 9.0% 33.3% 33.0% 52.9% 56.1%
Your peers 3.3% 2.7% 20.3% 10.9% 34.3% 30.3% 42.0% 56.1%
Your immediate superior
5.4% 3.6% 17.0% 10.4% 18.5% 13.6% 59.2% 72.4%
CEO/ executive officers
5.2% 5.4% 15.8% 7.7% 22.6% 14.5% 56.4% 72.4%
Other parts of my organisation
4.8% 2.7% 23.6% 16.3% 35.9% 35.7% 35.7% 45.2%
There were no significant differences by gender. However, there were some significant differences by organisation size. Respondents from small organisations were significantly more positive about the lack of unethical behaviour amongst the CEO/ executive officers78, the respondents’ peers79 and in other parts of their organisation80 compared to larger organisations. This finding is consistent with the increased familiarity between all staff in smaller organisations compared to organisations with more employees. There were almost no significant differences associated with an organisation having stated ethics/values or not.
D7 Specific situations or problems relating to values or ethics encountered at work Respondents were asked if there were any examples which they would be prepared to outline to us81. Responses included: • Chosen individuals being protected by management for serious breaches whilst other staff are
78 X2(12, N=970) = 25.048, p<.015. Cramer’s V = .093. 79 X2(12, N=970) = 32.554, p<.001. Cramer’s V = .106. 80 X2(12, N=970) = 54.122, p<.001. Cramer’s V = .136. 81 Question 31.

© 2013 ILM & BITC Page 55 of 68
Values & ethics in management: Technical report
seriously disciplined for minor infringements. • Immoral relationship between employees within and out of the team of the same institution, affects
the values and blocks fairness in promotions. • A CEO who started a rival business and took two executives with him. This person had written his
own contract as we were a new business and didn't write a clause in it not to go to a rival for so many years, he also took clients to the new business and we couldn't sue.
• A colleague who ran recruitment for his department misusing a 'refer a friend' scheme which paid £500 for each new recruit in order to supplement his income.
• A colleague had a relationship with a student. • A colleague of mine at the same level opened his own cafe bar and the most time of the day is
working for his personal business and not for the company. • A number of situations where profit is put before living by our values. Not in a way that would be in
any sense contrary to the law, health and/or safety, but shoddy all the same. • A Report of mine used the BLACK word within my hearing, meant as an insult to whom he was
talking. I called him over and immediately dismissed him, which by his learning he accepted and left the premises without incident but after first giving a full apology to the individual he had insulted. After three days he was contacted and agreed and was sent on a diversity course and has now been fully reinstated. He has definitely learnt his lesson.
• An estates manager is a majority share holder in a building maintenance company and that company is used by the service.
• At a recent job interview I was asked to conduct what I considered as unethical practices against a third party by this company. I believed they were serious and not testing my morals. I did not do what they asked and they never offered me a position.
• Backstabbing of peers. Senior staff making less senior staff feel worthless. • Bigotry is a personal matter. There have been occasions where the 'bigger' person places pressure
on the 'softer' staff and dictates their values. Despite the education on this matter being widely available, there will always exist an element of people who have low standards. It is the duty of professional "Company" personnel to ensure that firstly they are not recruited and secondly to highlight the consequences on the error of their ways.
• Blatant disregard to equal opportunities procedures in recruitment practices especially those of sessional staff. In one very recent case overturning a decision arrived through thorough observation of equal opportunities policy: taking away top 2 candidates which were flagged as most suitable after careful assessment against the job spec. They were deployed elsewhere and I know that knives will be sharpened if my current new recruits slip up. This is symptomatic of a culture which surreptitiously brings in relatives and friends to create an inner, impenetrable 'yes man' circle. This stifles creativity, healthy differences of opinion and leads to a culture of fear and intimidation effectively masked by a misguided illusion of 'family love' and 'shared values leading to unwavering commitment to the client group'. Done by enough people across the board consistently and exuberantly it can lull the most hard-nosed cynic into a false sense of love and security. Relatively open discussions on sensitive issues with regards to the client group as opposed to regular, structured, professional supervision sessions display a lack of respect towards them. Lack of communication and relationship skills displayed by many senior managers only serve to confirm some of their prejudices which do not provide enough evidence to be challenged effectively

© 2013 ILM & BITC Page 56 of 68
Values & ethics in management: Technical report
through formal procedures but which do constitute unprofessional behaviour. • Bullying (by managers) is a current issue - linked to the peoples general fears over job
security/economic climate. The global/local recession has also allowed the organisation to exploit current and potential employees.
• Bullying and failure to deal with bullying. Lying about reasons for staff absence - e.g. staff off with stress post bullying and telling everyone it was flu (their manager doing that).
• Bullying and harassment Welsh/English. • Bullying by the acting manager of the department, leading to two official grievances being lodged.
One was a physical assault requiring medical attention; the other was an instance of a (Muslim) woman being slandered as a 'slut' when she has no blemish on her character. Management has been made aware of the bullying in general and the specific grievances but has swept everything under the carpet. The stated company values include professionalism, 'Personal accountability', 'Teamwork', 'Integrity', 'Innovation' and 'Respect'. Of these six, five have been comprehensively trashed.
• Chief Executive was a bully. It was known by group CEO and the Board but they chose not to take action. She removed people from positions or even the organisation in an unfair manner. She applied pressure on senior managers to set them against each other. Compromise agreements were quite common to cope with those she forced out. No action ever taken about her behaviour possibly due to her very close relationship with the group CEO.
• Conflict between level of support people need and the cost of support bosses are prepared to pay. • Cost cutting drives people into corners that we might otherwise choose not to be. • Culture of bullying in the organisation that is not dealt with and just seems to be accepted by the
senior managers • Culture of targets and data manipulation. • Cutting patient services whilst ensuring executives have all they want / need. Putting the interests
of the board above the interests of patients & staff. Not being on board with the ethos of the NHS. Disingenuous consultation - consultation for consultation sake and ignoring responses to push ahead with their own agenda.
• Discrimination. • Drinking alcohol while working. • Examples of unethical behaviours that come to mind are not so much with business practices but
with management practices - e.g. managers claiming credit for work done by someone else in their team, managers giving preferential treatment to staff on the basis of personal relationship, manipulation/misrepresentation of budget information for departmental gain (rather than personal gain).
• False and misleading statements to the government and reporting of false and misleading statements to the internal stake holders and the public. I couldn't spend $50M on this project but to date they have blown $70M and counting. The project should have taken roughly 12 months and has been going (over 2 years) 776 days as of today with at least 8 months to go at the present rate of undertakings.
• For me it comes down to defining words, integrity and honesty are 2 words used in organisation I work for, for some these are same thing for others it is different. Organisation does not define these words which I believe can lead to skewed decisions.

© 2013 ILM & BITC Page 57 of 68
Values & ethics in management: Technical report
• Following policies and procedures when staff behave unethically is not always straightforward or practised.
• Fudging professional boundaries between staff/customers and staff/staff. • How to challenge inappropriate travel/accommodation choices by own line manager without
suffering any consequences. • I am active in management of a number of different (but closely related) organisations. The
organisations are all providers of public services and are required to adhere to very strict nationally developed ethical guidelines. This has the advantage that all personnel are aware of the guidelines and are required to follow them both on a personal and organisational level. This means there are very few opportunities for misunderstandings or inadvertent breeches and an expectation of being reported if any individual becomes aware of a breech.
• I feel there are members of staff in my organisation who accept and follow the ethical standards of the company. There are also those who do not fully understand the purpose of these standards . I feel that different types of people accept ethical standards depending on their own perception. Although those who accept the standards perform better and are quicker to achieve goals.
• I have experienced in the past (prior organisations) that analysts did a sloppy job on the Predictive Models they were building. They knew that the information they were providing wasn't their "best work" and some minor miscalculations were present into their forecasts. I think some organisations need to put more emphasis on the most important elements, the "Customer". Making sure that we are delivering the right products for our customers with care and the best-in-class practices is a must.
• I have faced the difficult position of having to manage an employee whose performance was below expectations but who was also protected by the Disability Discrimination Act. Having a robust, agreed set of values enabled us handle a difficult situation in a way that was as comfortable as it could be. In the end, the employee refused the reasonable adjustments offered and was dismissed on the grounds of competency and capability. It was not an easy process but our values helped us to retain mutual respect whilst going through a difficult legal process.
• In a previous job I was reprimanded severely (asked to resign) because I remained silent during a discussion that was advocating a decision I firmly disagreed with. The scenario was in my role as a youth worker / teacher in a case meeting with a girl and her female careers advisor who encouraged the girl (19 years old with manic depression caused by a very abusive background) to explore work in local strip clubs citing the travel, adventure and money as being good benefits in that line of work. A complaint was made after the meeting by the careers advisor that I was not vocally supportive enough. The grounds for being asked to leave were that my own religious beliefs prevented my effective support of young people in an office which was primarily "secular humanist".
• In a previous organisation my direct manager employed a relative of themselves, without informing the organisation. After some months the manager let me know they were related to the newly employed member of staff and asked me not to inform anyone else. I felt that I was put in a difficult position. I was leaving the organisation in a few weeks time, so did not raise the issue until I left, despite thinking that I should have raised the issue immediately. If the same thing occurred today, I would be able to handle the issue more easily, having developed myself and my confidence considerably over the past few years my job role developed.

© 2013 ILM & BITC Page 58 of 68
Values & ethics in management: Technical report
• In a previous role in a previous employee (who are now bust) preparing for an audit I discovered a claim had gone accidentally unpaid; it was quite a considerable amount of money that would have made a significant difference to a vulnerable individual. My line manager instructed me to 'loose the file' and not pay it. I refused and agreed to pay it with a colleague and informed our manager we were not prepared to carry out her instructions and that if need be we would go over her head, she relented.
• In my organisation, stated values and actual values practiced are worlds apart, especially since the last reform (2008). I have moved around my organisation a lot since 2003, and I am finally in a team of people who share the same values as I do. Top management especially seems to have no clue about the stated values and ethics, and seems to think they are above the organisations internal procedures and the applicable regulations. We are probably the most corrupt organisation in the country.
• In the days when some of our work involved government funding brokered through Business Links there were a number of instances where what we were asked to do in terms of invoicing at the end of the year was at odds with our own ethics. More recently I felt I could not agree to one element of a bank's terms and conditions for use of an internet portal involving an open ended agreement to indemnify the bank for unspecified potential losses and was advised by the bank verbally simply to sign them indicating my agreement on the basis that it was unlikely to be an issue.
• Incentivising situation to win work. • It depends on the ethical standpoint for me. Making people redundant with impersonal
communications has happened frequently, however this can be justified through ethics as ultimately the business is trying to safeguard future employees. However the approach was very unethical. Any debate can be argued through ethics whether deontological, teleogiocal or egoist for e.g. so the debate can be always justified.
• It is of note that I changed my employment and have only been with my current employer for 6 months. My responses related to this, and my previous, employers.
• Lack of adherence to policy / ignoring spirit of law in regard op employee rights on redundancy • My Manager has offered to claim on expenses for team nights out - I have declined as believe this
is not ethical. • My manager lied about his part in a failed project in order to protect himself. When I confronted him
with the facts he said that that was what you did if you wanted to get on. I responded that I could no longer trust him as he was prepared to lie for his own ends. I subsequently left the organisation as I could no longer work with him.
• My superior often uses his own rules where this is not called for, i.e. there is policy or procedure in place. They often appear to be conducting personal business in work time and using work resources. Their attitude is do as I say not as I do.

© 2013 ILM & BITC Page 59 of 68
Values & ethics in management: Technical report
Annex A: Questionnaire: 1. Which of these best describes your role?
-First-line manager (managing people who are not managers themselves) -Middle manager (managing first-line managers or other middle managers) -Senior manager (managing middle or other senior managers) -Executive Director -CEO or equivalent -Non-Executive Director -Not currently employed as a manager or director
2. What is your age?
-18-24 -25-29 -30-34 -35-39 -40-44 -45-49 -50-54 -55-59 -60-64 -65+ -Prefer not to say
3. What is your gender?
-Female -Male -Prefer not to say
We define ethics and values as follows:
• Ethics or ethical standards are the set of moral principles that govern a person’s behaviour or the conduct of an activity
• Values is another way of describing those specific moral principles or standards of behaviour
4. How many people approximately [full time equivalents] does your
organisation currently employ?
-Fewer than 20 -Between 20 and 49 -Between 50 and 99 -Between 100 and 249 -Between 250 and 499 -Between 500 and 999

© 2013 ILM & BITC Page 60 of 68
Values & ethics in management: Technical report
-Over 1,000 -Don’t know/Prefer not to say
5. Does your current employer have an explicitly stated set of values and/or ethics?
-Yes -No -Not sure/ Don't know
6. How have the set of values and/or ethics been arrived at?
-They were developed by the Senior Management and/or Board of Directors -They were developed by the Marketing/Communications team -They were developed by the HR team -They were developed by a cross-departmental project team -I don’t know/they existed when I joined -Other (Please specify)
7. Was there any consultation with the following groups in the process of
developing the set of values and/or ethics? (Please choose all that apply)
-Employees -Shareholders/owners -Other external stakeholders -Other (please specify) -No consultation -Not sure/Don’t know
8. Has this statement of values and/or ethics changed since 2008?
-Yes -No -Don’t know/ prefer not to say
9. What has driven that change in the organisation’s stated values, as far as
you are aware? (Please choose all that apply)
-Other (please specify) -The changing external economic, social and political context -A new CEO, Chair of the Board or similar -Need to respond to market pressure or expectations -The need to meet regulatory conditions -I don’t know/prefer not to say
10. Have you ever consciously referred to the statement of values and/or
ethics when deciding what to do?

© 2013 ILM & BITC Page 61 of 68
Values & ethics in management: Technical report
-Yes -No -Don’t know/prefer not to say
11. To your knowledge, have your colleagues ever consciously referred to the statement of values and/or ethics when deciding what to do?
-Yes -No -Don’t know/prefer not to say
12. In general, how closely do you believe your fellow employees’ behaviour and decisions match the stated values?
-Extremely - I have never experienced any decision or behaviour not fully in line with them -Very closely – it is rare to experience any decision or behaviour not in line with them -Quite closely – sometimes I experience decisions or behaviour not in line with them -Not that closely – I quite often experience decisions or behaviour not in line with them -Not closely at all – I frequently experience decisions or behaviour not in line with them -Don’t know/prefer not to say
13. How important is it to you, personally, for the organisation’s stated values to be in line with your own personal values?
-Very important -Quite important -Neither important nor unimportant -Quite unimportant -Very unimportant -Don’t know/prefer not to say
14. Have you ever felt any conflict between your own personal values and your organisation's stated values?
-No, never -Occasionally, but not any serious conflict -Occasionally, sometimes serious conflict -Frequently, but not any serious conflict -Frequently, often serious conflict -Don’t know/prefer not to say
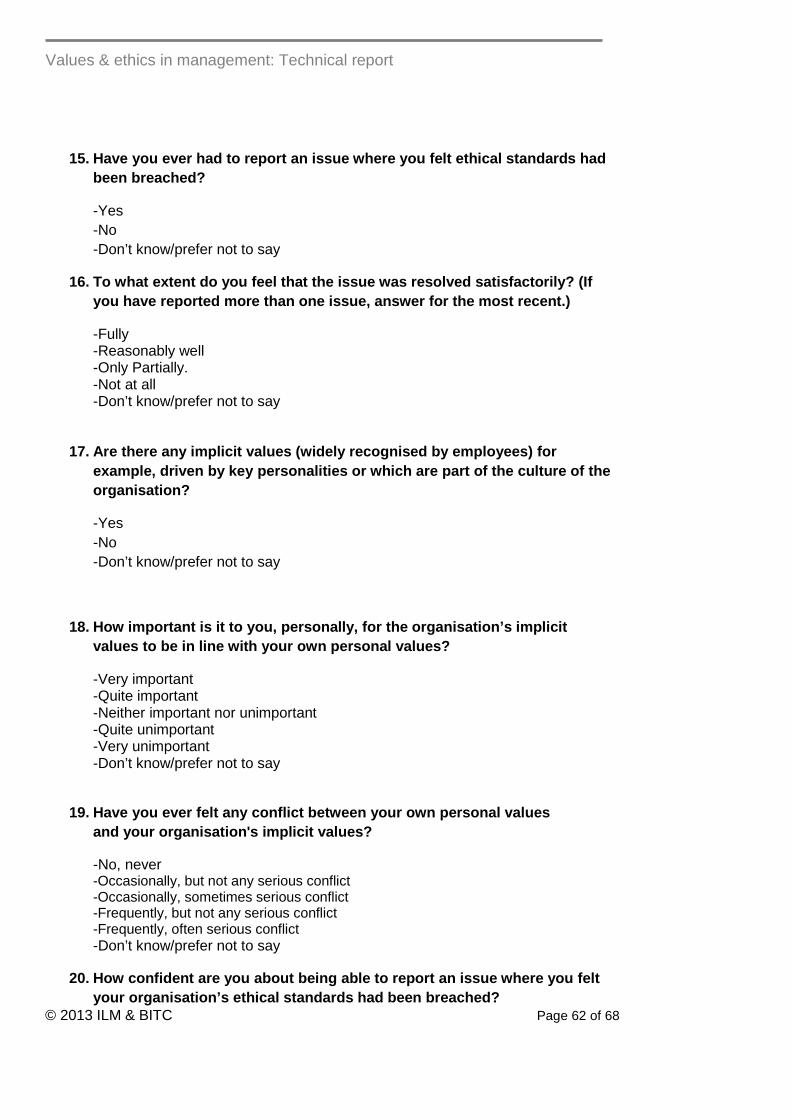
© 2013 ILM & BITC Page 62 of 68
Values & ethics in management: Technical report
15. Have you ever had to report an issue where you felt ethical standards had been breached?
-Yes -No -Don’t know/prefer not to say
16. To what extent do you feel that the issue was resolved satisfactorily? (If you have reported more than one issue, answer for the most recent.)
-Fully -Reasonably well -Only Partially. -Not at all -Don’t know/prefer not to say
17. Are there any implicit values (widely recognised by employees) for example, driven by key personalities or which are part of the culture of the organisation?
-Yes -No -Don’t know/prefer not to say
18. How important is it to you, personally, for the organisation’s implicit values to be in line with your own personal values?
-Very important -Quite important -Neither important nor unimportant -Quite unimportant -Very unimportant -Don’t know/prefer not to say
19. Have you ever felt any conflict between your own personal values and your organisation's implicit values?
-No, never -Occasionally, but not any serious conflict -Occasionally, sometimes serious conflict -Frequently, but not any serious conflict -Frequently, often serious conflict -Don’t know/prefer not to say
20. How confident are you about being able to report an issue where you felt your organisation’s ethical standards had been breached?
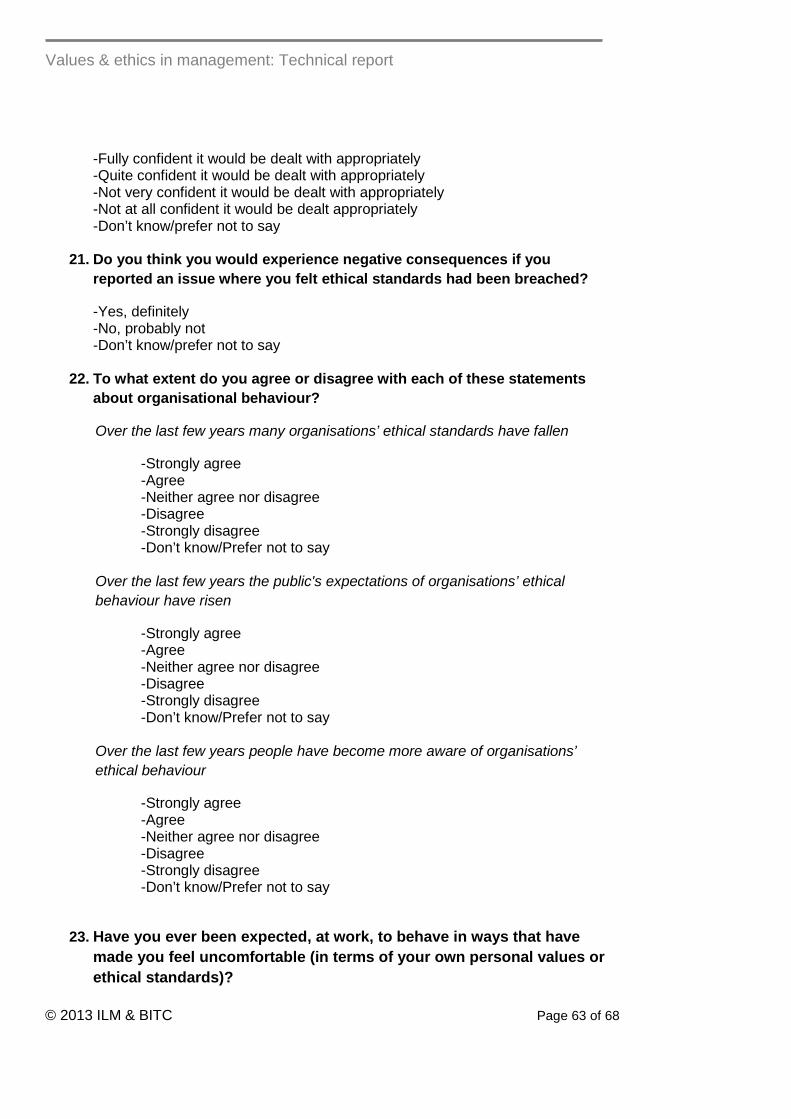
© 2013 ILM & BITC Page 63 of 68
Values & ethics in management: Technical report
-Fully confident it would be dealt with appropriately -Quite confident it would be dealt with appropriately -Not very confident it would be dealt with appropriately -Not at all confident it would be dealt appropriately -Don’t know/prefer not to say
21. Do you think you would experience negative consequences if you
reported an issue where you felt ethical standards had been breached?
-Yes, definitely -No, probably not -Don’t know/prefer not to say
22. To what extent do you agree or disagree with each of these statements
about organisational behaviour?
Over the last few years many organisations’ ethical standards have fallen
-Strongly agree -Agree -Neither agree nor disagree -Disagree -Strongly disagree -Don’t know/Prefer not to say
Over the last few years the public's expectations of organisations’ ethical behaviour have risen
-Strongly agree -Agree -Neither agree nor disagree -Disagree -Strongly disagree -Don’t know/Prefer not to say
Over the last few years people have become more aware of organisations’ ethical behaviour
-Strongly agree -Agree -Neither agree nor disagree -Disagree -Strongly disagree -Don’t know/Prefer not to say
23. Have you ever been expected, at work, to behave in ways that have made you feel uncomfortable (in terms of your own personal values or ethical standards)?

© 2013 ILM & BITC Page 64 of 68
Values & ethics in management: Technical report
-Yes, frequently (Please explain) -Yes, sometimes (Please explain) -Yes, though only once or rarely -No, not at all -Don’t know/prefer not to say
24. Have you, at any time in your career, been directly asked to do something
that you felt:
Was against your own personal values? -Yes -No -Don’t know/prefer not to say
Was against the organisation's values?
-Yes -No -Don’t know/prefer not to say
Broke specific industry regulations?
-Yes -No -Don’t know/prefer not to say
Broke the law?
-Yes -No -Don’t know/prefer not to say
If you have answered yes to any of these, please would you explain why?
25. Have any instances of having to behave unethically caused you to resign or consider resigning?
-Yes, I subsequently resigned -Yes, I seriously considered resigning -No, I did not seriously consider resigning
26. There now follow three pairs of statements. Please select one statement in
each pair which most closely fits your own values:
-I always try to do the right thing -I always try to ensure that I achieve the right outcome -I always try to ensure that I achieve the best outcome -I will always follow the rules governing what I should do -I always follow the rules governing what I should do -I always try to do the right thing

© 2013 ILM & BITC Page 65 of 68
Values & ethics in management: Technical report
27. This question presents a number of hypothetical situations at work, each of which presents some ethical dilemmas. In each case you are asked to decide what course of action you would pursue:
A junior member of staff using the photocopier to copy material for use by a local charity, without permission:
-Do nothing -Warn them that what they are doing is wrong and not to repeat it -Warn them that what they are doing is wrong and they should rectify the situation urgently -Report the incident to a responsible person or compliance officer
A colleague claiming mileage for a trip when you have a strong suspicion they were given a lift by someone else who is also claiming expenses
-Do nothing -Warn them that what they are doing is wrong and not to repeat it -Warn them that what they are doing is wrong and they should rectify the situation urgently -Report the incident to a responsible person or compliance officer
A colleague deciding not to report a minor infringement of regulations that apply to the industry because 'The last time it was reported the regulator decided to take no action'
-Do nothing -Warn them that what they are doing is wrong and not to repeat it -Warn them that what they are doing is wrong and they should rectify the situation urgently -Report the incident to a responsible person or compliance officer
A more senior colleague accepting an invitation from a major supplier to a prestigious sporting event in Paris, with travel and accommodation paid for, and not declaring it as required by the organisation's anti-bribery and corruption rules
-Do nothing -Warn them that what they are doing is wrong and not to repeat it -Warn them that what they are doing is wrong and they should rectify the situation urgently -Report the incident to a responsible person or compliance officer

© 2013 ILM & BITC Page 66 of 68
Values & ethics in management: Technical report
A member of the organisation's senior management telling one of their reports to make a fairly significant purchase from a market-leading supplier, where their spouse is in a senior position, without going out to tender
-Do nothing -Warn them that what they are doing is wrong and not to repeat it -Warn them that what they are doing is wrong and they should rectify the situation urgently -Report the incident to a responsible person or compliance officer
28. Please choose one button for each pair of statements, to indicate which one you agree with more. If you select a button nearer a statement, the more strongly you agree with it.
-I feel my own ethical standards are higher than those of many members of the general public
-I feel most of society has higher ethical standards than I do
-I feel my own ethical standards are higher than those of the organisation I work for
-I feel the organisation I work for has higher ethical standards than I do
-I feel the organisation I work for has higher ethical standards than most of society
-I feel most of society has higher ethical standards than the organisation I work for
29. Where are organisational values highlighted/discussed in your
organisation? (Please select all that apply)
-Don't know -As part of the appraisal/performance management system -On your organisation's website -As part of employee induction -On your organisation's intranet/staff handbook
30. Have there any been any instances since 2008 when you have been aware of unethical behaviour by any of the following people?
-Your immediate superior -Your direct reports -Your peers (managers at the same level) -The CEO/Executives Officers (if applicable) -Other parts of my organisation

© 2013 ILM & BITC Page 67 of 68
Values & ethics in management: Technical report
31. Are there any specific situations or problems relating to values or ethics you have encountered at work that you would be prepared to outline to us?
32. Which of these sectors does your organisation operate in?
-Private sector -Public sector -Third sector (charity, social enterprise, or similar)
33. To which one of the following ethnic groups do you belong? (categories are from the 2011 Census)
-White - English / Welsh / Scottish / Northern Irish / British -White – Irish -White - Gypsy or Irish Traveller -White - Any Other White background -Mixed / Multiple ethnic group - White and Black Caribbean -Mixed / Multiple ethnic group - White and Black African -Mixed / Multiple ethnic group - White and Asian -Mixed / Multiple ethnic group - Any Other Mixed / multiple ethnic background -Asian / Asian British – Indian -Asian / Asian British – Pakistani -Asian / Asian British – Bangladeshi -Asian / Asian British – Chinese -Asian / Asian British - Any other Asian background -Black / African / Caribbean / Black British – African -Black / African / Caribbean / Black British – Caribbean -Black / African / Caribbean / Black British – Any other Black / African / -Caribbean background -Other ethnic group – Arab -Other ethnic group – Any other ethnic group -Don't know/ prefer not to say
34. In which country/region do you work (most often)?
-North East -North West -Yorks & Humber -East Midlands -West Midlands -East -London -South East -South West -Wales -Scotland

© 2013 ILM & BITC Page 68 of 68
Values & ethics in management: Technical report
-Northern Ireland -Other
35. Which of these best describes the industry that your organisation operates in?
-Health -Education -Military / defence -National / local government / other public sector -Charity -Retail -Wholesale, distribution, travel and transport -Catering and hospitality -Financial services, banking and insurance -Professional services and consultancy -Leisure -Engineering and manufacturing -Utilities, post and telecoms -Media, PR and marketing -Other (please specify)
36. Would you like any of the following: - Your name to be entered into the prize draw (for one of five £100 donations to the charity of your choice - terms and conditions available online)? - To talk to one of our researchers for an anonymous case study for use with the results of this survey? - To receive a copy of the report when it is published? (Please select all which you wish to participate in)
Please select all which you would like to participate in:
-Enter the prize draw -Be contacted by one of our researchers for an anonymous case study -Receive a copy of the report when it is published
37. Please provide your name
38. Please provide your email address.