technical study for community choice aggregation program ... analysis... · technical study for...
TRANSCRIPT
Technical Study for Community Choice Aggregation Program in Alameda County
Prepared by:
With
MRW&Associates,LLC1814FranklinStreet,Ste720Oakland,CA94612
TierraResourceConsultantsWalnutCreek,CA
EconomicDevelopmentResearchGroupBoston,MA
June2016


CommunityChoiceAggregationFeasibilityAnalysis AlamedaCounty
June2016 . MRW&Associates,LLC
TableofContents
Executive Summary .................................................................................................................. i Loads and Forecast ........................................................................................................................... i CCA Power Supplies ........................................................................................................................ iii
Local Renewable Development ........................................................................................................... iii Rate Results .................................................................................................................................... iv
Scenario 1 (Simple Renewable Compliance) ....................................................................................... iv Scenario 2 (Accelerated RPS) ............................................................................................................... v Scenario 3 (80% RPS by 2021) .............................................................................................................. v
Greenhouse Gas Emissions ............................................................................................................ vii Sensitivity Analysis ......................................................................................................................... ix Macroeconomic and Job Impacts ..................................................................................................... x Energy Efficiency ............................................................................................................................ xii Conclusions .................................................................................................................................... xiii
Chapter 1: Introduction ........................................................................................................... 1 What is a CCA? ................................................................................................................................. 1 Assessing CCA Feasibility.................................................................................................................. 1
Chapter 2: Economic Study Methodology and Key Inputs ........................................................ 3 Alameda County Loads and CCA Load Forecasts ............................................................................... 1 Energy Efficiency .............................................................................................................................. 4 CCA Supplies .................................................................................................................................... 6
Power Supply Cost Assumptions .......................................................................................................... 9 Locally‐Sited and Developed Renewables .......................................................................................... 11 Other CCA Supply Costs ...................................................................................................................... 11
PG&E Rate and Exit Fee Forecasts .................................................................................................. 12 PG&E Bundled Generation Rates ....................................................................................................... 12 PG&E Exit Fee Forecast ...................................................................................................................... 13
Pro Forma Elements and CCA Costs of Service ................................................................................ 13 Pro Forma Elements ........................................................................................................................... 14 Startup Costs ...................................................................................................................................... 15 Energy Efficiency Program Costs ........................................................................................................ 15 Administrative and General Cost Inputs ............................................................................................ 16 Cost of Service Analysis and Reserve Fund ........................................................................................ 16
Chapter 3: Cost and Benefit Analysis ..................................................................................... 17 Scenario 1 (Renewable Compliance) .............................................................................................. 17
Rate Differentials ................................................................................................................................ 17 Residential Bill Impacts ...................................................................................................................... 18 Greenhouse Gas Emissions ................................................................................................................ 18
Scenario 2 (Accelerated RPS) .......................................................................................................... 19 Rate Differentials ................................................................................................................................ 19 Residential Bill Impacts ...................................................................................................................... 20 GHG Emissions ................................................................................................................................... 21
Scenario 3 (80% RPS by 2021) ........................................................................................................ 22 Rate Differentials ................................................................................................................................ 22

CommunityChoiceAggregationFeasibilityAnalysis AlamedaCounty
June2016 . MRW&Associates,LLC
Residential Bill Impacts ...................................................................................................................... 23 GHG Emissions ................................................................................................................................... 24
Chapter 4: Sensitivity of Results to Key Inputs ....................................................................... 25 Diablo Canyon Relicensing Sensitivity ............................................................................................ 25 Higher Renewable Power Prices Sensitivity .................................................................................... 26 Higher Exit Fee (PCIA) Sensitivity ................................................................................................... 27 Higher Natural Gas Prices Sensitivity .............................................................................................. 27 Lower PG&E Portfolio Cost Sensitivity ............................................................................................ 28 Stress Case and Sensitivity Comparisons ........................................................................................ 28 Conclusions .................................................................................................................................... 31
Chapter 5: Macroeconomic Impacts ...................................................................................... 32 How a CCA interacts with the Surrounding Economy ...................................................................... 32 How Job Impacts Are Measured ..................................................................................................... 34 Scenario Results ............................................................................................................................. 34
Job and Gross Regional Product Total Impacts .................................................................................. 35 County Job impact by Stage of Job generation, Scenario 1 ............................................................... 37 County Job Impacts by Sector 2023 ................................................................................................... 38 Focus on Construction Sector Jobs .................................................................................................... 39 Occupation Impacts for Alameda County, 2023 ................................................................................ 42
Chapter 6: Other Risks ........................................................................................................... 43 Financial Risks to CCA Members ..................................................................................................... 43 Procurement‐Related Risks ............................................................................................................ 43 Legislative and Regulatory Risks .................................................................................................... 44 PCIA Uncertainty ........................................................................................................................... 44 Impact of High CCA Penetration on the PCIA .................................................................................. 45 Bonding Risk .................................................................................................................................. 45
Chapter 7: Other Issues Investigated ..................................................................................... 47 Funding, Costs, and Impacts of the Energy Efficiency Program Scenario ......................................... 47 “Minimum” CCA Size? .................................................................................................................... 49 Individuals and Communities Self‐Selecting 100% Renewables ...................................................... 51 Competition with a PG&E Community Solar Program..................................................................... 52 Additional Local Renewables ......................................................................................................... 52
Chapter 8: Conclusions ......................................................................................................... 54

CommunityChoiceAggregationFeasibilityAnalysis AlamedaCounty
June2016 . MRW&Associates,LLC
List Of Acronyms
AAEE Additional Achievable Energy Efficiency CAISO California Independent System Operator CBA Collective Bargaining Agreement CCA Community Choice Aggregation CEC California Energy Commission CPUC California Public Utilities Commission EE Energy Efficiency EBCE East Bay Community Energy ESPs Energy Service Providers FY Fiscal Year GHG Greenhouse Gas GRP Gross Regional Product GWh Gigawatt-hour (= 1,000 MWhs) IOU Investor-Owned Utility I/T Information Technology JEDI Jobs and Economic Impact (model) JPA Joint Powers Authority kWh Kilowatt-hour MW Megawatt MWh Megawatt-hour NREL National Renewable Energy Laboratory PCIA Power Charge Indifference Adjustment PEIR Programmatic Environmental Impact Report PG&E Pacific Gas & Electric REC Renewable Energy Credit REMI Regional Economic Modeling Inc RPS Renewable Portfolio Standard roCA Rest of California SB 350 Senate Bill 350 TURN The Utility Reform Network

CommunityChoiceAggregationFeasibilityAnalysis AlamedaCounty
June2016 . MRW&Associates,LLC

CommunityChoiceAggregationFeasibilityAnalysis AlamedaCounty
June2016 i MRW&Associates,LLC
ExecutiveSummaryCalifornia Assembly Bill 117, passed in 2002, established Community Choice Aggregation in California, for the purpose of providing the opportunity for local governments or special jurisdictions to procure or provide electric power for their residents and businesses. In June 2014, the Alameda County Board of Supervisors voted unanimously to allocate funding to explore the creation of a Community Choice Aggregation (CCA) Program called East Bay Community Energy (EBCE) and directed County staff to undertake the steps necessary to evaluate the feasibility of a CCA. This feasibility study is in response to this Board Action.
In order to assess whether a CCA is “feasible” in Alameda County, the local objectives must be laid out and understood. Based on the specifications of the initial request for proposals and input from the County, this study:
Quantifies the electric loads that an Alameda County CCA would have to serve Estimates the costs to start-up and operate the CCA Considers scenarios with differing assumptions concerning the amount of carbon-free
power being supplied to the CCA so as to assess the costs and greenhouse gas (GHG) emissions reductions possible with the CCA
Includes analysis of in-county renewable generation Compares the rates that could be offered by the CCA to PG&E’s rates Quantitatively explores the rate competiveness to key input variables, such as the cost of
natural gas Explores what activities a CCA might take with respect to administering customer-side
energy efficiency programs Calculates the macroeconomic development and employment benefits of CCA formation.
Loads and Forecast
Figure ES-1 provides a snapshot of Alameda County electric load in 2014 by city and by rate class. As the figure shows, total electricity load in 2014 from Alameda County was approximately 8,000 GWh. The cities of Oakland, Fremont, and Hayward were together responsible for half the county load, with Berkeley, San Leandro, and Pleasanton also contributing substantially. Residential and commercial customers made up the majority of the county load, with smaller contributions from the industrial and public sectors.
To forecast CCA loads through 2030, MRW used a 0.3% annual average growth rate, which is consistent with the California Energy Commission’s most recent electricity demand forecast for PG&E’s planning area. This growth rate incorporates load reductions from the CCA’s energy efficiency programs of about 6 GWh per year from 2021 through 2030. Figure ES-2 shows this forecast by class, with the energy efficiency savings that are included in the forecast indicated by the top (yellow) segment.

CommunityChoiceAggregationFeasibilityAnalysis AlamedaCounty
June2016 ii MRW&Associates,LLC
Figure ES-1. PG&E’s 2014 Bundled Load in Alameda County by Jurisdiction and Rate Class
Figure ES-2: CCA Load Forecast by Class, 2017-2030

CommunityChoiceAggregationFeasibilityAnalysis AlamedaCounty
June2016 iii MRW&Associates,LLC
CCA Power Supplies
The CCA’s primary function is to procure power supplies to meet the electrical loads of its customers. This requires balancing energy supply and demand on an hourly basis. It also requires procuring generating capacity (i.e., the ability to provide energy when needed) to ensure that customer loads can be met reliably. By law, the CCA must supply a certain portion of its sales to customers from eligible renewable resources. This Renewable Portfolio Standard (RPS), requires 33% renewable energy supply by 2020, increasing to 50% by 2030. The CCA may choose to procure a greater share of its supply from renewable sources than the minimum requirements, or may seek to otherwise reduce the environmental impact of its supply portfolio (e.g., purchase hydroelectric power rather than power from a fossil fuel generator).
The three supply scenarios that we considered are:
1. Minimum RPS Compliance: The CCA meets the state-mandated 33% RPS requirement in 2020 and the 50% RPS requirement in 2030
2. More Aggressive: The CCA’s supply portfolio is set at 50% RPS from the first year onward, plus additional amounts of non-RPS compliant large hydro power to reduce GHG emissions
3. Ultra-Low GHG: The CCA’s supply portfolio is set at 50% RPS in the first year and increases to 80% RPS by the fifth year.
In each case, we assumed that the RPS portfolio was predominately supplied with solar and wind resources, which are currently the lowest cost sources of renewable energy in California. We assumed that solar and wind each contribute 45% of the renewable energy supply. To provide resource diversity and partly address the need for supply at times when solar and wind production are low, we assumed the remaining 10% of renewable supply would be provided by higher-cost baseload resources, such as geothermal or biomass.
Local Renewable Development
The CCA may choose to contract with or develop renewable projects within Alameda County so as to promote economic development or reap other benefits. For the purpose of this study, we assume that the local renewable power development resulting from the CCA would be largely solar. In developing the hypothetical portfolios, we made conservative assumptions about how much local solar development would occur as a result of the CCA. A renewable potential study performed for the California Public Utilities Commission (CPUC) estimated roughly 300 MW of large solar supply in Alameda County. (Large solar in this study means ground-mounted utility-scale solar farms).1 This estimate is based on an assessment that five percent of the estimated 6,000 MW of technical potential could be developed, largely as a result of land use conflicts or slope issues that would make solar development unfeasible in certain areas. We assume that over the forecast period through 2030, about 1/3 of the estimated 300 MW large solar supply
1 At about 8-10 acres per megawatt, this corresponds to 2,400 to 3,000 acres (3.75-4.7 square miles).

CommunityChoiceAggregationFeasibilityAnalysis AlamedaCounty
June2016 iv MRW&Associates,LLC
potential in Alameda County is developed as a result of commitments by the CCA. Additional in-county, small solar projects are assumed to be added at 5-10 MW per year.
As a result of feedback from reviews of the preliminary results, an additional case in which we assume that 50% of the renewables are met with local generation. This case is discussed in Chapter 7 and will be explored in greater detail in an addendum.
Additional studies are available and underway2 assessing in more detail the solar potential in the County, which preliminarily confirm the assumptions used here are conservative (i.e., low). Once formed and operational, the CCA should investigate in greater detail the practical solar potential in the County.
Rate Results
Scenario 1 (Simple Renewable Compliance)
Figure ES-3 summarizes the results of Scenario 1. The figure shows the total average cost of the Alameda CCA to serve its customers (vertical bars) and the comparable PG&E generation rate (line).3 Of the CCA cost elements, the greatest cost is for non-renewable generation followed by the cost for the renewable generation, which increases over the years according to the RPS standards. Another important CCA customer cost is the Power Charge Indifference Adjustment (PCIA), which is the CPUC-mandated charge that PG&E must impose on all CCA customers. This fee is expected to decrease in most years beginning in 2019 and have less of an impact on the CCA customer rates over time.
Under Scenario 1, the differential between PG&E generation rates and average cost for the Alameda CCA to serve its customer (aka the CCA rates) is positive in each year (i.e., CCA rates are lower than PG&E rates). As a result, Alameda CCA customers’ average generation rate (including contributions to the reserve fund) can be set at a level that is lower than PG&E’s average customer generation rate in each year.
2 For example, “Bay Area Smart Energy 2020,” available at http://bayarearegionalcollaborative.org/pdfs/BayAreaSmartEnergy2020fin.pdf 3 All rates are in nominal dollars. Note that these are NOT the full rates shown on PG&E bills. They are only the generation portion of the rates. Other parts of the rate, such as transmission and distribution, are not included, as customers pay the same charges for these components regardless of who is providing their power.

CommunityChoiceAggregationFeasibilityAnalysis AlamedaCounty
June2016 v MRW&Associates,LLC
Table ES-1 shows the average annual savings for Residential customers under Scenario 1. The average annual bill for the residential customer on the Alameda CCA program could average about 7% lower than the same bill on PG&E rates.
Table ES-1. Scenario 1 Savings for Residential CCA Customers
Residential Monthly
Consumption (kWh)
Bill with PG&E ($)
Bill with Alameda CCA
($) Savings ($) Savings (%)
2017 650 147 142 5 3%
2020 650 160 145 15 9%
2030 650 201 188 13 6%
Scenario 2 (Accelerated RPS)
Under Scenario 2, Alameda CCA meets 50% of its load through renewable power starting from 2017, while 50% of its non-renewable load is met through hydro-electricity (i.e., overall 50% qualifying renewable. 25% hydro, 25% fossil or market). In this scenario, the differential between PG&E generation rates and Alameda CCA customer rates is slightly lower than that under Scenario 1, but continues to follow a similar pattern over the years with respect to PG&E rates. As was the case under Scenario 1, because of this positive differential, Alameda CCA customers’ average generation rate (including contributions to the reserve fund) can be lower than PG&E’s average customer generation rate in each year under this scenario as well.
The annual bill for a residential customer on the Alameda CCA program in Scenario 2 could about 6.5% lower than the same bill on PG&E rates (on average over the 2017-2030 study period). This is less than, but close to, bill savings under Scenario 1.
Scenario 3 (80% RPS by 2021)
Under this scenario, the Alameda CCA starts with 50% of its load being served by renewable sources in 2017, and increases this at a quick pace to 80% renewable energy content by 2021. In addition, 50% of its non-renewable supply is met through large hydro-electric sources.
The differential between PG&E generation rates and Alameda CCA customer rates in Scenario 3 is the lowest of the three scenarios, as this scenario has the most expensive supply portfolio (Figure ES-4). However, the expected Alameda CCA rates continue to be lower than the forecast PG&E generation rates for all years from 2017 to 2030. Although this positive differential still allows for the collection of reserve fund contributions through the CCA’s rates in all the years under consideration, between 2026 to 2028 the differential is very small. Similarly, the annual

CommunityChoiceAggregationFeasibilityAnalysis AlamedaCounty
June2016 vi MRW&Associates,LLC
bill for a residential customer on the Alameda CCA program will be on average only about 3% lower than the same customers on PG&E rates.
Figure ES-3. Scenario 1 Rate Savings, 2017-2030
Figure ES-4. Scenario 3 Rate Savings, 2017-2030

CommunityChoiceAggregationFeasibilityAnalysis AlamedaCounty
June2016 vii MRW&Associates,LLC
Greenhouse Gas Emissions
As modeled, there are no greenhouse gas benefits for Scenario 1—in fact there are net incremental emissions. This is because both the CCA and PG&E are meeting the same RPS requirements, but over 40% of PG&E’s supply portfolio is made up of nuclear4 and large hydro generation, both of which are considered emissions-free.
The Alameda CCA’s GHG emissions under Scenario 2 are much lower than those under Scenario 1. This is due to the higher renewable content in the CCA’s generation mix under Scenario 2, but more importantly, the 50% hydro content in the non-renewable generation mix. Figures ES-5 compares the GHG emissions from 2017-2030 for the Alameda CCA under Scenario 2 with what PG&E’s emissions would be for the same load if no CCA is formed. PG&E’s GHG emissions are initially comparable to, the CCA’s emissions. The expected retirement of Diablo Canyon in 2025 increases PG&E’s emissions by approximately 30% in 2025. Following this, PG&E’s emissions are expected to decrease from 2026 to 2030 as PG&E procures renewables to meet its mandated RPS goals. However, they still remain higher than the CCA’s expected GHG emissions.
The results of Scenarios 1 and 2 illustrate that if the CCA wants to reduce is net carbon emissions, it must include hydroelectric (or other low- or carbon-free resources) in its portfolio.
Note that the analysis assumes “normal” hydroelectric output for PG&E. during the drought years, PG&E’s hydro output has been at about 50% of normal, and the utility has made up these lost megawatt-hours through additional gas generation. This means that our PG&E emissions are the PG&E emissions shown here are lower that the “current” emission. If, as is expected by many experts, the recent drought conditions are closer to the “new normal, then PG&E’s GHG emissions in the first 8 years would be approximately 30% higher, resulting in GHG savings for Scenario 2 rather than parity.
Similar to Scenarios 1 and 2, under Scenario 3 the Alameda CCA’s GHG emissions first increase from 2017 to 2019 as the CCA is phased in into the entire county. However, in Scenario 3 this increase is partially offset by the increasing renewable content in the CCA’s supply mix (Figure ES-6). Thus the CCA’s emissions in this scenario grow at a slower rate from 2017 to 2019 than in the first 2 scenarios, then decrease until 80% renewable supply is achieved in 2021, and remain flat thereafter. The CCA’s GHG emissions under this scenario are lower than PG&E’s expected emissions for the same load if no CCA is formed, for all years except for 2017 for which the emissions are comparable.
4 40% of PG&E portfolio is nuclear and hydro 2017-2024; in 2024 the Diablo Canyon retires and is replaced by gas-fired generation.

CommunityChoiceAggregationFeasibilityAnalysis AlamedaCounty
June2016 viii MRW&Associates,LLC
Figure ES-5. Scenario 2 GHG Emissions by Year (PG&E Normal Hydro Conditions)
Figure ES-6. Scenario 3 GHG Emissions by Year PG&E Normal Hydro Conditions

CommunityChoiceAggregationFeasibilityAnalysis AlamedaCounty
June2016 ix MRW&Associates,LLC
Sensitivity Analysis
In addition to the base case forecast described above, MRW assessed alternative cases to evaluate the sensitivity of the results to possible conditions that could impact the Alameda CCA’s rate competitiveness. The key factors are summarized in Table ES-2.
Table ES-2.
Factor Sensitivity Change
Relicensing Diablo Canyon Increases PG&E’s generation rates by ~30%5
Increased cost of renewable power 10% higher through 2021, 20% higher in 2021 and 2022, and 30% higher after 2022
High PCIA (“exit fee”) Retains the high PCIA expected in 2018 (2.1¢/kWh) through 2030
High Natural Gas Prices US Energy Information Administration’s High Gas Price Scenario, which is about 60% higher than the base case price
Low PG&E Rates PG&E rates 10% lower than base forecast
Stress Scenario Combined impact of high renewable costs, high PCIA, high gas price and low PG&E rates.
The sensitivity results are shown as the difference between the annual average PG&E generation rate and the Alameda CCA rate6 and are shown in Figure ES-7. Scenario 1 (RPS Compliance) is the least costly scenario for the CCA and therefore has the highest rate differentials under most of the sensitivity cases considered. Scenario 2 (Accelerated RPS), though still quite competitive with PG&E, fares slightly worse, with a rate differential typically about 8% lower than in Scenario 1. Scenario 3 (80% RPS by 2021) has the highest renewable content and is the costliest scenario, with rate differentials much lower than those in the other two scenarios. While Scenario 3 is anticipated to be competitive with PG&E in most cases (on average), the margins are much lower, particularly in the “High Renewable Prices” sensitivity case, and they become negative in the “Low PG&E rates” sensitivity case (i.e., CCA customer rates are higher than PG&E rates).
5 The new cooling system, which would be required per state regulations implementing the Federal Clean Water Act, Section 316(b), would alone have an estimated cost of $4.5 billion. It is because of these very high costs that the base case assumes the that power plant is retired. 6The Alameda CCA rate includes the PG&E exit fees (PCIA charges) that will be charged to CCA customers but does not include the rate adjustment for the reserve fund.

CommunityChoiceAggregationFeasibilityAnalysis AlamedaCounty
June2016 x MRW&Associates,LLC
In the stress case,7 Alameda CCA customer rates exceed PG&E customer rates on average over the 2017-2030 period for all three scenarios, with the rate differential being highest in Scenario 3 at -1.5¢/kWh. This is double the Scenario 2 stress case rate differential of -0.75¢/kWh.
Figure ES-7. Difference Between PG&E Customer Rates and CCA Customer Rates Under Each Sensitivity Case and Supply Scenario, 2017-2030 Average (i.e., positive vertical axis
means PG&E rates higher than CCA rates).
Macroeconomic and Job Impacts
The local economic development and jobs impacts for the three scenarios were analyzed using the dynamic input-output macroeconomic model developed by Regional Economic Models, Inc. (REMI). The model accounts for not only the impact of direct CCA activities (e.g., construction jobs at a new solar power plant or energy efficiency device installers), but also how the rate savings that County households and businesses might experience with a CCA ripple through the local economy, creating more jobs and regional economic growth.
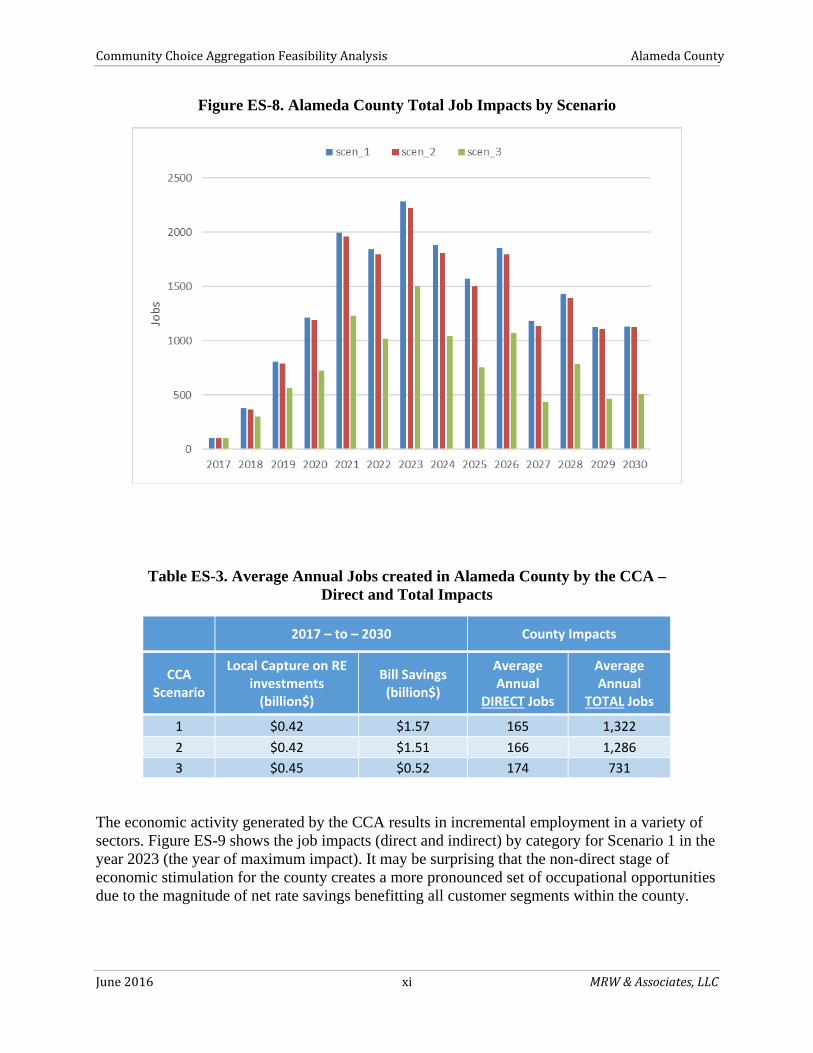
Table ES-3 and Figure ES-8 illustrate this through high-level results expressed as average annual job changes for the three CCA scenarios. While Scenarios 1 and 2 create nearly identical direct jobs (due to comparable investment in local renewable projects), Scenario 1 creates far more TOTAL jobs. This is due to the higher bill savings under Scenario 1. Scenario 3 creates a few more direct jobs, but far fewer total jobs, due to decreased bill savings as compared to the other two scenarios. As a result, its total job impact is 55 percent of the Scenario 1 total job impact.
7 Stress Scenario assumes the risk cases no favorable to the CCA: High Renewable Prices, High PCIA, High Natural Gas Prices, and Low PG&E rates.
CommunityChoiceAggregationFeasibilityAnalysis AlamedaCounty
June2016 xi MRW&Associates,LLC
Figure ES-8. Alameda County Total Job Impacts by Scenario
Table ES-3. Average Annual Jobs created in Alameda County by the CCA – Direct and Total Impacts
2017 – to – 2030 County Impacts
CCA Scenario
Local Capture on RE investments (billion$)
Bill Savings (billion$)
Average Annual
DIRECT Jobs
Average Annual
TOTAL Jobs
1 $0.42 $1.57 165 1,322
2 $0.42 $1.51 166 1,286
3 $0.45 $0.52 174 731
The economic activity generated by the CCA results in incremental employment in a variety of sectors. Figure ES-9 shows the job impacts (direct and indirect) by category for Scenario 1 in the year 2023 (the year of maximum impact). It may be surprising that the non-direct stage of economic stimulation for the county creates a more pronounced set of occupational opportunities due to the magnitude of net rate savings benefitting all customer segments within the county.

CommunityChoiceAggregationFeasibilityAnalysis AlamedaCounty
June2016 xii MRW&Associates,LLC
Figure ES-9. Occupational Impacts Scenario 1, 2023
Energy Efficiency
The three cases each assumed approximately 6 GWh of annual incremental energy efficiency savings directly attributable to CCA efficiency program administration. This value is based on forecasts from the California Energy Commission, and take into account the savings being achieved/allocated to PG&E as well as the mandates from Senate Bill 350.
A CCA has a number of options with respect to administering energy efficiency programs. First, it can rely upon PG&E to continue to all energy efficiency activities in its area, with some input to insure that monies collected from CCA customers flow back to the area. This is the path that two of the four active California CCAs have chosen (Sonoma Clean Power and Lancaster Choice Energy). Second, the CCA can apply to the CPUC to use monies collected in PG&E rates for energy efficiency programs and administration. These CCA efficiency programs can be for CCA customers only or for all customers in the CCA region, no matter their power provider. If the CCA chose the latter path, greater funds are available (including for natural gas efficiency programs). MCE Clean Energy has chosen this latter path. Our modeling assumed the more conservative former one (i.e., offer efficiency programs to only CCA-served residents and businesses). Third, the CCA supplement or supplant these funds though revenues collected by the CCA.

CommunityChoiceAggregationFeasibilityAnalysis AlamedaCounty
June2016 xiii MRW&Associates,LLC
Conclusions
Overall, a CCA in Alameda County appears favorable. Given current and expected market and regulatory conditions, an Alameda County CCA should be able to offer its residents and business electric rates that are a cent or more per kilowatt-hour (~8%) less than that available from PG&E.
Sensitivity analyses suggest that these results are relatively robust. Only when very high amounts of renewable energy are assumed in the CCA portfolio (Scenario 3), combined with other negative factors, do PG&E’s rates become consistently more favorable than the CCAs.
An Alameda CCA would also be well positioned to help facilitate greater amounts renewable generation to be installed in the County. While the study assumed a relatively modest amount for its analysis—about 175 MW, other studies suggest that greater amounts are possible. Because the CCA would have a much greater interest in developing local solar than PG&E, it is much more likely that such development would actually occur with a CCA in the County than without it.
The CCA can also reduce the amount greenhouse gases emitted by the County, but only under certain circumstances. Because PG&E’s supply portfolio has significant carbon-free generation (large hydroelectric and nuclear generators), the CCA must contract for significant amounts of carbon-fee power above and beyond the required qualifying renewables in order to actually reduce the county’s electric carbon footprint. For example, even assuming that the CCA implements a portfolio with 50% qualifying renewables and meets the 50% of the remaining power with carbon-free hydropower, it would only then just barely result in net carbon reductions. However, the extent to which GHG emissions reductions could occur is also a function of the amount of hydroelectric power that PG&E is able to use. If hydro output (continues) to be below historic normal levels, then the CCA should be able to achieve GHG savings, as long as it is also contracting for significant amounts of carbon-free (likely hydroelectric) power. Therefore, if carbon reductions are a high priority for the CCA, a concerted effort to contract with hydroelectric or other carbon-free generators would be needed.
A CCA can also offer positive economic development and employment benefits to the County. At the peak, the CCA would create approximately 2300 new jobs in the region. The large amount for be for construction trades, totaling 440 jobs. What may be surprising is that much for the jobs and economic benefit come from reduced rates. Residents, and more importantly businesses, can spend and reinvest their bill savings, and thus generate greater economic impacts.
CommunityChoiceAggregationFeasibilityAnalysis AlamedaCounty
June,2016 1 MRW&Associates,LLC
Chapter1:IntroductionThe Alameda County Board of Supervisors voted unanimously in June, 2014 to allocate funding to explore the creation of a Community Choice Aggregation (CCA) Program and directed County staff to undertake the steps necessary to evaluate the feasibility of a CCA. This Technical Study is in response to that Board Action.
What is a CCA?
California Assembly Bill 117, passed in 2002, established Community Choice Aggregation in California, for the purpose of providing the opportunity for local governments or special jurisdictions to procure or provide electric power for their residents and businesses.
Under existing rules administered by the California Public Utilities Commission PG&E must use its transmission and distribution system to deliver the electricity supplied by a CCA in a non-discriminatory manner. That is, it must provide these delivery services at the same price and at the same level of reliability to customers taking their power from a CCA as it does for its own full-service customers. By state law, PG&E also must provide all metering and billing services, its customers receiving a single electric bill each month from PG&E, which would differentiate the charges for generation services provided by the CCA as well as charges for PG&E delivery services. Money collected by PG&E on behalf of the CCA is remitted in a timely fashion (e.g., within 3 business days).
As a power provider, the CCA must abide by the rules and regulations placed on it by the state and its regulating agencies, such as maintaining demonstrably reliable supplies and fully cooperating with the State’s power grid operator. However, the State has no rate-setting authority over the CCA; the CCA may set rates as it sees fit so as to best serve its constituent customers.
Per California law, when a CCA is formed all of the electric customers within its boundaries will be placed, by default, onto CCA service. However, customers retain the right to return to PG&E service at will, subject to whatever administrative fees the CCA may choose to impose.
California currently has four active CCA Programs: MCE Clean Energy, serving Marin County and selected neighboring jurisdictions; Sonoma Clean Power, serving Sonoma County, CleanPowerSF, serving San Francisco City and County, and Lancaster Choice Energy, serving the City of Lancaster (Los Angeles County). Numerous other local governments are also investigating CCA formation, including Los Angeles County, San Mateo County, Monterey Bay region, Santa Barbara, San Luis Obispo and Ventura Counties; and Lake County to name but a few.
Assessing CCA Feasibility
In order to assess whether a CCA is “feasible” in Alameda County, the local objectives must be laid out and understood. Based on the specifications of the initial request for proposals and input from the County, this study:
Quantifies the electric loads that an Alameda County CCA would have to serve. Estimates the costs to start-up and operate the CCA.

CommunityChoiceAggregationFeasibilityAnalysis AlamedaCounty
June,2016 2 MRW&Associates,LLC
Considers three scenarios with differing assumptions concerning the amount of carbon-free power being supplied to the CCA so as to assess the costs and greenhouse gas emissions reductions possible with the CCA.
Includes analysis of in-county renewable generation. Compares the rates that could be offered by the CCA to PG&E’s rates. Quantitatively explores the rate competiveness of the three scenarios to key input
variables, such as the cost of natural gas. Explores what activities a CCA might take with respect to administering
customer-side, energy efficiency programs Calculates the macroeconomic development and employment benefits of CCA
formation.
This study was conducted by MRW & Associates, LLC. MRW was assisted by Tierra Resource Consultants, who conducted all the research and analysis related to energy efficiency. MRW was also assisted by Economic Development Research Group, which conducted all of the macroeconomic and jobs analysis contained in the study.
This Study is based on the best information available at the time of its preparation, using publicly available sources for all assumptions to provide an objective assessment regarding the prospects of CCA operation in the County. It is important to keep in mind that the findings and recommendations reflected herein are substantially influenced by current market conditions within the electric utility industry, which are subject to sudden and significant changes.

CommunityChoiceAggregationFeasibilityAnalysis AlamedaCounty
June,2016 3 MRW&Associates,LLC
Chapter2:EconomicStudyMethodologyandKeyInputsThe section summarizes the key inputs and methodologies used to evaluate the cost-effectiveness and cost-competitiveness of the CCA under different scenarios. It considers the requirements that an Alameda County CCA would need to meet, the resources that the County has available or could obtain to meet these requirements, and the PG&E rates that the CCA would be competing against. It also describes the pro forma analysis methodology that is used to evaluate the financial feasibility of the CCA.
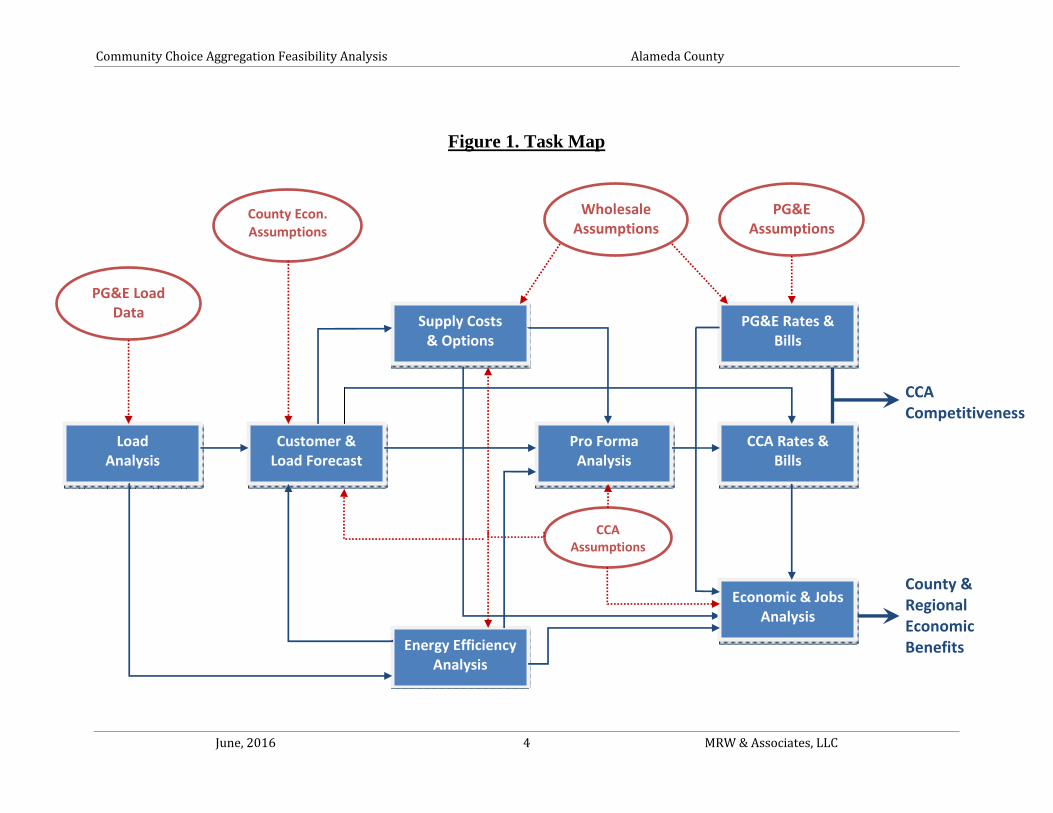
Understanding the interrelationships of all the tasks and using consistent and coherent assumptions throughout are critical to delivering a quality work product. Figure 1 shows the analysis elements (blue boxes) and major assumptions (red ovals) and how they relate to each other. As the figure illustrates, there are numerous integrations between the tasks. For example, the load forecast is a function of not only the load analysis, but also of projections of economic activity in the county and outcome of the energy efficiency analysis.
Two important points are highlighted in this figure. First, it is critical that wholesale power market and prices assumptions are consistent between the CCA and PG&E. While there are reasons that one might have lower or higher costs than the other for a particular product (e.g., CCAs can use tax-free debt to finance generation projects while PG&E cannot), both will participate in the wider Western US gas and power markets and therefore will be subject to the same underlying market forces. To apply power cost assumptions to the CCA than to PG&E, such as simply escalating PG&E rates while deriving the CCA rates using a bottom-up approach, will result in erroneous results. Second, virtually all elements of the analysis feed into the economic and jobs assessment. As is described in detail in Chapter 5, the Study here uses a state-of-the art macroeconomic model that can account for numerous activities in the economy, which allows for a much more comprehensive—and accurate—assessment than a simple input-output model.
CommunityChoiceAggregationFeasibilityAnalysis AlamedaCounty
June,2016 4 MRW&Associates,LLC
Figure 1. Task Map
Economic & JobsAnalysis
Load Analysis
Customer & Load Forecast
CCA Rates & Bills
Pro Forma Analysis
Supply Costs & Options
Energy EfficiencyAnalysis
PG&E Rates & Bills
PG&E Load Data
Wholesale Assumptions
CCA Assumptions
PG&E Assumptions
CCA Competitiveness
County & Regional Economic Benefits
County Econ. Assumptions

CommunityChoiceAggregationFeasibilityAnalysis AlamedaCounty
June,2016 1 MRW&Associates,LLC
Alameda County Loads and CCA Load Forecasts
MRW used PG&E bills from 2014 for all PG&E bundled service customers within the Alameda County region as the starting point for developing electrical load and peak demand forecasts for the Alameda CCA program.8 Figure 2 provides a snapshot of Alameda County load in 2014 by city and by rate class. PG&E’s total electricity load in 2014 from Alameda County bundled customers was approximately 8,000 GWh.9 The cities of Oakland, Fremont, and Hayward were together responsible for half the county load, with Berkeley, San Leandro, and Pleasanton also contributing substantially. Residential and commercial customers made up the majority of the county load, with smaller contributions from the industrial and public sectors (Figure 3). This same sector-level distribution of load is also apparent at the jurisdictional level for most cities, with the exception of the city of Berkeley. The city of Berkeley’s load has a significant public-sector footprint due to the presence of the University of California, Berkeley.
Figure 2. PG&E’s 2014 Bundled Load in Alameda County by Jurisdiction and Rate Class
8 Detailed monthly usage data provided by PG&E to Alameda County. 9 As determined from bill data provided by PG&E. “Bundled” load includes only load for which PG&E supplies the power; it excludes load from Direct Access customers and load met by customer self-generation.

CommunityChoiceAggregationFeasibilityAnalysis AlamedaCounty
June,2016 2 MRW&Associates,LLC
Figure 3. PG&E’s 2014 Bundled Load in Alameda County by Rate Class
To estimate CCA loads from PG&E’s 2014 bundled loads, MRW assumed a CCA participation rate of 85% (i.e., 15% of customers opt to stay with PG&E) and a three-year phase in period from 2017 to 2019, with 33% of potential CCA load included in the CCA in 2017, 67% in 2018, and 100% in 2019. To forecast CCA loads through 2030, MRW used a 0.3% annual average growth rate, consistent with the California Energy Commission’s most recent electricity demand forecast for PG&E’s planning area.10 This growth rate incorporates load reductions from energy efficiency of about 6 GWh per year from 2021 through 2030.
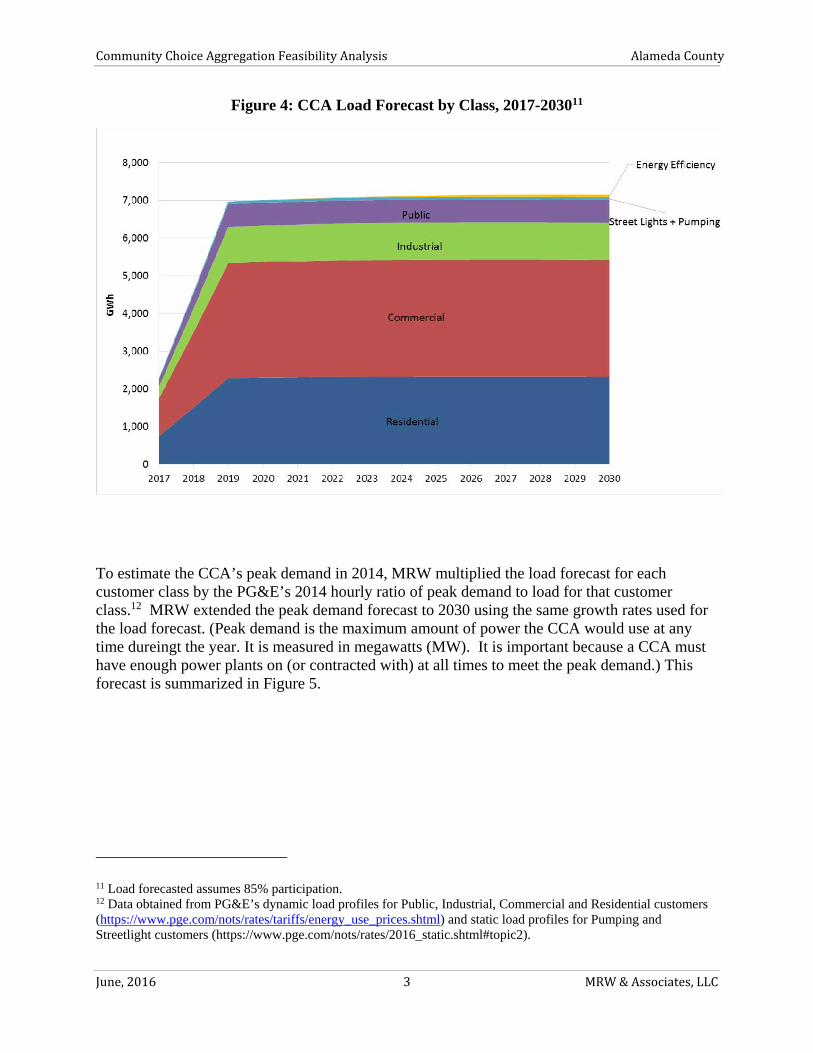
The CCA load forecast is summarized in Figure 4, which shows annual projected CCA loads by class, with the energy efficiency savings that are included in the forecast indicated by the top (yellow) segment.
10 California Energy Commission. Form 1.1c California Energy Demand Updated Forecast, 2015 - 2025, Mid Demand Baseline Case, Mid AAEE Savings. January 20, 2015 http://www.energy.ca.gov/2014_energypolicy/documents/demand_forecast_cmf/LSE_and_BA/
CommunityChoiceAggregationFeasibilityAnalysis AlamedaCounty
June,2016 3 MRW&Associates,LLC
Figure 4: CCA Load Forecast by Class, 2017-203011
To estimate the CCA’s peak demand in 2014, MRW multiplied the load forecast for each customer class by the PG&E’s 2014 hourly ratio of peak demand to load for that customer class.12 MRW extended the peak demand forecast to 2030 using the same growth rates used for the load forecast. (Peak demand is the maximum amount of power the CCA would use at any time dureingt the year. It is measured in megawatts (MW). It is important because a CCA must have enough power plants on (or contracted with) at all times to meet the peak demand.) This forecast is summarized in Figure 5.
11 Load forecasted assumes 85% participation. 12 Data obtained from PG&E’s dynamic load profiles for Public, Industrial, Commercial and Residential customers (https://www.pge.com/nots/rates/tariffs/energy_use_prices.shtml) and static load profiles for Pumping and Streetlight customers (https://www.pge.com/nots/rates/2016_static.shtml#topic2).

CommunityChoiceAggregationFeasibilityAnalysis AlamedaCounty
June,2016 4 MRW&Associates,LLC
Figure 6. CCA Peak Demand Forecast, 2017-2030
Energy Efficiency
The assessment of energy efficiency potential in Alameda County completed for this feasibility study used outputs from the 201313 and 201514 Energy Efficiency Potential and Goals studies developed by the CPUC. These CPUC studies define the technical and economic potential for energy efficiency in PG&E’s service territory. They also determine the market potential used to set goals and budgets for PG&E’s energy efficiency programs.15 Because of its size, varied economy, diverse demographics, and range of climates, it is likely that both energy use characteristics and the potential for energy efficiency in Alameda County is consistent with the potential for energy efficiency in PG&E’s overall service territory, with some exceptions, such as a reduced presence of agricultural and oil extraction loads found elsewhere in the state. Based on these consistencies, this analysis concludes that the energy efficiency potential for electricity in PG&E’s overall service territory as presented in the CPUC studies can be allocated to Alameda County in proportion to overall electricity sales, which average approximately 7.5% of total annual PG&E electricity sales.
Using this approach to interpreting the output from CPUC potential studies, Table 1 provides a range of estimates of technical and economic potential in Alameda County for a forecast horizon from the 2017 to 2024. This provides a general indication of the total amount of energy efficiency potential that exists in Alameda County that PG&E and any CCA administered programs would be serving.
13 2013 California Energy Efficiency Potential and Goals Study, Final Report. Prepared for the California Public Utilities Commission by Navigant Consulting, Inc. February 14, 2014 14 Energy Efficiency Potential and Goals Study for 2015 and Beyond, Stage 1 Final Report. Prepared for the California Public Utilities Commission by Navigant Consulting, Inc. Reference No.: 174655, September 25, 2015 15 See Appendix A for a discussion of technical, economic, and market potential.

CommunityChoiceAggregationFeasibilityAnalysis AlamedaCounty
June,2016 5 MRW&Associates,LLC
Table 1. Alameda County Average Technical and Economic Energy Efficiency Potential
Metric Technical Potential Economic Potential
Range (% of sales) 21% 16% 18% 15%
Potential (GWh) 1,623 1,237 1,391 1,159
Table 2 provides a forecast of the market potential for energy efficiency based on a similar analysis market forecasts from the CPUC potential studies. The row labeled “PG&E Goals” represents Alameda County’s share of the market potential forecast which formed the basis for PG&E’s 2015 energy efficiency program portfolio savings targets.16 That is, because Alameda is in PG&E’s service area, it provides, and will continue to provide, energy efficiency programs to Alameda county residents and businesses. This row shows this amount. The row labeled “High Savings Scenario” represents the energy efficiency savings attributable to Alameda County in the CPUC potential study’s high savings scenario.17 The row labelled ”Incremental Potential” is the difference between PG&E’s 2015 portfolio goals for Alameda County and the high savings scenario for the County. This row represents the total market potential that could be served by CCA administered programs. The forecast presented in Table 2
Table 2. Alameda County Incremental Energy Efficiency Market Potential (GWh)18
Year 2017 2018 2019 2020 2021 2022 2023 2024
Alameda Component of PG&E Goals
25.9 35.8 24.6 29.4 41.1 48.2 50.0 25.9
Alameda of High Savings Scenario
44.2 59.8 56.6 65.6 71.7 84.2 88.4 44.2
Incremental Potential 18.3 24.0 32.0 36.3 30.6 36.0 38.4 18.3
While there are countless opportunities and approaches to achieve energy efficiency, several examples of technologies and programs that will yield savings above what is being targeted through the current portfolio of PG&E programs operating in Alameda County are listed below. This includes initiatives that might compliment and leverage existing technologies or programs, or highlight emerging opportunities that are in design or early deployment.
High efficiency LED lighting initiatives targeting high lumen per watt technologies.
16 Net GWh, as defined by the CEC Mid Additional Achievable Energy Efficiency (AAEE) forecast 17 Referred to as the High AAEE Potential Scenario 18 Savings values do not include energy efficiency potential associated with building codes, appliance standards, or estimates for the agricultural or mining market sectors.

CommunityChoiceAggregationFeasibilityAnalysis AlamedaCounty
June,2016 6 MRW&Associates,LLC
Advanced controls for lighting and platforms that integrate advanced building information & energy management systems.
Increased use of over 50 market ready funding and financing products that can be used to implement sustainability projects in all market sectors.
High Opportunity Programs and Projects (HOPPs) being submitted in response to AB802, such as the Residential Pay-for-Performance HOPP being proposed by PG&E may provide an opportunity to drive higher participation Property Assessed Clean Energy (PACE) programs currently operating throughout Alameda.
CCA Supplies
The CCA’s primary function is to procure supplies to meet the electrical loads of its customers. This requires balancing energy supply and demand on an hourly basis. It also requires procuring generating capacity (i.e. the ability to provide energy when needed) to ensure that customer loads can be met reliably.19 In addition to simply meeting the energy and capacity needs of its customers, the CCA must meet other procurement objectives. By law, the CCA must supply a certain portion of its sales to customers from eligible renewable resources. This Renewable Portfolio Standard (RPS), requires 33% renewable energy supply by 2020, increasing to 50% by 2030. The CCA may choose to source a greater share of its supply from renewable sources than the minimum requirements, or may seek to otherwise reduce the environmental impact of its supply portfolio. The CCA may also use its procurement function to meet other objectives, such as sourcing a portion of its supply from local projects to promote economic development in the county.
The Alameda CCA would be taking over these procurement responsibilities from PG&E for those customers who do not opt out of the CCA to remain bundled customers of PG&E. To retain customers, the CCA’s offerings and rates must compete favorably with those of PG&E.
The CCA’s specific procurement objectives, and its strategy for meeting those objectives, will be determined by the CCA through an implementation plan, startup activities and ongoing management of the CCA. The purpose of this study is to assess the feasibility of establishing a CCA to serve Alameda County based on a forecast of costs and benefits. This forecast requires making certain assumptions about how the CCA will operate and the objectives it will pursue. To address the uncertainty associated with these assumptions, we have evaluated three different supply scenarios and have generally made conservative assumptions about the ways in which the CCA would meet the objectives discussed above. In no way does this study prescribe actions to be taken by the CCA should one be established.
The three supply scenarios that we considered are:
19 The California Public Utilities Commission (CPUC) requires that load serving entities like CCAs demonstrate that they have procured resource adequacy capacity to meet at least 115% of their expected peak load. Since Alameda falls within the Greater Bay Area Local Reliability Area, it must also meet its share of local resource adequacy requirements.

CommunityChoiceAggregationFeasibilityAnalysis AlamedaCounty
June,2016 7 MRW&Associates,LLC
1. Minimum RPS Compliance: The CCA meets the state-mandated 33% RPS requirement in 2020 and the 50% RPS requirement in 2030;
2. More Aggressive: The CCA’s supply portfolio is set at 50% RPS from the first year onward, plus additional amounts of non-RPS compliant large hydro power to reduce GHG emissions;
3. Ultra-Low GHG: The CCA’s supply portfolio is set at 50% RPS in the first year and increases to 80% RPS by the fifth year.
To evaluate these scenarios we assumed a simple portfolio consisting of RPS-eligible resources in an amount dictated by the particular scenario, with the balance of supply provided by non-renewable wholesale market purchases. In each case, we assumed that the RPS portfolio was predominately supplied with solar and wind resources, which are currently the low-cost sources of renewable energy. We assumed that solar and wind each contribute 45% of the renewable energy supply on an annual basis. To provide resource diversity and partly address the need for supply at times when solar and wind production are low, we assumed the remaining 10% of renewable supply would be provided by higher-cost baseload resources, such as geothermal or biomass.
As mentioned above, the CCA may choose to source a portion of its supply from local resources. Alameda County has significant potential for both wind and solar production. The wind resource is located in the Altamont Pass and largely consists of repowering existing turbines with a smaller number of much larger turbines. Costs are generally competitive with other California wind areas, however, the ability to develop projects is constrained by environmental impacts, primarily avian mortality in the Altamont Pass. A Programmatic Environmental Impact Report (PEIR) for the Alameda County portion of the Altamont Pass repowering would allow development of up to 450 MW. Since this amount of capacity may be developed regardless of whether the CCA is formed, and CCA local procurement wouldn’t necessarily increase the amount of wind developed in the Altamont Pass, we have made the conservative assumption that the wind portfolio would effectively be from projects located outside of Alameda County. Thus, for the purpose of this study, we assumed that all of the local procurement by the CCA would be from solar energy, including a mix of smaller and larger projects.20
Figure 7 through Figure 9 show the assumed build-out of new resources under each of the three scenarios outlined above.
20 Note that customer-owned generation, such as rooftop photovoltaic panels, is reflected in the load forecast rather than considered part of the supply portfolio. (I.e., the load forecast is what the CCA must serve, not the gross consumption at the home prior to factoring in customer-side PV.)

CommunityChoiceAggregationFeasibilityAnalysis AlamedaCounty
June,2016 8 MRW&Associates,LLC
Figure 7. Senario 1 CCA Build-Out
Figure 8. Scenario 2 CCA Build-Out
Figure 9. Scenario 3 CCA Build-Out

CommunityChoiceAggregationFeasibilityAnalysis AlamedaCounty
June,2016 9 MRW&Associates,LLC
Power Supply Cost Assumptions
As discussed above, the CCA would procure a portfolio of resources to meet its customers’ needs, which would consist of a mix of renewable and non-renewable (i.e., wholesale market) resources. As shown in Figure 10, the products to be purchased by the CCA consist generally of energy, capacity and renewable attributes (which for counting purposes take the form of renewable energy credits, or RECs).21
Figure 10. Power Supply Cost Elements
The CCA will be procuring supplies from the same competitive market for resources as PG&E. As a result, we assume that the costs for renewable and non-renewable energy and for resource adequacy capacity are the same for the CCA as for new purchases made by PG&E (as used in our forecast of PG&E rates discussed below). Wholesale market prices for electricity in California are largely driven by the cost of operating natural gas fueled power plants, since these plants typically have the highest operating costs and are the marginal units. As a result, market prices are a function of the efficiency of the marginal generators, the price of natural gas and the cost of GHG allowances. MRW developed forecasts of these elements to derive a power price forecast for use in determining costs for the CCA and PG&E. Capacity prices are based on prices for resource adequacy contracts reported by the CPUC.
MRW developed a forecast of renewable generation prices starting from an assessment of the current market price for renewable power. For the current market price, MRW relied on wind and solar contract prices reported by California municipal utilities and CCAs in 2015 and early 2016, finding an average price of $49/MWh for the solar contracts, $55/MWh for windpower
21 RECs are typically bundled with energy deliveries from renewable energy projects, with each REC representing 1 MWh of renewable energy. A limited number of unbundled RECs may be used to meet RPS requirements. For the purpose of this study we have not considered unbundled RECs and have rather estimated costs based on renewable energy contracts where the RECs are bundled.

CommunityChoiceAggregationFeasibilityAnalysis AlamedaCounty
June,2016 10 MRW&Associates,LLC
and $80/MWh for geothermal.22 We used these prices as the starting point for our forecast of CCA renewable energy procurement costs. For geothermal, which is a relatively mature technology, we assumed that new contract prices would simply escalate with inflation. Solar and wind prices are a function of technology costs, which have generally been declining over time; financing costs, which have been very low in recent years; and tax incentives, which significantly reduce project costs, but phase out over time. In the near-term we would not expect prices to increase as technology costs and continued tax incentives provide downward pressure and likely offset any increase in financing costs or other competitive pressure from an increasing demand for renewable energy in California. Thus we have held solar and wind prices constant in nominal dollars through 2020. Beyond 2020, with increasing competitive pressure associated with the drive to a 50% RPS and the anticipated phase-out of federal tax incentives (offset in part by continued declining technology costs), we would expect prices to increase somewhat and have assumed they escalate at the rate of inflation. In addition to this base case price outlook, we also consider a high solar cost scenario based on work performed by Lawrence Berkeley Laboratory on the value of tax incentives. In the high scenario we assume that costs increase with the phase-out of federal tax incentives, without being offset by declining technology costs. Figure 11 shows the resulting solar price forecasts for the two scenarios.
Figure 11. Solar Price Forecast
22 MRW relied exclusively on prices from municipal utilities and CCAs because investor-owned utility contract prices from this period are not yet public. We included all reported wind and solar power purchase agreements, excluding local builds (which generally come at a price premium), as reported in California Energy Markets, an independent news service from Energy Newsdata, from January 2015-January 2016 (see issues dated July 31, August 14, October 16, October 30, 2015, and January 15, 2016).

CommunityChoiceAggregationFeasibilityAnalysis AlamedaCounty
June,2016 11 MRW&Associates,LLC
Locally-Sited and Developed Renewables
As discussed above, the CCA may choose to contract with or develop renewable projects in the local area to promote economic development or other benefits. For the purpose of this study, we assume that incremental local development resulting from the CCA would be largely solar. Since the solar resource in Alameda County is not as strong as in the desert and inland areas where new utility-scale projects are typically developed (and upon which the above solar price forecast was developed), solar generation costs in Alameda County are expected to be somewhat higher than our price forecast. Based on renewable energy supply curves developed for the CPUC, we assume a 15% premium for projects located in Alameda County.23
Given the limited open space for very large solar projects in the County, we expect a portion of the local projects included in a hypothetical CCA portfolio to be smaller in size (e.g., < 3 MW). Smaller solar projects tend to have higher generation costs since they don’t have the same economies of scale as the larger projects upon which our estimates of market prices are based. We have assumed a 55% generation cost premium for smaller projects, based on the same supply curve study referenced above. Future price changes and economies of scale might lower this value.
In developing the hypothetical portfolios depicted in Figure 7 through Figure 9, we made conservative assumptions about how much local solar development may occur as a result of the CCA. The supply curve study performed for the CPUC estimated roughly 300 MW of solar supply in Alameda County, based on an assessment that five percent of the estimated 6,000 MW of technical potential could be developed, largely as a result of land use conflicts or slope issues that would make solar development infeasible in certain areas. We assume that over the forecast period through 2030, about 1/3 of the estimated 300 MW large solar supply potential in Alameda County is developed as a result of commitments by the CCA.
A discussion of the impacts and implications of greater local renewables can be found in Chapter 7.
Other CCA Supply Costs
The CCA is expected to incur additional costs associated with its procurement function. For example, if the CCA relies on a third-party energy marketing company to manage its portfolio it will likely incur broker fees or other expenses equal to roughly 5% of the forecasted contract costs. The CCA would also incur costs charged by the California Independent System Operator (CAISO) for ancillary services (activities required to ensure reliability) and other expenses. MRW added 5.5% to the CCA’s power supply cost to cover these CAISO costs. Finally, we added an expense associated with managing the CCA’s renewable supply portfolio. Based on an analysis of the expected CCA load shape and the typical generation profile of California solar and wind resources, we observed that there will be hours in which the expected deliveries from renewable contracts will be greater than the CCAs load in that hour. This results from the amount of renewable capacity that must be contracted to meet annual RPS targets and the variability in renewable generation that leads to higher deliveries in some hours and lower
23 CPUC RPS calculator (RETI 2.0)

CommunityChoiceAggregationFeasibilityAnalysis AlamedaCounty
June,2016 12 MRW&Associates,LLC
deliveries in other hours. When high renewable energy deliveries coincide with low loads, the CCA will need to sell the excess, likely at a loss, or curtail deliveries, and potentially have to make up those renewable energy purchases during higher load hours to comply with the RPS. The result is that the procurement costs will be somewhat higher than simply contracting with sufficient capacity to meet the annual RPS.
PG&E Rate and Exit Fee Forecasts
MRW developed a forecast of PG&E’s bundled generation rates and CCA exit fees in order to compare the projected rates that customers would pay as Alameda CCA customers to the projected rates and fees they would pay as bundled PG&E customers.
PG&E Bundled Generation Rates
To ensure a consistent and reliable financial analysis, MRW developed a 30-year forecast of PG&E’s bundled generation rates using market prices for renewable energy purchases, market power purchases, greenhouse gas allowances, and capacity that are consistent with those used in the forecast of Alameda CCA’s supply costs. MRW additionally forecast the cost of PG&E’s existing resource portfolio, adding in market purchases only when necessary to meet projected demand. MRW assumed that near-term changes to PG&E’s generation portfolio would be driven primarily by increases to the Renewable Portfolio Standard requirement in the years leading up to 2030 and by the retirement of the Diablo Canyon nuclear units at the end of their current license periods in 2024 and 2025. More information about this forecast is provided in Appendix B.
MRW forecasts that, on average, PG&E’s generation rates will increase just slightly faster than inflation through 2030, with 2030 rates 3% higher than today’s rates when considered on a constant dollar basis (i.e., assuming zero inflation). Underlying this result are three distinct rate periods:
1. An initial period of faster rate growth through 2023 (1.3% above inflation); 2. A period of rate decline from 2023-2026 (2.5% below inflation) primarily due to the
retirement of Diablo Canyon24; and 3. A period of dampened rate growth through 2030 (0.2% above inflation) primarily due to
the replacement of high-cost renewable power contracts currently in PG&E’s portfolio with new lower-priced contracts (reflecting the significant fall in renewable power prices in recent years).
PG&E’s bundled generation rates in each year of MRW’s forecast are shown in Figure 12, on both a nominal and constant-dollar basis.
24 More information can be found in the Appendix C

CommunityChoiceAggregationFeasibilityAnalysis AlamedaCounty
June,2016 13 MRW&Associates,LLC
Figure 12: PG&E Bundled Generation Rates, nominal and constant-dollar forecasts
PG&E Exit Fee Forecast
In addition to the bundled rate forecast, MRW developed a forecast of the Power Charge Indifference Adjustment (“PCIA”), which is a PG&E exit fee that is charged to CCA customers. The PCIA is intended to pay for the above-market costs of PG&E generation resources that were acquired, or which PG&E committed to acquire, prior to the customer’s departure to CCA. The total cost of these resources is compared to a market-based price benchmark to calculate the “stranded costs” associated with these resources, and CCA customers are charged what is determined to be their fair share of the stranded costs through the PCIA.
MRW forecasted the PCIA charge by modeling expected changes to PCIA-eligible resources and to the market-based price benchmark through 2030, using assumptions consistent with those used in the PG&E rate model. Based on our modelling, we expect the PCIA to increase by 8% over the 2016-2018 period (4% in constant dollars) and subsequently to decline in most years until it drops off completely in the late 2030s. MRW’s forecast of the residential PCIA charge through 2030 is summarized in Table 3.
Table 3. PG&E Residential PCIA Charges, ¢/kWh (nominal)
2015 2018 2020 2025 2030
2.3 2.5 2.2 1.1 0.9
Pro Forma Elements and CCA Costs of Service
MRW conducted a pro forma analysis to evaluate the expected financial performance of the CCA and the CCA’s competitive position vis a vis PG&E. The analysis was conducted on a forward looking basis from the expected start of CCA operations in 2017 through the year 2030, with several scenarios considered to address uncertainty in future circumstances.

CommunityChoiceAggregationFeasibilityAnalysis AlamedaCounty
June,2016 14 MRW&Associates,LLC
Pro Forma Elements
Figure 13 provides a schematic of the pro forma analysis, outlining the input elements of the analysis and the output results. The analysis involves a comparison between the generation-related costs that would be paid by Alameda CCA customers and the generation-related costs that would be paid by PG&E bundled service customers. Costs paid by CCA customers include all CCA-related costs (i.e., supply portfolio costs, net energy efficiency costs,25 and administrative and general costs) and exit fee payments that CCA customers will be required to make to PG&E.
As discussed in previous sections, supply portfolio costs and energy efficiency program costs are informed and affected by CCA loads, by the requirements the CCA will need to meet (or will choose to meet) such as with respect to renewable procurement, and by CCA participation levels, which can vary depending on whether or not all cities in the county choose to join the CCA. Administrative and general costs are discussed further below.
Figure 13. Pro forma Analysis
25 We anticipate that Alameda CCA’s energy efficiency costs will be fully offset by Public Benefits Charge revenue provided by PG&E for the purpose of energy efficiency programming and that net costs to Alameda CCA will be zero.
Pro-forma analysis
Inputs: selection of scenarios and cities
Load Forecast
PG&E Generation Rate
Forecast
Supply Costs Forecast
Adm. Costs Forecast
Assessment of CCA viability and CCA customer rates vs, PG&E customer rates (also accounts for reserve fund contributions)
Exit fees Forecast
Net Energy Efficiency Costs
Forecast
Generation Rates paid by Alameda CCA Customers (also accounts for debt interest)

CommunityChoiceAggregationFeasibilityAnalysis AlamedaCounty
June,2016 15 MRW&Associates,LLC
Startup Costs
Table 4 shows the estimated CCA startup costs. They are based on the experience of the existing CCAs as well as from other CCA feasibility assessments.
Table 4. Estimated Start-Up Costs
Item Cost
Technical Study $200,000
JPA Formation/Development $100,000
Implementation Plan Development $50,000
Power Supplier Solicitation & Contracting $75,000
Staffing $1,000,000
Consultants and Legal Counsel $500,000
Marketing & Communications $500,000
PG&E Service Fees $75,000
CCA Bond $100,000
Miscellaneous $500,000
Total $ 3,300,000
Working Capital $51,000,000
Total $54,300.000
Working capital is set to equal three months of CCA revenue, or approximately $50 million. This amount would cover the timing lag between when invoices for power purchases (and other account payables) must be remitted and when income is received from the customers. Initially, the working capital is provided by a bank on credit to the CCA. Typical power purchase contracts require payment for the prior month’s purchases by the 20th of the current month. Customers’ payments are typically received 60 to 90 days from when the power is delivered.
These startup costs are assumed to be financed over 5 years at 5% interest.
Energy Efficiency Program Costs
CCA’s have the opportunity use both electric and gas public purpose program funds to provide energy efficiency programs to customers, and using rules defined in CPUC Ruling R.09-11-014 and various cost reports.26As discussed in Chapter 7, approximately $3.9 million would be available for programs administered by a CCA to Alameda County residents, including both
26 Electric and Gas Utility Cost Report. Public Utilities Code Section 913 Report to the Governor and Legislature, April 2016.

CommunityChoiceAggregationFeasibilityAnalysis AlamedaCounty
June,2016 16 MRW&Associates,LLC
CCA and PG&E customers, or $3.5 million if these programs serve only CCA customers, assuming a 15% opt-out rate. This latter case was modeled.
Administrative and General Cost Inputs
Administrative and general costs cover the everyday operations of the CCA, including costs for billing, data management, customer service, employee salaries, contractor payments, and fees paid to PG&E. MRW conducted a survey of the financial reports of existing CCAs to develop estimates of the costs that would be faced by an Alameda County CCA. Administrative and general costs are phased in from 2017 to 2019, as the CCA operations expand to cover the entire territory of the county; after that, costs are escalated by 2% each year to account for the effects of inflation.
Administrative and general costs are unchanged under the three renewable level scenarios, but do vary based on how many cities join the CCA and the number of participating customer accounts. As previously mentioned, a 15% opt-out rate has been assumed for customer participation.
Cost of Service Analysis and Reserve Fund
To determine annual CCA costs and the rates that would need to be charged to CCA customers to cover these costs, MRW summed the three categories of CCA costs (i.e., supply portfolio costs, net energy efficiency costs, and administrative and general costs) and added in debt financing to cover start-up costs and initial working capital. Financing was assumed to be for a five-year period at an interest rate of 5%. These costs were divided by projected CCA loads to develop the average rate the CCA would need to charge customers to cover its costs (“minimum CCA rate”).
To establish the Alameda CCA rate, MRW adjusted the minimum CCA rate, if needed, based on the competitive position of the CCA. In particular, when the total CCA customer rate (i.e., the minimum CCA rate plus the PG&E exit fee) was below the projected PG&E generation rate,27 MRW increased the minimum CCA rate up to the amount needed to meet the reserve refund targets while still maintaining a discount. MRW used the surplus CCA revenue from these rate increases (“Reserve Fund”) in order to maintain Alameda CCA competitiveness with PG&E rates in years in which total CCA customer rates would otherwise be higher than PG&E generation rates.28
27 For this analysis, MRW used the average of the projected PG&E generation rates across all rate classes, weighted by the projected Alameda CCA load in each rate class. 28 MRW applied a Reserve Fund cap of 15% of the annual operating cost. After this cap was reached, no further rate increases were applied for the purpose of Reserve Fund contributions.

CommunityChoiceAggregationFeasibilityAnalysis AlamedaCounty
June,2016 17 MRW&Associates,LLC
Chapter3:CostandBenefitAnalysisAs described in the prior chapter, as part of the pro forma analysis, MRW calculated Alameda CCA rates that would, where feasible, cover CCA costs and maintain long-term competitiveness with PG&E. This chapter uses those rates to compare the costs and benefits of the Alameda CCA across three scenarios: (1) Renewable Compliance, (2) Accelerated RPS and (3) 80% RPS by 2021. Costs and benefits are evaluated by comparing total CCA customer rates (including PG&E exit fees) to PG&E generation rates to assess the net bill savings (costs) for customers that join the CCA.
Scenario 1 (Renewable Compliance)
Under Scenario 1, the Alameda CCA meets all RPS requirements (including Senate Bill 350 requirements) and does not obtain incremental renewable power or low-carbon power in excess of these requirements.
Rate Differentials
Figure 14 summarizes the results of this scenario in the form of the total Alameda CCA customer rate (vertical bars) and the comparable PG&E generation rate (line).29 Of the CCA cost elements, the greatest cost is for non-renewable generation followed by the cost for the renewable generation, which increases over the years according to the RPS standards. Another important CCA customer cost is the PCIA exit fee, which is expected to decrease in most years beginning in 2019 and to become less important over time.
Under Scenario 1, the differential between PG&E generation rates and Alameda CCA customer rates is positive in each year (i.e., CCA rates are lower than PG&E rates). As a result, Alameda CCA customers’ average generation rate (including contributions to the reserve fund) can be set at a level that is lower than PG&E’s average customer generation rate in each year. The annual differential between the PG&E rate and the total CCA customer rate is expected to vary significantly over the course of this period (Figure 14). During the initial period from 2017-2023, the differential between the two rates increases (i.e., the CCA becomes more cost-competitive) due to an expected decrease in the exit fees charged to Alameda CCA customers. Beginning in 2024, the rate differential narrows due to a decrease in PG&E generation rates stemming from the closure of the Diablo Canyon nuclear plant. After 2026, the difference between the two rates is expected to increase at a modest rate as PG&E’s generation rates stabilize and exit fees decline.
29 All rates are in nominal dollars

CommunityChoiceAggregationFeasibilityAnalysis AlamedaCounty
June,2016 18 MRW&Associates,LLC
Figure 14. Scenario 1 Rate Savings, 2017-2030
Residential Bill Impacts
Table 5 shows the average annual savings for Residential customers under Scenario 1. The average annual bill for the residential customer on the Alameda CCA program will be on average 7% lower than the same bill on PG&E rates.
Table 6. Scenario 1 Savings for Residential CCA Customers
Residential Monthly
Consumption (kWh)
Bill with PG&E ($)
Bill with Alameda CCA
($) Savings ($) Savings (%)
2017 650 147 142 5 3%
2020 650 160 145 15 9%
2030 650 201 188 13 6%
Greenhouse Gas Emissions
Figure 15 shows the GHG emissions from 2017-2030 for Alameda CCA under Scenario 1, and PG&E’s expected emissions for the same load if no CCA is formed. The CCA’s GHG emissions initially increase from 2017 to 2019 as the CCA is phased in across the county (from serving 33% potential county load in 2017 to 100% in 2019), and then decrease steadily in the following years as the CCA’s renewable content grows pursuant to SB 350’s requirements of 50% RPS by 2030. PG&E emissions are lower than those of the CCA in this scenario due to the diversity in

CommunityChoiceAggregationFeasibilityAnalysis AlamedaCounty
June,2016 19 MRW&Associates,LLC
PG&E’s electric mix. Besides renewable generation, over 40% of PG&E’s supply portfolio is made up of nuclear and large hydro generation, both of which are emissions-free generation technologies. PG&E’s GHG emissions decrease before 2019 and increase between 2019 and 2024 due to the changes in its RPS procurement.30 In 2025, the retirement of the Diablo Canyon nuclear generation plant increases PG&E’s GHG emissions by approximately 30% as the utility will need to increase its fuel-fired generation to make up for the loss. In the following years PG&E’s GHG emissions are expected to decrease as it ramps up renewable procurement to meet its mandated RPS goals.
Figure 16. Scenario 1 GHG Emissions by Year Year (“Normal” PG&E Hydro Conditions)
Scenario 2 (Accelerated RPS)
Under Scenario 2, Alameda CCA meets 50% of its load through renewable power starting from 2017, while 50% of its non-renewable load is met through hydro-electricity.
Rate Differentials
Figure 17 summarizes the results for this scenario, with the vertical bars representing the Alameda CCA customer rate and the counterpart PG&E generation rate shown as a line. In this
30 According to the PG&E RPS plan PG&E Final 2015 Renewable Energy Procurement Plan, filed in CPUC proceeding R.15-02-020, January 14, 2016, Appendix D, Table 2 and Table 4, the RPS procurement in 2019-2024 falls in average 3.5% annual.

CommunityChoiceAggregationFeasibilityAnalysis AlamedaCounty
June,2016 20 MRW&Associates,LLC
scenario, the renewable lost is the largest single element of the CCA rate, reflecting the higher renewable content of this scenario. Non-renewable generation is the next largest cost component of the rate, followed by the PCIA exit fee. The PCIA exit fee is expected to decrease in most years beginning in 2019, as it did in the case of Scenario 1. However, the costs associated with GHG allowance purchases are a lower portion of the total costs in this scenario because 50% of the non-renewable generation is expected to be met by hydro-electricity, which is a non-emitting resource. This limits the need for purchase of GHG allowances.
The differential between PG&E generation rates and Alameda CCA customer rates in Scenario 2 is lower than that under Scenario 1; however, it continues to follow a similar pattern over the years with respect to PG&E rates, and it is positive in all years from 2017 to 2030. As was the case under Scenario 1, because of this positive differential, Alameda CCA customers’ average generation rate (including contributions to the reserve fund) can be set at a level that is lower than PG&E’s average customer generation rate in each year under this scenario as well.
Figure 17. Scenario 2 Rate Savings, 2017-2030
Residential Bill Impacts
Table 7 below shows the average annual savings for residential customers under Scenario 2. The annual bill for a residential customer on the Alameda CCA program will be for the period 2017-2030 on average 6.5% lower than the same bill on PG&E rates. This is lower than, but close to, bill savings under Scenario 1.

CommunityChoiceAggregationFeasibilityAnalysis AlamedaCounty
June,2016 21 MRW&Associates,LLC
Table 7. Scenario 2 Savings for Residential CCA Customers
Residential Monthly
Consumption (kWh)
Bill with PG&E ($)
Bill with Alameda CCA
($) Savings ($) Savings (%)
2017 650 147 146 1 1%
2020 650 160 147 13 8%
2030 650 201 188 13 6%
GHG Emissions
The Alameda CCA’s GHG emissions under Scenario 2 are much lower than those under Scenario 1. This is due to the higher renewable content in the CCA’s generation mix under Scenario, as well as the 50% hydro content in the non-renewable generation mix.
Figure 18 compares the GHG emissions from 2017-2030 for the Alameda CCA under Scenario 2 with what PG&E’s emissions would be for the same load if no CCA is formed. The Alameda CCA’s emissions increase from 2017 to 2019 as the CCA is phased in across the entire county, and then remain flat through 2030. PG&E’s GHG emissions are initially slightly lower than the CCA’s emissions, but as the CCA’s emissions flatten out, PG&E’s emissions follow a generally upward trend and surpass CCA emissions in 2024, with the expected retirement of Diablo Canyon in 2025 – further bumping up PG&E’s emissions by approximately 30% in 2025. Following this, PG&E’s emissions are expected to decrease from 2026 to 2030 as PG&E procures renewables to meet its mandated RPS goals. However, they still remain higher than the CCA’s expected GHG emissions.
Note that the analysis assumes “normal” hydroelectric output for PG&E. during the drought years, PG&E’s hydro output has been at about 50% of normal, and the utility has made up these lost megawatt-hours through additional gas generation. This means that our PG&E emissions are the PG&E emissions shown here are lower that the “current” emission. If, as is expected by many experts, the recent drought conditions are closer to the “new normal, then PG&E’s GHG emissions in the first 8 years would be approximately 30% higher, resulting in GHG savings for Scenario 2 rather than parity.
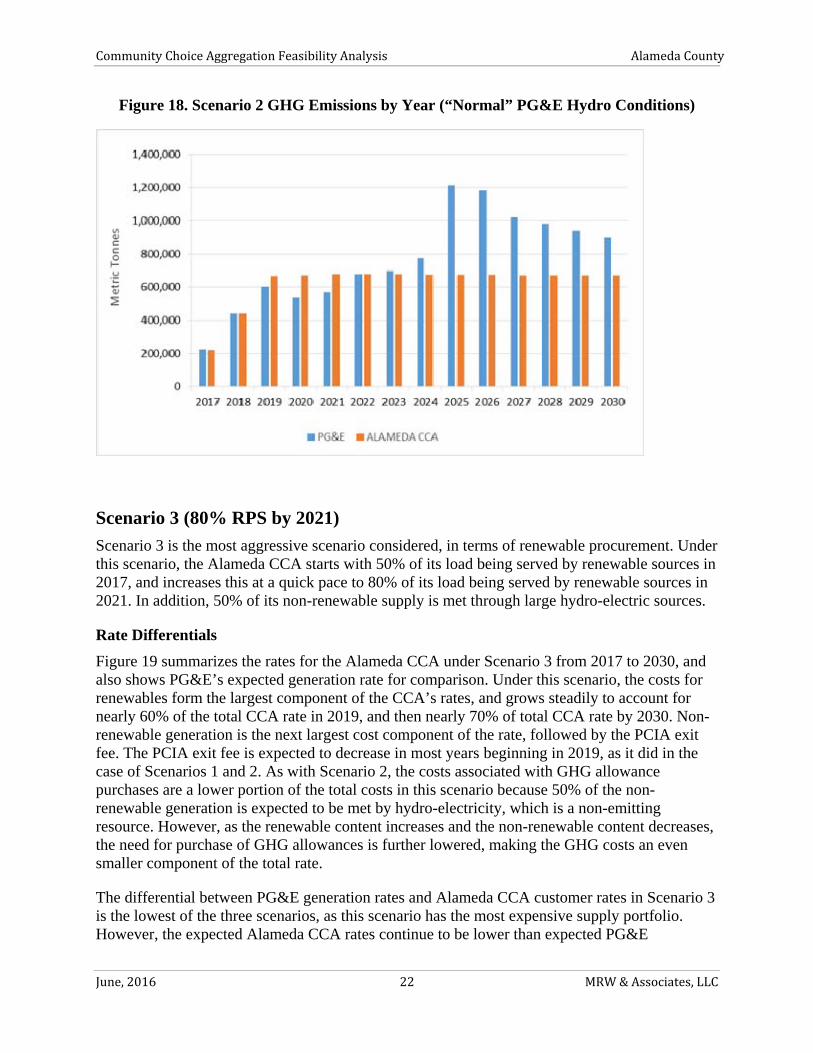
CommunityChoiceAggregationFeasibilityAnalysis AlamedaCounty
June,2016 22 MRW&Associates,LLC
Figure 18. Scenario 2 GHG Emissions by Year (“Normal” PG&E Hydro Conditions)
Scenario 3 (80% RPS by 2021)
Scenario 3 is the most aggressive scenario considered, in terms of renewable procurement. Under this scenario, the Alameda CCA starts with 50% of its load being served by renewable sources in 2017, and increases this at a quick pace to 80% of its load being served by renewable sources in 2021. In addition, 50% of its non-renewable supply is met through large hydro-electric sources.
Rate Differentials
Figure 19 summarizes the rates for the Alameda CCA under Scenario 3 from 2017 to 2030, and also shows PG&E’s expected generation rate for comparison. Under this scenario, the costs for renewables form the largest component of the CCA’s rates, and grows steadily to account for nearly 60% of the total CCA rate in 2019, and then nearly 70% of total CCA rate by 2030. Non-renewable generation is the next largest cost component of the rate, followed by the PCIA exit fee. The PCIA exit fee is expected to decrease in most years beginning in 2019, as it did in the case of Scenarios 1 and 2. As with Scenario 2, the costs associated with GHG allowance purchases are a lower portion of the total costs in this scenario because 50% of the non-renewable generation is expected to be met by hydro-electricity, which is a non-emitting resource. However, as the renewable content increases and the non-renewable content decreases, the need for purchase of GHG allowances is further lowered, making the GHG costs an even smaller component of the total rate.
The differential between PG&E generation rates and Alameda CCA customer rates in Scenario 3 is the lowest of the three scenarios, as this scenario has the most expensive supply portfolio. However, the expected Alameda CCA rates continue to be lower than expected PG&E
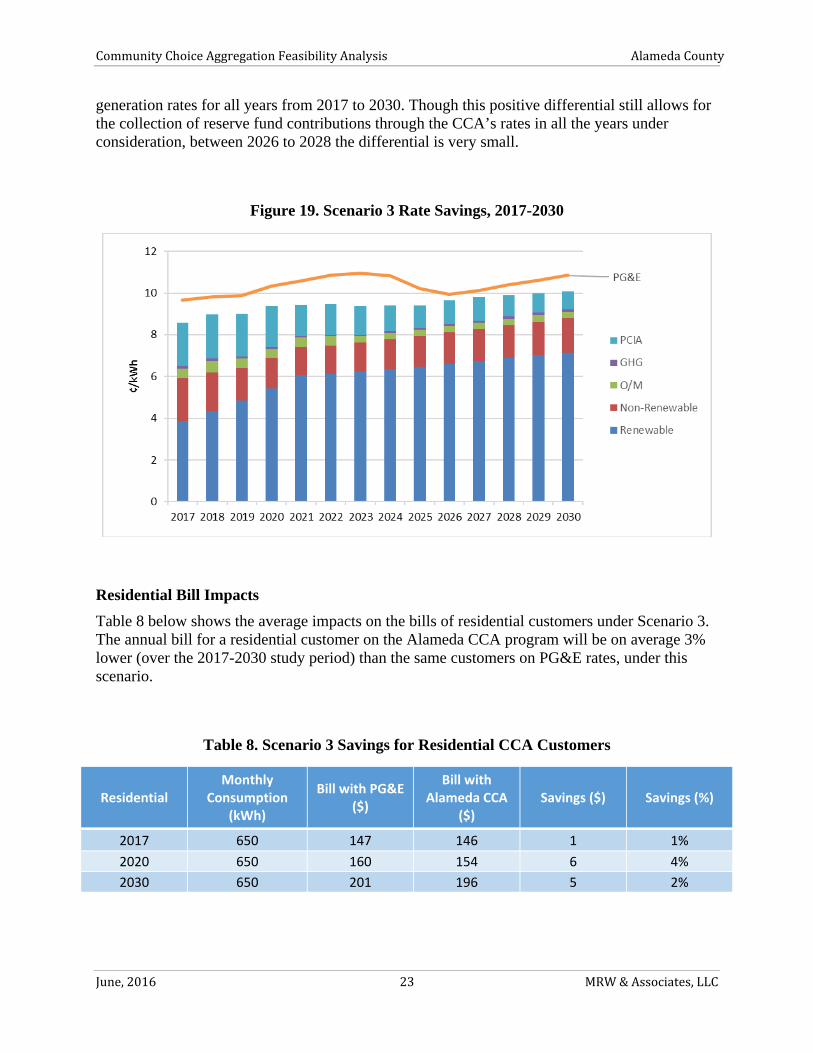
CommunityChoiceAggregationFeasibilityAnalysis AlamedaCounty
June,2016 23 MRW&Associates,LLC
generation rates for all years from 2017 to 2030. Though this positive differential still allows for the collection of reserve fund contributions through the CCA’s rates in all the years under consideration, between 2026 to 2028 the differential is very small.
Figure 19. Scenario 3 Rate Savings, 2017-2030
Residential Bill Impacts
Table 8 below shows the average impacts on the bills of residential customers under Scenario 3. The annual bill for a residential customer on the Alameda CCA program will be on average 3% lower (over the 2017-2030 study period) than the same customers on PG&E rates, under this scenario.
Table 8. Scenario 3 Savings for Residential CCA Customers
Residential Monthly
Consumption (kWh)
Bill with PG&E ($)
Bill with Alameda CCA
($) Savings ($) Savings (%)
2017 650 147 146 1 1%
2020 650 160 154 6 4%
2030 650 201 196 5 2%

CommunityChoiceAggregationFeasibilityAnalysis AlamedaCounty
June,2016 24 MRW&Associates,LLC
GHG Emissions
Similar to Scenarios 1 and 2, under Scenario 3, the Alameda CCA’s GHG emissions first increase from 2017 to 2019 as the CCA is phased in into the entire county. However, in Scenario 3 this increase is partially off-set by the increasing renewable content in the CCA’s supply mix. Thus the CCA’s emissions in this scenario grow at a slower rate from 2017 to 2019 than in the first 2 scenarios, then decrease till 80% renewable supply is achieved in 2021, and remain flat thereafter. The CCA’s GHG emissions under this scenario are lower than PG&E’s expected emissions for the same load if no CCA is formed. Figure 20 shows the expected GHG emissions from the CCA and PG&E for all years from 2017 to 2030.
Figure 20. Scenario 3 GHG Emissions by Year Year (“Normal” PG&E Hydro Conditions)

CommunityChoiceAggregationFeasibilityAnalysis AlamedaCounty
June,2016 25 MRW&Associates,LLC
Chapter4:SensitivityofResultstoKeyInputsIn addition to the base case forecast described above, MRW has assessed alternative cases to evaluate the sensitivity of the results to possible conditions that would have an impact on Alameda CCA’s feasibility study. The metric considered to compare the alternative sensitivity cases to the base case is the differential between the annual average generation rates for PG&E bundled customers and for Alameda CCA customers.31
The base-case analysis (Chapter 3 –Scenario 1) was developed as a reasonable and conservative assessment of the Alameda CCA. In addition to the base case analysis, MRW analyzed alternative cases to address six risks: (1) the relicensing of the Diablo Canyon nuclear units, (2) higher renewable supply costs, (3) higher PCIA charges, (4) higher natural gas prices, (5) lower PG&E portfolio costs, and (6) a combination of the last four of these five risks (stress scenario).
Diablo Canyon Relicensing Sensitivity
In the base case the Diablo Canyon nuclear units are retired at the end of their current operating licenses (Unit 1 in 2024 and Unit 2 in 2025).32 At this time, nuclear retirement appears to be the lower-cost option for PG&E ratepayers given, on the one hand, low market prices for replacement power (both gas-fired and renewable) and, on the other hand, the significant costs PG&E would likely incur to undertake a cooling system modification and potentially other upgrades that would be required to relicense the plant and continue operations.33 Under the relicensing scenario, PG&E’s generation rate would therefore increase, providing a competitive benefit to the Alameda CCA.34 As shown in Table 8, MRW anticipates that the average rate differential over the 2017-2030 period would increase by 1.35¢/kWh under the Diablo Canyon relicensing scenario.
31The Alameda CCA rate includes the PG&E exit fees (PCIA charges) that will be charged to CCA customers but does not include the rate adjustment for the reserve fund. 32 This assumption is consistent with the CPUC’s proposed assumptions for long-term transmission planning. “Administrative Law Judge’s Ruling Seeking Comment on Assumptions and Scenarios for use in the California Independent System Operator’s 2016-17 Transmission Planning Process and Future Commission Proceedings,” CPUC proceeding R.13-12-010, February 8, 2016, page 41. 33The new cooling system, which would be required per state regulations implementing the Federal Clean Water Act, Section 316(b), would have an estimated cost of $4.5 billion. Subcommittee Comments on Bechtel’s Assessment of Alternatives to Once-Through-Cooling for Diablo Canyon Power Plant. November 18, 2014, page 10.34 An increase in PG&E’s rates results in an increase to the CCA customers’ exit fees (which pay for the above-market costs of PG&E’s rates). However, this exit fee increase is much smaller than the PG&E rate increase, and the relicensing scenario provides an overall benefit to the CCA.

CommunityChoiceAggregationFeasibilityAnalysis AlamedaCounty
June,2016 26 MRW&Associates,LLC
Table 9. Diablo Canyon Relicensing Sensitivity Results, 2017-2030
Average PG&E Rate (¢/kWh)
Average Rate Differential (¢/kWh)
Base Case 10.36 2.1
Diablo Canyon Relicensing 11.75 3.4
Higher Renewable Power Prices Sensitivity
This sensitivity case evaluates the impact of higher prices for renewable power on the CCA’s financial viability. As discussed in Appendix B, in the base case, renewable power prices are flat in nominal dollars through 2022, based on the assumption that projected declines in renewable development costs will offset increases associated with the planned expiration of federal renewable tax credits.35,36 In the Higher Renewable Power Prices sensitivity, we assume that renewable prices would be flat in nominal dollars through 2022 if it were not for the tax credit expirations and add the impact of the tax credit expirations to the base case prices. Average renewable power prices in this scenario are 0-10% higher than in the base case scenario through 2021, about 20% higher in 2021 and 2022, and 30% higher after 2022 when the solar investment tax credit is reduced to 10%. These higher prices affect both the CCA and PG&E, but they have a greater effect on the CCA because PG&E has significant amounts of renewable resources under long-term contract. The impact of this stress case is to reduce the 2017-2030 average rate differential by 0.3¢/kWh relative to the base case.
Table 10. Higher Renewable Power Prices Sensitivity Results, 2017-2030
Average Renewable Power Prices
(¢/kWh)37
Average Rate Differential (¢/kWh)
Base Case 5.4 2.1
Higher Renewable Power Prices 6.6 1.8
35 Investment Tax Credit (ITC) which is commonly used by solar developers, is scheduled to remain at its current level of 30% through 2019 and then to fall over three years to 10%, where it is to remain. The federal Production Tax Credit (PTC), which is commonly used by wind developers, is scheduled to be reduced for facilities commencing construction in 2017-2019 and eliminated for subsequent construction. U.S. Department of Energy. Business Energy Investment Tax Credit (ITC). http://energy.gov/savings/business-energy-investment-tax-credit-itc; U.S. Department of Energy. Electricity Production Tax Credit (PTC). http://energy.gov/savings/renewable-electricity-production-tax-credit-ptc 36 The base case forecast would also be consistent with a scenario in which the tax credit expirations are delayed. 37 Average for solar and wind utility scale generation (>3MW), not including local Alameda County generation.

CommunityChoiceAggregationFeasibilityAnalysis AlamedaCounty
June,2016 27 MRW&Associates,LLC
Higher Exit Fee (PCIA) Sensitivity
PG&E’s PCIA exit fees are subject to considerable uncertainty. Under the current methodology, PCIA rates can swing dramatically from one year to the next, and this methodology is currently under review and may be adjusted in the coming years. MRW therefore evaluated a stress case in which PCIA rates don’t fall after 2018, as anticipated in the base case, but instead remain at 2018 levels through 2030. This increases the 2030 PCIA to 250% of its base case value. The impact of this stress case is to reduce the 2017-2030 average rate differential by 0.7¢/kWh relative to the base case.
Table 11. Higher PCIA Exit Fee Sensitivity Results, 2017-2030
Average PCIA Rate
(¢/kWh)
Average Rate Differential (¢/kWh)
Base Case 1.4 2.1
Higher Exit Fees (PCIA) 2.1 1.4
Higher Natural Gas Prices Sensitivity
Natural gas prices have been low and relatively steady over the last few years, but they have historically been quite volatile and subject to significant swings from local supply disruptions (e.g., Hurricanes Katrina and Rita in 2005). MRW analyzed a gas price sensitivity case using the U.S. Energy Information Administration’s High Scenario natural gas prices forecast,38 which is up to 60% higher than MRW’s base case forecast in some years. Natural gas price increases affect power supply costs for both Alameda CCA and PG&E; however, the nuclear and hydroelectric capacity in PG&E’s resource mix makes PG&E less sensitive than Alameda CCA to changes in natural gas prices. The net effect of higher natural gas prices is therefore to increase CCA rates relative to PG&E rates39 (i.e., reduce the average rate differential). Under the sensitivity conditions considered, the 2017-2030 average rate differential decreases relative to the base case by 0.9¢/kWh.
38 U.S. Energy Information Administration. “2015 Annual Energy Outlook,” Table 13 39 For the Scenario 3 the high gas natural prices case is favorable (i.e., the rate differential is higher than the rate differential for the Base Case).

CommunityChoiceAggregationFeasibilityAnalysis AlamedaCounty
June,2016 28 MRW&Associates,LLC
Table 12. Higher Natural Gas Prices Sensitivity Results, 2017-2030
Average Natural Gas Price ($/MMBtu)
Average Rate Differential (¢/kWh)
Base Case 4.85 2.1
Higher Natural Gas Prices 7.67 1.2
Lower PG&E Portfolio Cost Sensitivity
While changes to natural gas prices and renewable power prices affect both the CCA and PG&E, dampening the impact on the CCA’s cost competitiveness, reductions to the costs to operate and maintain PG&E’s nuclear and hydroelectric facilities would provide cost savings to PG&E that would not be offset by cost savings to the CCA. MRW considered a case in which PG&E’s overall generation rates are 10% below the base case, driven by reductions to PG&E’s nuclear and hydroelectric portfolio costs. Under such a scenario, the 2017-2030 average rate differential would be reduced by 1 cent per kWh relative to the base case scenario.
Table 13. Lower PG&E Portfolio Sensitivity Results, 2017-2030
Average PG&E Rate (¢/kWh)
Average Rate Differential (¢/kWh)
Base Case 10.4 2.1
Lower PG&E Portfolio Costs 9.3 1.1
Stress Case and Sensitivity Comparisons
For all but the Diablo Canyon relicensing case, rate differentials (i.e., the CCA’s competitive positions) are lower in the sensitivity cases than in the base case scenario, for all years from 2017 to 2030 (Figure 21). To evaluate a more extreme scenario, MRW developed a stress case that combines all the negative sensitivity cases: (1) higher renewable power prices, (2) lower PG&E portfolio costs, (3) higher PCIA exit fees, and (4) higher natural gas prices. The 2017-2030 average rate differential for this stress case is negative, at -0.7¢/kWh, meaning that CCA customer costs would exceed PG&E customer costs under this scenario.

CommunityChoiceAggregationFeasibilityAnalysis AlamedaCounty
June,2016 29 MRW&Associates,LLC
Table 14. Stress Test Results, 2017-2030
Average Rate Differential (¢/kWh)
Base 2.1
Stress Scenario ‐0.7
Figure 21 shows the difference between the PG&E customer rate and the Alameda CCA customer rate (including exit fees) in the base case and in each of the sensitivity scenarios, for each year from 2017 to 2030. As Figure 21 illustrates, CCA customer rates are lower than PG&E customer rates in each of the individual sensitivity cases in each year and are lower that PG&E customer rates in the stress test case from 2017-2023. Beginning in 2024, CCA customer rates exceed PG&E customer rates in the stress test case (i.e., the rate differential is negative) due to the reduction in PG&E rates as Diablo Canyon is retired and replaced with lower-cost power sources.
Figure 21. Difference Between PG&E Customer Rates and CCA Customer Rates Under Each Sensitivity Case, 2017-2030

CommunityChoiceAggregationFeasibilityAnalysis AlamedaCounty
June,2016 30 MRW&Associates,LLC
The results shown above reflect the RPS Compliance supply scenario. MRW additionally evaluated each sensitivity scenario under the two alternative supply scenarios: (1) Accelerated RPS and (2) 80% RPS by 2021. Figure 22 depicts the average rate differentials for 2017-2030 for each sensitivity case under the three supply scenarios.
Figure 22. Difference Between PG&E Customer Rates and CCA Customer Rates Under Each Sensitivity Case and Supply Scenario, 2017-2030 Average
Scenario 1 (RPS Compliance) is the least costly scenario for the CCA and therefore has the highest rate differential under most of the sensitivity cases considered. Scenario 2 (Accelerated RPS), though still quite competitive with PG&E, fares slightly worse, with a rate differential approximately 8% lower than in Scenario 1 for most of the sensitivity cases considered. The one exception is the “High Natural Gas Price” sensitivity case, in which Scenarios 1 and 2 have about the same results. This is due to the higher renewable content in Scenario 2, which makes the supply portfolio less susceptible to volatility in natural gas prices than Scenario 1. Scenario 3 (80% RPS by 2021) has the highest renewable content and is the costliest scenario, with rate differentials much lower than those in Scenario 1 and Scenario 2. Scenario 3 is anticipated to be competitive with PG&E in most cases (on average); however, the margins are much lower, particularly in the “High Renewable Prices” sensitivity case, and they become negative in the “Low PG&E rates” sensitivity case (i.e., CCA customer rates are higher than PG&E rates). On

CommunityChoiceAggregationFeasibilityAnalysis AlamedaCounty
June,2016 31 MRW&Associates,LLC
the other hand, Scenario 3 is relatively unaffected by the “High Natural Gas Prices” sensitivity case due to the lower share of natural gas power in this supply portfolio.
In the stress case, Alameda CCA customer rates exceed PG&E customer rates on average over the 2017-2030 period for all three scenarios, with the rate differential being highest in Scenario 3 at -1.5¢/kWh. This is double the Scenario 2 stress case rate differential of -0.75¢/kWh.
Conclusions
Under the base case scenario, Alameda CCA customer rates compare quite favorably to PG&E rates in all years from 2017 to 2030, under all three supply scenarios. Furthermore, under the base supply scenario (RPS compliance), Alameda CCA customer rates remain below PG&E rates under all but the most extreme sensitivity case considered. However, under the alternate supply scenarios, as the CCA renewable content increases, the CCA becomes less completive with PG&E. This is especially pronounced in the 80%-by-2021 scenario, which shows marginal or negative competitiveness vis a vis PG&E in a number of scenarios. Under the stress case, irrespective of the supply scenario considered, CCA rates are higher than PG&E rates. While the stress case may appear extreme given that it involves four adverse sensitivities simultaneously occurring, cost volatility in the power industry is well-established, and the possibility of adverse conditions arising should be understood and planned for in any CCA venture.
CommunityChoiceAggregationFeasibilityAnalysis AlamedaCounty
June,2016 32 MRW&Associates,LLC
Chapter5:MacroeconomicImpactsEach of the three scenarios discussed thus far is next examined for job impacts within Alameda County. To understand just how job impacts can come about, and the extent of those changes (plus or minus), a brief description of elements associated with the CCA and how they influence the existing economy is provided.
How a CCA interacts with the Surrounding Economy
The establishment and operation of a CCA creates a new set of spending (also referred to as demands) elements as a community changes the type of electricity generation they want to purchase, where the new mix of generation is (to be) located, adjustments necessary for existing generating assets of the provider utility, and implications on customers’ bills as a result of retail rate differentials. Some of these new elements have temporary effects, while others have long-term effects. Investment in locally situated elements (such as operation & maintenance) will result in the direct creation of jobs, and when a job is created in a sector, there will be a multiplier response on “backwardly-linked” jobs with supplier businesses. The new elements include:
Administration – [direct jobs, long-term effect] county staffing, professional-technical services and I/T-database services
Net Rate Savings (or bill savings) – [long-term effect] county households have an increase in their spending ability, county commercial and industrial energy customers experience a reduction in their costs-of-doing business which makes them each more competitive, garnering more business that requires more employees, and municipal energy customers can provide more local services which requires more local government staff.
New Renewable Capacity Investment within County – [direct jobs, short-term] New Renewable Operations within County – [direct jobs, long-term] New Energy-efficiency within County – [direct jobs, short-term] Net Generating Capacity and Operations offsets for PG&E outside of county –
[direct jobs, short & long-term]
To frame expectations around how many direct jobs can be created in the county from the above CCA elements, consideration must be given to (a) how much of the spending associated with the CCA scenario is fulfilled by a within county business or resident workforce, and (b) what do these locally-fulfilled dollars represent in terms of current annual county business activity, e.g. is this a large spending event.
Table 15 presents these considerations, which are shaped in part by assumptions defined by the MRW study team. For instance, the labor share required on the annual investments (or the operating budget) was assumed to be 100 percent satisfied by within county resident laborers.

CommunityChoiceAggregationFeasibilityAnalysis AlamedaCounty
June,2016 33 MRW&Associates,LLC
Table 15. Initial Investment within Alameda County from Proposed CCA
2017 to 2030
CCA Scenario
Local Capture on RE investments (billion$)
As % of County’s Total RE
investment
As % of County’s Expected Economic
Activity
Bill Savings (billion$)
1 $0.42 44% 0.01% $1.57
2 $0.42 44% 0.01% $1.51
3 $0.45 45% 0.01% $0.52
As can be seen from the table, the initial local investment that would result from building and operating additional renewable projects in Alameda County between the years 2017 to 2030 represents a very small portion of the County’s total expected economic activity, 40 even assuming all of the project costs are directed locally (usually 56% of the project costs would be funneled outside the county due to procurement of equipment from outside the county). By contrast bill savings for scenarios 1 and 2 provide over three fold the benefits of initial local investment. These bill savings indirectly stimulate the economy and ultimately create jobs.
Table 16 illustrates this through high-level results expressed as average annual job changes for the three CCA scenarios. While scenarios 1 and 2 create nearly identical direct jobs (due to comparable investment in local renewable projects), scenario 1 creates far more TOTAL jobs. This is due to the higher bill savings under scenario 1. Scenario 3 creates a few more direct jobs, but far fewer total jobs, due to decreased bill savings as compared to the other two scenarios. As a result, its total job impact is 55 percent of the scenario 1 total job impact. A more detailed discussion of these results will follow later.
Table 16. Average Annual Jobs created in Alameda County by the CCA – Direct and Total Impacts
2017 – to – 2030 County Impacts
CCA Scenario
Local Capture on RE investments (billion$)
Bill Savings (billion$)
Average Annual
DIRECT Jobs
Average Annual
TOTAL Jobs
1 $0.42 $1.57 165 1322
2 $0.42 $1.51 166 1286
3 $0.45 $0.52 174 731
40 Forecast to be $3,500 billion (nominal). Source REMI Policy Insight model, Alameda County forecast.

CommunityChoiceAggregationFeasibilityAnalysis AlamedaCounty
June,2016 34 MRW&Associates,LLC
How Job Impacts Are Measured
The scenario-specific elements described in the prior section are expressed as annual dollar amounts (plus or minus) in comparison to what would have been expected in the county economy without a CCA. Initially these amounts supplied by MRW and Tierra are general, representing total project cost by year. The annual investment for specific types of renewable energy projects and of making further energy-efficiency improvements are really comprised of some portion spent on installation labor, a large portion for the equipment (either manufactured in the region or if not, a leakage to imports), and some small portion soft project costs. These details are necessary for modeling impacts on the county economy due to a CCA program.
A macroeconomic impact (industry) forecasting model of Alameda County41 is used, the dollar amounts, with further data refinement (detail) are introduced to the model, the economy adjusts to these spending and savings changes by year and then identifies annual impacts in terms of dollar concepts (wages, sales, prices, gross regional product) and jobs, among numerous other metrics. Appendix E provides some high-level background on the REMI Policy Insight model. This model was chosen since it is uniquely qualified over other models and approaches to understand how price (or rate) changes on the business segment (Commercial /Industrial energy customers) influence business activity levels. Since electric rate differentials are a key consideration in pursuing a CCA, the study required a method that would adequately address this.
Scenario Results
MRW created the three supply scenarios by considering how much within county RE investment (for future generating assets) the CCA could fund, and how much it might invest elsewhere in California (rest of California or roCA). Program administration and energy efficiency deployment investments are the same in all three scenarios. As can be seen from Table 17, scenario 3 has the most proposed CCA renewables investment within county but, it has the lowest bill savings. In contrast scenario 1 would site a smaller renewables investment by the CCA as within county, but has proportionally much higher bill savings.
41 The model is a Policy Insight model by Regional Economic Models, Inc. (REMI) of Amherst, MA. It is a model that has been used by the CA Energy Commission, CALTrans, Los Angeles MTA, ABAG, City of San Francisco, and the South Coast AQMD. For this study a two-region socio-economic forecasting model (the county, and balance of State) with 23- industries was used.

CommunityChoiceAggregationFeasibilityAnalysis AlamedaCounty
June,2016 35 MRW&Associates,LLC
Table 17. Initial Comparison of Proposed CCA Scenarios
2017 to 2030
Million$ nominal
Million $ nominal DEMAND
Scenario Bill
Savings
CCA Renewable Investment
CCA Renewable O&M
PG&E Offset Renew. O&M
Alameda roCA
PG&E offset RE invest. roCA
Alameda roCA Alameda
1 $1,574 $623 $1,676 ‐$1,946 $47 $133 ‐$153
2 $1,513 $623 $2,217 ‐$2,446 $47 $190 ‐$206
3 $522 $674 $2,514 ‐$2,785 $51 $200 ‐$219
Note: Customers’ bill savings account for PG&E’s indifference charge, and any out‐of‐pocket expenditures for customer‐sited renewable or efficiency projects.
Job and Gross Regional Product Total Impacts
The yearly profile for the county’s total impacts – whether as jobs (Figure 23) or dollars of gross regional product (GRP) (
Figure 24) – shows that scenario 1 outperforms the other two scenarios. All scenarios share the year 2023 as the year of maximum positive impact which is due to maximum net rate savings. The cumulative GRP impact through 2030 for scenario 1 represents a 0.12% change relative to the county’s forecasted GRP without a CCA.

CommunityChoiceAggregationFeasibilityAnalysis AlamedaCounty
June,2016 36 MRW&Associates,LLC
Figure 23. Alameda County Total Job Impacts by Scenario
Figure 24. Alameda County Total Gross Regional Product Impacts by Scenario

CommunityChoiceAggregationFeasibilityAnalysis AlamedaCounty
June,2016 37 MRW&Associates,LLC
County Job impact by Stage of Job generation, Scenario 1
Job changes typically start from a direct productive event that alters the need for labor, such as constructing a facility or opening/closing a business. Then there are the local cycles of business-to-business supplier transactions that follow (called indirect jobs), cycles of household spending from the direct and indirect paychecks (called induced jobs), and sometimes there are job changes due to changes in costs (rates) of a location which affect doing-business in the county. These are job impacts from competitiveness effects. The indirect and induced combined are referred to as multiplier effects. The total job impact reflects the direct, the multiplier, and the competitiveness effects. Figure 25 juxtaposes the county’s direct job impacts with the total job impacts from Scenario 1. The majority of job creation in the scenario is from non-direct economic influences - specifically from the net rate savings which drives approximately 76 percent of the county’s job gain (Figure 26). As shown in Appendix E, Scenario 2 would have an identical profile of direct jobs but a slightly lower total job profile, due to almost $60 million of curtailed net rate savings (relative to scenario 1) through 2030. Scenario 3 has a slightly higher direct job profile but a greatly reduced total job impact profile.
Figure 25. CCA Scenario 1 County Job Impacts

CommunityChoiceAggregationFeasibilityAnalysis AlamedaCounty
June,2016 38 MRW&Associates,LLC
Figure 26. Alameda County CCA Scenario 1 Total Jobs Impacts by Source
County Job Impacts by Sector 2023 (Scenario 1)
The county’s sectors which will create these jobs are shown next in Figure 27. The year 2023 is selected since it is when the maximum job impact was shown. Not all sectors are involved with CCA activities (the absence of direct jobs) but all do experience business growth -hence added jobs- as a result of multiplier effects and competitiveness effects. The per-worker 2023 (forecasted and nominal) earnings rate is shown to the right of the sector name. The average (weighted) annual earnings implied across the 2,282 jobs gained within the county in 2023 is $102,120.
The results of the other two Scenarios are found in Appendix E.

CommunityChoiceAggregationFeasibilityAnalysis AlamedaCounty
June,2016 39 MRW&Associates,LLC
Figure 27. Alameda County Jobs Changes by sector (annual earnings per worker), 2023
Focus on Construction Sector Jobs
The county economy does not forfeit Construction sector jobs (nor does the balance of California economy). In fact, as Figure 27 shows, Construction experiences the largest direct (136 jobs) and total job change (440) for 2023 among all sectors. The degree to which any of these jobs are held by union members or equivalently non-union laborers “working under a collective bargaining agreement (CBA)” is addressed by understanding the publicly available data sources that are used in calibrating any region of a REMI model. It should be noted that the REMI model does not carry a union segmentation on the industry specific employment data. REMI relies upon data series from the U.S. Department of Labor, Commerce and Census. All the data products are the result of states providing a mix of annual and quarterly reports. A consistent characterization of REMI’s Construction sector employment is obtained from (Census’) the

CommunityChoiceAggregationFeasibilityAnalysis AlamedaCounty
June,2016 40 MRW&Associates,LLC
Current Population Survey – Earnings Report (2014) which for California shows approximately 20 percent of construction employment is engaged in work ‘covered’ by a CBA.42 Again those working under a CBA need not all be union members. The Construction sector activity in the two-region REMI model is therefore a blend of work, (20:80) covered-to-non-covered projects.
Table 18shows average annual direct and total job impacts by scenario and how many occur in the Construction sector and which would be “covered” by a CBA. Because the direct construction jobs (in particular) vary markedly from year to year (depending upon if a generation project is under construction or not, it is informative to look at a single year). Table 19 shows the construction jobs in 2023, the peak year for direct construction activity. As the table shows, when a project is utility-scale is under construction, the construction jobs increase to about ten times the average number.
Table 18. County’s Average Annual Construction Job Impacts
Scenario Jobs in All Sectors Jobs in Construction Sector Jobs Associated with CBA
Direct Total Direct Total Direct Total
1 165 1322 80 235 16 47
2 166 1286 81 231 16 46
3 174 731 86 160 17 32
Table 19. Peak-Year Construction Job Impacts
CCA Scenario
Jobs in Construction Sector Jobs Associated with CBA
Direct Total Direct Total
1 136 440 27 88
2 137 432 27 86
3 154 326 31 65
The CBA distinction is important as it uses the prevailing hourly wage set by the CA Dept. of Industrial Relations43 for public-funded projects. It is premature to determine how much of the
42 www.unionstats.com 43 See page 49 of http://www.dir.ca.gov/oprl/pwd/Determinations/Northern/Northern.pdf
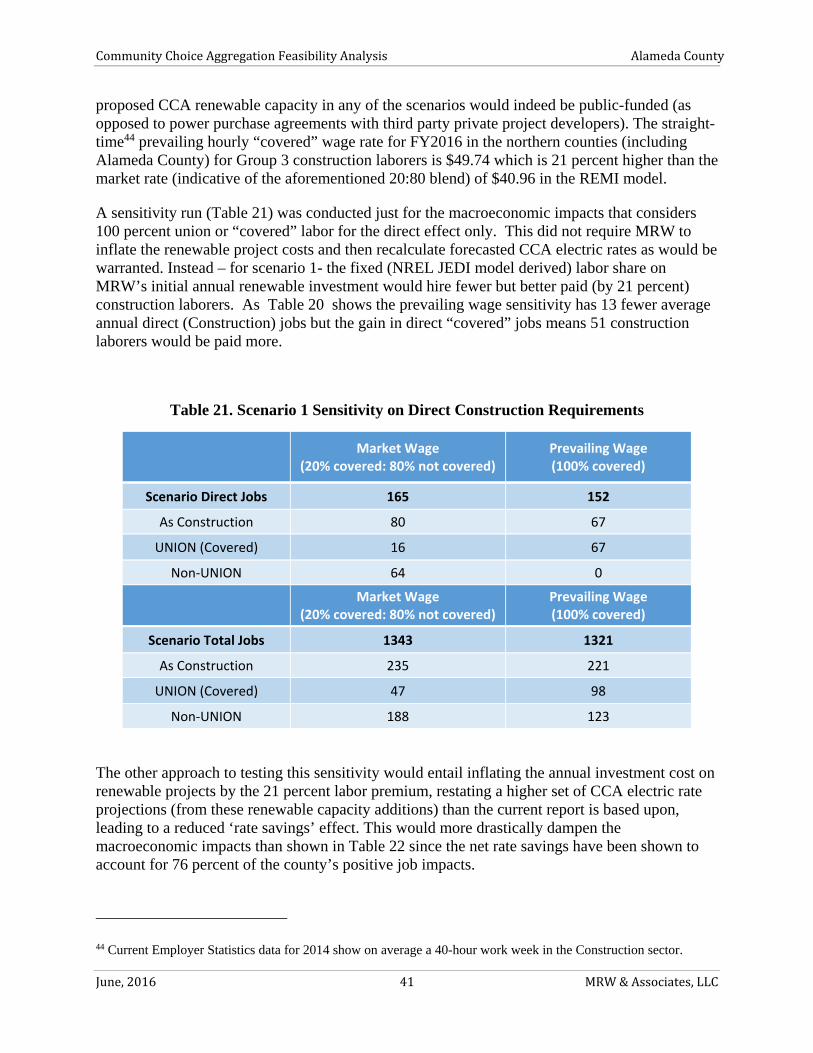
CommunityChoiceAggregationFeasibilityAnalysis AlamedaCounty
June,2016 41 MRW&Associates,LLC
proposed CCA renewable capacity in any of the scenarios would indeed be public-funded (as opposed to power purchase agreements with third party private project developers). The straight-time44 prevailing hourly “covered” wage rate for FY2016 in the northern counties (including Alameda County) for Group 3 construction laborers is $49.74 which is 21 percent higher than the market rate (indicative of the aforementioned 20:80 blend) of $40.96 in the REMI model.
A sensitivity run (Table 21) was conducted just for the macroeconomic impacts that considers 100 percent union or “covered” labor for the direct effect only. This did not require MRW to inflate the renewable project costs and then recalculate forecasted CCA electric rates as would be warranted. Instead – for scenario 1- the fixed (NREL JEDI model derived) labor share on MRW’s initial annual renewable investment would hire fewer but better paid (by 21 percent) construction laborers. As Table 20 shows the prevailing wage sensitivity has 13 fewer average annual direct (Construction) jobs but the gain in direct “covered” jobs means 51 construction laborers would be paid more.
Table 21. Scenario 1 Sensitivity on Direct Construction Requirements
Market Wage
(20% covered: 80% not covered) Prevailing Wage (100% covered)
Scenario Direct Jobs 165 152
As Construction 80 67
UNION (Covered) 16 67
Non‐UNION 64 0
Market Wage
(20% covered: 80% not covered) Prevailing Wage (100% covered)
Scenario Total Jobs 1343 1321
As Construction 235 221
UNION (Covered) 47 98
Non‐UNION 188 123
The other approach to testing this sensitivity would entail inflating the annual investment cost on renewable projects by the 21 percent labor premium, restating a higher set of CCA electric rate projections (from these renewable capacity additions) than the current report is based upon, leading to a reduced ‘rate savings’ effect. This would more drastically dampen the macroeconomic impacts than shown in Table 22 since the net rate savings have been shown to account for 76 percent of the county’s positive job impacts.
44 Current Employer Statistics data for 2014 show on average a 40-hour work week in the Construction sector.
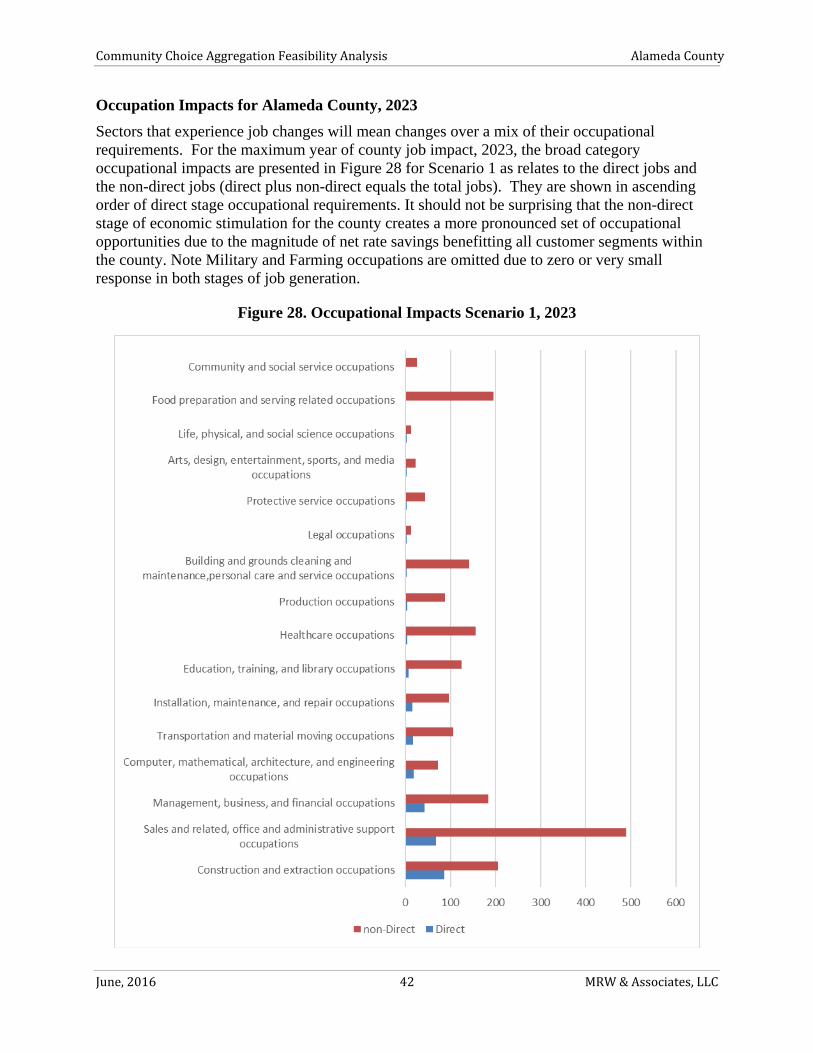
CommunityChoiceAggregationFeasibilityAnalysis AlamedaCounty
June,2016 42 MRW&Associates,LLC
Occupation Impacts for Alameda County, 2023
Sectors that experience job changes will mean changes over a mix of their occupational requirements. For the maximum year of county job impact, 2023, the broad category occupational impacts are presented in Figure 28 for Scenario 1 as relates to the direct jobs and the non-direct jobs (direct plus non-direct equals the total jobs). They are shown in ascending order of direct stage occupational requirements. It should not be surprising that the non-direct stage of economic stimulation for the county creates a more pronounced set of occupational opportunities due to the magnitude of net rate savings benefitting all customer segments within the county. Note Military and Farming occupations are omitted due to zero or very small response in both stages of job generation.
Figure 28. Occupational Impacts Scenario 1, 2023

CommunityChoiceAggregationFeasibilityAnalysis AlamedaCounty
June,2016 43 MRW&Associates,LLC
Chapter6:OtherRisksAside from the risks identified above, the CCA or the political jurisdictions that are part of the CCA could be at risk. This section addresses some of those risks.45
Financial Risks to CCA Members
A CCA is effectively an association of various political subdivisions. The formation documents for the CCA define the rights and responsibilities of each member of the CCA. Given the large number of political subdivisions that might participate in an Alameda County CCA, MRW assumes that the Alameda CCA would be formed under a Joint Powers Authority, in much the same way as MCE Clean Energy and Sonoma Clean Power.
The CCA will ultimately take on various financial obligations. These include obtaining start-up financing, establishing lines of credit, and entering into contracts with suppliers. Because a CCA will take on such financial obligations, it is likely very important to the prospective member political subdivisions that the financial obligations of the CCA cannot be assigned to the members.
As a result, it is critical that the Joint Powers Authority and any other structuring documents are carefully drafted to ensure that the member agencies are not jointly obligated on behalf of the CCA (unless a member agency chooses to bear such obligations). The CCA should obtain competent legal assistance when developing the formation documents.46
Procurement-Related Risks
Because a CCA is responsible for procurement of supply for its customers, the CCA must develop a portfolio of supply that meets the resource preferences of its customers (e.g., ratio of renewable versus non-renewable supply) while controlling risks (e.g., ratio of short-term versus long-term purchase agreements) and meeting regulatory mandates (e.g., resource adequacy and RPS requirements). Thus, it is tempting to assume that customers would prefer a fully hedged supply portfolio. However, such insurance comes at a cost and a CCA must be mindful of the potential competition from PG&E. As a result, the CCA’s portfolio must be both flexible while meeting the needs of its customers.
The CCA will likely need to negotiate a flexible supply arrangement with its initial set of suppliers. Such an arrangement is important since the CCA’s loads are highly uncertain during CCA ramp-up. Without such an arrangement, the CCA faces the risk of either under- or over-procuring renewable or non-renewable supplies. Excessive mismatches between supply and demand of these different products would expose the CCA’s customers to major purchases or sales in the spot markets. These spot purchases could have a major impact on the CCA’s financials.
45 Note that this section does not provide legal opinion regarding specific risks, especially those related to the formation or the structure of the Joint Powers Authority under which MRW assumes the CCA will be established. 46 Cities such as El Cerrito and Benicia have conducted legal analyses when they were considering joining MCE. which should also be consulted.

CommunityChoiceAggregationFeasibilityAnalysis AlamedaCounty
June,2016 44 MRW&Associates,LLC
The CCA will by necessity have to procure a certain amount of short-term supplies. These short-term supplies bring with them price volatility for that element of the supply portfolio. While this volatility is not unexpected, the CCA must be mindful that such volatility could increase the need for reserve funds to help buffer rate volatility for the CCA’s customers. Funding such reserve funds could be challenging in this time of low gas prices (resulting in high PCIA charges).
The CCA will be entering the renewable market at an interesting time. While all LSEs must meet the expanded RPS targets by 2030, at least the IOUs are currently over-procured relative to their 2020 RPS targets. Whether the IOUs will attempt to sell off some of their near-term renewable supplies is unknown. However, if the IOUs believe that this is a good time to acquire additional renewables, the CCA could face stiff competition for renewable supplies, meaning that the green portfolio costs for the CCA might be higher than expected.
Finally, it should be noted that as greater levels of renewables are developed to meet the State’s very aggressive RPS goals, it is possible that the traditional peak period will change. Adding significant amounts of solar could depress prices during the middle of the day. This could result in the need to try to sell power to out-of-state market participants during the middle of the day, possibly even at a loss. It could also result in the curtailment of renewable resources (even resources owned or controlled by the CCA). This could force the CCA to acquire greater levels of renewable supplies, thereby increasing costs.
Legislative and Regulatory Risks
As noted above, the CCA must meet various procurement requirements established by the state and implemented by the CPUC or other agencies. These include procuring sufficient resource adequacy capacity of the proper type and meeting RPS requirements that are evolving.47 Additional rules and requirements might be established. These could affect the bottom line of the CCA.
PCIA Uncertainty
Assembly Bill 117, which established the CCA program in California, included a provision that states that customers that remain with the utility should be “indifferent” to the departure of customers from utility service to CCA service. This has been broadly interpreted by the CPUC to mean that the departure of customers to CCA service cannot cause the rates of the remaining utility “bundled” customers to go up. In order to maintain bundled customer rates, the CPUC has instituted an exit fee, known as the “Power Charge Indifference Adjustment” or “PCIA” that is charged to all CCA customers. The PCIA is intended to ensure that generation costs incurred by PG&E before a customer transitions to CCA service are not shifted to remaining PG&E bundled service customers.
Even though there is an explicit formula for calculating the PCIA, forecasting the PCIA is difficult, since many of the key inputs to the calculation are not publicly available, and the results are very sensitive to these key assumptions. For PG&E, the PCIA has varied widely; for example, at one time the PCIA was negative.
47 Rules to establish RPS requirements under the new 50% RPS mandate are currently being debated at the CPUC.

CommunityChoiceAggregationFeasibilityAnalysis AlamedaCounty
June,2016 45 MRW&Associates,LLC
Current CCAs have chosen to have customers bear the financial risk associated with the level of exit fees they will pay to PG&E. Thus, for a customer taking CCA service to be economically better off (i.e., pay less for electricity), the sum of the CCA charges plus the PCIA must be lower than PG&E’s generation rate.
This risk can be mitigated in two ways. First, as discussed in more detail elsewhere, a rate stabilization fund can be created. Second, the CCA can actively monitor and vigorously participate in CPUC proceedings that impact cost recovery and the PCIA.
Impact of High CCA Penetration on the PCIA
Currently, the PCIA calculation is based on the cost and value of a utility's portfolio, without regard to how much of that portfolio is to be paid for by bundled customers and how much by Direct Access (DA) and CCA customers. As such, the PCIA is not affected by the number of DA/CCA customers.
Currently, for bundled customers the rate impacts associated with fluctuating PCIAs are relatively small, but this will change as the number of DA/CCA customers grows. At some point, bundled customers' rates may experience marked volatility as the impacts of the annual PCIA rate swings reverberate to bundled rates. This may be unacceptable to ratepayer advocates and the Commission.
The PCIA rate volatility in part reflects changes to the utilities generation costs, which is appropriately reflected in bundled customers’ rates. But, often to a large degree, it reflects changes to the market price benchmark, which should not be relevant to bundled customer rates. For a utility with flat RPS costs, this would have increased the RPS-related PCIA, which would have reduced bundled rates, even though there was no change in RPS costs. This could also happen in the reverse direction, increasing bundled rates when there is no increase in underlying generation costs.
Once DA/CCA load gets large enough that there are real stranded contracts, we suspect that the Commission is going to look much more closely at the value of these stranded contracts (and how to get the most value for them).
Bonding Risk
Pursuant to CPUC Decision 05-12-041, a new CCA must include in its registration packet evidence of insurance or bond that will cover such costs as potential re-entry fees, specifically, the cost to PG&E if the CCA were to suddenly fail and be forced to return all its customers back to PG&E bundled service. Currently, a bond amount for CCAs is set at $100,000.
This $100,000 is an interim amount. In 2009, a Settlement was reached in CPUC Docket 03-10-003 between the three major California electric utilities (including PG&E), two potential CCAs (San Joaquin Valley Power Authority and the City of Victorville) and The Utility Reform Network (TURN) concerning how a bonding amount would be calculated. The settlement was vigorously opposed by MCE and San Francisco and never adopted.

CommunityChoiceAggregationFeasibilityAnalysis AlamedaCounty
June,2016 46 MRW&Associates,LLC
Since then, the issue of CCA bond requirements has not been revisited by the CPUC. If it is, the bonding requirement will likely follow that set for Energy Service Providers (ESPs) serving direct access customers. This ESP bond amount covers PG&E’s administrative cost to reintegrate a failed ESP’s customers back into bundled service, plus any positive difference between market-based costs for PG&E to serve the unexpected load and PG&E’s retail generation rates. Since the ESP bonding requirement has been in place, retail rates have always exceeded wholesale market prices, and thus the ESP’s bond requirement has been simply the equal to a modest administrative cost.
If the ESP bond protocol is adopted for CCAs, during normal conditions, the CCA Bond amount will not be a concern. However, during a wholesale market price spike, the bond amount could potentially increase to millions of dollars. But the high bond amount would likely be only short term, until more stable market conditions prevailed. Also it is important to note that high power prices (that would cause a high bond requirement) would also depress PG&E’s exit fee and would also raise PG&E rates, which would in turn likely provide the CCA sufficient headroom to handle the higher bonding requirement and keep its customers’ overall costs competitive with what they would have paid had they remained with PG&E. As discussed above, JPA member entities would not be individually liable for any increase in the bond amount.

CommunityChoiceAggregationFeasibilityAnalysis AlamedaCounty
June,2016 47 MRW&Associates,LLC
Chapter7:OtherIssuesInvestigated
Funding, Costs, and Impacts of the Energy Efficiency Program Scenario
Having established that both adequate economic and market potential exist beyond what is currently being targeted through PG&E programs, the MRW Team estimated how much efficiency could reasonably be captured by assessing the availability of funding for energy efficiency, and the cost of to acquire it through various programs. Understanding available funding options and costs allowed the MRW team to determine the amount of energy efficiency that could be acquired in various funding options and use this to calculate the economic inputs for the REMI model.
To assess funding, CCA’s have several funding options, including;
Funds from Non-bypassable Electric Charges – CPUC Ruling R.09-11-014 defined various funding options for CCAs that are administrators of energy efficiency programs, and also outlined some of the funding authorities available to CCA’s that elect to not administer programs
Funds from Non-bypassable Gas Charges – CPUC Decision D.14-10-046 allows CCA’s to administer programs that include funds collected from natural gas customer. This analysis did not estimate the value of these funds.
Income from CCA Operations. Income generated through CCA operations may be used to fund customer programs.
Funding secured by aligned organizations, such as StopWaste’s Energy Council, on behalf of a CCA.
Increased funding through the expansion of the CCA territory. Under current regulations it is allowed for a CCA to define its service territory more broadly than a city or county. As such, the rules that define the funding for Alameda County residents would apply to new participants in a CCA and so provide incremental program funding. For example, in 2015 Marin Clean Energy began serving customer in Contra Costa County and has increased its available program funding as a result of this enrollment.
This analysis only considered the impact of Non-bypassable Electric Charges. Using rules defined in CPUC Ruling R.09-11-014 and various cost reports48, Table 23 shows that approximately $3.9M would be available for programs administered by a CCA to Alameda County residents, including both CCA and PG&E customers, or $3.5M if these programs serve only CCA customers, assuming a 15% opt-out rate.
48 Electric and Gas Utility Cost Report. Public Utilities Code Section 913 Report to the Governor and Legislature, April 2016.

CommunityChoiceAggregationFeasibilityAnalysis AlamedaCounty
June,2016 48 MRW&Associates,LLC
Table 23. Annual Funding Models for Non-bypassable Electric Charges
Annual Funding Models for Non‐bypassable Electric Charges
Estimated Value
Program Administrator ‐ CCA and PG&E customers $3,941,000
Program Administrator ‐ CCA customer only $3,350,000
The cost of energy was determined by analyzing the 2015 PG&E portfolio to identify the costs per first year net kWh for programs that are likely to be the most representative of programs administered by an Alameda CCA. An analysis the PG&E portfolio, including the programs presented in Table 24, indicates that $0.61 per net first year kWh is a reasonable estimate of the current unit cost of energy efficiency.
Table 24. Select Unit Costs for Energy Efficiency ($/ net kWh)
Program Administrator Sub‐Program Name
Percent Program Savings that are
Electric
Cost Per First Year Net kWh Equivalent
PG&E Commercial Energy Advisor 18% $0.18
MCE MEA 02 ‐ Small Commercial 79% $0.37
PG&E Lighting Programs Total 100% $0.38
MCE MEA01 2013‐14 MF ‐ Multifamily 36% $0.59
PG&E East Bay 93% $0.59
Third Party RightLights 100% $0.75
PG&E Energy Savers 100% $0.81
Third Party Energy Fitness Program 100% $0.84
The MRW teams defined the level of energy efficiency input into the REMI model by dividing the available funding by the units cost of energy efficiency as defined above, using the following assumptions;
Available annual budget for energy efficacy programs is based on the maximum funding equation provided in R.09-11-014, and assuming programs are administered only to CCA customers. As discussed in Table 23, this represents approximately $3.5M annually.
The cost of energy efficiency programs most likely to be offered under and a CCA would be $0.61 per net first year kWh.

CommunityChoiceAggregationFeasibilityAnalysis AlamedaCounty
June,2016 49 MRW&Associates,LLC
The savings from energy efficiency during the forecast horizon would grow at a rate consistent with expected annual energy demand as defined in the 2015 CEC IEPR demand forecast.49
Demand savings would be consistent with the ratio of demand to energy savings achieved by the programs most likely to be offered by a CCA as presented in Table 24.
Based on this methodology, Table 25 provides a summary of model energy and demand savings inputs. Note that these savings numbers are incremental to PG&E goals, which average about 42 GWh annually from 2021 through 2024, as defined in the CPUC potential model, which has a forecast horizon ending in 2024.
Table 25. Model Energy and Demand Savings Inputs
Year 2021 2022 2023 2024 2025 2026 2027 2028 2029 2030
Annual incremental energy savings (GWh)
5.7 5.8 5.9 5.9 6.0 6.0 6.1 6.1 6.2 6.3
Annual incremental demand savings (MW)
0.9 0.9 0.9 0.9 0.9 1.0 1.0 1.0 1.0 1.0
“Minimum” CCA Size?
MRW’s analysis above assumed that all eligible Alameda County cities join the Alameda CCA program with a participation rate of 85% from each city, resulting in an anticipated CCA load of about 7 million MWh per year.50 If fewer customers join, CCA rates will generally be higher because about $8 million of annual CCA costs are invariant to the amount of CCA load. Along with the number of customers, the customer make-up is also important. For example, a higher share of residential customers would improve the competiveness of the CCA, while a higher share of commercial customers or industrial customers would weaken the competitiveness of the CCA. Since cities vary in their distribution of customers by rate class, a city opting out of the CCA could affect the competitiveness of the CCA due to both the reduction in CCA load and the shift in customer make-up.
The “minimum” load needed for CCA customer rates to be no higher than PG&E customer rates is approximately 450,000 MWh per year, assuming the average customer portfolio for Alameda County and Supply Scenario 1. This value was estimated by assuming that the fixed costs remained the same (i.e., did not scale with sales) and then lowering the sales until the hypothetical reduced CCA’s rates were equal to PG&E’s. As shown in the Figure 29, this is roughly the load from each of the medium-sized cities (e.g., Pleasanton and San Leandro) and much smaller than the load from the larger cities (e.g., Berkeley, Oakland, and Fremont). As
49 Form 1.1 - PGE Planning Area California Energy Demand 2015 Revised - Mid Demand Case. Electricity Consumption by Sector (GWh) 50 In the alternate supply scenarios, the “minimum” annual load assuming the average customer portfolio for Alameda County and the base case is 550,000 MWh (Scenario 2) and 1,000,000 MWh (Scenario 3). These “minimum” loads are also far below the expected annual CCA load of 7 million MWh.

CommunityChoiceAggregationFeasibilityAnalysis AlamedaCounty
June,2016 50 MRW&Associates,LLC
long as two medium-sized cities or one larger city joins the CCA, this “minimum” load will be met. It is not a true minimum, however, because the true minimum depends on the make-up of the customer portfolio.
Figure 30. Potential load (85% participation) per city
Table 26. Examples of Combinations of Cities and the Average Generation Rate
Examples of city combinations
ONLY BERKELEY ONLY PLEASANTON ONLY DUBLIN +
NEWARK
TOTAL ALAMEDA COUNTY
Potential Load (MWh)
Customer Class (%)
Potential Load (MWh)
Customer Class (%)
Potential Load (MWh)
Customer Class (%)
Customer Class (%)
Residential 136,000 23.37% 158,000 35.11% 160,000 33.83% 32.90%
Commercial 176,000 30.24% 232,000 51.56% 234,000 49.47% 43.70%
Industrial 74,000 12.71% 36,000 8.00% 41,000 8.67% 13.80%
Public 193,000 33.16% 19,000 4.22% 35,000 7.40% 8.60%
Street lights + Pumping 3,000 0.52% 5,000 1.11% 3,000 0.63% 1.00%
TOTAL 582,000 450,000 473,000
Average PG&E rate (¢/kWh) 9.71 10.56 10.51 10.36
Average Alameda rate (¢/kWh) 9.92 10.48 10.19 8.28
Differential rate (¢/kWh) ‐0.21 0.08 0.32 2.08
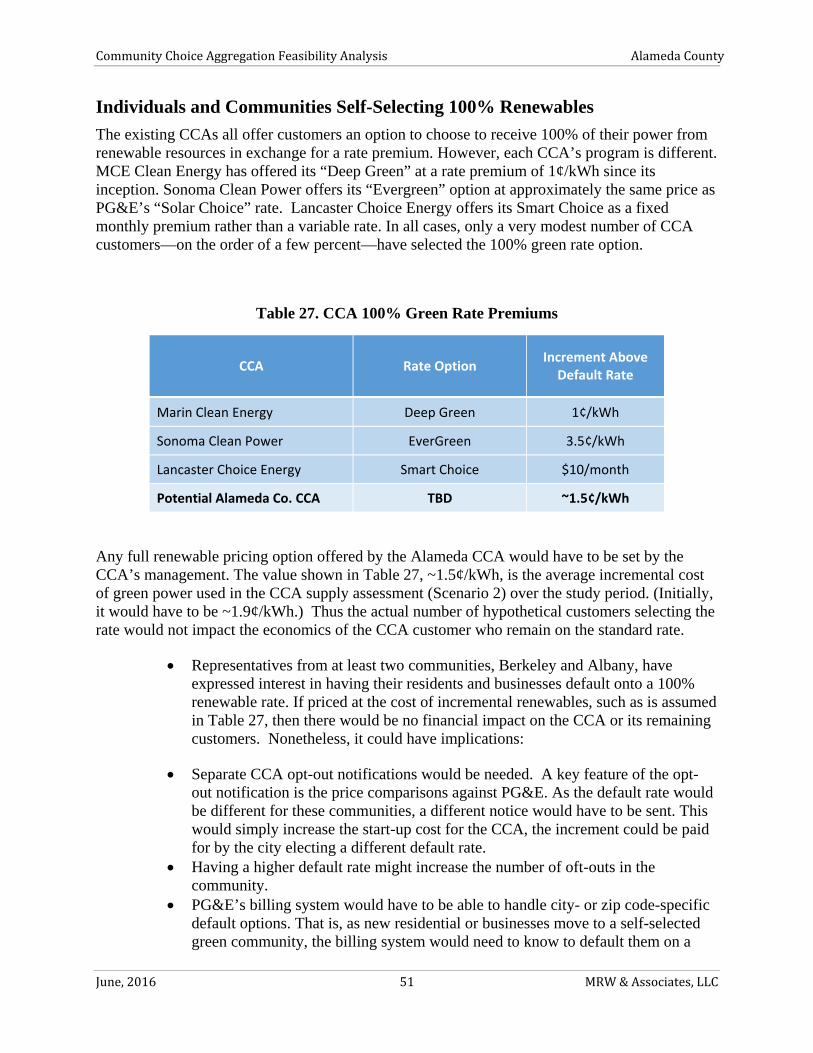
CommunityChoiceAggregationFeasibilityAnalysis AlamedaCounty
June,2016 51 MRW&Associates,LLC
Individuals and Communities Self-Selecting 100% Renewables
The existing CCAs all offer customers an option to choose to receive 100% of their power from renewable resources in exchange for a rate premium. However, each CCA’s program is different. MCE Clean Energy has offered its “Deep Green” at a rate premium of 1¢/kWh since its inception. Sonoma Clean Power offers its “Evergreen” option at approximately the same price as PG&E’s “Solar Choice” rate. Lancaster Choice Energy offers its Smart Choice as a fixed monthly premium rather than a variable rate. In all cases, only a very modest number of CCA customers—on the order of a few percent—have selected the 100% green rate option.
Table 27. CCA 100% Green Rate Premiums
CCA Rate Option Increment Above Default Rate
Marin Clean Energy Deep Green 1¢/kWh
Sonoma Clean Power EverGreen 3.5¢/kWh
Lancaster Choice Energy Smart Choice $10/month
Potential Alameda Co. CCA TBD ~1.5¢/kWh
Any full renewable pricing option offered by the Alameda CCA would have to be set by the CCA’s management. The value shown in Table 27, ~1.5¢/kWh, is the average incremental cost of green power used in the CCA supply assessment (Scenario 2) over the study period. (Initially, it would have to be ~1.9¢/kWh.) Thus the actual number of hypothetical customers selecting the rate would not impact the economics of the CCA customer who remain on the standard rate.
Representatives from at least two communities, Berkeley and Albany, have expressed interest in having their residents and businesses default onto a 100% renewable rate. If priced at the cost of incremental renewables, such as is assumed in Table 27, then there would be no financial impact on the CCA or its remaining customers. Nonetheless, it could have implications:
Separate CCA opt-out notifications would be needed. A key feature of the opt-out notification is the price comparisons against PG&E. As the default rate would be different for these communities, a different notice would have to be sent. This would simply increase the start-up cost for the CCA, the increment could be paid for by the city electing a different default rate.
Having a higher default rate might increase the number of oft-outs in the community.
PG&E’s billing system would have to be able to handle city- or zip code-specific default options. That is, as new residential or businesses move to a self-selected green community, the billing system would need to know to default them on a

CommunityChoiceAggregationFeasibilityAnalysis AlamedaCounty
June,2016 52 MRW&Associates,LLC
different rate schedule than a customer in a different CCA community. This may or may not be an issue.
Competition with a PG&E Community Solar Program
PG&E has been offering a solar choice program known as Green Tariff Shared Renewable Program since February 2015.51 The program was established under Senate Bill 43, and pursuant to Decision 15-01-051 from the CPUC, to extend access to renewable energy to ratepayers that are currently unable to install onsite generation.52 It offers homes and businesses the option to purchase 50% or 100% of their energy use from solar resources. The program provides those with homes or apartments or businesses that cannot support rooftop solar the opportunity to meet their electricity requirements through renewable energy and support the growth of renewable energy resources.
PG&E’s current Solar Choice program costs residential customers an additional 3.58¢/kWh. Given that MRW projects that the CCA can offer 100% green power at ~1.5¢/kWh over its own Scenario 1 or Scenario 2 rate (which is projected to be less than PG&E’s), we do not see PG&E’s Community Solar Program as an immediate threat.
The program is open for enrollment until subscriptions reach 272 MW or January 1, 2019, whichever comes first.53 While this does limit the ability for PG&E to provide a 100% renewable option in the long-run, at the start of the CCA this program it provides an opportunity for customers who desire 100% renewable power to remain with PG&E.
Additional Local Renewables
As noted in Chapter 2, relatively conservative penetrations of locally-sited renewable generation (solar) was included in the quantitative analysis. Even in scenario 3, the most aggressive with respect to renewables, the modeling assumed only 175 MW of in-county solar. Other individuals and studies have placed the potential for solar in the Alameda County at much higher levels. For example, a 2012 study conducted for Pacific Environment, a San Francisco-Based environmental non-governmental agency, placed the “technical potential” for rooftop and parking lot PC at over 3,700 MW.54 However, it must be noted that technical potential is different than economic or achievable potentials; it represented the absolute ceiling on this kind of PV in the county.
Assuming that greater amounts of this solar potential can in practice be tapped has a number of implications for the results of this study. First, greater local solar will increase CCA costs. As noted in the supply section of Chapter 2, in-county solar costs about 15% more than solar located in lower cost, inland counties, and small solar, such as is quantified in the Pacific Environment report, is typically 55% more costly than central solar. This increased cost will narrow the
51 PG&E website http://www.pge.com/en/b2b/energysupply/wholesaleelectricsuppliersolicitation/RFO/CommunitySolarChoice.page?WT.mc_id=Vanity_communitysolarchoice . Accessed 5/16/2016 52 California Public Utilities Commission, Decision 15-01-051, p.3 53 Solar Choice Program FAQs website, https://www.pge.com/en/myhome/saveenergymoney/solar/choice/faq/index.page Accessed, 5/16/2016 54 Powers, Bill, “Bay Area Smart Energy 2020,” March 2012.

CommunityChoiceAggregationFeasibilityAnalysis AlamedaCounty
June,2016 53 MRW&Associates,LLC
difference between the rates that the CCA can offer and PG&E. Still, as the analysis has shown, there is significant financial “headroom” to allow for this.
To explore this, we ran Scenario 2 with the assumption that 50% of the renewables were locally sourced. This implies that in 2025, there would be about 925 MW small solar (less than 3MW, including rooftop) and 888 MW large solar in the county (assuming that it can be phased in that quickly). As shown in Figure 31, the margin between the CCA’s costs (bars) and the projected PG&E generation rates is much closer than in the standard Scenario 2. This is not unexpected, as local renewables are assumed to be more costly than large-scale ones located in lower-cost areas of the state.
Figure 31. Scenario 2 with 50% of the Renewables Met Using In-County Generation
0
2
4
6
8
10
12
2017 2018 2019 2020 2021 2022 2023 2024 2025 2026 2027 2028 2029 2030
C$/kWh
PCIA
GHG
O/M
Non‐Renewable
Renewable
PG&E
The impacts on the macroeconomics are more complex. Additional local solar would increase local direct jobs by employing more workers to install and maintain solar arrays. On the other hand, the greater driver of jobs, the bill savings from reduced rates, would go down with the increased CCA costs. While this scenario was not explicitly modeled, the results of the three scenarios at were model strongly suggest that total economic activity and jobs would decrease with the inclusion of more local renewables in the CCA’s supply portfolio.
A macroeocnomic and jobs impact of Alternative Scenario 2 will be explored quantitatively in REMI in an addendum to this report, to be issued in late June.

CommunityChoiceAggregationFeasibilityAnalysis AlamedaCounty
June,2016 54 MRW&Associates,LLC
Chapter8:ConclusionsOverall, a CCA in Alameda County appears favorable. Given current and expected market and regulatory conditions, an Alameda County CCA should be able to offer its residents and business electric rates that are a cent or more per kilowatt-hour less than that available from PG&E.
Sensitivity analyses suggest that these results are relatively robust. Only when very high amounts of renewable energy are assumed in the CCA portfolio (Scenario 3), combined with other negative factors, do PG&E’s rates become consistently more favorable than the CCAs.
An Alameda CCA would also be well positioned to help facilitate greater amounts renewable generation to be installed in the County. While the study assumed a relatively modest amount for its analysis—about 175 MW, other studies suggest that greater amounts are possible. Because the CCA would have a much greater interest in developing local solar than PG&E, it is much more likely that such development would actually occur with a CCA in the County than without it.
The CCA can also reduce the amount greenhouse gases emitted by the County, but only under certain circumstances. Because PG&E’s supply portfolio has significant carbon-free generation (large hydroelectric and nuclear generators), the CCA must contract for significant amounts of carbon-fee power above and beyond the required qualifying renewables in order to actually reduce the county’s electric carbon footprint. For example, even assuming that the CCA implements a portfolio with 50% qualifying renewables and contracts with carbon-free hydropower 50% of the remaining power (i.e., 50% renewable, 25% hydro, 25% fossil/market) , it would only then just barely result in net carbon reductions. However, the extent to which GHG emissions reductions occur is also a function of the amount of hydroelectric power that PG&E is able to use. If hydro output (continues) to be below historic normal levels, then the CCA should be able to achieve GHG savings, (as long as it is also contracting for significant amounts of carbon-free (likely hydroelectric) power). Therefore, if carbon reductions are a high priority for the CCA, a concerted effort to contract with hydroelectric or other carbon-free generators would be needed.
A CCA can also offer positive economic development and employment benefits to the County. At the peak, the CCA would create approximately 2300 new jobs in the region. The large amount for be for construction trades, totaling 440 jobs. What may be surprising is that much for the jobs and economic benefit come from reduced rates; residents, and more importantly businesses, can spend and reinvest their bill savings, and thus generate greater economic impacts.