technological hazards - home | fema.gov · technological hazards hazard identification risk...
TRANSCRIPT

TECHNOLOGICALHAZARDS
Principal Threats Facing Communities and Local Emergency Management Coordinators
Part II
TECHNOLOGICALHAZARDS
"Advancements in technology and the increased development and use of chemicals over the past decades have resulted in the rise of a new and wide range of threats. Estimates of some of these threats are often difficult because of a lack of experience with them or a thorough knowledge of the full range of their impact."
From Principal Threats Facing Communities and Local Emergency Management Coordinators, April 1993

TECHNOLOGICAL HARARDS250 TECHNOLOGICAL HARARDS

Introduction
251
Introduction
Technological hazards can affect localized or widespread areas, are frequently unpredictable, can cause
property damage and loss of life, and can significantly affect infrastructure in many areas of the United States. FEMA recognizes that a comprehensive strategy to mitigate the nation’s hazards can not address natural hazards alone.
FEMA and other disaster and mitigation experts have long acknowledged that natural events can trigger technological disasters. It is recognized that one technological event can lead directly to another. Recent events illustrate the effects of technological events:
• On April 13, 1992, the heart of the Business District in Chicago was immobilize by flooding in an old network of tunnels connecting major buildings in the Chicago Loop. Approximately 25,000 people were sent home while the subway system was shut down, and workers addressed the flood damage before vital power and fiber-optic communication lines in the tunnels could be affected.
• On June 30, 1992, a derailed train dumped 30,000 gallons of benzene and other petroleum additives into the Nemadji River. The resulting toxic vapor cloud covered an area of over 1,200 mi2 (1,900 km2). As a result, 25,000 people were evacuated from Superior, WI to Duluth, MN.
The following technological hazards have been identified in FEMA reports as warranting attention:
• Dam failures - collapses or failures of impoundment structures that cause down-stream flooding (Chapter 20);
• Fires - uncontrolled burning in residential, commercial, industrial or other properties in rural or developed areas (not forest and wildfires) (Chapter 21);
• Hazardous materials events - uncontrolled releases of hazardous materials from fixed sites or during transport (Chapter 22);
• Nuclear accidents - uncontrolled releases of radioactive materials at commercial powerplants or other nuclear reactor facilities or during the shipment of materials (Chapter 23);
• National security hazards - hazards that come from actions by external hostile forces against the land, population, or infrastructure of the United States, such as ballistic missile attack, chemical and biological attack, civil disorder, nuclear attack, terrorism) ;
• Power failures - interruptions or losses of electrical service for extended periods of time (i.e., length of time sufficient to require emergency management organization response to health and safety needs); and
• Telecommunications failures - failures of data transfer, communications, or processing brought about either by physical destruction of computers or communications equipment or a performance failure of software.


CHAPTERCHAPTER
20
DAMDAM FAILURESFAILURES

TECHNOLOGICAL HAZARDS
Chapter Summary
254 TECHNOLOGICAL HAZARDS
Chapter Summary
The 1993-1994 National Inventory of Dams identifies 74,053 dams in the United States (FEMA and USACE, 1994). Thousands are classified as high
or significant hazard dams whose failure would likely cause loss of life and/or substantial economic damage.
Dam failures can result from natural events, human-induced events, or a combination. Failures due to natural events such as hurricanes, earthquakes, or landslides are significant because there is generally little or no advance warning. The most common cause of dam failure is pro-longed rainfall that produces flooding.
The deadliest dam failure in U.S. history occurred in Johnstown, PA, in 1889, 2,209 people. More recently, the 1972 failure in Buffalo Creek, WV, killed 125 people and left 3,000 homeless. A 1976 failure in Teton, ID, took 11 lives and cost $1 billion. A 1977 failure in Toccoa Falls, GA, resulted in 37 deaths and heavy property damage. In 1994, approximately 230 dams in Georgia were damaged by flooding caused by Tropical Storm Alberto.
As States move forward with dam safety programs, Emergency Action Plans (EAPs) have been prepared for approximately 6,500 dams. The plans, which are public documents, include evaluations of downstream inundation areas.
Since the initiation of the National Inventory of Dams in 1975, some Federal, State, and local governments and private owners have taken action to mitigate the potential for damage from dam failures. The Community Rating System of the National Flood Insurance Program provides reduced flood insurance premium rates based on activities that communities undertake to reduce flood losses. Credit points are awarded if a State's dam safety program meets the criteria of the Model State Dam Safety Program.

DAM FAILURESDAM FAILURES 255
Photo: Michael Baker Corporation

TECHNOLOGICAL HAZARDS
HAZARD IDENTIFICATION
RISK ASSESSMENT
Exposure
256 TECHNOLOGICAL HAZARDS
HAZARD IDENTIFICATION
A dam is defined as a barrier constructed across a watercourse for the purpose of storage, control, or diversion of water. Dams typically are constructed of earth, rock, concrete, or mine tailings. A dam failure is the collapse, breach, or other failure resulting in down-stream flooding.
A dam impounds water in the upstream area, referred to as the reservoir. The amount of water impounded is measured in acre-feet. An acre-foot is the volume of water that covers an acre of land to a depth of one foot. As a function of upstream topography, even a very small dam may impound or detain many acre-feet of water. Two factors influence the potential severity of a full or partial dam failure: the amount of water impounded, and the density, type, and value of development and infrastructure located downstream.
Of the 74,053 dams identified in the 1994 National Inventory of Dams, Federal agencies own 2,131; States own 3,627; local agencies own 12,078; public utilities own 1,626; and private entities or individuals own 43,656. Ownership of 10,935 dams is undetermined. The locations of the dams included in the Inventory are illustrated on Map 20-1. The Inventory categorizes the dams according to primary function:
• Recreation (31.3 percent)
• Fire and farm ponds (17.0 percent)
• Flood control (14.6 percent)
• Irrigation (13.7 percent)
• Water supply (9.8 percent)
• Tailings and other (8.1 percent)
• Hydroelectric (2.9 percent)
• Undetermined (2.3 percent)
• Navigation (0.3 percent)
Each dam in the Inventory is assigned a downstream hazard classification based on the potential for loss of life and damage to property should the dam fail. The three classifications are high, significant, and low. Map 20-2 shows the dams classified as posing high or significant hazards. With changing demographics and land development in downstream areas, hazard classifications are updated continually. The hazard classification is not an indicator of the adequacy of a dam or its
physical integrity.
Dam failures typically occur when spillway capacity is inadequate and excess flow overtops the dam, or when internal erosion (piping) through the dam or foundation occurs. Complete failure occurs if internal erosion or overtopping results in a complete structural breach, releasing a high-velocity wall of debris-laden water that rushes downstream, damaging or destroying everything in its path.
Dam failures can result from any one or a combination of the following causes:
• Prolonged periods of rainfall and flooding, which cause most failures;
• Inadequate spillway capacity, resulting in excess overtopping flows;
• Internal erosion caused by embankment or foundation leakage or piping;
• Improper maintenance, including failure to remove trees, repair internal seepage problems, replace lost material from the cross section of the dam and abutments, or maintain gates, valves, and other operational components;
• Improper design, including the use of improper construction materials and construction practices;
• Negligent operation, including failure to remove or open gates or valves during high flow periods;
• Failure of upstream dams on the same waterway;
• Landslides into reservoirs, which cause surges that result in overtopping;
• High winds, which can cause significant wave action and result in substantial erosion; and
• Earthquakes, which typically cause longitudinal cracks at the tops of embankments that weaken entire structures.
RISK ASSESSMENT
Exposure
People, property, and infrastructure downstream of dams could be subject to devastating damage in the event of failure. The areas impacted are delineated using dam breach analyses that consider both "sunny day" failures and failures under flood conditions. The

DAM FAILURESDAM FAILURES 257

TECHNOLOGICAL HAZARDS258 TECHNOLOGICAL HAZARDS

DAM FAILURES
Consequences
RESEARCH, DATA COLLECTION, ANDMONITORING ACTIVITIES
DAM FAILURES 259
downstream extent of impact areas and the height to which waters will rise are largely functions of valley topography and the volume of water released during failure. More than 3,300 high and significant hazard dams are located within 1 mi ( 1.6 km) of a downstream population center, and more than 2,400 are located within 2 mi ( 3.2 km).
Exposure is compounded in communities experiencing growth because the typical dam-break floodplain is more extensive than the floodplain used for regulatory purposes. Therefore, new development is likely occur-ring without full recognition of the potential hazard. Few States and local jurisdictions consider the hazard classification of upstream dams when permitting development.
Roads and linear infrastructure such as electric, gas, cable, water lines, and sewer lines that cross waterways are exposed to scour and damage during dam failures.
Consequences
Some of the worst U.S. dam failures in terms of lives lost from 1874 to 1995 are listed in Table 20-1. The most devastating failure in U.S. history occurred in Johnstown, PA, in 1889. An earthen dam above the City failed, resulting in the deaths of 2,209 people and widespread property destruction.
The 1952 earthquake in southern California weakened the South Haiwee, Dry Canyon, and Buena Vista Dams (Sherard, 1983). In 1959, the Hebgen Dam in West Yellowstone, MT, was impacted by an earthquake with an estimate MMI of 10 (Woodward, 1983). During the 1994 Northridge earthquake, a Los Angeles earthen replacement dam settled 3 ft (1 m) and began to leak. The leaking subsided, as was anticipated by Los Angeles officials after inspection (Emergency Preparedness News, 1995).
In 1972, the failure of a privately-owned slagheap dam at Buffalo Creek, WV, devastated a 16-mi (26-km) valley. Of the 6,000 residents, 125 were killed and more than 3,000 were left homeless. The dam was neither designed nor built to acceptable engineering standards. In 1976, the failure of a federally-owned earthen dam in Teton, ID, caused 11 deaths and more than $1 billion in losses. The 1977 failure of the Kelly Barnes Dam in Toccoa Falls, GA, resulted in 37 deaths and heavy dam-age to homes and property.
In 1994, approximately 230 dams in Georgia were dam-aged by flooding caused by Tropical Storm Alberto. The damage to dams attributable to saturation during and after rainfall ranged from partial to complete fail
ure. This is believed to be the greatest number of dams damaged in a single event. However, according to the Center on the Performance of Dams at Stanford University, very few fatalities were attributed to the failures (McCann, 1995).
Dam failures often are cited as secondary effects of natural disasters and are not named as the primary hazard that causes the disaster declaration. Although wind-induced erosion occurred at the Point-of-Rocks Dam in northeastern Colorado, it did not fail
RESEARCH, DATA COLLECTION, AND MONITORING ACTIVITIES
Public concern stirred by the 1972 Buffalo Creek dam failure prompted the U.S. Congress to adopt the National Dam Inspection Act (P. L. 92-367) in 1972. The U.S. Army Corps of Engineers was authorized to inventory and inspect all non-Federal dams. In 1975, USACE published the first National Inventory of Dams.
Following the Teton and Kelly Barnes Dam failures, the U.S. Congress provided funding for USACE to begin inspecting the dams listed in the Inventory. The updated Inventory was established as a source of information for Federal, State, and local governments and other public and private owners to assist in the management of dams. Results of the initial inspection program were provided to each State's Governor.
In 1976, the President appointed an ad hoc committee to review safety programs for Federal dams. The commit-tee developed the Federal Guidelines for Dam Safety in 1979, and FEMA became responsible for coordinating Federal dam safety efforts.
In 1981, FEMA commissioned the National Research Council (NRC) to study policy and technical issues related to dam safety. The first NRC report emphasized the importance of updating the National Inventory of Dams. A second report examined technical issues of dam safety, and proposed guidelines to achieve improvements.
In 1985, FEMA modified a cooperative agreement with the Association of State Dam Safety Officials (ASDSO) to update the National Inventory of Dams through electronic transfer of State data. In 1986, funds to maintain and periodically publish updated information were authorized with the enactment of the Water Resources Development Act of 1986 (P. L. 99-662). Funds could be used for State grants, research programs to develop improved techniques for dam inspections, and training for State dam safety inspectors.

MITIGATION APPROACHES
TECHNOLOGICAL HAZARDS260 TECHNOLOGICAL HAZARDS
In 1989, FEMA and USACE signed a Memorandum of Agreement in which FEMA accepted responsibility for updating the National Inventory of Dams with USACE funds.
TABLE 20-1.— Selected Dam failures in the United States: 1874 - 1995
Source: From McCann, 1995.
Dam Name Date Fatalities Mill River, MA 1874 143 South Fork (Johnstown), PA 1889 2209 Walnut Grove, AZ 1890 150 Mountjoy Hill Reservoir, ME 1893 4 Angles, CA 1895 1 Melzingah 1&2, NY 1897 7 Austin TX 1900 8 Bayless (Austin Dam), PA 1911 80 Lyman, AZ 1915 8 Lower Otay, CA 1916 30 Mammoth, UT 1917 1 St. Francis, CA 1928 450 Wagner, WA 1938 1 Schoellkopf Station, NY 1956 1 Baldwin Hills, CA 1963 5 Little Deer Creek, UT 1963 1 Moohegan Park (Spaulding Pond), CT
1963 6
Swift, MT 1964 19 Two Medicine (Lower), MT 1964 9 Skagway, CO 1965 2 East Lee (Mud Pond), MA 1968 2 Lee Lake, MA 1968 2 Virden Creek, IA 1968 1 Anzalduas, TX 1972 4 Black Hills, SD 1972 245 Buffalo Creek, WV 1972 125 Canyon Lakes, SD 1972 33 Lake O’ the Hills, AK 1972 1 Lakeside, SC 1975 1 Asheville, NC 1976 4 Bear Wallow, NC 1976 4 Teton, ID 1976 11 Evans & Lockwood, NC 1977 2 Kelly Barnes, GA 1977 39 Laurel Run, PA 1977 40 Sandy Run, PA 1977 5 Lake Keowee Cofferdam, SC 1978 7 Swimming Pool, NY 1979 4 Eastover Mining Co., KY 1981 1 Lawn Lake, CO 1982 3 DMAD, UT 1983 1 Bass Haven, TX 1984 1 Little Falls, DC 1984 5 Kendall Lake, SC 1990 4 Shadyside, OH 1990 24 Timber Lake, VA 1995 2 Unnamed Dams Winston, NC 1904 9 Kansas River, KS 1951 11 Denver, CO 1965 1 Black Hills, SD 1972 245 Big Thompson River, CO 1976 144 Newfound, NC 1976 4 Kansas City, MO 1977 20 Texas Hill County, TX 1978 25 Austin , TX 1981 13 Northern, NJ 1984 2 Allegheny County, PA 1986 9 Americus, GA 1994 3
Emergency Action Plans (EAPs) have been prepared for approximately 6,500 dams, allowing for evaluation of the downstream inundation areas. Delineation of inundation areas is a crucial step, without which public notification, warning and evacuation planning cannot occur. As States move forward with dam safety pro-grams, dam classifications are amended when warranted by changing conditions, new development, and new information.
MITIGATION APPROACHES
Mitigation of hazards associated with dam failure differs depending on whether the hazard is associated with a new or existing dam. New dams can be designed to meet stringent safety criteria, including passage of extreme flood discharges and resistivity to earthquakes. Land downstream of new dams can be zoned or other-wise regulated to limit new construction and exposure.
Addressing hazards associated with existing dams often is problematic, especially when ownership cannot be determined. The primary mechanism is development of EAPs focused on evacuation of people and closure of roads. In some cases, high hazard dams that are deemed unsafe because of disrepair, poor maintenance, or changed design standards, can be retrofit. In extreme cases, removal of a dam may be the most efficient and cost-effective approach to mitigation of imminent danger and damage.
FEMA, working in concert with Federal and non-federal agencies, is continuing its efforts in the dam safety program, while considering improvements. One improvement under consideration would be to show dam-break inundation areas on NFIP maps to facilitate avoidance of hazards and emergency response.
Human intervention can play a significant role in averting dam catastrophes as illustrated by the following examples.
• A dam owned by Los Angeles County, CA, was severely damaged and considered destroyed by an earthquake in 1972. Fortunately for thousands of San Fernando Valley residents, dam operators were able to lower the water level to a safe elevation through the existing outlet structure, thus significantly reducing risks.
• Following the Mount St. Helens eruption in Washington in May 1980, a natural impoundment at Spirit Lake was in danger of failure. Because of the proximity of downstream communities combined with ash-laden streams, failure would have been dev-
DAM FAILURES
RECOMMENDATIONS
BIBLIOGRAPHY AND REFERENCES
DAM FAILURES 261
astating. Emergency pumping was accomplished to equalize the elevation of the lake, preventing a secondary disaster.
When FEMA was established in 1979, the position of Dam Safety Project Officer was created. The Dam Safety Project Officer serves as the chair of the Interagency Committee on Dam Safety (ICODS), a forum where Federal agencies initiate cooperative efforts and offer talent and resources to meet national dam safety needs. The ICODS member agencies are FEMA, DOD, NRC, DOE, TVA, U.S. Department of Agriculture, U.S. Department of the Interior, U.S. Department of Labor, Federal Energy Regulatory Commission, and the International Boundary and Water Commission.
FEMA coordinates with the Association of State Dam Safety Officials, which brings together State and local agencies and private sector representatives to provide a non-Federal voice on national dam safety issues. The United States Committee on Large Dams (USCOLD) represents the United States on the International Commission on Large Dams. USCOLD is dedicated to advancing the technology of dam design, construction, and operation and maintenance, and to promoting awareness of the role of dams in the beneficial development of water resources nationwide. Federal, State, and local governments and private owners have taken action since the initiation of the National Inventory of Dams to mitigate the potential for damage from dam failures. Activities have included the following:
• Develop a model dam safety program and database as a resource for States. States are now responsible for the safety of more than 95 percent of all dams, and all but three States have dam safety programs;
• Develop EAPs for dams that have high- and significant-hazard classifications. EAPs have been pre-pared for 35 percent of dams with high hazard classification, and 15 percent of dams with significant hazard classification.
• Hold dam safety engineering seminars, training sessions, and workshops, including the EAP Development and Design Course for all dam owners.
• Improve State dam safety programs as a part of the comprehensive hazard mitigation plan required after a disaster declaration.
RECOMMENDATIONS
Those States and communities that have not already done so should develop and adopt Dam Safety Programs. State and community officials should be encouraged to develop or update EAPs for the remaining structures classified as having high or significant downstream hazards. Unsafe dams present significant risks for people and property, and retrofit, repair, or removal should be considered in selected cases.
BIBLIOGRAPHY AND REFERENCES
Byrant, E. 1991. Natural Disasters. New York, NY: Cambridge University Press.
Coch, N.K. 1995. GEOHAZARDS: Natural and Human. Upper Saddle River, NJ: Prentice Hall.
Federal Emergency Management Agency. 1986. National Dam Safety Program: A Progress Report. Washington, DC: U.S. Government Printing Office.
Federal Emergency Management Agency, Office of Civil Defense. April 1990. Principal Threats Facing Communities and Local Emergency Management Coordinators: A Report to the United States Senate Committee on Appropriations. FEMA 191. Washington, DC: U.S. Government Printing Office.
Federal Emergency Management Agency. April 1993. Principal Threats Facing Communities and Local Emergency Management Coordinators: A Report to the United States Senate Committee on Appropriations. Washington, DC: U.S. Government Printing Office.
Federal Emergency Management Agency and U.S. Army Corps of Engineers. 1994. Water Control Infrastructure, National Inventory of Dams on CD-ROM, Updated Data. Washington, DC.
Federal Emergency Management Agency. 1987. State Non-Federal Dam Safety Programs-1985. Washington, DC: U.S. Government Printing Office.
McCall, M. 1995. Unpublished data. National Performance on Dams Program, Center on Performance of Dams. 1995. Stanford, CA: Stanford University.
Tschantz, Bruce A. August 1989. 1989 Report on Review of State Non-Federal Dam Safety Programs. Knoxville, TN: University of Tennessee.


CHAPTERCHAPTER
21
FIRESFIRES

TECHNOLOGICAL HAZARDS
Chapter Summary
264 TECHNOLOGICAL HAZARDS
Chapter Summary
Natural hazards represent a significant fire risk to the built-environment in the United States: lightning, high winds, earthquakes, volcanoes, and
floods can trigger or exacerbate fires.
States with the largest populations tend to have the greatest number of fire-related fatalities, which are related to population density. During 1991, structural fires caused 4,465 civilian deaths and 21,850 injuries, and resulted in an estimated $8.3 billion in damage.
The National Fire Protection Association (NFPA) prepares data that assist in assessment of the frequency and severity of fires caused by natural events. These and other industry-specific data help to assess risk and to determine expo-sure.
Of the current mitigation approaches, the trend toward performance-based regulations in the fire and building code communities is evolving and is based on the development and use of fire safety engineering methods.
Photo: Red Cross

FIRESFIRES 265
Photo: Red Cross
TECHNOLOGICAL HAZARDS
HAZARD IDENTIFICATION
RISK ASSESSMENT
Probability and Frequency
266 TECHNOLOGICAL HAZARDS
HAZARD IDENTIFICATION
Lightning is the most significant natural contributor to fires affecting the built-environment. Lightning can trigger structural fires, such as the $1.5 million loss of a historic mansion in Pennsylvania in 1994. Buildings with roof-top storage tanks for flammable liquids are particularly susceptible.
Wildfires are commonly the result of lightning strikes in outdoor areas, many of which have significant impacts to buildings. For example, a lightning strike near Dude Creek, AZ, resulted in six deaths in 1990. Wildfires are addressed in Chapter 19.
Prolonged warm winds can increase fire risks, especially in the more arid Western States. Sparks and embers are carried by winds, escalating fire spread. In 1985, a welder triggered a fire in a building under construction in Tennessee. The situation magnified in intensity when winds carried molten metal to an area with ordinary combustibles.
Significant seismic events often result in fires, particularly in areas where natural gas distribution systems can rupture, as was evident several years ago during the San
Francisco earthquake. Floods can trigger fires, and volcanic events may involve multiple fires.
RISK ASSESSMENT
The National Fire Protection Association (NFPA) Technical Committee on Lightning Protection prepared a guide for the risk assessment of buildings subject to lightning events (NFPA, 1992). Factors considered include type of structure, type of construction, relative location, topography, occupancy and contents, and lightning frequency isoceraunic level. This general approach has been complemented by industry-specific studies. For example, Giese, Rohsler, and Schollhorn (1984) developed a lightning risk assessment methodology specific to a gas-insulated switchgear plants.
Probability and Frequency
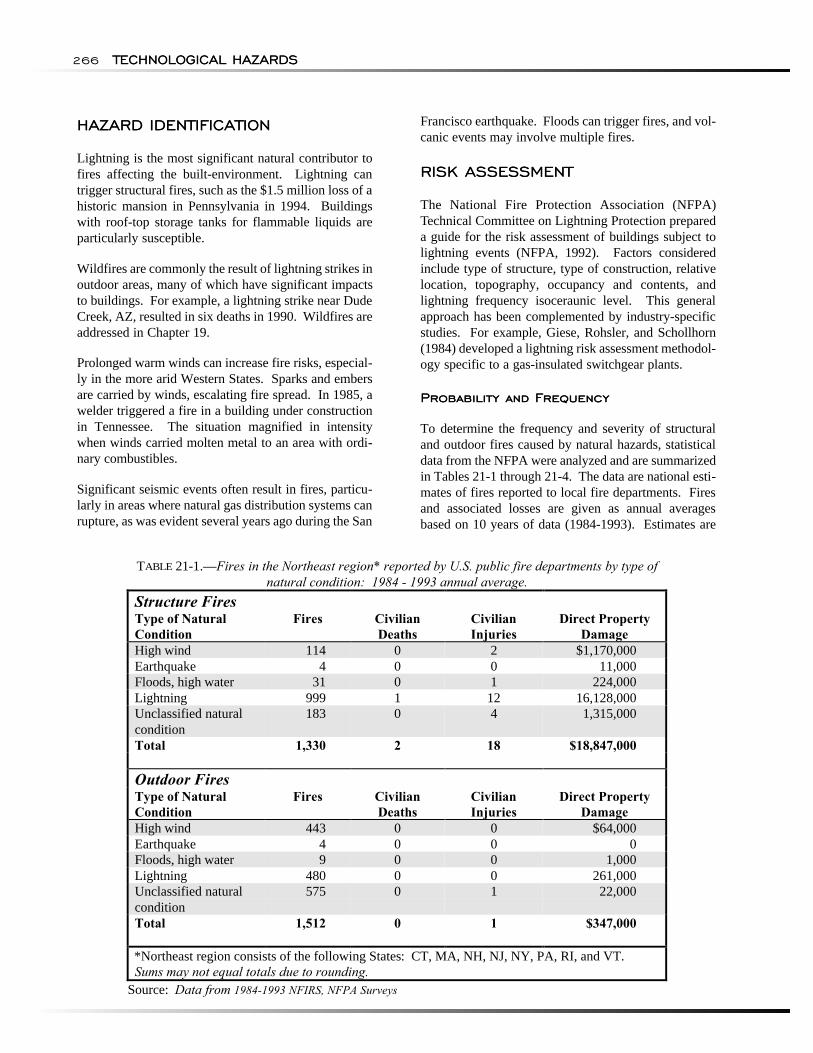
To determine the frequency and severity of structural and outdoor fires caused by natural hazards, statistical data from the NFPA were analyzed and are summarized in Tables 21-1 through 21-4. The data are national estimates of fires reported to local fire departments. Fires and associated losses are given as annual averages based on 10 years of data (1984-1993). Estimates are
TABLE 21-1.—Fires in the Northeast region* reported by U.S. public fire departments by type of natural condition: 1984 - 1993 annual average.
Structure Fires Type of Natural Condition
Fires Civilian Deaths
Civilian Injuries
Direct Property Damage
High wind 114 0 2 $1,170,000 Earthquake 4 0 0 11,000 Floods, high water 31 0 1 224,000 Lightning 999 1 12 16,128,000 Unclassified natural condition
183 0 4 1,315,000
Total 1,330 2 18 $18,847,000
Outdoor Fires Type of Natural Condition
Fires Civilian Deaths
Civilian Injuries
Direct Property Damage
High wind 443 0 0 $64,000 Earthquake 4 0 0 0 Floods, high water 9 0 0 1,000 Lightning 480 0 0 261,000 Unclassified natural condition
575 0 1 22,000
Total 1,512 0 1 $347,000
*Northeast region consists of the following States: CT, MA, NH, NJ, NY, PA, RI, and VT. Sums may not equal totals due to rounding.
Source: Data from 1984-1993 NFIRS, NFPA Surveys

FIRES
Exposure
Consequences
FIRES 267
TABLE 21-2.—Fires in the North Central region* reported by U.S. public fire departments by type of natural condition: 1984 - 1993 annual average.
Structure Fires Type of Natural Condition
Fires Civilian Deaths
Civilian Injuries
Direct Property Damage
High wind 279 1 2 $2,971,000 Earthquake 8 0 0 20,000 Floods, high water 46 0 0 128,000 Lightning 3,601 5 28 51,202,000 Unclassified natural condition
409 0 9 3,265,000
Total 4,343 7 38 $57,587,000
Outdoor Fires Type of Natural Condition
Fires Civilian Deaths
Civilian Injuries
Direct Property Damage
High wind 2,039 0 0 $234,000 Earthquake 10 0 0 25,000 Floods, high water 22 0 0 1,000 Lightning 3,486 0 0 1,464,000 Unclassified natural condition
1,151 0 1 148,000
Total 6,708 0 1 $1,872,000
*North Central region consists of the following States: IA, IL, IN, KS, MI, MN, MO, ND, NB, OH, SD, and WI.
Sums may not equal totals due to rounding. Source: 1984-1993 NFIRS, NFPA Survey
based on data from the NFPA's annual stratified random sample survey and the National Fire Incident Reporting System (NFIRS) developed by the U.S. Fire Administration (USFA). The estimates were combined using statistical methods developed by analysts at NFPA, USFA, and the U.S. Consumer Product Safety Commission.
Tables 21-1 through 21-4 present information for four regions of the United States: Northeastern, North Central, Southern, and Western. Each table shows the type of natural condition that caused the fire, identified as Ignition Factors 80 through 89 in accordance with the 1976 Edition of NFPA 901, Uniform Coding for Fire Protection.
The 10-year annual average number of civilian deaths and civilian injuries are rounded to the nearest whole number, and figures for fire-related direct property damage are rounded to the nearest thousand dollars. Normally, figures for number of reported fires are rounded to the nearest hundred, however the number of fires caused by earthquakes and floods are too few for rounding.
Exposure
All areas of the United States are exposed to personal injury and property damage as a result of fires caused by natural hazards. Fires occur year-round, but the rate of residential fires in January is twice that of the summer months (FEMA, 1993). Fatalities tend to be distributed according to population density. In 1987, 52 percent of the recorded fires occurred in 10 States (FEMA, 1993).
The 16 States and the District of Columbia that make up the Southern Region experience the most fires triggered by natural hazards, and lightning is the largest contributor. In the Western Region, high winds account for more structure fires than lightning, and a high percent-age (50 to 60 percent) of fires were caused by unclassified natural conditions.
Consequences
Fires, including large-scale fires, are well documented. For instance, the Great Chicago Fire of 1871 killed 1,152 people, burned 17,450 buildings, and caused an estimate $168 million in damage. It still ranks as one of the worst urban fires in U.S. history (FEMA, 1993).

TECHNOLOGICAL HAZARDS
RESEARCH, DATA COLLECTION, ANDMONITORING ACTIVITIES
268 TECHNOLOGICAL HAZARDS
TABLE 21-3.—Fires in the Southern region* reported by U.S. public fire departments by type of natural condition: 1984 - 1993 annual average.
Structure Fires Type of Natural Condition
Fires Civilian Deaths
Civilian Injuries
Direct Property Damage
High wind 276 1 2 $2,857,000 Earthquake 11 0 0 141,000 Floods, high water 32 0 0 147,000 Lightning 3,034 3 34 43,505,000 Unclassified natural condition
260 1 4 4,464,000
Total 3,613 4 41 $51,114,000
Outdoor Fires Type of Natural Condition
Fires Civilian Deaths
Civilian Injuries
Direct Property Damage
High wind 2,714 0 0 $93,000 Earthquake 70 0 0 2,000 Floods, high water 23 0 0 24,000 Lightning 6,135 0 3 2,085,000 Unclassified natural condition
1,869 0 2 161,000
Total 10,811 0 7 $2,365,000
*Southern region consists of the following States: AL, AR, DC, DE, FL, GA, KY, LA, MD, MS, NC, OK, SC, TN, TX, VA, and WV. Sums may not equal totals due to rounding.
Source: 1984-1993 NFIRS, NFPA Survey
During 1991, structural fires caused 4,465 civilian deaths and 21,850 injuries and resulted in an estimated $8.3 billion in fire-related losses (FEMA, 1993).
RESEARCH, DATA COLLECTION, AND MONITORING ACTIVITIES
Friedman conducted an international survey of computer models for fire and smoke on behalf of the Forum for International Cooperation on Fire Research (Friedman, 1992). The survey identified 62 programs in 10 countries, including compartment fire models, fire-sprinkler interaction models, and submodels for fire endurance, building evacuation, thermal detector activation, fire spread on a wall, and smoke movement.
As directed by P.L. 93-498, the National Fire Data Center (NFDC), operated by FEMA's Office of Fire Data and Analysis, is responsible for selecting, analyzing, publishing, and disseminating information concerning the prevention, occurrence, control, and results of fires of all types. Its missions are to: provide accurate nationwide analysis of the fire problem; identify major problem areas; assist in setting priorities; deter-mine possible solutions to problems; and monitor the progress of programs designed to reduce the loss of life
and property due to fires (USFA, 1992). NFDC gathers and analyzes information on:
• Frequency, cause, spread, and extinguishment;
• Number of injuries and deaths, including the specific cause(s) and nature of the deaths and injuries;
• Property losses;
• Occupational hazards faced by firefighters, including the cause(s) of deaths and injuries;
• Types of firefighting activities, including inspection practices;
• Building construction practices and fire properties of materials;
• Fire prevention and control laws, systems, methods, techniques, and administrative structures used in other countries; and
• Causes, behavior, and best methods for control of structural, brush, forest, underground, oil-blowout, and water-borne fires.

FIRES
MITIGATION APPROACHES
RECOMMENDATIONS
FIRES 269
With the cooperation of the National Fire Information Council (NFIC), the USFA maintains the National Fire Incident Reporting System (NFIRS). NFIRS data are analyzed to assess fire problems on national, regional, State, and local levels. Based on these analyses, the USFA develops and distributes reports describing problems and indicating targets for prevention and mitigation strategies. Of particular note is the NFDC's Technical Report Series, through which information on major or unusual fires is disseminated, stressing "lessons learned" from those incidents.
MITIGATION APPROACHES
The USFA provides an extensive continuing series of on- and off-campus educational programs through the National Fire Academy in Emmitsburg, MD. It provides information on an array of topics through the EENET videoconferencing network, and works with State and local fire officials to educate the public through school curricula and a variety of awareness publications and presentations.
The trend toward performance-based regulations in the fire and building code communities is evolving based on the development and use of fire safety engineering methods. Such regulations may have a significant impact on fire-caused damage in the future.
The mitigation measures available for lightning protection are well-known. As presented by the NFPA (1992), there are detailed requirements for ordinary structures, miscellaneous structures and special occupancies, heavy-duty stacks, and structures containing flammable vapors, flammable gases, or liquids that can give off flammable vapors. Conductors are specified in terms of design and construction as a function of the geometry of the structure protected.
RECOMMENDATIONS
While a risk assessment methodology exists for lightning hazards, additional methods for assessing the risk of fires due to other natural events have not been developed or were not identified during this research effort.
TABLE 21-4.—Fires in the Western region* reported by U.S. public fire departments by type of natural condition: 1984 - 1993 annual average.
Structure Fires Type of Natural Condition
Fires Civilian Deaths
Civilian Injuries
Direct Property Damage
High wind 368 1 5 $5,432,000 Earthquake 32 0 0 756,000 Floods, high water 22 0 1 180,000 Lightning 169 0 3 1,973,000 Unclassified natural condition
576 4 12 33,079,000
Total 1,167 5 22 $41,420,000
Outdoor Fires Type of Natural Condition
Fires Civilian Deaths
Civilian Injuries
Direct Property Damage
High wind 1,992 0 0 $3,218,000 Earthquake 23 0 0 10,000 Floods, high water 30 0 0 7,000 Lightning 2,019 0 3 285,000 Unclassified natural condition
5,706 0 6 2,211,000
Total 9,770 0 10 $5,731,000
*Western region consists of the following States: AK, AZ, CA, CO, HI, ID, MT, NM, NV, OR, UT, WA, and WY.
Sums may not equal totals due to rounding. Source: 1984-1993 NFIRS, NFPA Survey

TECHNOLOGICAL HAZARDS
BIBLIOGRAPHY AND REFERENCES
270 TECHNOLOGICAL HAZARDS
BIBLIOGRAPHY AND REFERENCES
Federal Emergency Management Agency. 1987. Fire in the United States: Deaths, Injuries, Dollar Losses, and Incidents. Washington, DC: U.S. Government Printing Office.
Federal Emergency Management Agency, Office of Civil Defense. 1990. Principal Threats Facing Communities and Local Emergency Management Coordinators: A Report to the United States Senate Committee on Appropriations. FEMA 191. Washington, DC: U.S. Government Printing Office.
Federal Emergency Management Agency, Office of Emergency Management. 1993. Principal Threats Facing Communities and Local Emergency Management Coordinators: A Report to the United States Senate Committee on Appropriations. Washington, DC: U.S. Government Printing Office.
Federal Emergency Management Agency, U.S. Fire Administration. 1992. Report to Congress, Fiscal Year 1991. Washington, DC.
Friedman, R. 1992. "An International Survey of Computer Models for Fire and Smoke." Journal of Fire Protection Engineering. Vol. 4, No. 3, p. 81.
Giese, M., H. Rosler, and W. Schollhorn. 1989. "Lightning Protection of Gas Insulated Switchgear Plant - a Procedure for Assessing the Residual Failure Risk." Elektrizitactswirtschaft. Vol. 88, No. 11, p. 672.
National Fire Protection Association. 1976. Uniform Coding for Fire Protection, No. 901.
National Fire Protection Association, Technical Committee on Lightning Protection. 1992. Lightning Protection Code, No. 780.
Sundt, N. A. 1989. Budgetary Levels and Flexibility: The 1988 Fire Season and Beyond. U.S. Forest Service. Washington, DC: U.S. Government Printing Office.

FIRESFIRES 271


CHAPTERCHAPTER
22
HAZARDOUSHAZARDOUS MATERIALSMATERIALS
EVENTSEVENTS

TECHNOLOGICAL HAZARDS
Chapter Summary
274 TECHNOLOGICAL HAZARDS
Chapter Summary
Cities, counties, and towns where hazardous materials (HAZMAT) fabrication, processing, and storage sites are located, and those where hazardous
waste treatment, storage, or disposal facilities operate, are at risk for HAZMAT events.
Of the 6,774 HAZMAT events that occur on average each year, 5,517 are highway events, 991 are railroad events, and 266 are due to other causes. Transportation of HAZMAT on highways involves tanker trucks or trailers and certain types of specialized bulk-cargo vehicles. Because of the distances traveled, it is not surprising that trucks are responsible for the greatest number of HAZMAT events. Transportation routes and facilities may sustain damage, including pipelines, airports, highways, railroad routes, harbors, and related facilities.
An average of 280 HAZMAT releases and spills at fixed sites occurred each year between 1987 and 1990, according to the U.S. Coast Guard's National Response Center. Natural disasters, particularly earthquakes, can cause HAZMAT releases at fixed sites and can impact response. External events, including natural hazards, can contribute to transportation-related HAZMAT events.
Rain, high winds, and fires can worsen conditions surrounding HAZMAT events, making it more difficult to contain releases and to mitigate the short- and long-term effects. Burning fuels or chemicals entering sewers or drains that are not completely filled with storm runoff have caused underground fires. Fires involving certain types of HAZMAT may generate more toxic gas or smoke than would otherwise normally evolve (FEMA, DOT, and EPA, 1989).
HAZMAT releases pose short- and long-term toxological threats to people and to terrestrial and aquatic plants and wildlife. Toxic materials affect people through inhalation, ingestion, or direct contact with skin.
Two programs specifically designed by FEMA to address potential HAZMAT releases are the Hazardous Materials Program and the Chemical Stockpile Emergency Preparedness Program. Additional supporting programs by other Federal agencies, the Chemical Manufacturers Association, and the American Institute of Chemical Engineers promote safety and development of plans to respond to HAZMAT events.
Photo: Michael Baker Corporation

HAZARDOUS MATERIALS EVENTSHAZARDOUS MATERIALS EVENTS 275
Photo: FEMA

TECHNOLOGICAL HAZARDS
HAZARD IDENTIFICATION
Fixed-Site Facilities.
276 TECHNOLOGICAL HAZARDS
Photo: Michael Baker Corporation
HAZARD IDENTIFICATION
Under the Emergency Planning and Right to Know Act of 1986, the U.S. Department of Transportation (DOT) identified as hazardous 308 specific chemicals from 20 chemical categories. Identified chemicals cover a wide range of toxicities, and in small doses many have minimal or no effect on humans. Another category of HAZMAT is the U.S. Army's stockpile of unitary chemical weapons, which are stored at eight sites in the continental United States.
To identify the extent of the hazard in a particular community or region, planning personnel and others must determine what types of HAZMAT are stored, handled, processed, or transported, and where and how those functions are performed. Storage, handling, and processing will usually take place at fixed sites: bulk chemical, petroleum processing, and other industrial facilities; hazardous waste disposal and water treatment facilities; public and private chemistry laboratories; and U.S. Army weapons depots.
For regulatory purposes, various U.S. and international organizations including USEPA, DOT, NFPA, and the International Maritime Organization, have defined HAZMAT lists or classes. USEPA sorts HAZMAT into the following categories: toxic agents (irritants, asphixi
ants, anesthetics and narcotics, sensitizers); other types of toxic agents (hepatoxic and nephratoxic agents, carcinogens, mutagens); hazardous wastes; hazardous sub-stances; toxic pollutants; and extremely hazardous sub-stances.
During transportation, DOT classifies HAZMAT in one or more of the following categories: explosive; blasting agent; flammable liquid; flammable solid; oxidizer; organic peroxide; corrosive material; compressed gas; flammable compressed gas; poison (A and B); irritating materials; inhalation hazard; etiological agent; radioactive materials; and other regulated material (FEMA, DOT, and USEPA, 1989).
The 1986 Act requires that companies report releases of designated hazardous chemicals to USEPA, even if releases do not result in human exposure. Types of releases are:
• Air emissions of gases or particles from a pressure relief valve, smokestack, ruptured reaction vessel, broken pipe or other equipment at a chemical plant or other fixed-site facility; from broken, loose-fitting, or punctured equipment, containers, or cylinders on transportation vehicles; and from solid or liquid discharges onto ground or into water;
• Discharges into bodies of water from damaged ships, barges, underwater pipelines, and trucks or railroad cars that fall into the water;
• Discharges as outflows from sewer or drain outfalls, runoff from spills on land, runoff from water used to control fires, or contaminated groundwater;
• Discharges onto land;
• Solid waste disposal in onsite landfills;
• Injection of wastes into underground wells;
• Transfers of wastewater to public sewage plants; and
• Transfers of wastes to offsite facilities for treatment or storage.
Fixed-Site Facilities. HAZMAT is stored, processed, and handled at a range of facilities:
• Large refineries, chemical plants, and storage terminals;
• Moderate-sized industrial users, warehouses, and isolated storage tanks for water treatment; and

HAZARDOUS MATERIALS EVENTS
Highway
Marine Transportation.
Air Transportation.
Pipeline Transportation.
Natural Hazards.
Transportation.Rail and
HAZARDOUS MATERIALS EVENTS 277
• Small quantity users and storage facilities, such as school laboratories, florists/greenhouses, and hard-ware/automotive stores.
Because of the wide range of facility types, accurate data are not available to make determinations concerning the magnitude of the potential hazard. HAZMAT releases result from storage tank and container ruptures or leaks, releases through safety and relief valves, piping ruptures and leaks, fire-induced releases, equipment failures, overfills and overflows of storage tanks, and human error (FEMA, DOT, and USEPA, 1989).
The chemical weapons stockpile represent another fixed-site category. The Department of Defense Authorization Act of 1986 (P.L. 99-145) mandated that the stockpile be destroyed, while directing the Secretary of Defense to provide for the protection of the environment, the general public, and the personnel involved in stockpile destruction activities.
Highway and Rail Transportation. Transportation of HAZMAT on the highway involves tanker trucks or trailers and specialized bulk-cargo vehicles. Average trip lengths are 28 miles for gasoline trucks and 260 miles for chemical trucks. Because of the distance traveled, it is not surprising that trucks are responsible for the greatest number of HAZMAT events (FEMA, DOT, and USEPA, 1989).
Two types of HAZMAT releases from railroad events are of most concern: collisions and derailments that result in large spills or discharges; and releases from leaks in fittings, seals, or relief valves, and improper closures or defective equipment. According to Harvey and others (1987), these releases account for 70 percent of the nearly 1,000 railroad-related events each year. Many of the more severe events occur in railyards and on sidings (Wolfe, 1984).
Marine Transportation. The primary vessels used for marine transport of HAZMAT are bulk liquefied gas carriers, chemical tankers, oil tankers, and tank barges. Bulk cargos may be found in smaller tanks on decks of vessels or in standard intermodal cargo containers (FEMA, DOT, and USEPA, 1989).
Air Transportation. Transportation of HAZMAT by air is generally limited to small packages. According to 1986 figures from the Office of Technology Assessment (March 1996), the annual tonnage shipped is between 200,000 and 300,000 tons. Only a few HAZMAT events involving air transportation occur each year, and those usually are due to violations of regulations.
Pipeline Transportation. U.S. pipelines are used primarily for the transport of petroleum liquids (crude oil, gasoline, and natural gas liquids) and energy gases (natural gas and liquefied petroleum gas). Some pipelines transport ethane, ethylene, liquefied natural gas, anhydrous ammonia, carbon monoxide, sour gas, and other chemicals.
Pipeline length from the source to the receiving site can be 1,000 ft (300 m), 1 mi (1.6 km), or hundreds of miles. Pipelines cross both rural and heavily populated areas. The capacity of a pipeline depends largely on its diameter. A pipeline may be buried or above-ground, and may contain pumps or compressors, cased sleeves under roadways or rail lines, and storage tanks.
Natural Hazards. Natural disasters, particularly earthquakes, can cause HAZMAT releases at fixed sites and complicate spill response activities. An earthquake may impair the physical integrity of a facility or may cause failure of multiple containers. When a HAZMAT event occurs during a natural disaster, access to facilities may be restricted, waterlines for fire suppression may be broken, and response personnel and resources may be limited. The potential threat of an event can be magnified by winds, thunderstorms, or floods, which can spread contamination quickly, threatening the local water supply, agriculture, and air.
Examples of natural hazards that may cause transportation-related HAZMAT events include:
• Heavy rainfall during thunderstorms and hurricanes cause slippery road conditions resulting in highway carrier accidents;
• Earthquakes destroy highways, bridges, and rail-ways, resulting in damage to HAZMAT carriers;
• Earthquakes, land subsidence, avalanches, flood/scouring, lightning, fires, and severe winter-storms cause pipelines to fail;
• Snow, ice, and high-wind conditions during severe winterstorms cause traffic accidents; and
• High velocities and volumes of floodwaters wash out bridges, roads, and fixed HAZMAT manufacturing, handling, and storage facilities.

TECHNOLOGICAL HAZARDS
RISK ASSESSMENT
Probability and Frequency
Exposure
Consequences
278 TECHNOLOGICAL HAZARDS
RISK ASSESSMENT
Probability and Frequency
An average of 280 HAZMAT releases and spills at fixed sites occurred each year between 1987 and 1990, according to the U.S. Coast Guard's National Response Center. In 1987, the first year of reporting, releases totaling 22.5 billion pounds occurred (FEMA 191, 1990). Facilities in the Gulf Coast, Great Lakes, and Middle Atlantic States and California have had the largest number of releases.
According to DOT, most HAZMAT events between 1982 and 1991 occurred during transport. The average number of HAZMAT events (6,774 each year) is broken down as follows: highway (5,517 or 81.4 percent); railroad (991 or 14.7 percent); and other events (266 or 3.9 percent).
The number of railroad accidents reported to the Federal Railroad Administration (FRA) decreased by a factor of three between 1979 and 1993, while total rail traffic increased by 5 percent over the same period. The number of accidental releases also declined, due both to the reduction in accidents and the application of protective measures. The design, construction, and use of railroad tank cars are regulated by the FRA and the American Association of Railroads.
Because of the slow speeds and extra precautions taken on marine vessels, the lowest number of HAZMAT events occurs on the water. However, due to the total tonnage of materials involved, events involving collisions with other vessels and groundings have the potential to be devastating. As with other modes of transportation, small leaks do occur as a result of problems with seals and other equipment integrity. However, the impact of such small leaks is minimized because of the physical separation of the vessels from the general population.
Pipeline failure rates have not declined in recent years. In fact, some specialists have suggested that, although the standards for new pipelines are improving, the likelihood of failure of older pipelines due to corrosion and aging has increased. A significant correlation exists between reported incidents involving loss of product and pipeline age. Besides corrosion, failures are caused by external impacts by farm or construction machinery, structural failures, mechanical defects, and natural hazards.
Exposure
All areas of the United States where DOT-designated chemicals are fabricated, processed, stored, or disposed at fixed sites may be exposed. USEPA catalogued existing HAZMAT sites and identified 1,225 Superfund sites. Every State has at least one Superfund site, but they are more prevalent east of the Mississippi River and most heavily concentrated in the Northeastern States (Map 22-1). New Jersey and Pennsylvania account for more than 18 percent of the sites.
Communities close to highway, railroad, pipeline, air, and water transportation systems are at risk from HAZMAT events that occur during transport. The Emergency Planning and Right to Know Act requires that USEPA be notified of releases. USEPA, DOT and the U.S. Coast Guard maintain spill data.
States and jurisdictions immediately surrounding unitary chemical weapon stockpile sites have the highest risk of exposure in the event of a storage or destruction accident:
• Aberdeen Proving Ground, Aberdeen, MD; • Lexington-Blue Grass Army Depot,
Lexington, KY; • Anniston Army Depot, Anniston, AL; • Pine Bluff Arsena, Pine Bluff, AR; • Newport Army Ammunition Plant,
Newport, IN; • Pueblo Depot, Pueblo, CO; • Tooele Army Depot, Tooele, UT; and • Umatilla Depot, Umatilla, OR.
Consequences
HAZMAT releases pose short- and long-term toxological threats to humans and to terrestrial and aquatic plants and wildlife. Toxic materials affect people through one of three processes: inhalation, ingestion, or direct contact with skin. Inhalation exposures result from breathing gases that may have been vented from containers, liquid aerosols generated during venting of pressurized liquids, fumes from spilled acids, vapors created by evaporating liquids, and airborne dust. Ingestion exposures typically result from poor hygiene habits after handling contaminated materials or eating contaminated food, or the inhalation of insoluble particles that become trapped in mucous membranes. Skin may be affected by direct contact with gas, liquid, or solid forms of hazardous materials.
Since reporting began, highway transportation events have caused more than 100 deaths (averaging 11 per year) and 2,800 injuries (FEMA, 1993). Incidents asso-

HAZARDOUS MATERIALS EVENTSHAZARDOUS MATERIALS EVENTS 279

TECHNOLOGICAL HAZARDS
RESEARCH, DATA COLLECTION, AND MONITORING
MITIGATION APPROACHES
280 TECHNOLOGICAL HAZARDS
ciated with all other modes of transportation accounted for an average of less than one death per year. The estimated average annual damage from HAZMAT events is $22.4 million. This dollar figure does not account for multi-year losses such as the fishing industry losses from the 1991 chemical spill in the Sacramento River or the disruption caused by evacuations during the Nemadji River spill in Wisconsin.
RESEARCH, DATA COLLECTION, AND MONITORING
The Federal Railroad Administration's accident reporting system provides accurate data regarding accident incidences by cause, but it does not include natural hazards as a separate category. The Department of Transportation’s Research and Special Programs Administration (RSPA) collects data on HAZMAT releases, but these data do not include information on accident causes. Efforts to match these data with natural hazard events have been only partially successful.
FEMA, USEPA, and DOT collect and disseminate extensive statistics on HAZMAT releases. Information is provided via the Hazardous Materials Information Exchange computerized bulletin board system maintained by FEMA and DOT.
With the publication of Handbook of Chemical Hazard Analysis Procedures in 1989, FEMA, USEPA, and DOT introduced a computer program that can be used by local emergency planning committees and other personnel to evaluate potentially hazardous facilities and activities. The Automated Resource for Chemical Hazard Incident Evaluation (ARCHIE) program was designed as a tool for local government officials to use “to conduct consequence analysis for postulated accident scenarios” involving HAZMAT (FEMA, DOT, and USEPA, 1989).
DOT has sponsored numerous research studies and demonstration projects related to planning for transportation-related HAZMAT events. A fairly comprehensive list is provided in Appendix E of the Hazardous Materials Emergency Planning Guide, published by the National Response Team in 1987. Additional studies are cited in the Handbook of Chemical Hazard Analysis Procedures (FEMA, DOT, and USEPA, 1989).
MITIGATION APPROACHES
Science and technology applications used to avoid HAZMAT events are of two types: physical adjustments and social adjustments. Physical adjustments for avoiding the impacts of natural hazards include:
• Planning and building HAZMAT facilities to with-stand prevalent natural hazards;
• Identifying and avoiding sites where hazards are highly likely to occur;
• Predicting the occurrence of hazards; and
• Preventing or altering the characteristics of hazards.
Social adjustments for avoiding impacts associated with natural hazards include:
• Restricting the use of land and establishing minimum standards for avoiding hazardous sites and conditions;
• Implementing Local Emergency Planning Committees to enhance public awareness of hazardous materials in communities;
• Instituting public awareness campaigns in areas prone to hazards in the vicinity of HAZMAT sites;
• Initiating emergency preparedness and evacuation programs to protect life and property when warnings are issued or events occur;
• Establishing systems for notification of key individuals in the public and private sectors, including supervisory personnel of facilities requiring special notification, water users, supervisory personnel of water-treatment plants, utility companies, air traffic con-trollers, railroad dispatchers, and U.S. Coast Guard or harbor master facilities;
• Spreading the economic loss among a larger population through insurance, taxation, and monetary grants; and
• Reconstructing communities to be less vulnerable to future hazard events and HAZMAT releases.
As an example of social adjustments, in August 1994, community activists successfully lobbied to prevent the storage of tons of hazardous waste in Strawberry Canyon on the campus of the University of California. The site was located close to residential neighborhoods and in an area subject to fires, mudslides, and earth-quakes that could damage a facility. Thus, the potential for a catastrophic HAZMAT event caused by a natural hazard was significant.
Two FEMA programs specifically designed to address the potential problem of HAZMAT releases are the Hazardous Materials Program and the Chemical Stockpile Emergency Preparedness Program (CSEPP).

HAZARDOUS MATERIALS EVENTS
BIBLIOGRAPHY AND REFERENCES
HAZARDOUS MATERIALS EVENTS 281
FEMA's mission under the Hazardous Materials Program is to provide technical and financial assistance to State and local government agencies and to coordinate and cooperate with private-sector companies in developing, implementing, and evaluating HAZMAT emergency preparedness programs. This mission is accomplished through planning, training, exercising, information exchange, and intergovernmental coordination and cooperation.
FEMA's efforts under the CSEPP are based on a Memorandum of Understanding with the U.S. Army, under which FEMA assists States and local jurisdictions surrounding the eight stockpile sites. FEMA provides technical assistance with comprehensive planning, exercises, training, and emergency public information, and serves as the intermediary through which U.S. Army funding is provided to jurisdictions.
Standards in ANSI B31.8, Code for Gas Transmission and Distribution Piping Systems (1986), recognize the increased risk from pipeline failures in populated areas. Improved safety requirements are recommended, including progressive increases in pipe wall thickness with both increased population density and types of road and railroad crossings. The code recommends minimum safety distances to occupied buildings to reduce individual risk levels for pipelines carrying gas, volatile liquids and chemicals.
Corrosion can be reduced by the installation of cathodic protection systems. They are used in areas prone to corrosion and in the vicinity of metallic services (telephone, sewer, water, etc.). Regular inspection is required to ensure that high electrical currents are not being drawn so that early indication of the failure of the corrosion coatings is detected. Inspection devices travel internally along pipelines and measure the condition of pipe walls.
Railroad car design features have a significant influence on release probability. With proper design, the risk of release can be lowered if a natural event causes an accident. Resistance to head and shell puncture during impact is a function of shell thickness and material of construction, and whether the car is equipped with jacketed insulation (glass wool inside a steel jacket). Distortion of the jacket absorbs impact energy and reduces the severity of containment shell damage. Other measures reduce vulnerability to puncture and rupture in the event containers are uncoupled.
The Federal Government has a long record of concern about HAZMAT releases and the potential impact on U.S. citizens and the environment. Several Federal agencies, including USEPA, DOT, and FEMA, provide
training, technical assistance, and guidance to State and local governments and industry in planning for, and responding to, HAZMAT releases.
With the publication of Hazardous Materials Emergency Planning Guide (March 1987), the National Response Team coordinated the Federal planning process. The National Response Team consists of 14 agencies with responsibilities for the environment, transportation, and public health and safety. The guide focused on the needs of State and local governments, while providing useful information for industrial planners (USEPA and USDOT, 1987).
The joint publication of Technical Guidance for Hazards Analysis-Emergency Planning for Extremely Hazardous Substances (USEPA and USDOT, 1987) fulfilled mandates of the Superfund Amendments and Reauthorization Act of 1986 by providing simplified guidance for hazard identification, vulnerability analysis, and risk analysis for fixed facilities that are subject to the 1986 reporting requirements.
Also issued by FEMA, DOT, and USEPA (undated), The Handbook of Chemical Hazard Analysis Procedures takes a more comprehensive approach to emergency planning and mitigation activities by including information on explosive, flammable, reactive, and otherwise dangerous chemicals. DOT has sponsored many research studies and demonstration projects related to planning for HAZMAT-related transportation emergencies. To assist emergency personnel at all levels, USEPA and FEMA published a variety of planning documents.
Federal agencies are not the only organizations involved in disseminating planning and mitigation information to the public and private sectors. The Chemical Manufacturers Association and the American Institute of Chemical Engineers have also undertaken ambitious programs to promote safety and the development of plans for HAZMAT response.
BIBLIOGRAPHY AND REFERENCES
American Institute of Chemical Engineers, Battelle Memorial Institute. 1985. Guidelines for Hazard Evaluation Procedures. New York, NY: Center for Chemical Plant Safety.
American Institute of Chemical Engineers. 1987. Guidelines for Safe Storage and Handling of High Toxic Hazard Materials. New York, NY: Arthur D. Little, Inc.

TECHNOLOGICAL HAZARDS282 TECHNOLOGICAL HAZARDS
American Institute of Chemical Engineers. 1994. Guidelines for Evaluating the Characteristics of Vapor Cloud Explosion, Flash Fires, and BLEVEs. New York, NY: The Center.
Badolato, E.V. 1990. "Vulnerability of the Oil and Gas Transportation and Storage System." Paper presented at the Joint Government-Industry Symposium on Transportation, Williamsburg, VA, March 21-22, 1990.
Bennett, G.F. and others. 1982. Hazardous Materials Spills Handbook. New York, NY: McGraw-Hill Book Company.
Chemical Manufacturers Association. 1985. Community Awareness and Emergency Response Program Handbook. Washington, DC.
Chemical Manufacturers Association. 1992 Community Emergency Response Exercise Program. Arlington, VA.
Chemical Manufacturers Association. 1992 Site Emergency Response Planning. Arlington, VA.
Deines, V., B.H. Garten, R. Jepsen, P.G. Joshi, J.P. Lambert, T.R. Mansfield, E.R. Russell, and J.J. Smaltz. 1986. Community Model for Handling Hazardous Material Transportation Emergencies: Executive Summaries. Office of the Secretary of Transportation, University Research Program. Manhatten, KS: Kansas State University.
Federal Emergency Management Agency. (undated). Guide for Development of State and Local Emergency Plans. Washington, DC.
Federal Emergency Management Agency. 1981. Disaster Operations: A Handbook for Local Governments. Washington, DC.
Federal Emergency Management Agency. 1984. Objectives for Local Emergency Management. Washington, DC.
Federal Emergency Management Agency. 1987. Digest of Federal Training in Hazardous Materials. Washington, DC.
Federal Emergency Management Agency, U.S. Department of Transportation, and U.S. Environmental Protection Agency. 1989. Handbook of Chemical Hazard Analysis Procedures. Washington, DC: U.S. Government Printing Office.
Federal Emergency Management Agency, Office of Civil Defense. 1990. Principal Threats Facing Communities and Local Emergency Management Coordinators: A Report to the United States Senate Committee on Appropriations. FEMA 191. Washington, DC: U.S. Government Printing Office.
Federal Emergency Management Agency, Office of Emergency Management. 1993. Principal Threats Facing Communities and Local Emergency Management Coordinators: A Report to the United States Senate Committee on Appropriations. Washington, DC: U.S. Government Printing Office.
Federal Railroad Administration, Office of Safety. 1990. Accident/Incident Bulletin No. 158, Calendar Year 1989. Washington, DC: U.S. Government Printing Office.
Federal Railroad Administration, Office of Safety. 1992. Accident/Incident Bulletin No. 160, Calendar Year 1991. Washington, DC: U.S. Government Printing Office.
Federal Railroad Administration, Office of Safety. 1987. Certain Fatalities Investigated by the Federal Railroad Administration, Third Quarter 1987. Washington, DC: U.S. Government Printing Office.
Federal Railroad Administration, Office of Safety. Certain Fatalities Investigated by the Federal Railroad Administration, Fourth Quarter 1987. Washington, DC: U.S. Government Printing Office.
Federal Railroad Administration, Office of Safety. 1987. Certain Fatalities Investigated by the Federal Railroad Administration, Third Quarter 1987. Washington, DC: U.S. Government Printing Office.
Federal Railroad Administration, Office of Safety. 1988. Certain Fatalities Investigated by the Federal Railroad Administration, Fourth Quarter 1987. Washington, DC: U.S. Government Printing Office.
Federal Railroad Administration, Office of Safety. (Various Calendar Years). Summary of Accidents Investigated by the Federal Railroad Administration. Washington, DC: U.S. Government Printing Office.
Harvey, A.E., P.C. Conlon, and T.S. Glickman. 1987. Statistical Trends in Railroad Hazardous Materials Transportation Safety. Association of American Railroads, Washington Systems Center. Publication No. R-640.

HAZARDOUS MATERIALS EVENTSHAZARDOUS MATERIALS EVENTS 283
Hatayama, H.K. and others. 1980. A Method for Determining the Compatibility of Hazardous Wastes. EPA Report No. 600/2-80-76. U.S. Environmental Protection Agency, Municipal Environmental Research Laboratory. Cincinnati, OH.
Hildebrand, M.S. 1980. Disaster Planning Guidelines for Fire Chiefs - Final Report. Washington, DC: International Association of Fire Chiefs.
Lee, M.T., and P.G. Roe. 1981. Hazardous Materials Management System: A Guide for Local Emergency Managers. For Federal Emergency Management Agency. Portland, OR: Multnoma County Office of Emergency Management.
McGregor, G.I. (Ed.) 1983. Community Teamwork: Working Together to Promote Hazardous Materials Transportation Safety—A Guide for Local Officials. U.S. Environmental Protection Agency, Chemical Emergency Preparedness and Prevention Office. Cambridge, MA: Cambridge Systematics, Inc.
National Fire Protection Association. 1986. Fire Protection Guide on Hazardous Materials. Quincy, MA.
National Response Team. 1987. Hazardous Materials Emergency Planning Guide. Washington, DC.
National Transportation Safety Board. January 17, 1991. News Release S.B. 91.03. Washington, DC.
National Transportation Safety Board. 1981. Railroad/Highway Grade Crossing Accidents Involving Trucks Transporting Bulk Hazardous Materials. NTIS PB82-113432. Washington, DC: U.S. Government Printing Office.
National Transportation Safety Board. 1990. Safety Information. Washington, DC: U.S. Government Printing Office.
Office of Technology Assessment. 1986. Transportation of Hazardous Materials: State and Local Activities. OTA-SET-301. Washington, DC: U.S. Government Printing Office.
Office of Technology Assessment. 1986. Transportation of Hazardous Materials. OTA-SET-340. Washington, DC: U.S. Government Printing Office.
U.S. Environmental Protection Agency and U.S. Department of Transportation. 1987. Technical Guidance for Hazards Analysis—Emergency Planning for Extremely Hazardous Substances. Washington, DC: Federal Emergency Management Agency.
U.S. Department of Transportation and U.S. Environmental Protection Agency. 1985. Lessons Learned: A Report on the Lessons Learned from State and Local Experiences in Accident Prevention and Response Planning for Hazardous Materials Transportation. Washington, DC: ICF, Incorporated.
U.S. Department of Transportation. 1981. Risk Assessment Vulnerability - Users Manual for Small Communities and Rural Areas. Research and Special Programs. Washington, DC.
U.S. Environmental Protection Agency. 1988. Chemicals in Your Community: A Guide to the Emergency Planning and Community Right to Know Act. Department of Solid Waste and Emergency Response Office, Washington, DC.
U.S. Environmental Protection Agency. 1988. Technical Assistance Bulletin 1 of 3, A Guide Introduction to Exercises in Chemical Emergency Preparedness Program. Chemical Emergency Preparedness and Prevention Office, Washington, DC.
U.S. Environmental Protection Agency. 1988. Technical Assistance Bulletin 2 of 3, A Guide to Planning and Conducting Table-Top Exercises. Chemical Emergency Preparedness and Prevention Office, Washington, DC.
U.S. Environmental Protection Agency. 1988. Technical Assistance Bulletin 3 of 3, A Guide to Planning and Conducting Field Simulation Exercises. Chemical Emergency Preparedness and Prevention Office, Washington, DC.
U.S. Environmental Protection Agency. 1989. The Toxicss-Release Inventory: A National Perspective. Research and Special Programs Washington, DC.
U.S. Environmental Protection Agency. 1990. Toxics in the Community: 1988 National and Local Perspectives. Washington, DC.
Wolfe, K.E. 1984. "An Examination of Risk Costs Associated with the Movement of Hazardous Materials." Proceedings of the 26th Annual Transportation Research Forum.


CHAPTERCHAPTER
23
NUCLEARNUCLEAR ACCIDENTSACCIDENTS

TECHNOLOGICAL HAZARDS
Chapter Summary
286 TECHNOLOGICAL HAZARDS
Chapter Summary
Although the term "nuclear accident" has no strict technical definition, it generally refers to events involving the release of significant levels of
radioactivity or exposure of workers or the general public to radiation. Most commercial nuclear facilities in the United States were developed in the mid-1960s and are designed to withstand aircraft attack. Therefore, they should withstand most natural hazards even though they may not have been specifically designed for those forces. In known seismic areas, significant protection was addressed during initial design.
Although the possibility of a nuclear accident caused by a natural hazard is remote, a variety of nuclear facilities in or adjacent to the United States could be affected. The United States and Canada conduct extensive reviews of design and safety records and require periodic exercises to ensure a high degree of safety.
The U.S. Department of Energy (DOE) and the Nuclear Regulatory Commission (NRC) require safety analyses for all major nuclear facilities, including those associated with research. Furthermore, regulations administered by NRC, DOE, and the U.S. Environmental Protection Agency (USEPA) require facilities to calculate offsite radiation doses from routine, allowable releases.
Seventeen Federal agencies, including FEMA, have developed the Federal Radiological Emergency Response Plan (FRERP) to respond to actual, potential, or perceived peacetime radiological consequences. In response to a State request, during a major radiological occurrence DOE and FEMA will coordinate response efforts through establishment of the Federal Radiological Monitoring and Assessment Center (FRMAC). FEMA coordinates Federal offsite monitoring and assessment efforts to assist DOE and affected State and local authorities.

NUCLEAR ACCIDENTSNUCLEAR ACCIDENTS 287
Photo: Michael Baker Corporation

TECHNOLOGICAL HAZARDS
HAZARD IDENTIFICATION
RISK ASSESSMENT
Probability and Frequency
Consequences
288 TECHNOLOGICAL HAZARDS
HAZARD IDENTIFICATION
The NRC regulates 123 commercial nuclear power plants (Map 23-1). Nuclear accidents are classified in three categories, described below.
• Criticality accidents involve nuclear assemblies, research, production or power reactors, and chemical operations. While such accidents have been few, they have resulted in fatalities, radiation exposure, and release of radioactivity to the environment. To date, the NRC reports no deaths from radiation at NRC-licensed facilities, and natural hazards have not been associated with any criticality accidents.
• Loss-of-coolant accidents result whenever a reactor coolant system experiences a break or opening large enough so that the coolant inventory in the system cannot be maintained by the normally operating makeup system. Loss-of-coolant accidents have not been triggered by natural disaster events.
• Loss-of-containment accidents involve the release of radioactivity and have involved materials such as tritium, fission products, plutonium, and natural, depleted, or enriched uranium. Points of release have been containment vessels at fixed facilities or dam-aged packages during transportation accidents. Loss-of-containment accidents have not been caused by natural disaster events.
RISK ASSESSMENT
The Nuclear Regulatory Commission encourages use of Probabilistic Risk Assessments (PRA) to estimate quantitatively the potential risk to public health and safety considering the design, operations, and maintenance practices at nuclear powerplants. PRAs typically focus on accidents that can severely damage the core and that may challenge containment. In cooperation with FEMA and other federal interests, affected State and local governments formulate Radiological Emergency Response Plans (REPS) to prepare for radiological emergencies.
Probability and Frequency
Although the possibility of a nuclear accident caused by a natural hazard is remote, a variety of nuclear facilities in or adjacent to the United States could cause radiation releases during disasters. The probability of release would be related to the probability of occurrence of the triggering natural hazard.
An important difference between commercial nuclear powerplants and federal nuclear facilities is that the commercial facilities were built during the 1960s, 1970s, and 1980s and were subject to the NRC public licensing process. A facility safety analysis was conducted for each site. The analyses determine which plants must meet requirements to withstand low-probability natural hazards that would have high consequences if are damages occurred.
Most federal nuclear facilities were built under the requirements of national security with virtually no public review or involvement. Safety analysis reviews may have been performed either initially or after construction. Most of the weapons complexes are aging, and decommissioning and decontamination activities are planned. A recent DOE review of its plutonium operations and storage facilities identified potential problems (DOE, 1994).
To date, no major nuclear accident has occurred as a result of natural hazards, either in the United States or abroad. However, people in the immediate vicinity of facilities could be exposed and air or waterborne contamination could expose people outside of the immediate facility planning area.
Consequences
Consequences associated with a nuclear accident triggered by a natural hazard would be a function of the nature of the hazard, the nature of the accident, and the population characteristics within the Emergency Planning Zone (EPZ) around the impacted facility. EPZs typically include a 10-mile Critical Risk Zone and a 50-mile Ingestion Pathway Zone.
In August, 1992, the Florida Power and Light Company's Turkey Point nuclear powerplant could have been severely impacted by Hurricane Andrew. At the peak of the storm, windspeeds of 140 mph (225 km/h), with gusts up to 152 mph (245 km/h), were measured at Turkey Point. Plant operators had adequate notice on the hurricane's estimated time of landfall, and brought the plant to a shutdown state. During the hurricane, both units lost offsite power.
In recognition of the potential for hurricanes and other factors that could interrupt power, Turkey Point was designed with emergency diesel generators to maintain shutdown cooling. Although communication between the facility and NRC was lost, it was restored quickly. Some facility damage was sustained but the basic reactor and the primary and secondary cooling loops were not damaged and radiation was not released.

NUCLEAR ACCIDENTS
RESEARCH, DATA COLLECTION, AND MONITORING ACTIVITIES
MITIGATION APPROACHES
RECOMMENDATIONS
NUCLEAR ACCIDENTS 289
Map 23-1. Nuclear powerplants in the United States as of 1993. Data not available for Pacific Territories. Note: there are no commercial reactors in Alaska or Hawaii.
(Source: Data from U.S. Department of Energy, 1993)
RESEARCH, DATA COLLECTION, AND MONITORING ACTIVITIES
The NRC has developed an implementation plan to encourage use of Probabilistic Risk Assessments. Performance-based regulations may be developed based on improved knowledge of risks.
The Atomic Energy Commission performed numerous studies related to nuclear reactor accidents. The most notable were performed by Brookhaven National Laboratory in 1957, and the Massachusetts Institute of Technology (MIT). The MIT study included an assessment of accident risks at U.S. commercial nuclear powerplants. Through a fault tree analysis, this study evaluated quantitatively, the probability of a release, trans-port of radioactivity, dose consequence, and health effects to the public from a variety of causes. External accidents caused by natural hazards such as earth-quakes, tornados, and floods were evaluated. NRC used the accident analysis to set many continuing, comprehensive research and experience requirements.
MITIGATION APPROACHES
The Nuclear Regulatory Commission and DOE require owners of major nuclear facilities to perform safety analyses relating to natural and technological hazards that may cause damage to facilities and could result in the release of radioactivity and radiation exposure to the public. If the probability is low, but the consequences are high, regulators require that facilities be designed to withstand the primary damage and thus eliminate secondary effects on the public. Commercial nuclear powerplant systems are designed for seismic events, with snubbers on essential cooling water and other critical systems to minimize damage.
Some U.S. facilities have experienced earthquakes and were safely shut down until further system inspections assessed potential damage.
RECOMMENDATIONS
Additional research to determine whether nuclear facilities could be damaged by low-probability natural hazards would be beneficial to determine the possibility of high-consequence impacts, and to facilitate emergency management response planning.

TECHNOLOGICAL HAZARDS
BIBLIOGRAPHY AND REFERENCES
290 TECHNOLOGICAL HAZARDS
BIBLIOGRAPHY AND REFERENCES
American Nuclear Society. 1995. Nuclear News. Vol. 38, No. 3.
Federal Emergency Management Agency. 1987. Digest of Federal Training in Hazardous Materials. Washington, DC: U.S. Government Printing Office.
Federal Emergency Management Agency. 1988. Federal Emergency Management Agency's Radiological Emergency Preparedness (REP) Program. Washington, DC: U.S. Government Printing Office.
Federal Emergency Management Agency. 1991. Guidance for Developing State and Local Radiological Emergency Response Plans and Preparedness for Traffic Accidents. Washington, DC: U.S. Government Printing Office.
Federal Emergency Management Agency. 1985. Guide for the Evaluation of Alert and Notification Systems for Nuclear Power Plants. Washington, DC: U.S. Government Printing Office.
Federal Emergency Management Agency, Office of Civil Defense. 1990. Principal Threats Facing Communities and Local Emergency Management Coordinators: A Report to the United States Senate Committee on Appropriations. FEMA 191. Washington, DC: U.S. Government Printing Office.
Federal Emergency Management Agency, Office of Emergency Management. 1993. Principal Threats Facing Communities and Local Emergency Management Coordinators: A Report to the United States Senate Committee on Appropriations. Washington, DC: U.S. Government Printing Office.
Federal Emergency Management Agency and U.S. Nuclear Regulatory Commission. 1987. Criteria for Preparation and Evaluation of Radiological Emergency Response Plans and Preparedness in Support of Nuclear Powerplants—Criteria for Utility Offsite Planning and Preparedness. Washington, DC: U.S. Government Printing Office.
U.S. Department of Energy. 1994. Plutonium Working Group Report No. EH-0415. Washington, DC: U.S. Government Printing Office.
U.S. Department of Energy, Office of Environmental Management. 1995. Closing the Circle on the Splitting of the Atom. Washington, DC: U.S. Government Printing Office.
U.S. Nuclear Regulatory Commission. 1992. Annual Report on Power Reactors. Washington, DC: U.S. Government Printing Office.
U.S. Nuclear Regulatory Commission. 1990. Report to Congress on Abnormal Occurrences, July-September 1989. Washington, DC: U.S. Government Printing Office.

NUCLEAR ACCIDENTSNUCLEAR ACCIDENTS 291
