technology and big data are changing economics: …
TRANSCRIPT

NBER WORKING PAPER SERIES
TECHNOLOGY AND BIG DATA ARE CHANGING ECONOMICS:MINING TEXT TO TRACK METHODS
Janet CurrieHenrik KlevenEsmée Zwiers
Working Paper 26715http://www.nber.org/papers/w26715
NATIONAL BUREAU OF ECONOMIC RESEARCH1050 Massachusetts Avenue
Cambridge, MA 02138January 2020
We are grateful to Lawrence Katz for helpful comments. We thank Dana Scott for outstanding research assistance, and Tilmann Herchenroder for excellent research assistance in the early stages of the project. The views expressed herein are those of the authors and do not necessarily reflect the views of the National Bureau of Economic Research.
NBER working papers are circulated for discussion and comment purposes. They have not been peer-reviewed or been subject to the review by the NBER Board of Directors that accompanies official NBER publications.
© 2020 by Janet Currie, Henrik Kleven, and Esmée Zwiers. All rights reserved. Short sections of text, not to exceed two paragraphs, may be quoted without explicit permission provided that full credit, including © notice, is given to the source.

Technology and Big Data Are Changing Economics: Mining Text to Track MethodsJanet Currie, Henrik Kleven, and Esmée ZwiersNBER Working Paper No. 26715January 2020JEL No. A0,B0,C0,H0,I0,J0,L0
ABSTRACT
The last 40 years have seen huge innovations in computing technology and data availability. Data derived from millions of administrative records or by using (as we do) new methods of data generation such as text mining are now common. New data often requires new methods, which in turn can inspire new data collection. If history is any guide, some methods will stick and others will prove to be a flash in the pan. However, the larger trends towards demanding greater credibility and transparency from researchers in applied economics and a “collage” approach to assembling evidence will likely continue.
Janet CurrieDepartment of EconomicsCenter for Health and Wellbeing185A Julis Romo Rabinowitz BuildingPrinceton UniversityPrinceton, NJ 08544and [email protected]
Henrik KlevenDepartment of EconomicsPrinceton University238 Julis Romo Rabinowitz BuildingPrinceton, NJ 08544and CEPRand also [email protected]
Esmée ZwiersCenter for Health and Wellbeing219 Julis Romo Rabinowitz BuildingPrinceton UniversityPrinceton, NJ [email protected]
The last 40 years have seen huge innovations in computing technology and in the availability
of all types of data. It has become commonplace to process data sets derived from millions of
administrative records or by using (as in this paper) new methods of data generation such as text
mining. While we like to think that we can choose what to sip from the fire hose of data that is now
available, the torrent is also sweeping the field of economics in specific directions that we attempt
to document in this paper. We argue that new data often requires new methods, which in turn can
inspire new data collection.
I Data and Methods
Our data come from two sources: The first is all papers in the National Bureau of Economic Re-
search (NBER) working paper series between January 1, 1980 and June 30, 2018, and the second
is all papers published in the “Top Five” economics journals (American Economic Review, Econo-
metrica, Journal of Political Economy, Quarterly Journal of Economics, and Review of Economic
Studies) between January 1, 2004 and August 2019. Because our focus is on the ways that new data
and methods are changing the profession, we focus on the field of applied microeconomics. For
top-five papers, we use the Journal of Economic Literature (JEL) codes corresponding to applied
microeconomic fields as suggested by Card and DellaVigna (2013) with the addition of category
I3 for “Welfare, Wellbeing, and Poverty” and category Q for environmental economics. For the
NBER working papers, we include papers in the following programs: Aging; Children; Develop-
ment; Education; Health Care; Health Economics; Industrial Organization; Labor Studies; Political
Economy; Public Economics; International Trade; and Environment and Energy. We end up with
a sample of 2,830 top-five papers and 10,324 NBER working papers.1
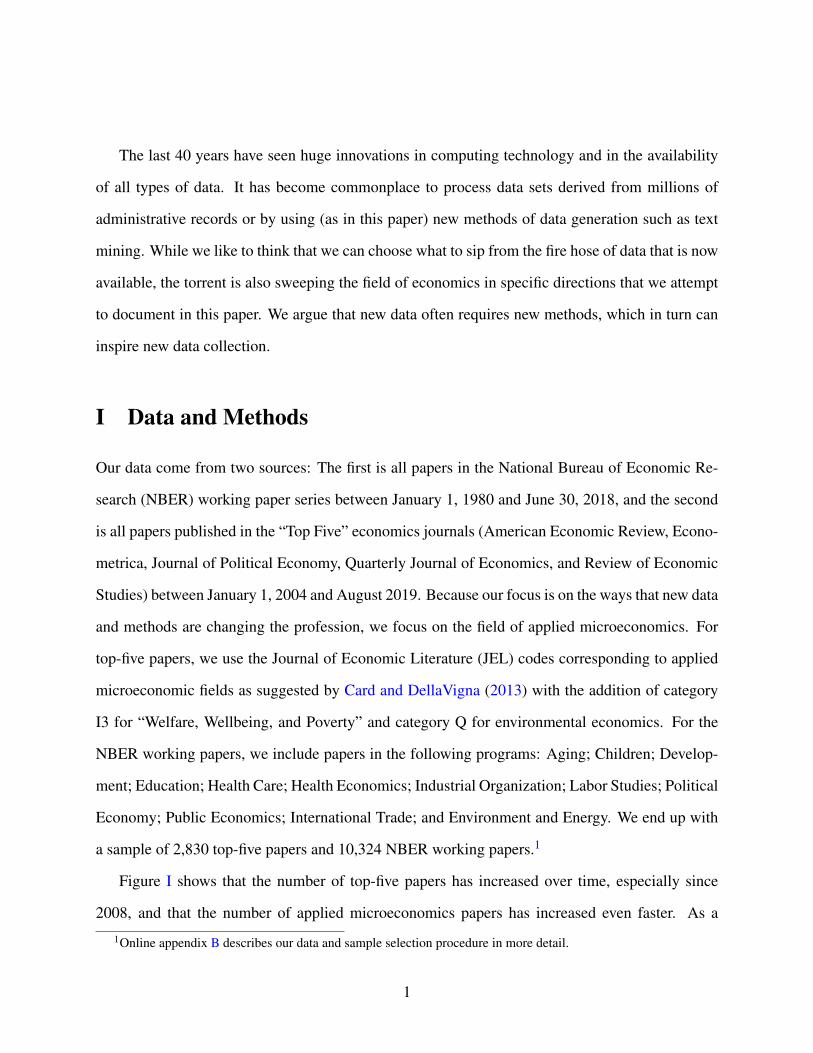
Figure I shows that the number of top-five papers has increased over time, especially since
2008, and that the number of applied microeconomics papers has increased even faster. As a
1Online appendix B describes our data and sample selection procedure in more detail.
1
result, the fraction of applied microeconomics papers published in major general interest journals
has increased from 55-60% to about 75%.
For each paper, we use a plain text version excluding references for the analysis. We use a
series of regular expression (regex) searches, implemented using Python, to find keywords and
phrases. The full details of our data and methods are provided in appendix B, while Table A.I
lists the search categories we consider and the specific trigger phrases within each category. For
most categories, we simply search for any instances of each trigger phrase. Take the category
‘Event Study’ as an example: here we search for the trigger phrases ‘event stud’ and ‘event-stud’,
including a wild card at the end. The wild card ensures that we capture all permutations of ‘event
stud’ and ‘event-stud’ such as ‘event studies’ or ‘event-study specification.’ This particular search
is not case-sensitive, so that ‘Event Study,’ ‘Event study,’ and ’event study’ will all be counted. For
other categories and trigger phrases (for example, the phrase ‘DiD’ in the difference-in-differences
category), it is important that the search is case sensitive.
For some categories, we search for specific phrases while conditioning on using the word ‘data.’
That is, our search focuses only on papers that mention the word ’data’ or any permutation of the
word ’data’ at least once. An example would be ‘clustering,’ where we are interested in capturing
empirical papers talking about standard errors rather than, say, theoretical papers talking about
clustering around a discontinuous incentive. Conditioning on ‘data’ reduces (but may not entirely
eliminate) the likelihood of picking up false positives. For some categories, we use more complex
search instructions. To illustrate, for the category ‘Survey Data’, we look for any instance in which
the words ’survey’ and ’data’ are both mentioned within two full stops. The search for ‘identi-
fication’ is based on a more involved algorithm, because we want to capture language like “the
behavioral response is identified using exogenous tax variation” without counting papers that use
permutations of the word ‘identification’ in ways unrelated to causal research designs. In general,
our search algorithms have been designed by trial and error, with the intention of minimizing the
prevalence of Type I and Type II errors. Even if some errors remain, this is not a major concern
due to the fact that our main focus is on trends rather than on levels. Our methods are similar to
2

those in Kleven (2018) and Brice and Montesinos-Yufa (2019).
II Results
In this section, we document methodological changes in applied microeconomics by plotting the
time series of methods-related words and phrases since 1980 (for NBER working papers) and 2004
(for top-five papers). The four panels of Figure II highlight different dimensions of what has been
dubbed the “credibility revolution” in economics (Angrist and Pischke 2010). Panel A illustrates
a virtually linear rise in the fraction of papers, in both the NBER and top-five series, which make
explicit reference to identification. This fraction has risen from around 4 percent to 50 percent of
papers. Figure A.I in the online appendix shows the time trends of specific identification concerns:
omitted variables, selection biases, reverse causation, and simultaneity. Curiously, concerns about
simultaneity seems to have fallen out of fashion, perhaps being replaced by reverse causation.
With this focus on cleaner identification has come a somewhat slower rise in the use of ex-
perimental and quasi-experimental methods, illustrated in Panel B. Currently, over 40 percent of
NBER papers and about 35 percent of top-five papers make reference to randomized controlled
trials (RCTs), lab experiments, difference-in-differences, regression discontinuity, event studies,
or bunching. We unpack these individual methods further below.
Panel C shows a very similar pattern in references to administrative data. The NBER series
starts increasing in the mid-1990s, rising to about 30 percent today. The top-five series shows a
similar increase, but with a lag of about three years. Appendix Figure A.II considers alternative
data sources. References to survey data have declined from their peak in the mid-1990s, and they
are less frequent in top-five journals than in NBER working papers, but still appear in over 50% of
NBER working papers. References to proprietary data, internet data, and big data have increased
over time, although the exact timing varies across categories. The term Big Data suddenly sky-
rockets after 2012, with a more recent uptick in the top five.
Panel D depicts what we have called the “Graphical Revolution” in applied economics. It
3
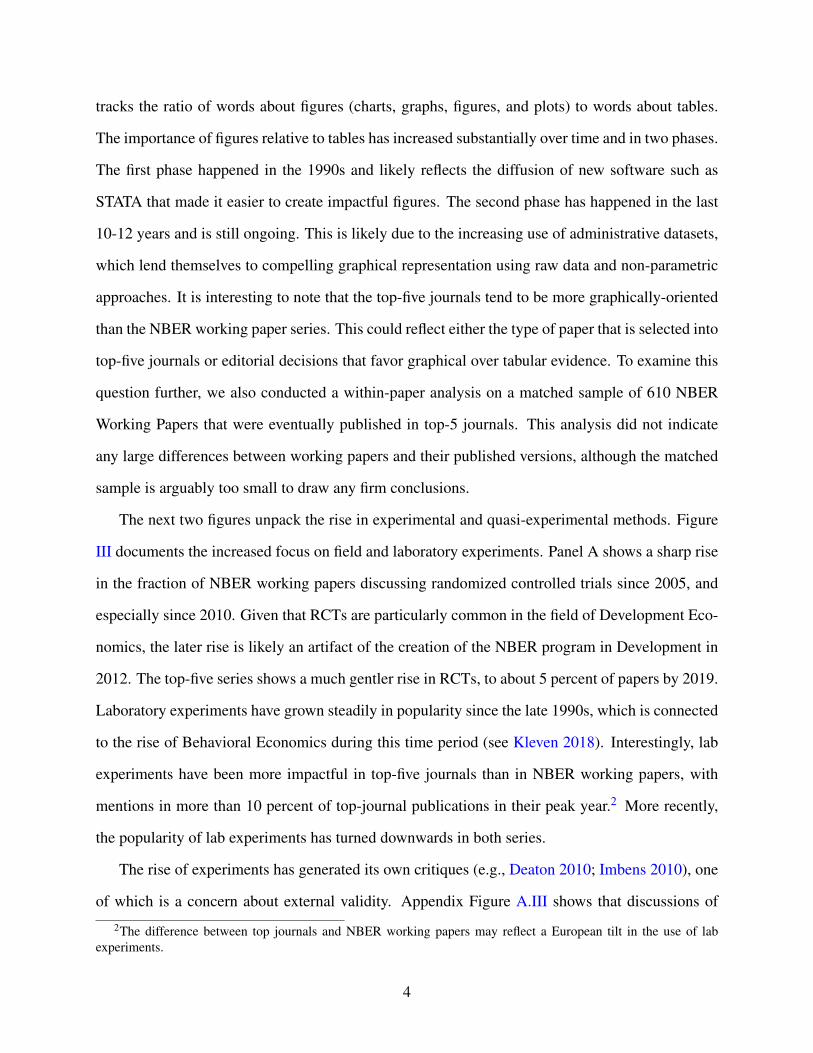
tracks the ratio of words about figures (charts, graphs, figures, and plots) to words about tables.
The importance of figures relative to tables has increased substantially over time and in two phases.
The first phase happened in the 1990s and likely reflects the diffusion of new software such as
STATA that made it easier to create impactful figures. The second phase has happened in the last
10-12 years and is still ongoing. This is likely due to the increasing use of administrative datasets,
which lend themselves to compelling graphical representation using raw data and non-parametric
approaches. It is interesting to note that the top-five journals tend to be more graphically-oriented
than the NBER working paper series. This could reflect either the type of paper that is selected into
top-five journals or editorial decisions that favor graphical over tabular evidence. To examine this
question further, we also conducted a within-paper analysis on a matched sample of 610 NBER
Working Papers that were eventually published in top-5 journals. This analysis did not indicate
any large differences between working papers and their published versions, although the matched
sample is arguably too small to draw any firm conclusions.
The next two figures unpack the rise in experimental and quasi-experimental methods. Figure
III documents the increased focus on field and laboratory experiments. Panel A shows a sharp rise
in the fraction of NBER working papers discussing randomized controlled trials since 2005, and
especially since 2010. Given that RCTs are particularly common in the field of Development Eco-
nomics, the later rise is likely an artifact of the creation of the NBER program in Development in
2012. The top-five series shows a much gentler rise in RCTs, to about 5 percent of papers by 2019.
Laboratory experiments have grown steadily in popularity since the late 1990s, which is connected
to the rise of Behavioral Economics during this time period (see Kleven 2018). Interestingly, lab
experiments have been more impactful in top-five journals than in NBER working papers, with
mentions in more than 10 percent of top-journal publications in their peak year.2 More recently,
the popularity of lab experiments has turned downwards in both series.
The rise of experiments has generated its own critiques (e.g., Deaton 2010; Imbens 2010), one
of which is a concern about external validity. Appendix Figure A.III shows that discussions of
2The difference between top journals and NBER working papers may reflect a European tilt in the use of labexperiments.
4

external validity begins in the late 1990s and rises sharply in both the NBER and top-five series
after 2005. This time pattern mirrors the rise of lab and field experiments quite closely. One
possible reaction to external validity concerns is to supplement treatment effect estimates with
evidence on mechanisms, thereby allowing readers to better gauge if and when the estimates can
be extrapolated to other settings. Consistent with this, Appendix Figure A.IV shows an impressive
rise in the fraction of applied micro papers discussing mechanisms, from about 20 percent to
about 60 percent in the NBER series. The fraction of top-five papers discussing mechanisms is
even higher, more than 70 percent today, suggesting that editors either select papers that provide
evidence on mechanisms or push authors to add such evidence as part of the editorial process.
Figure IV drills down on specific quasi-experimental methods: difference-in-differences, re-
gression discontinuity, event studies, and bunching. These methods have all become more popular
over time, in roughly the order named. The use of difference-in-differences was virtually non-
existent until 1990 and then starts growing. The first papers that mention difference-in-differences
estimators in our data are Ashenfelter and Card (1985) and Card and Sullivan (1988), which ap-
peared as NBER working papers in 1984 and 1987, respectively. As far as we are aware, the very
first paper to use a difference-in-differences approach is Ashenfelter (1978), although that paper
did not use the difference-in-differences language. It is quite striking that, today, almost 25 per-
cent of all NBER working papers in applied micro make references to difference-in-differences.
Regression discontinuity approaches start gaining popularity around 2000, following the early con-
tributions by authors such as Angrist and Lavy (1999) and Hahn, Todd, and Van der Klaauw (2001),
which were circulated as NBER working papers a couple of years prior.
Event studies and bunching approaches are more recent, having taken off during the last decade.
Both of these approaches are closely linked to the increased use of administrative data sources,
which are critical to the effective implementation of these data-demanding approaches. Over time,
event studies have become almost synonymous with difference-in-differences: It is now rare to
use difference-in-differences without showing an event study graph, and conversely it is rare to
show event studies without a control group. As a result, the sharp rise in the use of event studies
5

over the last ten years goes hand in hand with the increased slope of the difference-in-differences
series during this time period. The modern bunching approach starts with Saez (2010), although
the NBER working paper version of that paper appeared more than ten years prior.3
One might wonder whether these new methods have grown at the expense of older empirical
methods such as instrumental variables and fixed effects. However, Appendix Figure A.V suggests
that this is not the case. Mentions of instrumental variables and fixed effects have both grown
continuously since the 1980s, while mentions of matching methods have been growing since the
mid-1990s.4 The fact that old and new methods appear to be complements rather than substitutes
suggests that another outgrowth of the credibility revolution is the rise of the “collage” approach
to empirical work. Authors no longer hang their hats on a single method or dataset, but attempt to
make a case based on a more multi-pronged approach.
Figure V documents another implication of the rise in “big data” and more credible research
designs, namely that authors have become increasingly concerned with whether their estimates
are precisely estimated, and not merely with whether they are significantly different from zero in
a statistical sense. As shown in Panel A, the focus on precision has grown continuously since
the beginning of our series, and is almost identical in the NBER and top-five series.5 Panel B
highlights a specific dimension of this change: the concept of a “precisely estimated zero.” This
concept, virtually non-existent until around 2010, has seen a sharp rise within the last decade. We
view this as a positive development, because it holds the promise to reduce the publication bias
that arises in a world where empiricists hunt for “large effects” in order to impress editors and drop
projects that show “no effects.” We still have a ways to go, however. The idea that a precisely
estimated zero could be as useful as a precisely estimated non-zero is only mooted in a little over
1 percent of papers.
3Bunching was discussed quite a bit in the early 1980s in the context of the non-linear budget set approach to laborsupply estimation (see Kleven 2016).
4 Synthetic control methods are a relative newcomer, showing rapid growth in the NBER working paper seriessince 2010.
5Related to this focus on precision, Figure A.VI in the online appendix shows a sharp rise in references to con-fidence intervals since the mid-1990s. Furthermore, authors have become increasingly concerned with the correctmeasurement of standard errors. As an example, Figure A.VII in the online appendix shows that, after year 2000,there has been a massive increase in attention paid to clustering of standard errors.
6

Figure VI considers a number of recent developments and innovations. Binscatter plots have
become a more popular way of visualizing big data since they were used in Chetty, Friedman,
Hilger, Saez, Schanzenbach, and Yagan (2011). Discussions of preanalysis plans have trended
up sharply since 2012, when the American Economic Association voted to create a registry for
them. Machine learning is the most popular among these brand new methods, with mentions in 2.5
percent of NBER working papers. Text analysis like we do here has also become more common,
with mentions in about 1 percent of NBER working papers in 2019.
Finally, Figures A.VIII-A.X in the online appendix consider time trends in references to struc-
tural methods. Specifically, we focus on words and phrases related to structural models, general
equilibrium, and specific functional forms (see Table A.I for details). These figures provide an ex-
ample of a case where it is important to consider heterogeneity across subfields in applied micro.
While there is no clear time trend in applied micro as a whole (see Panel A of each figure), this
masks relatively strong secular trends within specific subfields (see Panels B-D of each figure). For
example, structural models have been on the decline in Labor Economics, whereas they have been
on the rise in Public Economics and Industrial Organization.
III Conclusion
In the late 1960s and 1970s, new computing methods and data sources reshaped economics and
made it a more applied field (Moffitt 1999). Fields like Labor and Public Economics shifted their
focus away from theory and discussions of institutions and case studies towards estimating quan-
tities such as the returns to schooling and behavioral elasticities. Micro data from surveys in
developing countries made it possible to focus on the determinants of household and individual
well-being. Large-scale social experiments such as the Negative Income Tax Experiments and the
RAND Health Insurance Experiment were conducted and evaluated for the first time. In turn, these
new data sources prompted a flowering of interests in new methods such as selection and panel data
approaches.
7

We may be at a similar turning point in the field today, with a proliferation of new data and
methods. If history is any guide, some methods will stick and others will prove to be a flash
in the pan. However, the larger trend towards demanding greater credibility and transparency
from researchers in applied economics and a ‘collage’ approach to assembling evidence will likely
continue.
8

References
ANGRIST, JOSHUA D., AND VICTOR LAVY (1999): “Using Maimonides’ Rule to Estimate the
Effect of Class Size on Scholastic Achievement,” The Quarterly Journal of Economics, 114(2),
533–575.
ANGRIST, JOSHUA D., AND JÖRN-STEFFEN PISCHKE (2010): “The Credibility Revolution in
Empirical Economics: How Better Research Design is Taking the Con out of Econometrics,”
Journal of Economic Perspectives, 24(2), 3–30.
ASHENFELTER, ORLEY (1978): “Estimating the Effect of Training Programs on Earnings,” The
Review of Economics and Statistics, pp. 47–57.
ASHENFELTER, ORLEY, AND DAVID CARD (1985): “Using the Longitudinal Structure of Earn-
ings to Estimate the Effect of Training Programs,” The Review of Economics and Statistics,
67(4), 648–660.
BRICE, BRANDON, AND HUGO M. MONTESINOS-YUFA (2019): “The Era of Evidence,” Work-
ing Paper.
CARD, DAVID, AND STEFANO DELLAVIGNA (2013): “Nine Facts about Top Journals in Eco-
nomics,” Journal of Economic Literature, 51(1), 144–61.
CARD, DAVID, AND DANIEL SULLIVAN (1988): “Measuring the Effect of Subsidized Training
Programs on Movements in and out of Employment,” Econometrica, 56(3), 497–530.
CHETTY, RAJ, JOHN N. FRIEDMAN, NATHANIEL HILGER, EMMANUEL SAEZ, DIANE WHIT-
MORE SCHANZENBACH, AND DANNY YAGAN (2011): “How Does Your Kindergarten Class-
room Affect Your Earnings? Evidence from Project STAR,” The Quarterly Journal of Eco-
nomics, 126(4), 1593–1660.
DEATON, ANGUS (2010): “Instruments, Randomization, and Learning about Development,” Jour-
nal of Economic Literature, 48(2), 424–55.
9

HAHN, JINYONG, PETRA TODD, AND WILBERT VAN DER KLAAUW (2001): “Identification and
Estimation of Treatment Effects with a Regression-Discontinuity Design,” Econometrica, 69(1),
201–209.
IMBENS, GUIDO W. (2010): “Better LATE than Nothing: Some Comments on Deaton (2009) and
Heckman and Urzua (2009),” Journal of Economic Literature, 48(2), 399–423.
KLEVEN, HENRIK J. (2016): “Bunching,” Annual Review of Economics, 8, 435–464.
(2018): “Language Trends in Public Economics,” Slides.
MOFFITT, ROBERT A. (1999): “New Developments in Econometric Methods for Labor Market
Analysis,” Handbook of Labor Economics, 3, 1367–1397.
SAEZ, EMMANUEL (2010): “Do Taxpayers Bunch at Kink Points?,” American Economic Journal:
Economic Policy, 2(3), 180–212.
10
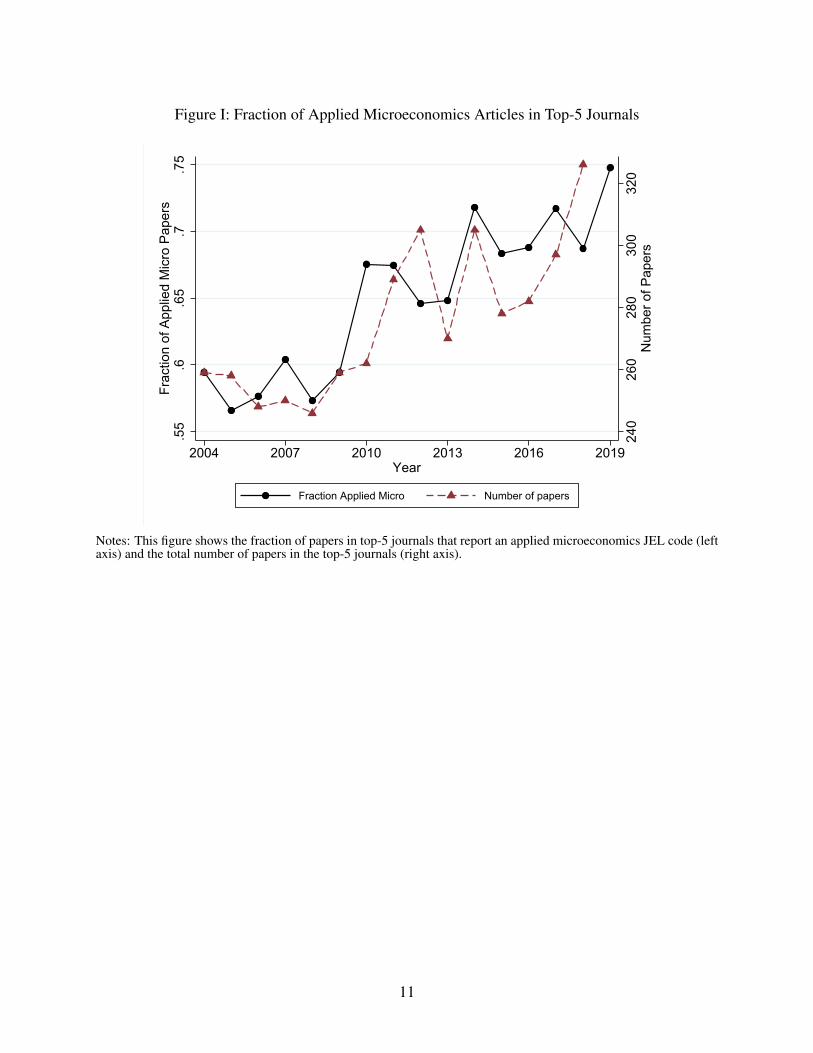
Figure I: Fraction of Applied Microeconomics Articles in Top-5 Journals
240
260
280
300
320
Num
ber o
f Pap
ers
.55
.6.6
5.7
.75
Frac
tion
of A
pplie
d M
icro
Pap
ers
2004 2007 2010 2013 2016 2019Year
Fraction Applied Micro Number of papers
Notes: This figure shows the fraction of papers in top-5 journals that report an applied microeconomics JEL code (leftaxis) and the total number of papers in the top-5 journals (right axis).
11

Figure II: The Credibility Revolution
A: Identification B: All Experimental andQuasi-Experimental Methods
0.1
.2.3
.4.5
Frac
tion
of P
aper
s
1980 1985 1990 1995 2000 2005 2010 2015 2020Year
NBER Working Papers Top-5 Journals
0.1
.2.3
.4Fr
actio
n of
Pap
ers
1980 1985 1990 1995 2000 2005 2010 2015 2020Year
NBER Working Papers Top-5 Journals
C: Administrative Data D: Graphical Revolution
0.1
.2.3
Frac
tion
of P
aper
s
1980 1985 1990 1995 2000 2005 2010 2015Year
NBER Working Papers Top-5 Journals
.51
1.5
2R
atio
of F
igur
e W
ords
to T
able
Wor
ds
1980 1985 1990 1995 2000 2005 2010 2015 2020Year
NBER Working Papers Top-5 Journals
Notes: This figure shows different dimensions of the “credibility revolution” in economics: Identification (Panel A), All Experimental and Quasi-ExperimentalMethods (Panel B), Administrative Data (Panel C), and the Graphical Revolution (Panel D). Panel D shows the ratio of the number of ’Figure’ terms to the numberof ’Table’ terms mentioned. See Table A.I for a list of terms. The series show 5-year moving averages.
12
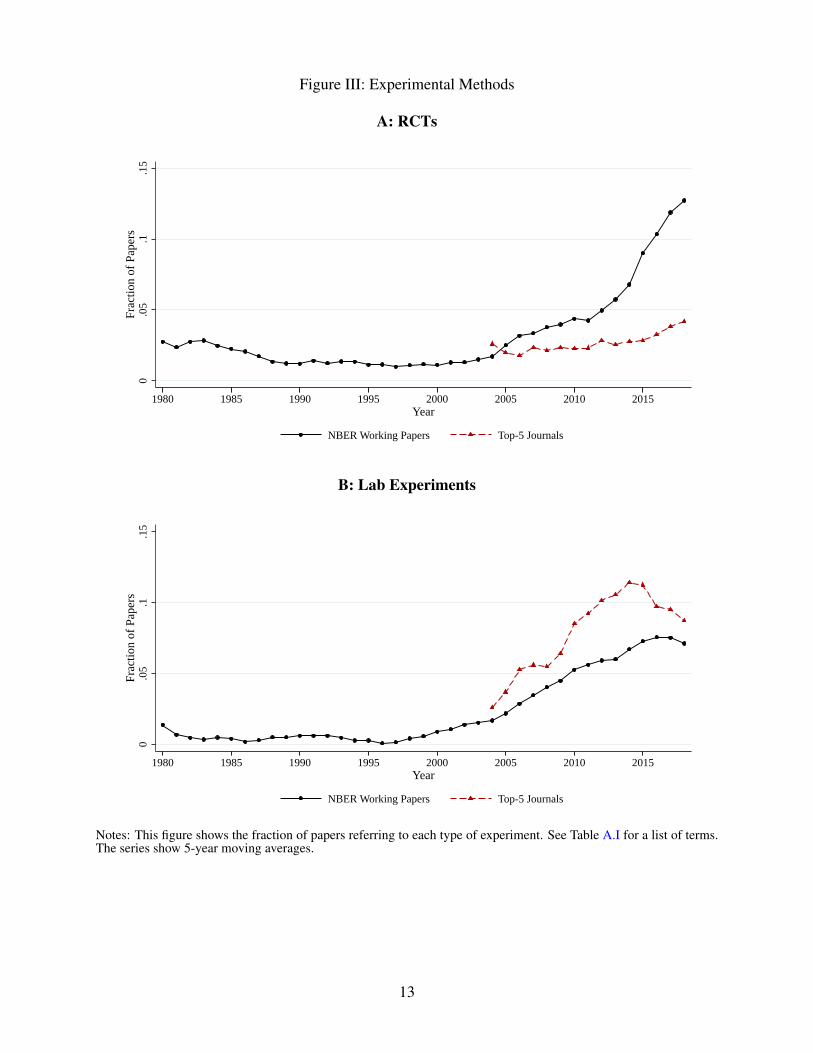
Figure III: Experimental Methods
A: RCTs0
.05
.1.1
5Fr
actio
n of
Pap
ers
1980 1985 1990 1995 2000 2005 2010 2015 2020Year
NBER Working Papers Top-5 Journals
B: Lab Experiments
0.0
5.1
.15
Frac
tion
of P
aper
s
1980 1985 1990 1995 2000 2005 2010 2015 2020Year
NBER Working Papers Top-5 Journals
Notes: This figure shows the fraction of papers referring to each type of experiment. See Table A.I for a list of terms.The series show 5-year moving averages.
13
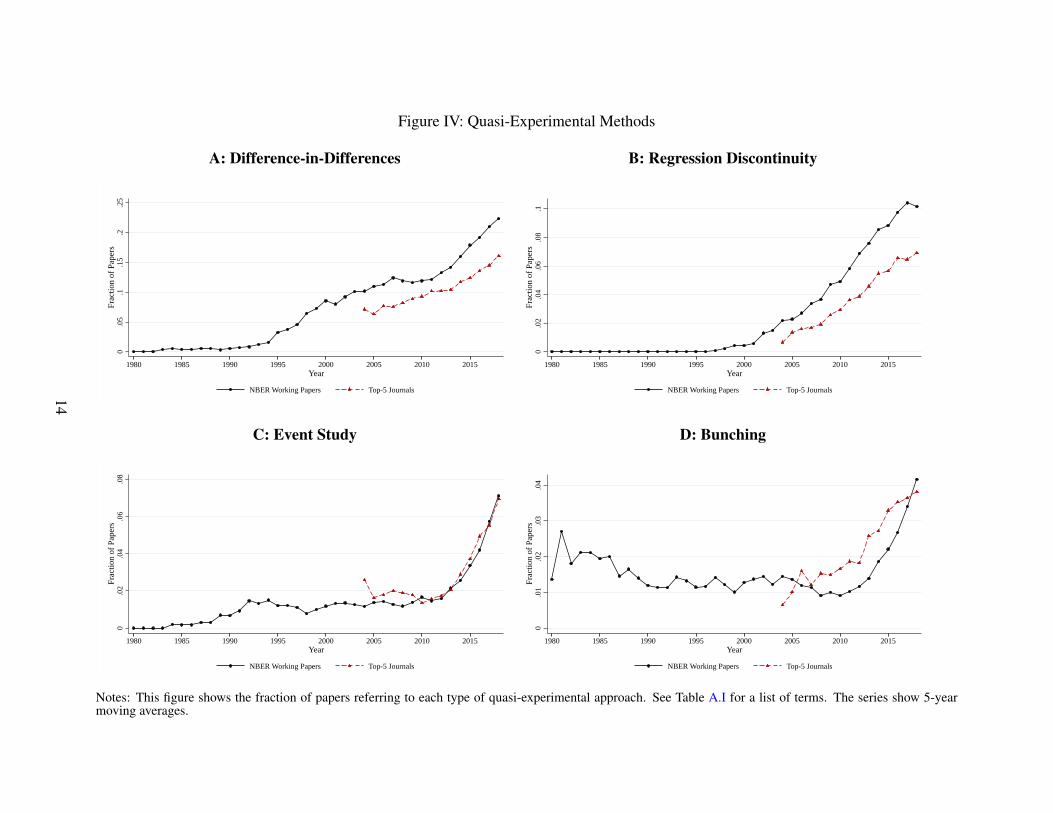
Figure IV: Quasi-Experimental Methods
A: Difference-in-Differences B: Regression Discontinuity
0.0
5.1
.15
.2.2
5Fr
actio
n of
Pap
ers
1980 1985 1990 1995 2000 2005 2010 2015 2020Year
NBER Working Papers Top-5 Journals
0.0
2.0
4.0
6.0
8.1
Frac
tion
of P
aper
s
1980 1985 1990 1995 2000 2005 2010 2015 2020Year
NBER Working Papers Top-5 Journals
C: Event Study D: Bunching
0.0
2.0
4.0
6.0
8Fr
actio
n of
Pap
ers
1980 1985 1990 1995 2000 2005 2010 2015 2020Year
NBER Working Papers Top-5 Journals
0.0
1.0
2.0
3.0
4Fr
actio
n of
Pap
ers
1980 1985 1990 1995 2000 2005 2010 2015 2020Year
NBER Working Papers Top-5 Journals
Notes: This figure shows the fraction of papers referring to each type of quasi-experimental approach. See Table A.I for a list of terms. The series show 5-yearmoving averages.
14
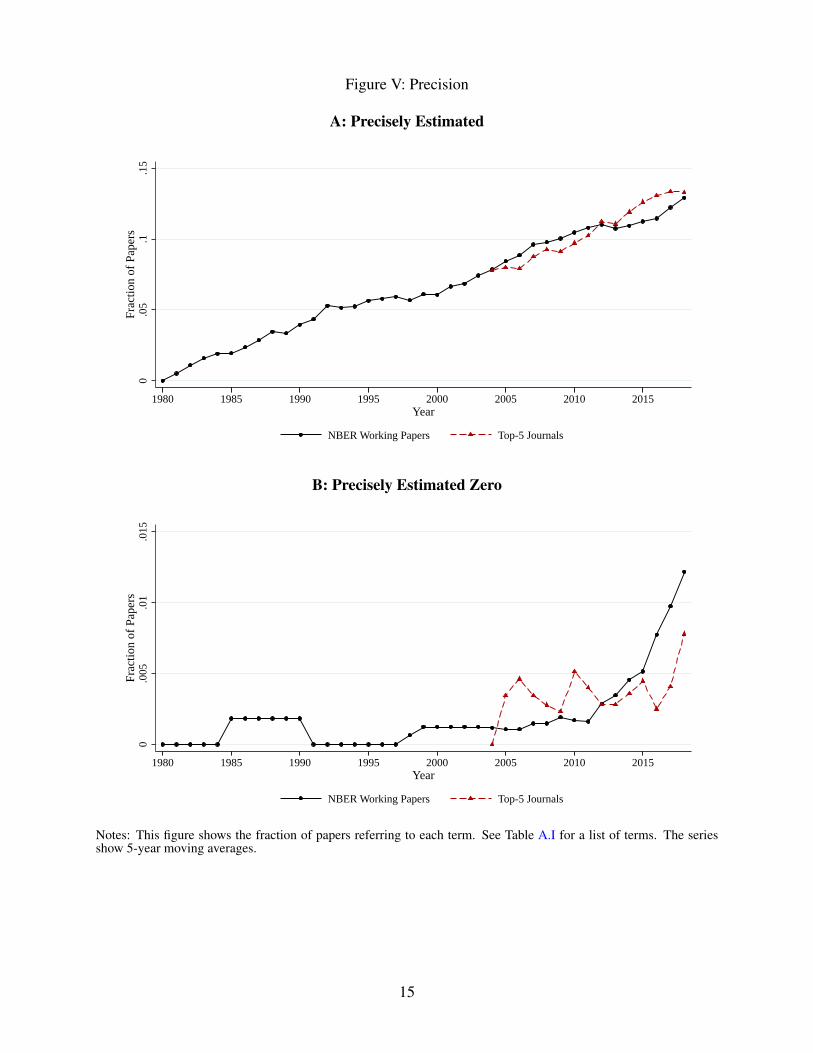
Figure V: Precision
A: Precisely Estimated0
.05
.1.1
5Fr
actio
n of
Pap
ers
1980 1985 1990 1995 2000 2005 2010 2015 2020Year
NBER Working Papers Top-5 Journals
B: Precisely Estimated Zero
0.0
05.0
1.0
15Fr
actio
n of
Pap
ers
1980 1985 1990 1995 2000 2005 2010 2015 2020Year
NBER Working Papers Top-5 Journals
Notes: This figure shows the fraction of papers referring to each term. See Table A.I for a list of terms. The seriesshow 5-year moving averages.
15
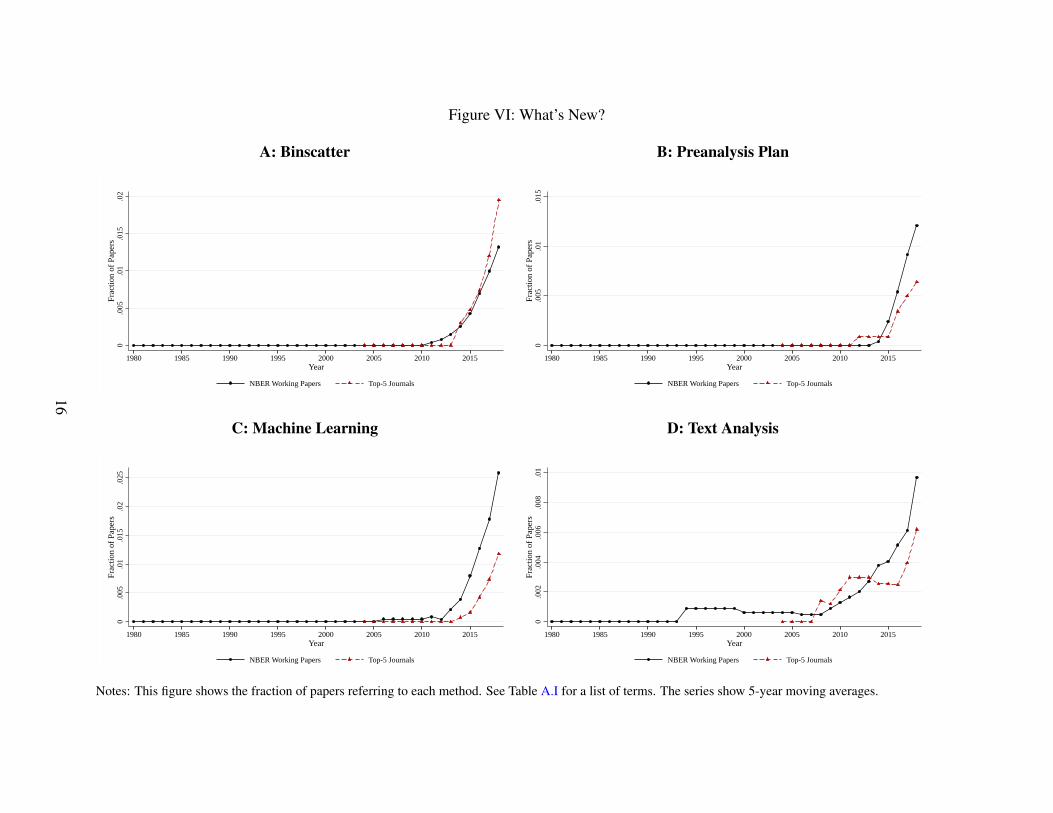
Figure VI: What’s New?
A: Binscatter B: Preanalysis Plan
0.0
05.0
1.0
15.0
2Fr
actio
n of
Pap
ers
1980 1985 1990 1995 2000 2005 2010 2015 2020Year
NBER Working Papers Top-5 Journals
0.0
05.0
1.0
15Fr
actio
n of
Pap
ers
1980 1985 1990 1995 2000 2005 2010 2015 2020Year
NBER Working Papers Top-5 Journals
C: Machine Learning D: Text Analysis
0.0
05.0
1.0
15.0
2.0
25Fr
actio
n of
Pap
ers
1980 1985 1990 1995 2000 2005 2010 2015 2020Year
NBER Working Papers Top-5 Journals
0.0
02.0
04.0
06.0
08.0
1Fr
actio
n of
Pap
ers
1980 1985 1990 1995 2000 2005 2010 2015 2020Year
NBER Working Papers Top-5 Journals
Notes: This figure shows the fraction of papers referring to each method. See Table A.I for a list of terms. The series show 5-year moving averages.
16

Online Appendix (Not for Publication)
A Supplementary Figures and Tables
17

Figure A.I: Identification Concerns
A: Omitted Variables B: Selection.1
.12
.14
.16
.18
Frac
tion
of P
aper
s
1980 1985 1990 1995 2000 2005 2010 2015Year
NBER Working Papers Top-5 Journals
.3.4
.5.6
.7Fr
actio
n of
Pap
ers
1980 1985 1990 1995 2000 2005 2010 2015Year
NBER Working Papers Top-5 Journals
C: Reverse Causation D: Simultaneity
.02
.04
.06
.08
.1Fr
actio
n of
Pap
ers
1980 1985 1990 1995 2000 2005 2010 2015Year
NBER Working Papers Top-5 Journals
.02
.04
.06
.08
.1Fr
actio
n of
Pap
ers
1980 1985 1990 1995 2000 2005 2010 2015Year
NBER Working Papers Top-5 Journals
Notes: This figure shows the fraction of papers referring to each term. See Table A.I for a list of terms. The series show 5-year moving averages.
18

Figure A.II: Data
A: Survey Data B: Proprietary Data.4
.45
.5.5
5.6
.65
Frac
tion
of P
aper
s
1980 1985 1990 1995 2000 2005 2010 2015Year
NBER Working Papers Top-5 Journals
0.0
1.0
2.0
3.0
4Fr
actio
n of
Pap
ers
1980 1985 1990 1995 2000 2005 2010 2015Year
NBER Working Papers Top-5 Journals
C: Internet Data D: Big Data
0.0
05.0
1.0
15.0
2Fr
actio
n of
Pap
ers
1980 1985 1990 1995 2000 2005 2010 2015Year
NBER Working Papers Top-5 Journals
0.0
05.0
1.0
15Fr
actio
n of
Pap
ers
1980 1985 1990 1995 2000 2005 2010 2015Year
NBER Working Papers Top-5 Journals
Notes: This figure shows the fraction of papers referring to each type of data. See Table A.I for a list of terms. The series show 5-year moving averages.
19

Figure A.III: External Validity0
.02
.04
.06
.08
Frac
tion
of P
aper
s
1980 1985 1990 1995 2000 2005 2010 2015 2020Year
NBER Working Papers Top-5 Journals
Notes: This figure shows the fraction of papers referring to external validity. See Table A.I for a list of terms. Theseries show 5-year moving averages.
20

Figure A.IV: Mechanisms0
.1.2
.3.4
.5.6
.7Fr
actio
n of
Pap
ers
1980 1985 1990 1995 2000 2005 2010 2015 2020Year
NBER Working Papers Top-5 Journals
Notes: This figure shows the fraction of papers referring to mechanisms. See Table A.I for a list of terms. The seriesshow 5-year moving averages.
21

Figure A.V: Other Empirical Methods
A: Instrumental Variables B: Fixed Effects0
.1.2
.3.4
Frac
tion
of P
aper
s
1980 1985 1990 1995 2000 2005 2010 2015Year
NBER Working Papers Top-5 Journals
0.2
.4.6
Frac
tion
of P
aper
s
1980 1985 1990 1995 2000 2005 2010 2015Year
NBER Working Papers Top-5 Journals
C: Matching D: Synthetic Control
0.0
2.0
4.0
6.0
8Fr
actio
n of
Pap
ers
1980 1985 1990 1995 2000 2005 2010 2015Year
NBER Working Papers Top-5 Journals
0.0
05.0
1.0
15.0
2Fr
actio
n of
Pap
ers
1980 1985 1990 1995 2000 2005 2010 2015Year
NBER Working Papers Top-5 Journals
Notes: This figure shows the fraction of papers referring to each method. See Table A.I for a list of terms. The series show 5-year moving averages.
22

Figure A.VI: Confidence Interval0
.1.2
.3.4
Frac
tion
of P
aper
s
1980 1985 1990 1995 2000 2005 2010 2015Year
NBER Working Papers Top-5 Journals
Notes: This figure shows the fraction of papers referring to confidence intervals. See Table A.I for a list of terms. Theseries show 5-year moving averages.
23

Figure A.VII: Clustering0
.2.4
.6Fr
actio
n of
Pap
ers
1980 1985 1990 1995 2000 2005 2010 2015Year
NBER Working Papers Top-5 Journals
Notes: This figure shows the fraction of papers referring to clustering. See Table A.I for a list of terms. The seriesshow 5-year moving averages.
24

Figure A.VIII: Structural Methods: Structural Model
A: All Papers B: NBER Program: Labor Studies.1
5.2
.25
.3.3
5Fr
actio
n of
Pap
ers
1980 1985 1990 1995 2000 2005 2010 2015 2020Year
NBER Working Papers Top-5 Journals
.18
.2.2
2.2
4.2
6.2
8Fr
actio
n of
Pap
ers
1980 1985 1990 1995 2000 2005 2010 2015 2020Year
NBER Working Papers
C: NBER Program: Public Economics D: NBER Program: Industrial Organization
.05
.1.1
5.2
.25
Frac
tion
of P
aper
s
1980 1985 1990 1995 2000 2005 2010 2015 2020Year
NBER Working Papers
.1.2
.3.4
.5Fr
actio
n of
Pap
ers
1980 1985 1990 1995 2000 2005 2010 2015 2020Year
NBER Working Papers
Notes: This figure shows the fraction of papers referring to structural methods. Panel A shows all papers in applied microeconomics, while Panels B-D focus onNBER working papers within specific programs (LS, PE, and IO). The IO series omit the first 5 data points, because of the low number of papers in the early yearsof the program. See Table A.I for a list of terms. The series show 5-year moving averages.
25

Figure A.IX: Structural Methods: General Equilibrium
A: All Papers B: NBER Program: Labor Studies.1
.15
.2.2
5.3
Frac
tion
of P
aper
s
1980 1985 1990 1995 2000 2005 2010 2015 2020Year
NBER Working Papers Top-5 Journals
0.0
5.1
.15
Frac
tion
of P
aper
s
1980 1985 1990 1995 2000 2005 2010 2015 2020Year
NBER Working Papers
C: NBER Program: Public Economics D: NBER Program: Industrial Organization
.1.2
.3.4
.5Fr
actio
n of
Pap
ers
1980 1985 1990 1995 2000 2005 2010 2015 2020Year
NBER Working Papers
.02
.04
.06
.08
.1Fr
actio
n of
Pap
ers
1980 1985 1990 1995 2000 2005 2010 2015 2020Year
NBER Working Papers
Notes: This figure shows the fraction of papers referring to general equilibrium. Panel A shows all papers in applied microeconomics, while Panels B-D focus onNBER working papers within specific programs (LS, PE, and IO). The IO series omit the first 5 data points, because of the low number of papers in the early yearsof the program. See Table A.I for a list of terms. The series show 5-year moving averages.
26

Figure A.X: Structural Methods: Functional Forms
A: All Papers B: NBER Program: Labor Studies.1
5.2
.25
.3Fr
actio
n of
Pap
ers
1980 1985 1990 1995 2000 2005 2010 2015 2020Year
NBER Working Papers Top-5 Journals
.05
.1.1
5.2
.25
Frac
tion
of P
aper
s
1980 1985 1990 1995 2000 2005 2010 2015 2020Year
NBER Working Papers
C: NBER Program: Public Economics D: NBER Program: Industrial Organization
.15
.2.2
5.3
.35
Frac
tion
of P
aper
s
1980 1985 1990 1995 2000 2005 2010 2015 2020Year
NBER Working Papers
.05
.1.1
5.2
Frac
tion
of P
aper
s
1980 1985 1990 1995 2000 2005 2010 2015 2020Year
NBER Working Papers
Notes: This figure shows the fraction of papers referring to functional forms. Panel A shows all papers in applied microeconomics, while Panels B-D focus onNBER working papers within specific programs (LS, PE, and IO). The IO series omit the first 5 data points, because of the low number of papers in the early yearsof the program. See Table A.I for a list of terms. The series show 5-year moving averages.
27

Table A.I: Search Categories and Trigger Phrases
Category Trigger Phrases Outcome CaseSensitive
Wildcardat end
Cond. on’data’
AdministrativeData
‘administrative data’, ‘admin data’, ‘administrative-data’,‘admin-data’, ‘administrative record’, ‘admin record’,administrative regist’, ‘admin regist’, ‘register data’,
’registry data’
Fraction of papers withat least 1 phrase
No Yes Yes
Big Data ‘big data’, ‘big-data’ Fraction of papers withat least 1 phrase
No Yes Yes
Binscatter ‘binscatter’, ‘bin scatter’, ‘binned scatter’ Fraction of papers withat least 1 phrase
No Yes No
Bunching ‘bunching’ Fraction of papers withat least 1 phrase
No Yes No
Clustering ‘cluster’ Fraction of papers withat least 1 phrase
No Yes Yes
ConfidenceInterval
’confidence interval’ Fraction of papers withat least 1 phrase
No Yes Yes
Data ’data’ Fraction of papers withat least 1 phrase
No Yes No
Difference-in-Differences
‘Difference in Diff’, ‘Difference in diff’, ‘difference indiff’, ‘Difference-in-Diff’, ‘Difference-in-diff’,
‘difference-in-diff’, ‘Differences in Diff’, ‘Differences indiff’, ‘differences in diff’, ‘Differences-in-Diff’,
‘Differences-in-diff’, ‘differences-in-diff’, ‘diff-in-diff’,‘d-in-d’, ‘DiD’
Fraction of papers withat least 1 phrase
Yes Yes No
Event Study ‘event stud’ ‘ event-stud’ Fraction of papers withat least 1 phrase
No Yes No
External Validity ‘external validity’, ‘external-validity’, ‘externally valid’,‘externally-valid’
Fraction of papers withat least 1 phrase
No Yes No
Figure ‘graph’, ‘figure’, ‘plot’, ‘chart’ Average word count perpaper
No Yes No
28

Fixed Effects ‘FE’, ‘Fixed Effect’, ‘Fixed effect’, ‘fixed effect’, FixedEffects’, ‘Fixed effects’, ‘fixed effects’, ‘Fixed-Effect’,
‘Fixed-effect’, ‘fixed-effect’, ‘Fixed-Effects’,Fixed-effects’, ‘fixed-effects’
Fraction of papers withat least 1 phrase
Yes No Yes
Functional Forms ‘CES’, ‘constant elasticity of substitution’, ‘ConstantElasticity of Substitution’, ‘Constant elasticity of
substitution’, ‘Cobb-Douglas’, ‘Cobb Douglas’, ‘StoneGeary’, ‘Stone-Geary’, ‘CRRA’, ‘coefficient of relative
risk-aversion’, ‘coefficient of relative risk aversion’,‘Coefficient of relative risk-aversion’, ‘Coefficient of
relative risk aversion’, ‘Coefficient of RelativeRisk-Aversion’, ‘Coefficient of Relative Risk Aversion’,
‘CARA’, ‘constant absolute risk aversion’, ‘constantabsolute risk-aversion’, ‘Constant absolute risk aversion’,
‘Constant absolute risk-aversion’, ‘Constant AbsoluteRisk Aversion’, ‘Constant Absolute Risk-Aversion’,
‘translog’, ‘Translog’
Fraction of papers withat least 1 phrase
Yes No No
GeneralEquilibrium
‘general equilibr’, ‘general-equilibr’ Fraction of papers withat least 1 phrase
No Yes No
Identification Sentence structure: search for sentences that have theterm ’identif’ in combination with any of the terms:
’effect’, ’response’, ’impact’, ’elasticit’, ’parameter’, or’coefficient’ with maximum two words in between. Notethat even though the search includes wildcards at the end,
we exclude any match with the word ’effective’.Also search for these terms: ’causal identification’,
’causally identified’, ’identification strategy’,’identification approach’, ’identification assumption’,
’identifying assumption’, ’identifying variation’,’empirical identification’, ’over identified’,
’over-identified’, ’under identified’, ’under-identified’,’identification properties’, ’identification test’,
’identification problem’,
Fraction of papers withat least 1 phrase
No Yes No
29

’identification issue’, ’problem with identification’,’problems with identification’, ’issue with identification’,
’issues with identification’, ’problem identifying’,’problems identifying’, ’issue identifying’,’issuesidentifying’, ’threat to identification’, ’threats to
identification’, ’threat for identification’, ’threats foridentification’, ’over identifying’, ’over-identifying’,
’under identifying’, ’under-identifying’, ’partialidentification’, ’partially identified’, ’non-parametricidentification’, ’nonparametric identification’, ’non
parametric identification’, ’non-parametricallyidentified’, ’nonparametrically identified’, ’non
parametrically identified’, ’identification condition’,’identifying condition’, ’condition for identification’,
’conditions for identification’, ’condition for identifying’,’conditions for identifying’, ’point identification’,
’point-identification’, ’point identified’,’point-identified’, ’point identifying’, ’point-identifying’,
’set identification’, ’set-identification’, ’set identified’,’set-identified’, ’set identifying’, ’set-identifying’,
’identification analysis’, ’weak identification’,’identification result’, ’identification argument’,
’identification framework’, ’identification scheme’Internet Data ‘internet data’, ‘internet-data’, ‘web data’, ‘web-data’,
‘scraped data’, ‘scraped-data’, ‘scrape data’, ‘scrapingdata’, ‘search data’, ‘search-data’, ‘google data’,google-data’, ‘social media data’, ‘google trend’,
‘google-trend’, ‘google search’, ‘google-search’, ‘googlengram’, ‘google n-gram’, ‘google books ngram’, ‘google
books n-gram’
Fraction of papers withat least 1 phrase
No Yes Yes
30

InstrumentalVariables
‘Instrumental Variable’, ‘Instrumental variable’,‘instrumental variable’, ‘Instrumental-Variable’,
‘Instrumental-variable’, ‘instrumental-variable’, ‘TwoStage Least Squares’, ‘Two stage least squares’, ‘two
stage least squares’, ‘2SLS’, ‘TSLS’, ‘valid instrument’,‘exogenous instrument’, ‘IV Estimat’, ‘IV estimat’,‘IV-estimat’, ‘IV Specification’, ‘IV specification’,‘IV-specification’, ‘IV Regression’, ‘IV regression’,
‘IV-regression’, ‘IV Strateg’, ‘IV strateg’, ‘IV-strateg’,‘we instrument’, ‘I instrument’, ‘paper instruments’,‘exclusion restriction’, ‘weak first stage’, ‘simulated
instrument’
Fraction of papers withat least 1 phrase
Yes Yes Yes
Lab Experiments ‘Laboratory Experiment’, ‘Laboratory experiment’,‘laboratory experiment’, ‘Lab Experiment’, ‘Labexperiment’, ‘lab experiment’, ’Dictator Game’,
‘Dictator game’, ‘dictator game’, ’Ultimatum Game’,‘Ultimatum game’, ‘ultimatum game’, ’Trust Game’,
‘Trust game’, ‘trust game’ , ’Public Good Game’, ’Publicgood game’, ‘public good game’, ’Public Goods Game’,
‘Public goods game’, ‘public goods game’, ‘Z-tree’,‘zTree’, ‘ORSEE’, ‘show-up fee’, ‘laboratory
participant’, ‘lab participant’
Fraction of papers withat least 1 phrase
Yes Yes No
MachineLearning
‘machine learning’, ‘lasso’, ‘random forest’ Fraction of papers withat least 1 phrase
No Yes No
Matching ‘propensity score’, ‘propensity score matching’,’propensity-score matching’, ‘matching estimat’, ‘nearest
neighbor matching’, ’nearest-neighbor matching’,‘nearest neighbour matching’, ’nearest-neighbour
matching’, ‘caliper matching’, ‘stratification matching’,‘exact matching’, ‘one to one matching’, ‘one-to-one
matching’, ‘kernel matching’, ‘inverse probabilitymatching’, ’inverse-probability matching’
Fraction of papers withat least 1 phrase
No Yes Yes
31
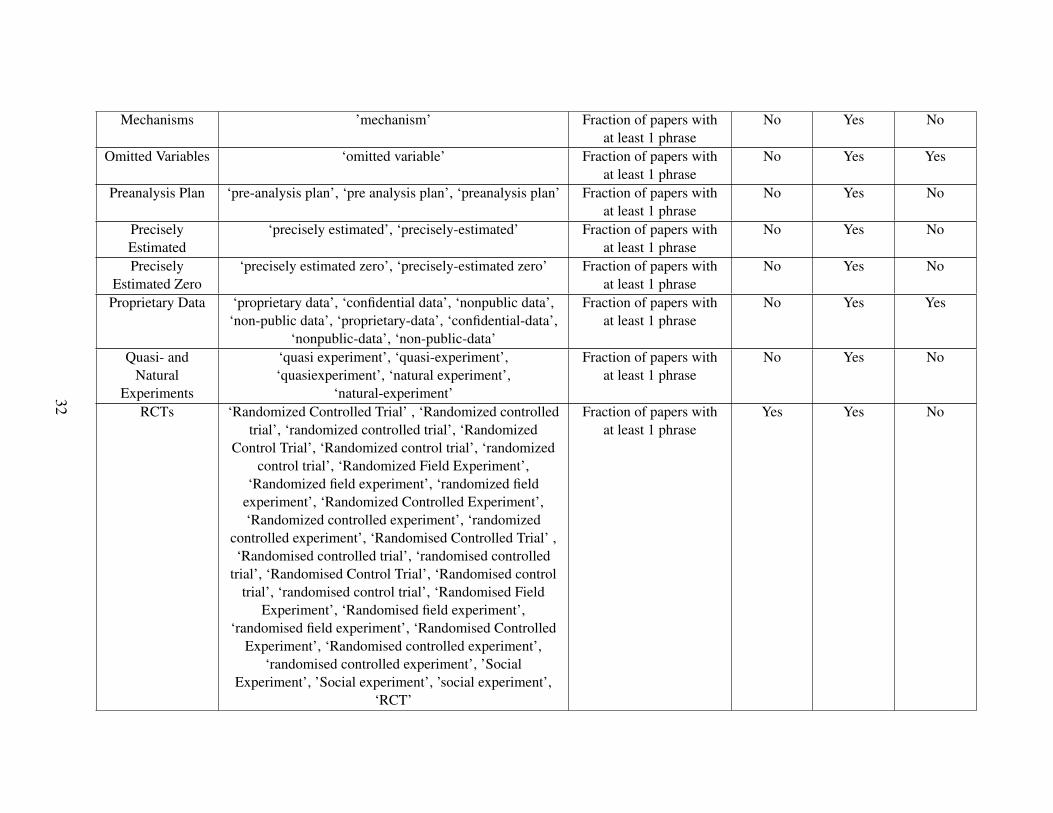
Mechanisms ’mechanism’ Fraction of papers withat least 1 phrase
No Yes No
Omitted Variables ‘omitted variable’ Fraction of papers withat least 1 phrase
No Yes Yes
Preanalysis Plan ‘pre-analysis plan’, ‘pre analysis plan’, ‘preanalysis plan’ Fraction of papers withat least 1 phrase
No Yes No
PreciselyEstimated
‘precisely estimated’, ‘precisely-estimated’ Fraction of papers withat least 1 phrase
No Yes No
PreciselyEstimated Zero
‘precisely estimated zero’, ‘precisely-estimated zero’ Fraction of papers withat least 1 phrase
No Yes No
Proprietary Data ‘proprietary data’, ‘confidential data’, ‘nonpublic data’,‘non-public data’, ‘proprietary-data’, ‘confidential-data’,
‘nonpublic-data’, ‘non-public-data’
Fraction of papers withat least 1 phrase
No Yes Yes
Quasi- andNatural
Experiments
‘quasi experiment’, ‘quasi-experiment’,‘quasiexperiment’, ‘natural experiment’,
‘natural-experiment’
Fraction of papers withat least 1 phrase
No Yes No
RCTs ‘Randomized Controlled Trial’ , ‘Randomized controlledtrial’, ‘randomized controlled trial’, ‘Randomized
Control Trial’, ‘Randomized control trial’, ‘randomizedcontrol trial’, ‘Randomized Field Experiment’,
‘Randomized field experiment’, ‘randomized fieldexperiment’, ‘Randomized Controlled Experiment’,‘Randomized controlled experiment’, ‘randomized
controlled experiment’, ‘Randomised Controlled Trial’ ,‘Randomised controlled trial’, ‘randomised controlled
trial’, ‘Randomised Control Trial’, ‘Randomised controltrial’, ‘randomised control trial’, ‘Randomised Field
Experiment’, ‘Randomised field experiment’,‘randomised field experiment’, ‘Randomised Controlled
Experiment’, ‘Randomised controlled experiment’,‘randomised controlled experiment’, ’Social
Experiment’, ’Social experiment’, ’social experiment’,‘RCT’
Fraction of papers withat least 1 phrase
Yes Yes No
32

RegressionDiscontinuity
‘Regression Discontinuit’, ‘Regression discontinuit’,‘regression discontinuit’, ’Regression-discontinuity’,
’regression-discontinuity’, ‘Regression Kink’,‘Regression kink’, ‘regression kink’, ‘RD Design’, ‘RD
design’, RD-design’, ‘RD Estimat’, ‘RD estimat’,‘RD-estimat’, ‘RD Model’, ‘RD model’, ‘RD-model’ ,
‘RD Regression’, ‘RD regression’, ‘RD-regression’, ‘RDCoefficient’, ‘RD coefficient’, ‘RD-coefficient’, ’RK
Design’, ’RK design’, ’RK-Design’, ’RK-design’,’RKD’, ’RDD’
Fraction of papers withat least 1 phrase
Yes Yes No
ReverseCausation
‘reverse causa’, ’reverse-causa’ Fraction of papers withat least 1 phrase
No Yes Yes
Selection ‘selection’ Fraction of papers withat least 1 phrase
No Yes Yes
Simultaneity ‘simultaneity’ Fraction of papers withat least 1 phrase
No Yes Yes
Structural Model Sentence structure: we search for instances where,within two full stops, the term ’structural’ is mentioned
in combination with either ’model’, ’specification’,’estimate’, or ’parameter’.
Also search for these terms: ‘Structural Model’,‘Structural model’, ‘structural model’, ‘Method of
Moments’, ‘Method of moments’, ‘method of moments’,’Method-of-Moments’, ’Method-of-moments’,
’method-of-moments’, ‘Berry, Levinsohn, Pakes’, ‘Berry,Levinsohn and Pakes’, ‘Berry, Levinsohn, and Pakes’,
‘BLP’, ‘Structural General Equilibrium Model’,’Structural general equilibrium model’, ’structuralgeneral equilibrium model’, ‘GMM’, ’Maximum
Likelihood Estimat’, ’Maximum likelihood estimat’,’maximum likelihood estimat’, ’Maximum-Likelihood
Estimat’, ’Maximum-likelihood estimat’,’maximum-likelihood estimat’, ’MLE’
Fraction of papers withat least 1 phrase
Yes Yes No
33

Survey Data Sentence structure: we search for instances where theterm ‘survey’ and ’data’ are mentioned within two full
stops.
Fraction of papers withat least 1 phrase
No Yes Yes
Synthetic Control ‘synthetic control’ Fraction of papers withat least 1 phrase
No Yes Yes
Table ’table’ Average word count perpaper
No Yes No
Text Analysis ‘natural language processing’, ‘text analys’,‘computational linguistics’, ‘speech processing’,
‘n-gram’, ‘ngram’, ‘n gram’, ‘textual analys’, ‘languageprocessing’, ’language analys’, ‘text data’, ‘text mining’,
‘mining text’, ‘text regression’, ‘tokeniz’
Fraction of papers withat least 1 phrase
No Yes No
34
B Data and Methods
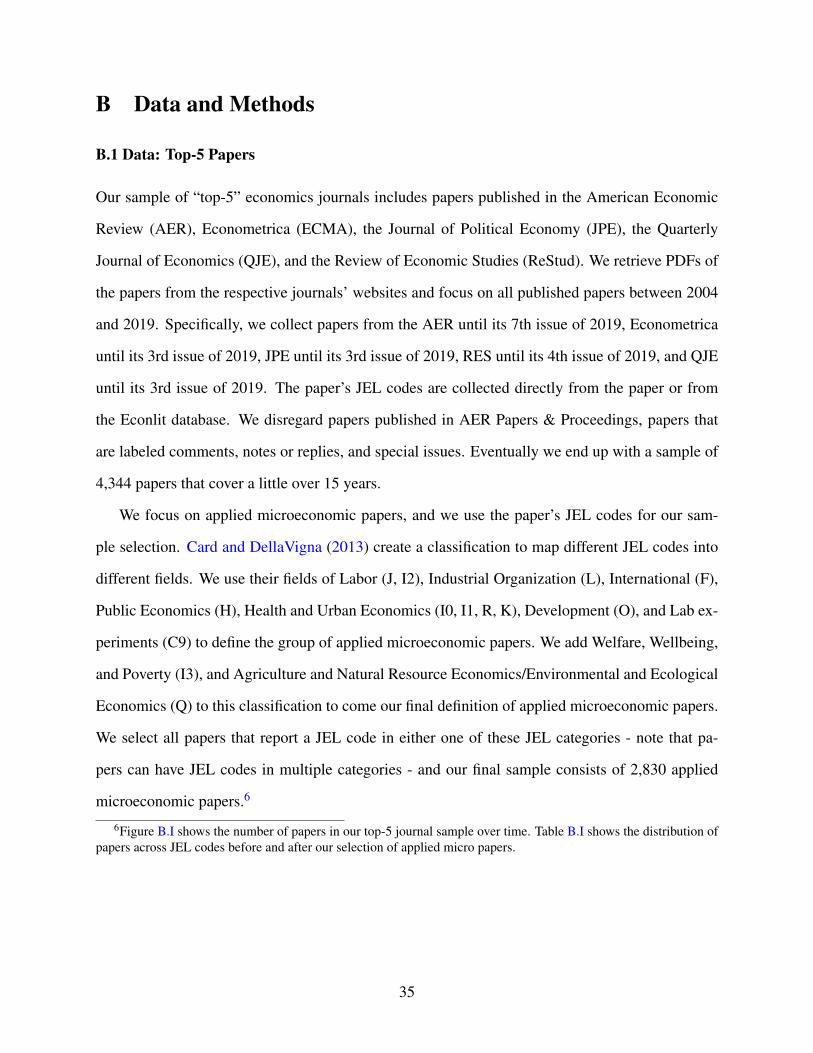
B.1 Data: Top-5 Papers
Our sample of “top-5” economics journals includes papers published in the American Economic
Review (AER), Econometrica (ECMA), the Journal of Political Economy (JPE), the Quarterly
Journal of Economics (QJE), and the Review of Economic Studies (ReStud). We retrieve PDFs of
the papers from the respective journals’ websites and focus on all published papers between 2004
and 2019. Specifically, we collect papers from the AER until its 7th issue of 2019, Econometrica
until its 3rd issue of 2019, JPE until its 3rd issue of 2019, RES until its 4th issue of 2019, and QJE
until its 3rd issue of 2019. The paper’s JEL codes are collected directly from the paper or from
the Econlit database. We disregard papers published in AER Papers & Proceedings, papers that
are labeled comments, notes or replies, and special issues. Eventually we end up with a sample of
4,344 papers that cover a little over 15 years.
We focus on applied microeconomic papers, and we use the paper’s JEL codes for our sam-
ple selection. Card and DellaVigna (2013) create a classification to map different JEL codes into
different fields. We use their fields of Labor (J, I2), Industrial Organization (L), International (F),
Public Economics (H), Health and Urban Economics (I0, I1, R, K), Development (O), and Lab ex-
periments (C9) to define the group of applied microeconomic papers. We add Welfare, Wellbeing,
and Poverty (I3), and Agriculture and Natural Resource Economics/Environmental and Ecological
Economics (Q) to this classification to come our final definition of applied microeconomic papers.
We select all papers that report a JEL code in either one of these JEL categories - note that pa-
pers can have JEL codes in multiple categories - and our final sample consists of 2,830 applied
microeconomic papers.6
6Figure B.I shows the number of papers in our top-5 journal sample over time. Table B.I shows the distribution ofpapers across JEL codes before and after our selection of applied micro papers.
35

B.2 Data: NBER Working Papers
Our sample of NBER Working Papers consists of all working papers published through the Na-
tional Bureau of Economic Research (NBER) Working Paper Series from the inception of the
program in 1975 to the end of June 2018, when the data for this project were scraped from the
NBER website. There are 24,449 papers in the generalized Working Paper series, 313 papers in
the Technical Working Paper (TWP) Series (papers focused on econometrics and other method-
ological contributions), 135 papers in the Working Paper Series on Historical Factors in Long-Run
Growth, and 166 Reprint Series papers, for a total of 25,063 papers across the programs.
For the analyses presented in this paper, we drop from the NBER data set all papers written
before 1980. Additionally, we restrict our analysis to papers in NBER Working Paper Program
categories associated with applied microeconomics. These categories are: Aging; Children; De-
velopment Economics; Education; Health Care; Health Economics; Industrial Organization; Labor
Studies; Political Economy; Public Economics; International Trade; and Environment and Energy.
Since papers may be tagged to more than one program, to select applied microeconomics papers,
we drop all papers that are tagged to programs other than the ones specified here. For example, a
paper that is only tagged to Public Economics would be included in our sample, but a paper that
is tagged to both Public Economics and Economic Fluctuations and Growth would be excluded.
Counts of papers in each category that we classify as applied microeconomics papers are detailed
in Table B.II. Within the set of applied microeconomics in our final sample, we have 62 in the
reprint program, 61 in the Technical Working Paper Series, and 10,201 standard working papers.
This gives us a total of 10,324 papers in the NBER data set.7
The more recent of these papers are available in plain text format at the nber.org URL associated
with the paper.8 For papers for which a plain text version is available, we scrape the text of the
paper directly from the link. For papers for which there is no plain text version available (typically
older papers), we scrape the PDF version of the paper from the NBER website. Bibliographic data
7Figure B.I shows the number of papers in the NBER Working Papers sample over time.8For example, Working Paper 25524 is available in plain text format at https://www.nber.org/papers/
w25524.txt.
36

– including title, author(s), year and date of publication, and abstract – are available for each paper
in the Series at the .bib URL associated with the paper.9
B.3 Data Processing
We use a series of Python scripts (files ending in .py) to process our data and count the number of
times each phrase of interest is mentioned in a paper. In what follows, we will first outline how
we processed our data to get from the paper PDFs to a plain text file that could be used for text
mining. Afterwards we will discuss how we searched for the categories mentioned in Table A.I.
B.3.1 Converting PDFs to text
Relevant code files: pdf2txt.py, convertPDF.py
We obtain PDFs of each paper in the Top 5 journal data set, as well as for each paper in the NBER
data set for which we are not able to obtain a text file directly from the NBER website. We use the
PDFMiner program, wrapped in the pdf2txt package, to convert the text of each PDF paper to
plain text format.10
B.3.2 Text cleaning
Relevant code file: gibberishDetector.py
In the NBER data set we encountered several papers that were transcribed from PDF to text as
an unreadable jumble of letters and numbers. We identify and drop these text files from our data
set by reviewing the five most common words in each transcribed text file and dropping those that
meet several common indicative criteria, such as having “!” in the five most common words or
having each of the five most common words be a single character, e.g. “t”. We manually verified
the accuracy of the algorithm by spot-checking discarded files. To our knowledge, this transcrip-
tion error only occurred in the NBER data set and was not present in any papers in the data set of
9E.g., bibliographic data for Working Paper 25524 are available at https://www.nber.org/papers/w25524.bib.
10Documentation for PDFMiner is available here.
37
top-5 journal articles.
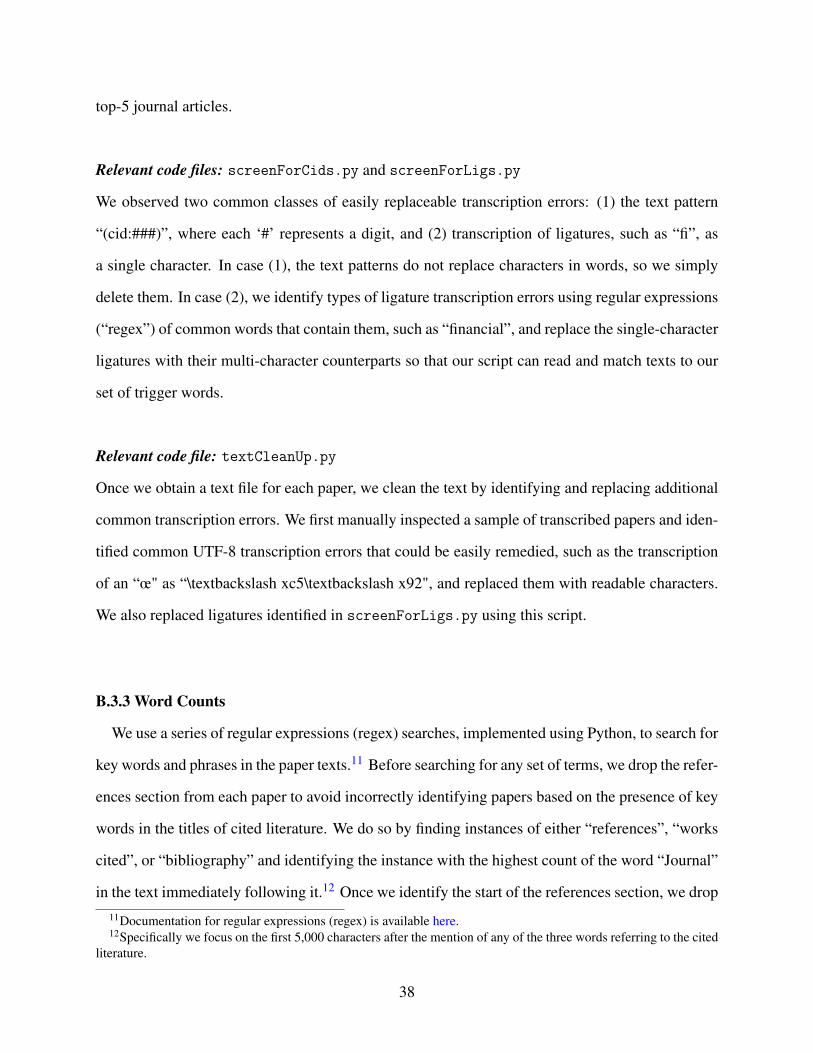
Relevant code files: screenForCids.py and screenForLigs.py
We observed two common classes of easily replaceable transcription errors: (1) the text pattern
“(cid:###)”, where each ‘#’ represents a digit, and (2) transcription of ligatures, such as “fi”, as
a single character. In case (1), the text patterns do not replace characters in words, so we simply
delete them. In case (2), we identify types of ligature transcription errors using regular expressions
(“regex”) of common words that contain them, such as “financial”, and replace the single-character
ligatures with their multi-character counterparts so that our script can read and match texts to our
set of trigger words.
Relevant code file: textCleanUp.py
Once we obtain a text file for each paper, we clean the text by identifying and replacing additional
common transcription errors. We first manually inspected a sample of transcribed papers and iden-
tified common UTF-8 transcription errors that could be easily remedied, such as the transcription
of an “œ" as “\textbackslash xc5\textbackslash x92", and replaced them with readable characters.
We also replaced ligatures identified in screenForLigs.py using this script.
B.3.3 Word Counts
We use a series of regular expressions (regex) searches, implemented using Python, to search for
key words and phrases in the paper texts.11 Before searching for any set of terms, we drop the refer-
ences section from each paper to avoid incorrectly identifying papers based on the presence of key
words in the titles of cited literature. We do so by finding instances of either “references”, “works
cited”, or “bibliography” and identifying the instance with the highest count of the word “Journal”
in the text immediately following it.12 Once we identify the start of the references section, we drop11Documentation for regular expressions (regex) is available here.12Specifically we focus on the first 5,000 characters after the mention of any of the three words referring to the cited
literature.
38

all text from the beginning of the references to the start of the appendix, if applicable.
Table A.I shows the search term categories that we use, and the trigger phrases we use for each
category. For most search terms, we use a dictionary approach in which we simply search for in-
stances of each trigger phrase, with switches indicating whether the terms are case-sensitive and/or
end in a wildcard13 as specified in Table A.I. To illustrate, for the search category ’Event Study’
we look for the trigger phrases ’event stud’ and ’event-stud’. Our search is not case-sensitive,
implying that we will be both capitalized and noncapitalized versions of the trigger phrases: e.g.
Event Study, Event study, and event study. For ’Event Study’ we also include a wildcard at the
end, which implies that we will capture all permutations of ’event stud’ and ’event-stud’: e.g.
event study and event studies. For some search term categories, for example ’Administrative Data’
and ’Big Data’ we condition on the search term category ’Data’. This implies that we only in-
clude papers in our search that mention the word ’data’ or any permutation of the word ’data’
more than once. Our standard search script is specified in wordcountsAppliedMicro_NBER.py
and wordcountsAppliedMicro_top5.py for the NBER and Top 5 datasets respectively. As is
defined in Table A.I, we run the standard script four times for different search term categories:
(1) with wildcards, case sensitive; (2) with wildcards, case insensitive; (3) without wildcards, case
sensitive; and (4) without wildcards, case insensitive. For categories with more complex search
instructions – such as when we search for one word from each of two categories within a given
sentence – we run a separate script. To illustrate, for the category ’Survey Data’ we look for any
instance in which the word ’survey’ and ’data’ are mentioned within two full stops. We run this
separate script for four search categories: survey data, identification, and structural models.
We then count the number of instances trigger phrases from a search term appear in the full
text of a paper. Our figures show five-year moving averages, and are based on each paper having
at least one mention of a trigger phrase in a search term category.
13A ’wildcard’ refers to a character that can be substituted for zero or more characters in a search string. For exam-ple, the phrase ’estimat*’, where ’*’ indicates a wildcard, will match to any of the phrases ’estimation’, ’estimate’, or’estimator’.
39

B.3.4 Word Counts – Identification
To search for the term ’identification’, we require a more precise search procedure. We use two
types of searches: (1) searching for a particular sentence structure with more flexible terms; and (2)
searching for a set of specific terms that are associated with the phenomenon we aim to measure.
We describe these two searches below.
Sentence structure. We search for sentences that match the following pattern. Between 2 full
stops (’.’) a matching sentence must contain the following features in the given order:
1. ‘identif’ with a wildcard at the end, followed by
2. any 0-2 words, followed by
3. any of the following terms: ‘effect’, ‘response’, ‘impact’, ‘elasticit’, ‘parameter’, or ‘coeffi-
cient’, with a wildcard at the end of the term. We exclude instances where the found term is
the word ‘effective’.
Specific trigger phrases. In addition to the flexible search pattern described above, we also
identify the terms associated with identification that we specify in Table A.I. Note that we permit
wildcards at the end of each of these trigger phrases.
40

Figure B.I: Number of papers in sample over time0
200
400
600
Num
ber o
f Pap
ers
1980 1985 1990 1995 2000 2005 2010 2015 2020Year
NBER Working Papers Top 5 Journals
Notes: The graphs shows the number of papers in our sample of NBER Working Papers and our sample of Top-5journals over time.
41
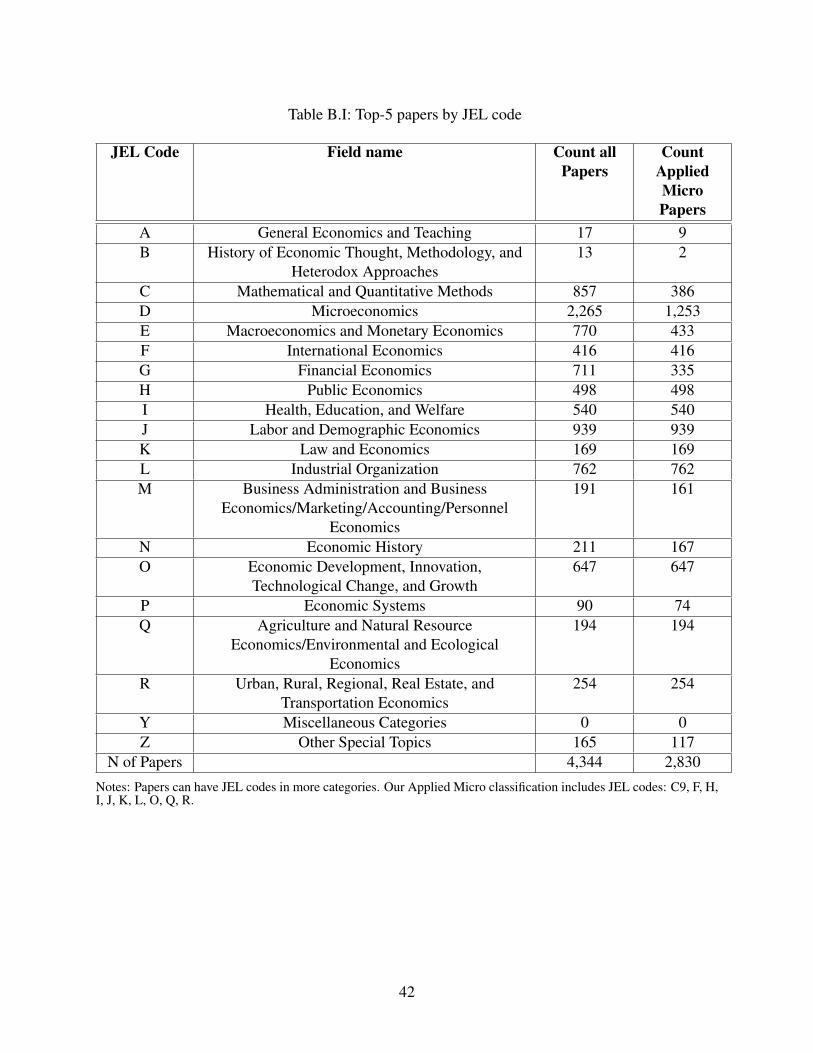
Table B.I: Top-5 papers by JEL code
JEL Code Field name Count allPapers
CountAppliedMicroPapers
A General Economics and Teaching 17 9B History of Economic Thought, Methodology, and
Heterodox Approaches13 2
C Mathematical and Quantitative Methods 857 386D Microeconomics 2,265 1,253E Macroeconomics and Monetary Economics 770 433F International Economics 416 416G Financial Economics 711 335H Public Economics 498 498I Health, Education, and Welfare 540 540J Labor and Demographic Economics 939 939K Law and Economics 169 169L Industrial Organization 762 762M Business Administration and Business
Economics/Marketing/Accounting/PersonnelEconomics
191 161
N Economic History 211 167O Economic Development, Innovation,
Technological Change, and Growth647 647
P Economic Systems 90 74Q Agriculture and Natural Resource
Economics/Environmental and EcologicalEconomics
194 194
R Urban, Rural, Regional, Real Estate, andTransportation Economics
254 254
Y Miscellaneous Categories 0 0Z Other Special Topics 165 117
N of Papers 4,344 2,830
Notes: Papers can have JEL codes in more categories. Our Applied Micro classification includes JEL codes: C9, F, H,I, J, K, L, O, Q, R.
42

Table B.II: NBER papers by category
Category Code Category Name PapersAG Aging 1,075CH Children 1,159
DEV Development Economics 468ED Education 1,075HC Health Care 1,076HE Health Economics 1,541IO Industrial Organization 712LS Labor Studies 3,519
POL Political Economy 529PE Public Economics 3,464ITI International Trade and Investment 1,285
EEE Environment and Energy 745All Papers All Papers 10,324
43