technology and payments provider empowering … · this presentation (this “presentation”) was...
TRANSCRIPT

January 2020
TECHNOLOGY AND PAYMENTS PROVIDER EMPOWERING
GLOBAL MERCHANTS

DisclaimerThis presentation (this “Presentation”) was prepared for informational purposes only to assist interested parties in making their own evaluation of the proposed transaction (the “Transaction”) between Far Point Acquisition Corporation (“FPAC”, “we”, or “our”) and Global Blue Group AG (“Global Blue”). This Presentation is for strategic discussion purposes only and does not constitute an offer to purchase nor a solicitation of an offer to sell shares of FPAC, Global Blue or any successor entity of the Transaction. This presentation is incomplete without reference to, and should be viewed solely in conjunction with, the oral briefing provided by FPAC. This Presentation is not intended to form the basis of any investment decision by the recipient and does not constitute investment, tax or legal advice. No representation, express or implied, is or will be given by FPAC, Global Blue or their respective affiliates and advisors as to the accuracy or completeness of the information contained herein, or any other written or oral information made available in the course of an evaluation of the Transaction.
This Presentation and the oral briefing provided by FPAC or Global Blue may contain certain “forward-looking statements” within the meaning of the Private Securities Litigation Reform Act of 1995, Section 27A of the Securities Act and Section 21E of the Securities Exchange Act of 1934, as amended, including statements regarding FPAC’s, Global Blue’s on their management teams’ expectations, hopes, beliefs, intentions or strategies regarding the future. The words “anticipate”, “believe”, “continue”, “could”, “estimate”, “expect”, “intends”, “may”, “might”, “plan”, “possible”, “potential”, “predict”, “project”, “should”, “would” and similar expressions may identify forward-looking statements, but the absence of these words does not mean that a statement is not forward-looking. These forward looking statements are based on FPAC’s and Global Blue’s current expectations and beliefs concerning future developments and their potential effects on FPAC, Global Blue or any successor entity of the Transaction. There can be no assurance that the future developments affecting FPAC, Global Blue or any successor entity of the Transaction will be those that we have anticipated. These forward-looking statements involve a number of risks, uncertainties (some of which are beyond FPAC’s or Global Blue’s control) or other assumptions that may cause actual results or performance to be materially different from those expressed or implied by these forward-looking statements. Except as required by law, FPAC and Global Blue are not undertaking any obligation to update or revise any forward-looking statements whether as a result of new information, future events or otherwise.
All rights to the trademarks, copyrights, logos and other intellectual property listed herein belong to their respective owners and FPAC’s or Global Blue’s use thereof does not imply an affiliation with, or endorsement by the owners of such trademarks, copyrights, logos and other intellectual property. Solely for convenience, trademarks and trade names referred to in this presentation may appear with the ® or ™ symbols, but such references are not intended to indicate, in any way, that such names and logos are trademarks or registered trademarks of FPAC.
This presentation contains statistical data, estimates and forecasts that have been provided by Global Blue and/or are based on independent industry publications or other publicly available information, as well as other information based on FPAC’s internal sources. This information involves many assumptions and limitations and you are cautioned not to give undue weight to these estimates. We have not independently verified the accuracy or completeness of the data that has been provided by Global Blue and/or contained in these industry publications and other publicly available information. Accordingly, none of FPAC, Global Blue nor their respective affiliates and advisors makes any representations as to the accuracy or completeness of these data. Certain amounts related to the transaction described herein have been expressed in U.S. dollars for convenience and, when expressed in U.S. dollars in the future, such amounts may be different from those set forth herein.
Financial Information. The historic financial information respecting Global Blue contained in this Presentation has been taken from or prepared based on the historical audited financial statements of Global Blue, which have been prepared in accordance with International Financial Reporting Standards (“IFRS”) as adopted by the EU, which are not materially different from IFRS as issued by the International Accounting Standards Board (“IASB”). An audit of such financial statements in accordance with the standards of the U.S. Public Company Accounting Oversight Board is in process and will be included in the registration statement/ proxy statement related to the Transaction.
Non-GAAP Financial Measures. This presentation includes certain financial measures not prepared in accordance with IFRS, which constitute “non-GAAP financial measures” as defined by the rules of the U.S. Securities and Exchange Commission. These non-GAAP financial measures include: Adjusted EBITDA, Adjusted EBITDA Margin, Cash Flow Conversion, FCFE (Group Share), Adjusted EBIT, Unlevered Net Income, Adjusted Net Income, Adjusted Net Income (Group Share), Net Leverage and Adjusted Operating Expenses. FPAC has included these non-GAAP financial measures because it believes they provide an additional tool for investors to use in evaluating the financial performance and prospects of Global Blue or any successor entity of the Transaction. These non-GAAP financial measures should not be considered in isolation from, or as an alternative to, financial measures determined in accordance with IFRS. In addition, these non-GAAP financial measures may differ from non-GAAP financial measures with comparable names used by other companies. Note however, that to the extent forward-looking non-GAAP financial measures are provided herein, they are not reconciled to comparable historic IFRS measures due to the inherent difficulty in forecasting and quantifying certain amounts that are necessary for such reconciliation.
Additional Information. In connection with the Transaction, Global Blue Group Holding AG, the intended successor entity in the Transaction, intends to file a Registration Statement on Form F-4, which will include a preliminary prospectus and preliminary proxy statement. FPAC will mail a definitive proxy statement/prospectus and other relevant documents to its stockholders. Investors and security holders of FPAC are advised to read, when available, the proxy statement/prospectus in connection with FPAC’s solicitation of proxies for its special meeting of stockholders to be held to approve the Transaction because the proxy statement/prospectus will contain important information about the Transaction and the parties thereto. The definitive proxy statement/prospectus will be mailed to stockholders of FPAC as of a record date to be established for voting on the Transaction. Stockholders will also be able to obtain copies of the proxy statement/prospectus, without charge, once available, at the SEC’s website at www.sec.gov or by directing a request to: Far Point Acquisition Corporation, 18 West 18th Street, New York, NY 10011.
Participants in the Solicitation. FPAC, Global Blue and their respective directors, executive officers, other members of management, and employees, under SEC rules, may be deemed to be participants in the solicitation of proxies of FPAC’s stockholders in connection with the Transaction. Investors and security holders may obtain more detailed information regarding the names and interests in the Transaction of FPAC’s directors and officers in FPAC’s filings with the SEC, including FPAC’s Annual Report on Form 10-K for the fiscal year ended December 31, 2018, which was filed with the SEC on March 29, 2019, and such information and names of Global Blue’s directors and executive officers will also be in the Registration Statement on Form F-4 to be filed with the SEC by Global Blue Group Holding AG, the intended successor entity in the Transaction, which will include the proxy statement of FPAC for the Transaction.
2

Today’s presenters
3
Thomas Farley
JacquesStern
Chief Executive Officer
Chief Executive Officer
Summary transaction overview
4
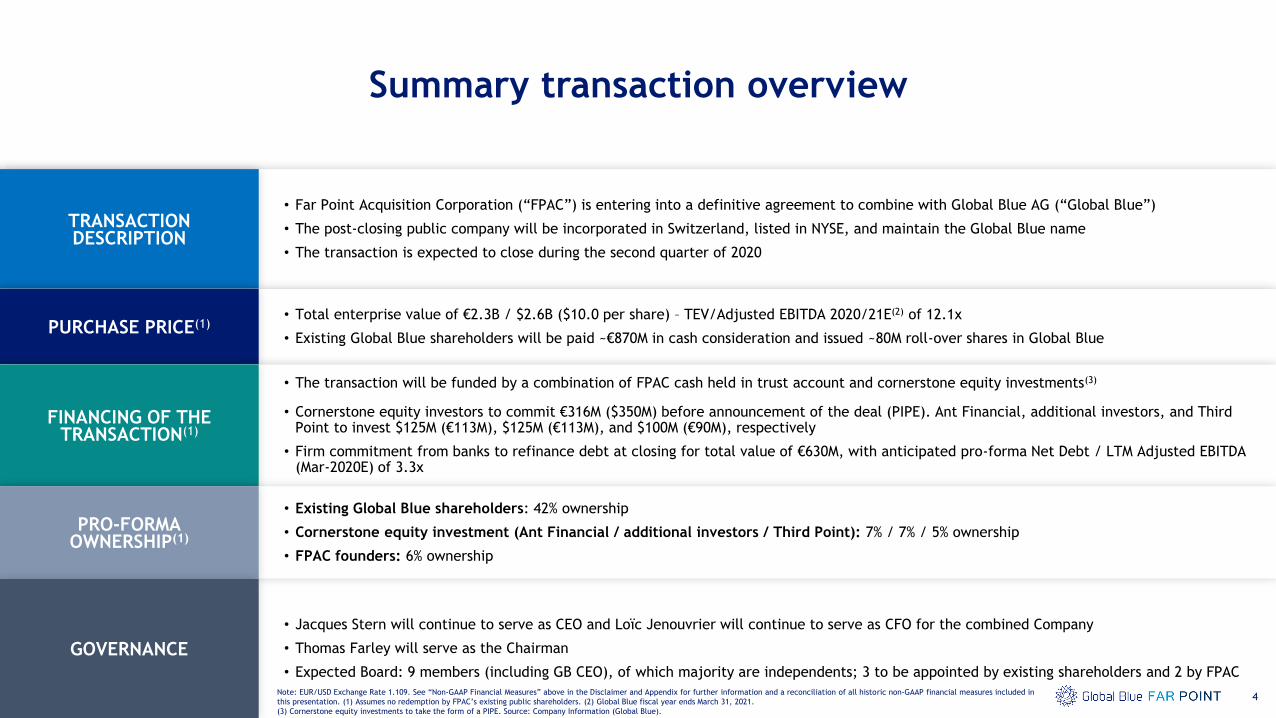
• Far Point Acquisition Corporation (“FPAC”) is entering into a definitive agreement to combine with Global Blue AG (“Global Blue”)
• The post-closing public company will be incorporated in Switzerland, listed in NYSE, and maintain the Global Blue name
• The transaction is expected to close during the second quarter of 2020
TRANSACTION DESCRIPTION
• Total enterprise value of €2.3B / $2.6B ($10.0 per share) – TEV/Adjusted EBITDA 2020/21E(2) of 12.1x
• Existing Global Blue shareholders will be paid ~€870M in cash consideration and issued ~80M roll-over shares in Global Blue PURCHASE PRICE(1)
• The transaction will be funded by a combination of FPAC cash held in trust account and cornerstone equity investments(3)
• Cornerstone equity investors to commit €316M ($350M) before announcement of the deal (PIPE). Ant Financial, additional investors, and Third Point to invest $125M (€113M), $125M (€113M), and $100M (€90M), respectively
• Firm commitment from banks to refinance debt at closing for total value of €630M, with anticipated pro-forma Net Debt / LTM Adjusted EBITDA (Mar-2020E) of 3.3x
FINANCING OF THE TRANSACTION(1)
• Existing Global Blue shareholders: 42% ownership
• Cornerstone equity investment (Ant Financial / additional investors / Third Point): 7% / 7% / 5% ownership
• FPAC founders: 6% ownership
PRO-FORMAOWNERSHIP(1)
GOVERNANCE
• Jacques Stern will continue to serve as CEO and Loïc Jenouvrier will continue to serve as CFO for the combined Company
• Thomas Farley will serve as the Chairman
• Expected Board: 9 members (including GB CEO), of which majority are independents; 3 to be appointed by existing shareholders and 2 by FPAC
Note: EUR/USD Exchange Rate 1.109. See “Non-GAAP Financial Measures” above in the Disclaimer and Appendix for further information and a reconciliation of all historic non-GAAP financial measures included in
this presentation. (1) Assumes no redemption by FPAC’s existing public shareholders. (2) Global Blue fiscal year ends March 31, 2021.
(3) Cornerstone equity investments to take the form of a PIPE. Source: Company Information (Global Blue).

INTERNATIONAL SHOPPERS
Worldwide Luxury Revenue20-30%
(1)
A strategic technology and payments partner empowering merchants to capture the growth of international shoppers
5
TAX FREE SHOPPINGTECHNOLOGY SOLUTIONS
SMART DATA& BUSINESS INTELLIGENCE
TARGETED MARKETING SOLUTIONS& INTELLIGENT SALES TECHNOLOGY
ADDED-VALUEPAYMENT SOLUTIONS
MERCHANTS
Note: (1) When limiting luxury revenue to that in Tax Free Shopping countries (instead of worldwide), international shoppers represent 40-50% of luxury revenue (company estimate based on a sample of merchants in Tax Free Shopping countries).
Source: Company Information (Global Blue).
TFS Merchant Stores+300K

13MGB international
shoppers
36MGB transactions
x
~70% GB market share(2)
€18.2B GB sales in store (SiS)
16MGB international
shoppers(1)
28MGB transactions
~20% GB market share(3)
€4.4BGB sales in store (SiS)
Global Blue at a glance
6
Added-Value Payment Solutions (AVPS)Tax Free Shopping Technology Solutions (TFS)
~85% of revenue ~15% of revenue
Note: Figures refer to the fiscal year ending 31 March 2019 (2018/19), except where noted. See “Non-GAAP Financial Measures” above in the Disclaimer and Appendix for further information and a reconciliation of all historic non-GAAP financial measures included in this presentation.
(1) Company estimate, extrapolated from GB sample set; (2) Estimated third-party serviced market share based on TFS SiS; (3) Estimated market share based on DCC revenue; (4) PT UFCF (Pre-tax unlevered free cash flow) divided by Adjusted EBITDA, where PT UFCF is defined as Adjusted
EBITDA less capital expenditures and change in net working capital. Source: Company Information (Global Blue).
REVENUE
~€430M(2019/20E)
ADJUSTED EBITDA
~€182M(2019/20E)
ADJUSTED EBITDA MARGIN
~42% (2019/20E)
CASH FLOW CONVERSION(4)
~85% (2019/20E)

PROOF POINTS GROWTH DRIVER
Strong macro driven historical growth expected to continue
7
Next ~5 years expectation
Note: (1) R-squared of the regression between arrivals into Global Blue markets (implied by emerging markets middle class growth, based on a regression calculated between 2000/01 to 2018/19) and Global Blue TFS transactions, calculated between 2009/10 and 2018/19; (2) Calculated
from 2009/10 to 2018/19, based on a consistent set of Global Blue countries with digital validation and non-digital validation at the start and end date of the calculation; (3) Extra-regional personal luxury market growth in countries with VAT refund schemes and countries without,
calculated from 2009/10 to 2018/19; (4) Forecast period is 2018/19 – 2024/25; (5) Forecast period is 2018/19 – 2021/22; (6) Subject to decisions of the respective governments, as such may or may not eventually occur. Source: Company Information (Global Blue).
EMERGING MARKETS +9%CAGR(4)
Arrivals of EM shoppers into Global Blue’s markets
97%correlation(1)
EM middle class vs. TFS transactionsA
VAT DYNAMICS>10
additional countries(6)
1.4xfaster(3)
Luxury sales growth in VAT refund vs. non-VAT refund countries
Countries adopting a VAT refund scheme C
DIGITALIZATION 54% to 89%% of transactions digitally validated
2.0xhigher(2)
Success ratio increase in digital vs. non-digital countriesB
(5)

8
Global Blue’s clear competitive differentiation
Note: Figures refer to 2018 / 19A. Fiscal year ending 31 March. (1) Estimated third-party serviced market share, based on TFS SiS; (2) Last 5 years average % SiS. (3) TFS countries where Global Blue currently operates. (4) Average tenure based on the top 20 merchants
Source: Company Information (Global Blue).
>3x market
share vs. next
TFS competitor
40+ PSP integrations
200+ POS integrations
17 customs integrations
13 payment partners
Low gross churn(2): -3%
Positive net churn(2): +1%70% market share in TFS(1)
PORTFOLIO OF ICONIC
LUXURY BRANDSGLOBAL LEADERSHIP
FULLY INTEGRATED
IN-HOUSE TECHNOLOGY
PLATFORM
DEEP DOMAIN EXPERTISE
IN COMPLIANCE
Avg. tenure (years)(4): >20
>40Tax free shopping
countries(3) where GB has
deep regulatory know-how
Longstanding relationships
with iconic luxury brands
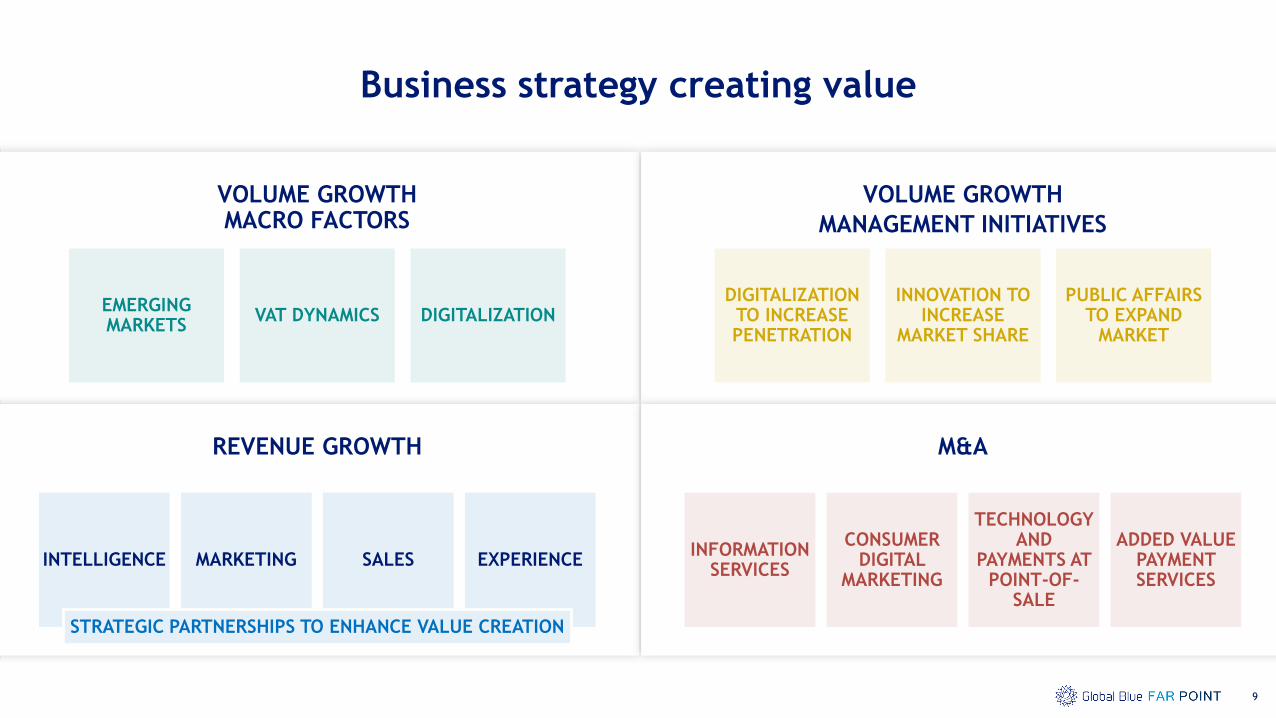
VOLUME GROWTH MACRO FACTORS
VOLUME GROWTH
MANAGEMENT INITIATIVES
Business strategy creating value
9
VAT DYNAMICS DIGITALIZATIONEMERGING MARKETS
REVENUE GROWTH M&A
INNOVATION TO INCREASE
MARKET SHARE
PUBLIC AFFAIRS TO EXPAND
MARKET
DIGITALIZATION TO INCREASE PENETRATION
INTELLIGENCE MARKETING SALES EXPERIENCE
STRATEGIC PARTNERSHIPS TO ENHANCE VALUE CREATION
INFORMATION SERVICES
CONSUMER DIGITAL
MARKETING
TECHNOLOGY AND
PAYMENTS AT POINT-OF-
SALE
ADDED VALUE PAYMENT SERVICES

TRACK RECORD OF GROWTH OPERATING LEVERAGEHIGH CASH FLOW
CONVERSION
EXCEPTIONAL TOTAL
SHAREHOLDER RETURNS
GROWTH PROFITABILITY CASH FLOW CONVERSION EARNINGS POWER
Powerful financial model delivering earnings growth and cash flow generation
Note: Fiscal year ending 31 March. Adjusted EBITDA defined as earnings before interest, taxes, depreciation and amortization, excluding other income and expense items that the Company considers as not related to ordinary business operations. PT UFCF (Pre-tax unlevered free cash flow)
defined as Adjusted EBITDA less capital expenditures and change in net working capital; Unlevered net income defined as earnings before interest and taxes less unlevered tax expense, before deducting non-controlling interest. See “Non-GAAP Financial Measures” above in the Disclaimer and
Appendix for further information and a reconciliation of all historic non-GAAP financial measures included in this presentation. (1) Adjusted EBIT defined as earnings before interest and taxes, excluding amortisation from purchase price allocation related to acquired assets, predominantly
related to the 2012 LBO. Source: Company Information (Global Blue).
[(7%)]
36
170
2009/10 2018/19
23% 41%
+19% CAGR
Adjusted
EBITDA
margin %
160
409
2009/10 2018/19
100%
85%(15%)
Adjusted EBITDA
Capex & ΔNWC
PT UFCF
139
108(31)
Adjusted EBIT Tax Unlevered Net Income
10
Adjusted EBITDA, €MRevenue, €M €M, 2018/19
Effective
tax rate:
22-23%
(1)
2018/19
(2009/10 and 2018/19 – Fiscal years
ended in March. The year 2018/19 refers
to 1 April 2018 to 31 March 2019)

Medium-term objectives
11
3-6% compounded annual growth rateREVENUE CAGR
Note: See “Non-GAAP Financial Measures” above in the Disclaimer and Appendix for further information and a reconciliation of all historic non-GAAP financial measures included in this presentation. (1) Clean EPS is based on Adjusted Net Income (Group Share).
(2) In form of dividend and / or share buyback.
Source: Company Information (Global Blue).
>200bps Adjusted EBITDA margin expansion over the medium-termADJUSTED EBITDA MARGIN
High-single digit growth from fiscal year ending 31 March 2021 onwardsCLEAN EPS CAGR(1)
Rapid deleveraging to below 2.5x Net debt / Adjusted EBITDANET LEVERAGE
€40M in September 2021 on fiscal year ending 31 March 2021, increase of absolute amount likely over time
Capital Return(2)

CAPEX-LIGHT MODEL
RICH CUSTOMER & MERCHANT DATA
PAYMENT PROCESSING EXPERTISE
DEEP MERCHANT RELATIONSHIPS
END-TO-END SERVICE OFFERING
INTEGRATED NETWORKS OTHER PAYMENTS NETWORK
Global Blue peer group positioning
12
No competency
Core competency
Some competency
POTENTIAL PEER SET

Implied discount:• 26% vs. Integrated Networks • 31% vs. Other Payments • 50% vs. Networks
Implied discount:• 1.6 pp vs. Integrated Networks• 1.8 pp vs. Other Payments • 2.5 pp vs. Networks
24.3x
17.6x
16.4x
12.1x
Networks
Other Payments
Integrated Networks
13
TEV/EBITDA 2020E
Note: Global Blue valued at TEV €2.3B and Equity Value of €1.7B. See “Non-GAAP Financial Measures” above in the Disclaimer and Appendix for further information and a reconciliation of all historic non-GAAP financial measures included in
this presentation. FY Mar-2021 for Global Blue / CY2020 for peers;
(1) Integrated Networks refers to median of: Amadeus, Edenred, Fleetcor and Wex; (2) Other Payments refers to median of: FIS, Fiserv, Global Payments and Worldline; (3) Networks refers to median of: Mastercard and Visa. Source: Company Information (Global Blue), Capital IQ.
(1)
Global Blue represents a unique and attractive investment opportunity at a compelling valuation
P/E 2020E FCFE YIELD 2020E
Implied discount:• 23% vs. Integrated Networks• 26% vs. Other Payments • 43% vs. Networks
(2)
(3)
31.3x
24.1x
23.2x
17.9x
Networks
Other Payments
Integrated Networks(1)
(2)
(3)
2.8%
3.5%
3.7%
5.3%
Networks
Other Payments
Integrated Networks(1)
(2)
(3)

Investment highlights
1414
POWERFUL
MACRO DRIVERS
OF GROWTH
1
CLEAR
MARKET &
TECHNOLOGY
LEADERSHIP
2
BUSINESS
STRATEGY
CREATING
VALUE
3
INTERNATIONAL
MANAGEMENT
TEAM WITH
RELEVANT
EXPERTISE
5
ATTRACTIVE
TRANSACTION-
BASED
BUSINESS
MODEL
4
COMPELLING
VALUATION
RELATIVE TO
PUBLIC PEERS
6

15
▪ APPENDIX
- Detailed transaction overview
Detailed transaction overview (1/2)
16
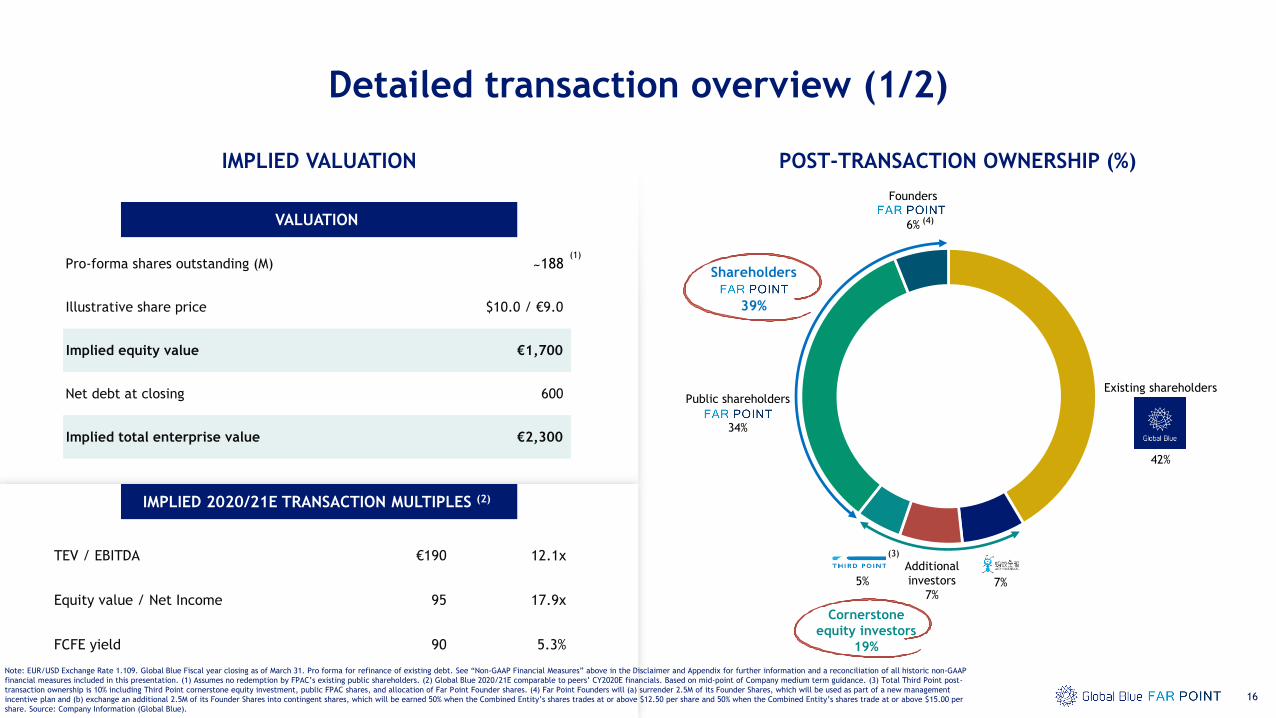
Note: EUR/USD Exchange Rate 1.109. Global Blue Fiscal year closing as of March 31. Pro forma for refinance of existing debt. See “Non-GAAP Financial Measures” above in the Disclaimer and Appendix for further information and a reconciliation of all historic non-GAAP
financial measures included in this presentation. (1) Assumes no redemption by FPAC’s existing public shareholders. (2) Global Blue 2020/21E comparable to peers’ CY2020E financials. Based on mid-point of Company medium term guidance. (3) Total Third Point post-
transaction ownership is 10% including Third Point cornerstone equity investment, public FPAC shares, and allocation of Far Point Founder shares. (4) Far Point Founders will (a) surrender 2.5M of its Founder Shares, which will be used as part of a new management
incentive plan and (b) exchange an additional 2.5M of its Founder Shares into contingent shares, which will be earned 50% when the Combined Entity’s shares trades at or above $12.50 per share and 50% when the Combined Entity’s shares trade at or above $15.00 per
share. Source: Company Information (Global Blue).
IMPLIED VALUATION POST-TRANSACTION OWNERSHIP (%)
Founders
6%
Public shareholders
34%
Existing shareholders
42%
Additional
investors
7%
Shareholders
39%
Cornerstone
equity investors
19%
IMPLIED 2020/21E TRANSACTION MULTIPLES (2)
VALUATION
TEV / EBITDA €190 12.1x
Equity value / Net Income 95 17.9x
FCFE yield 90 5.3%
Pro-forma shares outstanding (M) 188
Illustrative share price $10.0 / €9.0
Implied equity value €1,700
Net debt at closing 600
Implied total enterprise value €2,300
5%
(3)
188
(4)
7%
~(1)
Detailed transaction overview (2/2)
17
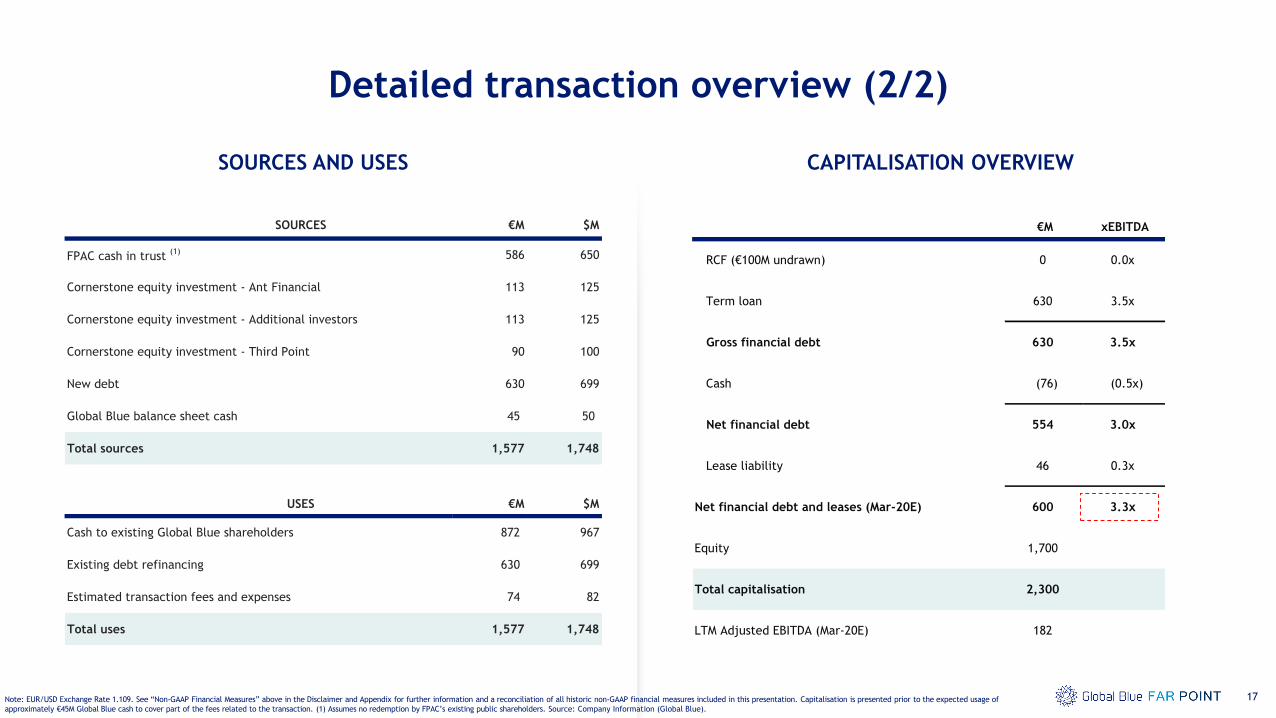
SOURCES AND USES CAPITALISATION OVERVIEW
Note: EUR/USD Exchange Rate 1.109. See “Non-GAAP Financial Measures” above in the Disclaimer and Appendix for further information and a reconciliation of all historic non-GAAP financial measures included in this presentation. Capitalisation is presented prior to the expected usage of
approximately €45M Global Blue cash to cover part of the fees related to the transaction. (1) Assumes no redemption by FPAC’s existing public shareholders. Source: Company Information (Global Blue).
€M xEBITDA
RCF (€100M undrawn) 0 0.0x
Term loan 630 3.5x
Gross financial debt 630 3.5x
Cash (76) (0.5x)
Net financial debt 554 3.0x
Lease liability 46 0.3x
Net financial debt and leases (Mar-20E) 600 3.3x
Equity 1,700
Total capitalisation 2,300
LTM Adjusted EBITDA (Mar-20E) 182
SOURCES €M $M
FPAC cash in trust (1) 586 650
Cornerstone equity investment - Ant Financial 113 125
Cornerstone equity investment - Additional investors 113 125
Cornerstone equity investment - Third Point 90 100
New debt 630 699
Global Blue balance sheet cash 45 50
Total sources 1,577 1,748
USES €M $M
Cash to existing Global Blue shareholders 872 967
Existing debt refinancing 630 699
Estimated transaction fees and expenses 74 82
Total uses 1,577 1,748

18
▪ APPENDIX
- Financials and reconciliations

Non-GAAP adjusted income statement
19Source: Company Information (Global Blue).
FY ended in March, €M FY 2016/17A FY 2017/18A FY 2018/19A FH1 2018/19A FH1 2019/20A
Revenue 417.9 420.0 409.0 208.7 226.5
Adjusted operating expenses (251.6) (250.4) (239.4) (119.9) (126.4)
Adjusted EBITDA 166.2 169.6 169.6 88.9 100.1
Other depreciation and amortisation (8.5) (11.9) (30.5) (14.5) (17.7)
Adjusted EBIT 157.8 157.7 139.1 74.4 82.4
Net finance costs (34.8) (32.1) (28.7) (15.9) (16.2)
Adjusted profit before tax 123.0 125.6 110.4 58.5 66.2
Adjusted income tax (28.2) (28.4) (25.1) (13.2) (16.2)
Adjusted profit for the period 94.7 97.1 85.4 45.3 50.0
Adjusted profit attributable to:
Owners of the parent (also referred to as “Adjusted Net
Income Group Share”)91.8 93.4 80.8 42.3 46.2
Non-controlling interests 2.9 3.8 4.5 3.0 3.8
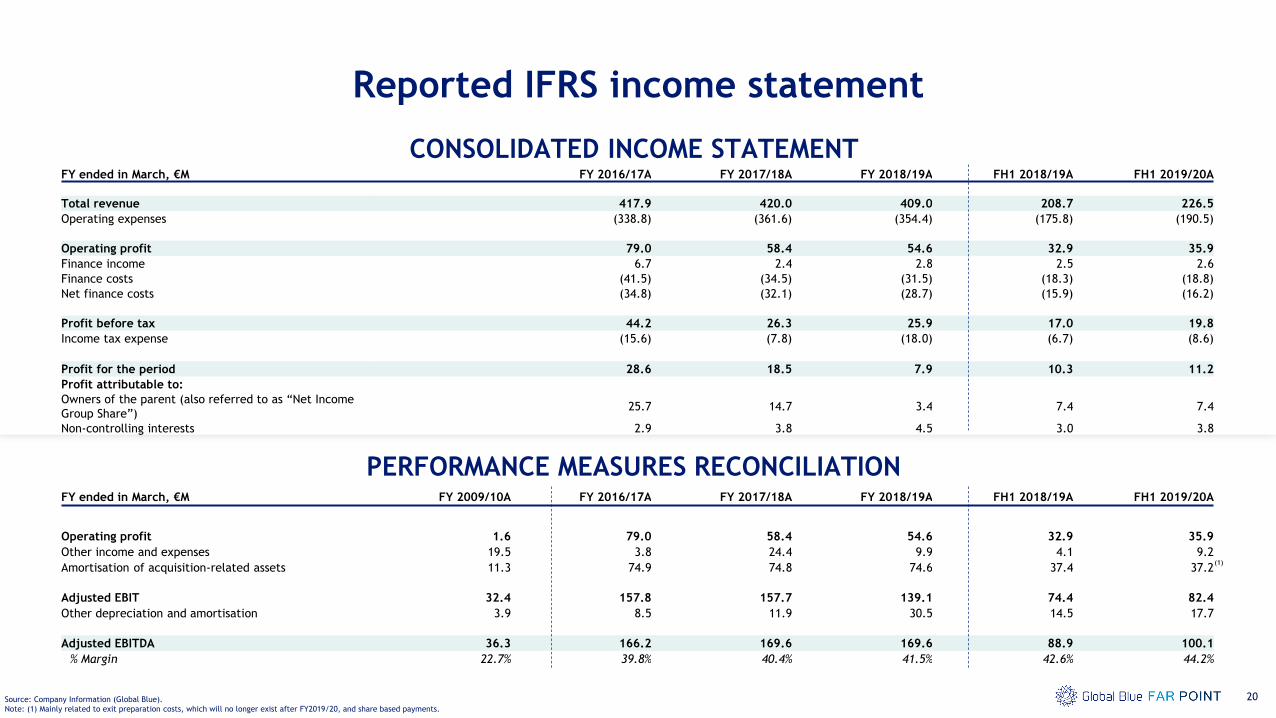
Reported IFRS income statement
20Source: Company Information (Global Blue).
Note: (1) Mainly related to exit preparation costs, which will no longer exist after FY2019/20, and share based payments.
PERFORMANCE MEASURES RECONCILIATION
CONSOLIDATED INCOME STATEMENT
(1)
FY ended in March, €M FY 2016/17A FY 2017/18A FY 2018/19A FH1 2018/19A FH1 2019/20A
Total revenue 417.9 420.0 409.0 208.7 226.5
Operating expenses (338.8) (361.6) (354.4) (175.8) (190.5)
Operating profit 79.0 58.4 54.6 32.9 35.9
Finance income 6.7 2.4 2.8 2.5 2.6
Finance costs (41.5) (34.5) (31.5) (18.3) (18.8)
Net finance costs (34.8) (32.1) (28.7) (15.9) (16.2)
Profit before tax 44.2 26.3 25.9 17.0 19.8
Income tax expense (15.6) (7.8) (18.0) (6.7) (8.6)
Profit for the period 28.6 18.5 7.9 10.3 11.2
Profit attributable to:
Owners of the parent (also referred to as “Net Income
Group Share”)25.7 14.7 3.4 7.4 7.4
Non-controlling interests 2.9 3.8 4.5 3.0 3.8
FY ended in March, €M FY 2009/10A FY 2016/17A FY 2017/18A FY 2018/19A FH1 2018/19A FH1 2019/20A
Operating profit 1.6 79.0 58.4 54.6 32.9 35.9
Other income and expenses 19.5 3.8 24.4 9.9 4.1 9.2
Amortisation of acquisition-related assets 11.3 74.9 74.8 74.6 37.4 37.2
Adjusted EBIT 32.4 157.8 157.7 139.1 74.4 82.4
Other depreciation and amortisation 3.9 8.5 11.9 30.5 14.5 17.7
Adjusted EBITDA 36.3 166.2 169.6 169.6 88.9 100.1
% Margin 22.7% 39.8% 40.4% 41.5% 42.6% 44.2%

Balance sheet
21
€M 3/31/2019 9/30/2019
Property, plant and equipment 56.2 53.8
Intangible assets 695.6 663.0
Deferred income tax assets 14.0 17.1
Investments in associates and joint ventures 2.4 3.1
Other non-current receivables 12.7 15.4
Non current assets 781.0 752.4
Trade receivables 249.3 377.1
Other current receivables 49.2 47.8
Income tax receivables 3.6 1.6
Prepaid expenses 15.0 11.4
Cash and cash equivalents 104.1 75.1
Current assets 421.3 513.1
Assets 1,202.3 1,265.5
Source: Company Information (Global Blue).
€M 3/31/2019 9/30/2019
Attributable to the parents 75.1 80.3
Non-controlling interest 8.4 7.7
Total equity 83.5 87.9
Loans and borrowings 622.4 623.5
Other long-term liabilities 39.2 39.0
Deferred income tax liabilities 49.4 41.8
Post-employment benefits 5.1 5.3
Provisions for other liabilities and charges 1.7 2.1
Non current liabilities 717.8 711.7
Trade payables 274.0 331.7
Other current liabilities 61.0 63.8
Accrued liabilities 40.0 41.6
Current income tax liabilities 26.0 28.7
Current liabilities 401.0 465.9
Total equity and liabilities 1,202.3 1,265.5
CONSOLIDATED STATEMENT OF FINANCIAL POSITION

Reconciliations (1/4)
22Source: Company Information (Global Blue).
Note: (1) Mainly related to SPAC costs, which will no longer exist after FY2019/20, and share based payments.
ADJUSTED OPERATING EXPENSES
FY ended in March, €M FY 2016/17A FY 2017/18A FY 2018/19A FH1 2018/19A FH1 2019/20A
Operating expenses (338.8) (361.6) (354.4) (175.8) (190.5)
Other income and expenses 3.8 24.4 9.9 4.1 9.2
Amortisation of acquisition-related assets 74.9 74.8 74.6 37.4 37.2
Other depreciation and amortisation 8.5 11.9 30.5 14.5 17.7
Adjusted operating expenses (251.6) (250.4) (239.4) 119.9 126.4
FY ended in March, €M FY 2016/17A FY 2017/18A FY 2018/19A FH1 2018/19A FH1 2019/20A
Income tax expense (15.6) (7.8) (18.0) (6.7) (8.6)
Deferred tax on amortisation of acquisition-related assets (15.1) (15.1) (15.1) (7.5) (7.5)
Tax impact of other income and expense 2.5 (5.6) (2.8) 1.0 (0.1)
Italian tax audit - - 10.8 - -
Adjusted income tax expense (28.2) (28.4) (25.1) (13.2) (16.2)
ADJUSTED INCOME TAX EXPENSE
(1)

Reconciliations (2/4)
23Source: Company Information (Global Blue).
Note: (1) Exit preparation costs, which will no longer exist after FY2019/20, and share based payments. (2) Based on Effective Tax Rate calculated as Adjusted Income Tax divided Adjusted PBT. (3) Impact on tax expense from other income and expenses and amortisation of
acquisition-related assets
FY ended in March, €M FY 2016/17A FY 2017/18A FY 2018/19A FH1 2018/19A FH1 2019/20A
Profit before tax 44.2 26.3 25.9 17.0 19.8
Other income and expenses 3.8 24.4 9.9 4.1 9.2
Amortisation of acquisition-related assets 74.9 74.8 74.6 37.4 37.2
Adjusted profit before tax 123.0 125.6 110.4 58.5 66.2
FY ended in March, €M FY 2016/17A FY 2017/18A FY 2018/19A
Operating profit 79.0 58.4 54.6
Other income and expenses 3.8 24.4 9.9
Amortisation of acquisition-related assets 74.9 74.8 74.6
Adjusted EBIT 157.8 157.7 139.1
Unlevered tax(2) (36.2) (35.7) (31.6)
Unlevered net income 121.5 122.0 107.5
UNLEVERED NET INCOME
ADJUSTED PROFIT BEFORE TAX and ADJUSTED NET INCOME
(1)
FY ended in March, €M FY 2016/17A FY 2017/18A FY 2018/19A FH1 2018/19A FH1 2019/20A
Net Income (Group Share) 25.7 14.7 3.4 7.4 7.4
Other income and expenses 3.8 24.4 9.9 4.1 9.2
Amortisation of acquisition-related assets 74.9 74.8 74.6 37.4 37.2
Cum. tax effect of adjustments(3) (12.6) (20.6) (7.1) (6.6) (7.6)
Adjusted net income (Group Share) 91.8 93.4 80.8 42.3 46.2

Reconciliations (3/4)
24
CASH FLOW SUMMARY
FY ended in March, €M FY 2016/17A FY 2017/18A FY 2018/19A FH 1 2018/19A FH1 2019/20A
Adjusted EBITDA(1) 166.2 169.6 169.6 88.9 100.1
Capex (27.8) (26.6) (33.4) (13.9) (14.4)
NWC 10.9 (21.2) 7.3 (53.4) (62.9)
PTUFCF 149.4 121.9 143.4 21.6 22.7
% Conversion (% Adjusted EBITDA) 89.8% 71.9% 84.6% N.M. N.M.
Interest paid (34.9) (26.8) (24.5) (12.4) (12.1)
Taxes paid (25.0) (24.7) (28.3) (15.6) (14.7)
Principal elements of lease payments - - (14.2) (7.0) (8.1)
Dividends paid to non-controlling interests (3.6) (3.5) (3.9) (3.6) (4.8)
FCFE (group share) 85.9 66.9 72.6 (17.1) (17.0)
Source: Company Information (Global Blue). (1) As reconciled on page 41
Normal seasonal
working capital
cash outflow
driven by summer
peak shopping
period
Normal seasonal
working capital
cash outflow
driven by summer
peak shopping
period

Reconciliations (4/4)
25Source: Company Information (Global Blue).
FY ended in March, €M FY 2016/17A FY 2017/18A FY 2018/19A FH1 2018/19A FH1 2019/20A
Cash and cash equivalents (111.7) (50.7) (104.1) N.A. (75.1)
Non-current loans and borrowings 610.5 612.8 622.4 N.A. 623.5
Addback: Capitalized Financing Costs 19.5 17.2 13.4 N.A. 11.6
Exclude: IFRS 9 Impact 0.0 0.0 (5.8) N.A. (5.1)
Current lease liabilities - - 13.7 N.A. 13.7
Non-current lease liabilities - - 32.4 N.A. 31.7
Net debt 518.3 579.3 572.0 N.A. 600.3
Adjusted EBITDA (on a rolling 12-month basis) 166.2 169.6 169.6 N.A. 180.8
Leverage ratio 3.1x 3.4x 3.4x N.A. 3.3x
NET LEVERAGE
Key risks relating to Global Blue
26
• We are subject to currency exchange rate risk in the conduct of our business, including commercial risk if certain currency zones become less attractive for inbound international shoppers.
• Our business is highly dependent on international travel, which may be adversely affected by regional or global circumstances or travel restrictions.
• Our business is dependent on the overall level of consumer spending, which is affected by general economic conditions and spending patterns.
• A decrease in VAT rates or changes in VAT or VAT refund policies in countries in which we operate could negatively affect our business.
• Changes in the regulatory environment, licencing requirements and government agreements could adversely affect our business.
• We must continually adapt and enhance our existing technology offerings and ensure continued resilience and uptime of our underlying technology platform to remain competitive in our industry.
• We operate in a competitive market and we may lose merchant accounts to our competitors.
• Our business may be adversely affected by disintermediation of TFS processes.
• Price harmonisation or convergence between destination markets and origin markets may adversely affect our business.
• The integrity, reliability and efficiency of our internal controls and procedures may not be guaranteed.
• We are subject to taxation in multiple jurisdictions, which is complex and often requires making subjective determinations subject to scrutiny by, and disagreements with, tax regulators.
• Adverse competition law rulings could restrict our ability to expand or to operate our business as we wish and could expose us to fines or other penalties.
• Our TFS business is dependent on our airport concessions and agreements with agents.
• We operate in emerging markets and are exposed to risks associated with operating in such markets.
• We may be adversely affected by risks associated with strategic arrangements or investments in joint ventures with third parties.
• Our business is subject to loss through physical disaster, data security breach, computer malfunction or sabotage.
• Our AVPS business relies on relationships with acquirers and on the involvement of card schemes.
• We are subject to counterparty risk and credit risk.
• We are subject to losses from fraud, theft and employee error.
• We may not be able to attract, integrate, manage and retain qualified personnel or key employees.
• We are subject to complex and stringent data protection and privacy laws and regulations in the jurisdictions in which we operate.
• Our business is subject to anti-money laundering, sanctions and anti-bribery regulation and related compliance costs and third-party risks.
• We are subject to risks relating to intellectual property.
• Litigation or investigations involving us could result in material settlements, fines or penalties and may adversely affect our business, financial condition and results of operations
• As reported on the French Competition Authority (FCA) website, on November 28, 2019, representatives of the FCA carried out unannounced inspections of companies in the VAT refund services sector in
Paris, including Global Blue. Documents were collected and taken in connection with an investigation, in respect of which Global Blue is fully co-operating. The investigation is solely linked to suspected
anti-competition breaches in France (which represents 7.6% of Global Blue’s total Oct-19 LTM revenue) and, as stated by the FCA, such investigation does not pre-suppose the existence of a breach of
law. Global Blue has lodged at court a right to appeal against the decision by the FCA to launch the investigation. Further information will be provided as and when available