technology - corporate-ir.net · outbound troubleshooting and inbound overfl ow calls for our...
TRANSCRIPT

uei.comUniversal Electronics Inc.
6101 Gateway Drive
Cypress, CA 90630
connect
we
universal electronics _ annual report 0
20
7
l i fe
technology
lifewe
0
20
7
0
2
0
7
universal electronics inc. annual report

>
home
more
electronics
UEI is the global leader in
wireless control technology
for the connected home. UEI
designs, develops, and deliv-
ers innovative solutions that
enable consumers to control
entertainment devices, digital
media, and home systems.
The company’s broad portfolio
of patented technologies and
database of infrared control soft-
ware have been adopted by many
Fortune 500 companies in the
consumer electronics, subscrip-
tion broadcast, and computing
industries.
growth
DIRECTORS
Paul D. Arling
Chairman and
Chief Executive Offi cer
Universal Electronics Inc.
Cypress, California
Satjiv S. Chahil2, 3
Senior Vice President
of Marketing
Hewlett-Packard
Personal Systems Group
Cupertino, California
William C. Mulligan1, 3
Managing Director
Primus Venture Partners, Inc.
Cleveland, Ohio
J.C. Sparkman2, 3
Retired Executive
Vice President and
Chief Operating Offi cer
Telecommunications, Inc. (TCI)
Denver, Colorado
Ed Zinser1
Chief Financial Offi cer
Boingo Wireless Inc.
Los Angeles, California
1 Member, Audit Committee
2 Member, Compensation
Committee
3 Member, Corporate
Governance & Nominating
Committee
Universal Electronics Inc.
is an equal opportunity employer
OFFICERS
Paul D. Arling
Chairman and
Chief Executive Offi cer
Paul J.M. Bennett
Executive Vice President
International
Managing Director EMEA
Mark S. Kopaskie
Executive Vice President
and General Manager, U. S.
Richard A. Firehammer, Jr.
Senior Vice President,
General Counsel and
Secretary
Bryan Hackworth
Senior Vice President and
Chief Financial Offi cer
Joe Miketo
Senior Vice President
of Operations
Olav Pouw
Senior Vice President Control
and Technology Group, EMEA
and Asia
Pam Price
Senior Vice President of Sales
Ramzi S. Ammari
Vice President of
Product Development
Steve Gutman
Vice President of Cable Sales
Patrick H. Hayes
Vice President of
Intellectual Property
Lou Hughes
Vice President of
Corporate Development
Em Klaver
Vice President
Digital Home Group , EMEA
Michael Koch
Vice President of Finance and
Treasurer
Patrick Lems
Vice President
Business Controlling & M&A
EMEA
Jacques Mathijsen
Vice President of Product
Mangement, EMEA
Graham Williams
Vice President of Engineering
WORLDWIDE HEADQUARTERS
Universal Electronics Inc.
6101 Gateway Drive
Cypress, California 90630
EUROPEAN HEADQUARTERS
The Netherlands
Universal Electronics BV
Institutenweg 21 7521 PH
Enschede, Netherlands
INVESTOR INFORMATION
Annual Meeting
4:00 p.m. PT - June 12, 2008
Universal Electronics Inc.
6101 Gateway Drive
Cypress, California 90630
Independent Registered Public
Accounting Firm
Grant Thornton LLP
Irvine, California
Registrar & Transfer Agent
Computershare Investor
Services, LLC
2 North LaSalle Street
Chicago, Illinois 60602
Phone (312) 588-4991
FORM 10-K
Any stockholder who desires
a copy of the Company’s 2007
Annual Report on Form 10-K
fi led with the Securities and
Exchange Commission may ob-
tain a copy (excluding exhibits)
without charge by addressing a
request to:
Investor Relations
Universal Electronics Inc.
6101 Gateway Drive
Cypress, California 90630
A charge equal to the reproduc-
tion cost will be made if the
exhibits are requested.
Universal’s Internet address is
www.uei.com. Universal makes
available through its internet
web site its annual report on
Form 10-K. Investors can also
obtain copies of our SEC fi lings
from the SEC web site at
www.sec.gov
corporate information_
revenue
All market trends underscore a sea change in technology and consumer electronics. The digital media rev-
olution is dramatically changing all aspects of our culture. New technology such as digital video recorders,
high-defi nition televisions, and digital music services are driving demand for more innovative and easier
ways to control it all. That’s where we come in. At Universal Electronics Inc. (UEI) we make innovative wire-
less control technology that allows everything to work together more easily and seamlessly, so consumers
can enjoy their home entertainment media content — and get more out of it — anytime and anywhere.
trends
04
05
06
07
$273 MILLION >
$236 MILLION >
$181 MILLION >
$158 MILLION >
connecting the dots on the latest market trends_
2
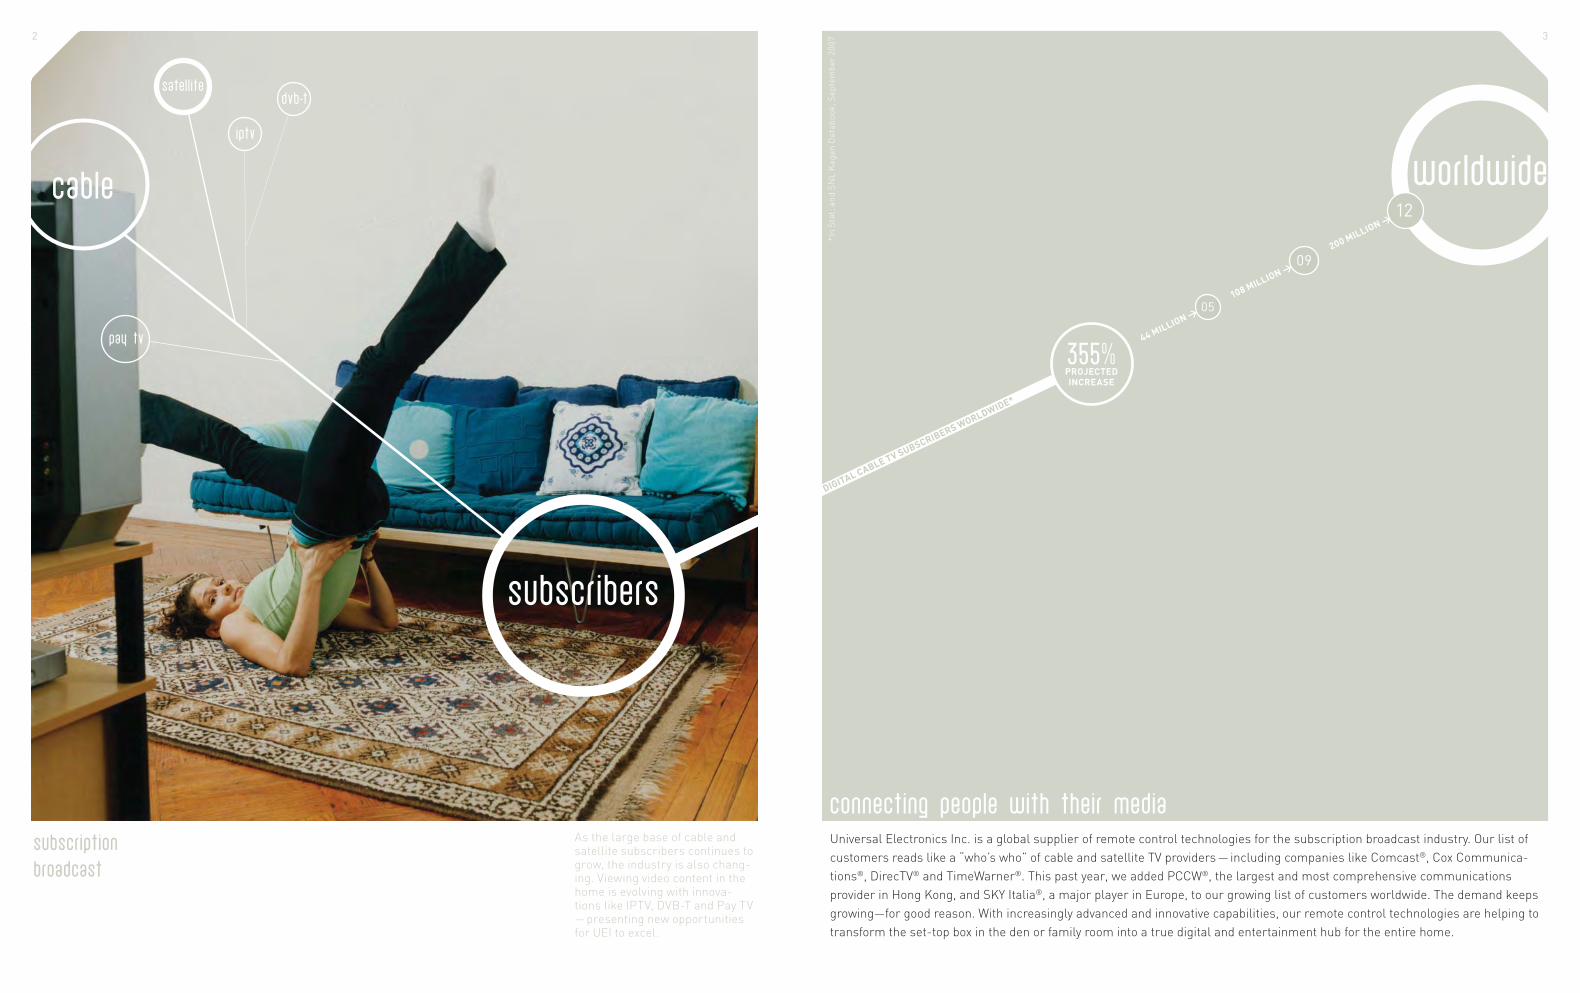
As the large base of cable and satellite subscribers continues to grow, the industry is also chang-ing. Viewing video content in the home is evolving with innova-tions like IPTV, DVB-T and Pay TV — presenting new opportunities for UEI to excel.
cable
subscribers
satell ite
subscription
broadcast
iptv
dvb-t
pay tv
3
Universal Electronics Inc. is a global supplier of remote control technologies for the subscription broadcast industry. Our list of
customers reads like a “who’s who” of cable and satellite TV providers — including companies like Comcast®, Cox Communica-
tions®, DirecTV® and TimeWarner®. This past year, we added PCCW®, the largest and most comprehensive communications
provider in Hong Kong, and SKY Italia®, a major player in Europe, to our growing list of customers worldwide. The demand keeps
growing—for good reason. With increasingly advanced and innovative capabilities, our remote control technologies are helping to
transform the set-top box in the den or family room into a true digital and entertainment hub for the entire home.
connecting people with their media
worldwide12
DIGITAL CABLE TV SUBSCRIBERS WORLDWIDE*
355%PROJECTEDINCREASE
*In
Sta
t; a
nd
SN
L K
ag
an
Da
tab
oo
k,
Se
pte
mb
er
20
07
05
09200 MILLION >
108 MILLION >
44 MILLION >
4
worldwide
electronics
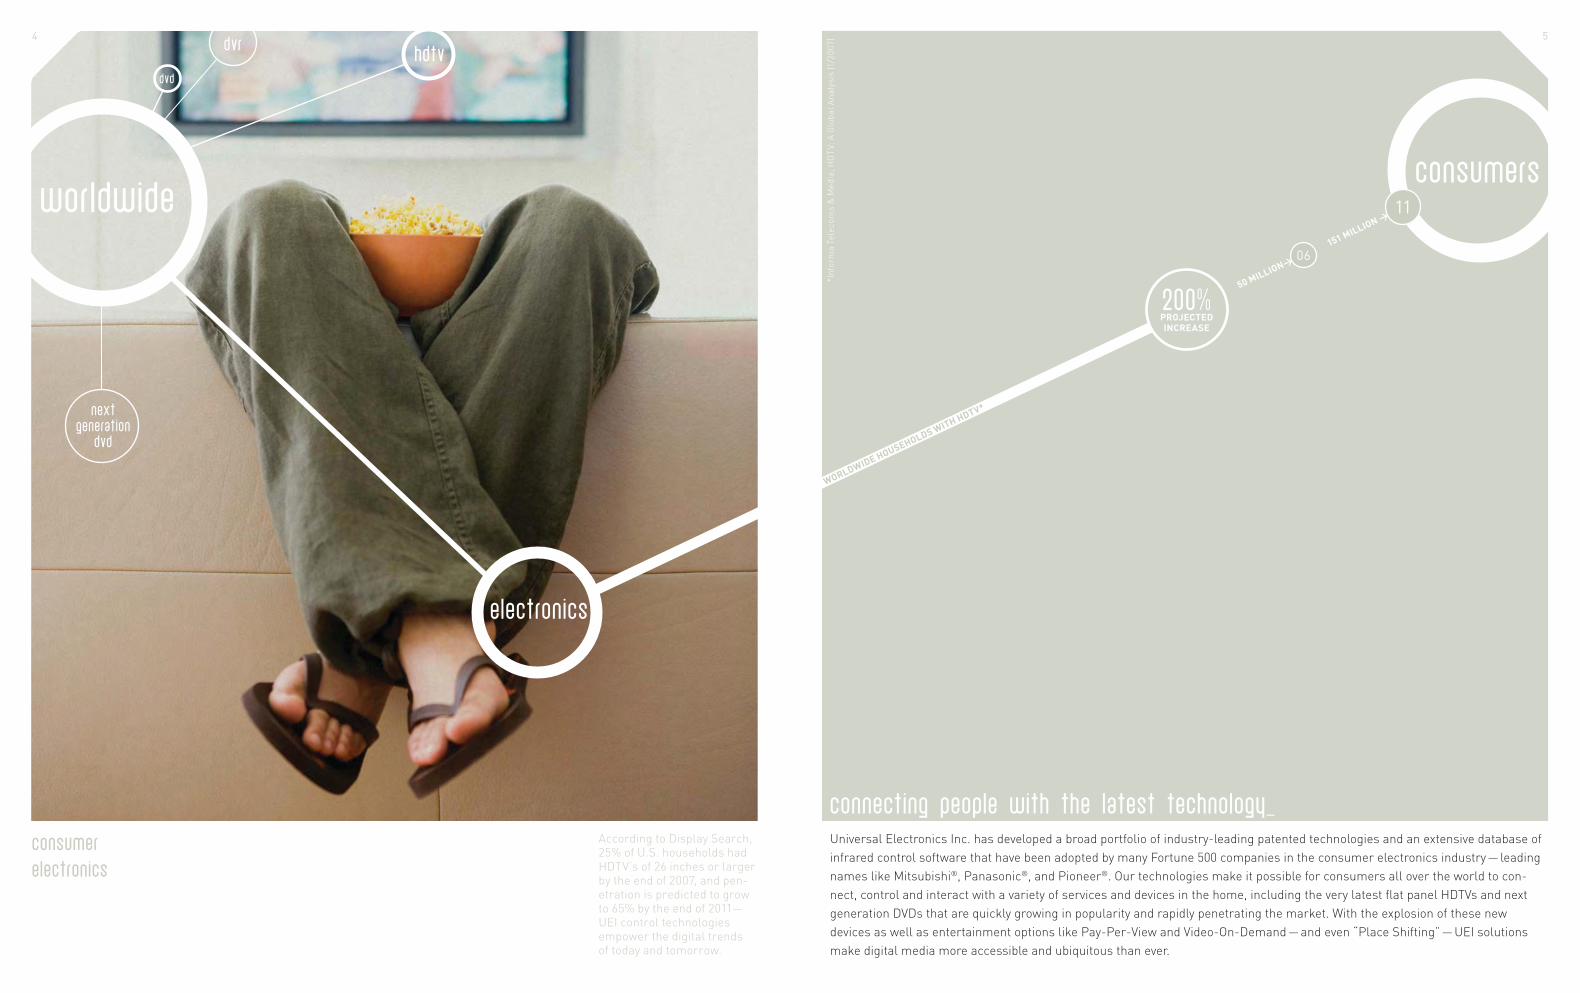
According to Display Search, 25% of U.S. households had HDTV’s of 26 inches or larger by the end of 2007, and pen-etration is predicted to grow to 65% by the end of 2011—UEI control technologies empower the digital trends of today and tomorrow.
dvr
dvd
hdtv
consumer
electronics
nextgeneration
dvd
5
consumers
connecting people with the latest technology_Universal Electronics Inc. has developed a broad portfolio of industry-leading patented technologies and an extensive database of
infrared control software that have been adopted by many Fortune 500 companies in the consumer electronics industry — leading
names like Mitsubishi®, Panasonic®, and Pioneer®. Our technologies make it possible for consumers all over the world to con-
nect, control and interact with a variety of services and devices in the home, including the very latest fl at panel HDTVs and next
generation DVDs that are quickly growing in popularity and rapidly penetrating the market. With the explosion of these new
devices as well as entertainment options like Pay-Per-View and Video-On-Demand — and even “Place Shifting” — UEI solutions
make digital media more accessible and ubiquitous than ever.
06
11
151 MILLION >
50 MILLION>
WORLDWIDE HOUSEHOLDS WITH HDTV*
200%PROJECTEDINCREASE
*In
form
a T
ele
co
ms &
Me
dia
; H
DT
V:
A G
lob
al
An
aly
sis
(1
/20
07
)
6
230,000+ BRAND AND
MODEL REFERENCES
348,000+UNIQUE
FUNCTIONCODES
complex
UEI’s products With innovative products like the Cricket Kids Remote, the Polaris™ remote for aging baby boomers, and the multimedia remote, UEI is enhancing the user experience for all ages and lifestyles.
7
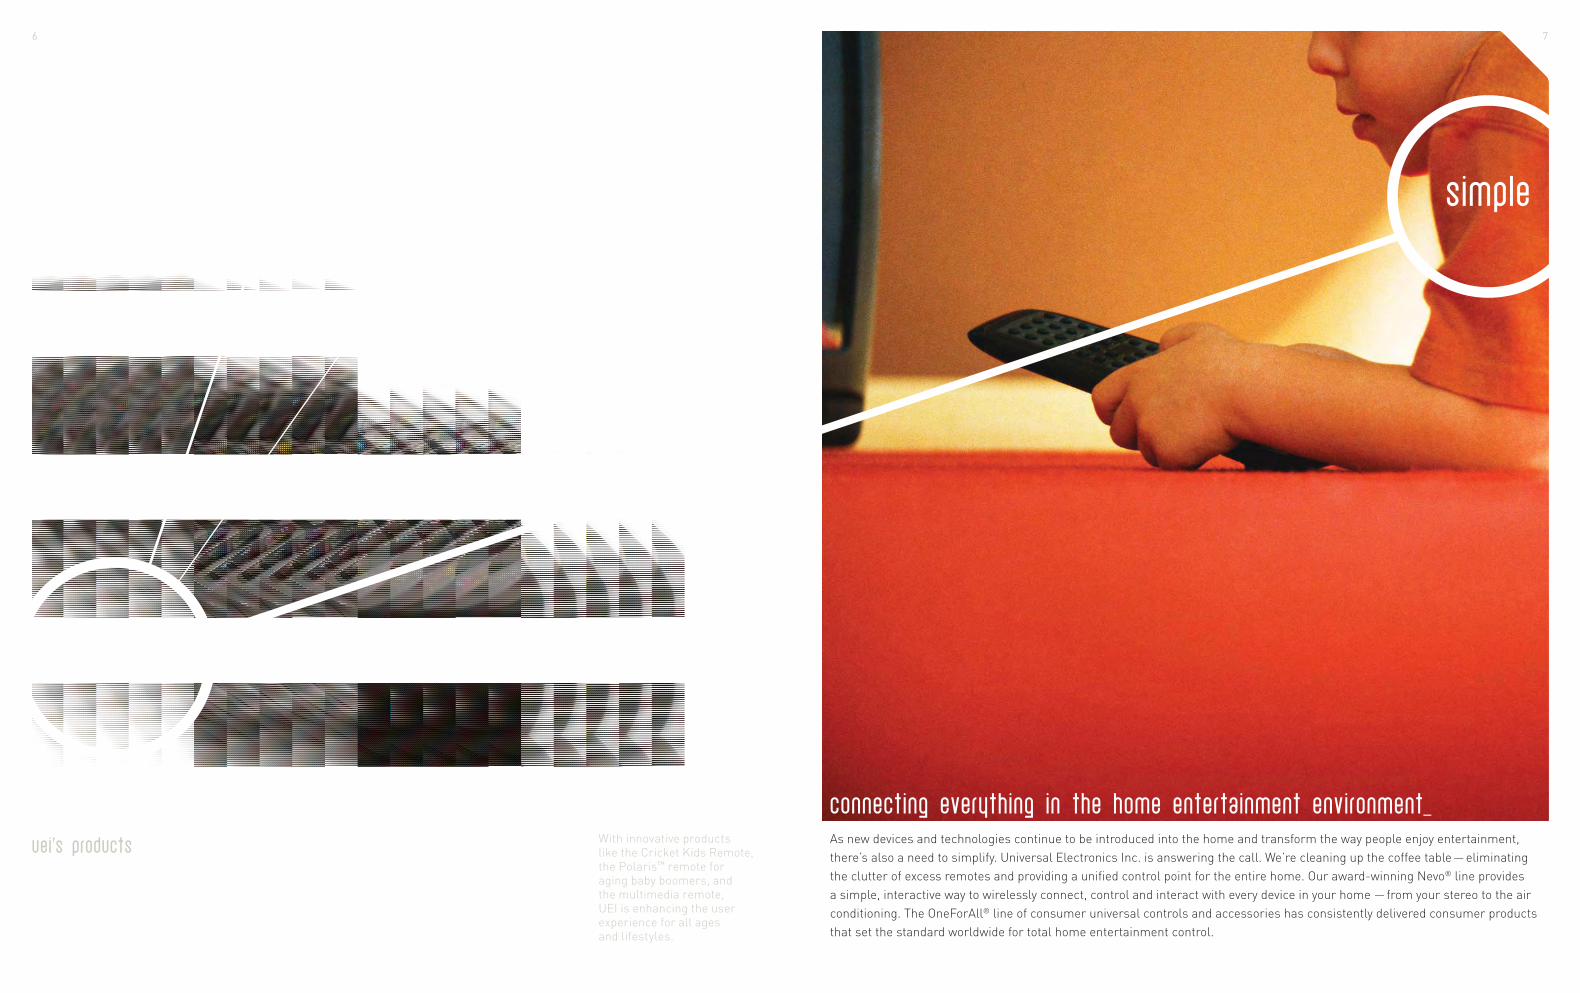
simple
As new devices and technologies continue to be introduced into the home and transform the way people enjoy entertainment,
there’s also a need to simplify. Universal Electronics Inc. is answering the call. We’re cleaning up the coffee table — eliminating
the clutter of excess remotes and providing a unifi ed control point for the entire home. Our award-winning Nevo® line provides
a simple, interactive way to wirelessly connect, control and interact with every device in your home — from your stereo to the air
conditioning. The OneForAll® line of consumer universal controls and accessories has consistently delivered consumer products
that set the standard worldwide for total home entertainment control.
Connecting everything in the home entertainment environment_

8 9
connect
we
9
The key to our success at UEI is the quality and talent of our people. We are fortunate to employ some of
the world’s leading experts in control technology. In fact, 70 of them have the distinction of being named
on one or more of the 175 issued and pending U.S. patents. Ours is a corporate culture that demands
and rewards excellence, as evidenced by the long tenure of our people. Of our 253 employees in the U.S.,
about 60 percent have been with the company for more than fi ve years; 25 percent have been with UEI
for more than ten years. Those are statistics we can be very proud of.
our people are making all the right connections worldwide_

10
r&d
For us, innovation begins with R&D and product design. This is where we test new ideas and develop new prototypes. At the
company’s Design Center located in Cypress, California, designers and product teams investigate new ways to improve the user
experience and simplify the home control environment. Our designers have extensive training and experience in all aspects of
ergonomic, industrial, and user interface design. They have also won numerous awards and international recognition for their
work — their contributions have been pivotal to our success in becoming a leading innovator in the industry. As more and more
new digital technology devices are introduced into home theaters, family rooms, and living rooms throughout the world, UEI
designers are the passionate visionaries helping achieve our mission of delivering the connected home.
design
11
connecting new products with new possibil ities_
innovation
consumer
usabil ity
technology

12
software
hardware
engineering
Engineering the hardware and software that connect the digital home_
13
awards
Our hardware and software engineers have a total of more than 540 years of collective experience in engineering. Over 40 percent
have been with the company more than ten years. During this time, they have helped to develop the “intelligence” inside many of
the digital and electronic devices and wireless controllers in use throughout the world. Our connectivity software, which we license
to many leading technology companies, covers more than 348,000 device function codes — meaning our remotes can readily be
programmed to operate equipment in all markets worldwide. UEI engineers are now working on the next generation of control
solutions, which incorporate leading-edge wireless technologies like Z-Wave™, ZigBee™, Wi-Fi, and two-way infrared protocols like
XMP-2™, to expand the parameters of what’s possible in the connected home.
Leveraging our extensive technology experience to Improve the user experience_
T3 GOLD AWARD
INNOVATIONS AWARD
INTERNATIONAL CES
INDUSTRIAL DESIGN
EXCELLENCE AWARD
14
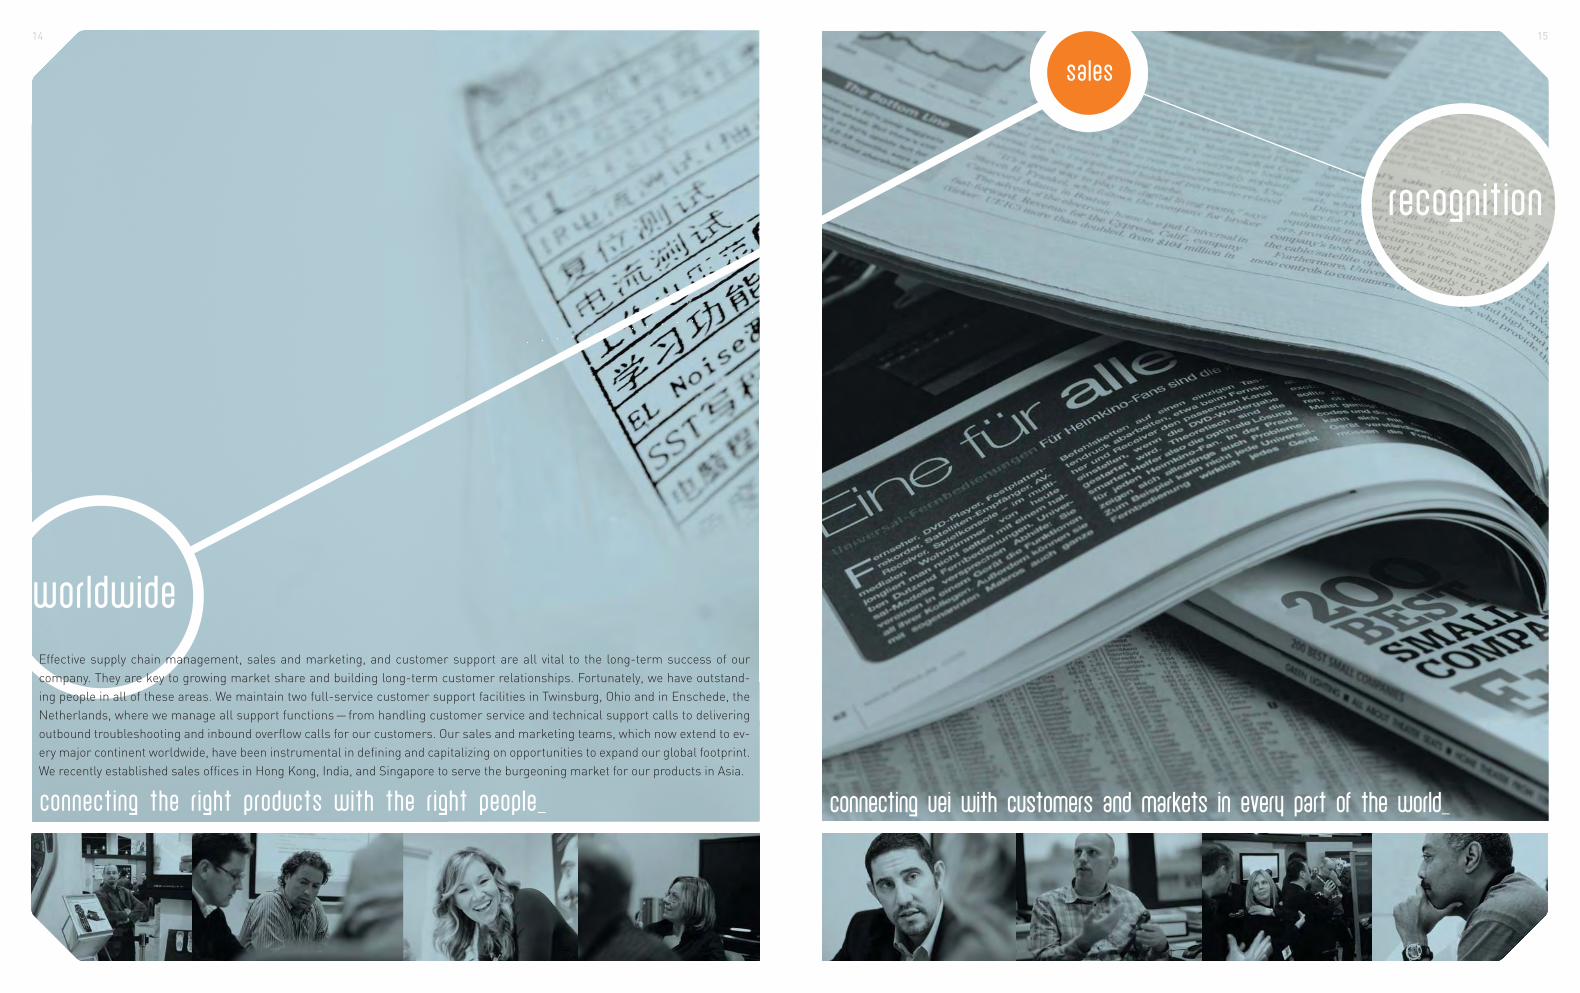
worldwide
Effective supply chain management, sales and marketing, and customer support are all vital to the long-term success of our
company. They are key to growing market share and building long-term customer relationships. Fortunately, we have outstand-
ing people in all of these areas. We maintain two full-service customer support facilities in Twinsburg, Ohio and in Enschede, the
Netherlands, where we manage all support functions — from handling customer service and technical support calls to delivering
outbound troubleshooting and inbound overfl ow calls for our customers. Our sales and marketing teams, which now extend to ev-
ery major continent worldwide, have been instrumental in defi ning and capitalizing on opportunities to expand our global footprint.
We recently established sales offi ces in Hong Kong, India, and Singapore to serve the burgeoning market for our products in Asia.
Connecting the right products with the right people_
15
recognition
sales
Connecting UEI with customers and markets in every part of the world_
17
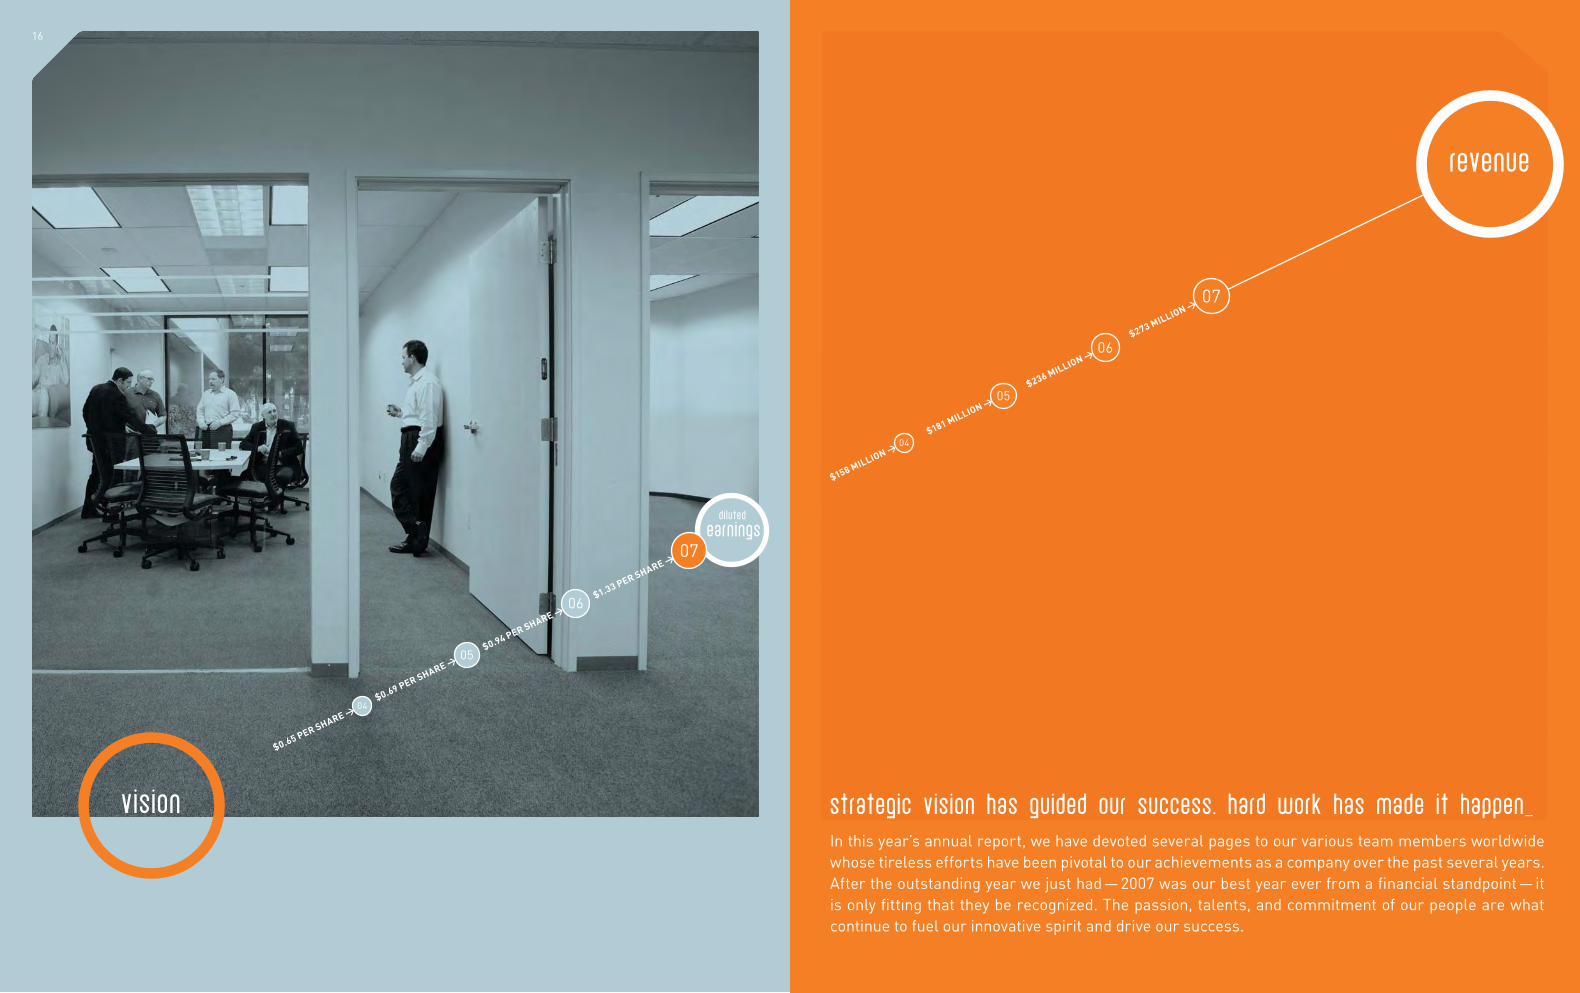
revenue
In this year’s annual report, we have devoted several pages to our various team members worldwide
whose tireless efforts have been pivotal to our achievements as a company over the past several years.
After the outstanding year we just had — 2007 was our best year ever from a fi nancial standpoint — it
is only fi tting that they be recognized. The passion, talents, and commitment of our people are what
continue to fuel our innovative spirit and drive our success.
Strategic vision has guided our success. Hard work has made it happen_
04
05
06
07
$273 MILLION >
$236 MILLION >
$181 MILLION >
$158 MILLION >
16
vision
earnings
04
05
06
07
$1.33 PER SHARE >
$0.94 PER SHARE >
$0.69 PER SHARE >
$0.65 PER SHARE >
di luted
18
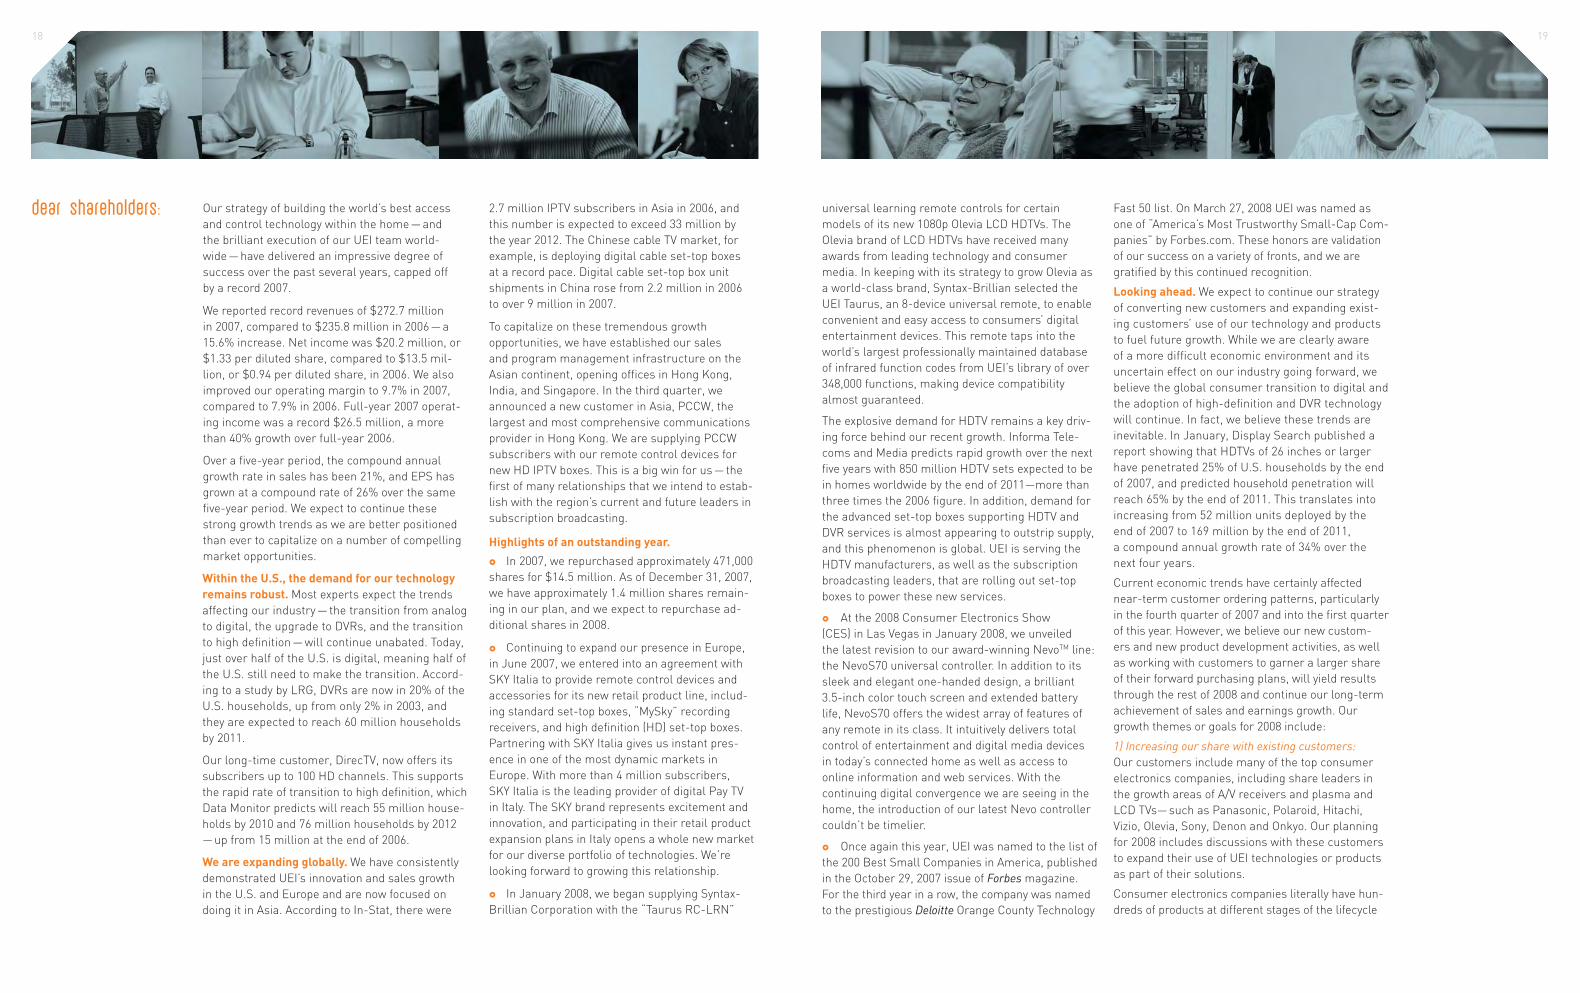
Our strategy of building the world’s best access
and control technology within the home — and
the brilliant execution of our UEI team world-
wide — have delivered an impressive degree of
success over the past several years, capped off
by a record 2007.
We reported record revenues of $272.7 million
in 2007, compared to $235.8 million in 2006 — a
15.6% increase. Net income was $20.2 million, or
$1.33 per diluted share, compared to $13.5 mil-
lion, or $0.94 per diluted share, in 2006. We also
improved our operating margin to 9.7% in 2007,
compared to 7.9% in 2006. Full-year 2007 operat-
ing income was a record $26.5 million, a more
than 40% growth over full-year 2006.
Over a fi ve-year period, the compound annual
growth rate in sales has been 21%, and EPS has
grown at a compound rate of 26% over the same
fi ve-year period. We expect to continue these
strong growth trends as we are better positioned
than ever to capitalize on a number of compelling
market opportunities.
Within the U.S., the demand for our technology
remains robust. Most experts expect the trends
affecting our industry — the transition from analog
to digital, the upgrade to DVRs, and the transition
to high defi nition — will continue unabated. Today,
just over half of the U.S. is digital, meaning half of
the U.S. still need to make the transition. Accord-
ing to a study by LRG, DVRs are now in 20% of the
U.S. households, up from only 2% in 2003, and
they are expected to reach 60 million households
by 2011.
Our long-time customer, DirecTV, now offers its
subscribers up to 100 HD channels. This supports
the rapid rate of transition to high defi nition, which
Data Monitor predicts will reach 55 million house-
holds by 2010 and 76 million households by 2012
— up from 15 million at the end of 2006.
We are expanding globally. We have consistently
demonstrated UEI’s innovation and sales growth
in the U.S. and Europe and are now focused on
doing it in Asia. According to In-Stat, there were
2.7 million IPTV subscribers in Asia in 2006, and
this number is expected to exceed 33 million by
the year 2012. The Chinese cable TV market, for
example, is deploying digital cable set-top boxes
at a record pace. Digital cable set-top box unit
shipments in China rose from 2.2 million in 2006
to over 9 million in 2007.
To capitalize on these tremendous growth
opportunities, we have established our sales
and program management infrastructure on the
Asian continent, opening offi ces in Hong Kong,
India, and Singapore. In the third quarter, we
announced a new customer in Asia, PCCW, the
largest and most comprehensive communications
provider in Hong Kong. We are supplying PCCW
subscribers with our remote control devices for
new HD IPTV boxes. This is a big win for us — the
fi rst of many relationships that we intend to estab-
lish with the region’s current and future leaders in
subscription broadcasting.
Highlights of an outstanding year.
In 2007, we repurchased approximately 471,000
shares for $14.5 million. As of December 31, 2007,
we have approximately 1.4 million shares remain-
ing in our plan, and we expect to repurchase ad-
ditional shares in 2008.
Continuing to expand our presence in Europe,
in June 2007, we entered into an agreement with
SKY Italia to provide remote control devices and
accessories for its new retail product line, includ-
ing standard set-top boxes, “MySky” recording
receivers, and high defi nition (HD) set-top boxes.
Partnering with SKY Italia gives us instant pres-
ence in one of the most dynamic markets in
Europe. With more than 4 million subscribers,
SKY Italia is the leading provider of digital Pay TV
in Italy. The SKY brand represents excitement and
innovation, and participating in their retail product
expansion plans in Italy opens a whole new market
for our diverse portfolio of technologies. We’re
looking forward to growing this relationship.
In January 2008, we began supplying Syntax-
Brillian Corporation with the “Taurus RC-LRN”
Dear Shareholders:
19
universal learning remote controls for certain
models of its new 1080p Olevia LCD HDTVs. The
Olevia brand of LCD HDTVs have received many
awards from leading technology and consumer
media. In keeping with its strategy to grow Olevia as
a world-class brand, Syntax-Brillian selected the
UEI Taurus, an 8-device universal remote, to enable
convenient and easy access to consumers’ digital
entertainment devices. This remote taps into the
world’s largest professionally maintained database
of infrared function codes from UEI’s library of over
348,000 functions, making device compatibility
almost guaranteed.
The explosive demand for HDTV remains a key driv-
ing force behind our recent growth. Informa Tele-
coms and Media predicts rapid growth over the next
fi ve years with 850 million HDTV sets expected to be
in homes worldwide by the end of 2011—more than
three times the 2006 fi gure. In addition, demand for
the advanced set-top boxes supporting HDTV and
DVR services is almost appearing to outstrip supply,
and this phenomenon is global. UEI is serving the
HDTV manufacturers, as well as the subscription
broadcasting leaders, that are rolling out set-top
boxes to power these new services.
At the 2008 Consumer Electronics Show
(CES) in Las Vegas in January 2008, we unveiled
the latest revision to our award-winning NevoTM line:
the NevoS70 universal controller. In addition to its
sleek and elegant one-handed design, a brilliant
3.5-inch color touch screen and extended battery
life, NevoS70 offers the widest array of features of
any remote in its class. It intuitively delivers total
control of entertainment and digital media devices
in today’s connected home as well as access to
online information and web services. With the
continuing digital convergence we are seeing in the
home, the introduction of our latest Nevo controller
couldn’t be timelier.
Once again this year, UEI was named to the list of
the 200 Best Small Companies in America, published
in the October 29, 2007 issue of Forbes magazine.
For the third year in a row, the company was named
to the prestigious Deloitte Orange County Technology
Fast 50 list. On March 27, 2008 UEI was named as
one of “America’s Most Trustworthy Small-Cap Com-
panies” by Forbes.com. These honors are validation
of our success on a variety of fronts, and we are
gratifi ed by this continued recognition.
Looking ahead. We expect to continue our strategy
of converting new customers and expanding exist-
ing customers’ use of our technology and products
to fuel future growth. While we are clearly aware
of a more diffi cult economic environment and its
uncertain effect on our industry going forward, we
believe the global consumer transition to digital and
the adoption of high-defi nition and DVR technology
will continue. In fact, we believe these trends are
inevitable. In January, Display Search published a
report showing that HDTVs of 26 inches or larger
have penetrated 25% of U.S. households by the end
of 2007, and predicted household penetration will
reach 65% by the end of 2011. This translates into
increasing from 52 million units deployed by the
end of 2007 to 169 million by the end of 2011,
a compound annual growth rate of 34% over the
next four years.
Current economic trends have certainly affected
near-term customer ordering patterns, particularly
in the fourth quarter of 2007 and into the fi rst quarter
of this year. However, we believe our new custom-
ers and new product development activities, as well
as working with customers to garner a larger share
of their forward purchasing plans, will yield results
through the rest of 2008 and continue our long-term
achievement of sales and earnings growth. Our
growth themes or goals for 2008 include:
1) Increasing our share with existing customers: Our customers include many of the top consumer
electronics companies, including share leaders in
the growth areas of A/V receivers and plasma and
LCD TVs — such as Panasonic, Polaroid, Hitachi,
Vizio, Olevia, Sony, Denon and Onkyo. Our planning
for 2008 includes discussions with these customers
to expand their use of UEI technologies or products
as part of their solutions.
Consumer electronics companies literally have hun-
dreds of products at different stages of the lifecycle
20
at any given time, and we work with them on a vari-
ety of levels, supplying a share of their chips and/or
control devices for some or all of their products.
Our goal is and always has been to earn more and
more of their business. We start our relationships
with a few successful projects and build on them to
supply a more substantial portion of their business
over time.
The same is true for our subscription broadcasting
customers. In many cases, we do not have 100%
of their business, and an opportunity exists to
capture more of it by demonstrating our technolog-
ically superior products and great service. It is our
expectation that, through these numerous relation-
ships and detailed discussions with these custom-
ers, we can earn a greater share of their business
throughout 2008.
2) Acquiring new customers in historically strong regions and expanding into new regions: I have
already touched on establishing offi ces in Hong
Kong, Singapore, and India in an effort to gain a
strong foothold in Asia, along with our continued
presence in Japan. Almost all market experts have
predicted that Asia will experience signifi cantly
more growth than any other region of the world
over the next fi ve to ten years.
Our newly established Asian presence is already
beginning to produce results. Since late last year,
we have added a number of new customers on
the continent and will enjoy revenue from these
relationships throughout 2008. Some of these
customers have requested we withhold the award
announcements to help them maintain privacy;
and for other customers, we hope to release formal
announcements soon.
Additionally, our sales team has continued to
focus on potential customers based in the U.S.
and Europe, where UEI is long established. These
efforts have also paid off. We anticipate the an-
nouncement of some key sales wins during 2008.
3) Continuing to develop new products and technologies. UEI still leads the industry in inno-
vation, and we will continue to develop and bring
to market new technologies and products that
redefi ne ease of use and set up. We are now enter-
ing the late stage of development on some exciting
new products, some of which will be able to achieve
price points that will bring an unprecedented blend
of functionality and ease-of-use to the widest pos-
sible market. Some of these products have already
been presented to potential customers for their
input, and the reaction has been universally posi-
tive. These products will incorporate both wired and
wireless technologies, and we will provide more
details on them as the year progresses, particu-
larly around important trade events in the May and
August-September timeframes.
As you can see, we have a lot of exciting develop-
ments in the works, so I remain very enthusiastic
about what lies ahead. In closing, I also want to
extend my sincere appreciation to our board of
directors and worldwide partners, and to you, our
shareholders, for your continued support. The
coming years promise to be very exciting as our
innovative solutions continue to transform the
digital media environment.
Sincerely,
Paul Arling
Chairman and
Chief Executive Offi cer
10k
UNITED STATES SECURITIES AND EXCHANGE COMMISSIONWASHINGTON, D.C. 20549
FORM 10-KFOR ANNUAL AND TRANSITION REPORTS
PURSUANT TO SECTIONS 13 OR15(d) OF THE SECURITIES EXCHANGE ACT OF 1934
(Mark One) � ANNUAL REPORT PURSUANT TO SECTION 13 OR 15(d) OF THE SECURITIES EXCHANGE ACT OF 1934
For the fiscal year ended December 31, 2007
OR
� TRANSITION REPORT PURSUANT TO SECTION 13 OR 15(d) OF THE SECURITIES EXCHANGE ACT OF 1934
For the transition period from to
Commission File Number: 0-21044
UNIVERSAL ELECTRONICS INC.(Exact Name of Registrant as Specified in its Charter)
Delaware 33-0204817(State or Other Jurisdiction (I.R.S. Employer
of Incorporation or Organization) Identification No.)
6101 Gateway DriveCypress, California 90630
(Address of Principal Executive Offices) (Zip Code)
Registrant’s telephone number, including area code: (714) 820-1000
Securities registered pursuant to Section 12(b) of the Act:
Common Stock, par value $.01 per share Nasdaq Global Select Market(Title of Class) (Name of each exchange on which registered)
Securities registered pursuant to Section 12(g) of the Act:None
Indicate by check mark if whether the registrant is a well-known seasoned issuer (as defined in Rule 405 of the Securities Act).Yes � No �
Indicate by check mark if the registrant is not required to file reports pursuant to Section 13 or Section 15(d) of the Act. Yes � No �
Indicate by check mark whether the registrant (1) has filed all reports required to be filed by Section 13 or 15(d) of the Securities Exchange Act of 1934 during the preceding 12 months, and (2) has been subject to such filing requirements for the past 90 days.
Yes � No �
Indicate by check mark if disclosure of delinquent filers pursuant to Item 405 of Regulation S-K is not contained herein, and will not be contained, to the best of registrant’s knowledge, in definitive proxy or information statements incorporated by reference in Part III of the Form 10-K or any amendment to this Form 10-K. �
Indicate by check mark whether the registrant is a large accelerated filer, an accelerated filer, a non-accelerated filer, or a smaller reporting company. See the definitions of “large accelerated filer,” “accelerated filer” and “smaller reporting company” in Rule 12b-2 of the Exchange Act. (Check one):
Large accelerated filer � Accelerated filer � Non-accelerated filer � Smaller Reporting Company �(Do not check if a smaller reporting company)
Indicate by check mark whether the registrant is a shell company (as defined in Rule 12b-2 of the Act). Yes � No �
The aggregate market value of the voting and non-voting common equity held by non-affiliates of the registrant as of June 30, 2007, the last business day of the registrant’s most recently completed second fiscal quarter was $469,563,193, based upon the closing sale price as reported on the NASDAQ Global Select Market for that date.
As of March 11, 2008, 14,591,875 shares of Common Stock, par value $.01 per share, of the registrant were outstanding.
DOCUMENTS INCORPORATED BY REFERENCE:
Portions of the registrant’s notice of annual meeting of shareowners and proxy statement to be filed pursuant to Regulation 14A within 120 days after registrant’s fiscal year end of December 31, 2007 are incorporated by reference into Part III of this
Form 10-K. The Proxy Statement will be filed with the Securities and Exchange Commission no later than April 29, 2008.
Except as otherwise stated, the information contained in this Form 10-K is as of December 31, 2007.
Exhibit Index appears on page 80. This document contains 83 pages.
DH
M B
P -
3868
0_10
K_7
- P
age
1 of
84
- Apr
4, 2
008
- 10:
01:1
6 A
M -
Bla
ck
UNIVERSAL ELECTRONICS INC.Annual Report on Form 10-K
For the Fiscal Year Ended December 31, 2007
Table of Contents
Item Page Number Number
PART I 1 Business .......................................................................................................................... 3 1A Risk Factors ..................................................................................................................... 9 1B Unresolved Staff Comments............................................................................................ 16 2 Properties......................................................................................................................... 17 3 Legal Proceedings ........................................................................................................... 17 4 Submission of Matters to a Vote of Security Holders ...................................................... 18
PART II
5 Market for Registrant’s Common Equity and Related Stockholder Matters .................... 19 6 Selected Consolidated Financial Data............................................................................. 20 7 Management’s Discussion and Analysis of Financial Condition and Results of
Operations ....................................................................................................................... 21 7A Quantitative and Qualitative Disclosures About Market Risk .......................................... 36 8 Financial Statements and Supplementary Data .............................................................. 37 9 Changes in and Disagreements with Accountants on Accounting and Financial
Disclosure ........................................................................................................................ 74 9A Controls and Procedures ................................................................................................. 74 9B Other Information............................................................................................................. 76
PART III
10 Directors, Executive Officers and Corporate Governance .............................................. 77 11 Executive Compensation ................................................................................................. 77 12 Security Ownership of Certain Beneficial Owners and Management and Related
Stockholder Matters......................................................................................................... 77 13 Certain Relationships and Related Transactions, and Director Independence............... 78 14 Principal Accountant Fees and Services ......................................................................... 78
PART IV
15 Exhibits and Financial Statement Schedules .................................................................. 78 Signatures........................................................................................................................ 79 Exhibit Index .................................................................................................................... 80 D
HM
BP
- 38
680_
10K
_7.p
df -
Pag
e 2
of 8
4 - A
pr 4
, 200
8 - 1
0:01
:16
AM
- B
lack
Forward-Looking Statements
This Annual Report on Form 10-K, including “Management’s Discussion and Analysis of Financial Condition and Results of Operations” in Item 7, contains statements that may constitute forward-looking statements within the meaning of the Private Securities Litigation Reform Act of 1995. These statements involve risks, uncertainties and assumptions. If the risks or uncertainties ever materialize or the assumptions prove incorrect, our results may differ materially from those expressed or implied by such forward-looking statements and assumptions. All statements other than statements of historical fact are statements that could be deemed forward-looking statements, including but not limited to any projections of revenue, margins, expenses, tax provisions, earnings, cash flows, benefit obligations, share repurchases or other financial items; any statements of the plans, strategies and objectives of management for future operations; any statements concerning expected development or relating to products or services; any statements regarding future economic conditions or performance; any statements regarding pending claims or disputes; any statements of expectation or belief; and any statements of assumptions underlying any of the foregoing. Risks, uncertainties and assumptions include macroeconomic and geopolitical trends and events; the execution and performance of contracts by customers, suppliers and partners; the challenge of managing asset levels, including inventory; the difficulty of aligning expense levels with revenue changes; the outcome of pending legislation and accounting pronouncements; and other risks that are described herein, including but not limited to the items discussed in “Risk Factors” in Item 1A of this report, and that are otherwise described from time to time in our Securities and Exchange Commission reports filed after the date of filing this report. We assume no obligation and do not intend to update these forward-looking statements.
PART I
ITEM 1. BUSINESS
Business of Universal Electronics Inc.
Universal Electronics Inc. was incorporated under the laws of Delaware in 1986 and began operations in 1987. The principal executive offices are located at 6101 Gateway Drive, Cypress, California 90630. As used herein, the terms “we”, “us” and “our” refer to Universal Electronics Inc. and its subsidiaries unless the context indicates to the contrary.
Additional information regarding UEI can be obtained at www.uei.com.
Business Segment
Overview
Our business is comprised of one reportable segment. We have developed a broad line of easy-to-use, pre-programmed universal wireless control products and audio-video accessories that are marketed to enhance home entertainment systems. Additionally, we develop software and firmware solutions that can enable devices such as TVs, set-top boxes, stereos, automotive audio systems, cell phones and other consumer electronic products to wirelessly connect and interact with home networks and interactive services to deliver digital entertainment and information.
Principal Markets
Our primary markets include retail, private label, OEMs, custom installers, automobile, cellular phone, subscription broadcasting, cable and satellite service providers and companies in the computing industry. We believe that our universal remote control database is capable of controlling virtually all infrared remote (“IR”) controlled TVs, VCRs, DVD players, cable converters, CD players, audio components and satellite receivers, as well as most other infrared remote controlled home entertainment devices and home automation control modules worldwide.
3
DH
M B
P -
3868
0_10
K_7
- P
age
3 of
84
- Apr
4, 2
008
- 10:
01:1
6 A
M -
Bla
ck
We provide subscription broadcasters, namely cable operators and satellite service providers, both domestically and internationally, with our wireless control devices and integrated circuits, on which our software is embedded, to support the demand associated with the deployment of digital set-top boxes that contain the latest technology and features. We also sell our universal wireless control devices and integrated circuits, on which our software is embedded, to OEMs that manufacture cable converters and satellite receivers for resale with their products.
We continue to pursue further penetration of the more traditional consumer electronics/OEM markets. Customers in these markets generally package our wireless control devices for resale with their audio and video home entertainment products. We also sell customized chips, which include our software and/or customized software packages, to these customers. Growth in this line of business has been driven by the proliferation and increasing complexity of home entertainment equipment, emerging digital technology, multimedia and interactive internet applications, and the number of OEMs.
We also continue to place significant emphasis on expanding our sales and marketing efforts to subscription broadcasters and OEMs in Asia, Latin America and Europe. We will continue to add new sales people to support anticipated sales growth in these markets over the next few years.
In the international retail markets, our One For All® brand name products accounted for 17.9%, 20.4%, and 25.4% of our total sales for the years ended December 31, 2007, 2006 and 2005, respectively. Throughout 2007, we continued our retail sales and marketing efforts in Europe, Australia, New Zealand, South Africa, the Middle East, Mexico and selected countries in Asia and Latin America. Financial information relating to our international operations for the years ended December 31, 2007, 2006 and 2005 is included in “ITEM 8. FINANCIAL STATEMENTS AND SUPPLEMENTARY DATA-Notes to Consolidated Financial Statements-Note 19”.
By providing our wireless control technology in many forms, including finished products and microcontrollers on which our software is embedded, we can meet the needs of our customers, enabling those who manufacture or subcontract their manufacturing requirements to use existing sources of supply and more easily incorporate our technology.
Since our beginning in 1986, we have compiled an extensive library that covers nearly 348,000 individual device functions and over 3,300 individual consumer electronic equipment brand names. Our library is regularly updated with new infrared (“IR”) codes used in newly introduced audio and video devices. All such IR codes are captured from the original manufacturer’s remote control devices or written specifications to ensure the accuracy and integrity of the database.
Our proprietary software and know-how permit us to compress the IR codes before being loaded into our products. This provides significant cost and space efficiencies that enable us to include more codes and features in the memory space of the wireless control devices than are included in the similarly priced products of our competitors.
With today’s rapidly changing technology, upgradeability ensures on-going compatibility with current and future devices. We have developed patented technology that provides the capability to easily upgrade the memory of our wireless control devices by adding IR codes from our library that were not originally included. These upgrade features, at no additional cost to the consumer, provide customers with the ability to upgrade our wireless devices remotely using a personal computer or telephone, and directly at the factory or service locations. These upgrade options utilize one-way or two-way communication to upgrade the wireless devices’ codes or data depending on the requirements.
Each of our wireless control devices is designed to simplify the use of audio, video and other devices. To appeal to the mass market, the number of buttons is minimized to include only the most popular functions. Another patented ease of use feature we offer in several of our products is our user programmable macro key. This feature allows the user to program a sequence of commands onto a single key, to be played back each time that key is subsequently pressed.
4
DH
M B
P -
3868
0_10
K_7
- P
age
4 of
84
- Apr
4, 2
008
- 10:
01:1
6 A
M -
Bla
ck
Our remotes are also designed for ease of set-up. For most of our products, the consumer simply inputs a four-digit code for each video or audio device to be controlled. During 2007, building on our strategy to develop new products and technologies to further simplify remote set-up, we created the Stealth USB product and the EZ Web remote control set-up application. The Stealth USB is a remote control device that utilizes a monochrome LCD display to augment the user experience for both set-up and operation. In addition the Stealth USB has a mini USB port that can be connected to a personal computer using a USB cable. Once connected to a personal computer, our customers can utilize the EZ Web remote control set-up application’s graphical interface to fully program their remote control. Another product we developed during 2007 is automated set-up method that utilizes a set-top box. This product, designed for subscription broadcasters, will help to simplify the end user’s set-up experience by allowing the user to interface with their set-top box, using their television, to program a remote. The set-top box can memorize the set-up parameters allowing the user to restore the set-up to a new or existing remote.
Wireless networking is one of today’s fastest growing trends. Combining our connectivity software and patent portfolio with Universal Plug-n-Play (“UPnP”) standards and the 802.11 wireless networking protocols, we developed our Nevo® product line. NevoSL®, which began shipping during the second quarter of 2005, is a stand alone universal wireless controller that uses Wi-Fi to control the play back or viewing of MP3s, photos, and videos stored on a PC, through a media player attached to a home entertainment center. By utilizing the touch screen user interface, customers can select play lists, slide shows, or videos to be played via the media player from anywhere within the networks range. In addition, NevoSL® utilizes infrared technology to control virtually all infrared controlled consumer electronic devices, and can also be utilized to control wireless household appliances.
Building on the Nevo line, in 2007 we launched three new products for the custom installer market: NevoQ50®; NevoConnect® NC-50 base station; and NevoStudio Pro® programming software. NevoQ50® and NevoConnect include Z-wave™ functionality to enable bi-directional RF control to take full advantage of Z-Wave “mesh networking” technologies, improving the range and increasing the reliability of signal transmissions. Voltage sensing and video state detection allows the controller to detect whether AV equipment is on or off for improved macro execution. NevoStudio Pro has been updated with an easy wizard interface, drag and drop programming, and the ability to generate configuration files for both the remote and base station simultaneously within a single application.
In January 2008, we continued to broaden our line of advanced function remotes for the custom installer market with the release of NevoS70®. The NevoS70 combines all the technology of the Nevo Q50 with access to web-based services to deliver real-time information such as news, sports and stock quotes; extended battery life; and the ability to view and control any device that has a compatible embedded web server, such as many web-based cameras and media servers. The Nevo® product line supports the attainment of our strategic goal to build our presence as a wireless control technology leader, enabling consumers to wirelessly connect, control, and interact within the ever-increasingly complex home.
Methods of Distribution and Customers
We have developed a broad portfolio of patented technologies and the industry’s leading database of home connectivity software. We include our technology in a broad family of products including universal standard and touch screen remote controls, antennas and various audio/video accessories, as well as custom and customizable microcontrollers. To a lesser extent, we also license our technology to certain customers, including leading Fortune 500 companies.
In addition, we sell our services and license our software to OEMs operating in the consumer electronics, automobile, cellular phone, and subscription broadcasting industries for use in their products. Licenses are delivered upon the transfer of a product master or on a per unit basis when the software is loaded onto the OEM’s device.
5
DH
M B
P -
3868
0_10
K_7
- P
age
5 of
84
- Apr
4, 2
008
- 10:
01:1
6 A
M -
Bla
ck
In the United States, we sell our products to cable operators, satellite service providers, private label customers, consumer electronics accessory manufacturers and companies in the computing industry for resale under their respective brand names. In addition, we sell our wireless control products, and to a lesser extent, license our proprietary technologies to OEMs for use in their products. We also license our One For All® brand name to a third party, who in turn sells the products directly to certain domestic retailers.
Outside the United States, we sell our wireless control devices and certain accessories under the OneFor All® and certain other brand names under private labels to retailers, and to other customers, through our international subsidiaries. Third party distributors are utilized in countries where we do not have subsidiaries. We also sell our products and/or license our proprietary technology to OEMs, cable operators and satellite service providers internationally.
We have eleven international subsidiaries, Universal Electronics B.V., established in the Netherlands, One For All GmbH and Ultra Control Consumer Electronics GmbH, both established in Germany, One for All Iberia S.L., established in Spain, One For All UK Ltd., established in the United Kingdom, One For All Argentina S.R.L., established in Argentina, One For All France S.A.S., established in France, Universal Electronics Italia S.R.L., established in Italy, UE Singapore Pte. Ltd., established in Singapore, UEI Hong Kong Pte. Ltd., established in Hong Kong and UEI Electronics Pte. Ltd., established in India.
For the years ended December 31, 2007, 2006 and 2005, our sales to Comcast Communications, Inc., represented 13.3%, 12.0% and 12.2% of our net sales, respectively. No other single customer accounted for 10% or more of our net sales in 2007, 2006 or 2005. However, DirecTV and its subcontractors collectively accounted for 16.9%, 17.7% and 16.6% of our net sales for the years ended December 31, 2007, 2006 and 2005, respectively.
We provide domestic and international consumer support to our various universal remote control marketers, including manufacturers, cable and satellite providers, retail distributors, and audio and video original equipment manufacturers through our automated “InterVoice” system. Live agent help is available through certain programs. We also make available a free web-based support resource, urcsupport.com, designed specifically for cable subscribers. This solution offers interactive online demos and tutorials to help users easily setup their remote and commands, and as a result reduces call volume at customer support centers. Additionally, ActiveSupport®, a call center, provides customer interaction management services from service and support to retention. Pre-repair calls, post-install surveys, and inbound calls to customers provide greater bottom-line efficiencies. We continue to review our programs to determine their value in enhancing and improving the sales of our products. As a result of this continued review, some or all of these programs may be modified or discontinued in the future and new programs may be added.
Raw Materials and Dependence on Suppliers
We utilize third-party manufacturers and suppliers primarily in Asia to produce our wireless control products. In 2007, Computime, C.G. Development and Samsung each provided more than 10% of our total inventory purchases. They collectively provided 63.2% of our total inventory purchases for 2007. In 2006, Computime, C.G. Development, Freescale and Jetta each provided more than 10% of our total inventory purchases. They collectively provided 60.9% of our total inventory purchases for 2006. In 2005, Computime provided more than 10% of our total inventory purchase, representing 33.9% of our total inventory purchases.
As in the past, we continue to evaluate alternative and additional third-party manufacturers and sources of supply. During 2007, we continued to utilize multiple suppliers and maintain duplicate tooling for certain of our products. This has allowed us to stabilize our source for products and negotiate more favorable terms with our suppliers. In addition, where we can, we use standard parts and components, which are available from multiple sources. To continue to reduce our dependence on suppliers, we continue to seek additional sources of integrated circuit chips to help reduce the potential for manufacturing and shipping delays. In addition, we have included flash microcontroller technology in some of our products. Flash microcontrollers can have shorter lead times than standard microcontrollers and may be reprogrammed if necessary, thus potentially reducing excess or obsolete inventory exposure.
6
DH
M B
P -
3868
0_10
K_7
- P
age
6 of
84
- Apr
4, 2
008
- 10:
01:1
6 A
M -
Bla
ck
Patents, Trademarks and Copyrights
We own a number of United States and foreign patents related to our products and technology, and have filed domestic and foreign applications for other patents that are pending. We had a total of 175 and 173 issued and pending patents at the end of 2007 and 2006, respectively. Our patents have remaining lives ranging from approximately one to eighteen years. We have also obtained copyright registration and claim copyright protection for certain of our proprietary software and libraries of IR codes. Additionally, the names of most of our products are registered or are being registered as trademarks in the United States Patent and Trademark Office and in most of the other countries in which such products are sold. These registrations are valid for a variety of terms ranging up to 20 years and may be renewed as long as the trademarks continue to be used and are deemed by management to be important to our operations. While we follow the practice of obtaining patent, copyright and trademark registrations on new developments whenever advisable, in certain cases, we have elected common law trade secret protection in lieu of obtaining such other protection.
Seasonality
Historically, our business has been influenced by the retail sales cycle, with increased sales in the last half of the year and the largest proportion of sales occurring in the last quarter. However, during 2007, sales in the first half of the year exceeded sales in the second half of the year. This was primarily due to the increased demand in the first and second quarters of 2007 from cable customers in an effort to meet the July 1, 2007 Open Cable Applications Platform (“OCAP”) standards deadline in the United States. We expect the sales cycle to return to its historical pattern in 2008.
See “ITEM 8. FINANCIAL STATEMENTS AND SUPPLEMENTARY DATA—Notes to the Consolidated Financial Statements-Note 22” for further details regarding our quarterly results.
Competition
Our principal competitors in the international retail and private label markets for our wireless controls include Philips, Thomson and Sony as well as various manufacturers of wireless controls in Asia. Our primary competitors in the OEM market are the original equipment manufacturers themselves and wireless control manufacturers in Asia. Our NevoSL® product competes in the custom electronics installation market against AMX, RTI, Universal Remote Control, Philips, Logitech and many others. We compete in our markets on the basis of product quality, product features, price, intellectual property and customer and consumer support. We believe that we will need to continue to introduce new and innovative products to remain competitive and to recruit and retain competent personnel to successfully accomplish our future objectives.
Engineering, Research and Development
During 2007, our engineering efforts focused on modifying existing products and technologies to improve features, to lower costs, and to develop measures to protect our proprietary technology and general know-how. In addition, we continue to regularly update our library of IR codes to include IR codes for new features and devices introduced worldwide. We also continue to explore ways to improve our software to pre-program more codes into our memory chips and to simplify the upgrading of our wireless control products.
We also broadened our product portfolio with solutions that address emerging technology sectors like home media distribution and home automation. These advanced technology development efforts focused on both industry-based standards as well as specific universal extensions that maximize the end user experience utilizing a set of heterogeneous protocols and technologies that exist in the modern home today. This environment is driving the need for simplification of these new protocols and devices, since they were originally engineered and targeted towards the enterprise customer. We created the Nevo® product offerings to simplify and manage the end user’s experience interacting with devices in the home — devices that may be used for a decade or more, including traditional IR based devices, and the more
7
DH
M B
P -
3868
0_10
K_7
- P
age
7 of
84
- Apr
4, 2
008
- 10:
01:1
6 A
M -
Bla
ck
complex TCP/IP consumer electronic devices utilizing both open and proprietary protocols. During 2007 we also focused on developing and marketing additional products that are based on the Zigbee, Z-Wave® and other radio frequency technology.
We also developed technologies aimed at unifying traditional technologies that are encountered within a home, and emerging technologies. This allows consumers to deploy our solutions ranging from a simple IR based audio-visual stack to a modern digital media management experience allowing access to digital content such as music, pictures and videos.
Our personnel are involved with various industry organizations and bodies, which are in the process of setting standards for infrared, radio frequency, power line, telephone and cable communications and networking in the home. There can be no assurance that any of our research and development projects will be successfully completed.
Our expenditures on engineering, research and development were:
2007 2006 2005 (in millions):
Research and Development (1).................................................................................. $ 8.8 $ 7.4 $ 6.6Engineering (2) ........................................................................................................... 3.9
5.0 5.1
Total Engineering, Research and Development ....................................................... $ 12.7 $ 12.4 $ 11.7____________(1) Research and Development expense for 2007 and 2006 include stock-based compensation expense
of $0.4 million and $0.4 million, respectively.
(2) Engineering costs are included in SG&A.
Environmental Matters
Many of our products are subject to various federal, state, local and international laws governing chemical substances in products, including laws regulating the manufacture and distribution of chemical substances and laws restricting the presence of certain substances in electronics products. We could incur substantial costs, including cleanup costs, fines and civil or criminal sanctions, third-party damage or personal injury claims, if we were to violate or become liable under environmental laws or if our products become non-compliant with environmental laws. We also face increasing complexity in our product design and procurement operations as we adjust to new and future requirements relating to the materials composition of our products.
We also could face significant costs and liabilities in connection with product take-back legislation. The European Union (the “EU”) enacted the Waste Electrical and Electronic Equipment Directive, which makes producers of electrical goods, including computers and printers, financially responsible for specified collection, recycling, treatment and disposal of past and future covered products. During 2007 the majority of our European subsidiaries became WEEE compliant. Our Italian subsidiary became compliant in February 2008. Similar legislation has been or may be enacted in other jurisdictions, including in the United States, Canada, Mexico, China and Japan.
We believe that we have materially complied with all currently existing international and domestic federal, state and local statutes and regulations regarding environmental standards and occupational safety and health matters to which we are subject. During the years ended December 31, 2007, 2006 and 2005, the amounts incurred in complying with federal, state and local statutes and regulations pertaining to environmental standards and occupational safety and health laws and regulations did not materially affect our earnings or financial condition. However, future events, such as changes in existing laws and regulations or enforcement policies, may give rise to additional compliance costs that could have a material adverse effect upon our capital expenditures, earnings or financial condition.
8
DH
M B
P -
3868
0_10
K_7
- P
age
8 of
84
- Apr
4, 2
008
- 10:
01:1
6 A
M -
Bla
ck
Employees
At December 31, 2007, we employed 397 employees, of whom 136 work in engineering and research and development, 68 in sales and marketing, 78 in consumer service and support, 44 in operations and warehousing and 71 are executive and administrative staff. None of our employees are subject to a collective bargaining agreement or represented by a union. We consider our employee relations to be good.
International Operations
Financial information relating to our international operations for the years ended December 31, 2007, 2006 and 2005 is included in “ITEM 8. FINANCIAL STATEMENTS AND SUPPLEMENTARY DATA-Notes to Consolidated Financial Statements-Note 19”.
Available Information
Our Internet address is www.uei.com. We make available free of charge through the website our annual report on Form 10-K, our quarterly reports on Form 10-Q, our current reports on Form 8-K and any amendments to these reports as soon as reasonably practical after we electronically file such reports with the Securities and Exchange Commission. These reports can be found on our website at www.uei.com under the caption “SEC Filings” on the Investor page. Investors can also obtain copies of our SEC filings from the SEC website at www.sec.gov.
ITEM 1A. RISK FACTORS
Forward Looking Statements
We caution that the following important factors, among others (including but not limited to factors discussed below in “Management’s Discussion and Analysis of Financial Condition and Results of Operations,” as well as those factors discussed elsewhere in this Annual Report on Form 10-K, or in our other reports filed from time to time with the Securities and Exchange Commission), could affect our actual results and could contribute to or cause our actual consolidated results to differ materially from those expressed in any of our forward-looking statements. The factors included here are not exhaustive. Further, any forward-looking statement speaks only as of the date on which such statement is made, and we undertake no obligation to update any forward-looking statement to reflect events or circumstances after the date on which such statement is made or to reflect the occurrence of unanticipated events. New factors emerge from time to time, and it is not possible for management to predict all such factors, nor can we assess the impact of each such factor on the business or the extent to which any factor, or combination of factors, may cause actual results to differ materially from those contained in any forward-looking statements. Therefore, forward-looking statements should not be relied upon as a prediction of actual future results.
While we believe that the forward looking statements made in this report are based on reasonable assumptions, the actual outcome of such statements is subject to a number of risks and uncertainties, including the failure of our markets to continue growing and expanding in the manner we anticipated; the failure of our customers to grow and expand as we anticipated; the effects of natural or other events beyond our control, including the effect a war or terrorist activities may have on us or the economy; the economic environment’s effect on us or our customers; the growth of, acceptance of and the demand for our products and technologies in various markets and geographical regions, including cable, satellite, consumer electronics, retail, digital media/technology, CEDIA, interactive TV, automotive, and cellular industries not materializing or growing as we believed; our inability to add profitable complementary products which are accepted by the marketplace; our inability to continue to maintain our operating costs at acceptable levels through our cost containment efforts; our inability to realize tax benefits from various tax projects initiated from time to time; our inability to maintain the strength of our balance sheet; our inability to continue selling our products or licensing our technologies at higher or profitable margins; our inability to obtain orders or maintain our order volume with new and existing customers; the possible
9
DH
M B
P -
3868
0_10
K_7
- P
age
9 of
84
- Apr
4, 2
008
- 10:
01:1
6 A
M -
Bla
ck
dilutive effect our stock option program may have on our earnings per share and stock price; our inability to continue to obtain adequate quantities of component parts or secure adequate factory production capacity on a timely basis; and other factors listed from time to time in our press releases and filings with the Securities and Exchange Commission.
Dependence upon Key Suppliers
During 2007, three sources, Computime, C.G. Development and Samsung, each provided over ten percent (10%) of our total inventory purchases. Purchases from these suppliers collectively amounted to $100.7 million, or 63.2%, of total inventory purchases during 2007. Purchases with the same suppliers collectively amounted to $66.1 million and $49.8 million, representing 48.7% and 47.6%, of total inventory purchases in 2006 and 2005, respectively. In 2006, two other suppliers provided over 10% of our inventory purchases. These two suppliers collectively provided $28.1 million or 20.7% of our total inventory purchases in 2006.
Most of the components used in our products are available from multiple sources. However, we have elected to purchase integrated circuits, used principally in our wireless control products, from two sources, Freescale and Samsung. We generally maintain inventories of our integrated chips, which could be used in part to mitigate, but not eliminate, delays resulting from supply interruptions.
In addition, we have identified alternative sources of supply for our integrated circuit, component parts, and finished goods needs; however, there can be no assurance that we will be able to continue to obtain these inventory purchases on a timely basis. Any extended interruption, shortage or termination in the supply of any of the components used in our products, or a reduction in their quality or reliability, or a significant increase in prices of components, would have an adverse effect on our business, results of operations and cash flows.
Dependence on Foreign Manufacturing
Third-party manufacturers located in Asia manufacture a majority of our products. Our arrangements with our foreign manufacturers are subject to the risks of doing business abroad, such as tariffs, environmental and trade restrictions, intellectual property protection and enforcement, export license requirements, work stoppages, political and social instability, economic and labor conditions, foreign currency exchange rate fluctuations, and other factors, which could have a material adverse effect on our business, results of operations and cash flows. We believe that the loss of any one or more of our manufacturers would not have a long-term material adverse effect on our business, results of operations and cash flows, because numerous other manufacturers are available to fulfill our requirements; however, the loss of any of our major manufacturers could adversely affect our business until alternative manufacturing arrangements are secured.
Potential Fluctuations in Quarterly Results
Historically, our business has been influenced by the retail sales cycle, with increased sales in the last half of the year and the largest proportion of sales occurring in the last quarter. However, during 2007, sales in the first half of the year exceeded sales in the second half of the year. This was primarily due to the increased demand in the first and second quarters of 2007 from cable customers in an effort to meet the July 1, 2007 OCAP standards deadline in the United States. While we expect the sales cycle to return to its historical pattern in 2008, factors, such as those we experienced during 2007 could cause our sales cycles to deviate from historical patterns. Such factors, including quarterly variations in financial results, could have a material adverse affect on the volatility and market price of our common stock.
We may from time to time increase our operating expenses to fund greater levels of research and development, sales and marketing activities, development of new distribution channels, improvements in our operational and financial systems and development of our customer support capabilities, and to support our efforts to comply with various government regulations. To the extent such expenses precede or are not subsequently followed by increased revenues, our business, operating results, financial condition and cash flows will be adversely affected.
10
DH
M B
P -
3868
0_10
K_7
- P
age
10 o
f 84
- Apr
4, 2
008
- 10:
01:1
6 A
M -
Bla
ck
In addition, we may experience significant fluctuations in future quarterly operating results that may be caused by many other factors, including demand for our products, introduction or enhancement of products by us and our competitors, the loss or acquisition of any significant customers, market acceptance of new products, price reductions by us or our competitors, mix of distribution channels through which our products are sold, product or supply constraints, level of product returns, mix of customers and products sold, component pricing, mix of international and domestic revenues, foreign currency exchange rate fluctuations and general economic conditions. In addition, as a strategic response to changes in the competitive environment, we may from time to time make certain pricing or marketing decisions or acquisitions that could have a material adverse effect on our business, results of operations or financial condition. As a result, we believe period-to-period comparisons of our results of operations are not necessarily meaningful and should not be relied upon as an indication of future performance.
Due to all of the foregoing factors, it is possible that in some future quarters our operating results will be below the expectations of public market analysts and investors. If this happens the price of our common stock may be materially adversely affected.
Dependence on Consumer Preference
We are susceptible to fluctuations in our business based upon consumer demand for our products. In addition, we cannot guarantee that increases in demand for our products associated with increases in the deployment of new technology will continue. We believe that our success depends on our ability to anticipate, gauge and respond to fluctuations in consumer preferences. However, it is impossible to predict with complete accuracy the occurrence and effect of fluctuations in consumer demand over a product’s life cycle. Moreover, we caution that any growth in revenues that we achieve may be transitory and should not be relied upon as an indication of future performance.
Demand for Consumer Service and Support
We have continually provided domestic and international consumer service and support to our customers to add overall value and to help differentiate us from our competitors. We continually review our service and support group and are marketing our expertise in this area to other potential customers. There can be no assurance that we will be able to attract new customers in the future.
In addition, certain of our products have more features and are more complex than others and therefore require more end-user technical support. In some instances, we rely on distributors or dealers to provide the initial level of technical support to the end-users. We provide the second level of technical support for bug fixes and other issues at no additional charge. Therefore, as the mix of our products includes more of these complex product lines, support costs could increase, which would have an adverse effect on our financial condition and results of operations.
Dependence Upon Timely Product Introduction
Our ability to remain competitive in the wireless control and audio/video accessory products market will depend considerably upon our ability to successfully identify new product opportunities, as well as develop and introduce these products and enhancements on a timely and cost effective basis. There can be no assurance that we will be successful at developing and marketing new products or enhancing our existing products, or that these new or enhanced products will achieve consumer acceptance and, if achieved, will sustain that acceptance. In addition, there can be no assurance that products developed by others will not render our products non-competitive or obsolete or that we will be able to obtain or maintain the rights to use proprietary technologies developed by others which are incorporated in our products. Any failure to anticipate or respond adequately to technological developments and customer requirements, or any significant delays in product development or introduction, could have a material adverse effect on our financial condition, results of operations and cash flows.
11
DH
M B
P -
3868
0_10
K_7
- P
age
11 o
f 84
- Apr
4, 2
008
- 10:
01:1
6 A
M -
Bla
ck
In addition, the introduction of new products may require significant expenditures for research and development, tooling, manufacturing processes, inventory and marketing. In order to achieve high volume production of any new product, we may have to make substantial investments in inventory and expand our production capabilities.
Dependence on Major Customers
The economic strength and weakness of our worldwide customers affect our performance. We sell our wireless control products, audio/video accessory products, and proprietary technologies to private label customers, original equipment manufacturers, and companies involved in the subscription broadcasting industry. We also supply our products to our wholly owned, non-U.S. subsidiaries and to independent foreign distributors, who in turn distribute our products worldwide, with Europe, Asia, South Africa, Australia, and Argentina currently representing our principal foreign markets.
In each of the years ended December 31, 2007, 2006 and 2005, we had sales to one customer, Comcast, that amounted to more than 10% of our net sales for the year. In addition, in each of these years, we had sales to DirecTV and its sub-contractors, that when combined, exceeded 10% of our net sales. The loss of either of these customers or of any other key customer, either in the United States or abroad or our inability to maintain order volume with these customers, may have an adverse effect on our financial condition, results of operations and cash flows.
Internal Investments
We employ a small number of personnel to develop and market additional products that are part of the Nevo® platform as well as products that are based on the Zigbee, Z-Wave® and other radio frequency technology. Even after these hires, we continue to use outside resources to assist us in the development of these products. While we believe that such outside services should continue to be available to us, if they cease to be available, the development of these products could be substantially delayed.
Competition
The wireless control industry is characterized by intense competition based primarily on product availability, price, speed of delivery, ability to tailor specific solutions to customer needs, quality, and depth of product lines. Our competition is fragmented across our products, and, accordingly, we do not compete with any one company across all product lines. We compete with a variety of entities, some of which have greater financial resources. Our ability to remain competitive in this industry depends in part on our ability to successfully identify new product opportunities, develop and introduce new products and enhancements on a timely and cost effective basis, as well as our ability to successfully identify and enter into strategic alliances with entities doing business within the industries we serve. There can be no assurance that our product offerings will be, and/or remain, competitive or that strategic alliances, if any, will achieve the type, extent, and amount of success or business that we expect them to achieve. The sales of our products and technology may not occur or grow in the manner we expect, and thus we may not recoup costs incurred in the research and development of these products as quickly as we expect, if at all.
Patents, Trademarks, and Copyrights
The procedures by which we identify, document and file for patent, trademark, and copyright protection are based solely on engineering and management judgment, with no assurance that a specific filing will be issued, or if issued, will deliver any lasting value to us. Because of the rapid innovation of products and technologies that is characteristic of our industry, there is no assurance that rights granted under any patent will provide competitive advantages to us or will be adequate to safeguard and maintain our proprietary rights. Moreover, the laws of certain countries in which our products are or may be manufactured or sold may not offer protection on such products and associated intellectual property to the same extent that the U.S. legal system may offer.
12
DH
M B
P -
3868
0_10
K_7
- P
age
12 o
f 84
- Apr
4, 2
008
- 10:
01:1
6 A
M -
Bla
ck
In our opinion, our intellectual property holdings as well as our engineering, production, and marketing skills and the experience of our personnel are of equal importance to our market position. We further believe that none of our businesses are materially dependent upon any single patent, copyright, trademark, or trade secret.
Some of our products include or use technology and/or components of third parties. While it may be necessary in the future to seek or renew licenses relating to various aspects of such products, we believe that, based upon past experience and industry practice, such licenses generally could be obtained on commercially reasonable terms; however, there is no guarantee that such licenses could be obtained on such terms or at all. Because of technological changes in the wireless and home control industry, current extensive patent coverage, and the rapid rate of issuance of new patents, it is possible certain components of our products and business methods may unknowingly infringe upon the patents of others.
Potential for Litigation
As is typical in our industry and for the nature and kind of business in which we are engaged, from time to time various claims, charges and litigation are asserted or commenced by third parties against us or by us against third parties, arising from or related to product liability, infringement of patent or other intellectual property rights, breach of warranty, contractual relations or employee relations. The amounts claimed may be substantial, but they may not bear any reasonable relationship to the merits of the claims or the extent of any real risk of court awards assessed against us or in our favor.
Risks of Conducting Business Internationally
Risks of doing business internationally could adversely affect our sales, operations, earnings and cash flows due to a variety of factors, including, but not limited to:
• changes in a country’s or region’s economic or political conditions, including inflation, recession, interest rate fluctuations and actual or anticipated military conflicts;
• currency fluctuations affecting sales, particularly in the Euro and British Pound, which contribute to variations in sales of products and services in impacted jurisdictions and also affect our reported results expressed in U.S. dollars;
• currency fluctuations affecting costs, particularly the Euro, British Pound and the Chinese Yuan, which contribute to variances in costs in impacted jurisdictions and also affect our reported results expressed in U.S. dollars;
• longer accounts receivable cycles and financial instability among customers;
• trade regulations and procedures and actions affecting production, pricing and marketing of products;
• local labor conditions, customs, and regulations;
• changes in the regulatory or legal environment;
• differing technology standards or customer requirements;
• import, export or other business licensing requirements or requirements related to making foreign direct investments, which could affect our ability to obtain favorable terms for components or lead to penalties or restrictions;
• difficulties associated with repatriating cash generated or held abroad in a tax-efficient manner and changes in tax laws;
• fluctuations in freight costs and disruptions at important geographic points of exit and entry.
13
DH
M B
P -
3868
0_10
K_7
- P
age
13 o
f 84
- Apr
4, 2
008
- 10:
01:1
6 A
M -
Bla
ck
Effectiveness of Our Internal Controls Over Financial Reporting
Pursuant to Section 404 of the Sarbanes-Oxley Act of 2002, we are required to include in our Annual Report on Form 10-K our assessment of the effectiveness of our internal controls over financial reporting. Furthermore, our independent registered public accounting firm is required to audit our internal controls over financial reporting and separately report on whether it believes we maintain, in all material respects, effective internal controls over financial reporting. Although we believe that we currently have adequate internal controls procedures in place, we cannot be certain that future material changes to our internal controls over financial reporting will be effective. If we cannot adequately maintain the effectiveness of our internal controls over financial reporting, we might be subject to sanctions or investigation by regulatory authorities, such as the Securities and Exchange Commission. Any such action could adversely affect our financial results and the market price of our common stock.
Changes in Accounting Rules
Our financial statements are prepared in accordance with U.S. generally accepted accounting principles. These principles are subject to interpretation by various governing bodies, including the FASB and the SEC, who create and interpret appropriate accounting standards. A change from current accounting standards could have a significant adverse effect on our results of operations.
Unanticipated Changes in Tax Provisions or Income Tax Liabilities
We are subject to income taxes in the United States and numerous foreign jurisdictions. Our tax liabilities are affected by the amounts we charge for inventory and other items in intercompany transactions. From time to time, we are subject to tax audits in various jurisdictions. Tax authorities may disagree with our intercompany charges or other matters and assess additional taxes. We assess the likely outcomes of these audits in order to determine the appropriateness of the tax provision. However, there can be no assurance that we will accurately predict the outcomes of these audits, and the actual outcomes of these audits could have a material impact on our financial condition, results of operations and cash flows. In addition, our effective tax rate in the future could be adversely affected by changes in the mix of earnings in countries with differing statutory tax rates, changes in the valuation of deferred tax assets and liabilities, changes in tax laws and the discovery of new information in the course of our tax return preparation process. Furthermore, our tax provisions could be adversely affected as a result of any new interpretative accounting guidance related to accounting for uncertain tax positions.
General Economic Conditions
General economic conditions, both domestic and international, have an impact on our business and financial results. The global economy remains uncertain. As a result, individuals and companies may delay or reduce expenditures. Weak global economic conditions and/or softness in the consumer, subscription broadcasting, and/or OEM channels could result in lower demand for our products, resulting in lower sales, earnings and cash flows.
Environmental Matters
Many of our products are subject to various federal, state, local and international laws governing chemical substances in products, including laws regulating the manufacture and distribution of chemical substances and laws restricting the presence of certain substances in electronics products. With the passage of the European Union’s Restriction of Hazardous Substances Directive, which makes producers of electrical goods responsible for collection, recycling, treatment and disposal of recovered products, similar restrictions in China effective March 2007 and the European Union’s Waste Electrical and Electronic Equipment Directive, we could face significant costs and liabilities in complying with these and new laws and regulations or enforcement policies that could have a material adverse effect upon our capital expenditures, earnings or financial condition.
14
DH
M B
P -
3868
0_10
K_7
- P
age
14 o
f 84
- Apr
4, 2
008
- 10:
01:1
6 A
M -
Bla
ck
Leased Property
We lease all of the properties used in our business. We can give no assurance that we will enter into new or renewal leases, or that, if entered into, the new lease terms will be similar to the existing terms or that the terms of any such new or renewal leases will not have a significant and material adverse effect on our financial condition, results of operations and cash flows.
Technology Changes in Wireless Control
We currently derive substantial revenue from the sale of wireless remote controls based on infrared (“IR”) technology. Other control technologies exist or could be developed that could compete with IR. In addition, we develop and maintain our own database of IR and RF codes. There are several competing IR and RF libraries offered by companies that we compete with in the marketplace. The advantage that we may have compared to our competitors is difficult to measure. If other wireless control technology gains acceptance and starts to be integrated into home electronics devices currently controlled through our IR remote controllers, demand for our products may decrease, resulting in decreased revenue, earnings and cash flow.
Failure to Recruit, Hire, and Retain Key Personnel
Our ability to achieve growth in the future will depend, in part, on our success at recruiting, hiring, and retaining highly skilled engineering, managerial, operational, sales and marketing personnel. In addition, our corporate office, including our advance technology engineering group, is based in Southern California. The high cost of living in Southern California makes it difficult to attract talent from outside the region and may also put pressure on overall employment related expense. Additionally, our competitors seek to recruit and hire the same key personnel. Therefore, if we fail to stay competitive in salary and benefits within the industry it may negatively impact our ability to hire and retain key personnel. The inability to recruit, hire, and retain qualified personnel in a timely manner, or the loss of any key personnel, could make it difficult to meet key objectives, such as timely and effective product introductions.
Credit Facility
We amended our Credit Facility in August 2006 by extending our credit facility for an additional three years. Presently, we have no borrowings under this facility; however, we cannot make any assurances that we will not need to borrow amounts under this facility or that this facility will continue to be extended and thus available to us if we need to borrow. If this or any other credit facility is not available to us at a time when we need to borrow, we would have to use our cash reserves which could have a material adverse effect on our earnings, cash flow and financial position.
Change in Competition and Pricing
We rely on third-party manufacturers to build our universal wireless control products, based on our extensive IR code library and patented technology. Price is always an issue in winning and retaining business. If customers become increasingly price sensitive, new competition could arise from manufacturers who decide to go into direct competition with us or from current competitors who perform their own manufacturing. If such a trend develops, we could experience downward pressure on our pricing or lose sales, which could have a material adverse effect on our financial condition and results of operations.
Transportation Costs; Impact of Oil Prices
We ship products from our foreign manufacturers via ocean and air transport. It is sometimes difficult to forecast swings in demand or delays in production and, as a result, products may be shipped via air which is more costly than ocean shipments. Often, we typically cannot recover the increased cost of air
15
DH
M B
P -
3868
0_10
K_7
- P
age
15 o
f 84
- Apr
4, 2
008
- 10:
01:1
6 A
M -
Bla
ck
freight from our customers. Additionally, tariffs and other export fees may be incurred to ship products from foreign manufacturers to the customer. The inability to predict swings in demand or delays in production can increase the cost of freight which could have a material adverse effect on our product margins.
In addition, we have an exposure to oil prices in two forms. The first is in the prices of the oil-based materials that we use in our products, which are primarily the plastics and other components that we include in our finished products. The second is in the cost of delivery and freight, which would be passed on by the carriers that we use in the form of higher rates. We record freight-in as a cost of sales, and freight-out in operating expenses. Rising oil prices may have an adverse effect on cost of sales and operating expenses.
Proprietary Technologies
We produce highly complex products that incorporate leading-edge technology, including hardware, firmware, and software. Firmware and software may contain bugs that can unexpectedly interfere with operations. There can be no assurance that our testing programs will detect all defects in individual products or defects that could affect numerous shipments. The presence of defects may harm customer satisfaction, reduce sales opportunities, or increase returns. An inability to cure or repair a product defect could result in the failure of a product line, temporary or permanent withdrawal from a product or market, damage to our reputation, increased inventory costs, or product reengineering expenses, any of which could have a material impact on our revenues, margins and net income.
Strategic Business Transactions
We may, from time to time, pursue strategic alliances, joint ventures, business acquisitions, products or technologies (“strategic business transactions”) that complement or expand our existing operations, including those that could be material in size and scope. Strategic business transactions involve many risks, including the diversion of management’s attention away from day-to-day operations. There is also the risk that we will not be able to successfully integrate the strategic business transaction with our operations, personnel, customer base, products or technologies. Such strategic business transactions could also have adverse short-term effects on our operating results, and could result in dilutive issuances of equity securities, the incurrence of debt, and the loss of key employees. In addition, these strategic business transactions are generally subject to specific accounting guidelines that may adversely affect our financial condition, results of operations and cash flow. For instance, business acquisitions must be accounted for as purchases and, because most technology-related acquisitions involve the purchase of significant intangible assets, these acquisitions typically result in substantial amortization charges and charges for acquired research and development projects, which could have a material adverse effect on our results of operations. There can be no assurance that any such strategic business transactions will occur or, if such transactions do occur, that the integration will be successful or that the customer bases, products or technologies will generate sufficient revenue to offset the associated costs or effects.
ITEM 1B. UNRESOLVED STAFF COMMENTS
We have no unresolved staff comments as of the date of filing this Form 10-K.
16
DH
M B
P -
3868
0_10
K_7
- P
age
16 o
f 84
- Apr
4, 2
008
- 10:
01:1
6 A
M -
Bla
ck
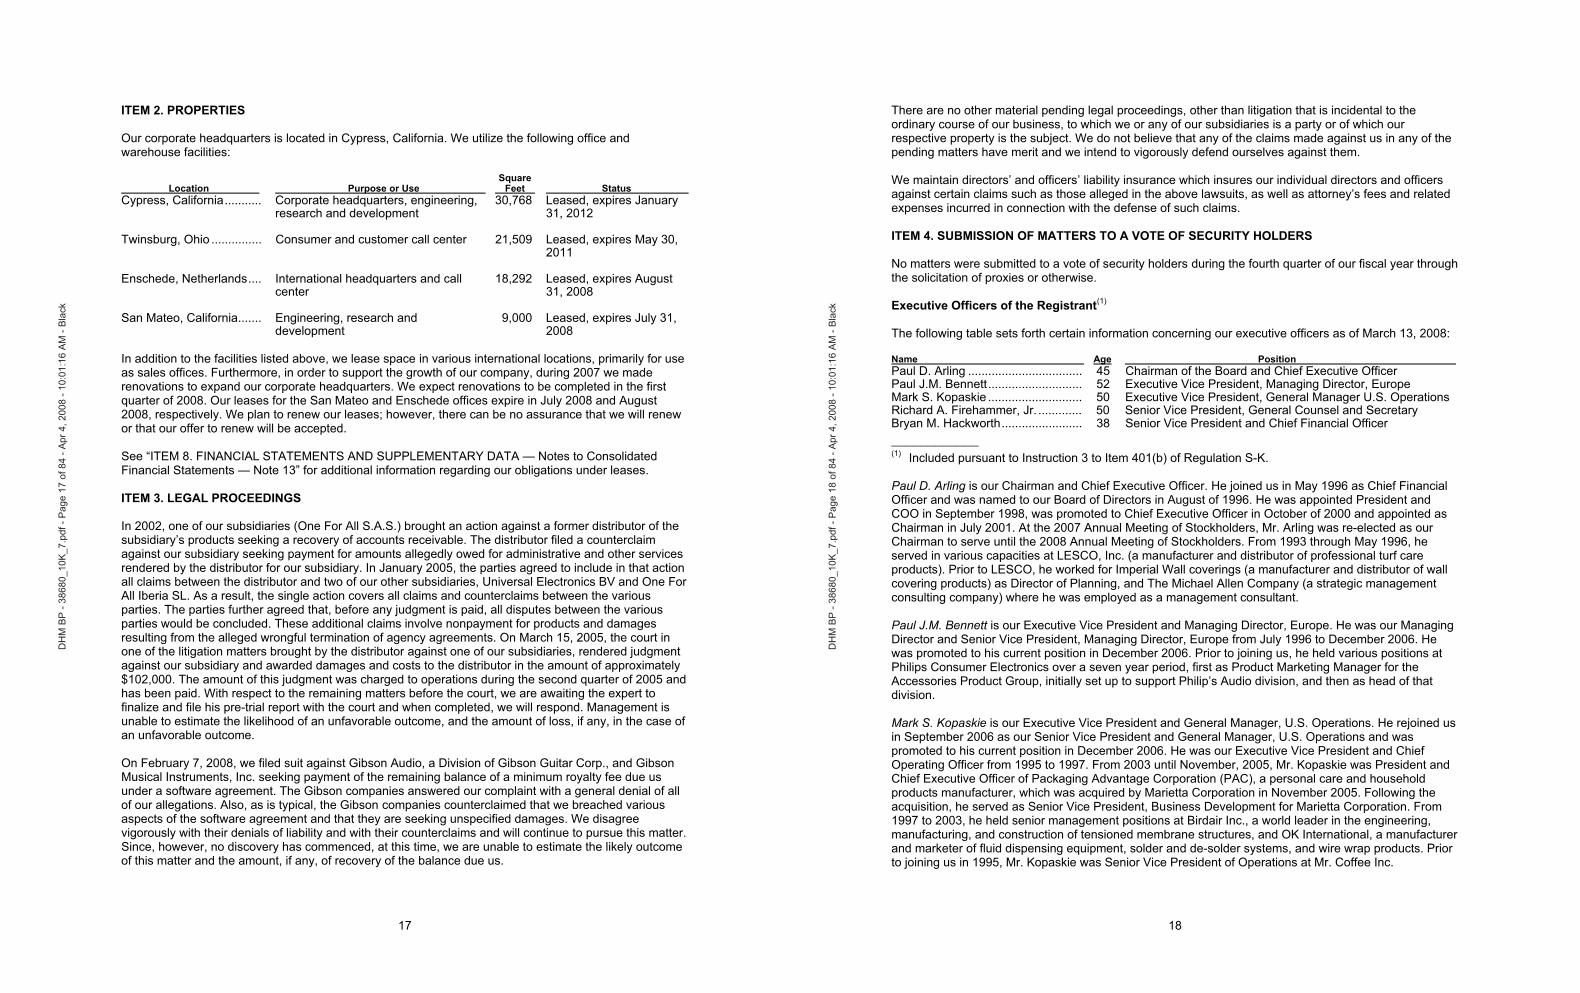
ITEM 2. PROPERTIES
Our corporate headquarters is located in Cypress, California. We utilize the following office and warehouse facilities:
Location Purpose or Use Square Feet Status
Cypress, California........... Corporate headquarters, engineering,research and development
30,768 Leased, expires January 31, 2012
Twinsburg, Ohio ............... Consumer and customer call center 21,509 Leased, expires May 30, 2011
Enschede, Netherlands.... International headquarters and call center
18,292 Leased, expires August 31, 2008
San Mateo, California....... Engineering, research and development
9,000 Leased, expires July 31, 2008
In addition to the facilities listed above, we lease space in various international locations, primarily for use as sales offices. Furthermore, in order to support the growth of our company, during 2007 we made renovations to expand our corporate headquarters. We expect renovations to be completed in the first quarter of 2008. Our leases for the San Mateo and Enschede offices expire in July 2008 and August 2008, respectively. We plan to renew our leases; however, there can be no assurance that we will renew or that our offer to renew will be accepted.
See “ITEM 8. FINANCIAL STATEMENTS AND SUPPLEMENTARY DATA — Notes to Consolidated Financial Statements — Note 13” for additional information regarding our obligations under leases.
ITEM 3. LEGAL PROCEEDINGS
In 2002, one of our subsidiaries (One For All S.A.S.) brought an action against a former distributor of the subsidiary’s products seeking a recovery of accounts receivable. The distributor filed a counterclaim against our subsidiary seeking payment for amounts allegedly owed for administrative and other services rendered by the distributor for our subsidiary. In January 2005, the parties agreed to include in that action all claims between the distributor and two of our other subsidiaries, Universal Electronics BV and One For All Iberia SL. As a result, the single action covers all claims and counterclaims between the various parties. The parties further agreed that, before any judgment is paid, all disputes between the various parties would be concluded. These additional claims involve nonpayment for products and damages resulting from the alleged wrongful termination of agency agreements. On March 15, 2005, the court in one of the litigation matters brought by the distributor against one of our subsidiaries, rendered judgment against our subsidiary and awarded damages and costs to the distributor in the amount of approximately $102,000. The amount of this judgment was charged to operations during the second quarter of 2005 and has been paid. With respect to the remaining matters before the court, we are awaiting the expert to finalize and file his pre-trial report with the court and when completed, we will respond. Management is unable to estimate the likelihood of an unfavorable outcome, and the amount of loss, if any, in the case of an unfavorable outcome.
On February 7, 2008, we filed suit against Gibson Audio, a Division of Gibson Guitar Corp., and Gibson Musical Instruments, Inc. seeking payment of the remaining balance of a minimum royalty fee due us under a software agreement. The Gibson companies answered our complaint with a general denial of all of our allegations. Also, as is typical, the Gibson companies counterclaimed that we breached various aspects of the software agreement and that they are seeking unspecified damages. We disagree vigorously with their denials of liability and with their counterclaims and will continue to pursue this matter. Since, however, no discovery has commenced, at this time, we are unable to estimate the likely outcome of this matter and the amount, if any, of recovery of the balance due us.
17
DH
M B
P -
3868
0_10
K_7
- P
age
17 o
f 84
- Apr
4, 2
008
- 10:
01:1
6 A
M -
Bla
ck
There are no other material pending legal proceedings, other than litigation that is incidental to the ordinary course of our business, to which we or any of our subsidiaries is a party or of which our respective property is the subject. We do not believe that any of the claims made against us in any of the pending matters have merit and we intend to vigorously defend ourselves against them.
We maintain directors’ and officers’ liability insurance which insures our individual directors and officers against certain claims such as those alleged in the above lawsuits, as well as attorney’s fees and related expenses incurred in connection with the defense of such claims.
ITEM 4. SUBMISSION OF MATTERS TO A VOTE OF SECURITY HOLDERS
No matters were submitted to a vote of security holders during the fourth quarter of our fiscal year through the solicitation of proxies or otherwise.
Executive Officers of the Registrant(1)
The following table sets forth certain information concerning our executive officers as of March 13, 2008:
Name Age Position
Paul D. Arling .................................. 45 Chairman of the Board and Chief Executive Officer Paul J.M. Bennett............................ 52 Executive Vice President, Managing Director, Europe Mark S. Kopaskie ............................ 50 Executive Vice President, General Manager U.S. Operations Richard A. Firehammer, Jr. ............. 50 Senior Vice President, General Counsel and Secretary Bryan M. Hackworth........................ 38 Senior Vice President and Chief Financial Officer ____________(1) Included pursuant to Instruction 3 to Item 401(b) of Regulation S-K.
Paul D. Arling is our Chairman and Chief Executive Officer. He joined us in May 1996 as Chief Financial Officer and was named to our Board of Directors in August of 1996. He was appointed President and COO in September 1998, was promoted to Chief Executive Officer in October of 2000 and appointed as Chairman in July 2001. At the 2007 Annual Meeting of Stockholders, Mr. Arling was re-elected as our Chairman to serve until the 2008 Annual Meeting of Stockholders. From 1993 through May 1996, he served in various capacities at LESCO, Inc. (a manufacturer and distributor of professional turf care products). Prior to LESCO, he worked for Imperial Wall coverings (a manufacturer and distributor of wall covering products) as Director of Planning, and The Michael Allen Company (a strategic management consulting company) where he was employed as a management consultant.
Paul J.M. Bennett is our Executive Vice President and Managing Director, Europe. He was our Managing Director and Senior Vice President, Managing Director, Europe from July 1996 to December 2006. He was promoted to his current position in December 2006. Prior to joining us, he held various positions at Philips Consumer Electronics over a seven year period, first as Product Marketing Manager for the Accessories Product Group, initially set up to support Philip’s Audio division, and then as head of that division.
Mark S. Kopaskie is our Executive Vice President and General Manager, U.S. Operations. He rejoined us in September 2006 as our Senior Vice President and General Manager, U.S. Operations and was promoted to his current position in December 2006. He was our Executive Vice President and Chief Operating Officer from 1995 to 1997. From 2003 until November, 2005, Mr. Kopaskie was President and Chief Executive Officer of Packaging Advantage Corporation (PAC), a personal care and household products manufacturer, which was acquired by Marietta Corporation in November 2005. Following the acquisition, he served as Senior Vice President, Business Development for Marietta Corporation. From 1997 to 2003, he held senior management positions at Birdair Inc., a world leader in the engineering, manufacturing, and construction of tensioned membrane structures, and OK International, a manufacturer and marketer of fluid dispensing equipment, solder and de-solder systems, and wire wrap products. Prior to joining us in 1995, Mr. Kopaskie was Senior Vice President of Operations at Mr. Coffee Inc.
18
DH
M B
P -
3868
0_10
K_7
- P
age
18 o
f 84
- Apr
4, 2
008
- 10:
01:1
6 A
M -
Bla
ck
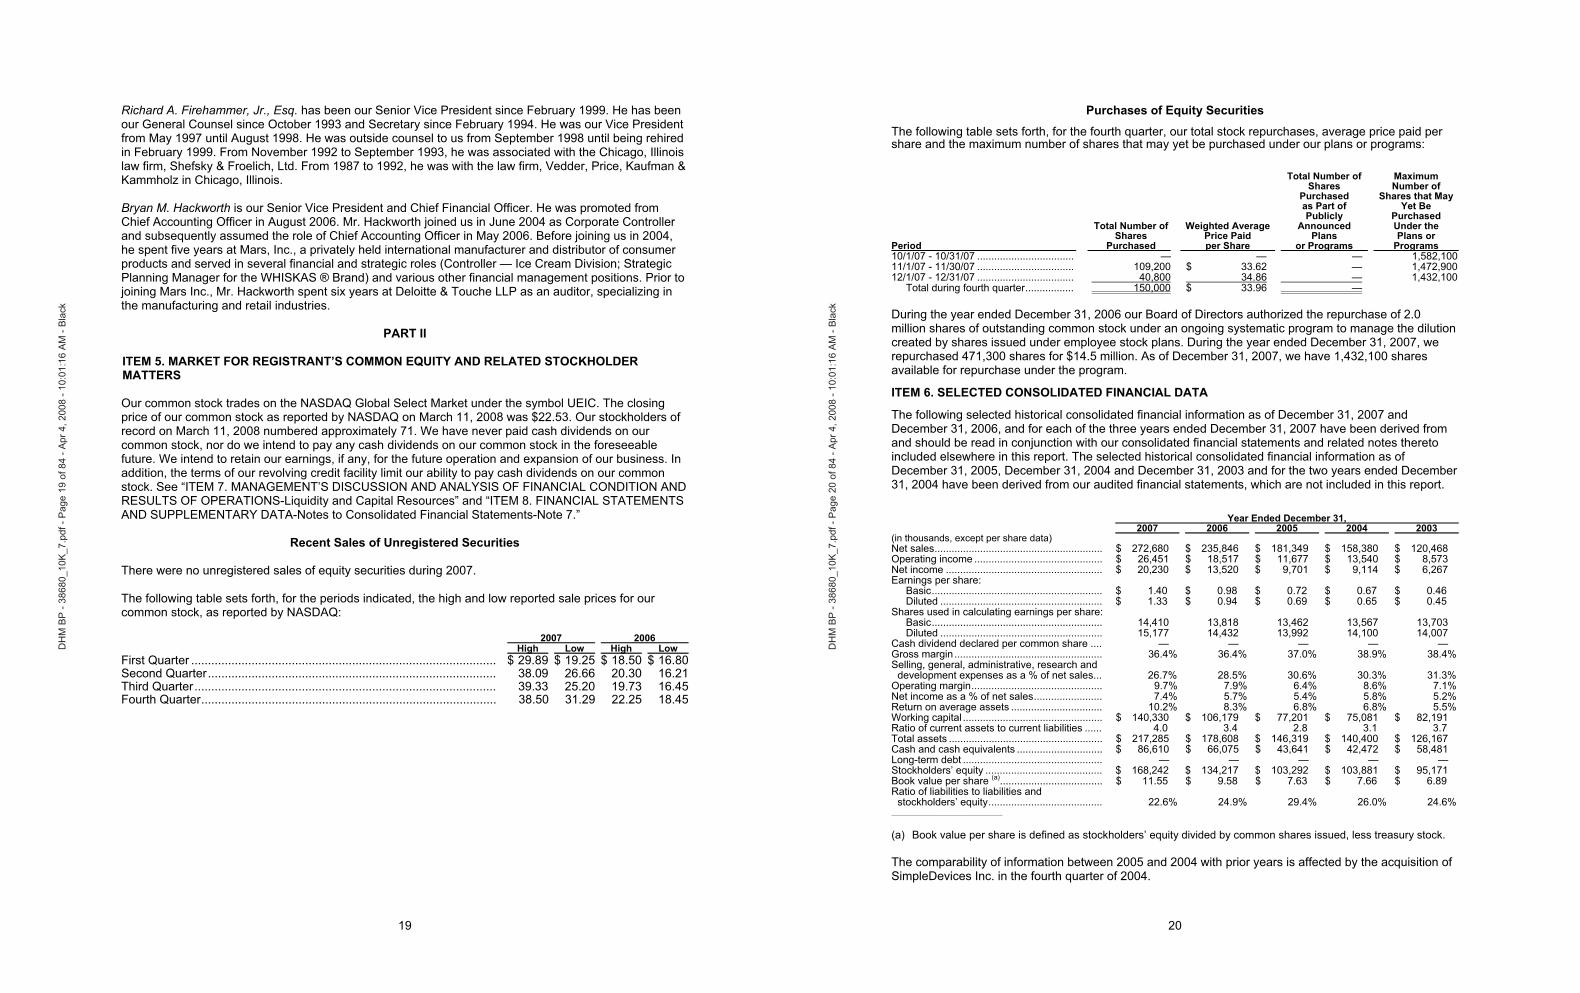
Richard A. Firehammer, Jr., Esq. has been our Senior Vice President since February 1999. He has been our General Counsel since October 1993 and Secretary since February 1994. He was our Vice President from May 1997 until August 1998. He was outside counsel to us from September 1998 until being rehired in February 1999. From November 1992 to September 1993, he was associated with the Chicago, Illinois law firm, Shefsky & Froelich, Ltd. From 1987 to 1992, he was with the law firm, Vedder, Price, Kaufman & Kammholz in Chicago, Illinois.
Bryan M. Hackworth is our Senior Vice President and Chief Financial Officer. He was promoted from Chief Accounting Officer in August 2006. Mr. Hackworth joined us in June 2004 as Corporate Controller and subsequently assumed the role of Chief Accounting Officer in May 2006. Before joining us in 2004, he spent five years at Mars, Inc., a privately held international manufacturer and distributor of consumer products and served in several financial and strategic roles (Controller — Ice Cream Division; Strategic Planning Manager for the WHISKAS ® Brand) and various other financial management positions. Prior to joining Mars Inc., Mr. Hackworth spent six years at Deloitte & Touche LLP as an auditor, specializing in the manufacturing and retail industries.
PART II
ITEM 5. MARKET FOR REGISTRANT’S COMMON EQUITY AND RELATED STOCKHOLDER MATTERS
Our common stock trades on the NASDAQ Global Select Market under the symbol UEIC. The closing price of our common stock as reported by NASDAQ on March 11, 2008 was $22.53. Our stockholders of record on March 11, 2008 numbered approximately 71. We have never paid cash dividends on our common stock, nor do we intend to pay any cash dividends on our common stock in the foreseeable future. We intend to retain our earnings, if any, for the future operation and expansion of our business. In addition, the terms of our revolving credit facility limit our ability to pay cash dividends on our common stock. See “ITEM 7. MANAGEMENT’S DISCUSSION AND ANALYSIS OF FINANCIAL CONDITION AND RESULTS OF OPERATIONS-Liquidity and Capital Resources” and “ITEM 8. FINANCIAL STATEMENTS AND SUPPLEMENTARY DATA-Notes to Consolidated Financial Statements-Note 7.”
Recent Sales of Unregistered Securities
There were no unregistered sales of equity securities during 2007.
The following table sets forth, for the periods indicated, the high and low reported sale prices for our common stock, as reported by NASDAQ:
2007 2006
High Low High Low
First Quarter ........................................................................................... $ 29.89 $ 19.25 $ 18.50 $ 16.80Second Quarter...................................................................................... 38.09 26.66 20.30 16.21Third Quarter.......................................................................................... 39.33 25.20 19.73 16.45Fourth Quarter........................................................................................ 38.50 31.29 22.25 18.45
19
DH
M B
P -
3868
0_10
K_7
- P
age
19 o
f 84
- Apr
4, 2
008
- 10:
01:1
6 A
M -
Bla
ck
Purchases of Equity Securities
The following table sets forth, for the fourth quarter, our total stock repurchases, average price paid per share and the maximum number of shares that may yet be purchased under our plans or programs:
Period
Total Number of Shares Purchased
Weighted Average Price Paid per Share
Total Number of Shares Purchased as Part of Publicly Announced Plans or Programs
Maximum Number of Shares that May Yet Be Purchased Under the Plans or Programs
10/1/07 - 10/31/07 .................................. — — — 1,582,10011/1/07 - 11/30/07 .................................. 109,200 $ 33.62 — 1,472,90012/1/07 - 12/31/07 .................................. 40,800 34.86 — 1,432,100
Total during fourth quarter................. 150,000 $ 33.96 —
During the year ended December 31, 2006 our Board of Directors authorized the repurchase of 2.0 million shares of outstanding common stock under an ongoing systematic program to manage the dilution created by shares issued under employee stock plans. During the year ended December 31, 2007, we repurchased 471,300 shares for $14.5 million. As of December 31, 2007, we have 1,432,100 shares available for repurchase under the program.
ITEM 6. SELECTED CONSOLIDATED FINANCIAL DATA
The following selected historical consolidated financial information as of December 31, 2007 and December 31, 2006, and for each of the three years ended December 31, 2007 have been derived from and should be read in conjunction with our consolidated financial statements and related notes thereto included elsewhere in this report. The selected historical consolidated financial information as of December 31, 2005, December 31, 2004 and December 31, 2003 and for the two years ended December 31, 2004 have been derived from our audited financial statements, which are not included in this report.
Year Ended December 31,
2007 2006 2005 2004 2003
(in thousands, except per share data) Net sales........................................................... $ 272,680 $ 235,846 $ 181,349 $ 158,380 $ 120,468 Operating income ............................................. $ 26,451 $ 18,517 $ 11,677 $ 13,540 $ 8,573 Net income ....................................................... $ 20,230 $ 13,520 $ 9,701 $ 9,114 $ 6,267 Earnings per share:
Basic............................................................ $ 1.40 $ 0.98 $ 0.72 $ 0.67 $ 0.46 Diluted ......................................................... $ 1.33 $ 0.94 $ 0.69 $ 0.65 $ 0.45
Shares used in calculating earnings per share: Basic............................................................ 14,410 13,818 13,462 13,567 13,703 Diluted ......................................................... 15,177 14,432 13,992 14,100 14,007
Cash dividend declared per common share .... — — — — — Gross margin .................................................... 36.4% 36.4% 37.0% 38.9% 38.4%Selling, general, administrative, research and
development expenses as a % of net sales... 26.7% 28.5% 30.6% 30.3% 31.3%Operating margin.............................................. 9.7% 7.9% 6.4% 8.6% 7.1%Net income as a % of net sales........................ 7.4% 5.7% 5.4% 5.8% 5.2%Return on average assets ................................ 10.2% 8.3% 6.8% 6.8% 5.5%Working capital ................................................. $ 140,330 $ 106,179 $ 77,201 $ 75,081 $ 82,191 Ratio of current assets to current liabilities ...... 4.0 3.4 2.8 3.1 3.7 Total assets ...................................................... $ 217,285 $ 178,608 $ 146,319 $ 140,400 $ 126,167 Cash and cash equivalents .............................. $ 86,610 $ 66,075 $ 43,641 $ 42,472 $ 58,481 Long-term debt ................................................. — — — — — Stockholders’ equity ......................................... $ 168,242 $ 134,217 $ 103,292 $ 103,881 $ 95,171 Book value per share (a).................................... $ 11.55 $ 9.58 $ 7.63 $ 7.66 $ 6.89 Ratio of liabilities to liabilities and
stockholders’ equity........................................ 22.6% 24.9% 29.4% 26.0% 24.6%_______________________________________________________
(a) Book value per share is defined as stockholders’ equity divided by common shares issued, less treasury stock.
The comparability of information between 2005 and 2004 with prior years is affected by the acquisition of SimpleDevices Inc. in the fourth quarter of 2004.
20
DH
M B
P -
3868
0_10
K_7
- P
age
20 o
f 84
- Apr
4, 2
008
- 10:
01:1
6 A
M -
Bla
ck
ITEM 7. MANAGEMENT’S DISCUSSION AND ANALYSIS OF FINANCIAL CONDITION ANDRESULTS OF OPERATIONS
The following discussion should be read in conjunction with the Consolidated Financial Statements and the related notes that appear elsewhere in this document.
Overview
We have developed a broad line of pre-programmed universal wireless control products and audio-video accessories that are marketed to enhance home entertainment systems. Our channels of distribution include international retail, U.S. retail, private label, OEMs, cable and satellite service providers, CEDIA (Custom Electronic Design and Installation Association) and companies in the computing industry. We believe that our universal remote control database contains device codes that are capable of controlling virtually all infrared remote (“IR”) controlled TVs, VCRs, DVD players, cable converters, CD players, audio components and satellite receivers, as well as most other infrared remote controlled devices worldwide.
Beginning in 1986 and continuing today, we have compiled an extensive library that covers over 348,000 individual device functions and over 3,300 individual consumer electronic equipment brand names. Our library is regularly updated with new IR codes used in newly introduced video and audio devices. All such IR codes are captured from the original manufacturer’s remote control devices or manufacturer’s specifications to ensure the accuracy and integrity of the database. We have also developed patented technologies that provide the capability to easily upgrade the memory of the wireless control device by adding IR codes from the library that were not originally included.
Since the third quarter of 2006, we have been operating as one business segment. We have eleven operating subsidiaries located in Argentina, France, two in Germany, Hong Kong, Italy, the Netherlands, Singapore, Spain, India and the United Kingdom.
To recap our results for 2007:
• revenue grew 15% from $235.8 million in 2006 to $272.7 million in 2007;
• full year 2007 operating income grew over 40% to $26.5 million, representing 9.7% operating margin from $18.5 million, representing 7.9% operating margin in 2006;
• our growth in 2007 was the result of strong demand from the customers in our business category, due in part to the continuation of the upgrade cycle from analog to digital, consumer demand for advanced-function offerings from subscription broadcasters, and the mid-year deadline for OCAP compliance; and
• 2007 capped off a successful three-year period, where sales during this period grew at a compounded rate of approximately 20% and earnings per share grew at a compounded rate of approximately 27%.
Our strategic business objectives for 2008 include the following:
• increase our share with existing customers;
• acquire new customers in historically strong regions;
• continue our expansion into new regions, Asia in particular;
• continue to develop industry-leading technologies and products; and
• continue to evaluate potential merger and acquisition opportunities that may enhance our business.
21
DH
M B
P -
3868
0_10
K_7
- P
age
21 o
f 84
- Apr
4, 2
008
- 10:
01:1
6 A
M -
Bla
ck
We intend for the following discussion of our financial condition and results of operations to provide information that will assist in understanding our consolidated financial statements, the changes in certain key items in those financial statements from period to period, and the primary factors that accounted for those changes, as well as how certain accounting principles, policies and estimates affect our consolidated financial statements.
Critical Accounting Policies and Estimates
The preparation of financial statements in conformity with accounting principles generally accepted in the United States of America requires us to make estimates and judgments that affect the reported amounts of assets and liabilities, disclosure of contingent assets and liabilities at the date of the financial statements and the reported amounts of revenues and expenses during the reporting period. On an on-going basis, we evaluate our estimates and judgments, including those related to revenue recognition, allowance for sales returns and doubtful accounts, warranties, inventory valuation, business combination purchase price allocations, our review for impairment of long-lived assets, intangible assets and goodwill, income taxes and stock-based compensation expense. Actual results may differ from these judgments and estimates, and they may be adjusted as more information becomes available. Any adjustment could be significant.
An accounting policy is deemed to be critical if it requires an accounting estimate to be made based on assumptions about matters that are highly uncertain at the time the estimate is made, if different estimates reasonably could have been used, or if changes in the estimate that are reasonably likely to occur could materially impact the financial statements. Management believes the following critical accounting policies affect our more significant judgments and estimates used in the preparation of our consolidated financial statements.
Revenue recognition
We recognize revenue on the sale of products when delivery has occurred, there is persuasive evidence of an arrangement, the sales price is fixed or determinable and collectibility is reasonably assured.
We record a provision for estimated sales returns on product sales in the same period as the related revenues are recorded. These estimates are based on historical sales returns, analysis of credit memo data and other known factors. The provision recorded for estimated sales returns and allowances is deducted from gross sales to arrive at net sales in the period the related revenue is recorded.
We accrue for discounts and rebates on product sales in the same period as the related revenues are recorded based on historical experience. Changes in such accruals may be required if future rebates and incentives differ from our estimates. Rebates and incentives are recognized as a reduction of sales if distributed in cash or customer account credits. Rebates and incentives are recognized as cost of sales if we provide products or services for payment.
Sales allowances reduce gross accounts receivable to arrive at accounts receivable, net in the same period the related receivable is recorded. We have no obligations after delivery of our products other than the associated warranties. We maintain an allowance for doubtful accounts for estimated losses resulting from the inability of our customers to make payments for products sold or services rendered. The allowance for doubtful accounts is based on a variety of factors, including historical experience, length of time receivables are past due, current economic trends and changes in customer payment behavior. Also, we record specific provisions for individual accounts when we become aware of a customer’s inability to meet its financial obligations to us, such as in the case of bankruptcy filings or deterioration in the customer’s operating results or financial position. If circumstances related to a customer change, our estimates of the recoverability of the receivables would be further adjusted, either upward or downward.
22
DH
M B
P -
3868
0_10
K_7
- P
age
22 o
f 84
- Apr
4, 2
008
- 10:
01:1
6 A
M -
Bla
ck
We generate service revenue, which is paid monthly, as a result of providing consumer support programs to some of our customers through our call centers. These service revenues are recognized when services are performed, persuasive evidence of an arrangement exists, the sales price is fixed or determinable and collectibility is reasonably assured.
We also license our intellectual property including our patented technologies, trade secrets, trademarks and database of infrared codes. We record license revenue when our customers ship products incorporating our intellectual property, persuasive evidence of an arrangement exists, the sales price is fixed or determinable and collectibility is reasonably assured.
When a sales arrangement contains multiple elements, such as software products, licenses and/or services, we allocate revenue to each element based on its relative fair value. The fair values for the multiple elements are determined based on vendor specific objective evidence (“VSOE”), or the price charged when the element is sold separately. The residual method is utilized when VSOE exists for all the undelivered elements, but not for the delivered element. This is performed by allocating revenue to the undelivered elements (that have VSOE) and the residual revenue to the delivered elements. When the fair value for an undelivered element cannot be determined, we defer revenue for the delivered elements until the undelivered element is delivered. We limit the amount of revenue recognition for delivered elements to the amount that is not contingent on the future delivery of products or services or subject to customer-specified return or refund privileges.
We account for revenue under software licensing arrangements involving significant production, modification or customization of software in accordance with SOP 81-1, “Accounting for Performance of Construction-Type and Certain Production-Type Contracts.” We recognize revenue and profit as work progresses on long-term, fixed price contracts using the percentage-of-completion method. When applying the percentage-of-completion method, we rely on estimates of total expected contract revenue and labor hours which are provided by our project managers. We follow this method because reasonably dependable estimates of the revenue and labor applicable to various stages of a contract can be made. Recognized revenue and profit are subject to revisions as the contract progresses to completion. Revisions to revenue and profit estimates are charged to income in the period in which the facts that give rise to the revision become known, and losses are accrued when identified.
We have not made any material changes in our methodology for recognizing revenue during the past three fiscal years. We do not believe there is a reasonable likelihood that there will be a material change in the estimates or assumptions we use to recognize revenue. However, if actual results are not consistent with our estimates or assumptions, we may be exposed to losses or gains that could be material.
Warranty
We warrant our products against defects in materials and workmanship arising during normal use. We service warranty claims directly through our customer service department or contracted third-party warranty repair facilities. Our warranty period ranges up to three years. We estimate and recognize product warranty costs, which are included in cost of sales, as we sell the related products. Warranty costs are forecasted based on the best available information, primarily historical claims experience and the expected cost per claim.
We have not made any material changes in our warranty reserve methodology during the past three fiscal years. We do not believe there is a reasonable likelihood that there will be a material change in the estimates or assumptions we use to calculate the warranty reserve. However, actual claim costs may differ from the amounts estimated. If a significant product defect were to be discovered on a high volume product, our financial statements could be materially impacted. Historically, product defects have been less than 0.5% of the net units sold.
23
DH
M B
P -
3868
0_10
K_7
- P
age
23 o
f 84
- Apr
4, 2
008
- 10:
01:1
6 A
M -
Bla
ck
Inventories
Our inventories consist of primarily wireless control devices and the related component parts, including integrated circuits, and are valued at the lower of cost or market. Cost is determined using the first-in, first-out method. We write down our inventory for the estimated difference between the inventory’s cost and its estimated market value based upon our best estimates about future demand and market conditions.
We carry inventory in amounts necessary to satisfy our customers’ inventory requirements on a timely basis. We continually monitor our inventory status to control inventory levels and write-down any excess or obsolete inventories on hand. Our total excess and obsolete inventory reserve as of December 31, 2007 and December 31, 2006 was approximately $1.8 million and $2.2 million, respectively, or 5.0% and 7.6% of total inventory.
We have not made any material changes in the accounting methodology used to establish our excess and obsolete inventory reserve during the past three fiscal years. We do not believe there is reasonable likelihood that there will be a material change in the future estimates or assumptions we used to calculate our excess and obsolete inventory reserve. If actual market conditions are less favorable than those projected by management additional inventory write-downs may be required, which could have a material impact on our financial statements. Each 1% change in the ratio of excess and obsolete inventory reserve to inventory would impact cost of sales by approximately $370 thousand. Such circumstances could include, but are not limited to, the development of new competing technology that impedes the marketability of our products or the occurrence of significant price decreases in our component parts, such as integrated circuits.
Business Combinations
We are required to allocate the purchase price of acquired companies to the tangible and intangible assets and the liabilities assumed, as well as in-process research and development (“IPRD”), based upon their estimated fair values. Such valuations require management to make significant fair value estimates and assumptions, especially with respect to intangible assets. Management estimates the fair value of certain intangible assets by utilizing the following (but not limited to):
• future free cash flow from customer contracts, customer lists, distribution agreements, acquired developed technologies, and patents;
• expected costs to develop IPR&D into commercially viable products and cash flows from the products once they are completed;
• brand awareness and market position, as well as assumptions regarding the period of time the brand will continue to be used in our product portfolio and
• discount rates utilized in discounted cash flow models.
Our estimates are based upon assumptions believed to be reasonable; however, unanticipated events or circumstances may occur which could affect the accuracy of our fair value estimates, including assumptions regarding industry economic factors and business strategies.
Valuation of Long-Lived Assets and Intangible Assets
We assess long-lived and intangible assets for impairment whenever events or changes in circumstances indicate that their carrying value may not be recoverable. Factors considered important which could trigger an impairment review if significant include the following:
• underperformance relative to historical or projected future operating results;
• changes in the manner of use of the assets;
24
DH
M B
P -
3868
0_10
K_7
- P
age
24 o
f 84
- Apr
4, 2
008
- 10:
01:1
6 A
M -
Bla
ck
• changes in the strategy of our overall business;
• negative industry or economic trends;
• a decline in our stock price for a sustained period; and
• a variance between our market capitalization relative to net book value.
When we determine that the carrying value of a long-lived asset or an intangible asset may not be recoverable based upon the existence of one or more of the above indicators of impairment we perform an impairment review. If the carrying value of the asset is larger than the undiscounted cash flows, the asset is impaired. We measure an impairment based on the projected discounted cash flow method using a discount rate determined by our management to be commensurate with the risk inherent in our current business model. In assessing the recoverability, we must make assumptions regarding estimated future cash flows and other factors to determine the fair value of the respective assets.
We have not made any material changes in our impairment loss assessment methodology during the past three fiscal years. We do not believe there is a reasonable likelihood that there will be a material change in the estimates or assumptions we use to calculate the impairment of long-lived assets and intangible assets. However, if actual results are not consistent with our estimates and assumptions we may be exposed to material impairment charges.
Goodwill
We evaluate the carrying value of goodwill as of December 31 of each year and between annual evaluations if events occur or circumstances change that would more likely than not reduce the fair value of the reporting unit below its carrying amount. Such circumstances could include, but are not limited to: (1) a significant adverse change in legal factors or in business climate, (2) unanticipated competition or (3) an adverse action or assessment by a regulator.
When performing the impairment review, we determine the carrying amount of each reporting unit by assigning assets and liabilities, including the existing goodwill, to those reporting units. A reporting unit is defined as an operating segment or one level below an operating segment (referred to as a component). A component of an operating segment is deemed a reporting unit if the component constitutes a business for which discrete financial information is available, and segment management regularly reviews the operating results of that component. Our domestic and international operations are components and reporting units of our sole operating segment.
To evaluate whether goodwill is impaired, we compare the fair value of the reporting unit to which the goodwill is assigned to the reporting unit’s carrying amount, including goodwill. We determine the fair value of each reporting unit using the present value of expected future cash flows for that reporting unit. If the carrying amount of a reporting unit exceeds its fair value, the amount of the impairment loss must be measured.
The impairment loss would be calculated by comparing the implied fair value of goodwill to its carrying amount. In calculating the implied fair value of the reporting unit goodwill, the present value of the reporting unit’s expected future cash flows is allocated to all of the other assets and liabilities of that unit based on their fair values. The excess of the present value of the reporting unit’s expected future cash flows over the amount assigned to its other assets and liabilities is the implied fair value of goodwill. An impairment loss would be recognized when the carrying amount of goodwill exceeds its implied fair value.
We have not made any material changes in our impairment loss assessment methodology during the past three fiscal years. We do not believe there is a reasonable likelihood that there will be a material change in the future estimates or assumptions we use to test for impairment losses on goodwill. However, if actual results are not consistent with our estimates and assumptions we may be exposed to material impairment charges.
25
DH
M B
P -
3868
0_10
K_7
- P
age
25 o
f 84
- Apr
4, 2
008
- 10:
01:1
6 A
M -
Bla
ck
Income Taxes
We are periodically under audit by domestic and foreign taxing authorities. These audits include questions regarding tax filing positions we have taken, including the timing and amount of deductions of income among various tax jurisdictions.
As part of the process of preparing our consolidated financial statements, we estimate our income taxes in each of the taxing jurisdictions in which we operate. This process involves estimating our actual current tax expense together with assessing any temporary differences resulting from the different treatment of certain items, such as the timing of expense recognition for tax and financial reporting purposes. These differences may result in deferred tax assets and liabilities, which are included in our consolidated balance sheet.
We are required to assess the likelihood that our deferred tax assets, which include net operating loss carryforwards and temporary differences that are expected to be deductible in future years, will be recoverable from future taxable income or other tax planning strategies. If recovery is not likely, we must provide a valuation allowance based on our estimates of future taxable income in the various taxing jurisdictions and the amount of deferred taxes that are ultimately realizable.
The provision for tax liabilities involves evaluations and judgments of uncertainties in the interpretation of complex tax regulations by various taxing authorities. Prior to January 1, 2007, in situations involving tax related uncertainties, we provided for tax liabilities when we believed such liabilities were probable under SFAS 5, “Accounting for Contingent Liabilities.” We adopted the provisions of FASB Interpretation 48, “Accounting for Uncertainty in Income Taxes- an interpretation of FASB Statement No. 109” (“FIN 48”) effective January 1, 2007. In accordance with the adoption of FIN 48, we evaluate our tax positions to determine if it is more likely than not that a tax position is sustainable, based on its technical merits. If a tax position does not meet the more likely than not standard, a full reserve is established against the tax asset or a liability is recorded. Additionally, for a position that is determined to, more likely than not, be sustainable, we measure the benefit at the greatest cumulative probability of being realized and establish a reserve or liability for the balance.
Management believes that our estimates are reasonable; however, actual results may differ. A material change in our tax reserves could have a significant impact on our effective tax rate and our results.
Stock-Based Compensation Expense
Effective January 1, 2006, we adopted the fair value recognition provisions of SFAS No. 123R, “Share-Based Payment” (“SFAS 123R”) using the modified-prospective transition method. Stock-based compensation expense is presented in the same income statement line as cash compensation paid to the same employees or directors. During the year ended December 31, 2007 and 2006, we recorded $3.5 million and $3.1 million, respectively, in pre-tax stock-based compensation expense. Included in SG&A stock-based compensation expense is $687 thousand and $353 thousand in pre-tax compensation expense related to stock awards granted to outside directors for the years ended December 31, 2007 and 2006, respectively. The income tax benefit associated with stock-based compensation expense was $1.2 million and $1.0 million for the years ended December 31, 2007 and 2006, respectively.
Prior to January 1, 2006, we accounted for options granted under these plans using the recognition and measurement provisions of Accounting Principles Board (“APB”) Opinion No. 25, “Accounting for Stock Issued to Employees,” (“APB 25”) and related interpretations, as permitted by SFAS 123. Under the intrinsic-value method of APB 25, compensation cost is the excess, if any, of the quoted market price of the stock at the grant date over the amount an employee must pay to acquire the stock. We grant options with an exercise price equal to the market value of the common stock on the date of grant; therefore no compensation expense was recognized related to those options for the 2005 fiscal year.
26
DH
M B
P -
3868
0_10
K_7
- P
age
26 o
f 84
- Apr
4, 2
008
- 10:
01:1
6 A
M -
Bla
ck
Stock-based compensation expense was included in the following for the years ended December 31, 2007 and 2006:
(in thousands) 2007 2006
Cost of sales ...................................................................................................................... $ 31 $ 26Research and development ............................................................................................... 418 370Selling, general and administrative .................................................................................... 3,072 2,721
Total Stock-based compensation expense........................................................................ $ 3,521 $ 3,117
During the year ended December 31, 2007, we granted 75,250 and 253,750 stock options to executive and non-executive employees, respectively.
As of December 31, 2007, we expect to recognize $4.4 million of total unrecognized compensation expense related to non-vested employee stock options over a weighted-average life of 2.36 years.
We issue restricted stock awards to the outside directors for services performed. Under SFAS No. 123R, compensation expense related to restricted stock awards is based on the fair value of the shares awarded as of the grant date. Compensation expense for the restricted stock awards is recognized on a straight-line basis over the requisite service period of one year. The fair value of non-vested shares is determined based on the average of the high and low trade prices of our company’s shares on the grant date. During the years ended December 31, 2007, 2006 and 2005, we granted 25,000, 22,813 and 20,000 shares, respectively.
As of December 31, 2007, we expect to recognize $0.4 million of total unrecognized compensation expense related to non-vested restricted stock awards over a weighted-average life of six months.
Determining the appropriate fair value model and calculating the fair value of share-based payment awards requires the utilization of highly subjective assumptions, including the expected life of the share-based payment awards and stock price volatility. Management determined that historical volatility calculated based on our actively traded common stock is a better indicator of expected volatility and future stock price trends than implied volatility. The assumptions used in calculating the fair value of share-based payment awards represent management’s best estimates, but these estimates involve inherent uncertainties and the application of management’s judgment. As a result, if factors change and we use different assumptions, our stock-based compensation expense could be materially different in the future. In addition, we are required to estimate the expected forfeiture rate and only recognize expense for those shares expected to vest.
We do not believe there is a reasonable likelihood that there will be a material change in the future estimates or assumptions used to determine stock-based compensation expense. However, if actual results are not consistent with our estimates and assumptions we may be exposed to material stock-based compensation expense. For instance, if our actual forfeiture rate decreased by 1%, stock-based compensation expense would have increased by approximately $0.1 million, or 3.5% for the year ended December 31, 2007.
27
DH
M B
P -
3868
0_10
K_7
- P
age
27 o
f 84
- Apr
4, 2
008
- 10:
01:1
6 A
M -
Bla
ck
Results of Operations
The following table sets forth our results of operations expressed as a percentage of net sales for the periods indicated.
Year Ended December 31, 2007
(in thousands) 2007 2006 2005
Net sales ....................................... $ 272,680 100.0% $ 235,846 100.0% $ 181,349 100.0%Cost of sales ................................. 173,329 63.6 149,970 63.6 114,222 63.0
Gross profit.................................... 99,351 36.4 85,876 36.4 67,127 37.0 Research and development expenses ..................................... 8,820 3.2 7,412 3.1 6,580 3.6
Selling, general and administrative expenses.............. 64,080 23.5 59,947 25.4 48,870 27.0
Operating income.......................... 26,451 9.7 18,517 7.9 11,677 6.4 Interest income.............................. 3,104 1.1 1,401 0.5 845 0.5 Other income (expense), net......... 7 0.0 (498) (0.2) 2,152 1.2
Income before income taxes......... 29,562 10.8 19,420 8.2 14,674 8.1 Provision for income taxes............ 9,332 3.4 5,900 2.5 4,973 2.7
Net income .................................... $ 20,230 7.4% $ 13,520 5.7% $ 9,701 5.4%
Year Ended December 31, 2007 Compared to Year Ended December 31, 2006
Consolidated
Net sales for the year ended December 31, 2007 were $272.7 million, an increase of 16% compared to $235.8 million for the same period last year. Net income for 2007 was $20.2 million or $1.40 per share (basic) and $1.33 per share (diluted) compared to $13.5 million or $0.98 per share (basic) and $0.94 per share (diluted) for 2006.
2007 2006
$ (millions) % of total $ (millions) % of total
Net sales: Business ...................................................................... $ 214.7 78.7% $ 178.8 75.8% Consumer .................................................................... 58.0 21.3% 57.0 24.2%
Total net sales.................................................................. $ 272.7 100.0% $ 235.8 100.0%
Net sales in our Business lines (subscription broadcasting, OEM, and computing companies) were approximately 79% of net sales for 2007 compared to approximately 76% for 2006. Net sales in our business lines for 2007 increased by 20% to $214.7 million from $178.8 million in 2006. This increase in sales resulted primarily from an increase in the volume of remote control sales, which was partially offset by lower prices. The increase in remote control sales volume was attributable to the continued deployment of advanced function set-top boxes by the service operators and market share gains with a few key subscription broadcasting customers. These advanced functions include digital video recording (“DVR”), video-on-demand (“VOD”), and high definition television (“HDTV”). We expect that the deployment of the advanced function set-top boxes by the service operators will continue into the foreseeable future as penetration for each of the functions cited continues to increase. As a result, we expect Business category revenue to range between $232 and $248 million in 2008.
Net sales in our Consumer lines (One For All® retail, private label, custom installers, and direct import) were approximately 21% of net sales for 2007 compared to approximately 24% for 2006. Net sales in our consumer lines for 2007 increased by 2% to $58.0 million, from $57.0 million in 2006. The increase in sales resulted primarily from our expanding presence in the custom electronic design & installation association (“CEDIA”) market. CEDIA sales increased by $1.5 million, or 47%, from 2006. Additionally, retail sales made outside of the United States increased by $0.7 million. These sales were positively impacted by the strengthening of both the Euro and the British Pound compared to the U.S. Dollar, which resulted in an increase in net sales of approximately $3.8 million. Net of this positive currency effect, retail sales outside of the United States were down by $3.1 million, primarily due to lower sales in the UK and
28
DH
M B
P -
3868
0_10
K_7
- P
age
28 o
f 84
- Apr
4, 2
008
- 10:
01:1
6 A
M -
Bla
ck
Australia. Partially offsetting these increases were United States direct import licensing and product revenues for 2007, which decreased by $0.9 million, or 44%, to $1.2 million in 2007, down from $2.1 million in 2006. This was due to a decline in royalty revenue and a decline in the volume of Kameleon sales. Additionally, Private Label sales decreased by $0.3 million, or 9%, to $3.2 million in 2007 from $3.5 million in 2006. This was due to a decline in the volume of Kameleon sales in the United States. We expect Consumer category revenue to range between $65 and $81 million in 2008.
Gross profit for 2007 was $99.4 million compared to $85.9 million for 2006. Gross profit as a percent of sales for 2007 was 36.4%, which is comparable to 2006. The gross profit rate was positively impacted by the strengthening of both the Euro and British Pound compared to the U.S. Dollar, which resulted in an increase of approximately $3.6 million in gross profit, or an increase of 0.8% in the gross profit rate. A decrease in royalty expense of $1.4 million, due to lower sales of SKY-branded retail product in Europe, increased the gross profit rate by 0.7%. Offsetting the increases in the gross profit rate was an increase in freight and handling expense of $2.7 million in 2007 as compared to 2006, which reduced the gross profit rate by 0.8%. The increase in freight expense is due primarily to an increase in the percentage of units that were shipped by air; air freight is significantly more costly than ocean freight. Additionally, subscription broadcast sales, which generally have a lower gross profit rate as compared to our other sales, represented a larger percentage of our total business. The impact of this change in mix was a 0.7% reduction in the gross profit rate.
Research and development expenses increased 19% from $7.4 million in 2006 to $8.8 million in 2007. The increase is primarily related to internal as well as third party costs associated with the continued expansion of the Nevo® platform and the development of products for sale in our subscription broadcasting, retail, and OEM channels. We expect that research and development expenses will range between $8.8 million and $9.4 million for the full year 2008.
Selling, general and administrative expenses increased 7% from $59.9 million in 2006 to $64.1 million in 2007. Payroll and benefits increased by $2.6 million due to new hires and merit increases; the strengthening of both the Euro and British Pound compared to the U.S. Dollar resulted in an increase of $2.4 million; long-term incentive compensation increased by $1.0 million; delivery, freight, and handling costs increased by $0.7 million; additional travel resulted in an increase of $0.6 million; director’s fees and expenses increased by $0.4 million; and commission expense increased by $0.2 million. These items were partially offset by lower employee bonus expense, which decreased by $4.0 million. We expect that selling, general, and administrative expenses will range between $70.2 and $74.6 million for the full year 2008.
In 2007, we recorded $3.1 million of net interest income compared to $1.4 million net for 2006. This increase is due to higher money market rates and a higher average cash balance. Net interest income will range between $3.0 and $4.0 million in 2008.
In 2007, we had $7 thousand in other income, net as compared to $0.5 million of other expense, net for 2006. Approximately $0.5 million of other expense in 2006 resulted from foreign currency losses.
We recorded income tax expense of $9.3 million in 2007 compared to $5.9 million in 2006. Our effective tax rate was 31.6% in 2007 compared to 30.4% in 2006. The increase in our effective tax rate is due primarily to additional income earned in higher tax-rate jurisdictions. We estimate that our effective tax rate will range between 33% and 35% for the full year 2008.
29
DH
M B
P -
3868
0_10
K_7
- P
age
29 o
f 84
- Apr
4, 2
008
- 10:
01:1
6 A
M -
Bla
ck
Year Ended December 31, 2006 Compared to Year Ended December 31, 2005
Consolidated
Net sales for the year ended December 31, 2006 were $235.8 million, an increase of 30% compared to $181.3 million for the same period last year. Net income for 2006 was $13.5 million or $0.98 per share (basic) and $0.94 per share (diluted) compared to $9.7 million or $0.72 per share (basic) and $0.69 per share (diluted) for 2005.
2006 2005
$ (millions) % of total $ (millions) % of total
Net sales: Business ...................................................................... $ 178.8 75.8% $ 126.2 69.6% Consumer .................................................................... 57.0 24.2% 55.1 30.4%
Total net sales.................................................................. $ 235.8 100.0% $ 181.3 100.0%
Net sales in our Business lines (subscription broadcasting, OEM, and computing companies) were approximately 76% of net sales for 2006 compared to approximately 70% for 2005. Net sales in our business lines for 2006 increased by 42% to $178.8 million from $126.2 million in 2005. This increase in sales resulted primarily from an increase in the volume of remote control sales, which was partially offset by lower prices. The increase in remote control sales volume was attributable to the continued deployment of advanced function set-top boxes by the service operators and market share gains with a few key subscription broadcasting customers. These advanced functions include digital video recording (“DVR”), video-on-demand (“VOD”), and high definition television (“HDTV”).
Net sales in our Consumer lines (One For All® retail, private label, custom installers, and direct import) were approximately 24% of net sales for 2006 compared to approximately 30% for 2005. Net sales in our consumer lines for 2006 increased by 4% to $57.0 million, from $55.1 million in 2005. Retail sales outside North America and Europe increased by $1.2 million compared to 2005 due to a new distributor in Australia and strong sales in Argentina, Brazil and New Zealand. The increase in consumer lines net sales was also driven by the strengthening of both the Euro and the British Pound compared to the U.S. Dollar, which resulted in an increase in net sales of approximately $1.0 million. However, excluding the positive foreign exchange impact, the dollar amount of European Retail sales was constant, compared to the prior year. This increase in consumer lines net sales was also driven by our entry into the custom electronic design & installation association (“CEDIA”) market in the second quarter of 2005, as CEDIA sales increased by $0.8 million from 2005. Partially offsetting these increases was Private Label sales, which decreased by $0.5 million, or 12%, to $3.5 million in 2006 from $4.0 million in 2005. This was due to a decline in the volume of Kameleon sales in the United States. Additionally, United States direct import licensing and product revenues for 2006 decreased by $0.4 million or 16%, to $2.1 million in 2006 from $2.5 million in 2005, due to a decline in royalty revenue.
Gross profit for 2006 was $85.9 million compared to $67.1 million for 2005. Gross profit as a percent of sales for 2006 was 36.4% compared to 37.0% for 2005. The decrease in gross profit as a percentage of net sales was primarily attributable to subscription broadcast sales, which generally have a lower gross profit rate as compared to our other sales, representing a larger percentage of our total business. The impact of this change in mix was a 3.3% reduction in the gross profit rate. Partially offsetting this decrease in the gross profit rate was a reduction of $1.4 million of freight expense recorded in 2006 as compared to 2005. In 2006, there was a decrease in the percentage of units that were shipped by air. Lower freight expense contributed to a 1.2% increase in the gross profit rate. A reduction in inventory scrap expense of $0.9 million added 0.7% to the gross profit rate. Scrap expense has declined as inventory management has improved. Royalty expense increased $41 thousand, but added 0.5% to the gross profit rate. Royalty expense is tied to Consumer sales, which have declined as a percentage of our total business. Warranty expense decreased by $0.2 million, which added 0.2% to the profit rate. Gross profit was also favorably impacted by the strengthening of both the Euro and British Pound compared to the U.S. Dollar, which resulted in an increase in gross profit of approximately $0.9 million and an increase of 0.2% in the gross profit rate.
Research and development expenses increased 13% from $6.6 million in 2005 to $7.4 million in 2006. The expensing of stock options, which was adopted on January 1, 2006 (SFAS 123R), accounted for $0.4 million of the increase. The remainder of the increase is related to development efforts with radio frequency technology using the Z-Wave platform, continued expansion of the Nevo® platform and development efforts taking place at our San Mateo location.
30
DH
M B
P -
3868
0_10
K_7
- P
age
30 o
f 84
- Apr
4, 2
008
- 10:
01:1
6 A
M -
Bla
ck
Selling, general and administrative expenses increased 23% from $48.9 million in 2005 to $59.9 million in 2006. Employee performance-based bonuses increased by $4.0 million, payroll and benefits increased by $3.5 million due to the growth of our company, expensing of stock options, which was adopted on January 1, 2006 (SFAS 123R), amounted to $2.4 million, travel increased $0.8 million, delivery and freight costs increased by $0.5 million due to the increase in sales volume, advertising increased by $0.5 million, $0.4 million is attributable to tradeshows and $0.4 million due to the strengthening of both the Euro and British Pound compared to the U.S. Dollar. These items were partially offset by lower bad debt expense, which decreased by $1.9 million. Fiscal 2005 bad debt expense included a $1.6 million write-down for a receivable due from a former European distributor.
In 2006, we recorded $1.4 million of interest income compared to $0.8 million for 2005. This increase is due to higher money market rates and a higher average cash balance.
In 2006, other expense, net was $0.5 million as compared to $2.2 million of other income, net for 2005. Approximately $0.5 million of other expense in 2006 resulted from foreign currency losses, and approximately $2.1 million of other income in 2005 resulted from foreign currency gains.
We recorded income tax expense of $5.9 million in 2006 compared to $5.0 million in 2005. Our effective tax rate was 30.4% in 2006 compared to 33.9% in 2005. The decrease in our effective tax rate is due primarily to the Netherlands’ statutory tax rate decreasing from 31.5% in 2005 to 29.6% in 2006.
Liquidity and Capital Resources
(In thousands)
Year Ended December 31, 2007
Increase (decrease)
Year Ended December 31, 2006
Increase (decrease)
Year Ended December 31, 2005
Cash provided by operating activities ..... $ 19,937 $ 2,725 $ 17,212 $ 3,083 $ 14,129 Cash used for investing activities............ (6,183) (1,115) (5,068) (1,031) (4,037) Cash provided by (used for) financing activities................................................. 1,398 (3,785) 5,183 8,429 (3,246)
Effect of exchange rate changes ............ 5,383 276 5,107 10,784 (5,677)
December 31, 2007 Increase (decrease) December 31, 2006
Cash and cash equivalents ............................................ $ 86,610 $ 20,535 $ 66,075 Working capital............................................................... 140,330 34,151 106,179
Cash provided by operating activities
Our principal sources of funds are from operations. Cash provided by operating activities for 2007 was $19.9 million, compared to $17.2 million and $14.1 million during 2006 and 2005, respectively. The increase in cash flows from operations in 2007 compared to 2006 was primarily due to the increase in net income of 50% from $13.5 million in 2006 to $20.2 million in 2007, offset partially by an increase in days sales outstanding and a decrease in inventory turns. Our days sales outstanding increased due to certain customers delaying payment beyond their respective payment terms. We do not believe that these customers represent a credit risk or bad debt risk. The decrease in inventory turns is due directly to weaker than expected fourth quarter sales.
The increase in cash flows from operations in 2006 compared to 2005 is primarily due to an increase in net sales, which resulted in an increase in net income of 39% from $9.7 million in 2005 to $13.5 million in 2006, as well as improvement in our days sales outstanding and overall inventory management. Our days sales outstanding improved from approximately 74 days at December 31, 2005 to approximately 64 days at December 31, 2006, due primarily to strong collections from our significant customers. In addition, despite an increase in net sales of approximately 30% from 2005 to 2006, inventory levels remained relatively constant with the prior year.
31
DH
M B
P -
3868
0_10
K_7
- P
age
31 o
f 84
- Apr
4, 2
008
- 10:
01:1
6 A
M -
Bla
ck
Cash used for investing activities
Cash used for investing activities during 2007 was $6.2 million as compared to $5.1 million and $4.0 million during 2006 and 2005, respectively. The increase in cash used for investing activities in 2007 compared to 2006 was due to increased capital expenditures. Capital expenditures in 2007, 2006, and 2005 were $4.8 million, $4.1 million and $3.1 million, respectively. During the first quarter of 2007, we began to renovate and expand our corporate headquarters. Construction is expected to be completed during the first quarter of 2008. The total cost of this renovation is estimated to be approximately $1.8 million, which will be financed through our current operations. In addition we will receive $0.4 million tenant improvement allowance upon completion of construction. We also plan to make a significant investment to upgrade our information systems, which we expect to cost approximately $1.0 million. The strategic planning for the upgrade of our information systems commenced in the second quarter of 2007 and we expect implementation to be completed in 2009. In addition, in order to support our sales growth, annual purchases of tooling equipment have increased throughout the years.
Cash provided by (used for) financing activities
Cash provided by financing activities during 2007 was $1.4 million compared to cash provided by financing activities during 2006 of $5.2 million and cash used for financing activities of $3.2 million during 2005. Proceeds from stock option exercises were $12.6 million during 2007, compared to proceeds of $7.5 million and $2.9 million during 2006 and 2005, respectively. In 2007, gain on stock option exercises resulted in a $3.3 million excess tax benefit compared to $275 thousand and $0 for 2006 and 2005, respectively. We purchased 471,300 shares of our common stock at a cost of $14.5 million during 2007, compared to 127,326 and 356,285 shares at a cost of $2.6 million and $6.1 million during 2006 and 2005, respectively. We hold these shares as treasury stock, and they are available for reissue. Presently, except for using a minimal number of these treasury shares to compensate our outside board members, we have no plans to distribute these shares, although we may change these plans if necessary to fulfill our on-going business objectives.
Effective August 31, 2006, we amended our original Credit Facility with Comerica, extending our line of credit through August 31, 2009. Under the amended Credit Facility, we have authority to acquire up to an additional 2.0 million shares of our common stock in the open market. From August 31, 2006, through December 31, 2007, we purchased 567,900 shares of our common stock, leaving 1,432,100 shares available for purchase under the Credit Facility. During 2008 we may continue to purchase shares of our common stock if we believe conditions are favorable and to offset the dilutive effect of stock option exercises.
The amended Credit Facility provides a $15 million unsecured revolving credit agreement with Comerica for an additional three years, expiring on August 31, 2009. Under the Credit Facility, the interest payable is variable and is based on the bank’s cost of funds or the LIBOR rate plus a fixed margin of 1.25%. The interest rate in effect as of December 31, 2007 using the LIBOR Rate option plus a fixed margin of 1.25% was 5.47%. We pay a commitment fee ranging from zero to a maximum rate of 1/4 of 1% per year on the unused portion of the credit line depending on the amount of cash investment retained with Comerica during each quarter. Under the terms of the Credit Facility, dividend payments are allowed for up to 100% of the prior fiscal year’s net income, to be paid within 90 days of this period’s year end. We are subject to certain financial covenants related to our net worth, quick ratio, and net income. Amounts available for borrowing under the Credit Facility are reduced by the outstanding balance of import letters of credit. As of December 31, 2007, we did not have any amounts outstanding under the Credit Facility or any outstanding import letters of credit. Furthermore, as of December 31, 2007, we were in compliance with all financial covenants required by the Credit Facility. As of December 31, 2007, we had available $15 million on the line of credit.
Historically, our working capital needs have typically been greatest during the third and fourth quarters when accounts receivable and inventories increase in connection with the fourth quarter holiday selling season. At December 31, 2007, we had $140.3 million of working capital as compared to $106.2 at December 31, 2006. The increase in working capital during these periods is principally due to higher cash, accounts receivable and inventory balances at December 31, 2007 compared to December 31, 2006.
32
DH
M B
P -
3868
0_10
K_7
- P
age
32 o
f 84
- Apr
4, 2
008
- 10:
01:1
6 A
M -
Bla
ck
The following table summarizes our contractual obligations at December 31, 2007 and the effect these obligations are expected to have on our liquidity and cash flow in future periods.
Payments Due by Period (in thousands) Contractual Obligations Total
Less than 1 year
1 - 3 Years
4 - 5 years
After 5 years
Operating Lease Obligations ............................................... $ 5,876 $ 1,756 $ 2,465 $ 1,351 $ 304Purchase Obligations(1) ........................................................ 19,762 19,762 — — —Total ..................................................................................... $ 25,638 $ 21,518 $ 2,465 $ 1,351 $ 304____________ (1) Purchase obligations primarily consist of an agreement with a specific vendor to purchase
approximately 80% of our integrated circuits through October 16, 2008 from this vendor.
At December 31, 2007, we did not have any bank guarantees that provide for the bank to make payment on our behalf in the event of our non-payment for transactions with suppliers in the ordinary course of business.
At December 31, 2007, we had approximately $12.2 million and $74.4 million of cash and cash equivalents in the United States and Europe, respectively.
It is our policy to carefully monitor the state of our business, cash requirements and capital structure. We believe that funds generated from our operations and available from our credit facility will be sufficient to fund current business operations as well as anticipated growth at least through the end of 2008; however, there can be no assurance that such funds will be adequate for that purpose.
Off Balance Sheet Arrangements
We do not participate in any off balance sheet arrangements.
New Accounting Pronouncements
In September 2006, the FASB issued SFAS No. 157, “Fair Value Measurements” (“SFAS 157”), which defines fair value, establishes a framework for measuring fair value in generally accepted accounting principles (GAAP), and expands disclosures about fair value measurements for assets and liabilities. SFAS 157 applies when other accounting pronouncements require or permit assets or liabilities to be measured at fair value. Accordingly, SFAS 157 does not require new fair value measurements. SFAS 157 is effective for fiscal years beginning after November 15, 2007. On February 12, 2008 the FASB issued FASB Staff Position for SFAS 157 (“FSP FAS 157-2”), which delays the effective date of SFAS 157 for nonfinancial assets and nonfinancial liabilities, except for items that are recognized or disclosed at fair value in an entity’s financial statements on a recurring basis (at least annually) until fiscal years beginning after November 15, 2008. We are required to adopt the provisions of SFAS 157 in the first quarter of 2008, except for those items within scope of FSP FAS 157-2, which we will adopt in the first quarter of 2009. We do not expect the adoption of SFAS 157 to have a material effect on our consolidated results of operations and financial condition.
In February 2007, the FASB issued SFAS No. 159, “The Fair Value Option for Financial Assets and Financial Liabilities—Including an amendment of FASB Statement No. 115” (“SFAS 159”). SFAS 159 expands the use of fair value accounting but does not affect existing standards that require assets or liabilities to be carried at fair value. Under SFAS 159, a company may elect to use fair value to measure accounts and loans receivable, available-for-sale and held-to-maturity securities, equity method investments, accounts payable, guarantees and issued debt. Other eligible items include firm commitments for financial instruments that otherwise would not be recognized at inception and non-cash warranty obligations where a warrantor is permitted to pay a third party to provide the warranty goods or services. If the use of fair value is elected, any upfront costs and fees related to the item must be recognized in earnings and cannot be deferred, such as debt issuance costs. The fair value election is irrevocable and generally made on an instrument-by-instrument basis, even if a company has similar
33
DH
M B
P -
3868
0_10
K_7
- P
age
33 o
f 84
- Apr
4, 2
008
- 10:
01:1
6 A
M -
Bla
ck
instruments that it elects not to measure based on fair value. At the adoption date, unrealized gains and losses on existing items for which fair value has been elected are reported as a cumulative adjustment to beginning retained earnings. Subsequent to the adoption of SFAS 159, changes in fair value are recognized in earnings. SFAS 159 is effective for fiscal years beginning after November 15, 2007 and is required to be adopted by us in the first quarter of fiscal 2008. We currently are determining whether fair value accounting is appropriate for any of our eligible items and cannot estimate the impact that SFAS 159 will have on our consolidated results of operations and financial condition.
In June 2007, the FASB ratified EITF 07-3, “Accounting for Nonrefundable Advance Payments for Goods or Services Received for Use in Future Research and Development Activities” (“EITF 07-3”). EITF 07-3 requires that nonrefundable advance payments for goods or services that will be used or rendered for future research and development activities be deferred and capitalized and recognized as an expense as the goods are delivered or the related services are performed. EITF 07-3 is effective, on a prospective basis, for fiscal years beginning after December 15, 2007 and will be adopted by us in the first quarter of fiscal 2008. We do not expect the adoption of EITF 07-3 to have a material effect on our consolidated results of operations and financial condition.
In December 2007, the FASB issued SFAS No. 141 (revised 2007), “Business Combinations” (“SFAS 141R”). SFAS 141R establishes principles and requirements for how an acquirer recognizes and measures in its financial statements the identifiable assets acquired, the liabilities assumed, any noncontrolling interest in the acquiree and the goodwill acquired. SFAS 141R also establishes disclosure requirements to enable the evaluation of the nature and financial effects of the business combination. SFAS 141R is effective as of the beginning of an entity’s fiscal year that begins after December 15, 2008, and will be adopted by us in the first quarter of fiscal 2009. We do not believe that the adoption of Statement 141R will have an effect on our financial statements; however, the effect is dependent upon whether we make any future acquisitions and the specifics of those acquisitions.
In December 2007, the FASB ratified EITF 07-1, “Accounting for Collaborative Arrangements Related to the Development and Commercialization of Intellectual Property” (“EITF 07-1”). EITF 07-1 defines collaborative arrangements and establishes disclosure requirements for transactions between participants in a collaborative arrangement and between participants in the arrangement and third parties. EITF 07-1 is effective as of the beginning of an entity’s fiscal year that begins after December 15, 2008 and should be applied retrospectively to all prior periods presented for all collaborative arrangements existing as of the effective date. EITF 07-1 is effective for us beginning January 1, 2009. Currently, we do not have any collaborative arrangements; therefore, we do not currently believe that the adoption of EITF 07-1 will have an impact on our consolidated results of operations and financial condition.
In December 2007, the FASB issued SFAS No. 160, “Noncontrolling Interests in Consolidated Financial Statements: an amendment of ARB No. 51” (“SFAS 160”). SFAS 160 changes the accounting for, and the financial statement presentation of, noncontrolling equity interests in a consolidated subsidiary. SFAS 160 replaces the existing minority-interest provisions of Accounting Research Bulletin 51 (“ARB 51”), “Consolidated Financial Statements,” by defining a new term-noncontrolling interests-to replace what were previously called minority interests. The new standard establishes noncontrolling interests as a component of the equity of a consolidated entity. The underlying principle of the new standard is that both the controlling interest and the noncontrolling interests are part of the equity of a single economic entity: the consolidated reporting entity. Classifying noncontrolling interests as a component of consolidated equity is a change from the current practice of treating minority interests as a mezzanine item between liabilities and equity or as a liability. The change affects both the accounting and financial reporting for noncontrolling interests in a consolidated subsidiary. SFAS 160 includes reporting requirements intended to clearly identify and differentiate the interests of the parent and the interests of the noncontrolling owners. The reporting requirements are required to be applied retrospectively. SFAS 160 is effective for fiscal years and interim periods within those fiscal years beginning on or after December 15, 2008. Early adoption is prohibited. We currently do not believe that the adoption of SFAS 160 will have a significant effect on our financial statements as we wholly own our subsidiaries.
34
DH
M B
P -
3868
0_10
K_7
- P
age
34 o
f 84
- Apr
4, 2
008
- 10:
01:1
6 A
M -
Bla
ck

Outlook
Our focus is to build technology and products that make the consumer’s interaction with devices and content within the home easier and more enjoyable. The pace of change in the home is increasing. The growth of new devices, such as DVD players, PVR/DVR technologies, HDTV and home theater solutions, to name only a few, has transformed control of the home entertainment center into a complex challenge for the consumer. The more recent introduction and projected growth of digital media technologies in the consumer’s life will further increase this complexity. We have set out to create the interface for the connected home, building a bridge between the home devices of today and the networked home of the future. We intend to invest in new products and technology, particularly in the connected home space, which will expand our business beyond the control of devices to the control of and access to content, such as digital media, to enrich the entertainment experience.
We will continue enhancing our leadership position in our core business by developing custom products for our subscription broadcasting, OEM, retail and computing customers, growing our capture expertise in infrared technology and radio frequency standards, adding to our portfolio of patented or patent pending technologies and developing new platform products. We are also developing new ways to enhance remote controls and other accessory products.
We are continuing to seek ways to use our technology to make the set-up and use of control products, and the access to and control of digital entertainment within the home entertainment network, easier and more affordable. In addition, we are working on product line extensions to our One For All® branded products which include digital antennas, signal boosters, and other A/V accessories.
We are also seeking ways to increase our customer base worldwide, particularly in the areas of subscription broadcasting, OEM and One For All® international retail. We will continue to work on strengthening existing relationships by working with customers to understand how to make the consumer interaction with products and services within the home easier and more enjoyable. We intend to invest in new products and technology to meet our customer needs now and into the future.
We will continue developing software and firmware solutions that can enable devices such as TVs, set-top boxes, stereos, automotive audio systems and other consumer electronic products to wirelessly connect and interact with home networks and interactive services to deliver digital entertainment and information. This “smart device” category is emerging, and in the remainder of 2008 we look to continue to build relationships with our customers in this category.
Throughout 2008, we will continue to evaluate acceptable acquisition targets and strategic partnership opportunities in our core business lines as well as in the networked home marketplace. We caution, however, that no assurance can be made that any suitable acquisition target or partnership opportunity will be identified and, if identified, that a transaction can be consummated. Moreover, if consummated, no assurance can be made that any such acquisition or partnership will profitably add to our operations.
35
DH
M B
P -
3868
0_10
K_7
- P
age
35 o
f 84
- Apr
4, 2
008
- 10:
01:1
6 A
M -
Bla
ck
ITEM 7A. QUANTITATIVE AND QUALITATIVE DISCLOSURES ABOUT MARKET RISK
We are exposed to various market risks, including interest rate and foreign currency exchange rate fluctuations. We have established policies, procedures and internal processes governing our management of these risks and the use of financial instruments to mitigate our risk exposure.
On August 31, 2006, we amended our credit facility to extend for an additional three years, expiring on August 31, 2009. The interest payable under our revolving Credit Facility with our bank is variable and based on either (i) the bank’s cost of funds or (ii) the LIBOR rate plus a fixed margin of 1.25%; the rate is affected by changes in market interest rates. At December 31, 2007, we had no borrowings on our credit facility. The interest rate in effect on the credit facility as of December 31, 2007 using the LIBOR Rate option plus a fixed margin of 1.25% was 5.47%.
At December 31, 2007 we had wholly owned subsidiaries in the Netherlands, United Kingdom, Germany, France, Argentina, Spain, Italy, Singapore, Hong Kong and India. Sales from these operations are typically denominated in local currencies including Euros, British Pounds and Argentine Pesos, thereby creating exposure to changes in exchange rates. Changes in local currency exchange rates relative to the U.S. Dollar and, in some cases, to each other, may positively or negatively affect our sales, gross margins and net income. From time to time, we enter into foreign currency exchange agreements to manage our exposure arising from fluctuating exchange rates that affect cash flows and our reported income. Contract terms for the foreign currency exchange agreements normally last less than nine months. We do not enter into any derivative transactions for speculative purposes.
The value of our net balance sheet positions held in foreign currency can also be impacted by fluctuating exchange rates, as can the value of the income generated by our European subsidiaries. It is difficult to estimate the impact of fluctuations on reported income, as it depends on the opening and closing rates, the average net balance sheet positions held in a foreign currency and the amount of income generated in local currency. We routinely forecast what these balance sheet positions and income generated in local currency may be, and we take steps to minimize exposure as we deem appropriate.
The sensitivity of earnings and cash flows to the variability in exchange rates is assessed by applying an approximate range of potential rate fluctuations to our assets, obligations and projected results of operations denominated in foreign currency. Based on our overall foreign currency rate exposure at December 31, 2007, we believe that movements in foreign currency rates could have a material affect on our financial position. We estimate that if the exchange rates for the Euro and the British Pound relative to the U.S. Dollar fluctuate 10% from December 31, 2007, net income and cash flows in the first quarter of 2008 would fluctuate by approximately $0.1 million and $9.5 million, respectively.
36
DH
M B
P -
3868
0_10
K_7
- P
age
36 o
f 84
- Apr
4, 2
008
- 10:
01:1
6 A
M -
Bla
ck
ITEM 8. FINANCIAL STATEMENTS AND SUPPLEMENTARY DATA
INDEX TO CONSOLIDATED FINANCIAL STATEMENTS
Page
Report of Independent Registered Public Accounting Firm — Grant Thornton LLP ........................... 38 Consolidated Balance Sheets at December 31, 2007 and 2006......................................................... 39 Consolidated Income Statements for the years ended December 31, 2007, 2006 and 2005............. 40 Consolidated Statements of Stockholders’ Equity for the years ended December 31, 2007, 2006
and 2005 ............................................................................................................................................ 41 Consolidated Statements of Cash Flows for the years ended December 31, 2007, 2006
and 2005 ............................................................................................................................................ 43 Notes to Consolidated Financial Statements....................................................................................... 44 Financial Statement Schedule: Schedule II — Valuation and Qualifying Accounts and Reserves for the years ended December 31, 2007, 2006 and 2005 ........................................................................ 73
All other schedules are omitted because they are not applicable or the required information is shown in the financial statements or notes thereto.
37
DH
M B
P -
3868
0_10
K_7
- P
age
37 o
f 84
- Apr
4, 2
008
- 10:
01:1
6 A
M -
Bla
ck
38
REPORT OF INDEPENDENT REGISTERED PUBLIC ACCOUNTING FIRM
Board of Directors and Shareholders Universal Electronics Inc.
We have audited the accompanying consolidated balance sheets of Universal Electronics Inc. (a Delaware corporation) as of December 31, 2007 and 2006, and the related consolidated statements of income, stockholders’ equity, and cash flows for each of the three years in the period ended December 31, 2007. Our audits of the basic financial statements included the financial statement schedule listed in the index to consolidated financial statements. These financial statements and financial statement schedule are the responsibility of the Company’s management. Our responsibility is to express an opinion on these financial statements and financial statement schedule based on our audits.
We conducted our audits in accordance with the standards of the Public Company Accounting Oversight Board (United States). Those standards require that we plan and perform the audit to obtain reasonable assurance about whether the financial statements are free of material misstatement. An audit includes examining, on a test basis, evidence supporting the amounts and disclosures in the financial statements. An audit also includes assessing the accounting principles used and significant estimates made by management, as well as evaluating the overall financial statement presentation. We believe that our audits provide a reasonable basis for our opinion.
In our opinion, the consolidated financial statements referred to above present fairly, in all material respects, the financial position of Universal Electronics Inc. as of December 31, 2007 and 2006, and the results of its operations and its cash flows for each of the three years in the period ended December 31, 2007 in conformity with accounting principles generally accepted in the United States of America. Also in our opinion, the related financial statement schedule, when considered in relation to the basic financial statements taken as a whole, presents fairly, in all material respects, the information set forth therein.
As discussed in Notes 2 and 16 to the consolidated financial statements, the Company adopted FASB Interpretation No. 48, “Accounting for Uncertainty in Income Taxes — an Interpretation of Statement No. 109”, effective January 1, 2007. As discussed in Notes 2 and 11 to the consolidated financial statements, the Company changed its method of accounting for stock-based compensation as a result of adopting Statement of Financial Accounting Standards No. 123(R), “Share-Based Payment”, effective January 1, 2006.
We also have audited, in accordance with the standards of the Public Company Accounting Oversight Board (United States), Universal Electronics Inc.’s internal control over financial reporting as of December 31, 2007, based on criteria established in Internal Control—Integrated Framework issued by the Committee of Sponsoring Organizations of the Treadway Commission (COSO) and our report dated March 5, 2008 expressed an unqualified opinion.
/s/ Grant Thornton LLP
Irvine, California March 5, 2008
DH
M B
P -
3868
0_10
K_7
- P
age
38 o
f 84
- Apr
4, 2
008
- 10:
01:1
6 A
M -
Bla
ck
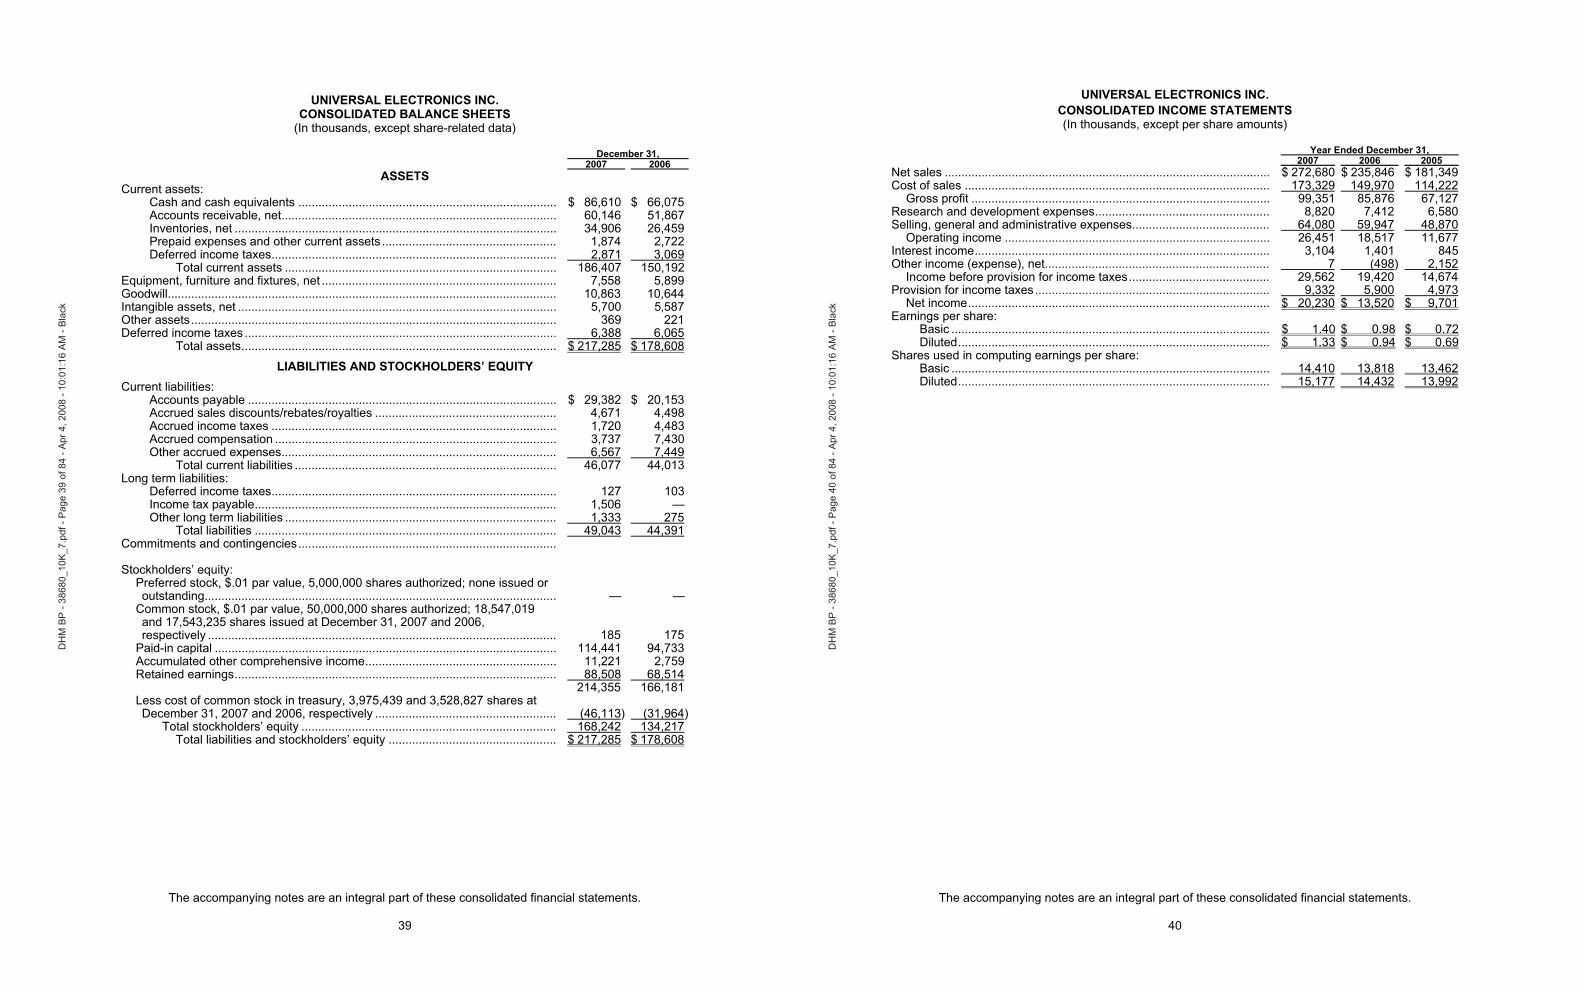
UNIVERSAL ELECTRONICS INC.CONSOLIDATED BALANCE SHEETS
(In thousands, except share-related data)
December 31, 2007 2006
ASSETSCurrent assets:
Cash and cash equivalents ............................................................................. $ 86,610 $ 66,075 Accounts receivable, net.................................................................................. 60,146 51,867 Inventories, net ................................................................................................ 34,906 26,459Prepaid expenses and other current assets .................................................... 1,874 2,722 Deferred income taxes..................................................................................... 2,871 3,069
Total current assets ................................................................................. 186,407 150,192 Equipment, furniture and fixtures, net ...................................................................... 7,558 5,899 Goodwill.................................................................................................................... 10,863 10,644 Intangible assets, net ............................................................................................... 5,700 5,587Other assets............................................................................................................. 369 221 Deferred income taxes ............................................................................................. 6,388 6,065
Total assets.............................................................................................. $ 217,285 $ 178,608
LIABILITIES AND STOCKHOLDERS’ EQUITYCurrent liabilities:
Accounts payable ............................................................................................ $ 29,382 $ 20,153 Accrued sales discounts/rebates/royalties ...................................................... 4,671 4,498 Accrued income taxes ..................................................................................... 1,720 4,483 Accrued compensation .................................................................................... 3,737 7,430 Other accrued expenses.................................................................................. 6,567 7,449
Total current liabilities .............................................................................. 46,077 44,013 Long term liabilities:
Deferred income taxes..................................................................................... 127 103 Income tax payable.......................................................................................... 1,506 — Other long term liabilities ................................................................................. 1,333 275
Total liabilities .......................................................................................... 49,043 44,391Commitments and contingencies.............................................................................
Stockholders’ equity: Preferred stock, $.01 par value, 5,000,000 shares authorized; none issued or outstanding......................................................................................................... — —
Common stock, $.01 par value, 50,000,000 shares authorized; 18,547,019 and 17,543,235 shares issued at December 31, 2007 and 2006, respectively ........................................................................................................ 185 175
Paid-in capital ...................................................................................................... 114,441 94,733 Accumulated other comprehensive income......................................................... 11,221 2,759 Retained earnings................................................................................................ 88,508 68,514
214,355 166,181 Less cost of common stock in treasury, 3,975,439 and 3,528,827 shares at December 31, 2007 and 2006, respectively ...................................................... (46,113) (31,964)
Total stockholders’ equity ............................................................................ 168,242 134,217Total liabilities and stockholders’ equity .................................................. $ 217,285 $ 178,608
The accompanying notes are an integral part of these consolidated financial statements.
39
DH
M B
P -
3868
0_10
K_7
- P
age
39 o
f 84
- Apr
4, 2
008
- 10:
01:1
6 A
M -
Bla
ck
UNIVERSAL ELECTRONICS INC.
The accompanying notes are an integral part of these consolidated financial statements.
40
CONSOLIDATED INCOME STATEMENTS(In thousands, except per share amounts)
Year Ended December 31, 2007 2006 2005
Net sales ................................................................................................. $ 272,680 $ 235,846 $ 181,349Cost of sales ........................................................................................... 173,329 149,970 114,222
Gross profit ......................................................................................... 99,351 85,876 67,127Research and development expenses.................................................... 8,820 7,412 6,580Selling, general and administrative expenses......................................... 64,080 59,947 48,870
Operating income ............................................................................... 26,451 18,517 11,677Interest income........................................................................................ 3,104 1,401 845Other income (expense), net................................................................... 7 (498) 2,152
Income before provision for income taxes.......................................... 29,562 19,420 14,674Provision for income taxes...................................................................... 9,332 5,900 4,973
Net income.......................................................................................... $ 20,230 $ 13,520 $ 9,701Earnings per share:
Basic ............................................................................................... $ 1.40 $ 0.98 $ 0.72Diluted............................................................................................. $ 1.33 $ 0.94 $ 0.69
Shares used in computing earnings per share: Basic ............................................................................................... 14,410 13,818 13,462Diluted............................................................................................. 15,177 14,432 13,992
DH
M B
P -
3868
0_10
K_7
- P
age
40 o
f 84
- Apr
4, 2
008
- 10:
01:1
6 A
M -
Bla
ck
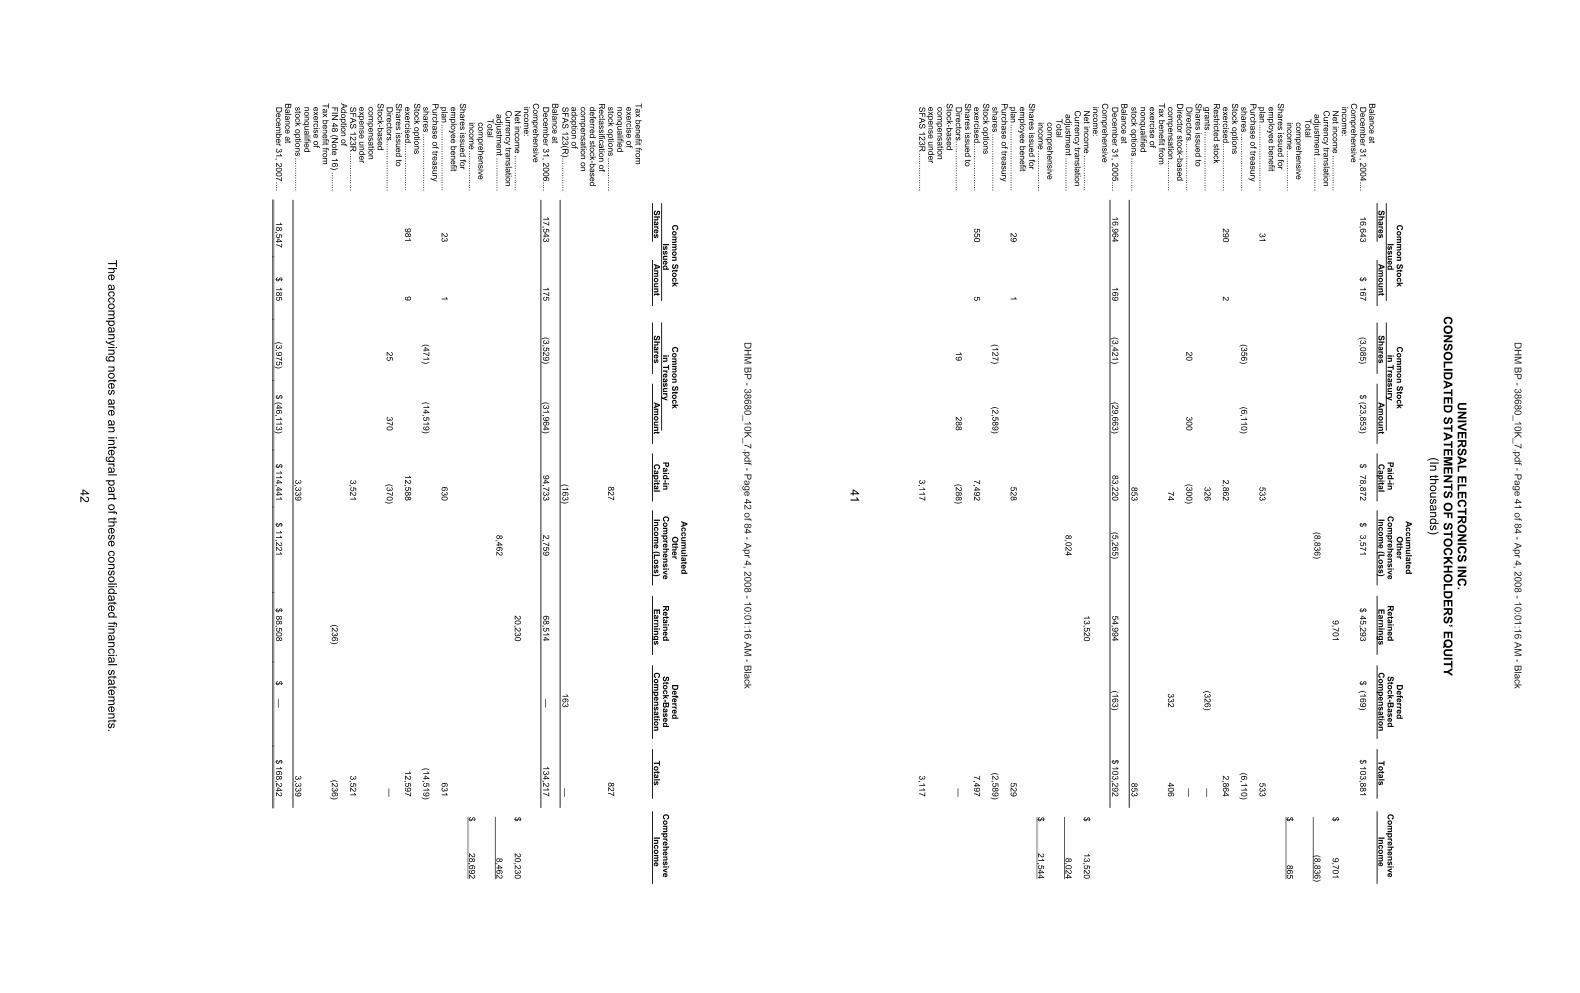
UN
IVERSA
L ELECTR
ON
ICS IN
C.
CO
NSO
LIDA
TED STA
TEMEN
TS OF STO
CK
HO
LDER
S’ EQU
ITY(In thousands)
C
omm
on Stock
Issued
Com
mon Stock
in Treasury
Paid-in
A
ccumulated
O
ther C
omprehensive
R
etained
D
eferred
Stock-Based
C
omprehensive
Shares A
mount
Shares
A
mount
C
apital
Income (Loss)
Earnings
C
ompensation
Totals
Incom
e Balance at D
ecember 31, 2004....
16,643
$ 167
(3,085)
$ (23,853)
$
78,872
$ 3,571
$ 45,293
$ (169)
$ 103,881
Com
prehensive incom
e: N
et income
...............
9,701
$
9,701
Currency translation
adjustment..............
(8,836)
(8,836)Total com
prehensive incom
e.................
$
865
Shares issued for em
ployee benefit plan
............................ 31
533
533
Purchase of treasury shares........................
(356)
(6,110)
(6,110)
Stock options exercised....................
290
2
2,862
2,864 R
estricted stock grants.........................
326
(326)
—
S
hares issued to D
irectors.....................
20 300
(300)
—
D
irector stock-based com
pensation.............
74
332
406 Tax benefit from
exercise of nonqualified stock options..............
853
853
B
alance at D
ecember 31, 2005....
16,964
169
(3,421)
(29,663)
83,220
(5,265)
54,994
(163)
$ 103,292
Com
prehensive incom
e: N
et income
...............
13,520
$
13,520
Currency translation
adjustment..............
8,024
8,024
Total com
prehensive incom
e.................
$
21,544
Shares issued for em
ployee benefit plan
............................ 29
1
528
529
Purchase of treasury shares........................
(127)
(2,589)
(2,589)
Stock options exercised....................
550
5
7,492
7,497 S
hares issued to D
irectors.....................
19 288
(288)
—
S
tock-based com
pensation expense under S
FAS
123R................
3,117
3,117
41
DH
M B
P - 38680_10K
_7.pdf - Page 41 of 84 - A
pr 4, 2008 - 10:01:16 AM
- Black
The accompanying notes are an integral part of these consolidated financial statem
ents.
42
C
omm
on Stock
Issued
Com
mon Stock
in Treasury
Paid-in
A
ccumulated
O
ther C
omprehensive
R
etained
D
eferred
Stock-Based
C
omprehensive
Shares A
mount
Shares
A
mount
Capital
Income (Loss)
Earnings
C
ompensation
Totals
Incom
e
Tax benefit from
exercise of nonqualified stock options..............
827 827
Reclassification of
deferred stock-based com
pensation on adoption of S
FAS
123(R)..............
(163)
163
—
Balance at D
ecember 31, 2006....
17,543
175
(3,529)
(31,964)
94,733
2,759
68,514
—
134,217
Com
prehensive incom
e: N
et income
...............
20,230
$
20,230
Currency translation
adjustment..............
8,462
8,462Total com
prehensive incom
e.................
$
28,692
Shares issued for em
ployee benefit plan
............................ 23
1
630
631
Purchase of treasury shares........................
(471)
(14,519)
(14,519)
Stock options exercised....................
981
9
12,588
12,597 S
hares issued to D
irectors.....................
25 370
(370)
—
S
tock-based com
pensation expense under S
FAS
123R................
3,521
3,521
Adoption of FIN
48 (Note 16)........
(236)
(236)
Tax benefit from
exercise of nonqualified stock options..............
3,339
3,339
Balance at D
ecember 31, 2007....
18,547
$ 185
(3,975)
$ (46,113)
$ 114,441
$ 11,221
$ 88,508
$
—
$ 168,242
DH
M B
P - 38680_10K
_7.pdf - Page 42 of 84 - A
pr 4, 2008 - 10:01:16 AM
- Black
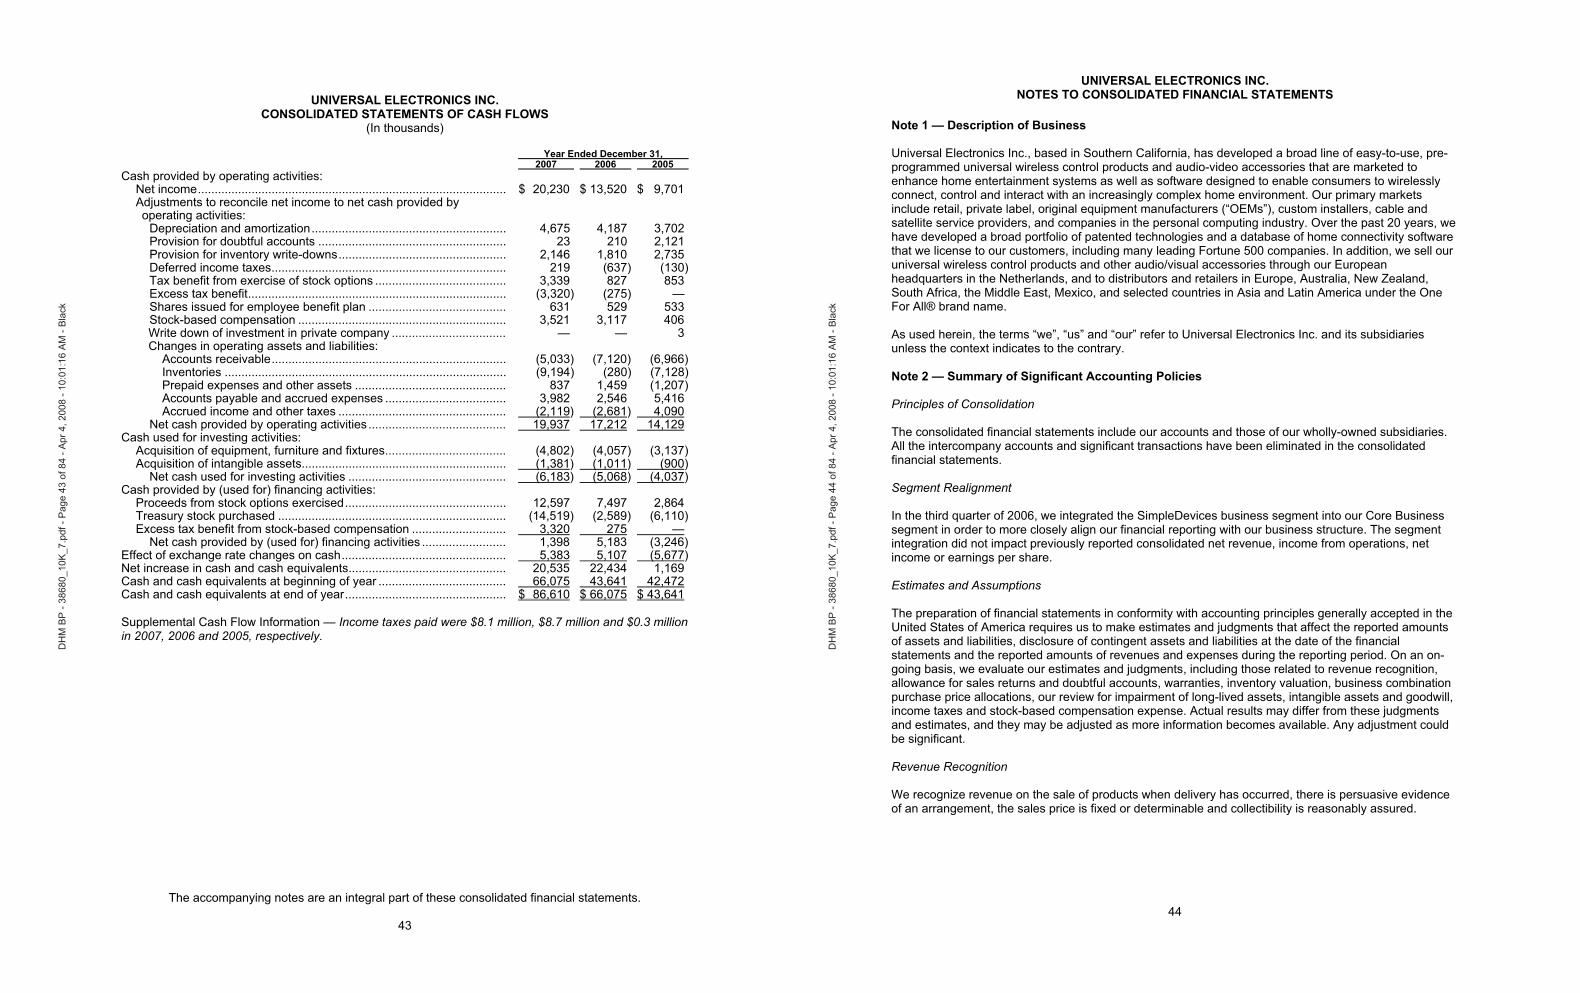
UNIVERSAL ELECTRONICS INC.CONSOLIDATED STATEMENTS OF CASH FLOWS
(In thousands)
Year Ended December 31, 2007 2006 2005
Cash provided by operating activities:Net income............................................................................................ $ 20,230 $ 13,520 $ 9,701Adjustments to reconcile net income to net cash provided by operating activities:
Depreciation and amortization.......................................................... 4,675 4,187 3,702 Provision for doubtful accounts ........................................................ 23 210 2,121 Provision for inventory write-downs.................................................. 2,146 1,810 2,735 Deferred income taxes...................................................................... 219 (637) (130)Tax benefit from exercise of stock options ....................................... 3,339 827 853 Excess tax benefit............................................................................. (3,320) (275) — Shares issued for employee benefit plan ......................................... 631 529 533 Stock-based compensation .............................................................. 3,521 3,117 406 Write down of investment in private company .................................. — — 3 Changes in operating assets and liabilities:
Accounts receivable...................................................................... (5,033) (7,120) (6,966)Inventories .................................................................................... (9,194) (280) (7,128)Prepaid expenses and other assets ............................................. 837 1,459 (1,207)Accounts payable and accrued expenses .................................... 3,982 2,546 5,416 Accrued income and other taxes .................................................. (2,119) (2,681) 4,090
Net cash provided by operating activities ......................................... 19,937 17,212 14,129Cash used for investing activities:
Acquisition of equipment, furniture and fixtures.................................... (4,802) (4,057) (3,137)Acquisition of intangible assets............................................................. (1,381) (1,011) (900)
Net cash used for investing activities ............................................... (6,183) (5,068) (4,037)Cash provided by (used for) financing activities:
Proceeds from stock options exercised................................................ 12,597 7,497 2,864 Treasury stock purchased .................................................................... (14,519) (2,589) (6,110)Excess tax benefit from stock-based compensation ............................ 3,320 275 —
Net cash provided by (used for) financing activities ......................... 1,398 5,183 (3,246)Effect of exchange rate changes on cash................................................. 5,383 5,107 (5,677)Net increase in cash and cash equivalents............................................... 20,535 22,434 1,169 Cash and cash equivalents at beginning of year ...................................... 66,075 43,641 42,472Cash and cash equivalents at end of year................................................ $ 86,610 $ 66,075 $ 43,641
Supplemental Cash Flow Information — Income taxes paid were $8.1 million, $8.7 million and $0.3 million in 2007, 2006 and 2005, respectively.
The accompanying notes are an integral part of these consolidated financial statements.
43
DH
M B
P -
3868
0_10
K_7
- P
age
43 o
f 84
- Apr
4, 2
008
- 10:
01:1
6 A
M -
Bla
ck
UNIVERSAL ELECTRONICS INC.NOTES TO CONSOLIDATED FINANCIAL STATEMENTS
44
Note 1 — Description of Business
Universal Electronics Inc., based in Southern California, has developed a broad line of easy-to-use, pre-programmed universal wireless control products and audio-video accessories that are marketed to enhance home entertainment systems as well as software designed to enable consumers to wirelessly connect, control and interact with an increasingly complex home environment. Our primary markets include retail, private label, original equipment manufacturers (“OEMs”), custom installers, cable and satellite service providers, and companies in the personal computing industry. Over the past 20 years, we have developed a broad portfolio of patented technologies and a database of home connectivity software that we license to our customers, including many leading Fortune 500 companies. In addition, we sell our universal wireless control products and other audio/visual accessories through our European headquarters in the Netherlands, and to distributors and retailers in Europe, Australia, New Zealand, South Africa, the Middle East, Mexico, and selected countries in Asia and Latin America under the One For All® brand name.
As used herein, the terms “we”, “us” and “our” refer to Universal Electronics Inc. and its subsidiaries unless the context indicates to the contrary.
Note 2 — Summary of Significant Accounting Policies
Principles of Consolidation
The consolidated financial statements include our accounts and those of our wholly-owned subsidiaries. All the intercompany accounts and significant transactions have been eliminated in the consolidated financial statements.
Segment Realignment
In the third quarter of 2006, we integrated the SimpleDevices business segment into our Core Business segment in order to more closely align our financial reporting with our business structure. The segment integration did not impact previously reported consolidated net revenue, income from operations, net income or earnings per share.
Estimates and Assumptions
The preparation of financial statements in conformity with accounting principles generally accepted in the United States of America requires us to make estimates and judgments that affect the reported amounts of assets and liabilities, disclosure of contingent assets and liabilities at the date of the financial statements and the reported amounts of revenues and expenses during the reporting period. On an on-going basis, we evaluate our estimates and judgments, including those related to revenue recognition, allowance for sales returns and doubtful accounts, warranties, inventory valuation, business combination purchase price allocations, our review for impairment of long-lived assets, intangible assets and goodwill, income taxes and stock-based compensation expense. Actual results may differ from these judgments and estimates, and they may be adjusted as more information becomes available. Any adjustment could be significant.
Revenue Recognition
We recognize revenue on the sale of products when delivery has occurred, there is persuasive evidence of an arrangement, the sales price is fixed or determinable and collectibility is reasonably assured.
DH
M B
P -
3868
0_10
K_7
- P
age
44 o
f 84
- Apr
4, 2
008
- 10:
01:1
6 A
M -
Bla
ck
UNIVERSAL ELECTRONICS INC.NOTES TO CONSOLIDATED FINANCIAL STATEMENTS
We record a provision for estimated sales returns on product sales in the same period as the related revenues are recorded. These estimates are based on historical sales returns, analysis of credit memo data and other known factors. The provision recorded for estimated sales returns and allowances is deducted from gross sales to arrive at net sales in the period the related revenue is recorded.
We accrue for discounts and rebates on product sales in the same period as the related revenues are recorded based on historical experience. Changes in such accruals may be required if future rebates and incentives differ from our estimates. Rebates and incentives are recognized as a reduction of sales if distributed in cash or customer account credits. Rebates and incentives are recognized as cost of sales if we provide products or services for payment.
Sales allowances reduce gross accounts receivable to arrive at accounts receivable, net in the same period the related receivable is recorded. We have no obligations after delivery of our products other than the associated warranties (See Note 21). We maintain an allowance for doubtful accounts for estimated losses resulting from the inability of our customers to make payments for products sold or services rendered. The allowance for doubtful accounts is based on a variety of factors, including historical experience, length of time receivables are past due, current economic trends and changes in customer payment behavior. Also, we record specific provisions for individual accounts when we become aware of a customer’s inability to meet its financial obligations to us, such as in the case of bankruptcy filings or deterioration in the customer’s operating results or financial position. If circumstances related to a customer change, our estimates of the recoverability of the receivables would be further adjusted, either upward or downward.
We generate service revenue, which is paid monthly, as a result of providing consumer support programs to some of our customers through our call centers. These service revenues are recognized when services are performed, persuasive evidence of an arrangement exists, the sales price is fixed or determinable, and collectibility is reasonably assured.
We also license our intellectual property including our patented technologies, trade secrets, trademarks, and database of infrared codes. We record license revenue when our customers ship products incorporating our intellectual property, persuasive evidence of an arrangement exists, the sales price is fixed or determinable, and collectibility is reasonably assured.
When a sales arrangement contains multiple elements, such as software products, licenses and/or services, we allocate revenue to each element based on its relative fair value. The fair values for the multiple elements are determined based on vendor specific objective evidence (“VSOE”), or the price charged when the element is sold separately. The residual method is utilized when VSOE exists for all the undelivered elements, but not for the delivered element. This is performed by allocating revenue to the undelivered elements (that have VSOE) and the residual revenue to the delivered elements. When the fair value for an undelivered element cannot be determined, we defer revenue for the delivered elements until the undelivered element is delivered. We limit the amount of revenue recognition for delivered elements to the amount that is not contingent on the future delivery of products or services or subject to customer-specified return or refund privileges.
We account for revenue under software licensing arrangements involving significant production, modification or customization of software in accordance with SOP 81-1, “Accounting for Performance of Construction-Type and Certain Production-Type Contracts”. We recognize revenue and profit as work progresses on long-term, fixed price contracts using the percentage-of-completion method. When applying the percentage-of-completion method, we rely on estimates of total expected contract revenue and labor hours which are provided by our project managers. We follow this method because reasonably dependable estimates of the revenue and labor applicable to various stages of a contract can be made. Recognized revenue and profit are subject to revisions as the contract progresses to completion. Revisions to revenue and profit estimates are charged to income in the period in which the facts that give rise to the revision become known, and losses are accrued when identified.
45
DH
M B
P -
3868
0_10
K_7
- P
age
45 o
f 84
- Apr
4, 2
008
- 10:
01:1
6 A
M -
Bla
ck
UNIVERSAL ELECTRONICS INC.NOTES TO CONSOLIDATED FINANCIAL STATEMENTS
Effective January 1, 2007, we applied the opinion reached by the FASB’s Emerging Issues Task Force on EITF Issue 06-3, “How Taxes Collected from Customers and Remitted to Governmental Authorities Should Be Presented in the Income Statement (That Is, Gross versus Net Presentation) (“EITF 06-3”).” The consensus in EITF 06-3 does not require us to reevaluate our existing accounting policies for income statement presentation. We present all non-income government-assessed taxes (sales, use and value added taxes) collected from our customers and remitted to governmental agencies on a net basis (excluded from revenue) in our financial statements. The government-assessed taxes are recorded in other accrued expenses until they are remitted to the government agency.
Foreign Currency Translation and Foreign Currency Transactions
The functional currency for our foreign operations is their local currency. The translation of foreign currencies into U.S. dollars is performed for balance sheet accounts using exchange rates in effect at the balance sheet dates and for revenue and expense accounts using the average exchange rate during the period. The gains and losses resulting from the translation are included in the foreign currency translation adjustment account, a component of accumulated other comprehensive income in stockholders’ equity, and are excluded from net income. The portions of inter-company accounts receivable and accounts payable that are not intended for settlement are translated at exchange rates in effect at the balance sheet date.
We recorded a foreign currency translation gain of $8.5 million for the year ended December 31, 2007 and a foreign currency translation gain of $8.0 million and a foreign currency translation loss of $8.8 million for the years ended December 31, 2006 and 2005, respectively. The foreign currency translation gain of $8.5 million for the year ended December 31, 2007 was driven by the weakening of the U.S. dollar versus the Euro. The U.S. dollar/Euro spot rate was 1.46 and 1.32 at December 31, 2007 and December 31, 2006, respectively. The foreign currency translation gain of $8.0 million for the year ended December 31, 2006 was driven by the weakening of the U.S. dollar versus the Euro. The U.S. dollar/Euro spot rate was 1.32 and 1.18 at December 31, 2006 and December 31, 2005, respectively. The foreign currency translation loss of $8.8 million for the year ended December 31, 2005 was driven by the strengthening of the U.S. dollar versus the Euro. The U.S. dollar/Euro spot rate was 1.18 and 1.35 at December 31, 2005 and December 31, 2004, respectively.
Transaction gains and losses generated by the effect of changes in foreign currency exchange rates on recorded assets and liabilities denominated in a currency different than the functional currency of the applicable entity are recorded in other income (expense), net (See Note 15).
Cash and Cash Equivalents
Cash and cash equivalents include cash accounts and all investments purchased with initial maturities of three months or less. We maintain cash and cash equivalents with various financial institutions. These financial institutions are located in many different geographic regions. We mitigate our exposure to credit risk by placing our cash and cash equivalents with high quality financial institutions.
At December 31, 2007, we had approximately $12.2 million and $74.4 million of cash and cash equivalents in the United States and Europe, respectively. At December 31, 2006, we had approximately $6.1 million and $60.0 million of cash and cash equivalents in the United States and Europe, respectively.
Inventories
Our inventories consist of primarily wireless control devices and the related component parts, including integrated circuits, and are valued at the lower of cost or market. Cost is determined using the first-in, first-out method. We write down our inventory for the estimated difference between the inventory’s cost and its estimated market value based upon our best estimates about future demand and market conditions.
46
DH
M B
P -
3868
0_10
K_7
- P
age
46 o
f 84
- Apr
4, 2
008
- 10:
01:1
6 A
M -
Bla
ck
UNIVERSAL ELECTRONICS INC.NOTES TO CONSOLIDATED FINANCIAL STATEMENTS
We carry inventory in amounts necessary to satisfy our customers’ inventory requirements on a timely basis. We continually monitor our inventory status to control inventory levels and write-down any excess or obsolete inventories on hand. Our total excess and obsolete inventory reserve as of December 31, 2007 and December 31, 2006 was approximately $1.8 million and $2.2 million, respectively, or 5.0% and 7.6% of total inventory. The decline in the inventory reserve was primarily due to scrapping of inventory in 2007 that was reserved in 2006.
If actual market conditions are less favorable than those projected by management additional inventory write-downs may be required, which could have a material impact on our financial statements. Such circumstances could include, but are not limited to, the development of new competing technology that impedes the marketability of our products or the occurrence of significant price decreases in our component parts, such as integrated circuits.
Equipment, Furniture and Fixtures
Equipment, furniture and fixtures are recorded at cost. To qualify for capitalization an asset must have a useful life greater than one year and a cost greater than $1,000 for individual assets or $5,000 for bulk assets. For financial reporting purposes, depreciation is calculated using the straight-line method over the estimated useful lives of the respective assets. When assets are retired or otherwise disposed of, the cost and accumulated depreciation are removed from the appropriate accounts and any gain or loss is included in operating income.
Estimated useful lives consist of the following:
Tooling and Equipment (1) .................... 2-7 Years Computer Equipment ........................... 3-5 Years Software ............................................... 3-5 Years Furniture and Fixtures .......................... 5-7 Years Leasehold Improvements..................... Lesser of lease term or useful life (approximately 2 to 6 years) ____________(1) We purchase tooling equipment for the production of our products. Tooling equipment is recorded on
our balance sheet; but is located at our third party manufactures. Tooling equipment as of December 31, 2007 and 2006 was $10.8 million and $8.5 million, respectively (See Note 6). Annually, we analyze tooling equipment for impairment along with our other long-lived assets.
Long-Lived Assets and Intangible Assets
Intangible assets consist principally of distribution rights, patents, trademarks, trade names, and developed and core technologies. Capitalized amounts related to patents represent external legal costs for the application and maintenance of patents. Intangible assets are amortized using the straight-line method over their estimated period of benefit, ranging from two to ten years.
We assess the impairment of long-lived assets and intangible assets whenever events or changes in circumstances indicate that the carrying value may not be recoverable. Factors considered important which could trigger an impairment review include the following: (1) significant underperformance relative to expected historical or projected future operating results; (2) significant changes in the manner or use of the assets or strategy for the overall business and (3) significant negative industry or economic trends.
When we determine that the carrying value may not be recoverable based upon the existence of one or more of the above indicators of impairment, we conduct an impairment review. The asset is impaired if its carrying value exceeds the sum of the undiscounted cash flows expected to result from the use and eventual disposition of the asset. In assessing recoverability, we must make assumptions regarding estimated future cash flows and other factors.
47
DH
M B
P -
3868
0_10
K_7
- P
age
47 o
f 84
- Apr
4, 2
008
- 10:
01:1
6 A
M -
Bla
ck
UNIVERSAL ELECTRONICS INC.NOTES TO CONSOLIDATED FINANCIAL STATEMENTS
The impairment loss is the amount by which the carrying value of the asset exceeds its fair value. We calculate fair value by taking the sum of the discounted projected cash flows over the assets remaining useful life, using a discount rate commensurate with the risks inherent in our current business model. When calculating fair value, we must make assumptions regarding estimated future cash flows, discount rates and other factors. For the years ended December 31, 2007, 2006 and 2005 we recorded impairment charges of $63 thousand, $20 thousand and $0, respectively, related to our long-lived assets. The impairment charges are recorded in depreciation expense.
Goodwill
We record the excess purchase price of net tangible and intangible assets acquired over their estimated fair value as goodwill. We have adopted the provisions of SFAS 142, “Goodwill and Intangible Assets.” Under SFAS 142, we are required to test goodwill for impairment at least annually. We evaluate the carrying value of goodwill as of December 31 of each year and between annual evaluations if events occur or circumstances change that may reduce the fair value of the reporting unit below its carrying amount. Such circumstances could include, but are not limited to: (1) a significant adverse change in legal factors or in business climate, (2) unanticipated competition, or (3) an adverse action or assessment by a regulator. In performing the impairment review, we determine the carrying amount of each reporting unit by assigning assets and liabilities, including the existing goodwill, to those reporting units (See Note 3). A reporting unit is defined as an operating segment or one level below an operating segment (referred to as a component). A component of an operating segment is deemed a reporting unit if the component constitutes a business for which discrete financial information is available and segment management regularly reviews the operating results of that component.
To evaluate whether goodwill is impaired, we compare the fair value of the reporting unit to which the goodwill is assigned to the reporting unit’s carrying amount, including goodwill. We determine the fair value of each reporting unit using the present value of expected future cash flows for that reporting unit. If the carrying amount of a reporting unit exceeds its fair value, the amount of the impairment loss must be measured.
The impairment loss would be calculated by comparing the implied fair value of goodwill to its carrying amount. In calculating the implied fair value of the reporting unit goodwill, the present value of the reporting unit’s expected future cash flows is allocated to all of the other assets and liabilities of that unit based on their fair values. The excess of the present value of the reporting unit’s expected future cash flows over the amount assigned to its other assets and liabilities is the implied fair value of goodwill. An impairment loss would be recognized when the carrying amount of goodwill exceeds its implied fair value.
We conducted annual goodwill impairment reviews as of December 31, 2007, 2006 and 2005. Based on the analysis performed, we determined that the fair values of our reporting units exceeded their carrying amounts, including goodwill, and therefore they were not impaired.
During the fourth quarter of 2004 we purchased SimpleDevices for approximately $12.8 million in cash, including direct acquisition costs, and a potential performance-based payment of our unregistered common stock, if certain future financial objectives were achieved. As a result of the performance-based incentive and other factors, our chief operating decision maker (“CODM”) reviewed SimpleDevices’ discrete operating results through the second quarter of 2006, and SimpleDevices was defined as an “operating segment” and a “reporting unit” as well.
Effective at the end of second quarter 2006, we completed our integration of SimpleDevices’ technologies with our existing technologies, merged SimpleDevices’ sales, engineering and administrative functions into our “domestic” reporting unit, and the performance-based payment related to the acquisition expired. Commencing in the third quarter of 2006, our CODM no longer reviews SimpleDevices’ financial statements on a stand alone basis. As a result of these activities, SimpleDevices became part of the “domestic” reporting unit within our single operating segment.
48
DH
M B
P -
3868
0_10
K_7
- P
age
48 o
f 84
- Apr
4, 2
008
- 10:
01:1
6 A
M -
Bla
ck
UNIVERSAL ELECTRONICS INC.NOTES TO CONSOLIDATED FINANCIAL STATEMENTS
Income Taxes
Income tax expense includes U.S. and international income taxes. We account for income taxes using the liability method. We record deferred tax assets and deferred tax liabilities on our balance sheet for expected future tax consequences of events that have been recognized in different periods for financial statement purposes versus tax return purposes using enacted tax rates that will be in effect when these differences reverse. We record a valuation allowance to reduce net deferred tax assets if we determine that it is more likely than not that the deferred tax assets will not be realized. A current tax asset or liability is recognized for the estimated taxes refundable or payable for the current year.
In accordance with the adoption of FIN 48, “Accounting for Uncertainty in Income Taxes- an Interpretation of Statement No. 109,” if a tax position does not meet the more likely than not standard, a full reserve is established against the tax asset or a liability is recorded. Additionally, a tax position that meets the more-likely-than-not recognition threshold is measured to determine the amount of benefit to recognize in the financial statements. The tax position is measured at the largest amount of benefit that is greater than 50 percent likely of being realized upon ultimate settlement.
Capitalized Software Costs
We account for software development costs in accordance with SFAS No. 86, “Accounting for the Costs of Computer Software to be Sold, Leased, or Otherwise Marketed.” Costs incurred internally while creating a computer software product are expensed when incurred as research and development until technological feasibility has been established. We determined that technological feasibility for our products is established when a working model is complete. Once technological feasibility is established, software costs are capitalized until the product is available for general release to customers and is then amortized using the greater of (i) the ratio that current gross revenues for a product bear to the total current and anticipated future gross revenues or (ii) the straight-line method over the remaining estimated economic life of the product. Software development costs consist primarily of salaries, employee benefits, supplies and materials. The straight-line amortization periods for capitalized software costs range from 1 to 2 years.
Capitalized software costs are stated at cost net of accumulated amortization. Unamortized capitalized software costs were $0.4 million and $0.1 million at December 31, 2007 and 2006, respectively. We capitalized $0.5 million, $0 and $0 for the years ended December 31, 2007, 2006 and 2005, respectively. Amortization expense related to capitalized software costs was $0.2 million, $0.3 million and $0.3 million for the years ended December 31, 2007, 2006 and 2005, respectively (See Note 3).
Research and Development
We account for research and development costs in accordance with SFAS No. 2, “Accounting for Research and Development Costs.” As such, research and development costs are expensed as incurred and consist primarily of salaries, employee benefits, supplies and materials.
Advertising
Advertising costs are expensed as incurred. Advertising expense was $2.3 million, $2.2 million and $1.5 million for the years ended December 31, 2007, 2006 and 2005, respectively.
Shipping and Handling Fees and Costs
In September 2000, the Emerging Issues Task Force issued EITF 00-10, “Accounting for Shipping and Handling Fees and Costs.” EITF 00-10 requires shipping and handling fees billed to customers to be classified as revenue and shipping and handling costs to be either classified as cost of sales or disclosed in the notes to the financial statements if classified elsewhere in the income statement. We include shipping and handling fees billed to customers in net sales. Shipping and handling costs associated with in-bound freight are recorded in cost of goods sold. Other shipping and handling costs are included in selling, general and administrative expenses and totaled $7.9 million, $6.9 million and $6.2 million for the years ended December 31, 2007, 2006 and 2005, respectively.
49
DH
M B
P -
3868
0_10
K_7
- P
age
49 o
f 84
- Apr
4, 2
008
- 10:
01:1
6 A
M -
Bla
ck
UNIVERSAL ELECTRONICS INC.NOTES TO CONSOLIDATED FINANCIAL STATEMENTS
Derivatives
Our foreign currency exposures are primarily concentrated in the Euro and British Pound. Depending on the predictability of future receivables, payables and cash flows in each operating currency, we periodically enter into foreign currency exchange contracts with terms normally lasting less than nine months to protect against the adverse effects that exchange-rate fluctuations may have on our foreign currency-denominated receivables, payables, cash flows and reported income. We do not enter into financial instruments for speculation or trading purposes. These derivatives have not qualified for hedge accounting. The gains and losses on both the derivatives and the foreign currency-denominated balances are recorded as foreign exchange transaction gains or losses and are classified in other income (expense), net. Derivatives are recorded on the balance sheet at fair value. The estimated fair value of derivative financial instruments represents the amount required to enter into similar offsetting contracts with similar remaining maturities based on quoted market prices.
We held foreign currency exchange contracts which resulted in a net pre-tax gain of approximately $784 thousand for the year ended December 31, 2007 and net pre-tax loss of approximately $97 thousand and $409 thousand for the years ended December 31, 2006 and 2005, respectively. We had one foreign currency exchange contract outstanding at December 31, 2007, a forward contract with a notional value of $5.0 million. We had two foreign currency exchange contracts outstanding at December 31, 2006, known as participating forwards, both with a notional value of $6.25 million each. Both contracts settled on January 3, 2007.
We held a US dollar/Euro forward contract with a notional value of $5.0 million and a forward rate of $1.4554 US dollar/Euro as of December 31, 2007, due for settlement on January 25, 2008. We held the Euro position on this contract. The fair value of this contract was $11 thousand at December 31, 2007; and this contract value is included in prepaid expenses and other current assets. At December 31, 2006, we had a loss on participating forward contracts of approximately $0.6 million, which was included in other accrued expenses.
Stock-Based Compensation
Effective January 1, 2006, we adopted the fair value recognition provisions of Statement of Financial Accounting Standards (“SFAS”) No. 123(R), “Share-Based Payment” (“SFAS 123R”) using the modified-prospective transition method. Under this transition method, compensation expense recognized for the year ended December 31, 2006 includes: (a) compensation expense for all share-based awards granted prior to, but not yet vested as of January 1, 2006 based on the grant date fair value estimated in accordance with the original provisions of SFAS 123 and (b) compensation expense for all share-based awards granted subsequent to December 31, 2005 based on the grant-date fair value estimated in accordance with the provisions of SFAS 123R. Results for prior periods have not been restated. We recognize such compensation expense, net of estimated forfeitures, on a straight-line basis over the service period of the award, which is generally the option vesting term of three to four years. Prior to January 1, 2006, we accounted for options granted under our plans using the intrinsic value method under Accounting Principles Board (“APB”) Opinion No. 25, “Accounting for Stock Issued to Employees,” (“APB 25”) and related interpretations, as permitted by SFAS No. 123, “Accounting for Stock Based Compensation” (“SFAS 123”). In March 2005, the Securities and Exchange Commission (the “SEC”) issued Staff Accounting Bulletin No. 107 (“SAB 107”) regarding the SEC’s interpretation of SFAS 123R and the valuation of share-based compensation for public companies. We have applied the provisions of SAB 107 to our adoption of SFAS 123R.
We use the Black Scholes option pricing model to measure the stock-based compensation expense. The assumptions used in the Black Scholes model includes the following: weighted average fair value of grant, risk-free interest rate, expected volatility and expected life in years. Refer to Note 10 for further discussion on stock-based compensation.
50
DH
M B
P -
3868
0_10
K_7
- P
age
50 o
f 84
- Apr
4, 2
008
- 10:
01:1
7 A
M -
Bla
ck
UNIVERSAL ELECTRONICS INC.NOTES TO CONSOLIDATED FINANCIAL STATEMENTS
New Accounting Pronouncements
In September 2006, the FASB issued SFAS No. 157, “Fair Value Measurements” (“SFAS 157”), which defines fair value, establishes a framework for measuring fair value in generally accepted accounting principles (GAAP), and expands disclosures about fair value measurements for assets and liabilities. SFAS 157 applies when other accounting pronouncements require or permit assets or liabilities to be measured at fair value. Accordingly, SFAS 157 does not require new fair value measurements. SFAS 157 is effective for fiscal years beginning after November 15, 2007. On February 12, 2008 the FASB issued FASB Staff Position for SFAS 157 (“FSP FAS 157-2”), which delays the effective date of SFAS 157 for nonfinancial assets and nonfinancial liabilities, except for items that are recognized or disclosed at fair value in an entity’s financial statements on a recurring basis (at least annually) until fiscal years beginning after November 15, 2008. We are required to adopt the provisions of SFAS 157 in the first quarter of 2008, except for those items within scope of FSP FAS 157-2, which we will adopt in the first quarter of 2009. We do not expect the adoption of SFAS 157 to have a material effect on our consolidated results of operations and financial conditions.
In February 2007, the FASB issued SFAS No. 159, “The Fair Value Option for Financial Assets and Financial Liabilities—Including an amendment of FASB Statement No. 115” (“SFAS 159”). SFAS 159 expands the use of fair value accounting but does not affect existing standards that require assets or liabilities to be carried at fair value. Under SFAS 159, a company may elect to use fair value to measure accounts and loans receivable, available-for-sale and held-to-maturity securities, equity method investments, accounts payable, guarantees and issued debt. Other eligible items include firm commitments for financial instruments that otherwise would not be recognized at inception and non-cash warranty obligations where a warrantor is permitted to pay a third party to provide the warranty goods or services. If the use of fair value is elected, any upfront costs and fees related to the item must be recognized in earnings and cannot be deferred, such as debt issuance costs. The fair value election is irrevocable and generally made on an instrument-by-instrument basis, even if a company has similar instruments that it elects not to measure based on fair value. At the adoption date, unrealized gains and losses on existing items for which fair value has been elected are reported as a cumulative adjustment to beginning retained earnings. Subsequent to the adoption of SFAS 159, changes in fair value are recognized in earnings. SFAS 159 is effective for fiscal years beginning after November 15, 2007 and is required to be adopted by us in the first quarter of fiscal 2008. We currently are determining whether fair value accounting is appropriate for any of our eligible items and cannot estimate the impact that SFAS 159 will have on our consolidated results of operations and financial condition.
In June 2007, the FASB ratified EITF 07-3, “Accounting for Nonrefundable Advance Payments for Goods or Services Received for Use in Future Research and Development Activities” (“EITF 07-3”). EITF 07-3 requires that nonrefundable advance payments for goods or services that will be used or rendered for future research and development activities be deferred and recognized as an expense as the goods are delivered or the related services are performed. EITF 07-3 is effective, on a prospective basis, for fiscal years beginning after December 15, 2007 and will be adopted by us in the first quarter of fiscal 2008. We do not expect the adoption of EITF 07-3 to have a material effect on our consolidated results of operations and financial condition.
In December 2007, the FASB issued SFAS No. 141 (revised 2007), “Business Combinations” (“SFAS 141R”). SFAS 141R establishes principles and requirements for how an acquirer recognizes and measures in its financial statements the identifiable assets acquired, the liabilities assumed, any noncontrolling interest in the acquiree and the goodwill acquired. SFAS 141R also establishes disclosure requirements to enable the evaluation of the nature and financial effects of the business combination. SFAS 141R is effective as of the beginning of an entity’s fiscal year that begins after December 15, 2008, and will be adopted by us in the first quarter of fiscal 2009. We do not believe that the adoption of Statement 141R will have an effect on our financial statements; however, the effect is dependent upon whether we make any future acquisitions and the specifics of those acquisitions.
51
DH
M B
P -
3868
0_10
K_7
- P
age
51 o
f 84
- Apr
4, 2
008
- 10:
01:1
7 A
M -
Bla
ck
UNIVERSAL ELECTRONICS INC.NOTES TO CONSOLIDATED FINANCIAL STATEMENTS
In December 2007, the FASB ratified EITF 07-1, “Accounting for Collaborative Arrangements Related to the Development and Commercialization of Intellectual Property” (“EITF 07-1”). EITF 07-1 defines collaborative arrangements and establishes disclosure requirements for transactions between participants in a collaborative arrangement and between participants in the arrangement and third parties. EITF 07-1 is effective as of the beginning of an entity’s fiscal year that begins after December 15, 2008 and should be applied retrospectively to all prior periods presented for all collaborative arrangements existing as of the effective date. EITF 07-1 is effective for us beginning January 1, 2009. Currently, we do not have any collaborative arrangements; therefore, we do not currently believe that the adoption of EITF 07-1 will have an impact on our consolidated results of operations and financial condition.
In December 2007, the FASB issued SFAS No. 160, “Noncontrolling Interests in Consolidated Financial Statements: an amendment of ARB No. 51” (“SFAS 160”). SFAS 160 changes the accounting for, and the financial statement presentation of, noncontrolling equity interests in a consolidated subsidiary. SFAS 160 replaces the existing minority-interest provisions of Accounting Research Bulletin 51 (“ARB 51”), “Consolidated Financial Statements,” by defining a new term-noncontrolling interests-to replace what were previously called minority interests. The new standard establishes noncontrolling interests as a component of the equity of a consolidated entity. The underlying principle of the new standard is that both the controlling interest and the noncontrolling interests are part of the equity of a single economic entity: the consolidated reporting entity. Classifying noncontrolling interests as a component of consolidated equity is a change from the current practice of treating minority interests as a mezzanine item between liabilities and equity or as a liability. The change affects both the accounting and financial reporting for noncontrolling interests in a consolidated subsidiary. SFAS 160 includes reporting requirements intended to clearly identify and differentiate the interests of the parent and the interests of the noncontrolling owners. The reporting requirements are required to be applied retrospectively. SFAS 160 is effective for fiscal years and interim periods within those fiscal years beginning on or after December 15, 2008. Early adoption is prohibited. We currently do not believe that the adoption of SFAS 160 will have a significant effect on our financial statements as we wholly own our subsidiaries.
Note 3 — Goodwill and Intangible Assets
Under the requirements of SFAS 142, “Goodwill and Intangible Assets”, the unit of accounting for goodwill is at a level of reporting referred to as a “reporting unit.” SFAS 142 defines a reporting unit as either (1) an operating segment — as defined in SFAS 131, “Disclosures about Segments of an Enterprise and Related Information” or (2) one level below an operating segment — referred to as a component. Our domestic and international components are “reporting units” within our one operating segment “Core Business.” Goodwill is reviewed for impairment as of December 31st of each year. Goodwill of a reporting unit is tested for impairment between annual tests, if an event occurs or circumstances change that would more likely than not reduce the fair value of a reporting unit below its carrying amount.
Effective at the end of second quarter 2006, we completed our integration of SimpleDevices’ technologies with our existing technologies, merged SimpleDevices’ sales, engineering and administrative functions into our “domestic” reporting unit, and the performance-based payment related to the acquisition expired. In addition, our CODM no longer reviews SimpleDevices’ financial statements on a stand alone basis, commencing in the third quarter of 2006. As a result of these activities, SimpleDevices became part of the “domestic” reporting unit within our single operating segment.
Goodwill for the domestic operations was generated from the acquisition of a remote control company in 1998 and the acquisition of a software and firmware solutions company, SimpleDevices, in 2004. Goodwill for international operations resulted from the acquisition of remote control distributors in the UK in 1998, Spain in 1999 and France in 2000.
52
DH
M B
P -
3868
0_10
K_7
- P
age
52 o
f 84
- Apr
4, 2
008
- 10:
01:1
7 A
M -
Bla
ck
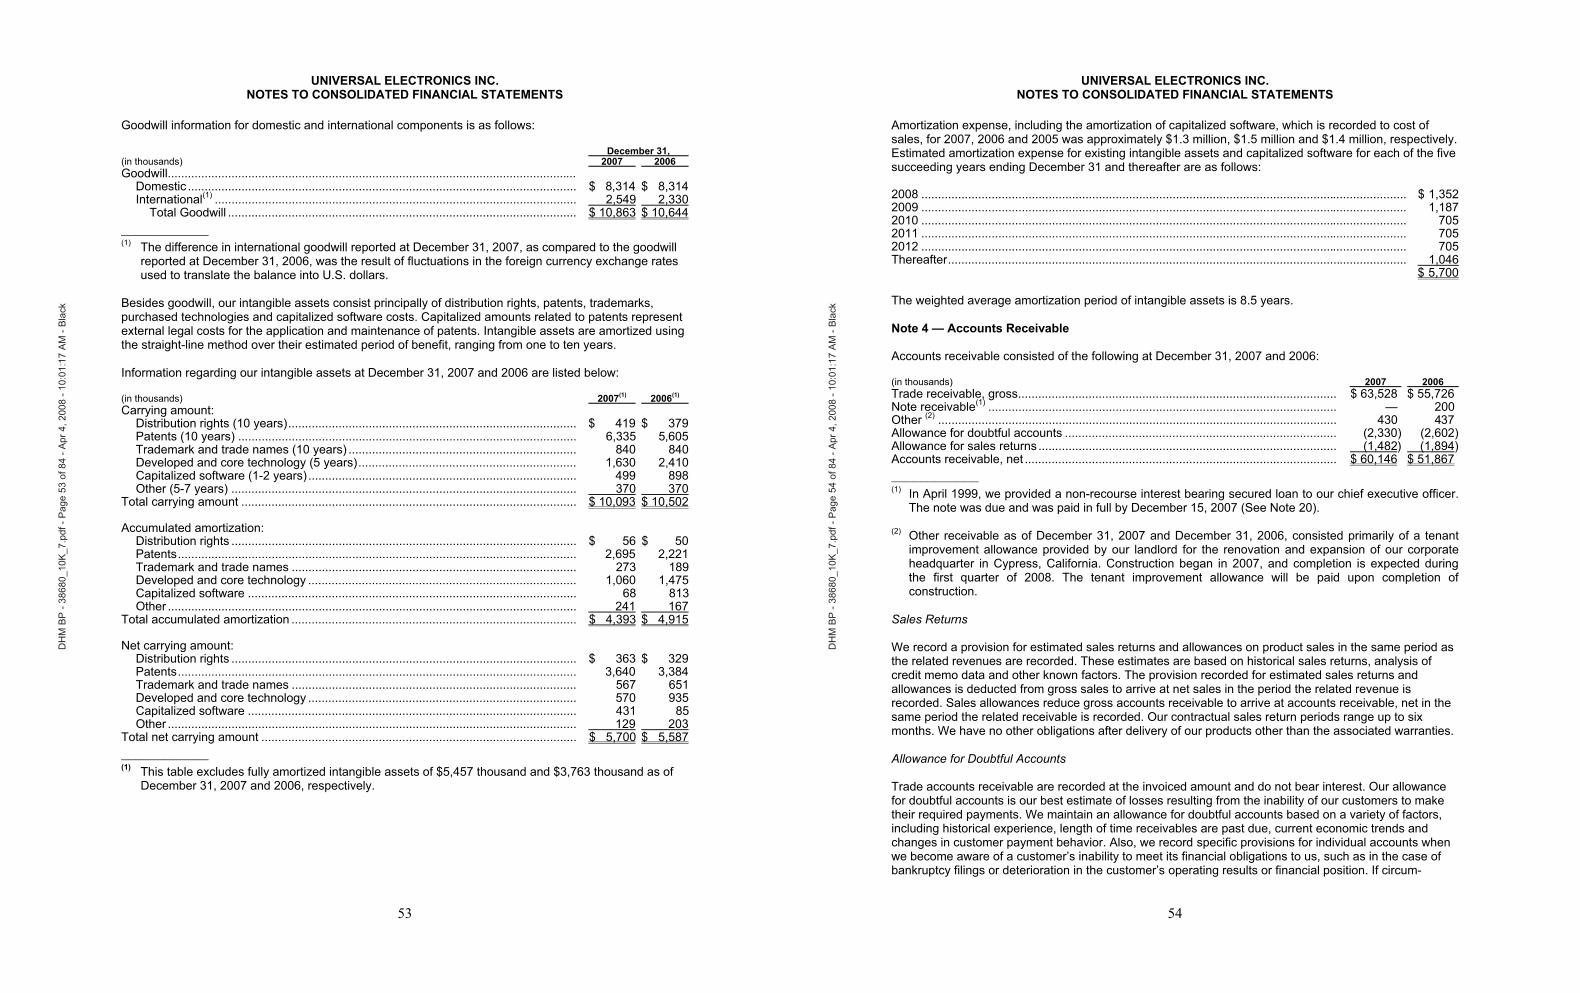
UNIVERSAL ELECTRONICS INC.NOTES TO CONSOLIDATED FINANCIAL STATEMENTS
Goodwill information for domestic and international components is as follows:
December 31, (in thousands) 2007 2006 Goodwill..........................................................................................................................
Domestic .................................................................................................................... $ 8,314 $ 8,314International(1) ............................................................................................................ 2,549 2,330
Total Goodwill ........................................................................................................ $ 10,863 $ 10,644____________(1) The difference in international goodwill reported at December 31, 2007, as compared to the goodwill
reported at December 31, 2006, was the result of fluctuations in the foreign currency exchange rates used to translate the balance into U.S. dollars.
Besides goodwill, our intangible assets consist principally of distribution rights, patents, trademarks, purchased technologies and capitalized software costs. Capitalized amounts related to patents represent external legal costs for the application and maintenance of patents. Intangible assets are amortized using the straight-line method over their estimated period of benefit, ranging from one to ten years.
Information regarding our intangible assets at December 31, 2007 and 2006 are listed below:
(in thousands) 2007(1) 2006(1)
Carrying amount: Distribution rights (10 years)...................................................................................... $ 419 $ 379Patents (10 years) ..................................................................................................... 6,335 5,605Trademark and trade names (10 years) .................................................................... 840 840Developed and core technology (5 years)................................................................. 1,630 2,410Capitalized software (1-2 years) ................................................................................ 499 898Other (5-7 years) ....................................................................................................... 370 370
Total carrying amount .................................................................................................... $ 10,093 $ 10,502
Accumulated amortization: Distribution rights ....................................................................................................... $ 56 $ 50Patents....................................................................................................................... 2,695 2,221Trademark and trade names ..................................................................................... 273 189Developed and core technology ................................................................................ 1,060 1,475Capitalized software .................................................................................................. 68 813Other .......................................................................................................................... 241 167
Total accumulated amortization ..................................................................................... $ 4,393 $ 4,915
Net carrying amount: Distribution rights ....................................................................................................... $ 363 $ 329Patents....................................................................................................................... 3,640 3,384Trademark and trade names ..................................................................................... 567 651Developed and core technology ................................................................................ 570 935Capitalized software .................................................................................................. 431 85Other .......................................................................................................................... 129 203
Total net carrying amount .............................................................................................. $ 5,700 $ 5,587____________(1) This table excludes fully amortized intangible assets of $5,457 thousand and $3,763 thousand as of
December 31, 2007 and 2006, respectively.
53
DH
M B
P -
3868
0_10
K_7
- P
age
53 o
f 84
- Apr
4, 2
008
- 10:
01:1
7 A
M -
Bla
ck
UNIVERSAL ELECTRONICS INC.NOTES TO CONSOLIDATED FINANCIAL STATEMENTS
Amortization expense, including the amortization of capitalized software, which is recorded to cost of sales, for 2007, 2006 and 2005 was approximately $1.3 million, $1.5 million and $1.4 million, respectively. Estimated amortization expense for existing intangible assets and capitalized software for each of the five succeeding years ending December 31 and thereafter are as follows:
2008 ................................................................................................................................................. $ 1,3522009 ................................................................................................................................................. 1,1872010 ................................................................................................................................................. 7052011 ................................................................................................................................................. 7052012 ................................................................................................................................................. 705Thereafter......................................................................................................................................... 1,046
$ 5,700
The weighted average amortization period of intangible assets is 8.5 years.
Note 4 — Accounts Receivable
Accounts receivable consisted of the following at December 31, 2007 and 2006:
(in thousands) 2007 2006 Trade receivable, gross............................................................................................... $ 63,528 $ 55,726 Note receivable(1) ........................................................................................................ — 200 Other (2) ....................................................................................................................... 430 437Allowance for doubtful accounts ................................................................................. (2,330) (2,602)Allowance for sales returns ......................................................................................... (1,482) (1,894)Accounts receivable, net ............................................................................................. $ 60,146 $ 51,867____________(1) In April 1999, we provided a non-recourse interest bearing secured loan to our chief executive officer.
The note was due and was paid in full by December 15, 2007 (See Note 20).
(2) Other receivable as of December 31, 2007 and December 31, 2006, consisted primarily of a tenant improvement allowance provided by our landlord for the renovation and expansion of our corporate headquarter in Cypress, California. Construction began in 2007, and completion is expected during the first quarter of 2008. The tenant improvement allowance will be paid upon completion of construction.
Sales Returns
We record a provision for estimated sales returns and allowances on product sales in the same period as the related revenues are recorded. These estimates are based on historical sales returns, analysis of credit memo data and other known factors. The provision recorded for estimated sales returns and allowances is deducted from gross sales to arrive at net sales in the period the related revenue is recorded. Sales allowances reduce gross accounts receivable to arrive at accounts receivable, net in the same period the related receivable is recorded. Our contractual sales return periods range up to six months. We have no other obligations after delivery of our products other than the associated warranties.
Allowance for Doubtful Accounts
Trade accounts receivable are recorded at the invoiced amount and do not bear interest. Our allowance for doubtful accounts is our best estimate of losses resulting from the inability of our customers to make their required payments. We maintain an allowance for doubtful accounts based on a variety of factors, including historical experience, length of time receivables are past due, current economic trends and changes in customer payment behavior. Also, we record specific provisions for individual accounts when we become aware of a customer’s inability to meet its financial obligations to us, such as in the case of bankruptcy filings or deterioration in the customer’s operating results or financial position. If circum-
54
DH
M B
P -
3868
0_10
K_7
- P
age
54 o
f 84
- Apr
4, 2
008
- 10:
01:1
7 A
M -
Bla
ck
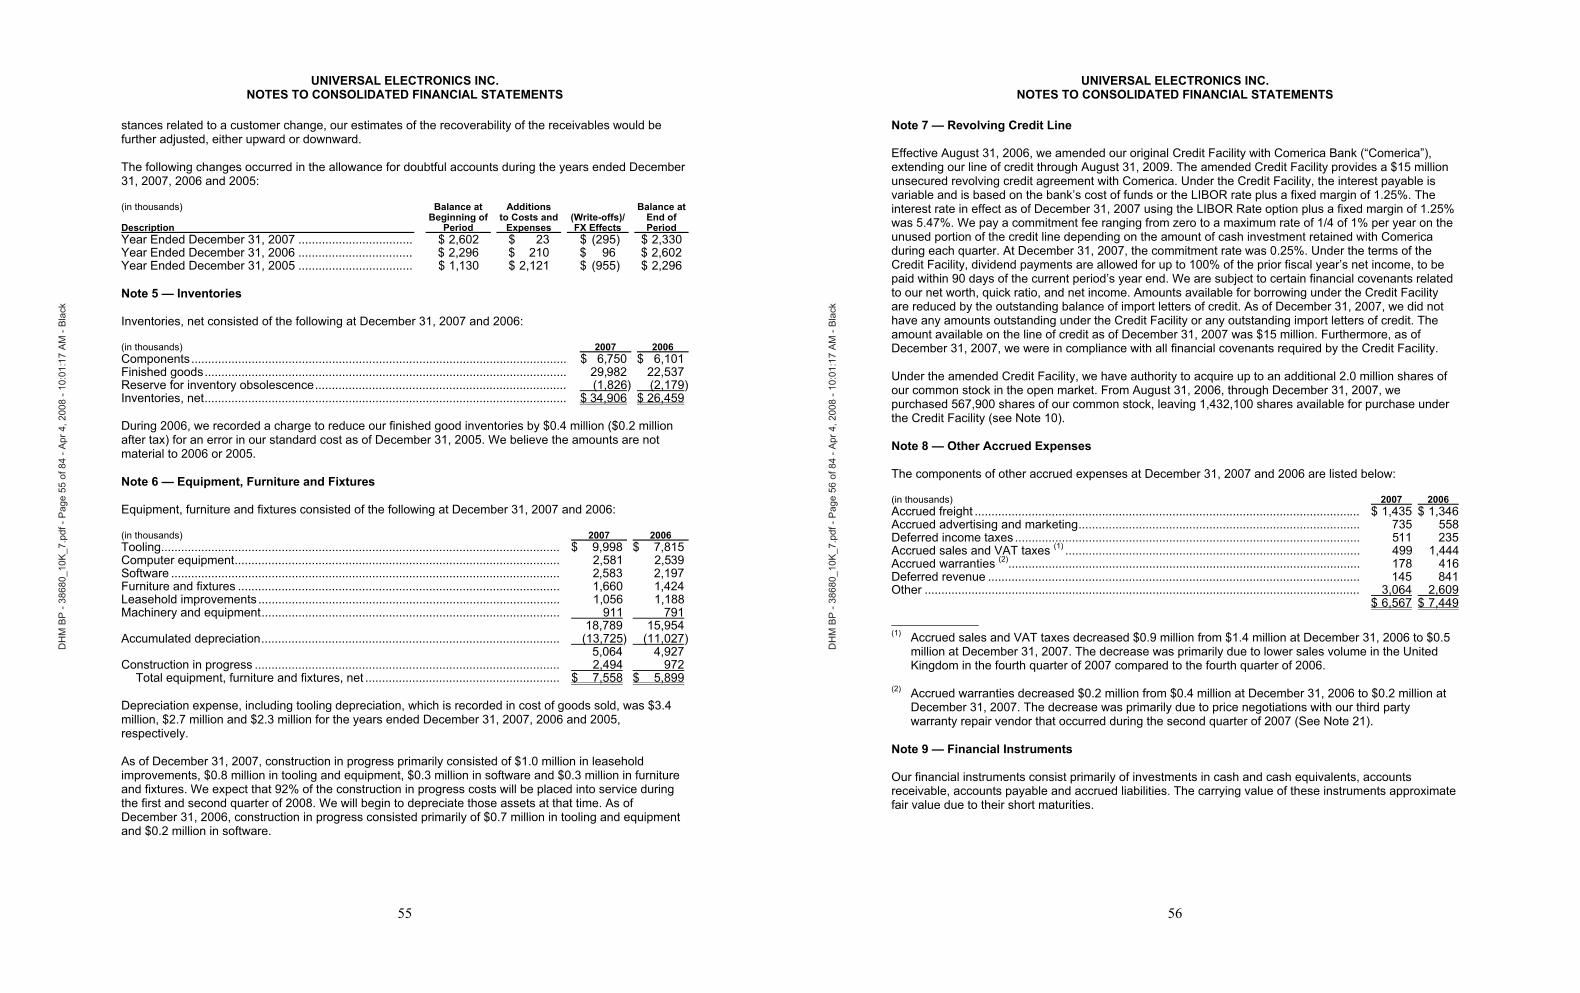
UNIVERSAL ELECTRONICS INC.NOTES TO CONSOLIDATED FINANCIAL STATEMENTS
stances related to a customer change, our estimates of the recoverability of the receivables would be further adjusted, either upward or downward.
The following changes occurred in the allowance for doubtful accounts during the years ended December 31, 2007, 2006 and 2005:
(in thousands)
Description
Balance at Beginning of Period
Additions to Costs and Expenses
(Write-offs)/ FX Effects
Balance at End of Period
Year Ended December 31, 2007 .................................. $ 2,602 $ 23 $ (295) $ 2,330 Year Ended December 31, 2006 .................................. $ 2,296 $ 210 $ 96 $ 2,602 Year Ended December 31, 2005 .................................. $ 1,130 $ 2,121 $ (955) $ 2,296
Note 5 — Inventories
Inventories, net consisted of the following at December 31, 2007 and 2006:
(in thousands) 2007 2006 Components................................................................................................................ $ 6,750 $ 6,101 Finished goods............................................................................................................ 29,982 22,537 Reserve for inventory obsolescence........................................................................... (1,826) (2,179)Inventories, net............................................................................................................ $ 34,906 $ 26,459
During 2006, we recorded a charge to reduce our finished good inventories by $0.4 million ($0.2 million after tax) for an error in our standard cost as of December 31, 2005. We believe the amounts are not material to 2006 or 2005.
Note 6 — Equipment, Furniture and Fixtures
Equipment, furniture and fixtures consisted of the following at December 31, 2007 and 2006:
(in thousands) 2007 2006 Tooling....................................................................................................................... $ 9,998 $ 7,815 Computer equipment................................................................................................. 2,581 2,539Software .................................................................................................................... 2,583 2,197 Furniture and fixtures ................................................................................................ 1,660 1,424Leasehold improvements .......................................................................................... 1,056 1,188 Machinery and equipment......................................................................................... 911 791
18,789 15,954 Accumulated depreciation......................................................................................... (13,725) (11,027)
5,064 4,927 Construction in progress ........................................................................................... 2,494 972
Total equipment, furniture and fixtures, net .......................................................... $ 7,558 $ 5,899
Depreciation expense, including tooling depreciation, which is recorded in cost of goods sold, was $3.4 million, $2.7 million and $2.3 million for the years ended December 31, 2007, 2006 and 2005, respectively.
As of December 31, 2007, construction in progress primarily consisted of $1.0 million in leasehold improvements, $0.8 million in tooling and equipment, $0.3 million in software and $0.3 million in furniture and fixtures. We expect that 92% of the construction in progress costs will be placed into service during the first and second quarter of 2008. We will begin to depreciate those assets at that time. As of December 31, 2006, construction in progress consisted primarily of $0.7 million in tooling and equipment and $0.2 million in software.
55
DH
M B
P -
3868
0_10
K_7
- P
age
55 o
f 84
- Apr
4, 2
008
- 10:
01:1
7 A
M -
Bla
ck
UNIVERSAL ELECTRONICS INC.NOTES TO CONSOLIDATED FINANCIAL STATEMENTS
Note 7 — Revolving Credit Line
Effective August 31, 2006, we amended our original Credit Facility with Comerica Bank (“Comerica”), extending our line of credit through August 31, 2009. The amended Credit Facility provides a $15 million unsecured revolving credit agreement with Comerica. Under the Credit Facility, the interest payable is variable and is based on the bank’s cost of funds or the LIBOR rate plus a fixed margin of 1.25%. The interest rate in effect as of December 31, 2007 using the LIBOR Rate option plus a fixed margin of 1.25% was 5.47%. We pay a commitment fee ranging from zero to a maximum rate of 1/4 of 1% per year on the unused portion of the credit line depending on the amount of cash investment retained with Comerica during each quarter. At December 31, 2007, the commitment rate was 0.25%. Under the terms of the Credit Facility, dividend payments are allowed for up to 100% of the prior fiscal year’s net income, to be paid within 90 days of the current period’s year end. We are subject to certain financial covenants related to our net worth, quick ratio, and net income. Amounts available for borrowing under the Credit Facility are reduced by the outstanding balance of import letters of credit. As of December 31, 2007, we did not have any amounts outstanding under the Credit Facility or any outstanding import letters of credit. The amount available on the line of credit as of December 31, 2007 was $15 million. Furthermore, as of December 31, 2007, we were in compliance with all financial covenants required by the Credit Facility.
Under the amended Credit Facility, we have authority to acquire up to an additional 2.0 million shares of our common stock in the open market. From August 31, 2006, through December 31, 2007, we purchased 567,900 shares of our common stock, leaving 1,432,100 shares available for purchase under the Credit Facility (see Note 10).
Note 8 — Other Accrued Expenses
The components of other accrued expenses at December 31, 2007 and 2006 are listed below:
(in thousands) 2007 2006 Accrued freight ................................................................................................................... $ 1,435 $ 1,346Accrued advertising and marketing.................................................................................... 735 558Deferred income taxes ....................................................................................................... 511 235Accrued sales and VAT taxes (1) ........................................................................................ 499 1,444Accrued warranties (2)......................................................................................................... 178 416Deferred revenue ............................................................................................................... 145 841Other .................................................................................................................................. 3,064 2,609
$ 6,567 $ 7,449____________(1) Accrued sales and VAT taxes decreased $0.9 million from $1.4 million at December 31, 2006 to $0.5
million at December 31, 2007. The decrease was primarily due to lower sales volume in the United Kingdom in the fourth quarter of 2007 compared to the fourth quarter of 2006.
(2) Accrued warranties decreased $0.2 million from $0.4 million at December 31, 2006 to $0.2 million at December 31, 2007. The decrease was primarily due to price negotiations with our third party warranty repair vendor that occurred during the second quarter of 2007 (See Note 21).
Note 9 — Financial Instruments
Our financial instruments consist primarily of investments in cash and cash equivalents, accounts receivable, accounts payable and accrued liabilities. The carrying value of these instruments approximate fair value due to their short maturities.
56
DH
M B
P -
3868
0_10
K_7
- P
age
56 o
f 84
- Apr
4, 2
008
- 10:
01:1
7 A
M -
Bla
ck
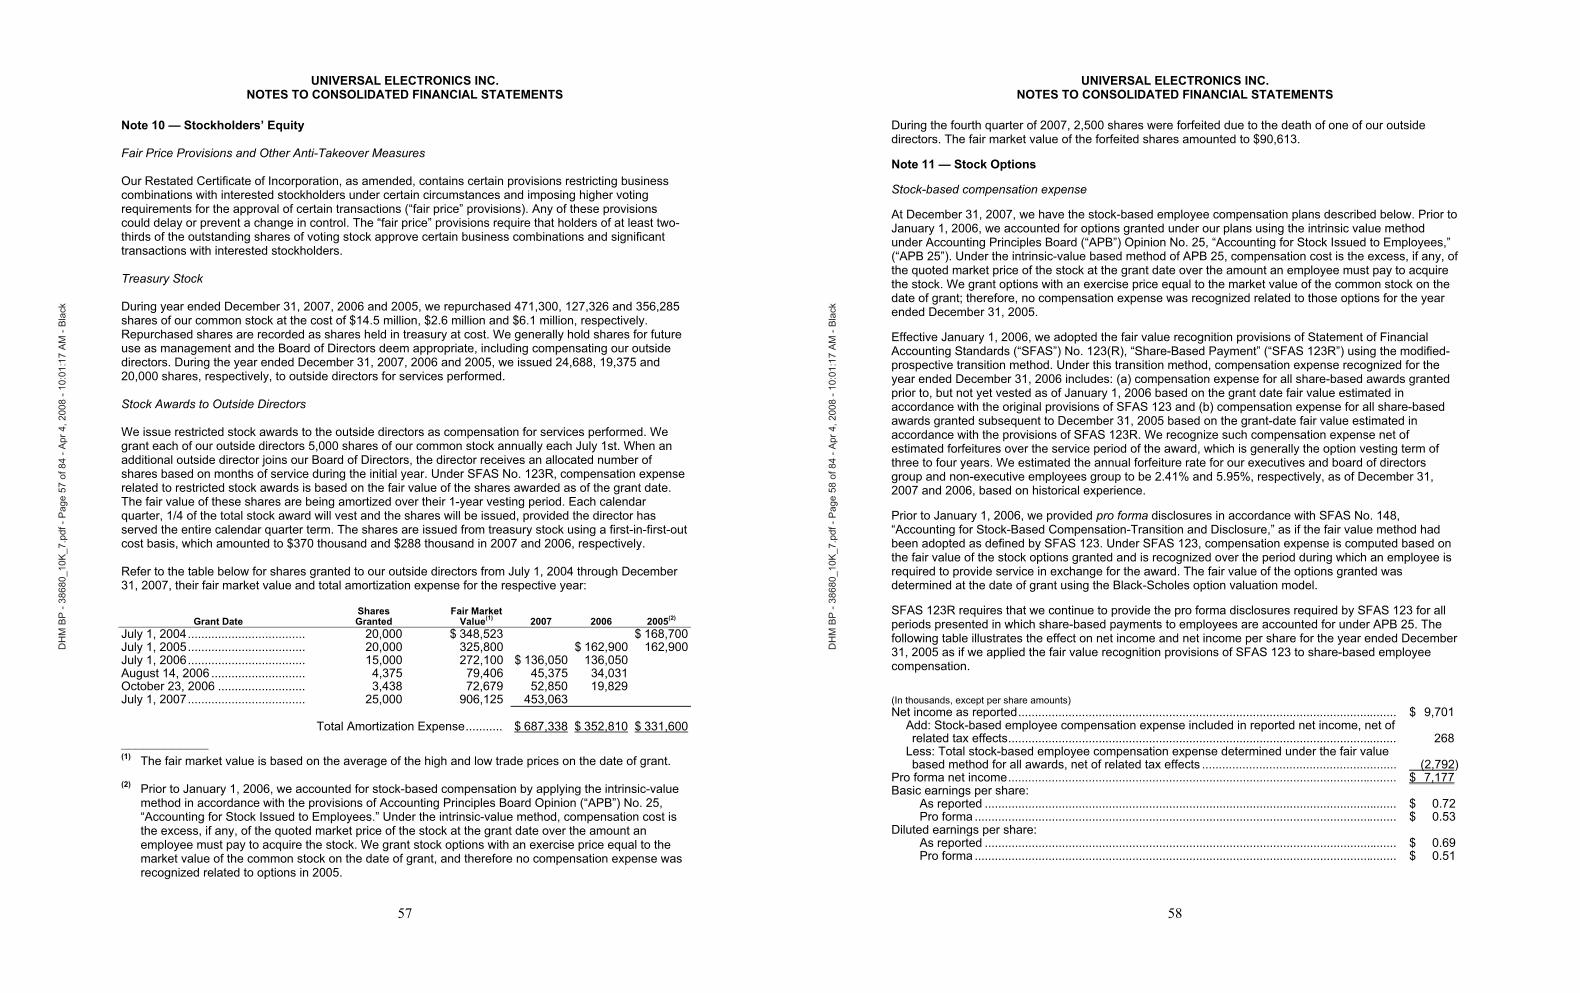
UNIVERSAL ELECTRONICS INC.NOTES TO CONSOLIDATED FINANCIAL STATEMENTS
Note 10 — Stockholders’ Equity
Fair Price Provisions and Other Anti-Takeover Measures
Our Restated Certificate of Incorporation, as amended, contains certain provisions restricting business combinations with interested stockholders under certain circumstances and imposing higher voting requirements for the approval of certain transactions (“fair price” provisions). Any of these provisions could delay or prevent a change in control. The “fair price” provisions require that holders of at least two-thirds of the outstanding shares of voting stock approve certain business combinations and significant transactions with interested stockholders.
Treasury Stock
During year ended December 31, 2007, 2006 and 2005, we repurchased 471,300, 127,326 and 356,285 shares of our common stock at the cost of $14.5 million, $2.6 million and $6.1 million, respectively. Repurchased shares are recorded as shares held in treasury at cost. We generally hold shares for future use as management and the Board of Directors deem appropriate, including compensating our outside directors. During the year ended December 31, 2007, 2006 and 2005, we issued 24,688, 19,375 and 20,000 shares, respectively, to outside directors for services performed.
Stock Awards to Outside Directors
We issue restricted stock awards to the outside directors as compensation for services performed. We grant each of our outside directors 5,000 shares of our common stock annually each July 1st. When an additional outside director joins our Board of Directors, the director receives an allocated number of shares based on months of service during the initial year. Under SFAS No. 123R, compensation expense related to restricted stock awards is based on the fair value of the shares awarded as of the grant date. The fair value of these shares are being amortized over their 1-year vesting period. Each calendar quarter, 1/4 of the total stock award will vest and the shares will be issued, provided the director has served the entire calendar quarter term. The shares are issued from treasury stock using a first-in-first-out cost basis, which amounted to $370 thousand and $288 thousand in 2007 and 2006, respectively.
Refer to the table below for shares granted to our outside directors from July 1, 2004 through December 31, 2007, their fair market value and total amortization expense for the respective year:
Grant Date Shares Granted
Fair Market Value(1) 2007 2006 2005(2)
July 1, 2004................................... 20,000 $ 348,523 $ 168,700July 1, 2005................................... 20,000 325,800 $ 162,900 162,900July 1, 2006................................... 15,000 272,100 $ 136,050 136,050 August 14, 2006 ............................ 4,375 79,406 45,375 34,031 October 23, 2006 .......................... 3,438 72,679 52,850 19,829 July 1, 2007................................... 25,000 906,125 453,063
Total Amortization Expense........... $ 687,338 $ 352,810 $ 331,600____________(1) The fair market value is based on the average of the high and low trade prices on the date of grant.
(2) Prior to January 1, 2006, we accounted for stock-based compensation by applying the intrinsic-value method in accordance with the provisions of Accounting Principles Board Opinion (“APB”) No. 25, “Accounting for Stock Issued to Employees.” Under the intrinsic-value method, compensation cost is the excess, if any, of the quoted market price of the stock at the grant date over the amount an employee must pay to acquire the stock. We grant stock options with an exercise price equal to the market value of the common stock on the date of grant, and therefore no compensation expense was recognized related to options in 2005.
57
DH
M B
P -
3868
0_10
K_7
- P
age
57 o
f 84
- Apr
4, 2
008
- 10:
01:1
7 A
M -
Bla
ck
UNIVERSAL ELECTRONICS INC.NOTES TO CONSOLIDATED FINANCIAL STATEMENTS
During the fourth quarter of 2007, 2,500 shares were forfeited due to the death of one of our outside directors. The fair market value of the forfeited shares amounted to $90,613.
Note 11 — Stock Options
Stock-based compensation expense
At December 31, 2007, we have the stock-based employee compensation plans described below. Prior to January 1, 2006, we accounted for options granted under our plans using the intrinsic value method under Accounting Principles Board (“APB”) Opinion No. 25, “Accounting for Stock Issued to Employees,” (“APB 25”). Under the intrinsic-value based method of APB 25, compensation cost is the excess, if any, of the quoted market price of the stock at the grant date over the amount an employee must pay to acquire the stock. We grant options with an exercise price equal to the market value of the common stock on the date of grant; therefore, no compensation expense was recognized related to those options for the year ended December 31, 2005.
Effective January 1, 2006, we adopted the fair value recognition provisions of Statement of Financial Accounting Standards (“SFAS”) No. 123(R), “Share-Based Payment” (“SFAS 123R”) using the modified-prospective transition method. Under this transition method, compensation expense recognized for the year ended December 31, 2006 includes: (a) compensation expense for all share-based awards granted prior to, but not yet vested as of January 1, 2006 based on the grant date fair value estimated in accordance with the original provisions of SFAS 123 and (b) compensation expense for all share-based awards granted subsequent to December 31, 2005 based on the grant-date fair value estimated in accordance with the provisions of SFAS 123R. We recognize such compensation expense net of estimated forfeitures over the service period of the award, which is generally the option vesting term of three to four years. We estimated the annual forfeiture rate for our executives and board of directors group and non-executive employees group to be 2.41% and 5.95%, respectively, as of December 31, 2007 and 2006, based on historical experience.
Prior to January 1, 2006, we provided pro forma disclosures in accordance with SFAS No. 148, “Accounting for Stock-Based Compensation-Transition and Disclosure,” as if the fair value method had been adopted as defined by SFAS 123. Under SFAS 123, compensation expense is computed based on the fair value of the stock options granted and is recognized over the period during which an employee is required to provide service in exchange for the award. The fair value of the options granted was determined at the date of grant using the Black-Scholes option valuation model.
SFAS 123R requires that we continue to provide the pro forma disclosures required by SFAS 123 for all periods presented in which share-based payments to employees are accounted for under APB 25. The following table illustrates the effect on net income and net income per share for the year ended December 31, 2005 as if we applied the fair value recognition provisions of SFAS 123 to share-based employee compensation.
(In thousands, except per share amounts) Net income as reported................................................................................................................. $ 9,701
Add: Stock-based employee compensation expense included in reported net income, net of related tax effects.................................................................................................................... 268
Less: Total stock-based employee compensation expense determined under the fair value based method for all awards, net of related tax effects .......................................................... (2,792)
Pro forma net income.................................................................................................................... $ 7,177Basic earnings per share:
As reported ........................................................................................................................... $ 0.72Pro forma .............................................................................................................................. $ 0.53
Diluted earnings per share: As reported ........................................................................................................................... $ 0.69Pro forma .............................................................................................................................. $ 0.51
58
DH
M B
P -
3868
0_10
K_7
- P
age
58 o
f 84
- Apr
4, 2
008
- 10:
01:1
7 A
M -
Bla
ck
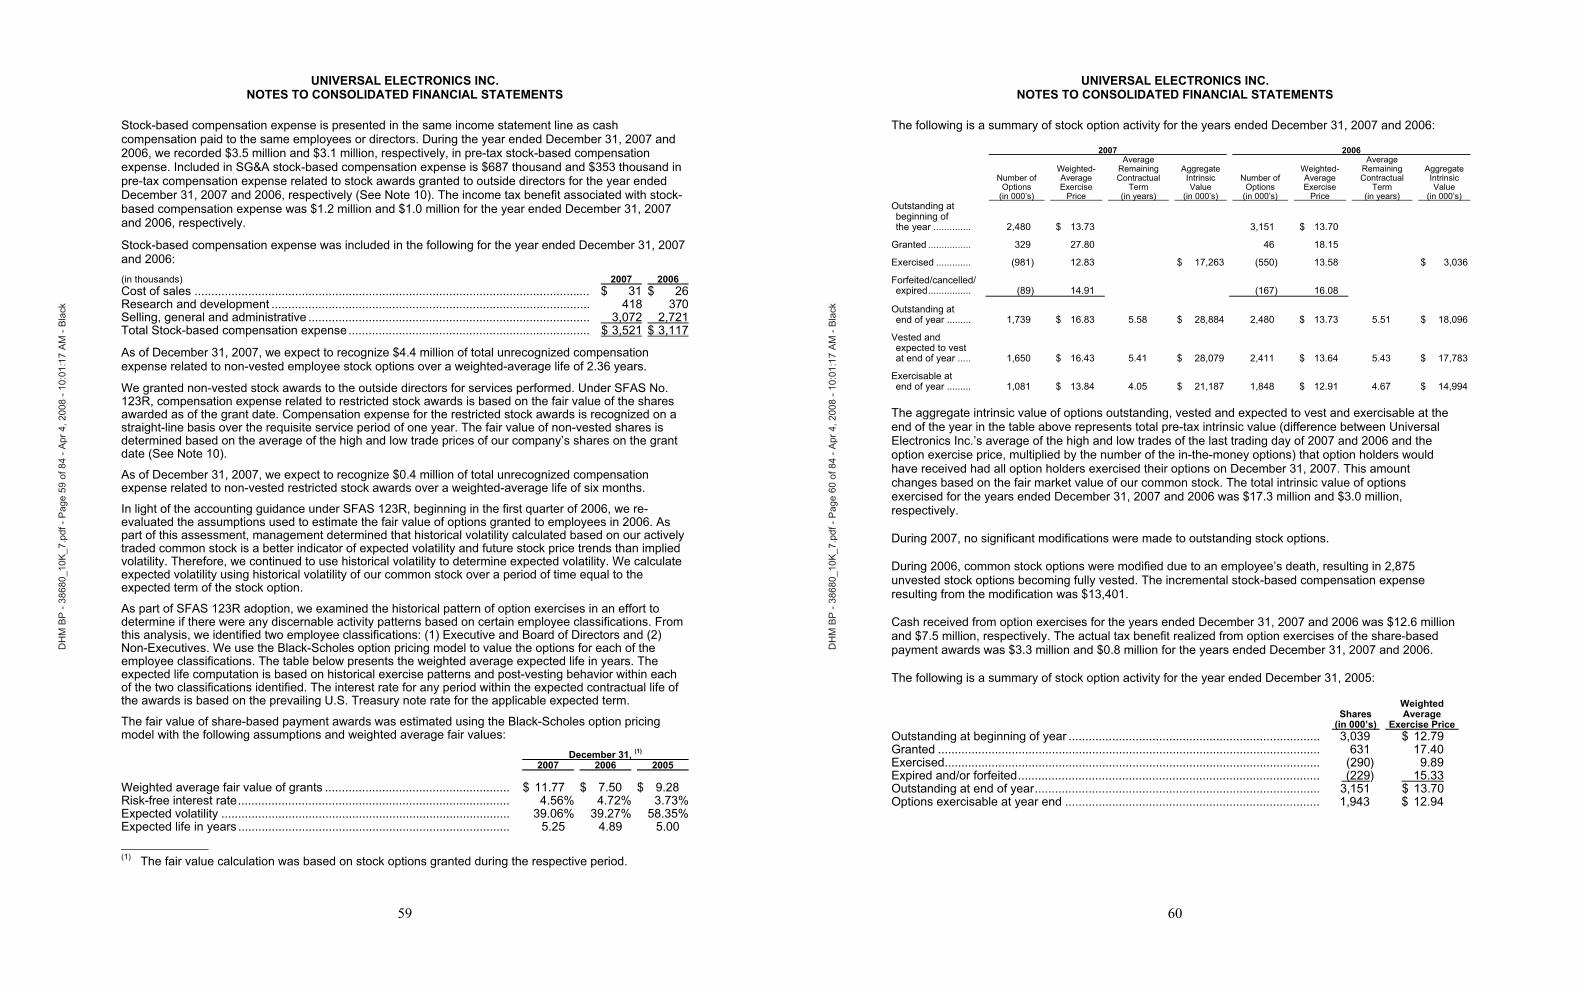
UNIVERSAL ELECTRONICS INC.NOTES TO CONSOLIDATED FINANCIAL STATEMENTS
Stock-based compensation expense is presented in the same income statement line as cash compensation paid to the same employees or directors. During the year ended December 31, 2007 and 2006, we recorded $3.5 million and $3.1 million, respectively, in pre-tax stock-based compensation expense. Included in SG&A stock-based compensation expense is $687 thousand and $353 thousand in pre-tax compensation expense related to stock awards granted to outside directors for the year ended December 31, 2007 and 2006, respectively (See Note 10). The income tax benefit associated with stock-based compensation expense was $1.2 million and $1.0 million for the year ended December 31, 2007 and 2006, respectively.
Stock-based compensation expense was included in the following for the year ended December 31, 2007 and 2006: (in thousands) 2007 2006 Cost of sales ...................................................................................................................... $ 31 $ 26Research and development ............................................................................................... 418 370Selling, general and administrative .................................................................................... 3,072 2,721Total Stock-based compensation expense........................................................................ $ 3,521 $ 3,117
As of December 31, 2007, we expect to recognize $4.4 million of total unrecognized compensation expense related to non-vested employee stock options over a weighted-average life of 2.36 years.
We granted non-vested stock awards to the outside directors for services performed. Under SFAS No. 123R, compensation expense related to restricted stock awards is based on the fair value of the shares awarded as of the grant date. Compensation expense for the restricted stock awards is recognized on a straight-line basis over the requisite service period of one year. The fair value of non-vested shares is determined based on the average of the high and low trade prices of our company’s shares on the grant date (See Note 10).
As of December 31, 2007, we expect to recognize $0.4 million of total unrecognized compensation expense related to non-vested restricted stock awards over a weighted-average life of six months.
In light of the accounting guidance under SFAS 123R, beginning in the first quarter of 2006, we re-evaluated the assumptions used to estimate the fair value of options granted to employees in 2006. As part of this assessment, management determined that historical volatility calculated based on our actively traded common stock is a better indicator of expected volatility and future stock price trends than implied volatility. Therefore, we continued to use historical volatility to determine expected volatility. We calculate expected volatility using historical volatility of our common stock over a period of time equal to the expected term of the stock option.
As part of SFAS 123R adoption, we examined the historical pattern of option exercises in an effort to determine if there were any discernable activity patterns based on certain employee classifications. From this analysis, we identified two employee classifications: (1) Executive and Board of Directors and (2) Non-Executives. We use the Black-Scholes option pricing model to value the options for each of the employee classifications. The table below presents the weighted average expected life in years. The expected life computation is based on historical exercise patterns and post-vesting behavior within each of the two classifications identified. The interest rate for any period within the expected contractual life of the awards is based on the prevailing U.S. Treasury note rate for the applicable expected term.
The fair value of share-based payment awards was estimated using the Black-Scholes option pricing model with the following assumptions and weighted average fair values:
December 31, (1)
2007 2006 2005
Weighted average fair value of grants ....................................................... $ 11.77 $ 7.50 $ 9.28 Risk-free interest rate................................................................................. 4.56% 4.72% 3.73%Expected volatility ...................................................................................... 39.06% 39.27% 58.35%Expected life in years ................................................................................. 5.25 4.89 5.00 ____________(1) The fair value calculation was based on stock options granted during the respective period.
59
DH
M B
P -
3868
0_10
K_7
- P
age
59 o
f 84
- Apr
4, 2
008
- 10:
01:1
7 A
M -
Bla
ck
UNIVERSAL ELECTRONICS INC.NOTES TO CONSOLIDATED FINANCIAL STATEMENTS
The following is a summary of stock option activity for the years ended December 31, 2007 and 2006:
2007 2006
Number of Options (in 000’s)
Weighted- Average Exercise Price
Average Remaining Contractual Term (in years)
Aggregate Intrinsic Value (in 000’s)
Number of Options (in 000’s)
Weighted- Average Exercise Price
Average Remaining Contractual Term (in years)
Aggregate Intrinsic Value (in 000’s)
Outstanding at beginning ofthe year .............. 2,480 $ 13.73 3,151 $ 13.70
Granted ................ 329 27.80 46 18.15
Exercised ............. (981) 12.83 $ 17,263 (550) 13.58 $ 3,036
Forfeited/cancelled/expired................ (89) 14.91 (167) 16.08
Outstanding atend of year ......... 1,739 $ 16.83 5.58 $ 28,884 2,480 $ 13.73 5.51 $ 18,096
Vested and expected to vest at end of year ..... 1,650 $ 16.43 5.41 $ 28,079 2,411 $ 13.64 5.43 $ 17,783
Exercisable atend of year ......... 1,081 $ 13.84 4.05 $ 21,187 1,848 $ 12.91 4.67 $ 14,994
The aggregate intrinsic value of options outstanding, vested and expected to vest and exercisable at the end of the year in the table above represents total pre-tax intrinsic value (difference between Universal Electronics Inc.’s average of the high and low trades of the last trading day of 2007 and 2006 and the option exercise price, multiplied by the number of the in-the-money options) that option holders would have received had all option holders exercised their options on December 31, 2007. This amount changes based on the fair market value of our common stock. The total intrinsic value of options exercised for the years ended December 31, 2007 and 2006 was $17.3 million and $3.0 million, respectively.
During 2007, no significant modifications were made to outstanding stock options.
During 2006, common stock options were modified due to an employee’s death, resulting in 2,875 unvested stock options becoming fully vested. The incremental stock-based compensation expense resulting from the modification was $13,401.
Cash received from option exercises for the years ended December 31, 2007 and 2006 was $12.6 million and $7.5 million, respectively. The actual tax benefit realized from option exercises of the share-based payment awards was $3.3 million and $0.8 million for the years ended December 31, 2007 and 2006.
The following is a summary of stock option activity for the year ended December 31, 2005:
Weighted Shares Average (in 000’s) Exercise Price
Outstanding at beginning of year ........................................................................... 3,039 $ 12.79 Granted .................................................................................................................. 631 17.40 Exercised................................................................................................................ (290) 9.89 Expired and/or forfeited.......................................................................................... (229) 15.33Outstanding at end of year..................................................................................... 3,151 $ 13.70Options exercisable at year end ............................................................................ 1,943 $ 12.94
60
DH
M B
P -
3868
0_10
K_7
- P
age
60 o
f 84
- Apr
4, 2
008
- 10:
01:1
7 A
M -
Bla
ck
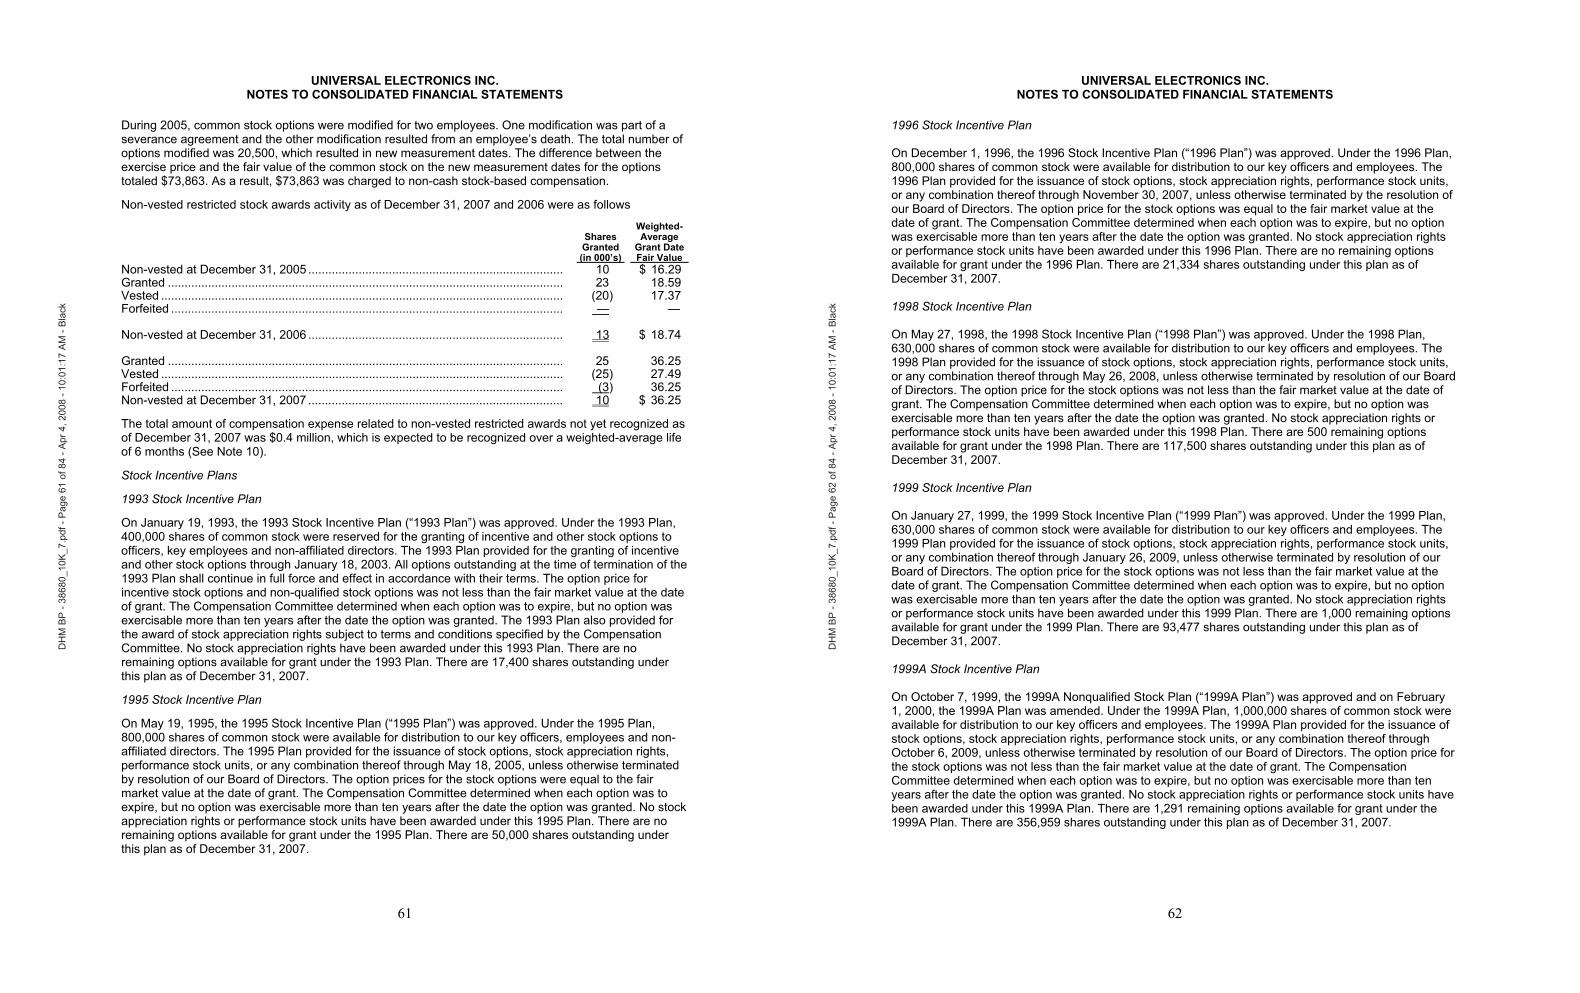
UNIVERSAL ELECTRONICS INC.NOTES TO CONSOLIDATED FINANCIAL STATEMENTS
During 2005, common stock options were modified for two employees. One modification was part of a severance agreement and the other modification resulted from an employee’s death. The total number of options modified was 20,500, which resulted in new measurement dates. The difference between the exercise price and the fair value of the common stock on the new measurement dates for the options totaled $73,863. As a result, $73,863 was charged to non-cash stock-based compensation.
Non-vested restricted stock awards activity as of December 31, 2007 and 2006 were as follows
Shares Granted (in 000’s)
Weighted- Average Grant Date Fair Value
Non-vested at December 31, 2005 ............................................................................ 10 $ 16.29 Granted ...................................................................................................................... 23 18.59 Vested ........................................................................................................................ (20) 17.37 Forfeited ..................................................................................................................... — —
Non-vested at December 31, 2006 ............................................................................ 13 $ 18.74
Granted ...................................................................................................................... 25 36.25 Vested ........................................................................................................................ (25) 27.49 Forfeited ..................................................................................................................... (3) 36.25 Non-vested at December 31, 2007 ............................................................................ 10 $ 36.25
The total amount of compensation expense related to non-vested restricted awards not yet recognized as of December 31, 2007 was $0.4 million, which is expected to be recognized over a weighted-average life of 6 months (See Note 10).
Stock Incentive Plans
1993 Stock Incentive Plan
On January 19, 1993, the 1993 Stock Incentive Plan (“1993 Plan”) was approved. Under the 1993 Plan, 400,000 shares of common stock were reserved for the granting of incentive and other stock options to officers, key employees and non-affiliated directors. The 1993 Plan provided for the granting of incentive and other stock options through January 18, 2003. All options outstanding at the time of termination of the 1993 Plan shall continue in full force and effect in accordance with their terms. The option price for incentive stock options and non-qualified stock options was not less than the fair market value at the date of grant. The Compensation Committee determined when each option was to expire, but no option was exercisable more than ten years after the date the option was granted. The 1993 Plan also provided for the award of stock appreciation rights subject to terms and conditions specified by the Compensation Committee. No stock appreciation rights have been awarded under this 1993 Plan. There are no remaining options available for grant under the 1993 Plan. There are 17,400 shares outstanding under this plan as of December 31, 2007.
1995 Stock Incentive Plan
On May 19, 1995, the 1995 Stock Incentive Plan (“1995 Plan”) was approved. Under the 1995 Plan, 800,000 shares of common stock were available for distribution to our key officers, employees and non-affiliated directors. The 1995 Plan provided for the issuance of stock options, stock appreciation rights, performance stock units, or any combination thereof through May 18, 2005, unless otherwise terminated by resolution of our Board of Directors. The option prices for the stock options were equal to the fair market value at the date of grant. The Compensation Committee determined when each option was to expire, but no option was exercisable more than ten years after the date the option was granted. No stock appreciation rights or performance stock units have been awarded under this 1995 Plan. There are no remaining options available for grant under the 1995 Plan. There are 50,000 shares outstanding under this plan as of December 31, 2007.
61
DH
M B
P -
3868
0_10
K_7
- P
age
61 o
f 84
- Apr
4, 2
008
- 10:
01:1
7 A
M -
Bla
ck
UNIVERSAL ELECTRONICS INC.NOTES TO CONSOLIDATED FINANCIAL STATEMENTS
1996 Stock Incentive Plan
On December 1, 1996, the 1996 Stock Incentive Plan (“1996 Plan”) was approved. Under the 1996 Plan, 800,000 shares of common stock were available for distribution to our key officers and employees. The 1996 Plan provided for the issuance of stock options, stock appreciation rights, performance stock units, or any combination thereof through November 30, 2007, unless otherwise terminated by the resolution of our Board of Directors. The option price for the stock options was equal to the fair market value at the date of grant. The Compensation Committee determined when each option was to expire, but no option was exercisable more than ten years after the date the option was granted. No stock appreciation rights or performance stock units have been awarded under this 1996 Plan. There are no remaining options available for grant under the 1996 Plan. There are 21,334 shares outstanding under this plan as of December 31, 2007.
1998 Stock Incentive Plan
On May 27, 1998, the 1998 Stock Incentive Plan (“1998 Plan”) was approved. Under the 1998 Plan, 630,000 shares of common stock were available for distribution to our key officers and employees. The 1998 Plan provided for the issuance of stock options, stock appreciation rights, performance stock units, or any combination thereof through May 26, 2008, unless otherwise terminated by resolution of our Board of Directors. The option price for the stock options was not less than the fair market value at the date of grant. The Compensation Committee determined when each option was to expire, but no option was exercisable more than ten years after the date the option was granted. No stock appreciation rights or performance stock units have been awarded under this 1998 Plan. There are 500 remaining options available for grant under the 1998 Plan. There are 117,500 shares outstanding under this plan as of December 31, 2007.
1999 Stock Incentive Plan
On January 27, 1999, the 1999 Stock Incentive Plan (“1999 Plan”) was approved. Under the 1999 Plan, 630,000 shares of common stock were available for distribution to our key officers and employees. The 1999 Plan provided for the issuance of stock options, stock appreciation rights, performance stock units, or any combination thereof through January 26, 2009, unless otherwise terminated by resolution of our Board of Directors. The option price for the stock options was not less than the fair market value at the date of grant. The Compensation Committee determined when each option was to expire, but no option was exercisable more than ten years after the date the option was granted. No stock appreciation rights or performance stock units have been awarded under this 1999 Plan. There are 1,000 remaining options available for grant under the 1999 Plan. There are 93,477 shares outstanding under this plan as of December 31, 2007.
1999A Stock Incentive Plan
On October 7, 1999, the 1999A Nonqualified Stock Plan (“1999A Plan”) was approved and on February 1, 2000, the 1999A Plan was amended. Under the 1999A Plan, 1,000,000 shares of common stock were available for distribution to our key officers and employees. The 1999A Plan provided for the issuance of stock options, stock appreciation rights, performance stock units, or any combination thereof through October 6, 2009, unless otherwise terminated by resolution of our Board of Directors. The option price for the stock options was not less than the fair market value at the date of grant. The Compensation Committee determined when each option was to expire, but no option was exercisable more than ten years after the date the option was granted. No stock appreciation rights or performance stock units have been awarded under this 1999A Plan. There are 1,291 remaining options available for grant under the 1999A Plan. There are 356,959 shares outstanding under this plan as of December 31, 2007.
62
DH
M B
P -
3868
0_10
K_7
- P
age
62 o
f 84
- Apr
4, 2
008
- 10:
01:1
7 A
M -
Bla
ck
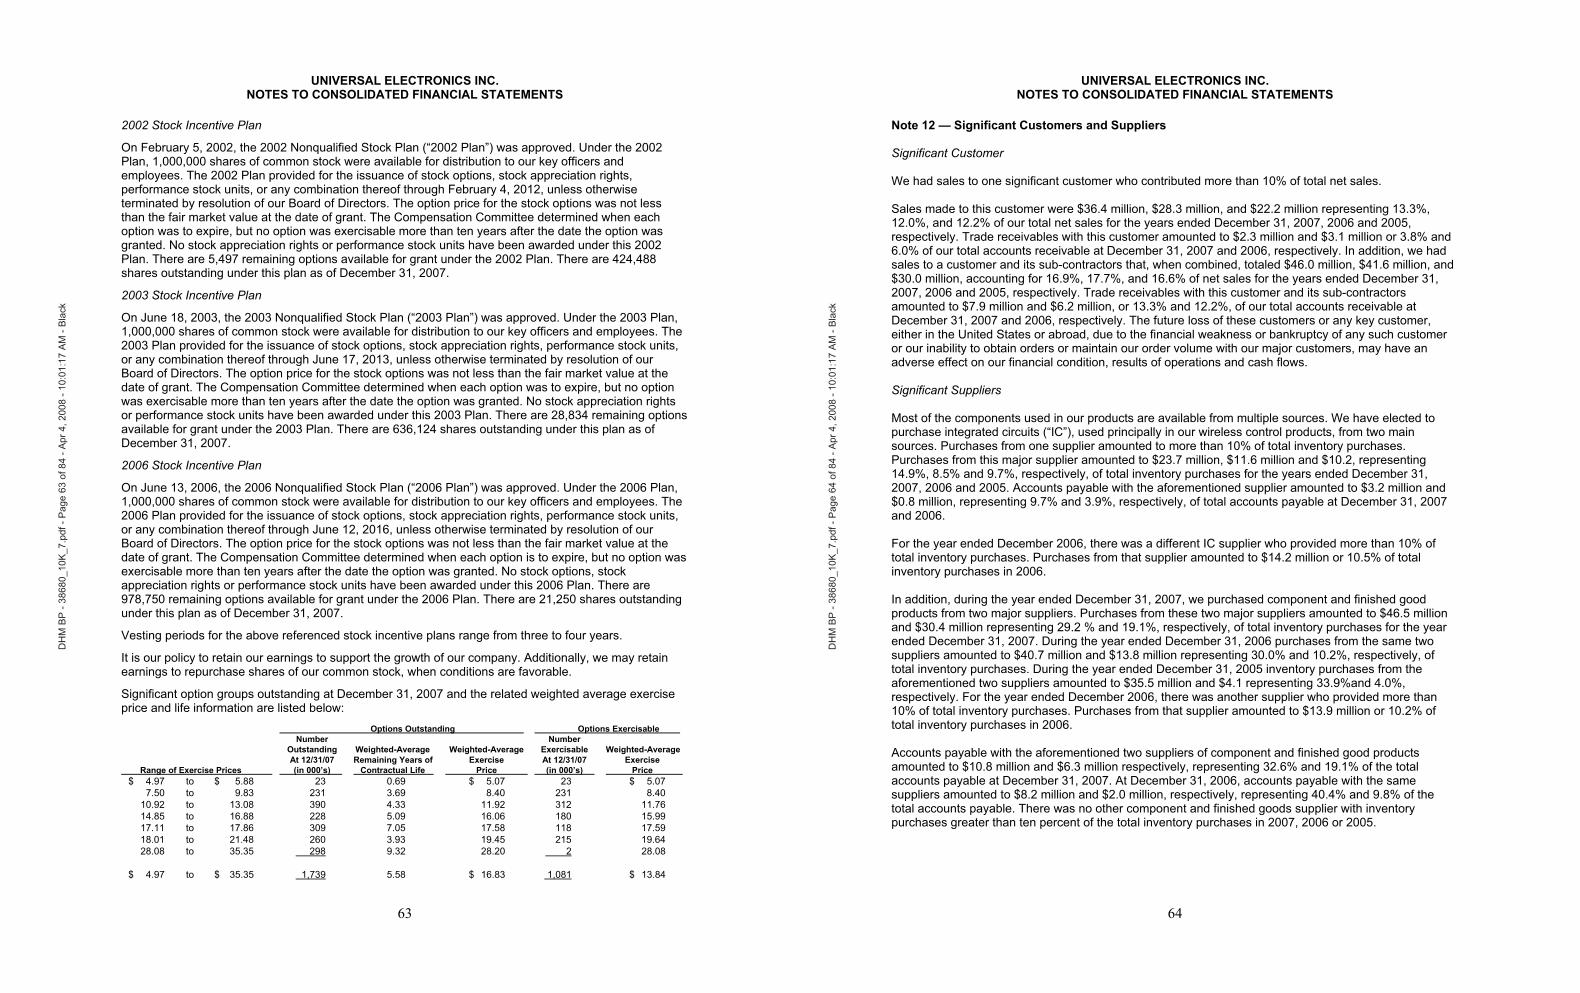
UNIVERSAL ELECTRONICS INC.NOTES TO CONSOLIDATED FINANCIAL STATEMENTS
2002 Stock Incentive Plan
On February 5, 2002, the 2002 Nonqualified Stock Plan (“2002 Plan”) was approved. Under the 2002 Plan, 1,000,000 shares of common stock were available for distribution to our key officers and employees. The 2002 Plan provided for the issuance of stock options, stock appreciation rights, performance stock units, or any combination thereof through February 4, 2012, unless otherwise terminated by resolution of our Board of Directors. The option price for the stock options was not less than the fair market value at the date of grant. The Compensation Committee determined when each option was to expire, but no option was exercisable more than ten years after the date the option was granted. No stock appreciation rights or performance stock units have been awarded under this 2002 Plan. There are 5,497 remaining options available for grant under the 2002 Plan. There are 424,488 shares outstanding under this plan as of December 31, 2007.
2003 Stock Incentive Plan
On June 18, 2003, the 2003 Nonqualified Stock Plan (“2003 Plan”) was approved. Under the 2003 Plan, 1,000,000 shares of common stock were available for distribution to our key officers and employees. The 2003 Plan provided for the issuance of stock options, stock appreciation rights, performance stock units, or any combination thereof through June 17, 2013, unless otherwise terminated by resolution of our Board of Directors. The option price for the stock options was not less than the fair market value at the date of grant. The Compensation Committee determined when each option was to expire, but no option was exercisable more than ten years after the date the option was granted. No stock appreciation rights or performance stock units have been awarded under this 2003 Plan. There are 28,834 remaining options available for grant under the 2003 Plan. There are 636,124 shares outstanding under this plan as of December 31, 2007.
2006 Stock Incentive Plan
On June 13, 2006, the 2006 Nonqualified Stock Plan (“2006 Plan”) was approved. Under the 2006 Plan, 1,000,000 shares of common stock were available for distribution to our key officers and employees. The 2006 Plan provided for the issuance of stock options, stock appreciation rights, performance stock units, or any combination thereof through June 12, 2016, unless otherwise terminated by resolution of our Board of Directors. The option price for the stock options was not less than the fair market value at the date of grant. The Compensation Committee determined when each option is to expire, but no option was exercisable more than ten years after the date the option was granted. No stock options, stock appreciation rights or performance stock units have been awarded under this 2006 Plan. There are 978,750 remaining options available for grant under the 2006 Plan. There are 21,250 shares outstanding under this plan as of December 31, 2007.
Vesting periods for the above referenced stock incentive plans range from three to four years.
It is our policy to retain our earnings to support the growth of our company. Additionally, we may retain earnings to repurchase shares of our common stock, when conditions are favorable.
Significant option groups outstanding at December 31, 2007 and the related weighted average exercise price and life information are listed below:
Options Outstanding Options Exercisable
Range of Exercise Prices
Number Outstanding At 12/31/07 (in 000’s)
Weighted-Average Remaining Years of Contractual Life
Weighted-Average Exercise Price
Number Exercisable At 12/31/07 (in 000’s)
Weighted-Average Exercise Price
$ 4.97 to $ 5.88 23 0.69 $ 5.07 23 $ 5.07 7.50 to 9.83 231 3.69 8.40 231 8.40 10.92 to 13.08 390 4.33 11.92 312 11.76 14.85 to 16.88 228 5.09 16.06 180 15.99 17.11 to 17.86 309 7.05 17.58 118 17.59 18.01 to 21.48 260 3.93 19.45 215 19.64 28.08 to 35.35 298 9.32 28.20 2 28.08
$ 4.97 to $ 35.35 1,739 5.58 $ 16.83 1,081 $ 13.84
63
DH
M B
P -
3868
0_10
K_7
- P
age
63 o
f 84
- Apr
4, 2
008
- 10:
01:1
7 A
M -
Bla
ck
UNIVERSAL ELECTRONICS INC.NOTES TO CONSOLIDATED FINANCIAL STATEMENTS
Note 12 — Significant Customers and Suppliers
Significant Customer
We had sales to one significant customer who contributed more than 10% of total net sales.
Sales made to this customer were $36.4 million, $28.3 million, and $22.2 million representing 13.3%, 12.0%, and 12.2% of our total net sales for the years ended December 31, 2007, 2006 and 2005, respectively. Trade receivables with this customer amounted to $2.3 million and $3.1 million or 3.8% and 6.0% of our total accounts receivable at December 31, 2007 and 2006, respectively. In addition, we had sales to a customer and its sub-contractors that, when combined, totaled $46.0 million, $41.6 million, and $30.0 million, accounting for 16.9%, 17.7%, and 16.6% of net sales for the years ended December 31, 2007, 2006 and 2005, respectively. Trade receivables with this customer and its sub-contractors amounted to $7.9 million and $6.2 million, or 13.3% and 12.2%, of our total accounts receivable at December 31, 2007 and 2006, respectively. The future loss of these customers or any key customer, either in the United States or abroad, due to the financial weakness or bankruptcy of any such customer or our inability to obtain orders or maintain our order volume with our major customers, may have an adverse effect on our financial condition, results of operations and cash flows.
Significant Suppliers
Most of the components used in our products are available from multiple sources. We have elected to purchase integrated circuits (“IC”), used principally in our wireless control products, from two main sources. Purchases from one supplier amounted to more than 10% of total inventory purchases. Purchases from this major supplier amounted to $23.7 million, $11.6 million and $10.2, representing 14.9%, 8.5% and 9.7%, respectively, of total inventory purchases for the years ended December 31, 2007, 2006 and 2005. Accounts payable with the aforementioned supplier amounted to $3.2 million and $0.8 million, representing 9.7% and 3.9%, respectively, of total accounts payable at December 31, 2007 and 2006.
For the year ended December 2006, there was a different IC supplier who provided more than 10% of total inventory purchases. Purchases from that supplier amounted to $14.2 million or 10.5% of total inventory purchases in 2006.
In addition, during the year ended December 31, 2007, we purchased component and finished good products from two major suppliers. Purchases from these two major suppliers amounted to $46.5 million and $30.4 million representing 29.2 % and 19.1%, respectively, of total inventory purchases for the year ended December 31, 2007. During the year ended December 31, 2006 purchases from the same two suppliers amounted to $40.7 million and $13.8 million representing 30.0% and 10.2%, respectively, of total inventory purchases. During the year ended December 31, 2005 inventory purchases from the aforementioned two suppliers amounted to $35.5 million and $4.1 representing 33.9%and 4.0%, respectively. For the year ended December 2006, there was another supplier who provided more than 10% of total inventory purchases. Purchases from that supplier amounted to $13.9 million or 10.2% of total inventory purchases in 2006.
Accounts payable with the aforementioned two suppliers of component and finished good products amounted to $10.8 million and $6.3 million respectively, representing 32.6% and 19.1% of the total accounts payable at December 31, 2007. At December 31, 2006, accounts payable with the same suppliers amounted to $8.2 million and $2.0 million, respectively, representing 40.4% and 9.8% of the total accounts payable. There was no other component and finished goods supplier with inventory purchases greater than ten percent of the total inventory purchases in 2007, 2006 or 2005.
64
DH
M B
P -
3868
0_10
K_7
- P
age
64 o
f 84
- Apr
4, 2
008
- 10:
01:1
7 A
M -
Bla
ck
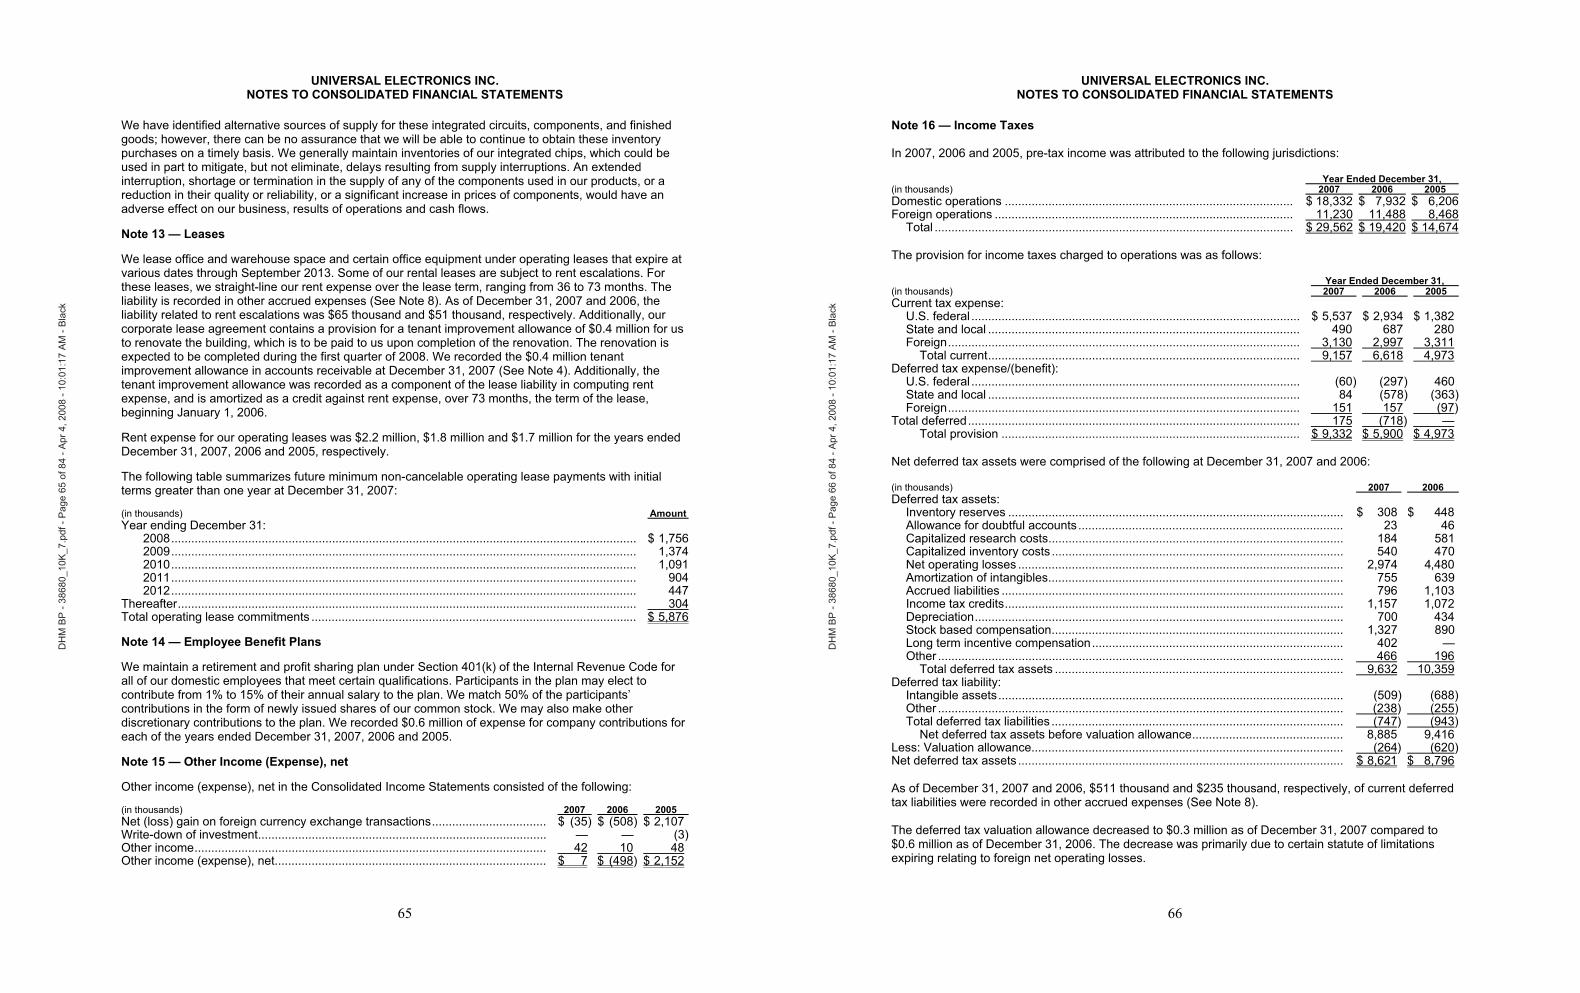
UNIVERSAL ELECTRONICS INC.NOTES TO CONSOLIDATED FINANCIAL STATEMENTS
We have identified alternative sources of supply for these integrated circuits, components, and finished goods; however, there can be no assurance that we will be able to continue to obtain these inventory purchases on a timely basis. We generally maintain inventories of our integrated chips, which could be used in part to mitigate, but not eliminate, delays resulting from supply interruptions. An extended interruption, shortage or termination in the supply of any of the components used in our products, or a reduction in their quality or reliability, or a significant increase in prices of components, would have an adverse effect on our business, results of operations and cash flows.
Note 13 — Leases
We lease office and warehouse space and certain office equipment under operating leases that expire at various dates through September 2013. Some of our rental leases are subject to rent escalations. For these leases, we straight-line our rent expense over the lease term, ranging from 36 to 73 months. The liability is recorded in other accrued expenses (See Note 8). As of December 31, 2007 and 2006, the liability related to rent escalations was $65 thousand and $51 thousand, respectively. Additionally, our corporate lease agreement contains a provision for a tenant improvement allowance of $0.4 million for us to renovate the building, which is to be paid to us upon completion of the renovation. The renovation is expected to be completed during the first quarter of 2008. We recorded the $0.4 million tenant improvement allowance in accounts receivable at December 31, 2007 (See Note 4). Additionally, the tenant improvement allowance was recorded as a component of the lease liability in computing rent expense, and is amortized as a credit against rent expense, over 73 months, the term of the lease, beginning January 1, 2006.
Rent expense for our operating leases was $2.2 million, $1.8 million and $1.7 million for the years ended December 31, 2007, 2006 and 2005, respectively.
The following table summarizes future minimum non-cancelable operating lease payments with initial terms greater than one year at December 31, 2007:
(in thousands) Amount Year ending December 31:
2008........................................................................................................................................... $ 1,7562009........................................................................................................................................... 1,3742010........................................................................................................................................... 1,0912011........................................................................................................................................... 9042012........................................................................................................................................... 447
Thereafter......................................................................................................................................... 304Total operating lease commitments ................................................................................................. $ 5,876
Note 14 — Employee Benefit Plans
We maintain a retirement and profit sharing plan under Section 401(k) of the Internal Revenue Code for all of our domestic employees that meet certain qualifications. Participants in the plan may elect to contribute from 1% to 15% of their annual salary to the plan. We match 50% of the participants’ contributions in the form of newly issued shares of our common stock. We may also make other discretionary contributions to the plan. We recorded $0.6 million of expense for company contributions for each of the years ended December 31, 2007, 2006 and 2005.
Note 15 — Other Income (Expense), net
Other income (expense), net in the Consolidated Income Statements consisted of the following:
(in thousands) 2007 2006 2005 Net (loss) gain on foreign currency exchange transactions.................................. $ (35) $ (508) $ 2,107 Write-down of investment...................................................................................... — — (3)Other income......................................................................................................... 42 10 48Other income (expense), net................................................................................. $ 7 $ (498) $ 2,152
65
DH
M B
P -
3868
0_10
K_7
- P
age
65 o
f 84
- Apr
4, 2
008
- 10:
01:1
7 A
M -
Bla
ck
UNIVERSAL ELECTRONICS INC.NOTES TO CONSOLIDATED FINANCIAL STATEMENTS
Note 16 — Income Taxes
In 2007, 2006 and 2005, pre-tax income was attributed to the following jurisdictions:
Year Ended December 31, (in thousands) 2007 2006 2005 Domestic operations ...................................................................................... $ 18,332 $ 7,932 $ 6,206Foreign operations ......................................................................................... 11,230 11,488 8,468
Total ........................................................................................................... $ 29,562 $ 19,420 $ 14,674
The provision for income taxes charged to operations was as follows:
Year Ended December 31, (in thousands) 2007 2006 2005 Current tax expense:
U.S. federal .................................................................................................. $ 5,537 $ 2,934 $ 1,382 State and local ............................................................................................. 490 687 280 Foreign......................................................................................................... 3,130 2,997 3,311
Total current............................................................................................. 9,157 6,618 4,973Deferred tax expense/(benefit):
U.S. federal .................................................................................................. (60) (297) 460State and local ............................................................................................. 84 (578) (363)Foreign......................................................................................................... 151 157 (97)
Total deferred................................................................................................... 175 (718) —Total provision ......................................................................................... $ 9,332 $ 5,900 $ 4,973
Net deferred tax assets were comprised of the following at December 31, 2007 and 2006:
(in thousands) 2007 2006 Deferred tax assets:
Inventory reserves .................................................................................................... $ 308 $ 448Allowance for doubtful accounts ............................................................................... 23 46 Capitalized research costs........................................................................................ 184 581 Capitalized inventory costs ....................................................................................... 540 470 Net operating losses ................................................................................................. 2,974 4,480Amortization of intangibles........................................................................................ 755 639 Accrued liabilities ...................................................................................................... 796 1,103 Income tax credits..................................................................................................... 1,157 1,072 Depreciation.............................................................................................................. 700 434 Stock based compensation....................................................................................... 1,327 890 Long term incentive compensation........................................................................... 402 — Other ......................................................................................................................... 466 196
Total deferred tax assets ...................................................................................... 9,632 10,359Deferred tax liability:
Intangible assets....................................................................................................... (509) (688)Other ......................................................................................................................... (238) (255)Total deferred tax liabilities ....................................................................................... (747) (943)
Net deferred tax assets before valuation allowance............................................. 8,885 9,416 Less: Valuation allowance............................................................................................. (264) (620)Net deferred tax assets ................................................................................................. $ 8,621 $ 8,796
As of December 31, 2007 and 2006, $511 thousand and $235 thousand, respectively, of current deferred tax liabilities were recorded in other accrued expenses (See Note 8).
The deferred tax valuation allowance decreased to $0.3 million as of December 31, 2007 compared to $0.6 million as of December 31, 2006. The decrease was primarily due to certain statute of limitations expiring relating to foreign net operating losses.
66
DH
M B
P -
3868
0_10
K_7
- P
age
66 o
f 84
- Apr
4, 2
008
- 10:
01:1
7 A
M -
Bla
ck
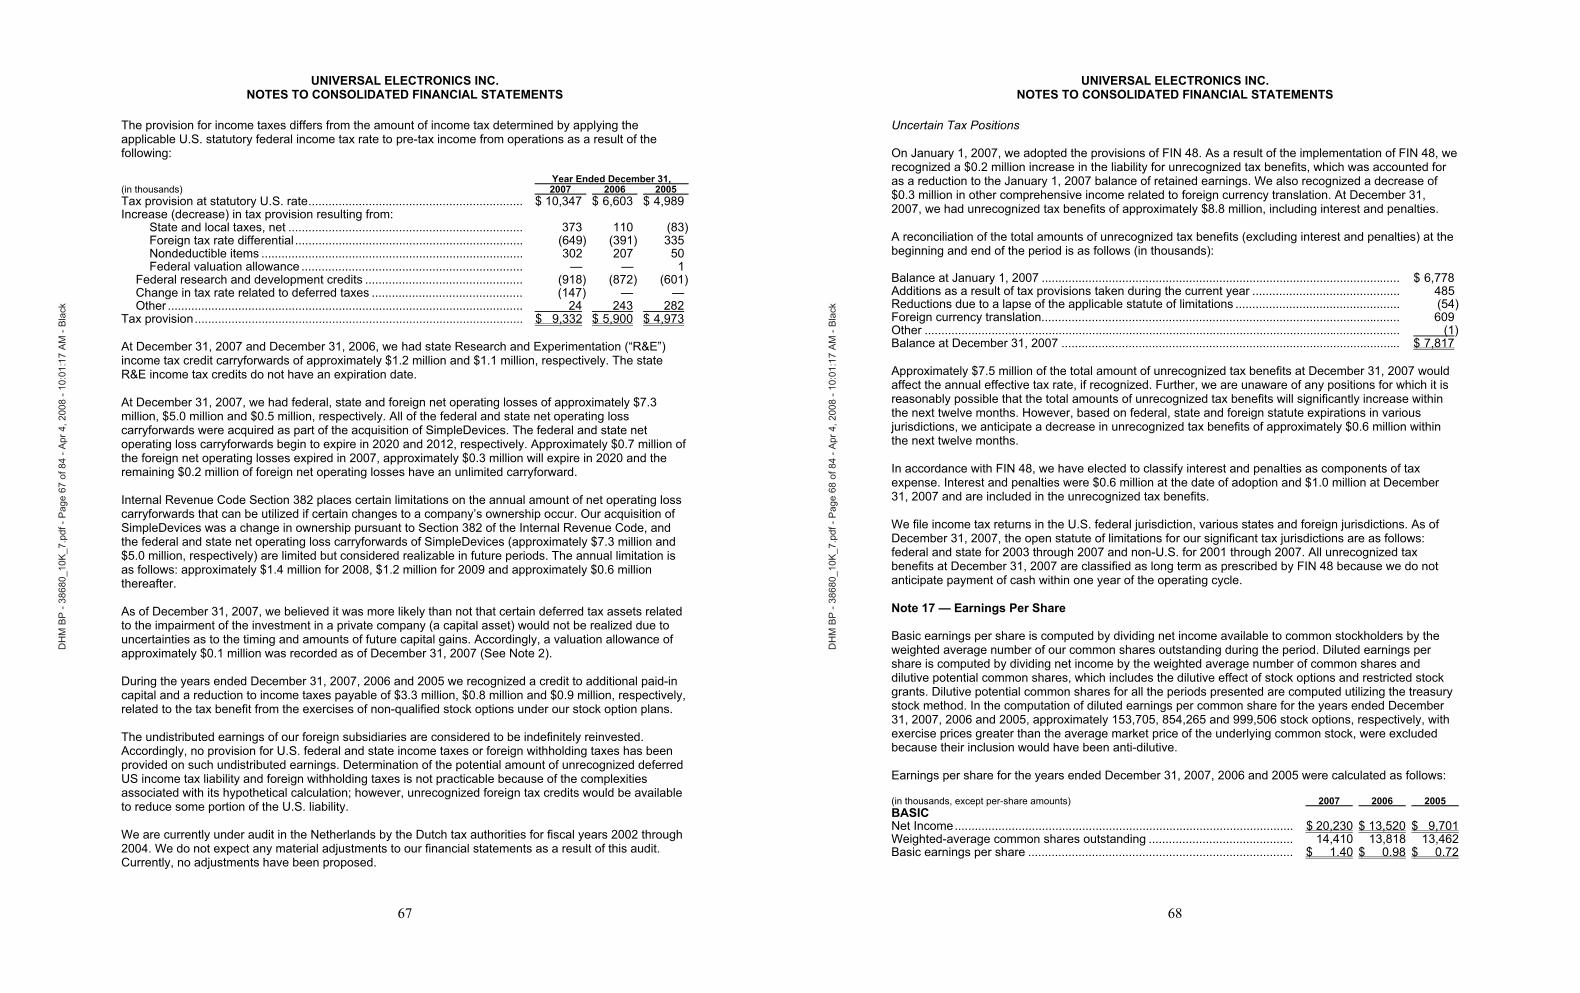
UNIVERSAL ELECTRONICS INC.NOTES TO CONSOLIDATED FINANCIAL STATEMENTS
The provision for income taxes differs from the amount of income tax determined by applying the applicable U.S. statutory federal income tax rate to pre-tax income from operations as a result of the following:
Year Ended December 31, (in thousands) 2007 2006 2005 Tax provision at statutory U.S. rate................................................................ $ 10,347 $ 6,603 $ 4,989 Increase (decrease) in tax provision resulting from:
State and local taxes, net ...................................................................... 373 110 (83)Foreign tax rate differential .................................................................... (649) (391) 335 Nondeductible items .............................................................................. 302 207 50 Federal valuation allowance .................................................................. — — 1
Federal research and development credits ............................................... (918) (872) (601)Change in tax rate related to deferred taxes ............................................. (147) — — Other .......................................................................................................... 24 243 282
Tax provision.................................................................................................. $ 9,332 $ 5,900 $ 4,973
At December 31, 2007 and December 31, 2006, we had state Research and Experimentation (“R&E”) income tax credit carryforwards of approximately $1.2 million and $1.1 million, respectively. The state R&E income tax credits do not have an expiration date.
At December 31, 2007, we had federal, state and foreign net operating losses of approximately $7.3 million, $5.0 million and $0.5 million, respectively. All of the federal and state net operating loss carryforwards were acquired as part of the acquisition of SimpleDevices. The federal and state net operating loss carryforwards begin to expire in 2020 and 2012, respectively. Approximately $0.7 million of the foreign net operating losses expired in 2007, approximately $0.3 million will expire in 2020 and the remaining $0.2 million of foreign net operating losses have an unlimited carryforward.
Internal Revenue Code Section 382 places certain limitations on the annual amount of net operating loss carryforwards that can be utilized if certain changes to a company’s ownership occur. Our acquisition of SimpleDevices was a change in ownership pursuant to Section 382 of the Internal Revenue Code, and the federal and state net operating loss carryforwards of SimpleDevices (approximately $7.3 million and $5.0 million, respectively) are limited but considered realizable in future periods. The annual limitation is as follows: approximately $1.4 million for 2008, $1.2 million for 2009 and approximately $0.6 million thereafter.
As of December 31, 2007, we believed it was more likely than not that certain deferred tax assets related to the impairment of the investment in a private company (a capital asset) would not be realized due to uncertainties as to the timing and amounts of future capital gains. Accordingly, a valuation allowance of approximately $0.1 million was recorded as of December 31, 2007 (See Note 2).
During the years ended December 31, 2007, 2006 and 2005 we recognized a credit to additional paid-in capital and a reduction to income taxes payable of $3.3 million, $0.8 million and $0.9 million, respectively, related to the tax benefit from the exercises of non-qualified stock options under our stock option plans.
The undistributed earnings of our foreign subsidiaries are considered to be indefinitely reinvested. Accordingly, no provision for U.S. federal and state income taxes or foreign withholding taxes has been provided on such undistributed earnings. Determination of the potential amount of unrecognized deferred US income tax liability and foreign withholding taxes is not practicable because of the complexities associated with its hypothetical calculation; however, unrecognized foreign tax credits would be available to reduce some portion of the U.S. liability.
We are currently under audit in the Netherlands by the Dutch tax authorities for fiscal years 2002 through 2004. We do not expect any material adjustments to our financial statements as a result of this audit. Currently, no adjustments have been proposed.
67
DH
M B
P -
3868
0_10
K_7
- P
age
67 o
f 84
- Apr
4, 2
008
- 10:
01:1
7 A
M -
Bla
ck
UNIVERSAL ELECTRONICS INC.NOTES TO CONSOLIDATED FINANCIAL STATEMENTS
Uncertain Tax Positions
On January 1, 2007, we adopted the provisions of FIN 48. As a result of the implementation of FIN 48, we recognized a $0.2 million increase in the liability for unrecognized tax benefits, which was accounted for as a reduction to the January 1, 2007 balance of retained earnings. We also recognized a decrease of $0.3 million in other comprehensive income related to foreign currency translation. At December 31, 2007, we had unrecognized tax benefits of approximately $8.8 million, including interest and penalties.
A reconciliation of the total amounts of unrecognized tax benefits (excluding interest and penalties) at the beginning and end of the period is as follows (in thousands):
Balance at January 1, 2007 ........................................................................................................... $ 6,778 Additions as a result of tax provisions taken during the current year ............................................ 485 Reductions due to a lapse of the applicable statute of limitations ................................................. (54)Foreign currency translation........................................................................................................... 609 Other .............................................................................................................................................. (1)Balance at December 31, 2007 ..................................................................................................... $ 7,817
Approximately $7.5 million of the total amount of unrecognized tax benefits at December 31, 2007 would affect the annual effective tax rate, if recognized. Further, we are unaware of any positions for which it is reasonably possible that the total amounts of unrecognized tax benefits will significantly increase within the next twelve months. However, based on federal, state and foreign statute expirations in various jurisdictions, we anticipate a decrease in unrecognized tax benefits of approximately $0.6 million within the next twelve months.
In accordance with FIN 48, we have elected to classify interest and penalties as components of tax expense. Interest and penalties were $0.6 million at the date of adoption and $1.0 million at December 31, 2007 and are included in the unrecognized tax benefits.
We file income tax returns in the U.S. federal jurisdiction, various states and foreign jurisdictions. As of December 31, 2007, the open statute of limitations for our significant tax jurisdictions are as follows: federal and state for 2003 through 2007 and non-U.S. for 2001 through 2007. All unrecognized tax benefits at December 31, 2007 are classified as long term as prescribed by FIN 48 because we do not anticipate payment of cash within one year of the operating cycle.
Note 17 — Earnings Per Share
Basic earnings per share is computed by dividing net income available to common stockholders by the weighted average number of our common shares outstanding during the period. Diluted earnings per share is computed by dividing net income by the weighted average number of common shares and dilutive potential common shares, which includes the dilutive effect of stock options and restricted stock grants. Dilutive potential common shares for all the periods presented are computed utilizing the treasury stock method. In the computation of diluted earnings per common share for the years ended December 31, 2007, 2006 and 2005, approximately 153,705, 854,265 and 999,506 stock options, respectively, with exercise prices greater than the average market price of the underlying common stock, were excluded because their inclusion would have been anti-dilutive.
Earnings per share for the years ended December 31, 2007, 2006 and 2005 were calculated as follows:
(in thousands, except per-share amounts) 2007 2006 2005 BASICNet Income..................................................................................................... $ 20,230 $ 13,520 $ 9,701Weighted-average common shares outstanding ........................................... 14,410 13,818 13,462Basic earnings per share ............................................................................... $ 1.40 $ 0.98 $ 0.72
68
DH
M B
P -
3868
0_10
K_7
- P
age
68 o
f 84
- Apr
4, 2
008
- 10:
01:1
7 A
M -
Bla
ck
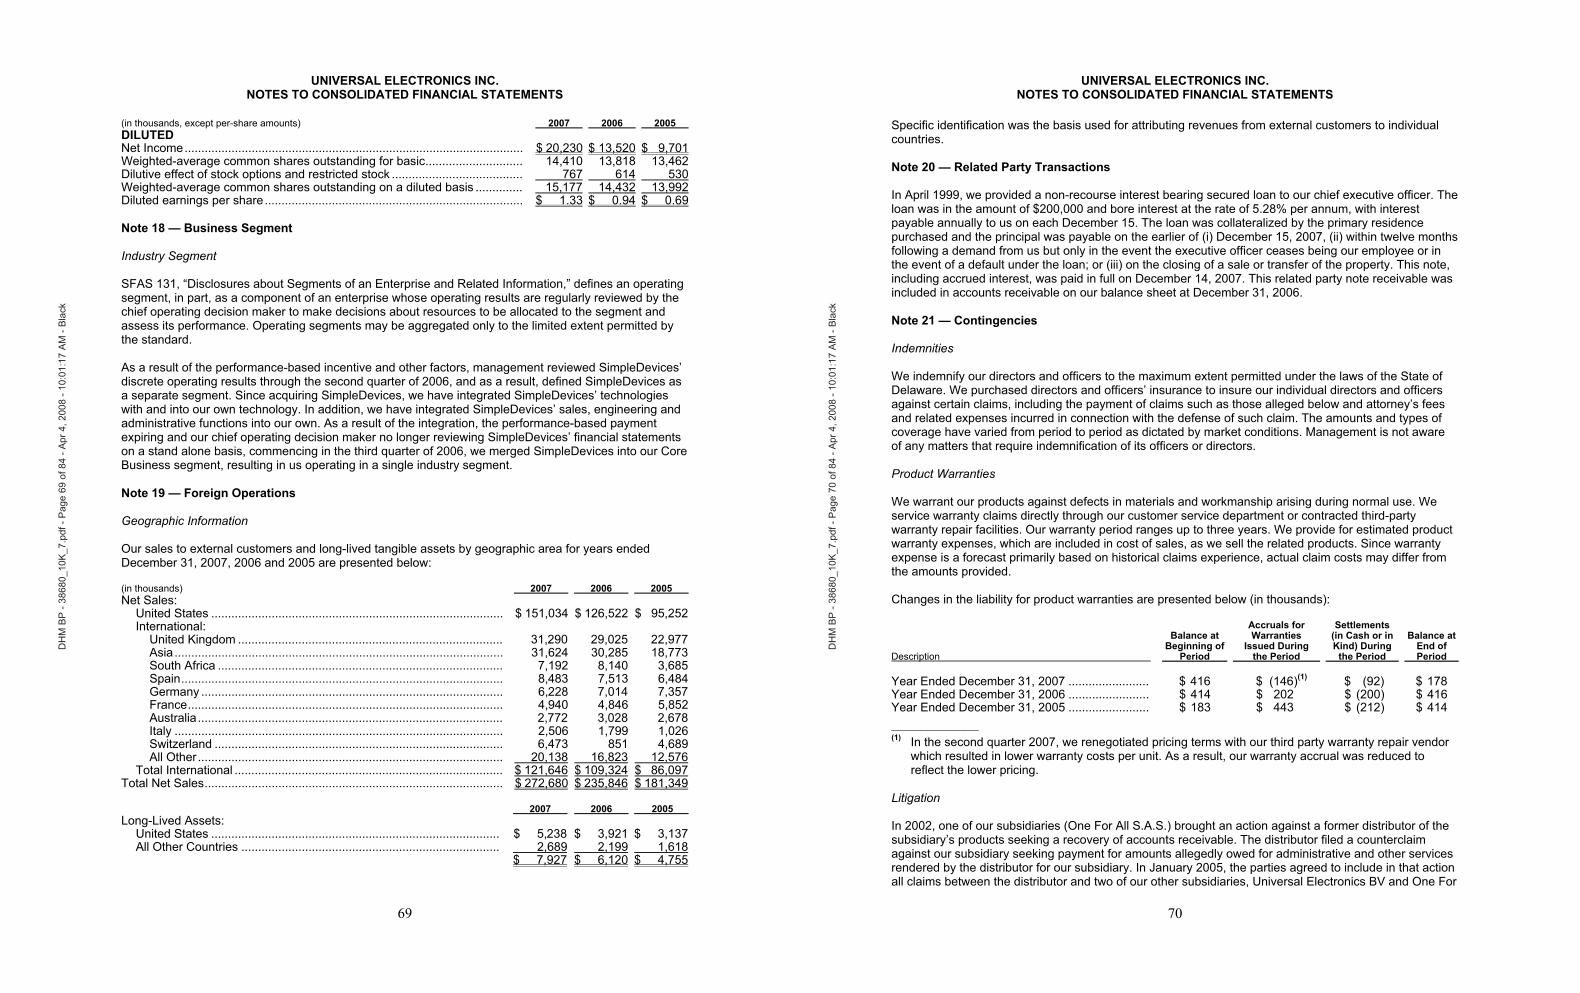
UNIVERSAL ELECTRONICS INC.NOTES TO CONSOLIDATED FINANCIAL STATEMENTS
(in thousands, except per-share amounts) 2007 2006 2005 DILUTEDNet Income..................................................................................................... $ 20,230 $ 13,520 $ 9,701Weighted-average common shares outstanding for basic............................. 14,410 13,818 13,462Dilutive effect of stock options and restricted stock ....................................... 767 614 530Weighted-average common shares outstanding on a diluted basis .............. 15,177 14,432 13,992Diluted earnings per share............................................................................. $ 1.33 $ 0.94 $ 0.69
Note 18 — Business Segment
Industry Segment
SFAS 131, “Disclosures about Segments of an Enterprise and Related Information,” defines an operating segment, in part, as a component of an enterprise whose operating results are regularly reviewed by the chief operating decision maker to make decisions about resources to be allocated to the segment and assess its performance. Operating segments may be aggregated only to the limited extent permitted by the standard.
As a result of the performance-based incentive and other factors, management reviewed SimpleDevices’ discrete operating results through the second quarter of 2006, and as a result, defined SimpleDevices as a separate segment. Since acquiring SimpleDevices, we have integrated SimpleDevices’ technologies with and into our own technology. In addition, we have integrated SimpleDevices’ sales, engineering and administrative functions into our own. As a result of the integration, the performance-based payment expiring and our chief operating decision maker no longer reviewing SimpleDevices’ financial statements on a stand alone basis, commencing in the third quarter of 2006, we merged SimpleDevices into our Core Business segment, resulting in us operating in a single industry segment.
Note 19 — Foreign Operations
Geographic Information
Our sales to external customers and long-lived tangible assets by geographic area for years ended December 31, 2007, 2006 and 2005 are presented below:
(in thousands) 2007 2006 2005 Net Sales:
United States ....................................................................................... $ 151,034 $ 126,522 $ 95,252International:
United Kingdom ............................................................................... 31,290 29,025 22,977Asia .................................................................................................. 31,624 30,285 18,773South Africa ..................................................................................... 7,192 8,140 3,685Spain................................................................................................ 8,483 7,513 6,484Germany .......................................................................................... 6,228 7,014 7,357France.............................................................................................. 4,940 4,846 5,852Australia........................................................................................... 2,772 3,028 2,678Italy .................................................................................................. 2,506 1,799 1,026Switzerland ...................................................................................... 6,473 851 4,689All Other........................................................................................... 20,138 16,823 12,576
Total International ................................................................................ $ 121,646 $ 109,324 $ 86,097Total Net Sales......................................................................................... $ 272,680 $ 235,846 $ 181,349
2007 2006 2005 Long-Lived Assets:
United States ...................................................................................... $ 5,238 $ 3,921 $ 3,137All Other Countries ............................................................................. 2,689 2,199 1,618
$ 7,927 $ 6,120 $ 4,755
69
DH
M B
P -
3868
0_10
K_7
- P
age
69 o
f 84
- Apr
4, 2
008
- 10:
01:1
7 A
M -
Bla
ck
UNIVERSAL ELECTRONICS INC.NOTES TO CONSOLIDATED FINANCIAL STATEMENTS
Specific identification was the basis used for attributing revenues from external customers to individual countries.
Note 20 — Related Party Transactions
In April 1999, we provided a non-recourse interest bearing secured loan to our chief executive officer. The loan was in the amount of $200,000 and bore interest at the rate of 5.28% per annum, with interest payable annually to us on each December 15. The loan was collateralized by the primary residence purchased and the principal was payable on the earlier of (i) December 15, 2007, (ii) within twelve months following a demand from us but only in the event the executive officer ceases being our employee or in the event of a default under the loan; or (iii) on the closing of a sale or transfer of the property. This note, including accrued interest, was paid in full on December 14, 2007. This related party note receivable was included in accounts receivable on our balance sheet at December 31, 2006.
Note 21 — Contingencies
Indemnities
We indemnify our directors and officers to the maximum extent permitted under the laws of the State of Delaware. We purchased directors and officers’ insurance to insure our individual directors and officers against certain claims, including the payment of claims such as those alleged below and attorney’s fees and related expenses incurred in connection with the defense of such claim. The amounts and types of coverage have varied from period to period as dictated by market conditions. Management is not aware of any matters that require indemnification of its officers or directors.
Product Warranties
We warrant our products against defects in materials and workmanship arising during normal use. We service warranty claims directly through our customer service department or contracted third-party warranty repair facilities. Our warranty period ranges up to three years. We provide for estimated product warranty expenses, which are included in cost of sales, as we sell the related products. Since warranty expense is a forecast primarily based on historical claims experience, actual claim costs may differ from the amounts provided.
Changes in the liability for product warranties are presented below (in thousands):
Description
Balance at Beginning of Period
Accruals for Warranties Issued During the Period
Settlements (in Cash or in Kind) During the Period
Balance at End of Period
Year Ended December 31, 2007 ........................ $ 416 $ (146)(1) $ (92) $ 178 Year Ended December 31, 2006 ........................ $ 414 $ 202 $ (200) $ 416 Year Ended December 31, 2005 ........................ $ 183 $ 443 $ (212) $ 414 ____________(1) In the second quarter 2007, we renegotiated pricing terms with our third party warranty repair vendor
which resulted in lower warranty costs per unit. As a result, our warranty accrual was reduced to reflect the lower pricing.
Litigation
In 2002, one of our subsidiaries (One For All S.A.S.) brought an action against a former distributor of the subsidiary’s products seeking a recovery of accounts receivable. The distributor filed a counterclaim against our subsidiary seeking payment for amounts allegedly owed for administrative and other services rendered by the distributor for our subsidiary. In January 2005, the parties agreed to include in that action all claims between the distributor and two of our other subsidiaries, Universal Electronics BV and One For
70
DH
M B
P -
3868
0_10
K_7
- P
age
70 o
f 84
- Apr
4, 2
008
- 10:
01:1
7 A
M -
Bla
ck
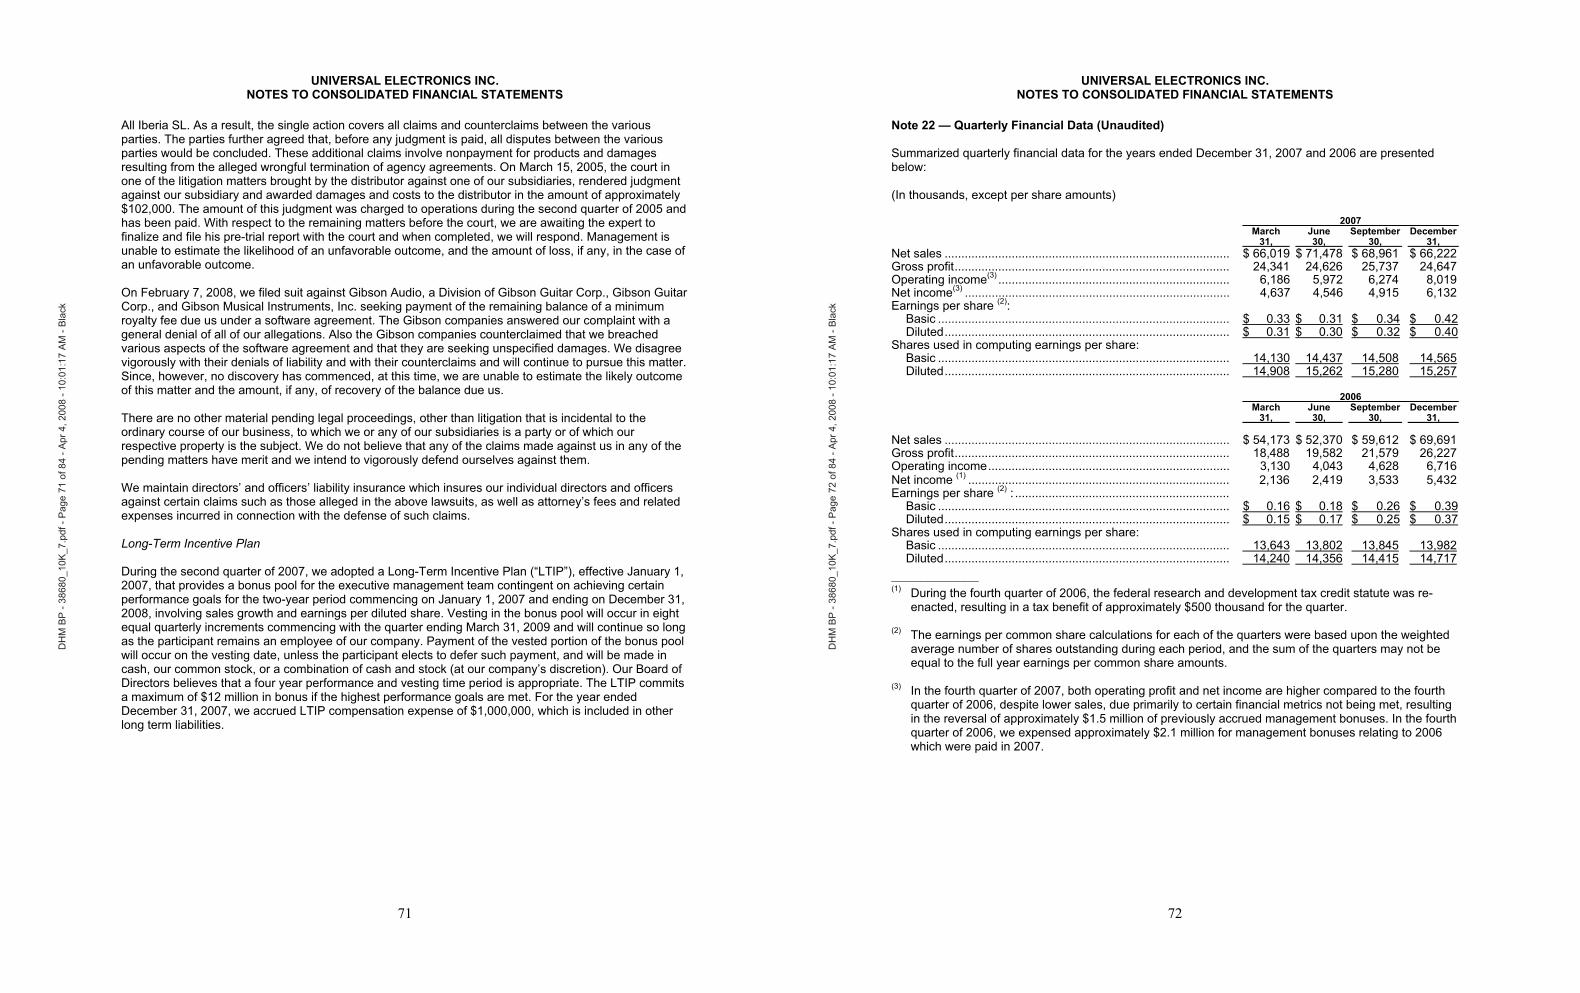
UNIVERSAL ELECTRONICS INC.NOTES TO CONSOLIDATED FINANCIAL STATEMENTS
All Iberia SL. As a result, the single action covers all claims and counterclaims between the various parties. The parties further agreed that, before any judgment is paid, all disputes between the various parties would be concluded. These additional claims involve nonpayment for products and damages resulting from the alleged wrongful termination of agency agreements. On March 15, 2005, the court in one of the litigation matters brought by the distributor against one of our subsidiaries, rendered judgment against our subsidiary and awarded damages and costs to the distributor in the amount of approximately $102,000. The amount of this judgment was charged to operations during the second quarter of 2005 and has been paid. With respect to the remaining matters before the court, we are awaiting the expert to finalize and file his pre-trial report with the court and when completed, we will respond. Management is unable to estimate the likelihood of an unfavorable outcome, and the amount of loss, if any, in the case of an unfavorable outcome.
On February 7, 2008, we filed suit against Gibson Audio, a Division of Gibson Guitar Corp., Gibson Guitar Corp., and Gibson Musical Instruments, Inc. seeking payment of the remaining balance of a minimum royalty fee due us under a software agreement. The Gibson companies answered our complaint with a general denial of all of our allegations. Also the Gibson companies counterclaimed that we breached various aspects of the software agreement and that they are seeking unspecified damages. We disagree vigorously with their denials of liability and with their counterclaims and will continue to pursue this matter. Since, however, no discovery has commenced, at this time, we are unable to estimate the likely outcome of this matter and the amount, if any, of recovery of the balance due us.
There are no other material pending legal proceedings, other than litigation that is incidental to the ordinary course of our business, to which we or any of our subsidiaries is a party or of which our respective property is the subject. We do not believe that any of the claims made against us in any of the pending matters have merit and we intend to vigorously defend ourselves against them.
We maintain directors’ and officers’ liability insurance which insures our individual directors and officers against certain claims such as those alleged in the above lawsuits, as well as attorney’s fees and related expenses incurred in connection with the defense of such claims.
Long-Term Incentive Plan
During the second quarter of 2007, we adopted a Long-Term Incentive Plan (“LTIP”), effective January 1, 2007, that provides a bonus pool for the executive management team contingent on achieving certain performance goals for the two-year period commencing on January 1, 2007 and ending on December 31, 2008, involving sales growth and earnings per diluted share. Vesting in the bonus pool will occur in eight equal quarterly increments commencing with the quarter ending March 31, 2009 and will continue so long as the participant remains an employee of our company. Payment of the vested portion of the bonus pool will occur on the vesting date, unless the participant elects to defer such payment, and will be made in cash, our common stock, or a combination of cash and stock (at our company’s discretion). Our Board of Directors believes that a four year performance and vesting time period is appropriate. The LTIP commits a maximum of $12 million in bonus if the highest performance goals are met. For the year ended December 31, 2007, we accrued LTIP compensation expense of $1,000,000, which is included in other long term liabilities.
71
DH
M B
P -
3868
0_10
K_7
- P
age
71 o
f 84
- Apr
4, 2
008
- 10:
01:1
7 A
M -
Bla
ck
UNIVERSAL ELECTRONICS INC.NOTES TO CONSOLIDATED FINANCIAL STATEMENTS
72
Note 22 — Quarterly Financial Data (Unaudited)
Summarized quarterly financial data for the years ended December 31, 2007 and 2006 are presented below:
(In thousands, except per share amounts)
2007 March 31,
June 30,
September 30,
December 31,
Net sales ..................................................................................... $ 66,019 $ 71,478 $ 68,961 $ 66,222Gross profit.................................................................................. 24,341 24,626 25,737 24,647Operating income(3) ..................................................................... 6,186 5,972 6,274 8,019Net income(3) ............................................................................... 4,637 4,546 4,915 6,132Earnings per share (2):
Basic ....................................................................................... $ 0.33 $ 0.31 $ 0.34 $ 0.42Diluted..................................................................................... $ 0.31 $ 0.30 $ 0.32 $ 0.40
Shares used in computing earnings per share: Basic ....................................................................................... 14,130 14,437 14,508 14,565Diluted..................................................................................... 14,908 15,262 15,280 15,257
2006 March 31,
June 30,
September 30,
December 31,
Net sales ..................................................................................... $ 54,173 $ 52,370 $ 59,612 $ 69,691Gross profit.................................................................................. 18,488 19,582 21,579 26,227Operating income........................................................................ 3,130 4,043 4,628 6,716Net income (1) .............................................................................. 2,136 2,419 3,533 5,432Earnings per share (2) : ................................................................
Basic ....................................................................................... $ 0.16 $ 0.18 $ 0.26 $ 0.39Diluted..................................................................................... $ 0.15 $ 0.17 $ 0.25 $ 0.37
Shares used in computing earnings per share: Basic ....................................................................................... 13,643 13,802 13,845 13,982Diluted..................................................................................... 14,240 14,356 14,415 14,717
____________(1) During the fourth quarter of 2006, the federal research and development tax credit statute was re-
enacted, resulting in a tax benefit of approximately $500 thousand for the quarter.
(2) The earnings per common share calculations for each of the quarters were based upon the weighted average number of shares outstanding during each period, and the sum of the quarters may not be equal to the full year earnings per common share amounts.
(3) In the fourth quarter of 2007, both operating profit and net income are higher compared to the fourth quarter of 2006, despite lower sales, due primarily to certain financial metrics not being met, resulting in the reversal of approximately $1.5 million of previously accrued management bonuses. In the fourth quarter of 2006, we expensed approximately $2.1 million for management bonuses relating to 2006 which were paid in 2007.
DH
M B
P -
3868
0_10
K_7
- P
age
72 o
f 84
- Apr
4, 2
008
- 10:
01:1
7 A
M -
Bla
ck
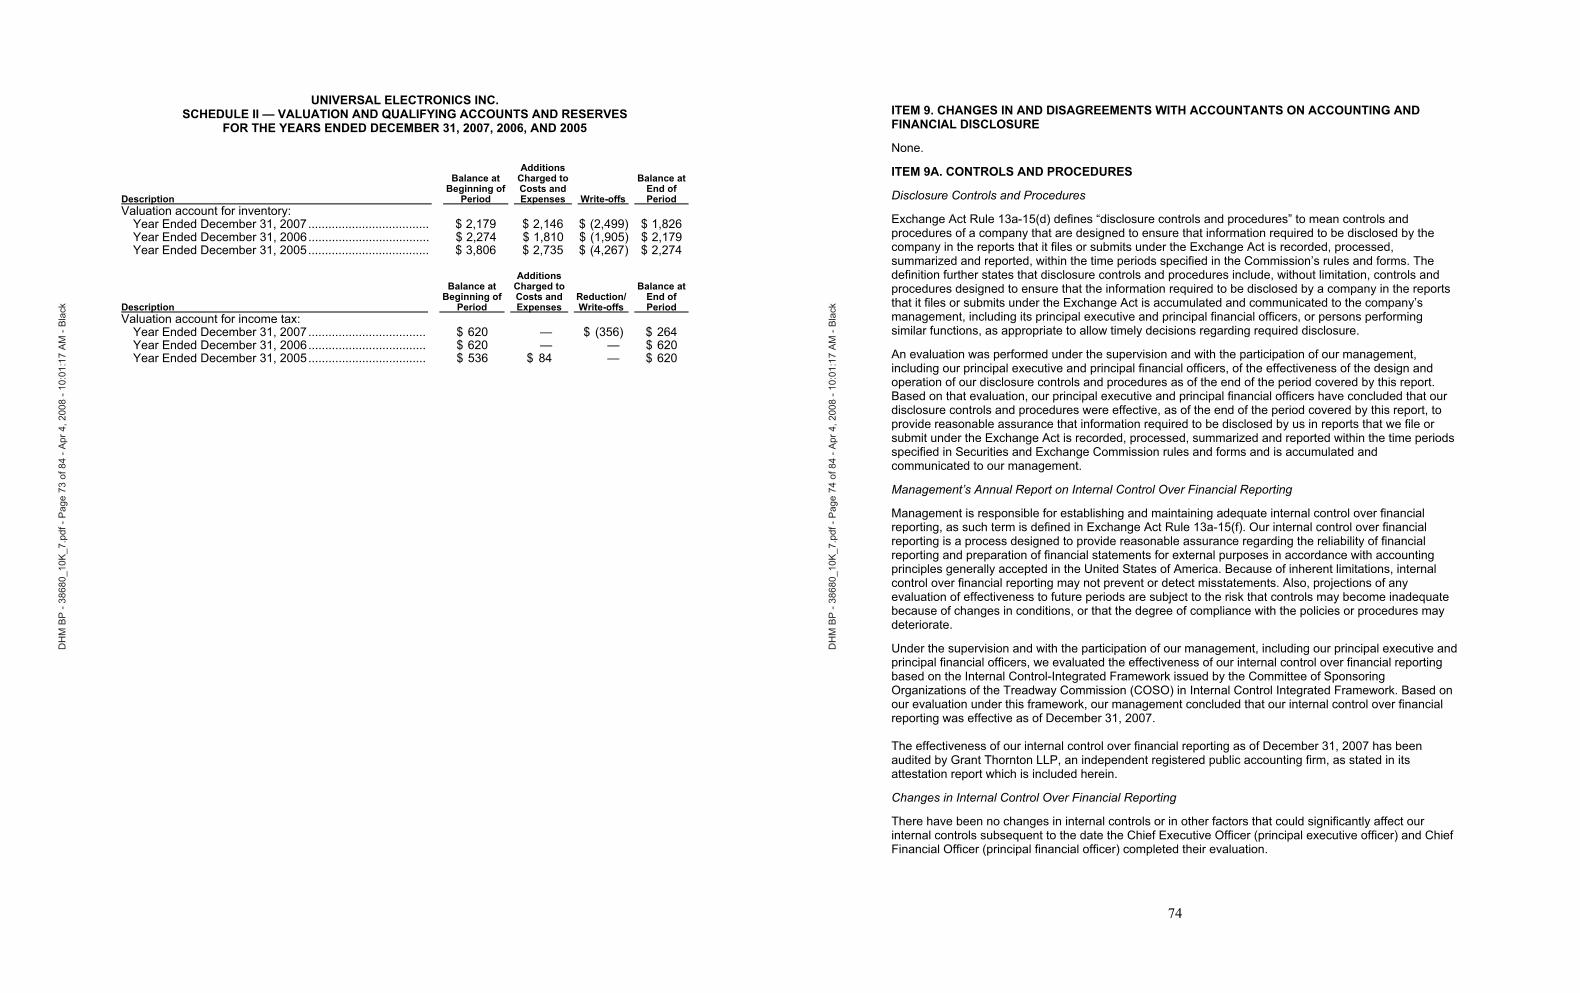
UNIVERSAL ELECTRONICS INC. SCHEDULE II — VALUATION AND QUALIFYING ACCOUNTS AND RESERVES
FOR THE YEARS ENDED DECEMBER 31, 2007, 2006, AND 2005
Description
Balance at Beginning of Period
Additions Charged to Costs and Expenses Write-offs
Balance at End of Period
Valuation account for inventory: Year Ended December 31, 2007.................................... $ 2,179 $ 2,146 $ (2,499) $ 1,826 Year Ended December 31, 2006.................................... $ 2,274 $ 1,810 $ (1,905) $ 2,179 Year Ended December 31, 2005.................................... $ 3,806 $ 2,735 $ (4,267) $ 2,274
Description
Balance at Beginning of Period
Additions Charged to Costs and Expenses
Reduction/ Write-offs
Balance at End of Period
Valuation account for income tax: Year Ended December 31, 2007................................... $ 620 — $ (356) $ 264 Year Ended December 31, 2006................................... $ 620 — — $ 620 Year Ended December 31, 2005................................... $ 536 $ 84 — $ 620
DH
M B
P -
3868
0_10
K_7
- P
age
73 o
f 84
- Apr
4, 2
008
- 10:
01:1
7 A
M -
Bla
ck
ITEM 9. CHANGES IN AND DISAGREEMENTS WITH ACCOUNTANTS ON ACCOUNTING ANDFINANCIAL DISCLOSURE
None.
ITEM 9A. CONTROLS AND PROCEDURES
Disclosure Controls and Procedures
Exchange Act Rule 13a-15(d) defines “disclosure controls and procedures” to mean controls and procedures of a company that are designed to ensure that information required to be disclosed by the company in the reports that it files or submits under the Exchange Act is recorded, processed, summarized and reported, within the time periods specified in the Commission’s rules and forms. The definition further states that disclosure controls and procedures include, without limitation, controls and procedures designed to ensure that the information required to be disclosed by a company in the reports that it files or submits under the Exchange Act is accumulated and communicated to the company’s management, including its principal executive and principal financial officers, or persons performing similar functions, as appropriate to allow timely decisions regarding required disclosure.
An evaluation was performed under the supervision and with the participation of our management, including our principal executive and principal financial officers, of the effectiveness of the design and operation of our disclosure controls and procedures as of the end of the period covered by this report. Based on that evaluation, our principal executive and principal financial officers have concluded that our disclosure controls and procedures were effective, as of the end of the period covered by this report, to provide reasonable assurance that information required to be disclosed by us in reports that we file or submit under the Exchange Act is recorded, processed, summarized and reported within the time periods specified in Securities and Exchange Commission rules and forms and is accumulated and communicated to our management.
Management’s Annual Report on Internal Control Over Financial Reporting
Management is responsible for establishing and maintaining adequate internal control over financial reporting, as such term is defined in Exchange Act Rule 13a-15(f). Our internal control over financial reporting is a process designed to provide reasonable assurance regarding the reliability of financial reporting and preparation of financial statements for external purposes in accordance with accounting principles generally accepted in the United States of America. Because of inherent limitations, internal control over financial reporting may not prevent or detect misstatements. Also, projections of any evaluation of effectiveness to future periods are subject to the risk that controls may become inadequate because of changes in conditions, or that the degree of compliance with the policies or procedures may deteriorate.
Under the supervision and with the participation of our management, including our principal executive and principal financial officers, we evaluated the effectiveness of our internal control over financial reporting based on the Internal Control-Integrated Framework issued by the Committee of Sponsoring Organizations of the Treadway Commission (COSO) in Internal Control Integrated Framework. Based on our evaluation under this framework, our management concluded that our internal control over financial reporting was effective as of December 31, 2007.
The effectiveness of our internal control over financial reporting as of December 31, 2007 has been audited by Grant Thornton LLP, an independent registered public accounting firm, as stated in its attestation report which is included herein.
Changes in Internal Control Over Financial Reporting
There have been no changes in internal controls or in other factors that could significantly affect our internal controls subsequent to the date the Chief Executive Officer (principal executive officer) and Chief Financial Officer (principal financial officer) completed their evaluation.
74
DH
M B
P -
3868
0_10
K_7
- P
age
74 o
f 84
- Apr
4, 2
008
- 10:
01:1
7 A
M -
Bla
ck
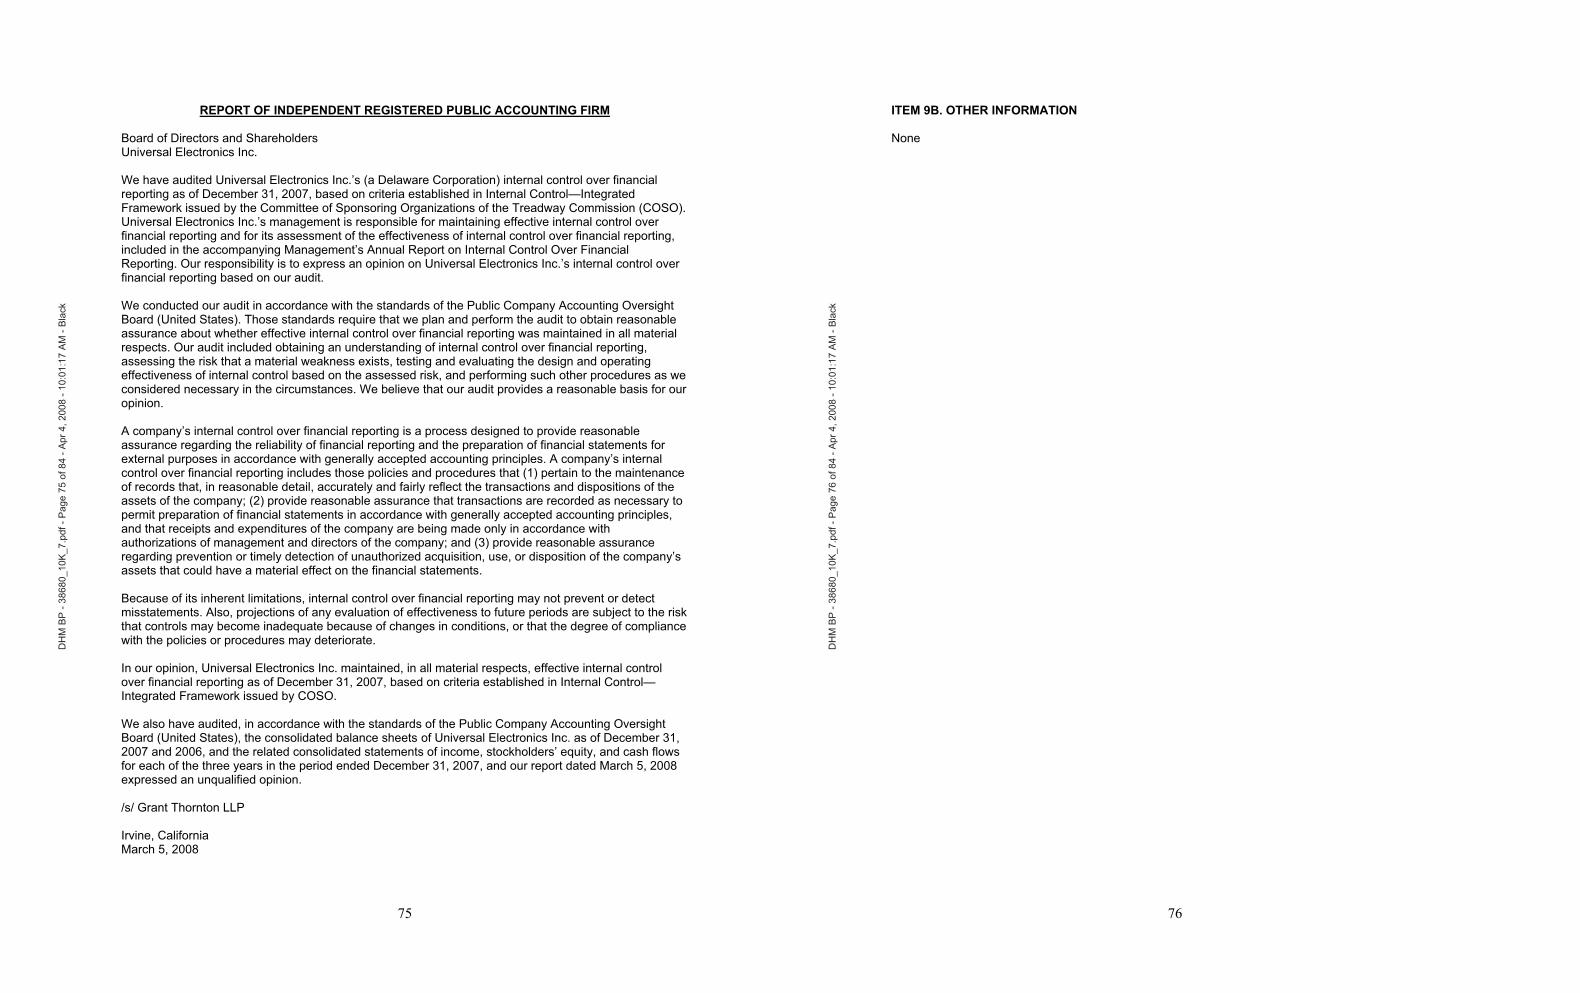
REPORT OF INDEPENDENT REGISTERED PUBLIC ACCOUNTING FIRM
Board of Directors and Shareholders Universal Electronics Inc.
We have audited Universal Electronics Inc.’s (a Delaware Corporation) internal control over financial reporting as of December 31, 2007, based on criteria established in Internal Control—Integrated Framework issued by the Committee of Sponsoring Organizations of the Treadway Commission (COSO). Universal Electronics Inc.’s management is responsible for maintaining effective internal control over financial reporting and for its assessment of the effectiveness of internal control over financial reporting, included in the accompanying Management’s Annual Report on Internal Control Over Financial Reporting. Our responsibility is to express an opinion on Universal Electronics Inc.’s internal control over financial reporting based on our audit.
We conducted our audit in accordance with the standards of the Public Company Accounting Oversight Board (United States). Those standards require that we plan and perform the audit to obtain reasonable assurance about whether effective internal control over financial reporting was maintained in all material respects. Our audit included obtaining an understanding of internal control over financial reporting, assessing the risk that a material weakness exists, testing and evaluating the design and operating effectiveness of internal control based on the assessed risk, and performing such other procedures as we considered necessary in the circumstances. We believe that our audit provides a reasonable basis for our opinion.
A company’s internal control over financial reporting is a process designed to provide reasonable assurance regarding the reliability of financial reporting and the preparation of financial statements for external purposes in accordance with generally accepted accounting principles. A company’s internal control over financial reporting includes those policies and procedures that (1) pertain to the maintenance of records that, in reasonable detail, accurately and fairly reflect the transactions and dispositions of the assets of the company; (2) provide reasonable assurance that transactions are recorded as necessary to permit preparation of financial statements in accordance with generally accepted accounting principles, and that receipts and expenditures of the company are being made only in accordance with authorizations of management and directors of the company; and (3) provide reasonable assurance regarding prevention or timely detection of unauthorized acquisition, use, or disposition of the company’s assets that could have a material effect on the financial statements.
Because of its inherent limitations, internal control over financial reporting may not prevent or detect misstatements. Also, projections of any evaluation of effectiveness to future periods are subject to the risk that controls may become inadequate because of changes in conditions, or that the degree of compliance with the policies or procedures may deteriorate.
In our opinion, Universal Electronics Inc. maintained, in all material respects, effective internal control over financial reporting as of December 31, 2007, based on criteria established in Internal Control—Integrated Framework issued by COSO.
We also have audited, in accordance with the standards of the Public Company Accounting Oversight Board (United States), the consolidated balance sheets of Universal Electronics Inc. as of December 31, 2007 and 2006, and the related consolidated statements of income, stockholders’ equity, and cash flows for each of the three years in the period ended December 31, 2007, and our report dated March 5, 2008 expressed an unqualified opinion.
/s/ Grant Thornton LLP
Irvine, California March 5, 2008
75
DH
M B
P -
3868
0_10
K_7
- P
age
75 o
f 84
- Apr
4, 2
008
- 10:
01:1
7 A
M -
Bla
ck
ITEM 9B. OTHER INFORMATION
None
76
DH
M B
P -
3868
0_10
K_7
- P
age
76 o
f 84
- Apr
4, 2
008
- 10:
01:1
7 A
M -
Bla
ck
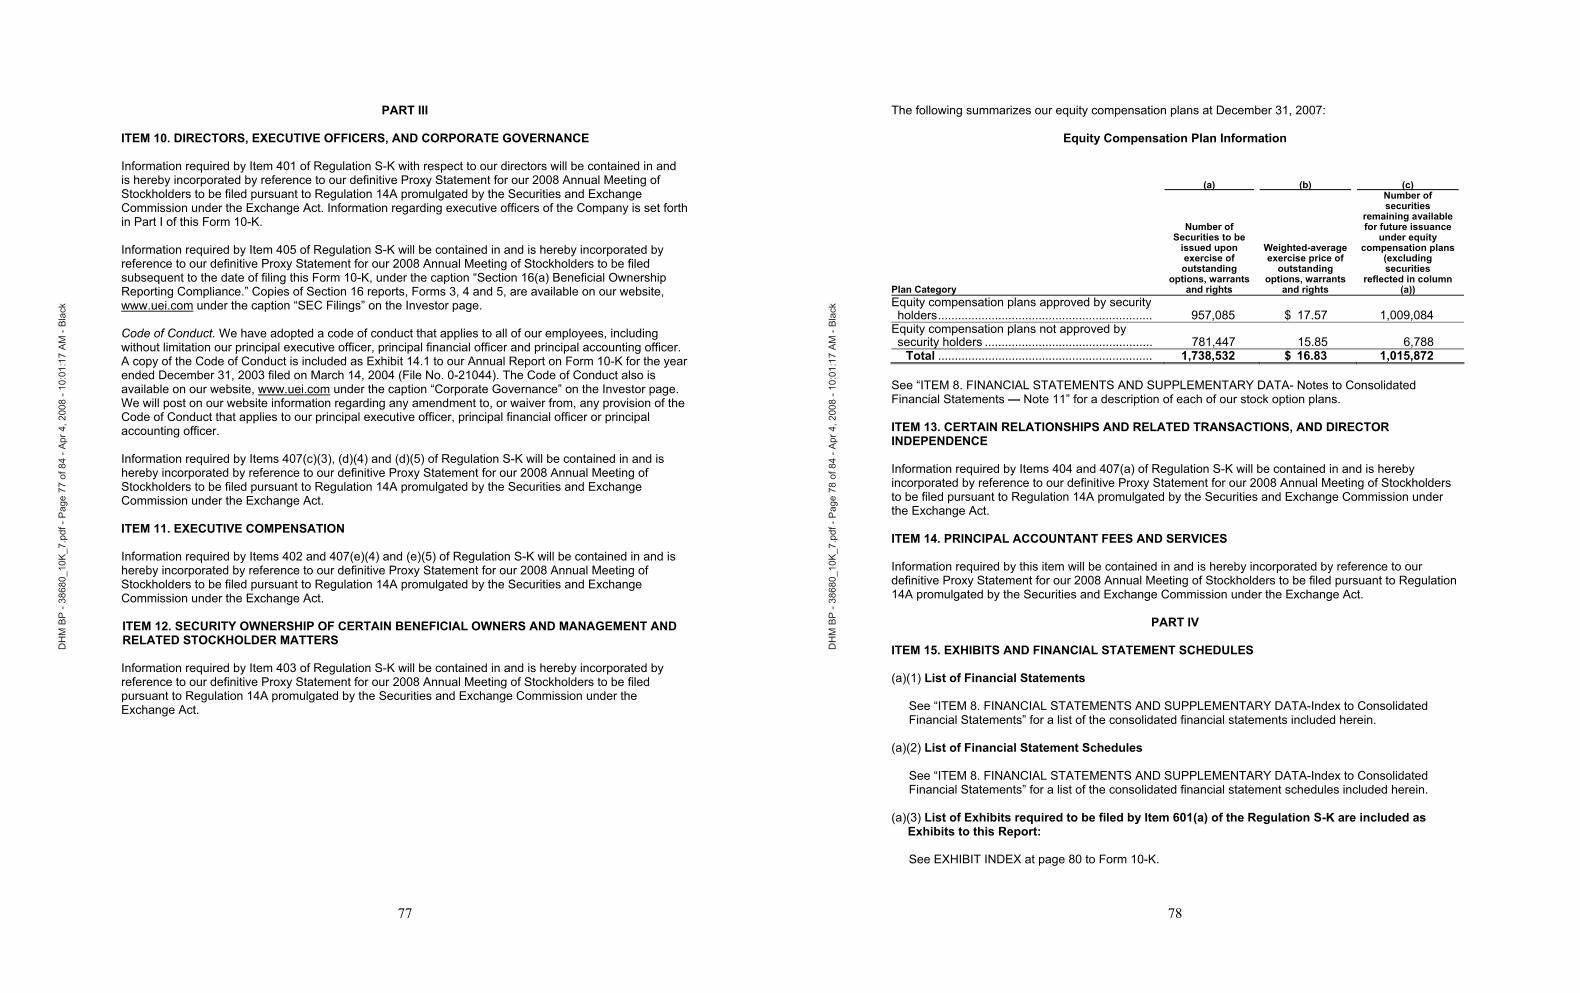
PART III
ITEM 10. DIRECTORS, EXECUTIVE OFFICERS, AND CORPORATE GOVERNANCE
Information required by Item 401 of Regulation S-K with respect to our directors will be contained in and is hereby incorporated by reference to our definitive Proxy Statement for our 2008 Annual Meeting of Stockholders to be filed pursuant to Regulation 14A promulgated by the Securities and Exchange Commission under the Exchange Act. Information regarding executive officers of the Company is set forth in Part I of this Form 10-K.
Information required by Item 405 of Regulation S-K will be contained in and is hereby incorporated by reference to our definitive Proxy Statement for our 2008 Annual Meeting of Stockholders to be filed subsequent to the date of filing this Form 10-K, under the caption “Section 16(a) Beneficial Ownership Reporting Compliance.” Copies of Section 16 reports, Forms 3, 4 and 5, are available on our website, www.uei.com under the caption “SEC Filings” on the Investor page.
Code of Conduct. We have adopted a code of conduct that applies to all of our employees, including without limitation our principal executive officer, principal financial officer and principal accounting officer. A copy of the Code of Conduct is included as Exhibit 14.1 to our Annual Report on Form 10-K for the year ended December 31, 2003 filed on March 14, 2004 (File No. 0-21044). The Code of Conduct also is available on our website, www.uei.com under the caption “Corporate Governance” on the Investor page. We will post on our website information regarding any amendment to, or waiver from, any provision of the Code of Conduct that applies to our principal executive officer, principal financial officer or principal accounting officer.
Information required by Items 407(c)(3), (d)(4) and (d)(5) of Regulation S-K will be contained in and is hereby incorporated by reference to our definitive Proxy Statement for our 2008 Annual Meeting of Stockholders to be filed pursuant to Regulation 14A promulgated by the Securities and Exchange Commission under the Exchange Act.
ITEM 11. EXECUTIVE COMPENSATION
Information required by Items 402 and 407(e)(4) and (e)(5) of Regulation S-K will be contained in and is hereby incorporated by reference to our definitive Proxy Statement for our 2008 Annual Meeting of Stockholders to be filed pursuant to Regulation 14A promulgated by the Securities and Exchange Commission under the Exchange Act.
ITEM 12. SECURITY OWNERSHIP OF CERTAIN BENEFICIAL OWNERS AND MANAGEMENT ANDRELATED STOCKHOLDER MATTERS
Information required by Item 403 of Regulation S-K will be contained in and is hereby incorporated by reference to our definitive Proxy Statement for our 2008 Annual Meeting of Stockholders to be filed pursuant to Regulation 14A promulgated by the Securities and Exchange Commission under the Exchange Act.
77
DH
M B
P -
3868
0_10
K_7
- P
age
77 o
f 84
- Apr
4, 2
008
- 10:
01:1
7 A
M -
Bla
ck
The following summarizes our equity compensation plans at December 31, 2007:
Equity Compensation Plan Information
(a) (b) (c)
Plan Category
Number of Securities to be issued upon exercise of outstanding options, warrants and rights
Weighted-average exercise price of outstanding options, warrants and rights
Number of securities remaining available for future issuance under equity compensation plans (excluding securities reflected in column (a))
Equity compensation plans approved by security holders................................................................ 957,085 $ 17.57 1,009,084
Equity compensation plans not approved by security holders .................................................. 781,447 15.85 6,788
Total ................................................................ 1,738,532 $ 16.83 1,015,872
See “ITEM 8. FINANCIAL STATEMENTS AND SUPPLEMENTARY DATA- Notes to Consolidated Financial Statements — Note 11” for a description of each of our stock option plans.
ITEM 13. CERTAIN RELATIONSHIPS AND RELATED TRANSACTIONS, AND DIRECTORINDEPENDENCE
Information required by Items 404 and 407(a) of Regulation S-K will be contained in and is hereby incorporated by reference to our definitive Proxy Statement for our 2008 Annual Meeting of Stockholders to be filed pursuant to Regulation 14A promulgated by the Securities and Exchange Commission under the Exchange Act.
ITEM 14. PRINCIPAL ACCOUNTANT FEES AND SERVICES
Information required by this item will be contained in and is hereby incorporated by reference to our definitive Proxy Statement for our 2008 Annual Meeting of Stockholders to be filed pursuant to Regulation 14A promulgated by the Securities and Exchange Commission under the Exchange Act.
PART IV
ITEM 15. EXHIBITS AND FINANCIAL STATEMENT SCHEDULES
(a)(1) List of Financial Statements
See “ITEM 8. FINANCIAL STATEMENTS AND SUPPLEMENTARY DATA-Index to Consolidated Financial Statements” for a list of the consolidated financial statements included herein.
(a)(2) List of Financial Statement Schedules
See “ITEM 8. FINANCIAL STATEMENTS AND SUPPLEMENTARY DATA-Index to Consolidated Financial Statements” for a list of the consolidated financial statement schedules included herein.
(a)(3) List of Exhibits required to be filed by Item 601(a) of the Regulation S-K are included as Exhibits to this Report:
See EXHIBIT INDEX at page 80 to Form 10-K.
78
DH
M B
P -
3868
0_10
K_7
- P
age
78 o
f 84
- Apr
4, 2
008
- 10:
01:1
7 A
M -
Bla
ck
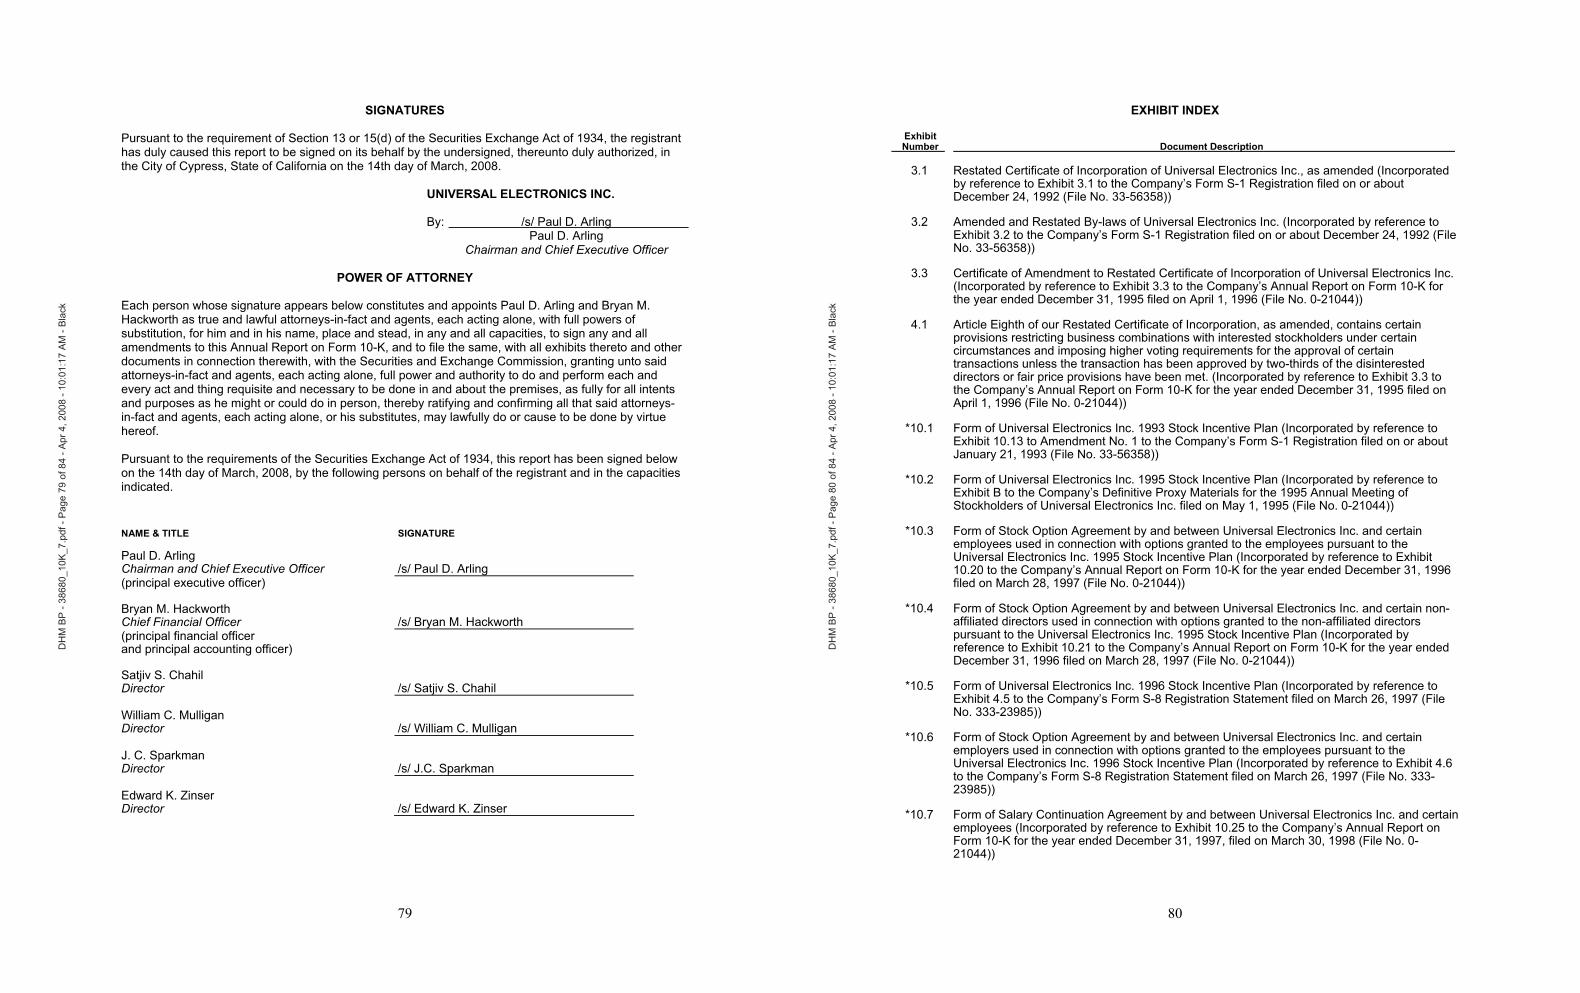
SIGNATURES
Pursuant to the requirement of Section 13 or 15(d) of the Securities Exchange Act of 1934, the registrant has duly caused this report to be signed on its behalf by the undersigned, thereunto duly authorized, in the City of Cypress, State of California on the 14th day of March, 2008.
UNIVERSAL ELECTRONICS INC.
By: /s/ Paul D. Arling Paul D. Arling Chairman and Chief Executive Officer
POWER OF ATTORNEY
Each person whose signature appears below constitutes and appoints Paul D. Arling and Bryan M. Hackworth as true and lawful attorneys-in-fact and agents, each acting alone, with full powers of substitution, for him and in his name, place and stead, in any and all capacities, to sign any and all amendments to this Annual Report on Form 10-K, and to file the same, with all exhibits thereto and other documents in connection therewith, with the Securities and Exchange Commission, granting unto said attorneys-in-fact and agents, each acting alone, full power and authority to do and perform each and every act and thing requisite and necessary to be done in and about the premises, as fully for all intents and purposes as he might or could do in person, thereby ratifying and confirming all that said attorneys-in-fact and agents, each acting alone, or his substitutes, may lawfully do or cause to be done by virtue hereof.
Pursuant to the requirements of the Securities Exchange Act of 1934, this report has been signed below on the 14th day of March, 2008, by the following persons on behalf of the registrant and in the capacities indicated.
NAME & TITLE SIGNATURE
Paul D. Arling Chairman and Chief Executive Officer /s/ Paul D. Arling (principal executive officer)
Bryan M. Hackworth Chief Financial Officer /s/ Bryan M. Hackworth (principal financial officer and principal accounting officer)
Satjiv S. ChahilDirector /s/ Satjiv S. Chahil
William C. Mulligan Director /s/ William C. Mulligan
J. C. Sparkman Director /s/ J.C. Sparkman
Edward K. Zinser Director /s/ Edward K. Zinser
79
DH
M B
P -
3868
0_10
K_7
- P
age
79 o
f 84
- Apr
4, 2
008
- 10:
01:1
7 A
M -
Bla
ck
EXHIBIT INDEX
Exhibit Number Document Description
3.1 Restated Certificate of Incorporation of Universal Electronics Inc., as amended (Incorporated by reference to Exhibit 3.1 to the Company’s Form S-1 Registration filed on or about December 24, 1992 (File No. 33-56358))
3.2 Amended and Restated By-laws of Universal Electronics Inc. (Incorporated by reference to Exhibit 3.2 to the Company’s Form S-1 Registration filed on or about December 24, 1992 (File No. 33-56358))
3.3 Certificate of Amendment to Restated Certificate of Incorporation of Universal Electronics Inc. (Incorporated by reference to Exhibit 3.3 to the Company’s Annual Report on Form 10-K for the year ended December 31, 1995 filed on April 1, 1996 (File No. 0-21044))
4.1 Article Eighth of our Restated Certificate of Incorporation, as amended, contains certain provisions restricting business combinations with interested stockholders under certain circumstances and imposing higher voting requirements for the approval of certain transactions unless the transaction has been approved by two-thirds of the disinterested directors or fair price provisions have been met. (Incorporated by reference to Exhibit 3.3 to the Company’s Annual Report on Form 10-K for the year ended December 31, 1995 filed on April 1, 1996 (File No. 0-21044))
*10.1 Form of Universal Electronics Inc. 1993 Stock Incentive Plan (Incorporated by reference to Exhibit 10.13 to Amendment No. 1 to the Company’s Form S-1 Registration filed on or about January 21, 1993 (File No. 33-56358))
*10.2 Form of Universal Electronics Inc. 1995 Stock Incentive Plan (Incorporated by reference to Exhibit B to the Company’s Definitive Proxy Materials for the 1995 Annual Meeting of Stockholders of Universal Electronics Inc. filed on May 1, 1995 (File No. 0-21044))
*10.3 Form of Stock Option Agreement by and between Universal Electronics Inc. and certain employees used in connection with options granted to the employees pursuant to the Universal Electronics Inc. 1995 Stock Incentive Plan (Incorporated by reference to Exhibit 10.20 to the Company’s Annual Report on Form 10-K for the year ended December 31, 1996 filed on March 28, 1997 (File No. 0-21044))
*10.4 Form of Stock Option Agreement by and between Universal Electronics Inc. and certain non-affiliated directors used in connection with options granted to the non-affiliated directors pursuant to the Universal Electronics Inc. 1995 Stock Incentive Plan (Incorporated by reference to Exhibit 10.21 to the Company’s Annual Report on Form 10-K for the year ended December 31, 1996 filed on March 28, 1997 (File No. 0-21044))
*10.5 Form of Universal Electronics Inc. 1996 Stock Incentive Plan (Incorporated by reference to Exhibit 4.5 to the Company’s Form S-8 Registration Statement filed on March 26, 1997 (File No. 333-23985))
*10.6 Form of Stock Option Agreement by and between Universal Electronics Inc. and certain employers used in connection with options granted to the employees pursuant to the Universal Electronics Inc. 1996 Stock Incentive Plan (Incorporated by reference to Exhibit 4.6 to the Company’s Form S-8 Registration Statement filed on March 26, 1997 (File No. 333-23985))
*10.7 Form of Salary Continuation Agreement by and between Universal Electronics Inc. and certain employees (Incorporated by reference to Exhibit 10.25 to the Company’s Annual Report on Form 10-K for the year ended December 31, 1997, filed on March 30, 1998 (File No. 0-21044))
80
DH
M B
P -
3868
0_10
K_7
- P
age
80 o
f 84
- Apr
4, 2
008
- 10:
01:1
7 A
M -
Bla
ck
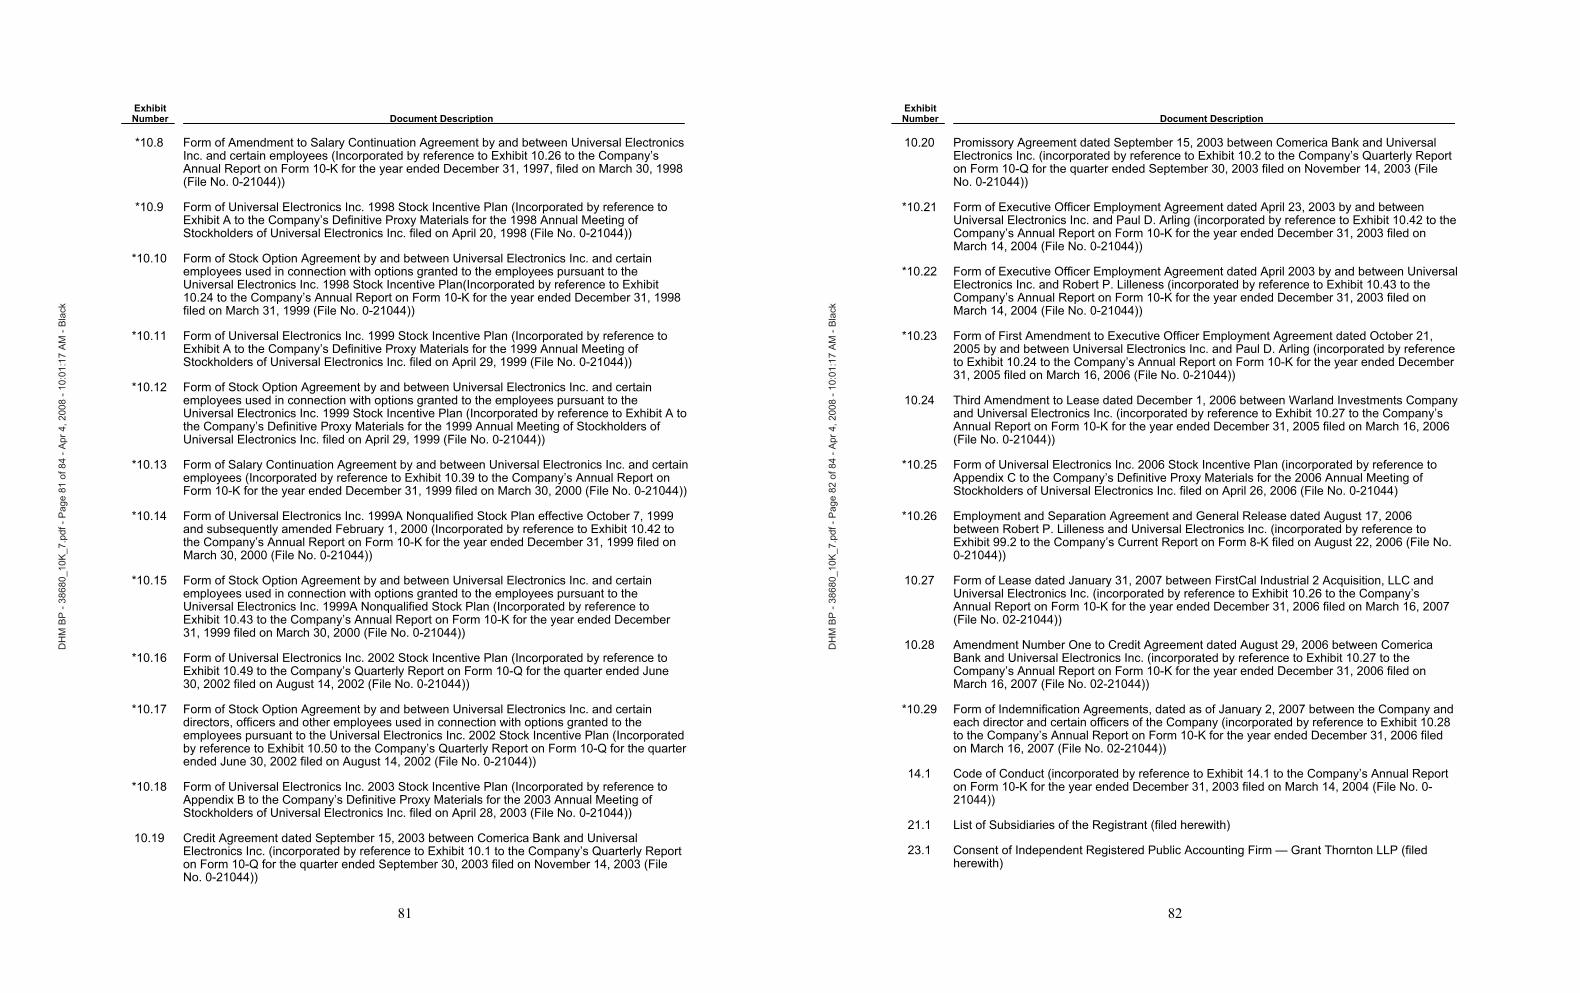
Exhibit Number Document Description
*10.8 Form of Amendment to Salary Continuation Agreement by and between Universal Electronics Inc. and certain employees (Incorporated by reference to Exhibit 10.26 to the Company’s Annual Report on Form 10-K for the year ended December 31, 1997, filed on March 30, 1998 (File No. 0-21044))
*10.9 Form of Universal Electronics Inc. 1998 Stock Incentive Plan (Incorporated by reference to Exhibit A to the Company’s Definitive Proxy Materials for the 1998 Annual Meeting of Stockholders of Universal Electronics Inc. filed on April 20, 1998 (File No. 0-21044))
*10.10 Form of Stock Option Agreement by and between Universal Electronics Inc. and certain employees used in connection with options granted to the employees pursuant to the Universal Electronics Inc. 1998 Stock Incentive Plan(Incorporated by reference to Exhibit 10.24 to the Company’s Annual Report on Form 10-K for the year ended December 31, 1998 filed on March 31, 1999 (File No. 0-21044))
*10.11 Form of Universal Electronics Inc. 1999 Stock Incentive Plan (Incorporated by reference to Exhibit A to the Company’s Definitive Proxy Materials for the 1999 Annual Meeting of Stockholders of Universal Electronics Inc. filed on April 29, 1999 (File No. 0-21044))
*10.12 Form of Stock Option Agreement by and between Universal Electronics Inc. and certain employees used in connection with options granted to the employees pursuant to the Universal Electronics Inc. 1999 Stock Incentive Plan (Incorporated by reference to Exhibit A to the Company’s Definitive Proxy Materials for the 1999 Annual Meeting of Stockholders of Universal Electronics Inc. filed on April 29, 1999 (File No. 0-21044))
*10.13 Form of Salary Continuation Agreement by and between Universal Electronics Inc. and certain employees (Incorporated by reference to Exhibit 10.39 to the Company’s Annual Report on Form 10-K for the year ended December 31, 1999 filed on March 30, 2000 (File No. 0-21044))
*10.14 Form of Universal Electronics Inc. 1999A Nonqualified Stock Plan effective October 7, 1999 and subsequently amended February 1, 2000 (Incorporated by reference to Exhibit 10.42 to the Company’s Annual Report on Form 10-K for the year ended December 31, 1999 filed on March 30, 2000 (File No. 0-21044))
*10.15 Form of Stock Option Agreement by and between Universal Electronics Inc. and certain employees used in connection with options granted to the employees pursuant to the Universal Electronics Inc. 1999A Nonqualified Stock Plan (Incorporated by reference to Exhibit 10.43 to the Company’s Annual Report on Form 10-K for the year ended December 31, 1999 filed on March 30, 2000 (File No. 0-21044))
*10.16 Form of Universal Electronics Inc. 2002 Stock Incentive Plan (Incorporated by reference to Exhibit 10.49 to the Company’s Quarterly Report on Form 10-Q for the quarter ended June 30, 2002 filed on August 14, 2002 (File No. 0-21044))
*10.17 Form of Stock Option Agreement by and between Universal Electronics Inc. and certain directors, officers and other employees used in connection with options granted to the employees pursuant to the Universal Electronics Inc. 2002 Stock Incentive Plan (Incorporated by reference to Exhibit 10.50 to the Company’s Quarterly Report on Form 10-Q for the quarter ended June 30, 2002 filed on August 14, 2002 (File No. 0-21044))
*10.18 Form of Universal Electronics Inc. 2003 Stock Incentive Plan (Incorporated by reference to Appendix B to the Company’s Definitive Proxy Materials for the 2003 Annual Meeting of Stockholders of Universal Electronics Inc. filed on April 28, 2003 (File No. 0-21044))
10.19 Credit Agreement dated September 15, 2003 between Comerica Bank and Universal Electronics Inc. (incorporated by reference to Exhibit 10.1 to the Company’s Quarterly Report on Form 10-Q for the quarter ended September 30, 2003 filed on November 14, 2003 (File No. 0-21044))
81
DH
M B
P -
3868
0_10
K_7
- P
age
81 o
f 84
- Apr
4, 2
008
- 10:
01:1
7 A
M -
Bla
ck
Exhibit Number Document Description
10.20 Promissory Agreement dated September 15, 2003 between Comerica Bank and Universal Electronics Inc. (incorporated by reference to Exhibit 10.2 to the Company’s Quarterly Report on Form 10-Q for the quarter ended September 30, 2003 filed on November 14, 2003 (File No. 0-21044))
*10.21 Form of Executive Officer Employment Agreement dated April 23, 2003 by and between Universal Electronics Inc. and Paul D. Arling (incorporated by reference to Exhibit 10.42 to the Company’s Annual Report on Form 10-K for the year ended December 31, 2003 filed on March 14, 2004 (File No. 0-21044))
*10.22 Form of Executive Officer Employment Agreement dated April 2003 by and between Universal Electronics Inc. and Robert P. Lilleness (incorporated by reference to Exhibit 10.43 to the Company’s Annual Report on Form 10-K for the year ended December 31, 2003 filed on March 14, 2004 (File No. 0-21044))
*10.23 Form of First Amendment to Executive Officer Employment Agreement dated October 21, 2005 by and between Universal Electronics Inc. and Paul D. Arling (incorporated by reference to Exhibit 10.24 to the Company’s Annual Report on Form 10-K for the year ended December 31, 2005 filed on March 16, 2006 (File No. 0-21044))
10.24 Third Amendment to Lease dated December 1, 2006 between Warland Investments Company and Universal Electronics Inc. (incorporated by reference to Exhibit 10.27 to the Company’s Annual Report on Form 10-K for the year ended December 31, 2005 filed on March 16, 2006 (File No. 0-21044))
*10.25 Form of Universal Electronics Inc. 2006 Stock Incentive Plan (incorporated by reference to Appendix C to the Company’s Definitive Proxy Materials for the 2006 Annual Meeting of Stockholders of Universal Electronics Inc. filed on April 26, 2006 (File No. 0-21044)
*10.26 Employment and Separation Agreement and General Release dated August 17, 2006 between Robert P. Lilleness and Universal Electronics Inc. (incorporated by reference to Exhibit 99.2 to the Company’s Current Report on Form 8-K filed on August 22, 2006 (File No. 0-21044))
10.27 Form of Lease dated January 31, 2007 between FirstCal Industrial 2 Acquisition, LLC and Universal Electronics Inc. (incorporated by reference to Exhibit 10.26 to the Company’s Annual Report on Form 10-K for the year ended December 31, 2006 filed on March 16, 2007 (File No. 02-21044))
10.28 Amendment Number One to Credit Agreement dated August 29, 2006 between Comerica Bank and Universal Electronics Inc. (incorporated by reference to Exhibit 10.27 to the Company’s Annual Report on Form 10-K for the year ended December 31, 2006 filed on March 16, 2007 (File No. 02-21044))
*10.29 Form of Indemnification Agreements, dated as of January 2, 2007 between the Company and each director and certain officers of the Company (incorporated by reference to Exhibit 10.28 to the Company’s Annual Report on Form 10-K for the year ended December 31, 2006 filed on March 16, 2007 (File No. 02-21044))
14.1 Code of Conduct (incorporated by reference to Exhibit 14.1 to the Company’s Annual Report on Form 10-K for the year ended December 31, 2003 filed on March 14, 2004 (File No. 0-21044))
21.1 List of Subsidiaries of the Registrant (filed herewith)
23.1 Consent of Independent Registered Public Accounting Firm — Grant Thornton LLP (filed herewith)
82
DH
M B
P -
3868
0_10
K_7
- P
age
82 o
f 84
- Apr
4, 2
008
- 10:
01:1
7 A
M -
Bla
ck
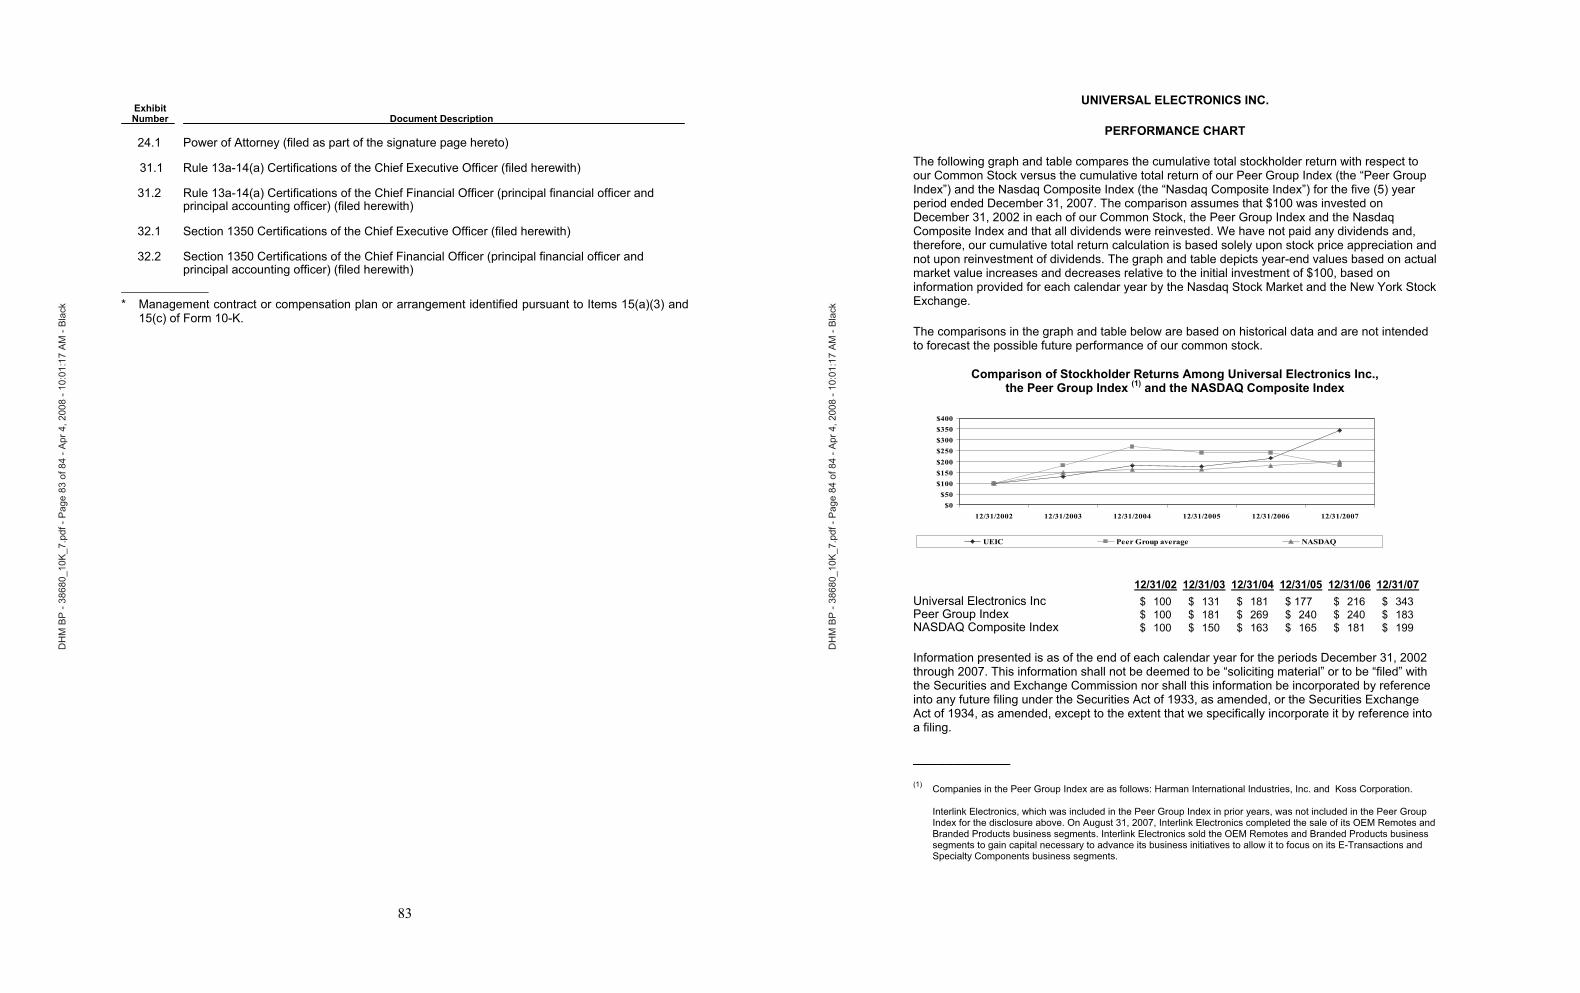
83
Exhibit Number Document Description
24.1 Power of Attorney (filed as part of the signature page hereto)
31.1 Rule 13a-14(a) Certifications of the Chief Executive Officer (filed herewith)
31.2 Rule 13a-14(a) Certifications of the Chief Financial Officer (principal financial officer and principal accounting officer) (filed herewith)
32.1 Section 1350 Certifications of the Chief Executive Officer (filed herewith)
32.2 Section 1350 Certifications of the Chief Financial Officer (principal financial officer and principal accounting officer) (filed herewith)
____________* Management contract or compensation plan or arrangement identified pursuant to Items 15(a)(3) and
15(c) of Form 10-K.
DH
M B
P -
3868
0_10
K_7
- P
age
83 o
f 84
- Apr
4, 2
008
- 10:
01:1
7 A
M -
Bla
ck
UNIVERSAL ELECTRONICS INC.
PERFORMANCE CHART
The following graph and table compares the cumulative total stockholder return with respect to our Common Stock versus the cumulative total return of our Peer Group Index (the “Peer Group Index”) and the Nasdaq Composite Index (the “Nasdaq Composite Index”) for the five (5) year period ended December 31, 2007. The comparison assumes that $100 was invested on December 31, 2002 in each of our Common Stock, the Peer Group Index and the Nasdaq Composite Index and that all dividends were reinvested. We have not paid any dividends and, therefore, our cumulative total return calculation is based solely upon stock price appreciation and not upon reinvestment of dividends. The graph and table depicts year-end values based on actual market value increases and decreases relative to the initial investment of $100, based on information provided for each calendar year by the Nasdaq Stock Market and the New York Stock Exchange.
The comparisons in the graph and table below are based on historical data and are not intended to forecast the possible future performance of our common stock.
Comparison of Stockholder Returns Among Universal Electronics Inc., the Peer Group Index (1) and the NASDAQ Composite Index
$0$50
$100$150$200$250$300$350$400
12/31/2002 12/31/2003 12/31/2004 12/31/2005 12/31/2006 12/31/2007
UEIC Peer Group average NASDAQ
12/31/02 12/31/03 12/31/04 12/31/05 12/31/06 12/31/07 Universal Electronics Inc $ 100 $ 131 $ 181 $ 177 $ 216 $ 343 Peer Group Index $ 100 $ 181 $ 269 $ 240 $ 240 $ 183 NASDAQ Composite Index $ 100 $ 150 $ 163 $ 165 $ 181 $ 199
Information presented is as of the end of each calendar year for the periods December 31, 2002 through 2007. This information shall not be deemed to be “soliciting material” or to be “filed” with the Securities and Exchange Commission nor shall this information be incorporated by reference into any future filing under the Securities Act of 1933, as amended, or the Securities Exchange Act of 1934, as amended, except to the extent that we specifically incorporate it by reference into a filing.
____________
(1) Companies in the Peer Group Index are as follows: Harman International Industries, Inc. and Koss Corporation.
Interlink Electronics, which was included in the Peer Group Index in prior years, was not included in the Peer Group Index for the disclosure above. On August 31, 2007, Interlink Electronics completed the sale of its OEM Remotes and Branded Products business segments. Interlink Electronics sold the OEM Remotes and Branded Products business segments to gain capital necessary to advance its business initiatives to allow it to focus on its E-Transactions and Specialty Components business segments.
DH
M B
P -
3868
0_10
K_7
- P
age
84 o
f 84
- Apr
4, 2
008
- 10:
01:1
7 A
M -
Bla
ck

DIRECTORS
Paul D. Arling
Chairman and
Chief Executive Offi cer
Universal Electronics Inc.
Cypress, California
Satjiv S. Chahil2, 3
Senior Vice President
of Marketing
Hewlett-Packard
Personal Systems Group
Cupertino, California
William C. Mulligan1, 3
Managing Director
Primus Venture Partners, Inc.
Cleveland, Ohio
J.C. Sparkman2, 3
Retired Executive
Vice President and
Chief Operating Offi cer
Telecommunications, Inc. (TCI)
Denver, Colorado
Ed Zinser1
Chief Financial Offi cer
Boingo Wireless Inc.
Los Angeles, California
1 Member, Audit Committee
2 Member, Compensation
Committee
3 Member, Corporate
Governance & Nominating
Committee
Universal Electronics Inc.
is an equal opportunity employer
OFFICERS
Paul D. Arling
Chairman and
Chief Executive Offi cer
Paul J.M. Bennett
Executive Vice President
International
Managing Director EMEA
Mark S. Kopaskie
Executive Vice President
and General Manager, U. S.
Richard A. Firehammer, Jr.
Senior Vice President,
General Counsel and
Secretary
Bryan Hackworth
Senior Vice President and
Chief Financial Offi cer
Joe Miketo
Senior Vice President
of Operations
Olav Pouw
Senior Vice President Control
and Technology Group, EMEA
and Asia
Pam Price
Senior Vice President of Sales
Ramzi S. Ammari
Vice President of
Product Development
Steve Gutman
Vice President of Cable Sales
Patrick H. Hayes
Vice President of
Intellectual Property
Lou Hughes
Vice President of
Corporate Development
Em Klaver
Vice President
Digital Home Group , EMEA
Michael Koch
Vice President of Finance and
Treasurer
Patrick Lems
Vice President
Business Controlling & M&A
EMEA
Jacques Mathijsen
Vice President of Product
Mangement, EMEA
Graham Williams
Vice President of Engineering
WORLDWIDE HEADQUARTERS
Universal Electronics Inc.
6101 Gateway Drive
Cypress, California 90630
EUROPEAN HEADQUARTERS
The Netherlands
Universal Electronics BV
Institutenweg 21 7521 PH
Enschede, Netherlands
INVESTOR INFORMATION
Annual Meeting
4:00 p.m. PT - June 12, 2008
Universal Electronics Inc.
6101 Gateway Drive
Cypress, California 90630
Independent Registered Public
Accounting Firm
Grant Thornton LLP
Irvine, California
Registrar & Transfer Agent
Computershare Investor
Services, LLC
2 North LaSalle Street
Chicago, Illinois 60602
Phone (312) 588-4991
FORM 10-K
Any stockholder who desires
a copy of the Company’s 2007
Annual Report on Form 10-K
fi led with the Securities and
Exchange Commission may ob-
tain a copy (excluding exhibits)
without charge by addressing a
request to:
Investor Relations
Universal Electronics Inc.
6101 Gateway Drive
Cypress, California 90630
A charge equal to the reproduc-
tion cost will be made if the
exhibits are requested.
Universal’s Internet address is
www.uei.com. Universal makes
available through its internet
web site its annual report on
Form 10-K. Investors can also
obtain copies of our SEC fi lings
from the SEC web site at
www.sec.gov
corporate information_

uei.comUniversal Electronics Inc.6101 Gateway DriveCypress, CA 90630
SPIN
ESP
INE