technology dissemination among small-scale farmers...
TRANSCRIPT

TECHNOLOGY DISSEMINATION AMONG SMALL-SCALE FARMERS IN MERU CENTRAL DISTRICT OF KENYA: IMPACT OF GROUP PARTICIPATION
By
KRISTIN ELIZABETH DAVIS
A DISSERTATION PRESENTED TO THE GRADUATE SCHOOL OF THE UNIVERSITY OF FLORIDA IN PARTIAL FULFILLMENT
OF THE REQUIREMENTS FOR THE DEGREE OF DOCTOR OF PHILOSOPHY
UNIVERSITY OF FLORIDA
2004

Copyright 2004
by
Kristin Elizabeth Davis
This dissertation is dedicated to my parents, Art and Mary Ellen Davis.

ACKNOWLEDGMENTS
I would like to thank the Ministry of Livestock Development and Fisheries in Meru
Central District for all of their help with my research. Henry Kirimi, the District
Livestock Production Officer, and his staff assisted in many ways. Divisional Livestock
Extension Officers and locational staff from Abothoguchi Central, Abothoguchi East, and
Miriga Mieru East divisions were especially helpful. Patrick Mutia and all of the FARM-
Africa staff are also owed a huge thank you for allowing me to make use of their
personnel, vehicles, and facilities in Meru, in order to facilitate my research. Special
thanks also go to my assistant Franklin Muthamia who worked tireless hours with me,
translated, repaired vehicles, and took care of logistics. Ben and Darlene O’Dell
provided much-needed moral support while in Meru.
Steve Franzel of the World Agroforestry Centre was a brilliant supervisor during
my time in Kenya, and together with Charles Wambugu provided much advice. I would
also like to thank the United States Agency for International Development, especially
Andrew Brubaker and Scott Bode, for funding that enabled me to conduct the field
research. Sarah Workman, the Scientific Liaison Officer between USAID and World
Agroforestry Centre, was instrumental in procuring the funding. I would also like to
thank Charity Blomeley, Betty Finn, and Lisette Staal from International Programs at the
University of Florida, for their assistance in the funding administration. I also must thank
Madhur Gautam, Pierre Rondot, and Willem Zijp from the World Bank; and John
Sanders from Purdue University for resources and feedback.
iv
Special thanks also go to my committee members. Pete Hildebrand was always
available for advice and discussions on small-scale livelihood systems. Christy Gladwin,
during her time on my committee, gave excellent insight into economics in Africa and
ethnographic techniques. Nick Place gracefully and patiently bore with all my questions
and dilemmas as my academic advisor. Tracy Irani provided great help and guidance in
methodology and statistics. Finally, Della McMillan Wilson helped me with critical
materials, with contacts in Kenya, and with meals and moral support.
I would like to thank my parents and family for their support and continued belief
in me. Finally, I acknowledge my Lord and Savior Jesus Christ, who is the one who
guided me to the University of Florida and this particular research study. It has all been
for Him.
v
TABLE OF CONTENTS page
ACKNOWLEDGMENTS ................................................................................................. iv
LIST OF TABLES...............................................................................................................x
LIST OF FIGURES ......................................................................................................... xiii
ABSTRACT..................................................................................................................... xiv
CHAPTER 1 INTRODUCTION ........................................................................................................1
Introduction...................................................................................................................1 Background to the Problem ..........................................................................................2
Smallholder Agriculture ........................................................................................3 Extension’s Approaches to Rural Development....................................................5
Study-Area Background ...............................................................................................9 The World Agroforestry Centre (WAC) .............................................................14 Food and Agricultural Research Management (FARM)-Africa .........................15
Researchable Problem ................................................................................................16 Purpose and Objectives...............................................................................................17 Research Questions.....................................................................................................18 Assumptions ...............................................................................................................18 Operational Definition of Terms ................................................................................18 Limitations of the Study .............................................................................................20 Significance of the Study............................................................................................20 Organization of Thesis................................................................................................21
2 LITERATURE REVIEW ...........................................................................................23
Extension History and Models in Kenya ....................................................................23 Introduction .........................................................................................................23 Diffusion of Innovations Theory and Transfer of Technology ...........................25 The 1960s Top-Down Approach: State Transfer of Technology Model ...........27 The 1970s Holistic Approach: Integrated Rural Development Projects and
Farming Systems Philosophy...........................................................................28 The 1980s Training and Visit Approach: Expanding the State Extension
Service..............................................................................................................30
vi

The 1990s Pluralistic Approach: Community-Based Farmer-Led Extension....34 Farmer-Led Extension ................................................................................................35 Social Capital..............................................................................................................39 Farmer Groups ............................................................................................................43
Role of Farmer Groups in Extension...................................................................44 Factors for Group Success...................................................................................49
Conclusion ..................................................................................................................52 3 METHODS.................................................................................................................54
Research Design .........................................................................................................55 Population and Subjects..............................................................................................56 Sampling Procedure....................................................................................................57 Instruments .................................................................................................................59 Data Collection ...........................................................................................................62 Data Analysis..............................................................................................................66 Validity and Reliability of the Results........................................................................67
Validity ................................................................................................................67 Reliability ............................................................................................................70
4 RESULTS...................................................................................................................74
The Food and Agricultural Research Management (FARM)-Africa Project and Dairy-Goat Groups.................................................................................................74
Fodder Training and Dissemination in the Project..............................................80 Description of Area and Subjects ........................................................................85
Objective One: Examine Participation in Groups and Identify What Factors Affect Participation in Groups ...............................................................................89
Introduction .........................................................................................................89 Groups in Meru Central District..........................................................................89 Factors Affecting Participation in Any Groups in Meru Central District ...........93 Issues Regarding Participation in Dairy-Goat Groups ......................................100
Lack of knowledge/information .................................................................102 Wealth and poverty ....................................................................................102 Social problems ..........................................................................................112 Time ...........................................................................................................113 Gender ........................................................................................................113 Household composition..............................................................................114 Other reasons..............................................................................................115 Participation in leadership ..........................................................................117 Withdrawal from groups ............................................................................118
Objective Two: Examine Linkages and Their Outcomes among Farmers and Other Extension Stakeholders..............................................................................118
Introduction .......................................................................................................118 Agricultural Players in Meru Central District ...................................................119 Dairy-Goat Group Linkages ..............................................................................124 Linkage Outcomes.............................................................................................126
vii

Objective Three: Identify the Mechanisms by Which Farmer Groups and Their Members Receive and Disseminate Information and New Technologies ...........131
How Dairy-Goat Groups Disseminate Information and Technology................131 How Dairy-Goat Groups and Individuals Receive Information and
Technology ....................................................................................................138 Sources of Information for Dairy-Goat Groups ................................................138 Sources of Information for Individual Farmers.................................................140
Objective Four: Identify the Factors Characteristic of Groups Successful in Disseminating Technology ..................................................................................142
Group Location..................................................................................................145 Group Size and Member Participation ..............................................................150 Group Age .........................................................................................................154 Formality and Management...............................................................................154 Leadership .........................................................................................................156 Activities............................................................................................................157 Gender, Poverty and Individuals in the Group..................................................157 Homogeneity of Members.................................................................................159 Group Cohesiveness ..........................................................................................160 Capacity.............................................................................................................161 Linkages ............................................................................................................163 Type of Group (Project-Facilitated versus Non-Facilitated).............................164 Groups’ Own Indicators ....................................................................................170
5 CONCLUSIONS AND RECOMMENDATIONS...................................................174
Objective One: Examine Participation in Groups and Identify What Factors Affect Participation in Groups .............................................................................175
Are Poorer People Participating in Groups in Meru?........................................175 What Affects Participation in Groups of Any Kind? ........................................181
Objective Two: Examine Linkages and Their Outcomes between Farmers and Other Extension Stakeholders..............................................................................183
Objective Three: Identify the Mechanisms by Which Farmer Groups and Their Members Receive and Disseminate Information and New Technologies ...........188
Objective Four: Identify the Factors Characteristic of Groups Successful in Disseminating Technology ..................................................................................192
Summary...................................................................................................................204 Use of Groups in Extension...............................................................................204 How Do Groups Fit in a Pluralistic Extension System?....................................208
Recommendations for Policymakers and Practitioners ............................................211 Recommendations for Further Research ..................................................................213 Conclusion ................................................................................................................213
viii

APPENDIX
A ADDITIONAL DATA ON GROUP PARTICIPATION.........................................215
B SEMI-STRUCTURED INTERVIEW TOPIC GUIDE............................................221
C LETTER OF INVITATION TO INTERVIEW FOR GROUPS..............................225
D INTERVIEW SCHEDULE FOR GROUPS.............................................................226
E INTERVIEW SCHEDULE FOR INDIVIDUALS ..................................................232
F INFORMED CONSENT..........................................................................................238
LIST OF REFERENCES.................................................................................................239
BIOGRAPHICAL SKETCH ...........................................................................................250
ix

LIST OF TABLES
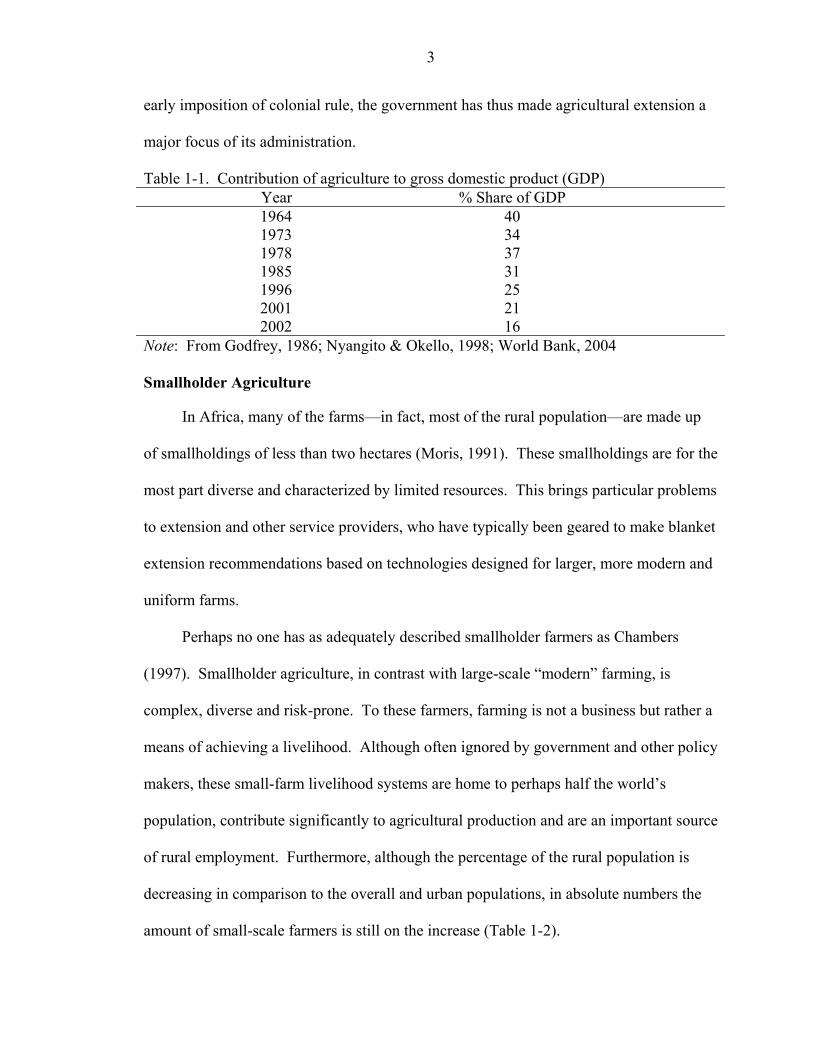
Table page 1-1. Contribution of agriculture to gross domestic product (GDP) ....................................3
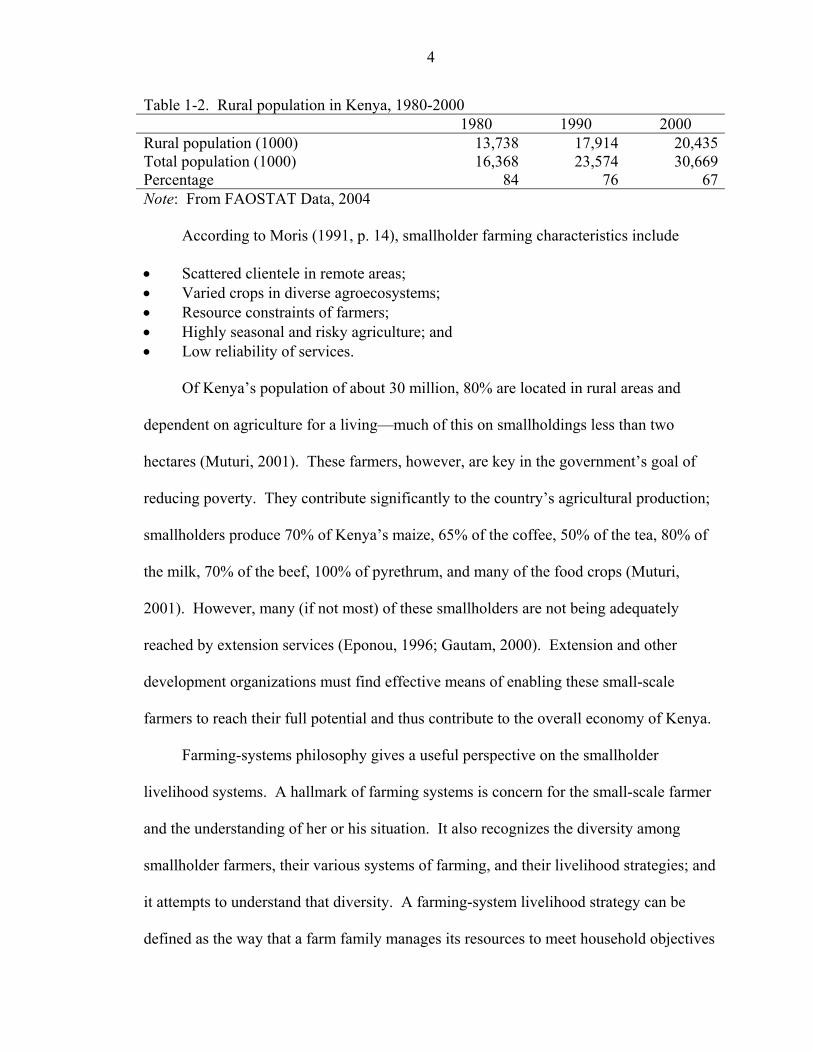
1-2. Rural population in Kenya, 1980-2000 .......................................................................4
2-1. Early extension approaches strengths and weaknesses .............................................28
2-2. Philosophy of transfer of technology (TOT) and farmer first ...................................37
4-1. Source of fodder training for the dairy-goat groups (n = 46) ....................................82
4-2. Descriptive data for individual farmers (n = 88) .......................................................85
4-3. Descriptive data for individuals interviewed (n = 88)...............................................88
4-4. Types of groups to which individual respondents belonged (n = 88) .......................90
4-5. Factors affecting participation in dairy-goat groups (n = 88)....................................94
4-6. Binary logistic regression analysis showing factors associated with membership in dairy-goat groups......................................................................................................96
4-7. Reasons given by individuals for joining most important group (n = 86).................99
4-8. Criteria for being a member of dairy-goat groups (n = 46) .....................................100
4-9. Most frequent reasons given for why some farmers are not in any groups (%)......101
4-10. Pearson’s product moment correlations between various indicators for wealth for individual farmers (n = 88).....................................................................................104
4-11. Frequencies for wealth indicators of dairy-goat group members and non-members (%) (n = 88) ............................................................................................................106
4-12. Wealth levels of dairy-goat members (divided into type of member) and non-members .................................................................................................................107
4-13. Number of improved cattle owned by various wealth levels (n = 88) ..................109
4-14. Individuals’ responses to participation in groups ..................................................111
x

4-15. Dairy-goat groups’ responses to participation in their group (n = 46) ..................111
4-16. Frequencies for group leaders’ gender, age and wealth level (%) (n = 138).........117
4-17. Agricultural players of Meru Central District .......................................................120
4-18. Sizes of chapatis given to various links with the dairy-goat groups (n = 46) .......125
4-19. Frequency of linkage with the dairy-goat groups as shown in chapati diagrams (n = 46) ...................................................................................................................126
4-20. Amount of fodder seedlings given by dairy-goat groups to non-members ...........136
4-21. Most important sources of information listed by dairy-goat groups (n = 46) .......138
4-22. Number one source of information for dairy-goat groups by type of group (%) ..139
4-23. Most important sources of information listed by individual farmers (n = 88) ......141
4-24. Pearson’s product moment correlations between variables affecting success (n = 46)...........................................................................................................................146
4-25. Pearson’s product moment correlation coefficients between location and success indicators (n = 46) ..................................................................................................148
4-26. Effect of high and low group elevation on success indicators (n = 46).................150
4-27. Effect of low and high group age on success indicators (n = 46)..........................154
4-28. Pearson’s product moment correlations between variables affecting success and wealth indicators for groups (n = 46) .....................................................................159
4-29. Pearson’s product moment correlations between cohesiveness and success indicators ................................................................................................................160
4-30. Effect of low and high group training on success indicators (n = 46)...................162
4-31. Differences in FARM- and extension-facilitated dairy-goat groups (n = 46) .......165
4-32. Effect of type of group on success indicators (n = 46)..........................................167
4-33. Linear regression analysis of variables for prediction of success in dissemination (adoption index) .....................................................................................................169
4-34. Effect of various group factors on success indicators based on t-tests..................170
5-1. Studies examining the effect of group factors on success .......................................204
A-1. Factors affecting participation in church groups ....................................................215
xi
A-2. Binary regression analysis for participation in church groups (n = 39) .................215
A-3. Factors affecting participation in clan groups ........................................................216
A-4. Contingency table on gender and participation in clan groups...............................216
A-5. Binary regression analysis for participation in clan groups (n = 23)......................216
A-6. Factors affecting participation in merry-go-rounds................................................217
A-7. Contingency table on gender and participation in merry-go-rounds ......................217
A-8. Binary regression analysis for participation in merry-go-rounds (n = 18) .............217
A-9. Factors affecting participation in water groups ......................................................218
A-10. Contingency table on gender and participation in water groups ..........................218
A-11. Contingency table on water source and participation in water groups (n = 18) ...218
A-12. Contingency table on wealth level and participation in water groups (n = 18)....219
A-13. Binary regression analysis for participation in water groups (n = 18) .................219
A-14. Factors affecting participation in women’s groups ..............................................219
A-15. Binary regression analysis for participation in women’s groups (n = 14)............220
xii

LIST OF FIGURES
Figure page 1-1. Meru Central District in Kenya .................................................................................11
2-1. Farming systems emerging methodology on technology transfer.............................26
4-1. Dairy-goat group distribution within Meru Central District .....................................79
4-2. Distribution of fodder planted by individual farmers (n = 88) ..................................83
4-3. Distribution of improved goats owned by individual farmers (n = 88).....................84
4-4. Distribution of years of education by individual farmers (n = 88)............................89
4-5. Distribution of number of animals owned by individual farmers (n = 88)................89
4-6. Chapati diagram by a dairy-goat group ...................................................................125
4-7. Buck station .............................................................................................................134
4-8. Agroecological zones in Meru Central District .......................................................147
4-9. Natural resources in Meru .......................................................................................151
4-10. Roads and towns in Meru Central District ............................................................152
4-11. A main road leading out of Meru town with vehicles stuck in the mud................152
4-12. Elevation in Meru Central District ........................................................................153
4-13. Groups’ self-ratings on success in dissemination (%)...........................................171
xiii

Abstract of Dissertation Presented to the Graduate School of the University of Florida in Partial Fulfillment of the Requirements for the Degree of Doctor of Philosophy
TECHNOLOGY DISSEMINATION AMONG SMALL-SCALE FARMERS IN MERU CENTRAL DISTRICT OF KENYA: IMPACT OF GROUP PARTICIPATION
By
Kristin Elizabeth Davis
August 2004
Chair: Nick Place Cochair: Peter Hildebrand Major Department: Agricultural Education and Communication
The goal of this study was to examine the role of farmer groups in technology
dissemination, and to assess what factors make groups effective in extending
technologies among small-scale dairy-goat farmers in Meru Central District of Kenya.
The theoretical framework for the study included insight from agricultural extension
theory, farming systems research and extension, social capital, and group theory.
A mixed-methods, multiple-stage approach was used to obtain data. Research
techniques included participant observation, documentary analysis, semi-structured
interviews, social mapping, group timelines, and structured questionnaires. Dairy-goat
farmer groups (n = 46) and individual farmers (n = 88) were interviewed during the
study. Qualitative data provided baseline information, and helped in the formation of
research questions. Quantitative data were entered into the Statistical Package for Social
xiv

Scientists (SPSS) and analyzed using contingency tables, descriptive statistics,
correlations, tests of significance, and regression.
Most farmers in Meru Central District belonged to some type of farmer group.
Factors for participation in different types of groups included household size, wealth
level, age, gender, and membership in other groups. The dairy-goat groups were linked
with an average of nine outside entities. Major linkages included government extension,
chief baraza (public meeting), churches, and the non-governmental organization Food
and Agricultural Research (FARM)-Africa. Dairy-goat groups had a variety of
mechanisms for disseminating information and technology, including the baraza, the
buck (breeding) station, through training others, and in other groups that members
belonged to. Certain factors about the dairy-goat groups were associated with success in
dissemination. These included type of group (those facilitated by the dairy-goat project
versus those not), location, age of group, number of trainings, homogeneity of members,
and number of linkages.
In the pluralistic extension milieu today, farmer groups play an increasingly
important role in the technology-dissemination process. Most farmers in Meru were in
groups, which were linked to other organizations and were disseminating the information
and technologies that they had. Groups are a key way for farmers to receive information
and training, and then to tell or train others. Some ingredients that might increase the
success of such groups include increasing capacity in groups (and especially of key
members), finding ways to link them with other extension providers, strengthening
government administration in the form of baraza, and encouraging groups to form around
common interests at the community level.
xv

CHAPTER 1 INTRODUCTION
A key feature distinguishing extension work from other forms of professional agriculture is that in the first instance extension deals with people rather than with their crops and
animals. (Moris, 1991, emphasis added)
Introduction
Government extension in Kenya today is unable to provide many small-scale
farmers with pertinent technologies and information to meet their needs and thus help to
bring about rural development, one of the acknowledged goals of the administration.
Lack of proper extension services is partially to blame for poverty, according to
participatory poverty assessments conducted in ten districts in Kenya in 2000 (Meru
Central District Development Plan, 2002; Republic of Kenya, 2001). This is due to both
reductions in government services in Kenya and ineffective and inappropriate extension
approaches (Eponou, 1996; Gautam, 2000). These issues have led to gaps in extension of
technologies to small-scale farmers, who play a major role in the Kenyan economy.
Technologies to address rural problems have been developed by research,
development organizations and farmers working together in Kenya. A major issue now is
how to extend, or scale up, these technologies to benefit more low-resource farmers
despite the limited government extension resources. Many approaches to technology
dissemination have been developed since the reduction of the state extension service,
such as private extension services and those run by non-governmental organizations
(NGOs). Recently, however, community-based extension has come to the fore as a
1

2
means of scaling up these technologies to have a wider impact in the rural economies
(Franzel, Cooper & Denning, 2001; Misiko, 2000; Noordin, Niang, Jama & Nyasimi,
2001). Farmer groups are an important vehicle for such community-based extension.
Background to the Problem
Sub-Saharan Africa is well known for its high poverty levels and other major
obstacles to development. In addition to the limited resources, risk and complexity
inherent in these African livelihood systems, small-scale farmers in Kenya today must
also deal with population pressure, the effects of HIV/AIDS, environmental degradation
and poor rural services and infrastructure. In contrast to other developing regions, the
problems in this particular part of the world do not seem to be improving. Per capita
agricultural production in sub-Saharan Africa has been in decline since the mid 1990s
(Shapouri & Rosen, 2001). As a result, living standards have also declined in the region.
Kenya perhaps typifies the experience of sub-Saharan Africa. With 70% of
Kenya’s workforce involved in agriculture, and smallholders contributing to a significant
portion of agricultural production, Kenya makes a good case for the examination of the
government extension’s relationship with the often-ignored smallholder farmers.
Kenya’s extension service, much like that of other countries in sub-Saharan Africa, has
gone through many changes since its original inception through the colonial government,
in response to the changing social, environmental, and political settings.
It has long been realized, in Kenya, that a strong agricultural sector is crucial to
growth (Pearson et al., 1995). Agriculture contributes a significant proportion to its gross
domestic product (Table 1-1). Because of this, the Kenyan government has taken a
strong interest and role in agricultural services (Umali & Schwartz, 1994). Since the
3
early imposition of colonial rule, the government has thus made agricultural extension a
major focus of its administration.
Table 1-1. Contribution of agriculture to gross domestic product (GDP) Year % Share of GDP 1964 40 1973 34 1978 37 1985 31 1996 25 2001 21 2002 16
Note: From Godfrey, 1986; Nyangito & Okello, 1998; World Bank, 2004 Smallholder Agriculture
In Africa, many of the farms—in fact, most of the rural population—are made up
of smallholdings of less than two hectares (Moris, 1991). These smallholdings are for the
most part diverse and characterized by limited resources. This brings particular problems
to extension and other service providers, who have typically been geared to make blanket
extension recommendations based on technologies designed for larger, more modern and
uniform farms.
Perhaps no one has as adequately described smallholder farmers as Chambers
(1997). Smallholder agriculture, in contrast with large-scale “modern” farming, is
complex, diverse and risk-prone. To these farmers, farming is not a business but rather a
means of achieving a livelihood. Although often ignored by government and other policy
makers, these small-farm livelihood systems are home to perhaps half the world’s
population, contribute significantly to agricultural production and are an important source
of rural employment. Furthermore, although the percentage of the rural population is
decreasing in comparison to the overall and urban populations, in absolute numbers the
amount of small-scale farmers is still on the increase (Table 1-2).
4
Table 1-2. Rural population in Kenya, 1980-2000 1980 1990 2000 Rural population (1000) 13,738 17,914 20,435Total population (1000) 16,368 23,574 30,669Percentage 84 76 67Note: From FAOSTAT Data, 2004
According to Moris (1991, p. 14), smallholder farming characteristics include
• Scattered clientele in remote areas; • Varied crops in diverse agroecosystems; • Resource constraints of farmers; • Highly seasonal and risky agriculture; and • Low reliability of services.
Of Kenya’s population of about 30 million, 80% are located in rural areas and
dependent on agriculture for a living—much of this on smallholdings less than two
hectares (Muturi, 2001). These farmers, however, are key in the government’s goal of
reducing poverty. They contribute significantly to the country’s agricultural production;
smallholders produce 70% of Kenya’s maize, 65% of the coffee, 50% of the tea, 80% of
the milk, 70% of the beef, 100% of pyrethrum, and many of the food crops (Muturi,
2001). However, many (if not most) of these smallholders are not being adequately
reached by extension services (Eponou, 1996; Gautam, 2000). Extension and other
development organizations must find effective means of enabling these small-scale
farmers to reach their full potential and thus contribute to the overall economy of Kenya.
Farming-systems philosophy gives a useful perspective on the smallholder
livelihood systems. A hallmark of farming systems is concern for the small-scale farmer
and the understanding of her or his situation. It also recognizes the diversity among
smallholder farmers, their various systems of farming, and their livelihood strategies; and
it attempts to understand that diversity. A farming-system livelihood strategy can be
defined as the way that a farm family manages its resources to meet household objectives

5
within social, economic and physical systems (Franzel, 1984). As seen from livelihood
analysis, resources or assets in small farm livelihood systems can be quite complex
(Dorward, Anderson, Clark, Keane & Moguel, 2002). One such resource is known as
social capital or collective action, and involves the networks and relationships that a
farmer may call on to meet her or his objectives (de Haan, 1999; Narayan & Pritchett,
1999). One type of social capital is farmer groups (mentioned in the introduction as a
vehicle for community-based extension).
Extension’s Approaches to Rural Development
To meet the challenges faced in the rural sector (mentioned in the previous section),
agricultural research and extension have been used for decades to improve the rural
economy. Agricultural extension, according to the World Bank, is “the process of
helping farmers to become aware of and adopt improved technology from any source to
enhance their production efficiency, income and welfare” (Purcell & Anderson, 1997, p.
55). Agricultural extension has also been defined as the extending of relevant
agricultural information to people (Swanson, Bentz & Sofranko, 1997). Moris (1991, p.
17) calls it “the promotion of agricultural technology to meet farmers’ needs.” This
process first became known as extension in England in the 1850s (Jones & Garforth,
1997). Extension has long played a role in the development of rural economies. This
“extending” of relevant agricultural information to people (Swanson et al., 1997) has
gone through many evolutions in various countries of the world.
Although the state has typically provided agricultural services, the paradigm for
research and extension has been changing extensively in Africa over the past 10 years.
State extension once played a successful and key role in development in Kenya. The
government service is now going through major changes and disintegration, however

6
(Kandie, 1997; Omolo, Sanders, McMillan & Georgis, 2001). Although extension has
been used in Africa under many different models, many claim today that it fails to do its
job of adequately reaching the majority of farmers and truly addressing the problems of
rural poverty, environmental sustainability, and food security (Eponou, 1996; Gautam,
2000; Republic of Kenya, 2001). Agricultural research and extension services have not
made the expected impact on small-scale farmers in Africa over the past few decades
(Eponou, 1996). Since the late 1980s, the efficiency of these services in Kenya has
dropped substantially (Government of Kenya, 1999; Kandie, 1997).
A wide range of factors has contributed to the current situation in Kenya. Its
weakening economy combined with poor management and corruption played an
important role. These internal problems coupled with the rapid expansion of the state
extension service created a large inefficient employee base that could only be sustained
with substantial outside support. At the same time, foreign donors (under pressure to
show “results”) were presented with a situation in which there was almost no evidence
for successful technology diffusion through these bloated bureaucracies. One result was
a major shift of foreign-donor support to technology research and the search for
alternative non-state mechanisms for delivering the inputs and advice needed. The net
result of these macro-policy shifts, combined with the stagnation of the state extension
services, has been a rapid increase in the number of private sector and NGO actors that
work side by side with state extension services in Kenya. Once totally state-run,
extension in Kenya is now conspicuous by the heavy role and increasing diversity of non-
governmental actors.

7
The extension service in Kenya has been unable to effectively reach farmers, even
in the high potential areas (Venkatesan & Kampen, 1998). The failure of early extension
models, and more recently the Training and Visit (T&V) model instituted by the World
Bank, has left a shell of an extension structure in Kenya with only a limited ability to
reach farmers in an effective way (Gautam, 2000; Sanders, Shapiro & Ramaswamy,
1996). The structural adjustment programs put in place in developing countries by the
International Monetary Fund and the World Bank helped to contribute to this problem by
reducing investment by the public sector.
The World Bank concluded in their assessment of extension in 2000 that a
decentralized, demand-driven and pluralistic system was needed in Kenya (Gautam,
2000). Pluralism is being promoted worldwide in extension systems (Feder, Willet &
Zijp, 1999). “Extension is not necessarily a government program, but rather a complex
set of institutions whereby rural people obtain new knowledge and information” (Rivera
& Alex, 2004, p. 339). The Kenyan government and donors agree on the need to focus
more on clients and lessen government costs through outsourcing, using farmers’ groups,
and cost sharing (Gautam, 2000). The current Kenyan extension model, called National
Agricultural and Livestock Extension Programme (NALEP), funded by the Swedish
government, is focused on pluralism.
Pluralism came about as a result of the inability of state services to provide for
farmers, and led to a search for other potential actors. The private sector emerged as one
important provider of services. Privatization has only recently become an issue in
extension. It entails the turning over of services typically provided by government to
private organizations. A study by Swanson et al. (cited in Umali & Schwartz, 1994)

8
showed that 81% of extension was provided by the public sector in the 207 organizations
surveyed in 113 countries. The private sector accounted for only 5% (Swanson et al.,
1990 in Umali & Schwartz, 1994). However, budget deficits are forcing both developed
and developing countries’ governments to downsize, decentralize, and move toward a
liberalized economy. Private extension is seen as one way of cutting down on the
massive public sector that has for so long characterized countries such as Kenya.
Government extension has also been criticized for many weaknesses including
inefficiencies through bureaucracy and top-down approaches where they are out of touch
with the farmers. Public organizations are seen to be wasteful of resources because they
do not have the same profit motivation as private companies. Umali and Schwartz (1994,
p. xii) encapsulate this perspective:
In view of the changing conditions facing agriculture today, coupled with the governmental and fiscal constraints faced by many developing countries, a structural transformation of the agricultural extension system is becoming increasingly essential. The public monopoly in agricultural extension provision in many countries is no longer feasible or sustainable, and a shift towards a multi-organization system consisting of the public, private, non-profit and non-governmental sectors will be vital for the effective performance of this complex task. Capitalizing on the comparative advantage of each of the different sectors will ensure the success of this endeavor.
The private sector’s profit motive for services is thought to make it more efficient.
However, this sector tends to ignore areas such as semiarid zones where there is little
chance of profit. The public sector is therefore still needed to advocate and intervene in
areas where the private sector has no interest. The key problem is that with the decrease
in government spending, it is unlikely that public-sector extension will have the means to
fully undertake the necessary support and services in the often-remote semiarid areas.
Therefore there is greater focus now on non-governmental organizations and community-
based organizations as important players in the extension scene.

9
Today in Kenya, many extension stakeholders and technology-dissemination
approaches exist, with few studies to show their effectiveness. There are still numerous
farmers who must be reached with effective technologies, however. One important need
in the new pluralistic milieu is to determine how community-based mechanisms such as
farmer-to-farmer extension works, and the role that community groups and farmers play
in extending technologies to other farmers. Knowing these mechanisms will contribute
to the effort in bringing about rural development.
With the food and environmental crisis throughout Africa, it is vital that all Kenyan
farmers receive the necessary information and inputs to make a living off their land
(Eponou, 1996). It is therefore crucial to explore all the avenues of rural development.
This includes examining the role that farmer groups play in disseminating technologies,
the mechanisms of farmer-to-farmer extension, what factors affect their success in
extension, who participates in the groups and why, and the implications of farmer-group
performance for extension policy.
If indeed farmer groups in the smallholder sector play an important role in
dissemination of appropriate technologies in Kenya, the question then becomes what
must extension and policy makers do to facilitate the smallholder sector—especially
farmer groups who are organized and already providing services—in scaling up and
therefore increasing production, addressing food security and fighting rural poverty?
This study shows the implications of farmer-group technology dissemination for
extension policy.
Study-Area Background
Meru Central District is an important smallholder agriculture district in Kenya’s
Eastern Province, covering 2,982 square kilometers (Meru Central District Development

10
Plan, 2002) (Figure 1-1). It lies between 0°3’45” north and 0°2’30” south, and between
37° and 38° east. Administratively, within the district there are 10 divisions, 27
locations, and 75 sublocations.
Meru Central lies on the equator, and is bordered by Mount Kenya on the west and
drier lowlands to the north and east. It ranges in altitude from 300 to 5199 m at the peak
of Mt. Kenya. It has nearly all of the agroecological zones of Kenya (Teel, 1985; Were,
1988).
Farmers in Meru Central District practice mixed cropping methods with maize (Zea
mays) and common beans (Phaseolus vulgarii) as the dominant farming system. Other
food crops include bananas (Musa spp.), yams (Dioscorea spp.), potatoes (Solanum
tuberosum), sweet potatoes (Ipomea batatas), sorghum (Sorghum bicolor), finger millet
(Eleucine coracana), cassava (Manihot esculenta), arrowroot (Maranta anindinacea),
pigeon pea (Cajanus cajun), lablab beans (Dolichos lablab), cowpeas (Vigna sinensis),
groundnuts (Arachis hypogaea), kales (“sukuma wiki”) (Brassica spp.), tomatoes
(Lycopersicum esculentum), onions (Allium spp.), cabbage (Brassica oleracea capitata),
pumpkins (Cucurbita spp.), sugar cane (Saccharum officinarum), avocados (Persica
americana), mangos (Mangifera indica), citrus (Citrus spp.) and papaya (Carica
papaya). Coffee (Coffea arabica), tea (Camellia sinensis), tobacco (Nicotiana tabacum),
cotton (Gossypium spp.), sunflower (Helianthus annuus), macadamia (Macadamia
tetraphylla) and pyrethrum (Chrysanthemum cinerariaefolium) are grown for cash.
Catha edulis (also called “miraa” or “khat”) is a stimulant used mostly by Somalis,
Swahili people, and in the Arab Gulf. It has been an important cash crop in wetter tea-
growing areas, such as the Nyambeni Hills in the northeast of the greater Meru area. It is

11
Figure 1-1. Meru Central District of Kenya

12
now being grown by many of the farmers in Meru Central District as well. Farmers in
the coffee zones have recently started growing it for cash with the decline of the coffee
industry.
A major feature of the farming landscape, especially in the middle and upper zones,
is the Australian tree Grevillea robusta. Apparently it was promoted for many years for
intercropping with coffee. It is very popular for all farmers, however, as a fast-growing
tree that produces good lumber. Other introduced species include Cassia and Leucaena
species, especially in the lower zones.
Livestock in the area include cattle, goats, sheep, pigs, rabbits, and chickens.
Farmers also keep bees. Livestock goods such as dairy products, meat, and hides are also
produced.
Rainfall is bimodal, falling between March and June (short rains) and October
through December (long rains). The southeastern slopes of Mount Kenya, where many
of the farms lie, receive between 1250 and 2500 mm of rainfall per year (Meru Central
District Development Plan, 2002). The leeward side of the mountain and northern and
eastern lowlands receive between 380 mm and 1000 mm annually.
Population within the district is 521,518. The growth rate is 1.48% (Meru Central
District Development Plan, 2002). Population density is an average of 167 people per
square mile. Farm size averages 1.1 hectares for smallholders. Although people are
moving to urban areas, absolute numbers of farmers in the rural areas are growing,
putting pressure on the natural resources of the district. Over 45% of the population is
classified as poor (Meru Central District Development Plan, 2002).

13
Some of the causes of poverty in Meru Central are seen as inadequate and
unreliable rainfall, unemployment, poor extension services, lack of land, collapse of the
cotton and coffee sectors, low prices for farm products and poor marketing channels
(Meru Central District Development Plan, 2002). The HIV/AIDS pandemic that is so
rampant in Africa is especially so in this area. Although it has recently dropped, the
Meru Central rate of infection was 38% a few years ago, well above Kenya’s national
average of 15%. At the Meru Central District consultative forum for the government’s
Poverty Reduction Strategy Paper, stakeholders listed inadequate extension services and
lack of extension services as two of the main problems in the district.
Dairy farming is an important economic activity in Meru, especially with the
decline of the coffee industry due to poor world market prices. Many farmers in the sub-
humid highlands of Kenya own dairy cattle or goats, and keep them in zero-grazing units.
This necessitates the growing of fodder or buying of feed for enhanced milk and meat
production. Zero grazing is a system whereby animals are kept in a stall or enclosure and
fodder is carried to them. Animals may also be managed through grazing and tethering.
However, commercial dairy meal is too expensive for many farmers to purchase, and is
perceived by farmers as unreliable in terms of quality (Daily Nation, Sunday, June 20,
2003).
Mineral fertilizers are also available, but too expensive for many farmers to afford
at the recommended rates. Because Kenya is in the process of liberalizing its markets,
there are now few subsidies on agricultural inputs. Farmers face low prices and poor
marketing channels in most of the rural areas, making farm-generated income difficult to
14
obtain. Farmers must find ways to increase production without the use of expensive
fertilizers and feeds.
The World Agroforestry Centre (WAC)
Especially for smallholders, agroforestry practices offer useful options and
alternatives to improve their farming systems. Agroforesty is the deliberate use of trees
on farms (in combination with crops, animals, or both) to meet multiple objectives of the
farmer. It is a “dynamic, ecologically based natural resources management system that,
through the integration of trees in farmland and rangeland, diversifies and sustains
production for increased social, economic and environmental benefits for land users at all
levels” (Huxley & van Houten, 1997). Many of the agricultural systems in the tropics are
(by nature) agroforestry, because of the integration of trees, crops, and animals.
However, scientists have recently begun paying attention to the benefits of agroforestry,
and much research has been conducted on the practice since the 1970s.
Smallholders have always used trees on their farms, as noted above. However,
since the introduction of structural adjustment programs in Kenya, intended by donors to
bring about economic recovery of developing countries’ economies, inputs such as
fertilizers, chemicals, seed and feeds have been too expensive for many small-scale
farmers to afford. Attention has turned to agroforestry as a means of restoring soil
fertility and providing cash income. Agroforestry has also been shown to produce good
feed for livestock. Low quality and quantity of animal feeds are a further constraint to
production within the livestock sector (Winrock International, 1992).
As a result of current smallholder constraints, various organizations have been
conducting research in agroforestry, as a possible solution to some of the problems faced
by small-scale farmers. The World Agroforestry Centre (formerly known as the

15
International Centre for Research in Agroforesty, or ICRAF) was established as part of
the Consultive Group on International Agricultural Research (CGIAR) centers in the
1980s. While the headquarters are in Nairobi, WAC also conducts research around the
world in places such as West Africa, Asia, and Latin America. Other organizations
working in agroforestry in Kenya include the International Livestock Research Institute
(ILRI), the National Agroforesty Research Project (NAFRP) of the Kenya Agricultural
Research Institute (KARI), and the Kenya Forestry Research Institute (KEFRI). Much of
this research has been focused on central Kenya, where a high proportion of small-scale
farmers reside.
Because of the need for quality feed for dairy animals, WAC and partner
organizations have been conducting research since the 1990s on Calliandra calothyrsus
Meissner (calliandra) and other agroforestry species for improving milk production on
small farms. Studies have shown that calliandra is effective as a supplement or feed for
dairy cattle (Paterson, Kiruiro & Arimi, 1999; Roothaert & Paterson, 1997), and farmers
have begun to plant and use it on their farms. Over 2600 farmers in 150 groups in central
Kenya are growing calliandra for feed (Wambugu, Franzel, Tuwei & Karanja, 2001).
Food and Agricultural Research Management (FARM)-Africa
Another introduced technology in central Kenya for small-scale farmers is the use
of improved dairy-goat breeds. The NGO FARM-Africa has been working in the Meru
area, targeting the poorest farmers in medium- and low-agricultural potential zones, by
working with over 80 self-help dairy-goat groups. The Meru Dairy Goat and Animal
Healthcare Project has been in the Meru area since 1996. The purpose of the project is to
“improve the productivity of local goats through better management and access to
sustainable healthcare and genetic improvement, and of local dairy cattle through better
16
access to sustainable healthcare systems” (Meru Dairy Goat and Animal Health Care
Phase II April 1999-March 2002 Project Review, p. 8).
Activities of the project to achieve this goal include
• Community-based breeding of local goats with Toggenburg dairy goats;
• Formation and training of autonomous self-help groups to undertake breeding activities;
• Development of community animal health care workers and a privatized veterinary and drug supply service;
• Improvement of fodder supplies through community bulking and on-farm planting of suitable fodder; and
• Development of effective extension support service through the existing Ministry of Agriculture and Rural Development (MoARD) staff and extension system.
The Project works through both existing extension and the private sector to support
small-scale farmers in the district. Through these linkages, FARM-Africa helps the
dairy-goat groups obtain loans, training, and improved bucks for breeding. The project is
estimated to benefit the welfare and income of 20,000 families in the area.
Researchable Problem
There is much discussion among the government, NGOs, and international research
centers of the increasing role that farmer groups and other community-based extension
mechanisms are playing in the dissemination of technologies in Kenya today. Many are
advocating community-based extension as a means of scaling up (Nyakuni, 2001;
Raussen, Ebong, & Musiime, 2001; Wambugu et al., 2001). However, there is little
research showing what factors make community-based groups effective, if at all, in
disseminating technologies. The researchable problem is the need to examine farmer
groups and the role that they play, and what factors make them effective in extending
technologies. If the role of farmer groups in extension could be more clearly defined, and

17
evidence found for which factors could or do affect their effectiveness, it would facilitate
technology dissemination to small-scale farmers. This information will be useful for
organizations working with farmer groups, and to the groups themselves. It can provide a
means to strengthen and guide the groups. Finally, it will provide valuable information to
policy makers.
In view of this problem, the goal of this study then was to determine the role of
farmer groups in technology dissemination, and to assess what factors make groups
effective in extending technologies among small-scale dairy-goat farmers in Meru
Central District of Kenya. The FARM-Africa Meru Dairy Goat and Animal Healthcare
Project, working with dairy-goat farmer groups, provides a good case study in which to
examine this research problem.
Purpose and Objectives
The goal of this study was to examine the role of farmer groups in technology
dissemination, and to assess what factors make groups effective in extending
technologies among small-scale dairy-goat farmers in Meru Central District of Kenya.
Specific objectives were as follows:
• Examine participation in groups and identify what factors, if any, affect participation in groups;
• Examine linkages and their outcomes, if any, between farmer groups and other extension stakeholders;
• Identify the mechanisms by which farmer groups and their members receive and disseminate information and new technologies, especially fodder shrubs and improved dairy-goat breeds;
• Identify the factors characteristic of groups successful in disseminating technology; and
• Propose policy recommendations to extension and development organizations regarding farmer groups’ roles in extension.

18
Research Questions
• Who participates in the groups, and what factors affect participation?
• What linkages, if any, exist among farmer groups and other extension players?
• What are the mechanisms, if any, within and outside of the groups for giving and/or receiving information and technology?
• What factors affect the success of farmer groups in disseminating technology?
• What are the implications of farmer-group dissemination for extension policy?
Assumptions
Several assumptions were made in this study. One was that rural development
(through means such as extension) was something that was desired by all of the
stakeholders involved. Another assumption was that factors that affect the success of
farmer groups in disseminating technology were measurable and valid. One way to assist
with this was to state the operational definition of terms of the study (see below).
Furthermore, it was assumed that respondents were forthright in their responses.
Operational Definition of Terms
Adoption. Use of a new technology or technique by farmers, in any amount, and
for any length of time1.
Agroforestry. Deliberate use of trees on farms (in combination with crops,
animals or both) to meet multiple objectives of the farmer.
Dissemination. The spread of information and technologies through various
means of communication.
1 World Agroforestry Centre defines adoption of fodder shrubs as having expanded once and having over 100 trees, for dairy cattle. For this study, farmers, extension agents, and FARM-Africa personnel referred to “adoption” as the use of a technology without specifying quantity or time. Thus, the definition used in the study is operationalized for the study purposes and in line with the perspectives of study participants.
19
Extension. The process of sharing information and technologies among various
development stakeholders.
Group. A local organization of people who have banded together to take
advantage of social capital.
Fodder tree. A tree or shrub that is used to feed dairy animals. The fodder is
often cut from the tree and carried to livestock.
Leadership. Role played by various people (within the group context) to provide
guidance, motivation, and management.
Linkage. An entity (organization, person, group) that has some sort of connection
or relationship with dairy-goat groups for any purpose.
Location. An administrative level below the district level, and above the village
level. Used also as an adjective (locational).
Scaling up. Strategies that lead to an enlargement of program size.
Small-scale farmer. Rural person who makes a livelihood from less than two
hectares of land.
Social capital. Norms and networks that enable collective action (the management
of resources by groups).
Success. The determination by a group, individual or organization that a group has
effectively disseminated information and/or technology. For this study, success was
determined through variables such as self-ratings of the groups themselves and outside
entities on perceived success in dissemination, number of neighbors adopting
technologies, number of farmers and groups trained, and number of buck services.

20
Technology. An idea, practice, or object used and/or promoted to improve
agricultural production (adapted from Rogers, 1995).
Limitations of the Study
Several constraints may have limited the study. Factors such as geography, tribal
identity, history, and gender may have affected both group performance and the role that
groups play in disseminating technology.
Language, culture, and gender may have also biased or complicated the findings.
This may have occurred not only with the North American researcher, but also with
assistants and extension observers who were possibly different from the farmers through
gender, culture, economic situation or education. Personal bias may have affected
interviews. Finally, many of the questions on the questionnaires dealt with perceptions of
farmers, and so have the possibility of bias on behalf of the respondents. The researcher
attempted to avoid these issues through
• Awareness of and attentiveness to potential bias;
• Use of trained assistants to help with the interviews and to provide input and interpretations;
• Triangulation through research design and data sources, such as interviewing various extension players, including individual farmers, groups, and government and non-government extension personnel;
• Establishing of a record trail of data obtained;
• Use of local languages; and
• Attention to both who is being interviewed and who is not.
Significance of the Study
Agriculture is the backbone of many African economies, yet many development
obstacles prevent improved agricultural production from increasing the standards of

21
living and decreasing poverty in rural areas. Key to sustainable livelihoods is the
opportunity for farmers to obtain and share useful information and technologies for their
farming systems. For decades now, extension has been attempting to increase production
through the provision of such information and technology. Only recently, however, has
the focus been on the needs of the farmers themselves, and their empowerment through
participatory methods of technology development and dissemination. If “farmers are the
owners of development” (Barkland, 2001), then only by facilitating their methods and
priorities can development organizations truly make a dent in the obstacles to their goals.
This study is important because it recognizes the crucial role that smallholders play
in the technology development process, and attempts to portray the role that farmer
groups play in disseminating technologies, what factors affect their success in doing so,
who participates in the groups, reasons for participation and the mechanisms of farmer-
led extension. Providing evidence on what role groups play and what factors affect their
performance can help to strengthen groups and to guide outside organizations in
facilitating and collaborating with groups (Place et al., 2002).
This study will be of significance to the many organizations working with small-
scale farmers in Kenya. It can also assist groups in reaching their goals, and in becoming
more effective. Finally, the study will have implications for extension systems in similar
regions.
Organization of Thesis
This chapter has given a brief introduction to the particular problems faced by
smallholder farmers in Kenya, and to projects working in Meru with these farmers.
Chapter 2 is a literature review of theories and studies related to agricultural extension,
social capital and farmer groups. The third chapter presents the research design, methods

22
used and procedures followed to collect data. Chapter 4 presents the results of the study
with regard to the first four objectives, and Chapter 5 contains the conclusions and
recommendations of the study. Instruments used are included in the appendices.
CHAPTER 2 LITERATURE REVIEW
Coming together is a beginning Keeping together is progress Working together is success
—Henry Ford
It was shown in Chapter 1 that agricultural extension is an important component of
rural development. A brief description of extension was given, along with an overview
of extension’s role in Kenya and its status today. Extension has evolved over the years to
meet the changing needs of its clients, to become more effective, and in response to
economic and environmental realities present in various countries. A description of this
evolution in Kenya is presented in this chapter, detailing the move from the top-down,
transfer of technology model to the so-called “farmer first” methods. The chapter goes
on to discuss social capital and group theory, which are important factors in extension in
Kenya today.
Extension History and Models in Kenya
Introduction
To meet the challenges of development, bring about rural improvement and address
farm constraints such as those faced by farmers in Kenya, agricultural research and
extension have been used for decades to advance the rural sector in nearly all countries.
In the previous chapter, the World Bank defined extension as “the process of helping
farmers to become aware of and adopt improved technology from any source to enhance
23

24
their production efficiency, income and welfare” (Purcell & Anderson, 1997, p. 55). It is
important how extension is defined because that in turn affects how it is conducted.
Extension has traditionally been defined as the delivery of information and
technologies to farmers (Moris, 1991). This leads to the technology transfer model of
extension, seen by many as the main purpose of agricultural extension (Moris, 1991).
This is based on the idea that “modern” knowledge and information is transferred through
extension agents to recipient farmers.
The conventional provider of extension, the state, has typically used top-down,
“transfer of technology” (TOT) methods for extending new technologies. Top down
methods characterized the United States extension model, which was instituted by many
colonial governments in Africa. In the TOT approach, technologies are generated at
research stations and diffused to farmers using the extension service (Put, 1998). Not
only technologies but also intangibles such as power, prestige and skills are located at
these centralized stations (Put, 1998). Technologies are spread vertically in this top-
down approach. The TOT approach is often biased toward better-endowed farmers
whose fields and infrastructure are more like those of the research stations (Chambers &
Ghildyal, 1984).
Early extension models in Kenya therefore followed a “cookbook” approach to new
technology through state extension services (McMillan, Hussein & Sanders, 2001, p. 1).
Technologies were developed at the Ministry of Agriculture and run through the
extension pipeline via extension agents to farmers, with agricultural development being
the desired product. Farmers were not much involved in the development or
dissemination of technology. Research and extension were focused mainly on large-scale
ment 25
farms or those smallholders living in high and medium-potential areas, and trials and
demonstrations were mostly on research stations. This approach began during the
colonial era and continued into the 1980s.
Diffusion of Innovations Theory and Transfer of Technology
Transfer of technology approaches are strongly linked to the diffusion of
innovations philosophy. Diffusion of innovations theory says that technologies are
communicated over time among the members of a social system, and adopted according
to various characteristics of both the technology and the user (Rogers, 1995). The
diffusion of innovations model was focused on a very linear process of technology
development. Rogers’ model has been critiqued for this and for other shortcomings, such
as the pro-innovation bias, blame of farmers for “non-adoption” of technologies, lack of
recognition of farmer innovations, and focus on the change agency/change agent instead
of the ultimate end users of technology (the farmers).
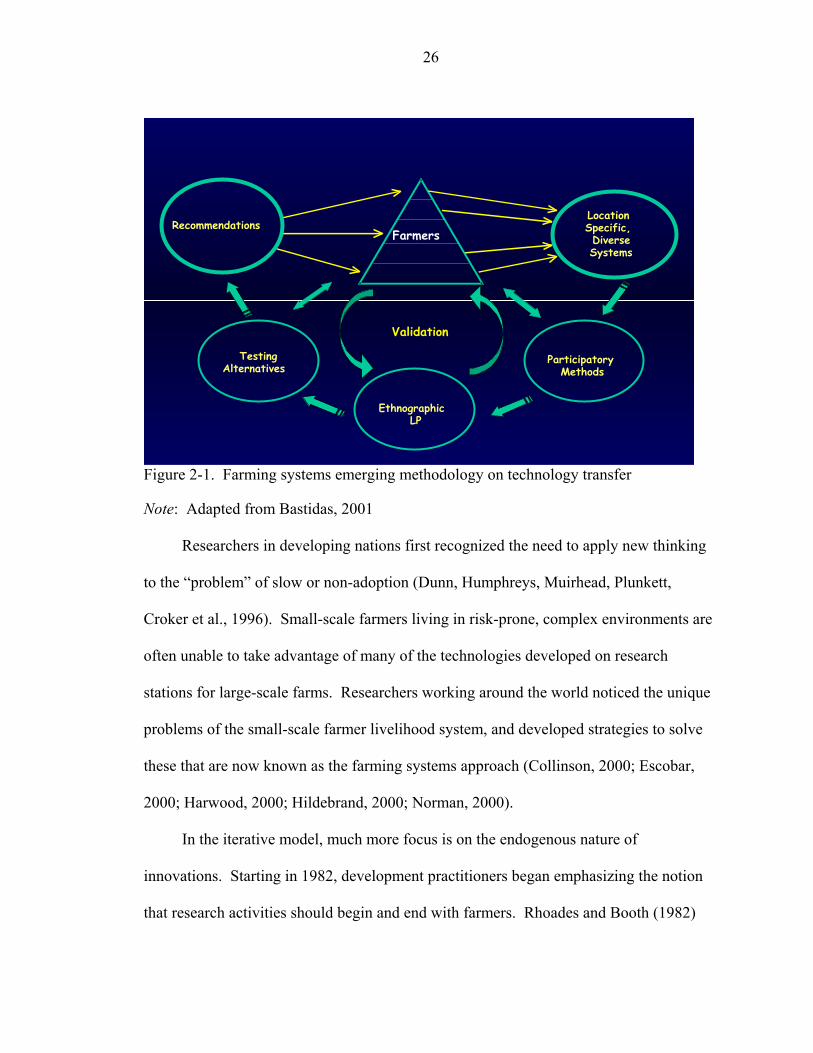
More recent thinking has developed models that are more iterative, dynamic, and
cyclical in nature (Figure 2-1). Rogers himself moves away from linear technology
transfer with the convergent model in the latest version of his theory on the diffusion of
innovations (Rogers, 1995).
The theory of innovations and related transfer-of-technology model has tended to
work better in developed rather than developing nations, but even within developed
nations, the perceived process has evolved into the more iterative model. The linear
model originally proposed by Rogers works better when there are limited
recommendation domains for the technology. Technologies can then be recommended in
“blanket” form.
26
FarmersLocation Specific, Diverse Systems
Recommendations
EthnographicLP
Testing Alternatives Participatory
Methods
Validation
Figure 2-1. Farming systems emerging methodology on technology transfer
Note: Adapted from Bastidas, 2001
Researchers in developing nations first recognized the need to apply new thinking
to the “problem” of slow or non-adoption (Dunn, Humphreys, Muirhead, Plunkett,
Croker et al., 1996). Small-scale farmers living in risk-prone, complex environments are
often unable to take advantage of many of the technologies developed on research
stations for large-scale farms. Researchers working around the world noticed the unique
problems of the small-scale farmer livelihood system, and developed strategies to solve
these that are now known as the farming systems approach (Collinson, 2000; Escobar,
2000; Harwood, 2000; Hildebrand, 2000; Norman, 2000).
In the iterative model, much more focus is on the endogenous nature of
innovations. Starting in 1982, development practitioners began emphasizing the notion
that research activities should begin and end with farmers. Rhoades and Booth (1982)

27
coined the term “farmer-back-to-farmer.” Chambers developed this into the “farmer-
first” philosophy (Chambers, 1990, as cited in Dunn et al., 1996). Along with these were
the “putting people first” (Cernea, 1985) and “farmer participatory research” models
(Farrington & Martin, 1988, as cited in Dunn et al., 1996). The linear model does not
show the many innovations that come from sources other than formal research. Roland
Bunch (1985) and many others (described in Haverkort, Van de Kamp & Waters-Bayer,
1991) have shown that farmers are experimenters.
Current dissemination thinking takes a much more participatory, farmer-centered
approach than the diffusion of innovations theory. Farmers are involved in every aspect
of technology generation, from generation to testing to dissemination. However, it has
not always been this way. Much of the history of extension in Kenya is beset with
examples of top-down, transfer-of-technology models of technology dissemination, many
following the theory of diffusion of innovations.
The 1960s Top-Down Approach: State Transfer of Technology Model
During the colonial period the state extension service developed into a major
service provider for large-scale colonial farmers. After independence in Kenya, the state
continued be the major actor in agricultural extension for the first twenty years (Schwartz
& Kampen, 1992) (see Table. 2-1). The colonial extension had used a regulatory and
commodity approach (Kandie, 1997). Following independence, the government
instituted a more general approach, based on the U.S. extension system and with funding
from the U.S. Agency for International Development (USAID). This approach assumes
that agricultural ministries have useful information for farmers, and extension’s job is to
transfer this to farmers (Schwartz & Kampen, 1992). USAID promoted new technologies
through demonstrations, technical packages and information.

28
At the same time, the commodity extension approach was still used for both small
and large-scale farmers. The commodity approach has been one of the most enduring
approaches used for extension in Kenya. It was successful in disseminating hybrid maize
technology, which was developed in Kenya around 1955.
In the late 1960s, the Ministry of Agriculture adopted a farm management approach
to extension (Gautam, 2000). This was initiated as part of a credit program for farmers.
The Ministry started the Farm Management Division at the same time to run the credit
program.
Table 2-1. Early extension approaches strengths and weaknesses Type of extension
When adopted
Strengths
Weaknesses
Regulatory, commodity
Colonial period, 1945-1963
Good management, effective for resource-rich
Top-down, ignores smallholders, coercive
General Early independence, 1963
Focus on whole family, increased participation
Top-down, poor management and linkages
Farm management
Late 1960s Provides inputs, management skills
Unsustainable, focused on credit
Integrated 1976 Provides inputs, holistic Lack of training and
linkages; top-down
The 1970s Holistic Approach: Integrated Rural Development Projects and Farming Systems Philosophy
During the 1970s, donors began to place an increasing emphasis on the poverty of
rural people, and the Integrated Rural Development Project (IRDP) was started in Kenya
in 1976 with World Bank support, using an integrated extension approach. The IRDP’s
goal was to build institutional infrastructure and to provide inputs to farmers to increase
production (Moris, 1991). These inputs included extension, research, irrigation, credit,
roads, water, electricity, and sometimes schools and health centers (Venkatesan &

29
Kampen, 1998). The focus was mainly on technical aspects, however, and left out crucial
issues such as training, linkages with research, and management. Integrated Rural
Development Projects are seen to have failed mainly due to lack of sustainability,
administrative problems, a top-down approach, and failure to build local capacity
(Venkatesan & Kampen, 1998).
There was concern by donors during this period that developing countries were at
risk of famine due to shortages of major staples. Many thought that agricultural research
would help address this issue (Hansen & McMillan, 1986). The same time period
coincided with the first activities of the Rockefeller and Ford-funded international centers
in Africa, and the World Bank consultive groups on agriculture in individual countries.
The international community decided to create an organization for international
agricultural research, and the Consultative Group on International Agricultural Research
(CGIAR) was launched in 1971 (CGIAR web site, available at
http://www.cgiar.org/who/wwa_history.html). It established International Agricultural
Research Centers (IARCs) around the globe, many of which provided research on food
crops.
One of these CGIAR centers was the International Maize and Wheat Improvement
Center, CIMMYT, which established a branch in Kenya. This was one of the
organizations that, during the 1960s and 1970s, gave greater emphasis on smallholder
farmers and their livelihood systems, as researchers realized that such people were not
being reached effectively with the traditional extension approaches. They thus began to
use what is known as the farming systems approach to research and extension. In Africa,
this was initiated through the work of Michael Collinson with CIMMYT (Collinson,

30
2000). Farming systems is a holistic type of approach that looks at the entire farm as a
system with various subsystems. It provides for greater dialog with and input from
farmers, and for enhanced linkages between research, extension and farmers. This model
was marked by participation at the farm level (through farmer input on research and on-
farm trials) and by interdisciplinary linkages and a systems approach to extension.
The farming systems approach (Norman, 2002) was characterized by
• A holistic approach viewing the farm as a whole; • Involvement of farmers and their priorities; • Research reflecting the various subsystems’ interactions and linkages and • Reliance on informal surveys or “rapid rural appraisal” (RRA). The 1980s Training and Visit Approach: Expanding the State Extension Service
During the 1980s, state extension systems in developing countries were further
altered, due to recognition of the need to reach more farmers and to better train extension
agents. The Training and Visit (T&V) system was a model that was instituted by the
World Bank in Kenya in the early 1980s (Gautam, 2000). The National Extension
Project (NEP I) of Kenya was the World Bank-funded T&V extension approach.
The T&V system was designed to address some of the weaknesses in the previous
extension approaches, such as weak linkages with research and low training of field
extension workers. It was introduced as a pilot project in two districts in Western Kenya
in 1982, and expanded to cover 30 districts by 1983. The objective of NEP I was to have
sustained increases in agricultural production in 30 of Kenya’s 41 districts, all medium-
and high-potential areas. National Extension Project I was also to promote institutional
development within the extension service (Gautam, 2000).
As its name suggests, the basic premise of T&V was training (instilling
professionalism in extension agents) and regular visitation of farmers by the agents.

31
Extension agents were to be trained in new technologies every two weeks. Under the
T&V system, subject matter specialists advised extension agents, and also provided a link
between extension and research. They provided monthly workshops where field
extension workers are trained. The agents then took these techniques to the farmers for
two weeks before returning for further training. Farm families were divided into groups,
with five to ten contact farmers per group. These contact farmers were to provide a
multiplier effect.
The second National Extension Project, NEP II, a continuation of NEP I, was
started in 1991. The second project’s objective was to increase smallholders’ incomes. It
sought to reach lower-potential areas and more marginalized farmers, and to further
improve links with research. NEP II expanded extension coverage to 40 of the now 45
districts, including some of the previously ignored semi-arid zones.
There are conflicting reports on the effectiveness of T&V in Kenya, which give
insight into the difficulties of measuring the impacts of extension. Bindlish and Evenson
(1997) performed an econometric review of T&V extension in Kenya and Burkina Faso.
Their study claimed high returns to extension through T&V. On the other hand, Gautam
(2000) reported limited impact of T&V extension in Kenya in a review of NEP
commissioned by the World Bank Operations Evaluation Department (OED). The OED
concluded that NEP I had some beneficial aspects but several operational deficiencies,
and was not financially sustainable (Gautam, 2000). Following discussions with the
Africa Region of the World Bank, the final rating of the NEP outcome was “marginally
satisfactory” (Gautam, 2000).
32
Whatever the arguments, there are indications that T&V had many shortfalls.
Some feel that T&V focused so much on training that the system lost sight of the goals of
meeting farmers’ needs and improving their livelihood. It was essentially a supply-
driven and top-down system, promoting agricultural messages that had been designed and
developed by research scientists, with limited input by the ultimate users of the
technologies (the farmers). The delivery method was perhaps efficient, but the messages
often irrelevant, according to farmers surveyed (Gautam, 2000). At the end of NEP II in
1998, the extension service was characterized by weak management, a lack of strategy
for the service, and general ineffectiveness (Gautam, 2000).
T&V, like the general extension approach, was characterized by limited feedback
from farmers. The packages were somewhat mechanistic, and not flexible enough to
meet the needs of Kenya’s variety of farming systems. Training and Visit relied on
contact farmers, and tended to neglect the larger rural population (Moris, 1991). In NEP
I and NEP II, there were no real mechanisms for choosing contact farmers who truly
represented many of the farming systems in the areas. The hierarchical structure set up
by the Bank prevented innovation, partnering, and efficiency. Despite a supposedly
improved system, farmers before and after NEP said they were not receiving advice from
extension, or else not the advice that they needed (Gautam, 2000).
An important factor in agricultural technology development and dissemination
during the 1980s and 1990s was structural adjustment programs (SAPs). The World
Bank and the International Monetary Fund introduced SAPs to help address some of the
economic crises that were facing Kenya and other developing nations. The 1980s had
brought about economic hard times to many developing countries, when the high price of

33
oil coupled with drought led to growing foreign debt. Also contributing were the
excessive growth of parastatals in African nations and declining prices of primary
products (Sanders, Shapiro & Ramaswamy, 1996).
Constraints to development in African countries were seen to be in four main areas:
budget deficits, over-centralized governments, recurrent personnel costs in bloated
bureaucracies, and declining administrative capacity (Cohen, 1993). The highly
centralized government led to much inefficiency and corruption. Over half of Kenya’s
employed population worked in the public sector. Government expenditures escalated
mainly due to the large growth in the public sector and debt service. One of the main
ways to cut down on expenditures was therefore to reduce government employment.
Donors instituted structural adjustment programs in Kenya to address budget
deficits and kick start the ailing economy. These programs included reduction of the civil
service, liberalization of markets and pricing policies, reforms of parastatal organizations
and removal of foreign exchange controls (Cohen, 1993; Ikiara, Jama & Amadi, 1992;
Sanders et al., 1996). The bloated civil service was to be reduced while privatization was
encouraged. The hope was that these steps would bring about more economic growth by
liberalizing marketing and pricing policies and reducing state control. The free market
was seen by pundits to be the best way to efficiently allocate resources (Ikiara, et al.,
1992).
Structural adjustment programs played a large role in technology dissemination and
growth during that period. Although SAPs were expected to adversely affect the urban
population, who would now have to pay more for food, the smallholders among the rural
areas were affected negatively as well. In the long run, SAPs were meant to increase

34
incentives to farmers, expand private investment, improve economic efficiency, improve
trade balances and develop appropriate energy sources (Sanders et al., 1996). They
aimed to encourage the private sector by reducing the size of the civil service.
However, although product prices were increased, privatization of the input
suppliers meant that smallholders no longer obtained subsidies on fertilizers and other
inputs. With the cost of inputs dramatically increased, SAPs reduced the smallholder’s
ability to purchase inputs such as chemical fertilizers when the government stopped
subsidizing them. Growth in the private sector has not made up for the SAP-induced
reductions in the public sector (Sanders et al., 1996).
Extension funding was reduced more and more during the 1980s and into the 1990s
due to the continuing economic crisis and the structural adjustment programs which
encouraged state downsizing. As the Kenyan government failed to recover from the
budget deficits so prevalent in the 1980s, it became obvious that they could no longer
fund T&V and other expensive extension models. There were limited funds for
operational costs, and most of the funding (80%) tended to go toward personnel. It was
therefore difficult to reach their clientele since there were no funds to fix vehicles or pay
for fuel to get to the field.
The 1990s Pluralistic Approach: Community-Based Farmer-Led Extension
Although state extension once played a major role in Kenya, the paradigm for
research and extension has been changing extensively over the past decade. The state
extension service has recently gone through major changes and disintegration (Kandie,
1997; Omolo, Sanders, McMillan & Georgis, 2001). Once totally state-run, extension in
Kenya is now conspicuous by the heavy role and increasing diversity of non-
governmental actors. The outcome of the economic crises and structural adjustment
35
programs in the 1980s was a search for other potential extension actors within the
extension domain during the 1990s. Many stakeholders began calling for a pluralistic
(multi-provider) extension model, in which the state takes on the role of facilitator for the
many other actors involved in extension such as non-governmental organizations,
farmers’ groups and private extension (Gautam, 2000; McMillan, Hussain & Sanders,
2001; van den Ban, 2000).
Because farmers are already receiving information and technology from a range of
sources from other farmers to private agro-business to the public government extension
system, Zijp (2002) calls for the promotion of pluralistic extension approaches. The
World Bank is now also promoting pluralism in extension in Kenya (Gautam, 2000).
This pluralistic type of system is meant to contribute to flexibility and complementarity
of extension systems, and meet the diverse needs of a wide range of farmers (Crowder,
1996).
Farmer-Led Extension
Not only in Kenya, but in many countries today, extension is marked by
partnerships between various agencies such as the state, private companies, non-
governmental organizations, and farmers’ groups. These partnerships and linkages are
seen as necessary to both cut costs and to involve all of the stakeholders in the extension
process. In such “coalition systems” of extension, the various stakeholders acknowledge
the role and skills of other partners, and are strengthened by alternate perspectives and
expertise (Anderson & Crowder, 2000). Multi-partner interaction promotes mutual
learning and innovation. Coalition systems can be flexible and provide a system of
checks and balances (Anderson & Crowder, 2000).

36
Extension systems today are characterized by approaches placing greater emphasis
on farmers playing a central role in the technology development process. The new
approaches collectively might be called farmer-led extension. The farmer-led model for
extension in developing countries is designed to be participatory, demand-driven, and
client-centered. This approach essentially evolved from the farming systems and similar
approaches, with a greater emphasis on the needs of resource-poor farmers, gender, and
the value of indigenous knowledge systems. Many researchers have described such
farmer-centered extension systems, including Chambers (1997), Esman & Uphoff (1984)
and Payson, Ganpat, Hartmann, Peters and Place (2004). Scarborough, Killough,
Johnson and Farrington (1997) describe farmer-led extension as
a multidirectional communication process between and among extension staff and farmers involving the sharing, sourcing and development of knowledge and skills in order to meet farming needs and develop innovative capacity among all actors, in which all farmers have a controlling interest; are “centre stage”, are the protagonists and play a key role in technology development and delivery; and involving farmers in training other farmers and trainers, and in sharing, sourcing and transferring knowledge and skills. (p. 4)
The philosophy in farmer-led extension is very different in its view of farmers and
scientists, when compared with the TOT model (Table 2-2). It is a “bottom-up”
approach. It sees farmers as part of the entire process of technology generation,
providing essential input and assisting in the design and evaluation of new technologies.
These models both begin and end with the farming family and the livelihood system. The
farm, not the research center, is the central location to the model. Scientists work closely
with farmers in this type of extension. It is believed that a farmer-led approach will
generate more appropriate technologies to farmers in low-resource areas.
Farmer-led extension models began showing up among non-governmental
development agencies that sprang into action at the reduction of many government

37
services in the 1980s and 1990s. Non-governmental organizations and community-based
organizations (farmers’ groups) are playing a key role in extension around the world
today. “Farmer-led approaches to extension are spreading . . . and farmers’ associations .
. . are contributing handsomely to the diffusion of modern technology” (Picciotto &
Anderson, 1997, p. 6).
Table 2-2. Philosophy of transfer of technology (TOT) and farmer first TOT Farmer First Diffusion of technology
Top down Bottom up
Farmer’s role
Beneficiary Client; colleague
Scientist’s role
Technology generator Consultant; collaborator
Extensionist’s role
Deliver technology and demonstrate
Facilitate and network
Determination of research priorities
Perceptions of scientists Perceptions and needs of farmers
Main research location
Research station Farmers’ fields
Explanation of non-adoption
Failure of farmer to learn, farmer’s constraints
Failure of technology and of scientists
Note: Adapted from Chambers & Ghildyal, 1984; Scoones, 1996; Scoones & Cousins, 1996
Extension is being called upon to engage communities more and to work with
them. Extension then is given a wider mandate than simply transfer of technology, one
that includes farmer mobilization, education, and organization (Zijp, 2002). Involving
the community in extension is one way for such engagement to occur.
By working through community groups, development agencies are more free to
focus on training and provision of materials, while community groups can be more
involved with planning, mobilization, and facilitation (Raussen, Ebong & Musiime,
2001). Such empowerment leads to a sense of ownership and contributes to more

38
effective programs. Community groups give development agencies entry points for
understanding village problems (Noordin, Niang, Jama & Nyasimi, 2001). Such groups
allow development agencies to build on existing social capital, therefore accelerating and
enhancing impact. It is a way to reach many in the community, including the poor
(Noordin et al., 2001).
Community-based extension mechanisms have both advantages and disadvantages.
One obvious advantage of state extension, of course, is a source of funding for such
outreach. Private extension players also have the funds for outreach. What options, if
any, do farmer-led extension mechanisms have? One option is contracting out, where the
public sector uses funds to contract NGOs, community-based or private extension
providers (Anderson & Crowder, 2000). Also, farmers and their groups are willing to
help shoulder the cost of extension, according to some studies. Gautam (2000) found in
his survey of T&V extension in Kenya that farmers were willing to pay a certain amount
for extension advice. In Nigeria, Apantaku, Fakoya and Sodiya (2002) found that many
stakeholders, including farmer groups, were willing to help fund extension. This
included community-based associations, religious organizations, non-governmental
organizations and farmer groups. Research conducted by Bebbington, Merrill-Sands and
Farrington (1994) and Ashby and Sperling (1994) corroborates this view.
Another concern with farmer-led extension is sources of information and new
technologies. The sources of new information and technologies remain diverse in
farmer-led extension. Previous TOT extension methods focused on the research station
and scientists as the key source of knowledge. Farmer-led extension is better adapted to
the newer thinking that embraces all sources of knowledge including farmers themselves.
39
The international research centers in Kenya today are focusing on participatory research
where farmers are heavily involved in research, almost all of which is on farmers’ fields.
Community-based extension does not stand on its own, but is yet one more
opportunity in the basket of options for development practitioners and policy makers to
use in bringing about rural development. Utilizing farmer groups or any other alternative
vehicle for extension of technologies does not negate the need for the state to remain
involved. Government extension is still needed (Rivera & Alex, 2004). However, with
the new pluralistic approach, other actors such as community-based mechanisms are
playing a larger role.
In conclusion, based upon both the farmer first approaches and the current
government budget deficits, community-based extension mechanisms are one of the most
promising means of scaling up, or extending, technologies. In order for effective
dissemination to take place, development players now view approaches using extension
by farmers and farmer groups as most appropriate to effectively and sustainably transfer
technologies to smallholders (Cooper & Denning, 1999). This type of farmer-led
extension looks to the communities to mobilize themselves to determine their own
problems and priorities in development, and to form groups to address their community
concerns. Because of the millions of small-scale farmers in the area, every farmer cannot
be reached by formal extension services. Therefore one of the major ways to bring about
development is to build capacity and empower communities to extend technologies.
Social Capital
To better understand community-based extension mechanisms such as farmer-led
approaches, it is necessary to examine social capital. Social capital is a construct that has
been viewed recently by many development players as an overlooked yet important factor

40
in rural growth (Grootaert, 2001; Pretty & Ward, 2001). It joins other forms of capital
that also play a role in development—natural, physical and human capital. Some claim
that social capital has been a missing link in development, and that by paying attention to
it development can better be achieved (Pretty & Ward, 2001; Robinson, Siles & Schmid,
2002).
There are many definitions of and theories about social capital. Grootaert (2001)
defines social capital as the internal social and cultural coherence of society, or the norms
and values that govern interactions among people and institutions. Robinson et al. (2002,
p. 5) define it as “a person or group’s sympathetic feelings for another person or group.
Sympathetic feelings may include admiration, caring, concern, empathy, regard, respect,
sense of obligation or trust for another person or group.”
The World Bank has a program called the Social Capital Initiative. It defines social
capital as “the norms and networks that enable collective action” (the management of
resources by groups). According to the World Bank, “increasing evidence shows that
social cohesion — social capital — is critical for poverty alleviation and sustainable
human and economic development” (World Bank, 2003).
Both narrow and broad conceptions of social capital exist. The most narrow, put
forth by Putnam (1993, in World Bank, 2003) sees it as the horizontal networks among
people. His view of social capital is at the micro level. Coleman, on the other hand
conceived of social capital as having both horizontal and vertical associations (1990, in
World Bank, 2003). Vertical links are hierarchical and have power differentials. Social
capital, in Coleman’s view, is more of a meso-level view. The even more encompassing
41
macro level involves political aspects and formal institutions such as the court system in
its view of social capital.
According to social capital theorists, there are two basic types of social capital:
structural and cognitive. The structural type involves information sharing, and collective
action through established roles and social networks (Uphoff & Wijayaratna, 2000).
Structural capital is easier to observe and quantify. Cognitive social capital, on the other
hand, is more related to shared norms, values, trust, attitudes, and beliefs (Uphoff &
Wijayaratna, 2000). Cognitive social capital is more of a subjective concept and is harder
to measure and quantify.
Although some argue that social capital has changed in Africa as a result of
capitalism and structural adjustment, collective action is still important among farmers.
Hoon2 (2002) describes the transformation of labor arrangements in the Eastern Zambia
from more egalitarian “horizontal” relationships such as collective labor arrangements to
more vertical relationships determined by the labor market or patron-client relations.
Traditional communal labor arrangements (kalimalima) have declined, while more
individualized labor agreements (ganyu) have increased. This is a result of the
increasingly monetized and individualistic relationships brought about through both the
growth of capitalism and structural adjustment programs. In response, collective action
among farmers has changed and adapted components of both the more traditional labor
practices and more modern capitalist practices. Three new types of collective labor
arrangement since the 1990s are known as “group ganyu,” “Kalimalima-in-clubs,” and
2 Hoon, P. (2002). Balancing labor market demands with solidarity networks: Changes in labor mobilization in eastern Zambia. Paper presented for the Department of Political Science and Center for African Studies, University of Florida, Gainesville

42
“neo-Kalimalima.” These types of institutions are known as syncretic, and “blend rules,
habits, or norms of an earlier time with modern institutions” (Hoon, 2002, p. 22).
Therefore social capital may have changed, but still exists strongly in African rural life.
There are many studies on social capital and its effects on people in rural areas.
Does it really contribute to rural development? How can development agencies capitalize
on social capital? Following are the findings of various studies on social capital.
One important finding on social capital was Krishna’s 2001 study in India. He
found that having a high level of social capital was not necessarily correlated with high
development performance. However, once a capable agency was added to high social
capital, high performance was achieved. This points to the value of linkages between
local social capital such as community groups with outside agencies such as extension,
NGOs and local research organizations.
Other researchers found a positive relationship between income and social capital.
Narayan and Pritchett (1999) found that social capital was positively correlated with
increased incomes. Because they were studying farmers who did not necessarily make a
measurable income, they used expenditures as a proxy for income, and found that
increased social capital led to increased expenditures. In fact, a one-standard deviation
increase in social capital led to increases in incomes of all households by about 50%
(Narayan & Pritchett, 1999). Furthermore, they found that adoption of improved
practices was positively correlated with social capital. Narayan and Pritchett argue that
social capital is just as important to households as many other factors such as schooling,
distance to market and gender of household head. They believe that social capital is an
important missing dimension of poverty analysis.
43
The World Bank Local Level Institutions (LLI) study on social capital was
conducted in Bolivia, Burkina Faso and Indonesia (Grootaert, 2001). In line with
Narayan and Pritchett’s 2001 study, Grootaert found that social capital contributes to
welfare. Because poor people do not necessarily have an income, both these studies
examined expenditure as a proxy for income. They also examined asset accumulation.
Increases in social capital led to increases in expenditure and other welfare indicators.
Gugerty and Kremer (2002) examined the question of whether development
assistance helped to build social capital. They found that outside funding had no effect
on social capital formation in a study of three development projects in western Kenya.
Their paper suggests that social capital is not easily created, and that many organizations’
goals of increasing social capital through funding may be limited. The paper does not
discuss the historically strong role of social capital in rural Kenya.
There are also studies on the role of heterogeneity in social capital. Groups may be
heterogeneous on many variables, such as age, gender, tribe and wealth level. Varughese
and Ostrom (2001) found that heterogeneity was not an important predictor of outcomes
in collective action such as farmers’ groups.
Farmer Groups
One of the most promising means of scaling up technologies in the new pluralistic
extension environment is through social capital in the form of community-based
extension mechanisms. Social capital in the form of groups is used in communities
worldwide, especially in rural areas, as safety nets to cope with risks and for mutual
assistance. Groups are valuable as a form of collective action to farmers, providing
resources such as credit, labor and information. Groups allow farmers to obtain new
technologies, benefit from economies of scale, enter into stable relationships with
44
suppliers, and set rules for natural resource management (Place et al., 2002; Stringfellow,
Coulter, Lucey, McKone & Hussain, 1997). Donors are seeing the value of farmer
groups, such that they are sometimes a prerequisite for various agricultural projects
(Stringfellow et al., 1997).
Role of Farmer Groups in Extension
Farmer groups have played an important role both in the community and in
extension, and now appear to be taking on an even larger role. It is known that farmers
transfer knowledge and technologies to each other (Arbab & Prager; 1991, Gubbels,
1991; Maseko, Scoones & Wilson, 1991). Maize was spread throughout the African
continent long before any formal extension was in place. Rhoades and Booth (1982)
argue that farmers are beneficial sources of information and practices for other farmers.
In Kenya, the major source of agroforestry germplasm was other farmers, according to a
study in 1998 (Edouard, 1998). Farmers obtained germplasm from their own farms,
relatives and neighbors. Over 39% of the farmers interviewed exchanged agroforestry
germplasm with other farmers (Edouard, 1998).
Groups are considered by both the Kenyan government and donors to be vehicles
and entry points for new technologies and training for farmers. Extension workers in
Meru Central District find that their work is easier to handle when they deal with groups.
Groups can be a powerful tool for extension, especially because they present an efficient
way for extension staff to pass on information and technologies. The current Kenyan
extension program, National Agriculture and Livestock Extension Programme (NALEP),
encourages what are called “common interest groups.”
Within a group context, one resource person can be trained, who will then be
empowered to pass on the information to the group. Groups are believed to extend

45
technologies faster than individual farmers. They have also been found to support fellow
members in adoption (Phiri et al. 2004). In the FARM-Africa project, 78% of the project
beneficiaries were said to be non-members of the FARM groups (Mutia, P., FARM-
Africa Meru Tharaka Nithi Dairy Goat and Animal Healthcare Project Progress Report,
January to June 1999). They were benefiting because of dissemination of information
and technologies by the dairy-goat groups, especially at the buck stations.
Farmers have some comparative advantages over what are seen as the more
conventional extension agents. Because they have similar circumstances, usually speak
the same mother tongue and have comparable educational backgrounds, farmers can
communicate well with and are trusted by fellow farmers. Farmer extensionists are able
to reach more people in a more timely fashion than regular agents (Nyakuni, 2001).
Farmers can be trained to lead community-based extension (Cooper & Denning, 1999), or
farmer exchanges can be facilitated in order to share information. Farmer Trainers are
already being educated in areas where the World Agroforestry Centre is working, since
they can effectively pass technologies on to fellow farmers (Cooper & Denning, 1999).
Farmer groups can be facilitated to network with other groups, forming strong farmers’
associations and giving farmers a voice with which to educate other farmers and to
demand services.
Along with advantages, farmers or community-based mechanisms of any kind have
some obvious disadvantages as extension players. They do not have the power or
authority to institute or regulate policy as governments do. They may lack capacity,
resources and the infrastructure that government or private organizations have. The
following issues come from Scarborough et al.’s 1997 book on farmer-led extension and

46
need to be addressed: The best way to choose farmer extensionists, defining their role,
remuneration for farmer-extensionists, and personal issues and jealousies that may play a
role at the community level.
Within Kenya, informal self-help groups have historically been an important tool of
community development. The colonial government used these groups to help promote
soil conservation, and formed the Department of Community Development to organize
such groups in 1948 (Tiffen, 1992, as cited in Wellard and Copestake, 1993). Following
independence, the harambee (let’s all work together) movement brought about more
group formation in order to obtain government assistance. Place et al. (2002) found in
central Kenya that most adults belonged to groups. Women’s groups especially are a
ubiquitous part of rural Kenya (Saito, 1994); over 25,000 are registered with the Ministry
of Culture and Social Services.
Due to the reasons discussed above, many are advocating community-based
extension through farmer groups as a means of scaling up technologies (Nyakuni, 2001;
Raussen, Ebong and Musiime, 2001; Wambugu, Franzel, Tuwei & Karanja, 2001).
However, little is known about how farmer groups work in disseminating technologies
and information. There is limited empirical evidence on the performance of groups
(Pretty & Ward, 2001). This points to a need to examine farmer-to-farmer technology
dissemination using farmer groups. The following studies show some of the research
findings on the role of farmer groups in disseminating technology. Factors that play a
role in farmer group success are also described.
Many studies on farmer groups attempt to find out why farmers join groups—what
benefits do they gain from being in a group? In an analysis of farmer groups in cereal
47
growing systems in the United Kingdom, Wibberley (1997) rated farmers’ perceptions of
farmer group benefits in the categories of self-help, motivation, cohesion, and
performance. Some of the highest ratings were with regard to cohesion; giving
friendship, problem sharing and enjoyment received the highest marks. In Kenya, Alawy
(1998) found that women feel that they benefit from being in the group through training,
cash, financial assistance, knowledge gained, and food.
Farmer groups have proven to be a useful way to access a community and to extend
knowledge to other farmers. In Australia, Andreata (2000) found in her study of farmer
groups that they were an efficient way for farmers to share information and experience.
Rouse found in 1996 that being part of a group contributed to knowledge, empowerment,
confidence and ability to make decisions among members. Women’s groups were shown
in Malawi to reach more smallholders than customary extension practices, and to be an
efficient way to reach women farmers (Sigman, Chibwana & Matenje, 1994). They are
an important component of farmer-to-farmer extension, helping to coordinate research
and extension. A study by Parkins in 1997 showed that 63% of farmers surveyed in
Embu preferred to approach groups, rather than individual farmers, for information on
tree planting.
Both public and private development partners can facilitate such groups to achieve
their goals by linking them with other groups and service providers (Cooper & Denning,
1999). Geran found in her 1996 study in Zimbabwe that group formation led to increased
links with service providers, as did Rouse in Zambia (1996). Such groups increase the
efficiency, effectiveness and equity of service provision and also help to empower
farmers (Esman & Uphoff, 1984; Geran, 1996).

48
However, being in a group does not guarantee equal access to services. There may
be differences among groups that lead to inequitable service provision. Alawy (1998)
conducted a study on the Kenyan coast where he examined factors influencing
accessibility of women’s groups to extension services. He found that extension tended to
be biased toward male farmers, Christians and tribes from other areas. This was likely
due to the fact that extension workers are mostly male, Christians working in a Moslem
area, and from an “up-country” tribe.
Esman and Uphoff (1984) perhaps conducted the most comprehensive study on
groups. They analyzed a cross-section of local organizations (LOs) from around the
world. Data were gathered from various books, journals, and bibliographies on the
subject of local organization. From this large set of case studies, data was gathered and
analyzed.
The authors put forth the idea that LOs act as intermediaries in rural development;
they intermediate between individuals and the state. Rather than being a part of the
public or the private sector, local organizations rather make up a third sector. Local
organizations, according to Esman and Uphoff, can extend the outreach of public
services, increasing their efficiency. They can also aggregate the demands of rural
people and assist them to solve problems in appropriate ways.
Their 1984 study was based off an earlier study conducted in 1974. The 1974
study indicated that local organizations were necessary for rural development. It also
showed that the most efficient local organizations functioned at more than one level.
Those organizations with links to political or administrative centers that provide
information were also more effective. Esman and Uphoff believe that characteristics of

49
the poorer members of the community prevented them from taking part in local
organizations. This is in contrast to Parkins’ findings below.
Parkins (1997) conducted a study on the mechanisms of group extension of
agroforestry technologies in central Kenya. He termed this “innovation networking” and
found that networking varies by gender, attitude toward participation and recency of
migration. He found that formal organizations tended to provide information to farmers,
while informal organizations usually provided materials. Parkins expected to find that
group participants were the middle class of small-scale farmers, because the poorer
farmers might not be able to afford the financial and labor commitments. However, he
found that the poorer farmers actually were participating in groups along with those of a
more average wealth level. The wealthier farmers were not as heavily involved in
groups.
Another hypothesis in Parkins’ study was that group-to-farmer contacts would be
more common than farmer-to-farmer contacts. Because 63% of farmers preferred groups
to individuals for information, this hypothesis was retained. However, respondents also
perceived that there were local experts available, and about half of them approached their
neighbors for networking purposes.
Factors for Group Success
In addition to the reasons why farmers join groups and the role that groups play,
effectiveness of groups is another important area of study. If groups are to be used to
help scale up technology dissemination and to extend more conventional extension, it is
important to know what factors make groups successful in group activities in general, and
extension in particular. Therefore several researchers have examined group performance.

50
One aspect that must be addressed at this point is the question of what is meant by
the term success. Presumably farmer groups have their own indicators of success.
However, outside agencies working with such groups may also have their definition of
success. From a project or donor viewpoint, adoption data, outputs or quantifiable
benefits from being involved with a group may be indicators. In this study, success was
examined in terms of dissemination of information and technology, not necessarily group
performance on the whole. Success was determined through the groups’ own perceptions
of success in dissemination to other farmers, through variables such as number of other
farmers and groups trained, and through external ratings of the groups by FARM and
extension staff.
Stringfellow, Coulter, Lucey, McKone and Hussain conducted a broad study on the
effectiveness of groups in sub-Saharan Africa in 1997. They found that cooperation
among farmers was more successful with small cohesive groups, when conducting simple
activities and by liaising with service providers such as agribusiness. They also found
that groups need internal cohesion and a member-driven agenda. Cohesion was also
assisted by small group size, homogeneity of members and member accountability.
De Haan (1999) studied group dissemination of dairy goats in Tanzania. Her
research was a case study of Heifer Project International’s goat group project. She found
that social capital was important in gaining access to goats. Success of the groups was
related to age of the group, spatial distance between members and group function. Older
groups with multiple functions were more successful at dissemination of the technology.
51
Hambly (2000) examined longevity in women’s tree planting groups. Her findings
included the conclusion that unsuccessful groups were related to inequitable social
structures.
Morton et al. (2001) conducted a study on self-help groups and cooperatives in the
dairy industry in Kenya. They found that success of these groups was related to
homogeneity, group size and activities undertaken. In analyzing the Kenyan dairy sector,
both cooperatives and farmer groups were examined as to their success in Morton et al.’s
study. The structural features that contributed most to success were member
homogeneity and starting with a single activity. Group size was shown to have both
positive and negative effects upon success. There was more cohesiveness and sense of
ownership among small groups of farmers (8 to 25 members). However, larger groups
were more likely to function successfully when working with outside agents such as
agribusiness and banks. With relation to outside agents, a high degree of self-financing
led to greater success. Also, heavy external training inputs led to greater success.
Finally, having a member-driven agenda had a negative effect upon group success
(Morton et al., 2001).
Place et al. (2002) studied group performance among small-scale farmers in Central
Kenya. They examined 87 groups and 442 households, and using descriptive analysis
and regression models, were able to gain better understanding of factors that affect group
performance. In the empirical analysis, the authors focused on group structural variables
as factors affecting performance. They found that performance was not correlated with
any particular “easy-to-measure” group characteristic (Place et al., 2002).

52
They also found that groups were very dynamic and took on new activities. Many
different types of groups were able to take on diverse activities and be successful in them.
Significant factors in explaining the success of groups were purpose of the group and
whether the group purpose had changed over time.
Place et al. found that in certain analyses, group size affected performance.
However, it seemed like middle-sized groups were more successful than the large or
smaller groups. Age of the group was not linked to performance in any of the analyses
(Place et al., 2002).
Conclusion
Many feel that there are currently good agroforestry practices and technologies for
small-scale farmers, such as calliandra for fodder, that have been developed and are ready
to be taken “off the shelf” (Cooper & Denning, 1999; Wambugu et al., 2001). There are
many farmers, in Kenya and elsewhere, who could benefit from such technologies if they
could obtain the necessary information and germplasm. What is lacking is the means of
disseminating this technology to more farmers who could take advantage of it.
Government extension in Kenya today is unable to provide many of these small-
scale farmers with appropriate technologies and information to meet their needs and thus
help to bring about rural development. The issue then is how to extend, or scale up, these
technologies to benefit more low-resource farmers in spite of the limited government
extension. Many approaches have been developed since the reduction of government
extension, such as private extension services and those run by NGOs. Recently,
however, community-based extension has come to the foreground as a means of scaling
up these technologies to have a wider impact in the rural economies (Franzel, Cooper &

53
Denning, 2001; Noordin, Niang, Jama & Nyasimi, 2001). Farmer groups are an
important vehicle for community-based extension.
Today in Kenya, many technology dissemination approaches exist, with few
studies to show their effectiveness. One important need in the new extension paradigm
that includes community-based extension is to determine the role that community groups
and farmers play in extending technologies, and how they go about disseminating the
information to other farmers. Knowing these mechanisms will contribute to the effort in
scaling up the impact of agroforestry and other research.
In this chapter we have examined extension history and models used in Kenya and
theories of social capital with special emphasis on farmer groups. In Chapter 3 the
methods used to gather the data and research design will be discussed.

CHAPTER 3 METHODS
Dèyè mònn gen mònn. (Haitian proverb meaning “Behind mountains, more mountains”)
In the previous chapter, theories of extension, social capital and farmer groups were
discussed. This chapter describes the methods used to help understand and describe the
role of groups in extending new technologies. It covers the research design, the
population and subjects, sampling procedure, instruments, study variables, data analysis
and means for ensuring validity and reliability.
The goal of this study was to examine the role of farmer groups in technology
dissemination, and to assess what factors make groups effective in extending
technologies among small-scale dairy-goat farmers in Meru Central District of Kenya.
The specific objectives were to
• Examine participation in groups and identify what factors, if any, affect participation in groups;
• Examine linkages and their outcomes, if any, between farmer groups and with other extension stakeholders;
• Identify the mechanisms by which farmer groups and their members receive and disseminate information and new technologies, especially fodder shrubs and improved dairy-goat breeds;
• Identify the factors characteristic of groups successful in disseminating technology; and
• Propose policy recommendations to extension and development organizations regarding farmer groups’ roles in extension.
54
55
Research Design
A mixed-methods, multiple-stage approach was used to obtain data for the study.
The study consisted of a preliminary phase (four months), survey research (four months)
and a follow-up stage that included stakeholder feedback (two months). The approach
used obtained both qualitative and quantitative information to answer research questions.
Many researchers in social science studies use the mixed-methods approach, also known
as triangulation (Jick, 1983). Triangulation not only allows for an enhanced description
of phenomena, but also helps to validate findings (Hinds & Young, 1987, in Bowen,
1996).
A main component of the research was an in-depth case study of dairy-goat farmer
groups in Meru. A case study is an in-depth look at one individual or social unit such as
an organization or community (Ary, Jacobs & Razavieh, 1996). Case studies look for
variables important to the phenomenon under study, and examine these variables and
their relationships within the social unit. Case studies involve a prolonged time frame—
for this study the researcher spent over 10 months in the field. The goal of case studies is
to understand and describe a phenomenon. Data, both qualitative and quantitative, were
collected through secondary documents and interviews, questionnaires and observations.
Much of the quantitative data were collected from formal surveys and secondary sources.
In light of the goals of the study, a mixed-methods approach was appropriate,
because in order to make associations, predictions, and inferences, one must first
understand a phenomenon. Using both qualitative and quantitative techniques helped to
strengthen and to add validity to the results of the study. Many researchers believe that
qualitative and quantitative methods are not competing, but complimentary (Bowen,

56
1996; Casey & Kumar, 1993), and indeed, can strengthen the perceived weaknesses of
both approaches.
Population and Subjects
The population of interest to the study was small-scale farmers in Meru Central
District in Kenya. According to FARM-Africa, small-scale farmers are those with
landholdings between 0.25 and 1.5 hectares (Meru Dairy Goat and Animal Health Care
Phase II April 1999-March 2002 Project Review, 2002). However, some of those
interviewed owned larger pieces of land, especially in the lower zones where there were
settlement schemes. The target population was those farmers who were involved in
dairy-goat groups through the non-governmental organization FARM-Africa in the
district, plus other similar farmers who were not members of the dairy-goat groups but
had benefited in some way from the groups. FARM-Africa intentionally worked with
those whom they consider to be the poorer farmers in the area, and with women. The
project also targeted farmers in the medium- and low-potential areas of the districts
(Meru Dairy Goat and Animal Health Care Phase II April 1999-March 2002 Project
Review, 2002), although other groups belong to higher-potential areas.
From that population of small-scale farmers, a sampling frame of farmers and
dairy-goat groups on FARM-Africa or government lists was put together. From the
sampling frame both purposive and random samples (described in Ary et al., 1996) of
individual households was drawn from FARM-Africa and government lists to elicit data
for the study. Purposive sampling was used for key informant interviews (n = 24).
Individual dairy-goat group members were chosen at random from a list of groups where
possible (n = 44). Also of interest to the study were farmers who have benefited from the
group (through group dissemination of information or technology). These non-dairy-goat

57
group farmers were sampled by asking the farmer groups for lists of people who had
benefited from their group, and then randomly selecting farmers from that list (n = 44).
Units of analysis thus included both farmers (dairy-goat members and non-members) and
the dairy-goat groups. Instead of randomly selecting groups, all of the current dairy-goat
farmer groups in the FARM-Africa project in the district were interviewed (n = 46).
There were other dairy-goat groups in the district that had either just formed or were
supported through another non-governmental organization (NGO) that were not
interviewed.
Sampling Procedure
The dairy-goat groups in Meru Central District that were part of the FARM-Africa
project were chosen for the study for several reasons. To reduce the number of variables,
it was decided to focus on one type of group rather than a variety of farmer groups who
may have had many different activities that they focused on. This also allowed for the
comparison of success in dissemination across groups. The dairy-goat groups were all
focused around the same activity, and there was an adequate number of them (46 in Meru
Central District). They were also in the same geographic vicinity, and worked with the
same organization (FARM-Africa).
Four other dairy-goat groups were also interviewed that were in the same area but
were supported through another NGO, Meru Drylands Farming Project, to see if the
project/NGO itself made any difference. However, their data was not included in the
analysis with the 46 FARM-Africa groups.
The Meru area is quite homogeneous ethnically, which also helped to reduce
variables in the study. The Meru tribe makes up most of the population, with its subtribes
58
the Tharaka, Imenti and Tigania. However, ethnicity was accounted for in the data
collection to see if it had an effect on the variables studied.
Although FARM-Africa is working with over 83 groups in Meru Central and Meru
South Districts of Kenya, it was decided to interview farmers and groups only in Meru
Central. This was decided for several reasons. Based upon preliminary research and
discussions with another research team that was covering both districts, it was decided
that there were not major differences between farmers in Meru South and Meru Central.
The Meru tribe was the majority in both districts. The districts were formed to cut across
the various agroecological zones, and so both districts had farmers in all the zones. It
was decided that there would be no major difference between the two districts.
Furthermore, it was decided that better quality data could be obtained by focusing on a
smaller yet similar area. The researcher could spend more time collecting data at each
point and more easily return to groups or individuals for clarification. Concentrating
solely on Meru Central would reduce expenses and increase efficiency of researcher time.
Therefore, all of the current FARM-Africa project dairy-goat groups in Meru
Central District were surveyed. Because the project was growing so rapidly, not all the
groups were interviewed. Therefore, there were dairy-goat groups that were not
interviewed, either in Meru South District (and still part of the FARM-Africa dairy-goat
project), or in Meru Central (with Meru Drylands Farming Project), or new groups that
had just recently started and will not be associated with FARM because the project was
ending.
Although FARM-Africa only had 20 dairy-goat groups in Meru Central, many new
groups were associated with the project, albeit without FARM support. These were

59
known as “extension” groups. They had bought a breeding buck (while “FARM” groups
were given one), and were trained by extension staff or other dairy-goat groups without
the normal FARM-Africa support. There were 26 extension groups as compared to 20
FARM groups.
Instruments
The study consisted of both qualitative and quantitative research methods.
Interviews, non-structured observation and document analysis were the main means of
collecting data that were used for descriptive purposes. A research journal was kept for
daily entry of data and observations.
Topic guides were used for semi-structured interviews (Appendix B). These
included general questions with probes. More formal questionnaires for both individual
farmers and farmer groups were then developed based on this information and from
document analysis (Appendices D and E). The individual instrument included 48
questions, while the group questionnaire had 66.
The researcher developed questionnaires based upon similar survey instruments
from studies in Kenya. Advice and input from key informants and research colleagues
was also sought. Questionnaire content was mainly guided by initial information elicited
from farmers and farmer groups, however, during the preliminary phase of the study.
The Institutional Review Board of the University of Florida approved the study design
and instruments prior to data collection (Protocol #2003-U-371). The researcher
developed questionnaires for both individual farmers and farmer groups.
Survey research includes issues of face and content validity. Face validity means
that the questionnaire appears to be measuring what it purports to measure. Content
validity means that the instrument contains a good representation of the range of meaning

60
of the construct being measured (Babbie, 1986). An instrument that does not have
content validity will not give an adequate measure of a construct. Researchers
conducting similar research in Meru and in Central Kenya and experts in the United
States checked the instruments for face and content validity. This panel of experts
consisted of four North American researchers and five Kenya-based researchers (three of
whom were based in Meru).
A pilot test of the instruments helped to check for face, content, and criterion
validity. This also helped to ascertain the amount of time needed to administer them.
Five groups and seven individuals were used for pilot testing. Pilot testing was
completed when the questions seemed to make sense to respondents and no additional
questions or pre-coded answers were added. Unclear questions were removed or
changed. Data from the pilot test instruments were used only when the question was not
changed from the pilot tests to the final instrument.
Other threats to validity on study questionnaires included history, measuring
instruments, differential selection of subjects, subject’s attitudes, importance of the topic
to respondents, and anonymity of respondents. Multiple indicators were used to measure
constructs on the instruments. The researcher used local languages to ensure that
respondents understood the questions. Indigenous categories and terms were used to
ensure understanding, for instance, in describing wealth categories. The translator was
trained and took part in the pre-test. All research objectives and methods were described
to him and other participants to make sure that they understood what was being sought.
Preliminary data collection ensured that the study was collecting information on matters
important to the farmers being studied. Respondents were assured of anonymity to
61
increase internal validity. Having multiple members present (e.g., group interviews) also
helps with validation, because the members present are validating each other. If someone
says something wrong, another member can correct the statement during group
interviews. Multiple methods of getting data (through groups, individuals, reports,
records, timelines, and chapati diagrams) were used. Also, at times the same question
was asked on surveys in different ways to make sure the results were valid. To limit the
phenomena of people trying to give an answer that they thought the researcher was
seeking, the researcher did not emphasize the connection with the World Agroforestry
Centre or with FARM-Africa. It was made clear that the researcher was just that, a
student, and not a possible funder, to limit bias in answers.
A further means of ensuring validity was through member checks. This was done
by presenting research results to study participants for verification on the findings. The
researcher followed Babbie’s (1986) suggestion to enlist the assistance of others to
confirm or validate researchers’ finding. This was done through a stakeholders’
workshop, where farmers, extension agents and NGO/international research center
personnel were present. Findings were presented to stakeholders to obtain feedback and
to ensure validity of results. This is known among anthropologists as “repatriation” of
information, and is a way to return knowledge to community. Reports in the vernacular
were also given to each group that had participated in the study. Reports were also left
with all of the other stakeholders, including farmers, FARM-Africa staff and extension
personnel.
62
Data Collection
Collection of data occurred in both the greater Meru area and Nairobi, and was on-
going throughout the study. As mentioned above, the study consisted of a preliminary
phase, a survey phase and a follow-up phase.
In line with the qualitative inductive approach, the study began with preliminary
data collection, which allows for the development of appropriate research questions.
Content analysis, direct observation, and semi-structured interviews with key informants
were used throughout the study, but especially during the preliminary phase to help guide
the inquiry, identify hypotheses, and collect rich qualitative data.
The more informal preliminary phase began with sondeo-like semi-structured
interviews. Sondeos (derived from “sounding out” in Spanish) are a type of rapid rural
appraisal where researchers quickly gain information in an informal, non-threatening
manner (Hildebrand, 1981). Topic guides were used which included basic questions and
probe questions to elicit yet more responses (Appendix B). Questions were open-ended,
and the interview followed the thought processes of the person being interviewed, rather
than sticking to a set questionnaire (as described in Chambers, 1997). This allows issues
to come out that perhaps the researcher missed during the literature review. However,
because the guide is structured, it allows the researcher to obtain consistent and reliable
data. Information obtained was mostly qualitative. These interviews were conducted
with key informants who were well informed and recognized in the community.
Farmers, farmer groups, extension workers and NGO personnel, and international
research center personnel were all interviewed to obtain and triangulate data.
Content or document analysis was another important tool during the preliminary
phase. This is the use of existing records and documents to obtain information on a

63
community or group of subjects. It allowed the researcher to assess the project prior to
semi-structured interviews and survey research. In this study such records included
FARM-Africa and World Agroforestry Centre (WAC) reports and government literature
such as the District Development Plan.
Qualitative techniques were used during the formal survey research as well.
Participatory techniques such as social mapping and timelines were used during the
survey phase to examine variables, and to provide both qualitative and quantitative data.
Social mapping is the construction of a representation of the services and facilities
that are available to a particular community. Venn (or chapati) diagrams were used
during the survey phase to allow the groups to show the relative importance of various
organizations or individuals within a community, and how they are interrelated. This was
done by giving respondents circles of paper of three different sizes to show relative
importance of the groups or individuals, and to show how they related to each other by
their proximity to the group and to one another.
Group timelines were used to elicit information on the history of the farmer groups.
This was done by using a piece of flip chart paper to write down group events while
asking them questions such as, what have been the changes in membership over the years
(has it increased, declined, stayed the same)? What have been your successes and/or
failures? When did the group start, how did it start, what have your activities been, has
gender composition changed and what events impacted your group? Has the group
changed focus since it started?
These details helped to give a history of the group and the major events affecting
them (AMREF, 1997). The timelines answered many of the questions on the instruments
64
using a relaxed way of story telling, rather than question-and-answer format with the
researcher appearing to extract information from the informants. This method (used at
the beginning) helped to put the group at ease, and assisted them to remember many
details about their group that helped to jog their memories later on in the interview. The
timelines also provided valuable information about the groups that helped to show where
they have come from and why they were the way they were.
Following the preliminary qualitative data collection, questionnaires were
developed and then administered via a translator to answer research questions, obtain
quantitative data and to gather more qualitative information. This helped to further
explore the themes that were brought out through the initial data.
A translator/research assistant was used to collect information from farmers using
questionnaires due to the language barrier. An assistant was procured through FARM-
Africa who was experienced in field data collection in the area and was of the same
ethnic group as the respondents. The assistant spent several years working for a similar
NGO and received training in participatory methods of working with communities. The
assistant was further trained for this particular study, and tested for accuracy by having
him ask the questions in Kimeru, the local language, to another person who then repeated
what he said in English.
The formal questionnaires were written in English. However, the interview was
conducted orally in Kiswahili and Kimeru with both groups and individuals. The
researcher asked the questions in Kiswahili and the research assistant translated into
Kimeru. Many of the farmers spoke Kiswahili but were more comfortable in Kimeru.
65
Answers were then recorded in English. Closed questions are typically used in survey
research, but some open-ended ones were asked as well.
The survey research took place with both groups and individual respondents.
Group interviewing is beneficial in that it is low-tech, rapid, and low-cost in comparison
to individual interviews. Group interviews also capitalize on group dynamics and take
advantage of the synergistic effect of people’s conversations, where ideas can stimulate
more and richer responses (AMREF, 1997; Debus, 1986). They are a means of
validation as well; by having multiple members present, veracity of answers is better
ensured.
For the group interviews in this study, typically four to six farmers from one dairy-
goat group were interviewed together over a period of about two hours. The group
questionnaire consisted of 66 questions and participatory activities. During the
interviews, group timelines and Venn (chapati) diagrams were drawn up by the group
members. The interviewer sought to allow everyone to be heard and to ensure that no
one person would dominate. In addition to group members, the researcher, research
assistant/translator and an extension staff member were present. Extension staff had
worked with the group over a period of years training them, and thus were able to guide
the researchers to the group and also to maintain the rural protocol regarding
introductions of visitors to the groups. Although this was something that could contribute
to bias on the respondents’ part, it was a necessary part of protocol that could not be
avoided. The research team attempted to avoid bias in having the agents present by
plainly stating that although the agent was present, they wanted the groups to answer
truthfully. The only role that the agent played was to introduce the group; he or she was

66
not to answer any questions. Finally, follow-up interviews with individuals were
conducted with no extension agent present to obtain further information and to confirm or
deny what the group had said.
Following the group interview, individuals were sought to both corroborate the
group information and to obtain information at the household level. One group member
and a non-member who had benefited in some way from the group were sought at each
interview site. The individual questionnaire consisted of 48 questions, and took between
30 to 60 minutes to complete. Typically, group members were chosen randomly from a
list obtained from FARM-Africa. Non-members were randomly selected from a list
provided during the group interview.
Data Analysis
Quantitative data from the questionnaires were entered into the Statistical Package
for the Social Sciences (SPSS) software (George & Mallery, 2001) and analyzed.
Descriptive analyses of the data were a major outcome. Correlational techniques and
measures of association such as correlation coefficients (Pearson’s product moment) and
multiple linear regression were used to examine and predict relationships among the
study variables. The logistic regression model was also used to deal with binary
responses. Comparisons of groups were made using contingency tables and cross-
tabulations, and tested for significance with tests such as chi-square.
Qualitative data was analyzed by hand by reducing them to workable categories.
The researcher then sought to discover themes, patterns, associations, explanations and
general statements about the relationships among categories of data (Marshall &
Rossman, 1999).
67
Another tool that was used for data collection was GIS (geographic information
systems). GIS is basically a software package that combines maps and database
information in a single analytical tool. With GIS, the researcher was able to map the
dairy-goat groups. Further information on Meru such as agroecological zone, altitude,
markets, forests, rivers and roads were added to this information to determine how they
were all related.
Validity and Reliability of the Results
Validity
Validity essentially means the closeness of a research finding to physical reality
(Chambers, 1997). The validity or integrity of qualitative data is measured by
trustworthiness, dependability and credibility. Threats to validity in the research study
might come from lack of understanding by respondents or enumerators, from unclear
questions, non-random sampling, failure to pay attention to the theoretical basis, and
failure to record and describe the research process and study area. Threats to validity of
the instrumentation process were discussed under the instruments section. Other threats
to validity of the overall study are discussed below.
One possible threat to validity was through history. Perhaps respondents had
certain attitudes toward FARM, government extension or even other farmers. Also, since
the goat project originated in the United Kingdom where many people are white, seeing a
white researcher may lead farmers to think that answering questions in a certain way
would get them benefits. Issues of threats through history were avoided by carefully
explaining the research project and the position of each person present with the research
team. It was also stressed that the researcher was essentially a Kenyan, with a home and
family in Kenya. Local languages were also used to stress this fact. It was also plainly

68
stated that there would be no benefits, except for information, from the research study.
Respondents were assured that a report would be sent to them in the local language at the
end of the study. All participatory materials developed by the farmers (such as chapati
diagrams and timelines) were left with the group.
Internal validity is yet another type of measure of the study’s trustworthiness.
Internal validity mostly relates to experimental research, but can be a factor in non-
experimental research designs as well (Ary et al, 1996). Internal validity of the research
design was improved through triangulation of data sources and the merging of qualitative
and quantitative methods. Furthermore, having multiple people validating the data also
contributed to internal validity.
External validity refers to the extent that results of the study can be generalized
(Ary et al., 1996). Population external validity, if high, means that results can be
generalized to the larger population (Ary et al., 1996). In this study it would mean that
results seen in a random sample of farmers in Meru could be inferred or generalized to
the general population of farmers there. Generalizations or inferences can be made to the
population only if a random sample was selected for the study. In qualitative research,
generalizability is not always a goal, and the main purpose is more exploratory than
explanatory. However, many social scientists do recognize the importance of designing
studies so that findings may also help in understanding other situations.
From the study population, purposive and random samples were drawn to elicit
data for the study. Survey data was collected from farmers chosen randomly where
possible from a list of farmers from FARM-Africa and/or government lists. This allowed
69
for higher population validity. Purposive sampling was used for the more qualitative
aspects of the study, especially to interview key informants.
High ecological external validity means that the same results would appear if the
study was conducted in another location or setting (Ary et al., 1996). High ecological
validity was ensured by carefully describing the study location, farming systems, and
farmer groups. By understanding the location and also all of the methods used, the study
should be able to be replicated elsewhere.
Finally, high external validity of operations means that if another researcher were
to conduct the study, the results would be the same (Ary et al., 1996). This was ensured
through the detailed description of the study daily in the research journal.
Validity in the qualitative portion of the research was handled overall through the
field research. Because the researcher “is the data-gathering instrument” (Ary et al.,
1996, p. 478), what she does is very important. A document trail of interviews, research
processes and findings was kept in the form of a research journal. This record of events
and observations, together with the raw data, can be audited and serves as a means of
checking the legitimacy of the study. High validity of operations was ensured by the
careful use of a research journal where all observations and details of the study are kept.
Anyone reading this should then be able to replicate the study.
Validity was also verified by triangulation—the use of multiple sources of data,
methods of collecting data (various people, times, and settings), multiple investigators
and drawing upon multiple theoretical bases (Ary et al., 1996). Groups, individuals and
organizations were interviewed to triangulate the data. Debriefing with peers, member
checks and the use of expert consultants were other means of verification of validity (Ary
70
et al., 1996; Bottorff, 2000). Regular supervision while in Kenya was provided through
the international research center World Agroforestry Centre, and debriefing also took
place among fellow researchers in Meru who were working on a similar project at the
same time. Using inductive analysis and grounded theory helped to increase credibility,
because the researcher was basing her hypotheses or findings on what had been found in
the field. Finally, a prolonged engagement in the research setting helps to establish more
credibility or validity. The researcher spent over 10 months in the field collecting data.
In summary, validity was assured by
• Triangulation; • Submitting questionnaires to a panel of experts; • Pre-testing the instrument; • Comparing observations to the literature; • Training assistants; • Assuring anonymity of respondents; • Using random sampling where possible; • Adequately describing the setting; and • Keeping a complete record of design and methods. Reliability
Reliability is the extent to which an instrument is consistent in measuring, or to
which a particular technique will always yield the same result (Babbie, 1986). It can be
compared to precision.
Error that affects reliability can come from various sources. The respondents may
have been tired or ill, or not be in the mood to talk to the researcher. On the
questionnaires, there may have been ambiguous questions or an enumerator may not have
understood what information the researcher was attempting to obtain. The atmosphere in
which the instrument was administered may also have affected reliability. Sometimes
during the interviews, it began to rain, or other types of interruptions occurred during

71
interviews. In such cases the interruption was noted and the data collection continued.
Finally, there may be errors in entering the data (Dedrick, 1997, Foundations of
educational research, unpublished manuscript, University of South Florida).
Inter-observer or inter-rater reliability is also important for reliability of qualitative
data. This can be increased by making sure that the enumerators are well trained by the
researcher, which was done. Because the researcher used just one assistant, this also
helped to reduce variability in observation. Also, following each interview, discussions
were held among the researcher, assistant and local extension staff as to the findings.
This helped to ensure that researcher observations were correct.
There is no true way to assure reliability in a purely qualitative study. In this study
it has been established mostly through documentation. A document trail of interviews
and findings was kept in the form of a research journal to ensure reliability. This record
of events and observations, together with the raw data, is a means of checking the
reliability of the study. For instance, during data analysis, if there is a question about the
responses, the researcher can return to the field notes to see what other factors may have
been coming into play. If there are any questions regarding the reliability of the findings,
the researcher can return to the record trail to show what was done. Random samples can
also be taken from the journal. The assumption is then made that the study is reliable
overall if random samples of this information are determined to be reliable.
Reliability was further assured by having multiple indicators to measure the
constructs on the questionnaires. The researcher also sought to only ask questions that
respondents are likely to know the answer to (Babbie, 1986). This prevented them from
making guesses or falsifying information to please the researcher.

72
An important consideration in research conducted in another language is the use of
translators to collect data with farmers who do not speak the same language as the
researcher. Ensuring that translators understand the questions and can translate them
with the right degree of meaning is also important. This was ensured by having the
translator ask the questions to another party in Kimeru, and the third party translated back
into English so that the researcher could check that he was translating accurately.
Reliability was further ensured by having the same translator in all except one of the
interviews, where it was not possible for him to be there.
In administering a questionnaire, reliability is a function of the length of
instrument, heterogeneity of the population, ability of the respondent, the nature of the
variables, and the number of items (Ary et al., 1996). Longer tests are more reliable. If
respondents are more heterogeneous, reliability will be higher. If respondents do not
understand a question because of their ability, they may guess and so affect the reliability
coefficient. Some variables are easier to measure and thus give higher reliability.
Limited redundancy was built into the questionnaire to assess the consistency of
responses to a particular question.
Reliability was ensured in the following manner:
• Pilot testing the instruments; • Training the assistant; • Maintaining a document trail of research findings; • Utilizing triangulation; and • Obtaining reliability coefficients from test constructs.3
This chapter has examined the research design and methods used, the qualitative
and quantitative paradigms, the population sampled, instruments used, the procedures, 3 Cronbach’s alpha for the adoption index, a measure of dairy goat technology adoption by group neighbors, was 0.69.

73
data analysis and issues of validity and reliability. The next chapter will examine the
results related to the objectives of the study.

CHAPTER 4 RESULTS
Before we started we were doing nothing and now we’re doing something. —Farmer in Meru Central
In Chapter 3 the methods used in the study were discussed. This chapter will
discuss the research findings, presenting information on the FARM-Africa dairy-goat
project and the groups that have been formed as a result of the project. It will also
describe the subjects of the study. Finally, the first four study objective results will be
presented, covering who participates in groups, group linkages, mechanisms of
dissemination, and factors that make groups successful in extension.
The Food and Agricultural Research Management (FARM)-Africa Project and Dairy-Goat Groups
FARM-Africa is a British non-governmental organization (NGO) that has been
working with projects in eastern and southern Africa since 1985. FARM-Africa initiated
a dairy-goat project in Meru Central and South Districts of Eastern Province of Kenya in
1996, targeting poorer farmers in the middle and low potential zones. The project was
called the Dairy Goat and Animal Healthcare Project, and attempted to improve the
productivity of farm animals in the area through breed improvement, better management
and sustainable animal healthcare.
Following preliminary surveys in 1994 and 1995, the project was implemented in
1996. The poorest members of the communities in the greater Meru area were targeted
for participation in the project. Such people were identified following awareness and
sensitization meetings at the community level, which included FARM-Africa and
74
75
extension staff, local administration (chiefs), and community members. Criteria for
poverty, based on the local communities’ indicators, included an inability to send
children to school, lack of regular income, temporary housing, having no cattle, and small
land size relative to the area.
FARM-Africa chose to work with organized farmer groups to efficiently target
communities. However, they did not use established groups, because they were targeting
the poor people of the communities. Therefore, most of these groups were formed for the
purpose of the project, resulting in about 44 groups that were created with assistance
from the local communities, chief, and extension staff. These dairy-goat groups were
then trained on group dynamics, goat management, housing, and breeding. Selected
members from each group were trained as buck keepers and community animal health
workers (CAHWs). Extension staff were also trained at this time using DELTA
(Development, Education, Leadership, Training and Action), a community mobilization
training program.
One of the main mechanisms for improving animal productivity was through the
establishment of pure Toggenburg buck stations located within the communities for
breeding with local goats. Genetic improvement of local goats was to occur through the
breeding of local and F1 crosses to the pure Toggenburg bucks. The project was unique
in that the breeding was to be done at the local level instead of the typical government or
private breeding stations. The bucks were given to the groups at no cost, with the
understanding that they belonged to the project, and could be retrieved in cases of
mismanagement.
76
These buck stations were thus owned and managed by groups of farmers. Group
members were to bring their local goats to the buck station to be served for free or for a
small fee. Community members could also obtain breeding services for a slightly higher
fee. The resulting offspring (F1s and F2s) were known as “improved” goats. Each of the
44 dairy-goat groups received a buck for their buck station. The project also included
breeding stations to breed more pure Toggenburg dairy goats. Breeding stations
consisted of a pure buck and four pure does. They were given to certain groups on the
condition that the pure goats were to be repaid to the project in kind from their offspring.
These repayment goats were then used to start additional breeding stations. At the time
of the research, there were 83 buck stations and 48 breeding stations within Meru Central
and South Districts (the project area).
The project also established two umbrella organizations, the Meru Goat Breeders’
Association (MGBA) and the Meru Animal Health Workers’ Group (MAHWG). These
were to provide a forum and support for the goat farmers, CAHWs, animal health
assistants (AHAs), and veterinarians.
The activities of the MGBA included safeguarding the Toggenburg and its
upgrades, buck rotation, training new groups, organizing shows and auctions, sourcing
markets for members, and management of the seed bank. The MGBA also provided seed
loans to member farmers due to drought in the area. Maize and bean seed was provided
to the dairy-goat groups, which was then repaid in cash with 10% interest. The members’
goats were used as collateral on the loan. Goats in the project were sold through the
MGBA, which received a commission. The MGBA also assisted in agricultural shows.
Groups and/or individual farmers were encouraged to formally register with the MGBA.

77
The Meru Animal Health Workers’ Group was provided with a loan of Kenya
shillings (Ksh.) 200,000 (USD 2,857) to start a credit scheme for its members to open
drug shops, purchase drug supplies, and so forth. It also helped members by purchasing
veterinary supplies in bulk. MAHWG was also meant to be a forum for experience
sharing among members.
In 2004, FARM started phasing out the project. The MGBA was therefore being
coached to take over many of its responsibilities such as extension activities and rotation
of breeding bucks. At the time of the research, the MGBA was starting to charge a small
fee for services such as training. The MGBA also began collaborating with private
breeders and with other NGOs such as the Meru Drylands Farming Project (MDFP), part
of another organization called SOS-Sahel.
Although 44 groups were formed and trained through FARM-Africa, there were
over 100 dairy-goat groups in the greater Meru region at the time of the study. Through
sensitization of communities and trainings held at agricultural shows, many more farmers
became interested in joining the project, but they were not chosen due to the criteria
mentioned above. Many farmers therefore formed their own groups, arranged to receive
training, and purchased a buck themselves. Extension staff, the MGBA or the older
FARM-Africa groups trained most of these newer groups. Because of this, the original
44 dairy-goat groups were called “FARM” groups and the new ones that were not
officially supported by FARM were called “extension” groups. Both extension and
FARM-Africa were involved with all of the groups; however, FARM groups were not
exclusively working with FARM nor extension groups working with extension only.
This terminology was used to distinguish the original project groups from the newer ones.

78
Ultimately, all of the groups were under the Meru Goat Breeders’ Association, which was
composed mostly of farmers, but had staff from FARM-Africa and from the Ministry of
Livestock Development and Fisheries.
Groups were located throughout the old Meru and Tharaka-Nithi Districts, which,
during the project, were subdivided into Meru North, Meru Central and Meru South
Districts. This study surveyed only groups in Meru Central due to time and financial
constraints. Staff from FARM, extension and the World Agroforestry Centre (WAC) felt
that this was acceptable due to the fact that there were no major differences between
Meru Central and Meru South Districts. Agroecological zones and tribal composition
were much the same in Meru Central and South.
Therefore 50 groups were interviewed during the research. This included 20
FARM groups, 26 extension groups and four Meru Drylands Farming Project (MDFP)
groups (Figure 4-1). The MDFP groups were interviewed to compare the 46 FARM-
Africa groups with other groups that were in the same district but connected with another
NGO. The MDFP groups are the four groups at the top of the map (Kamarete,
Kamakambi, Mumiri and Karimene). These groups were not included in any of the data
analysis in this chapter, but will be discussed in Chapter 5.
Groups were located in three divisions in the district (14 groups in Abothoguchi
Central, 13 in Abothoguchi East and 19 in Miriga Mieru East). The four MDFP groups
were in the nearby Buuri division. Average age of the groups was six years. Average
size was 23 members. Fifty-nine percent of group members were female.
The groups were distributed across most of the agroecological zones of Meru
Central District. Group locations ranged in altitude from 905 to 1795 m, with the average

79
Figure 4-1. Dairy-goat group distribution within Meru Central District
being 1279 m. Many of them were concentrated in the coffee and marginal coffee zones,
where there is a higher population density. On the slopes of Mount Kenya where tea and
coffee were grown, land sizes were much smaller, while in the drier, lower zones, farmers
tended to have larger pieces of land. Bonferroni post hoc procedures revealed significant
differences in land sizes owned by individual farmers (both group members and non-
members) between two of the three divisions studied in the district. Abothoguchi
Central, on the mountain slopes, averaged 2.94 acres, while Miriga Mieru East averaged
5.55 acres (p < .02). Abothoguchi East division had an average land size of 4.13 acres.
Altitude was also significantly different in the three divisions. Abothoguchi Central at
1431 m was significantly different from Miriga Mieru East at 1222 m (p < .01).
Abothoguchi Central was also significantly different from Abothoguchi East at 1198 m (p

80
< .01). Miriga Mieru East and Abothoguchi East were not significantly different,
according to Bonferroni analyses.
Fodder Training and Dissemination in the Project
Farmers were taught during the project to house their goats in zero grazing units.
Water and fodder were brought to the goats, and manure could be collected below the
unit. The units consisted of a raised wooden structure with a roof. Project stakeholders
(farmers, extension officials, and FARM personnel) discovered that feed was a limiting
factor for dairy-goat farmers, especially during the dry season. Because of these issues,
fodder was an important component of the project.
Fodder training and germplasm dissemination in the project and district were a
confusing issue because of the number of organizations involved. Players involved in
fodder shrub technologies included FARM-Africa, the World Agroforestry Centre, Meru
Drylands Farming Project, Kithima Tree Nursery, Kamutune Tree Nursery, Kenya
Agricultural Research Institute (KARI), the KARI project ATIRI (Agricultural
Technology and Information Response Initiative), and government extension; specifically
the Ministry of Livestock Development and Fisheries. Also, the Meru Central Dairy
Cooperative gave out fodder for dairy cattle in the district, and British American Tobacco
(BAT) gave out leucaena for firewood to cure tobacco in the lower zones. (This may
have turned some farmers against leucaena as a fodder shrub, since the species given out
by BAT—probably Leucaena leucocephala—was weedy, and some farmers therefore
were reluctant to plant any fodder.)
Germplasm was therefore provided to the dairy-goat groups by all of the above
institutions. The main species disseminated and planted for fodder were Calliandra
calothyrsus, Leucaena trichandra and Sesbania sesban. These species that were
81
developed and promoted especially for fodder for dairy animals were known as
“improved” trees or shrubs. All germplasm in the project was provided free of charge.
Bulking plots were also developed at certain dairy-goat groups. A bulking plot was
a site where cut fodder could be collected to use as animal feed. The bulking plots were
also to supply germplasm for other farmers and to provide income to the groups through
sale of fodder. The land for the sites was donated public land.
In 1997 and 1998 there was a little work done on fodder trees under the FARM-
Africa project. The main distributions through FARM were in 2000 and 2002. During
the rains (October through December) FARM distributed 30,000 seedlings to most dairy-
goat groups through the ATIRI project. Between July and December 2002, 90 dairy-goat
farmers were trained in nursery establishment and fodder conservation. During the same
time 27 nurseries were established and 2,800 seedlings distributed, and 80 farmers went
on a study tour to KARI-Embu, a nearby research center.
During the entire project, 200,000 seedlings were distributed, according to FARM-
Africa (Ahuya, Okey, Kitalyi, Mutia & Oduo, 2003). Germplasm for the dairy-goat
groups was obtained through Kithima Tree Nursery and Kamutune Farm in Meru Central
District. The British Department for International Development (DFID) funded the
seedling distribution through FARM. FARM reported that there were 500 people who
had planted forage in their project area (Mutia, P., FARM-Africa Meru Tharaka-Nithi
Dairy Goat and Animal Healthcare Project Progress Report, January to June 1999).
World Agroforestry Centre reported about 665 farmers in the district using the fodder
tree technology (Franzel & Wambugu, 2004).

82
World Agroforestry Centre’s work also opened the way for ATIRI—Agricultural
Technology Information Response Initiative, which was run through KARI. This
initiative promoted training, cross-region tours, and on-farm field days. The ATIRI
project then went to the same dairy-goat groups that the World Agroforestry Centre
trained, making it difficult to differentiate between the different fodder trainers and
suppliers. The ATIRI staff involved both extension and FARM staff for their trainings.
With ATIRI the fodder training expanded to more divisions than what FARM/WAC had
covered. Trees were given out in July of 2000; 70 to 100 trees per household. KARI-
Embu conducted training of both group members and non-members at the chief baraza
(public meeting) in both districts. Table 4-1 shows the different organizations that were
involved in training the dairy-goat groups in fodder tree technologies.
Table 4-1. Source of fodder training for the dairy-goat groups (n = 46) Source of training f Percent of groupsa FARM-Africa 21 46 Government extension 18 39 KARI 12 26 Other 5 11 aPercentages do not total 100 because more than one group could provide training
FARM-Africa was the main source of training, followed by government extension.
KARI also played an important role. Other training sources included individual farmers
and members of the MGBA.
Sixty percent of individuals interviewed (both dairy-goat group members and non-
members) had planted improved fodder. It appeared, however, that the amount of
improved planted fodder was quite limited except in a few cases. KARI and WAC
recommended 150 to 200 trees per goat. However, the average number planted by
individual farmers interviewed was only 34, with a range of 0 to 500 (Figure 4-2). On

83
the other hand, farmers interviewed (both members and non-members) had an average of
three improved goats (Figure 4-3). Farmers seen during the fieldwork were almost
always using local fodder for feed for their goats. Napier grass (thara or Pennisetum
purpureum) was a popular feed. Many of the goats were fed banana leaves and local
hedge shrubs such as Tithonia diversifolia and Lantana camara. Mulberry (ntaratare or
Morus rubra) was also being used. Many farmers did not know what types of improved
fodder trees they had planted nor how many trees they possessed.
Total improved fodder planted
500.0450.0
400.0350.0
300.0250.0
200.0150.0
100.050.0
0.0
70
60
50
40
30
20
10
0
Std. Dev = 84.07 Mean = 34.0
N = 88.00
Freq
uenc
y
Figure 4-2. Distribution of fodder planted by individual farmers (n = 88)

84
Number of improved goats
15.012.510.07.55.02.50.0
40
30
20
10
0
Std. Dev = 2.90 Mean = 3.4
N = 88.00
Freq
uenc
y
Figure 4-3. Distribution of improved goats owned by individual farmers (n = 88)
Seventy percent of the dairy-goat groups reported that all of their members had
planted at least some amount of improved fodder. Forty-six percent of groups said
“many” members had planted 1 to 50 trees. Fifty percent of groups said “some”
members had planted between 51 and 100 trees. Thirty-nine percent of the groups said
“some” members had planted over 100 trees.
Regarding their dissemination of fodder tree technologies, the dairy-goat groups
replied as follows during the interviews: 60% of their non-member neighbors had
planted “some” fodder shrubs, and 29% had planted “many.” Although many of the
group members had planted fodder trees, often it was just a few trees. Unfortunately,
after one of the major seedling distributions there was a prolonged drought, and many
farmers and groups reported that the trees they had planted died. Others were given seed
that did not germinate (possibly due to lack of knowledge on germination techniques;

85
seed such as Calliandra calothyrsus requires soaking in water for 48 hours prior to
germination).
Description of Area and Subjects
Individuals interviewed had an average of 4.9 persons per household (Table 4-2).
In Meru the households were complex, as they are for small-scale farmers worldwide.
Therefore, when households were discussed with individual farmers, informants were
referring to those people who slept on the farm and were fed by the person or household
being interviewed.
Most of those interviewed lived in a house with a permanent (usually tin or mabati)
roof and timber walls (Table 4-3). Most respondents obtained water from a pipe, stream
or borehole/well. The other 5% obtained water from other sources, usually piped water
or a borehole at their neighbor’s house.
Table 4-2. Descriptive data for individual farmers (n = 88) Variable Minimum Maximum M SD Years of education 0 14 6.68 3.55 Total household members on-farm 1 9 4.90 1.86 No. improved cattle 0 9 1.75 1.63 No. local cattle 0 10 0.49 1.52 No. improved goats 0 15 3.41 2.90 No. local goats 0 4 0.76 0.96 Total no. cattle and goats owned 0 20 6.39 3.77 Total no. animals sold last year 0 8 1.41 1.61
Individuals interviewed had an average of 6.7 years of education, varying from 0 to
14 (Figure 4-4). The Kenyan education system has eight years of primary school, four
years of secondary and four years of university. There are also two-year technical
colleges.

86
Farmers interviewed owned between 0 and 20 animals, with an average of 6.4
(Figure 4-5). This includes all cattle and goats. Averages for both local and improved
types of cattle and goats are given in Table 4-2.
Years of education
15.012.510.07.55.02.50.0
40
30
20
10
0
Std. Dev = 3.55 Mean = 6.7
N = 88.00
Figure 4-4. Distribution of years of education by individual farmers (n = 88)
The data in Table 4-3 are meant to give an overall picture of farmers and groups in
Meru Central District in Kenya. However, as discussed in Chapter 1, the livelihood
strategies of smallholders are diverse, complex and risk-prone. As a result, their farming
systems and behavior are also complex and diverse, and at times difficult to categorize
and measure. The variety of crops and animals in the area has been discussed in Chapter
1. In addition to a diversity of crops and livestock, there was also a myriad of activities
that farmers engage in, to obtain a living. Below is a list of some of the ways farmers
make a living or get cash in Meru (possible livelihood strategies), obtained through
Freq
uenc
y
87
observation, document review and discussions with informants. Taken together, these
describe the livelihood system of those living in the area.
• Sale of produce at roadside or path side • Sale of produce at market • Formal sector job • Informal (jua kali) sector job • Casual labor during cultivation, weeding or harvest • Rent coffee trees (upper zones) • Rent land (lower zones) • Sale of timber (Grevillea robusta, Eucalyptus spp. and indigenous trees) • Cut blocks at the quarry • Break rocks into kagoto (small stones for building) • Sell porridge/chai/chips/maandazi • Open a duka (shop or canteen) • Sell livestock (especially for school fees, especially in January) • Saw milling • Sale of seedlings during the rains (Grevillea, sukuma wiki) • Sale of firewood • Sale of manure • Sale of milk • Sale of animal by-products such as hides, eggs and honey • Butchering/sale of meat upon slaughtering an animal • Sale of crop residue (bean stover, maize stover etc.) • Sale of fodder, especially napier grass (Pennisetum spp.) • Sale of charcoal • Sale of chang’aa (local brew) • Steal (goats to eat, miraa to chew, trees to sell lumber) • Sale of sex • Make and sell curios such as baskets, carvings • Hawking (selling small carried items) • Witchcraft; putting curses on people or praying for rain • Circumcisers (mostly for males today) • Midwifery (wakunga) • Pastoring churches
This section discussed the FARM-Africa dairy-goat project and the farmer groups
that are a major part of it. The next section, Objective One, will discuss who participates
in groups in general and why.
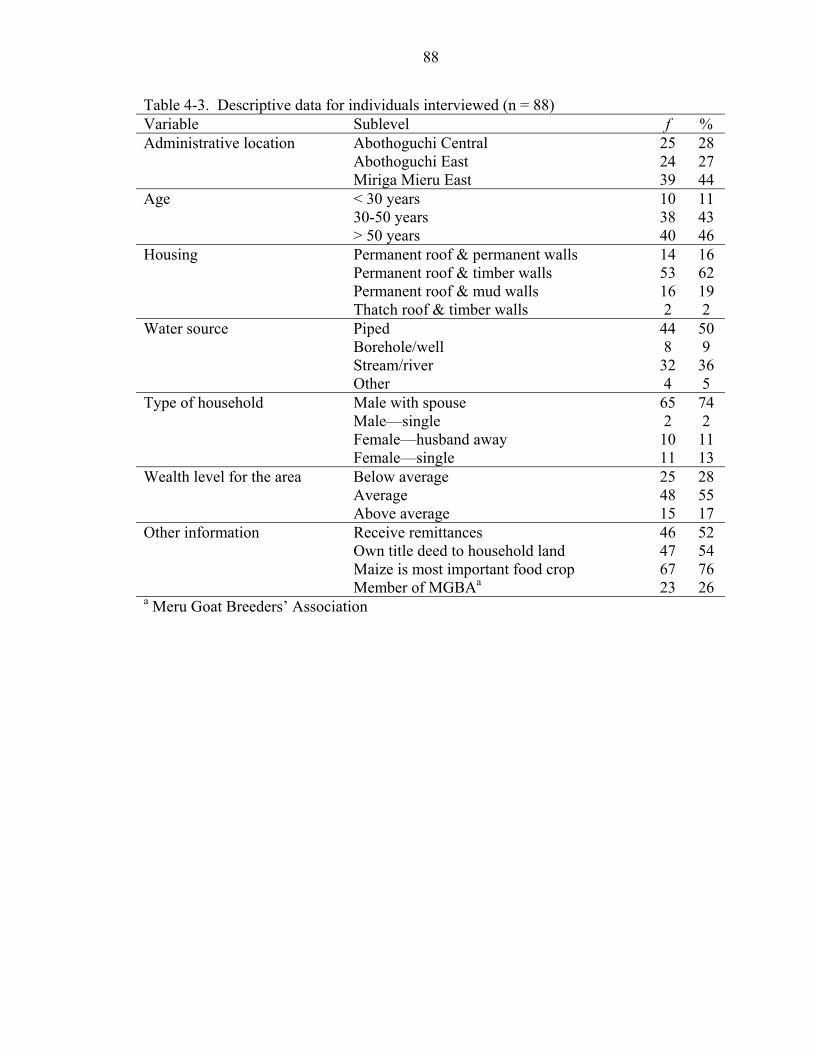
88
Table 4-3. Descriptive data for individuals interviewed (n = 88) Variable Sublevel f % Administrative location Abothoguchi Central 25 28 Abothoguchi East 24 27 Miriga Mieru East 39 44 Age < 30 years 10 11 30-50 years 38 43 > 50 years 40 46 Housing Permanent roof & permanent walls 14 16 Permanent roof & timber walls 53 62 Permanent roof & mud walls 16 19 Thatch roof & timber walls 2 2 Water source Piped 44 50 Borehole/well 8 9 Stream/river 32 36 Other 4 5 Type of household Male with spouse 65 74 Male—single 2 2 Female—husband away 10 11 Female—single 11 13 Wealth level for the area Below average 25 28 Average 48 55 Above average 15 17 Other information Receive remittances 46 52 Own title deed to household land 47 54 Maize is most important food crop 67 76 Member of MGBAa 23 26 a Meru Goat Breeders’ Association
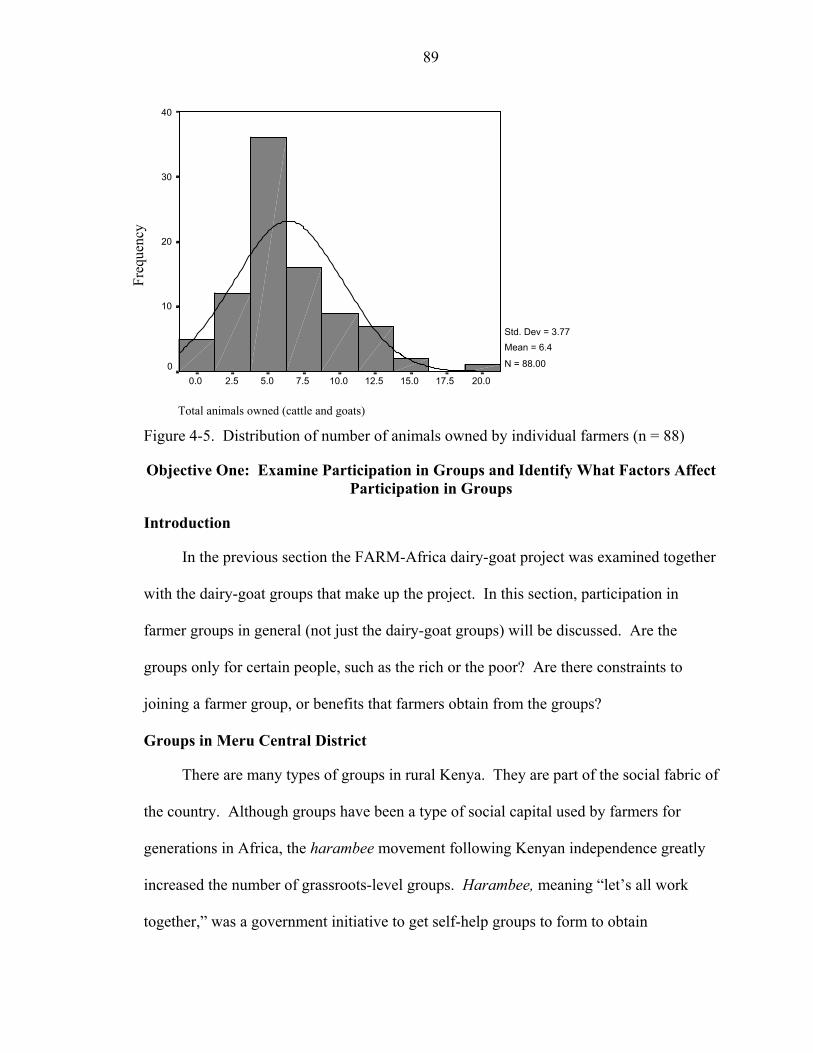
89
Total animals owned (cattle and goats)
20.017.515.012.510.07.55.02.50.0
40
30
20
10
0
Std. Dev = 3.77 Mean = 6.4
N = 88.00
Figure 4-5. Distribution of number of animals owned by individual farmers (n = 88)
Objective One: Examine Participation in Groups and Identify What Factors Affect Participation in Groups
Introduction
In the previous section the FARM-Africa dairy-goat project was examined together
with the dairy-goat groups that make up the project. In this section, participation in
farmer groups in general (not just the dairy-goat groups) will be discussed. Are the
groups only for certain people, such as the rich or the poor? Are there constraints to
joining a farmer group, or benefits that farmers obtain from the groups?
Groups in Meru Central District
There are many types of groups in rural Kenya. They are part of the social fabric of
the country. Although groups have been a type of social capital used by farmers for
generations in Africa, the harambee movement following Kenyan independence greatly
increased the number of grassroots-level groups. Harambee, meaning “let’s all work
together,” was a government initiative to get self-help groups to form to obtain
Freq
uenc
y

90
government assistance. Today, registration of groups with the government is usually
required for farmers to receive government or other project assistance. Therefore, many
groups have been formed at the community level in Kenya.
Almost every farmer in Meru was a member of some type of group. In addition to
farmers’ groups, some of the groups in Meru Central District included women’s and
men’s groups, sports, church, school, cattle dip, political party, locational development
committee, water, utensils, merry-go-rounds, clan, funeral and marketing. There were
also many informal social groups; for instance, dart clubs. Groups provide an important
venue for obtaining information and technology, as well as moral support. Individual
farmers (n = 88) were in an average of 2.3 groups, with the majority being in one or two
groups. Ninety-seven percent of the farmers in the dairy-goat groups were members of
other groups. The main groups that individual farmers in the study belonged to were
dairy-goat, church, clan, merry-go-round, water and women’s groups (Table 4-4).
Table 4-4. Types of groups to which individual respondents belonged (n = 88) Type of group f % of individuals Dairy goat 44 50 Church 39 44 Clan 23 26 Merry-go-round 18 20 Water 18 20 Women 14 16 Note. Individuals could be in more than one group
Most farmers in Meru attended church. Within the churches, there were various
types of groups that church members could belong to. Many of the church groups were
for fellowship. Often they were divided by gender. Also the church group might have as
an activity a merry-go-round (kuriunganira), where the members take turns contributing
money, and each member receives it in turn.

91
Clan groups were comprised of all male, all female or mixed gender. They were
mostly for emergencies or social help during weddings, funerals and illnesses. There are
two main clans (Abothoguchi and Miriga Mieru) and many subclans in the Meru tribe.
As with many groups, merry-go-rounds were often a component of clan groups.
Merry-go-rounds are very popular in Kenya. Many of the dairy-goat groups had at
one time or still use merry-go-rounds, or kuriunganira. As mentioned above, many
groups had kuriunganira as an activity in their group. They were also called chai (tea)
groups because members sometimes made and sold tea to raise money. Members of the
group contributed a certain amount of money or material items such as cupboards or
blankets at every meeting. Every time the group met, one member would receive the
money or the item. They usually met weekly or monthly. Organizations that helped with
micro-enterprise, such as Faulu Kenya and Maendeleo ya Wanawake, helped out such
groups with loans, so farmers must be in a group to benefit from these organizations.
Water groups were usually formed to bring piped water to a community. This was
done by forming a group within that community, raising money, registering with the
Department of Social Services, and getting permits from the water department. The
groups then paid the water department for materials and to have the pipes installed.
Women’s groups are found in most parts of Kenya. They are a large component of
rural life, as many women are left to tend farms while their husbands seek work in the
urban areas. Women also perform most of work on the farm. They do the tilling,
planting, weeding and even harvesting of crops in Meru. Women will get together in
groups for fellowship, work-sharing, merry-go-rounds or income generation. Often men
are allowed to join women’s groups.
92
Some informants believed that the biggest reason to be in groups was to market
farm produce, although this did not appear as a reason during the interviews. Groups
focused on marketing included those for milk, cotton, tobacco, mangos, honey,
horticulture, and poultry products. Coffee cooperatives were very important for farmers
in the coffee-growing areas (UM2 and UM34). Twenty percent of individual respondents
said that coffee was their most important cash crop. However, with the current low
coffee prices, very few farmers considered coffee cooperatives to be their most important
group.
Groups were also used as a sort of safety net. One such type of group was the
Giitune Burial Scheme. Members contributed ten shillings a month. When a person in
the group died, the scheme would pay for the coffin, transport and food for the funeral.
This was perhaps a modified version of the traditional clan mechanism for helping others
in times of emergency.
Some benefits from joining groups included unity and the social aspect. For
instance, one dairy-goat group in Chuka in Meru South District met twice a week just for
fellowship. Others joined to receive goats. Information was also a key benefit to being
in groups, according to informants. Of individual farmers surveyed, 60% said that they
joined a group to gain benefits. Benefits in this case referred to tangible benefits such as
access to improved breeds of goats, or to money through structures like merry-go-rounds.
One farmer stated, “Before the group, I had nothing.”
It appeared that nearly every Meru farmer was in one type of group or another.
One informant stated that he would be very surprised to find one farmer who is not in a
4 UM = Upper Midlands
93
group. Another said that people declare, “A woman who is not in a group is a chicken
thief;” in other words, there is likely something wrong with a farmer who is not in a
group.
Although groups appeared to be a valuable form of social capital, there were some
people who did not or could not participate in groups for various reasons. During both
the preliminary phase and the survey phase of the research, informants were asked about
participation in groups. Why did they join? What people were not in groups? During
the preliminary phase of data gathering, it became apparent that most farmers in the area
were in one type of group or another, and that it would be quite difficult to find a number
of people who were not any groups at all. This made it difficult to compare dairy-goat
group members to those people not in any type of group at all. Because the study was
concerned not only with participation, but also dissemination, the researcher decided to
look for dairy group members and farmers who had benefited in some way from the
group for the individual interviews, rather than members and non-members (of any group
at all).
Factors Affecting Participation in Any Groups in Meru Central District
However, it is possible to compare people who either belong to or do not belong to
particular types of groups. The major types of groups that farmers in the study belonged
to were examined to see if there was a difference in group members and non-members
with regard to various factors such as wealth and household composition. Part of
household composition includes producers and consumers. “Consumers” in this study
refers all people in the household who eat and sleep on the farm, while “producers” refers
to males and females between the ages of 11 and 50. Because the data is so extensive,
most of it is available in Appendix A. However, some information for the dairy-goat

94
groups is shown in Table 4-5, where means of various factors for members and non-
members were tested using t-tests.
As seen in Table 4-5, there were significant differences between members and non-
members of dairy-goat groups with regard to the number of males and total children
under the age of 10, total number of household members, consumers and number of
improved goats sold. This shows that individuals with more children under the age of 10,
more consumers and larger households are more likely to be members of dairy-goat
groups.
Table 4-5. Factors affecting participation in dairy-goat groups (n = 88) Response Member (n = 44) Non-member (n = 44) M SD M SD t p No. females under 10 years 0.68 0.88 0.48 0.70 1.21 0.23 No. females 11-20 0.48 0.76 0.61 0.84 -0.80 0.43 No. females 21-50 0.93 0.59 0.84 0.57 0.74 0.46 No. females over 50 0.32 0.52 0.39 0.58 -0.58 0.56 No. males under 10 0.75 0.94 0.39 0.72 2.03 0.05** No. males 11-20 0.86 0.93 0.73 0.82 0.73 0.47 No. males 21-50 1.16 1.06 0.86 1.86 0.92 0.36 No. males over 50 0.36 0.49 0.34 0.48 0.22 0.83 Total household members 5.41 1.63 4.39 1.96 2.66 0.01** Total children < 10 years 1.43 1.30 0.86 0.93 2.36 0.02** Total members age 11-21 1.34 1.12 1.34 1.18 0.00 1.00 Total adults (>21) 2.77 1.52 2.43 1.77 0.97 0.34 Total number of consumers on-farm 5.55 1.84 4.39 1.94 2.88 0.01** Total number producers on-farm 3.43 1.82 2.80 1.64 1.72 0.09* Producer to consumer ratio 0.63 0.24 0.63 0.24 -0.12 0.91 No. of groups farmer belongs to 2.59 1.04 2.02 1.68 1.91 0.06* Total number of livestock 6.75 3.48 6.02 4.05 0.90 0.37 No. of improved goats 3.66 3.19 3.16 2.60 0.81 0.42 No. of improved goats sold 0.45 0.85 1.11 1.47 -2.58 0.01** Education of respondent (total years) 6.65 3.66 6.71 3.48 -0.08 0.94 Land size of respondent (acres) 4.66 3.59 4.19 4.02 0.58 0.56 Type of housinga 3.75 0.84 3.95 0.86 -1.13 0.26 Water sourceb 1.95 0.99 2.14 1.07 -0.83 0.41 a0 = other; 1 = thatch roof/mud walls; 2 = thatch roof/timber walls; 3 = permanent roof/mud walls; 4 = permanent roof/timber walls; 5 = permanent roof/stone walls b 0 = other; 1 = stream/river; 2 = borehole/well; 3 = piped *Approaches significance; **significant

95
Tests of significance, as shown in Table 4-5, plus contingency tables show
important bivariate relationships and thus are used in these analyses. However, a
stronger type of analysis is multivariate analysis such as model building, where there is
more control over the variables with the degrees of freedom. For this analysis, various
factors were regressed upon the dependent variable “group membership” in a binary
logistic model. Such models are used when response variables are binary; that is, they
have only two possible outcomes (Agresti & Finlay, 1997). The generic terms for the
two possible outcomes are success and failure, and the “odds” equal the probability of
success divided by the probability of failure. The odds of a particular outcome is
obtained by the ratio /(1- ). The log of the odds is called the logistic transformation or
logit. The logistic regression model is logit ( ) = © +®X (Agresti & Finlay, 1997). As
the outcome (in this case, participation in a group) increases from 0 to 1, the odds
increase from 0 to infinity. This model tests the probability that the independent variable
X has no effect on the dependent variable Y (Agresti & Finlay, 1997). By using the
backward type of model building with the Wald statistic, the researcher could examine
which factors most significantly contributed to participation in the various groups. The
Wald statistic is the square of the slope ß divided by the standard error, and has a chi-
squared distribution with df = 1 (Agresti & Finlay, 1997). The regression model for
dairy-goat group membership is shown in Table 4-6.
This binary logistic model is interpreted as follows. The model for participation in
dairy-goat groups is logit( ) = -0.56 (constant) +0.28 (consumers) +0.47 (groups) +1.15
(church group member). As with linear regression models, positive numbers mean that
the probability of being a member of a dairy-goat group increases with higher levels of
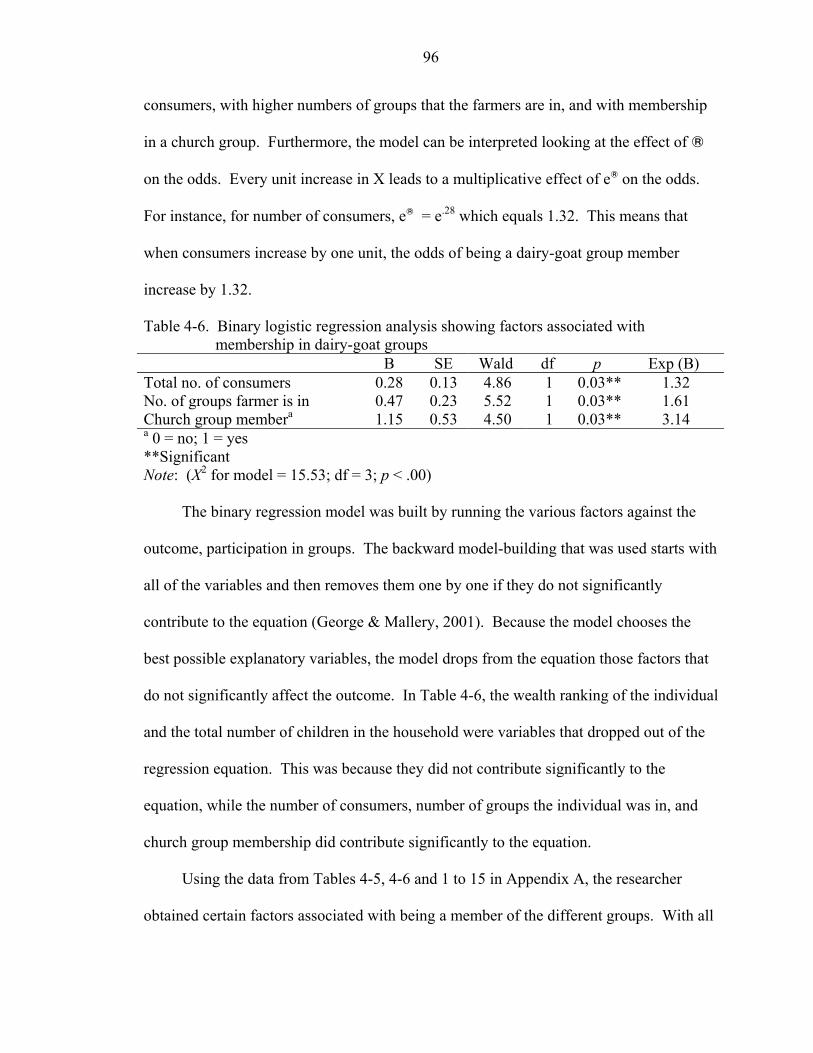
96
consumers, with higher numbers of groups that the farmers are in, and with membership
in a church group. Furthermore, the model can be interpreted looking at the effect of ®
on the odds. Every unit increase in X leads to a multiplicative effect of e® on the odds.
For instance, for number of consumers, e® = e.28 which equals 1.32. This means that
when consumers increase by one unit, the odds of being a dairy-goat group member
increase by 1.32.
Table 4-6. Binary logistic regression analysis showing factors associated with membership in dairy-goat groups
B SE Wald df p Exp (B) Total no. of consumers 0.28 0.13 4.86 1 0.03** 1.32 No. of groups farmer is in 0.47 0.23 5.52 1 0.03** 1.61 Church group membera 1.15 0.53 4.50 1 0.03** 3.14 a 0 = no; 1 = yes **Significant Note: (X2 for model = 15.53; df = 3; p < .00)
The binary regression model was built by running the various factors against the
outcome, participation in groups. The backward model-building that was used starts with
all of the variables and then removes them one by one if they do not significantly
contribute to the equation (George & Mallery, 2001). Because the model chooses the
best possible explanatory variables, the model drops from the equation those factors that
do not significantly affect the outcome. In Table 4-6, the wealth ranking of the individual
and the total number of children in the household were variables that dropped out of the
regression equation. This was because they did not contribute significantly to the
equation, while the number of consumers, number of groups the individual was in, and
church group membership did contribute significantly to the equation.
Using the data from Tables 4-5, 4-6 and 1 to 15 in Appendix A, the researcher
obtained certain factors associated with being a member of the different groups. With all
97
of the groups, the odds of membership in the group were increased by an increase in the
number of other groups a farmer belonged to.
Dairy-goat groups. There were certain factors that increased the odds of being a
member of a dairy-goat group. These included the number of children under the age of
10 and membership in a church group. The total number of people on-farm was
associated with participation in dairy-goat groups, with those with bigger families
participating more. Also, members of dairy-goat groups had a higher percentage of
males under the age of 10 (Table 4-6). Dairy-goat groups had a significantly higher
percentage of consumers on-farm. Having a poorer water source did increase the odds of
being a dairy-goat group member; however, it was not one of the best explanatory
variables, and did not remain in the model once the variables shown in Table 4-6 were
added. The variables that remained thus better explain the factors for participation in
dairy-goat groups. These data appear to show that the dairy-goat group members were
poorer, or at least more stressed with regards to household composition, than non-
members.
Church groups. Church group members tended to be a lower age bracket than non-
members. Being a member of a merry-go-round group increased the odds of being a
church group member (Table A-2 in Appendix A). As the number of females under the
age of 10 and age of the respondent decreased, the odds of church group membership
increased (Table A-2 in Appendix A). The producer to consumer ratio was significantly
larger for church group members; in other words, they had a higher number of producers
and lower number of consumers than non-members (Table A-1 in Appendix A). These
98
data show that church group members had less stress, at least in terms of household
composition.
Clan groups. Clan group members tended to be male (Table A-4 in Appendix A).
They also had more males under the age of 10 with results approaching significance
(Table A-3 in Appendix A). Being a member of a water group increased the odds of
being in a clan group (Table A-5 in Appendix A). They received fewer remittances (off-
farm income) than did non-members, although not at a statistically significant level. Clan
group members thus likely had fewer resources in terms of remittances, and greater
household stress than non-members.
Merry-go-rounds. Merry-go-round members had smaller land sizes and tended to
be of lesser age, with results that approached significance (Table A-6 in Appendix A).
Members also tended to be female (Table A-7 in Appendix A). Being a member of a
church group and a women’s group both increased the odds of being a member of a
merry-go-round (Table A-8 in Appendix A). Merry-go-round members were thus likely
to be female community members with fewer resources who were in multiple groups.
Water groups. Water group members were likely to be male (Table A-10 in
Appendix A). They were more educated than non-members with results that approached
significance (7.72 years for members; 6.41 for non-members). Having a title deed
increased the odds of being a member of a water group, as did being a member of a clan
group (Table A-13 in Appendix A). It appears that the overall wealth rating was
associated with belonging to water groups (Table A-12 in Appendix A). (Enumerators
gave wealth ratings based on various factors such as household composition, housing

99
type, size of land, crops grown and number of livestock.) Water group members thus
appeared to be men who were wealthier than non-members.
Women’s groups. Women’s group members had significantly fewer children under
the age of 10 (Table A-14 in Appendix A). Odds of being a member of a women’s group
increased with increased levels of producers, and with being a member of a church group
(Table A-15 in Appendix A). Age, total number of children under 10, and a high
producer to consumer ratio decreased the odds of being in women’s groups. Of course,
significantly more members were female. Women’s group members appeared to be
people in the community who had less stress with regard to household composition, were
female, and were church group members.
For those individual respondents who were members of any type of group, various
reasons for joining were discussed during the interview. Table 4-7 shows the main
reasons that individual farmers gave for joining the group that they considered to be the
most important. Others said that they joined to obtain services, development or
“learning.”
Table 4-7. Reasons given by individuals for joining most important group (n = 86) Reason f % Gain benefits 52 60 Increase income 11 13 Fellowship 10 12 Help in emergency 5 6 Note. Percent does not total 100 as there could be more than one answer.
Table 4-7 shows that the main reason farmers join groups in Meru Central was to
obtain benefits. Although all of the reasons given above could be termed “benefits,”
farmers seemed to be indicating that they were seeking physical benefits, such as goats,
water tanks, piped water, or cash loans. This was confirmed through qualitative data.

100
Issues Regarding Participation in Dairy-Goat Groups
One of the issues discussed with participants was criteria for membership in the
dairy-goat groups. Because many of these dairy-goat groups were formed for the FARM-
Africa project, the group members were put together by the local chief and extension
officials. FARM-Africa also had a rule limiting the number of group members to 25.
Therefore new members could join only if someone left the group. Because of this,
during the group interviews, members were asked what the rules were for joining the
group initially, rather than asking why new farmers joined their group. Table 4-8 shows
criteria mentioned by the dairy-goat groups for becoming a member of their group. Other
requirements mentioned were for the members to be “poor” or to own a goat.
Table 4-8. Criteria for being a member of dairy-goat groups (n = 46) Criterion f % of groups Pay a fee 37 84 Be a community member 10 22 Be married 8 18 Be over 18 4 9
Table 4-8 is important, because it shows that farmers must have at least some
amount of cash to join dairy-goat groups. This may be something that prevents the very
poor in the community from joining groups with physical benefits such as the dairy-goat
groups. Poor people were in dairy-goat groups, but within the category of “poor,”
perhaps there were those poverty was such that they could not take advantage of groups.
When asked why farmers in their area were not in any type of group, farmers
responded in a number of ways. Table 4-9 shows the most frequently given answers.
When the dairy-goat groups were asked if there was anyone in their village who could
not or would not participate in groups, 67% of them said “yes.” However, a significant
amount of respondents did not believe there was anyone in their area that was not in any
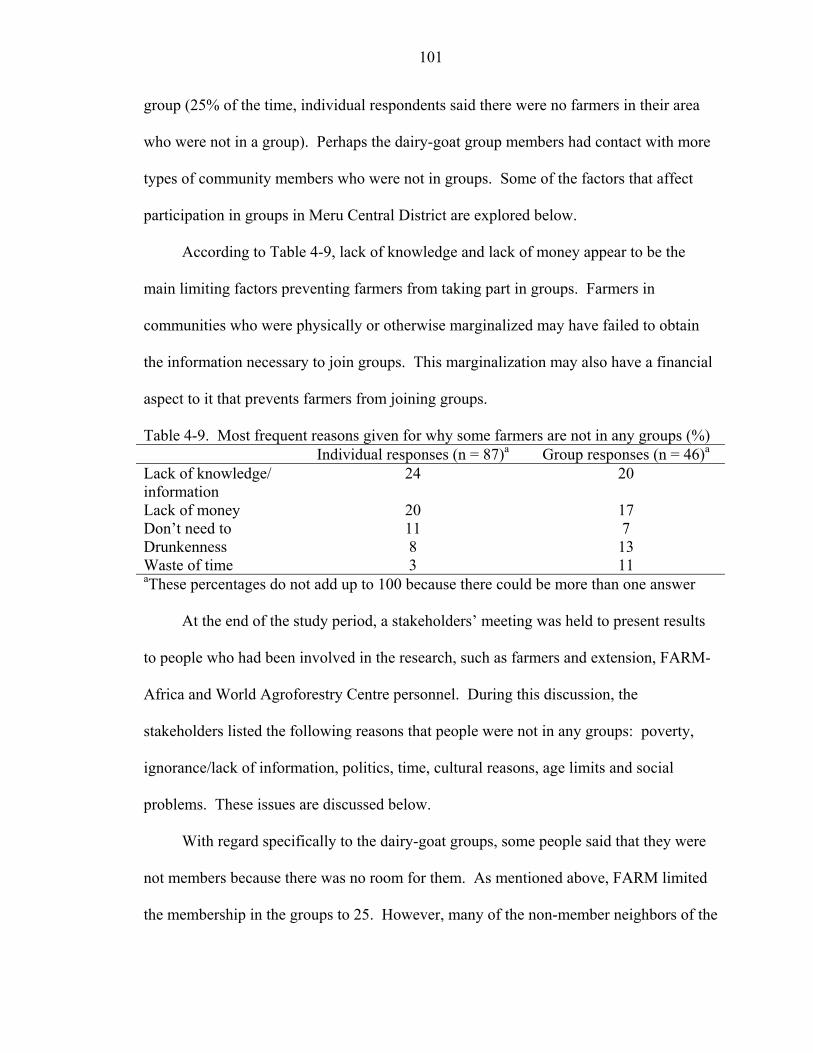
101
group (25% of the time, individual respondents said there were no farmers in their area
who were not in a group). Perhaps the dairy-goat group members had contact with more
types of community members who were not in groups. Some of the factors that affect
participation in groups in Meru Central District are explored below.
According to Table 4-9, lack of knowledge and lack of money appear to be the
main limiting factors preventing farmers from taking part in groups. Farmers in
communities who were physically or otherwise marginalized may have failed to obtain
the information necessary to join groups. This marginalization may also have a financial
aspect to it that prevents farmers from joining groups.
Table 4-9. Most frequent reasons given for why some farmers are not in any groups (%) Individual responses (n = 87)a Group responses (n = 46)a Lack of knowledge/ information
24 20
Lack of money 20 17 Don’t need to 11 7 Drunkenness 8 13 Waste of time 3 11 aThese percentages do not add up to 100 because there could be more than one answer
At the end of the study period, a stakeholders’ meeting was held to present results
to people who had been involved in the research, such as farmers and extension, FARM-
Africa and World Agroforestry Centre personnel. During this discussion, the
stakeholders listed the following reasons that people were not in any groups: poverty,
ignorance/lack of information, politics, time, cultural reasons, age limits and social
problems. These issues are discussed below.
With regard specifically to the dairy-goat groups, some people said that they were
not members because there was no room for them. As mentioned above, FARM limited
the membership in the groups to 25. However, many of the non-member neighbors of the
102
dairy-goat groups were receiving many benefits. Non-members sold a significantly
larger amount of improved goats than members (1.11 versus 0.45; t = -2.58; p < .01; df =
86), indicating that a farmer did not need to be a member of a group to benefit from it.
Non-members who benefited from dairy-goat technologies were likely people who were
able to take advantage of the technology through their resources.
Lack of knowledge/information
Some informants felt that people were not in farmer groups because they lacked
knowledge or information. In other words, if they only heard about an opportunity, they
might join a group. They also may not have had all of the facts. For instance, in the
dairy-goat project, perhaps people did not understand the purpose of the goat project and
so did not join. Likewise, they may have felt that they lacked knowledge to participate;
that is, they may not have understood how to care for the goats. This may have prevented
them from joining a dairy-goat group.
This explanation then leads to the question of why they lacked such knowledge.
Perhaps those who did not belong to any group whatsoever were socially marginalized
people. They may not have attended church. Farmers who are remote from town centers
and markets may not readily hear of opportunities and so miss out. Others may be too
busy to attend the chief baraza and discover such opportunities.
Wealth and poverty
Many of the groups formed in Kenya are for the resource-poor, to bring about some
benefit or “uplifting.” Therefore the “poor” are the ones participating in many of the
groups. One informant said, “The poor are mostly in groups.” They naturally come
together because they have needs. When FARM-Africa began their work in Meru, they
held discussions with community members about who were the “poorest of the poor.”

103
They categorized such people as having small farms and no cattle. They also had a lack
of regular income and proper shelter and could not educate their children (Report on
Project, 1999).
Although the FARM-Africa project specifically targeted poor people, it appeared
that sometimes the very poor could not join groups. Lack of capital was the main reason.
According to informants, they were the people lagging behind—they had nothing. They
may not have had the resources to join groups, or were afraid that they would be
exploited if they joined a group. One of the farmers interviewed who was not in any
group said that it was due to lack of money. Money, of course, is not the only indicator
of wealth. Many other factors were examined with regard to participation in groups—
number of various types of livestock, housing type, household composition, gender, age,
education, source of income off the farm (remittances) and amount of land (Table 4-10).
Table 4-10 shows some interesting correlations between various indicators for wealth.
For instance, the correlations between wealth level and number of improved cows (.523)
and house construction (.475) are positive, showing that increases in wealth are
associated with higher numbers of cows and better house construction. There is also a
positive correlation between wealth level and size of land (.476). Wealth level was
judged by an outsider rater and was based upon the land size related to the agroecological
zone, type of housing, household composition, and number of animals. Finally, the
negative correlation between age of respondents and amount of education (-.462) shows
that higher ages are associated with lower levels of education.

Table 4-10. Pearson’s product moment correlations between various indicators for wealth for individual farmers (n = 88)
1 2 3 4 5 6 7 8 9 10 11 12 13 14 1. Improved cows -- .156 .323* .523** .371** -.028 .212 .092 .148 .190 .004 .016 .070 -.078 2. Producer to consumer ratio -- .062 .156 -.190 -.013 .590** -.005 -.006 -.011 -.113 -.244 .186 -.040
3. Total animals -- .392* .061 .079 .154 .431* .209 .080 .058 .110 -.011 .752*** 4. Wealth levela -- .475* .020 .169 .476* .325* .179 -.099 .239 .115 .042 5. House constructionb -- -.143 .062 .212* .163 .156 -.063 -.131 .346* -.175 6. Consumers -- .755*** .264 .259 -.145 .122 .242 -.260 .143 7. Producers -- .139 .224 -.023 .049 -.096 -.037 .059 8. Total land -- .424* .117 .006 .407* -.168 .183 9. Title deedc -- -.014 .078 .369* -.144 .064 10. Remittancesc -- -.115 -.057 .120 .001 11. Genderd -- .191 .054 .123 12. Age -- -.462* .110 13. Education -- -.012 14. Improved goats --
104
a 1 = below average; 2 = average; 3 = above average b 1 = thatch roof and mud walls; 2 = thatch roof and permanent walls; 3 = permanent roof and mud walls; 4 = permanent roof & timber walls; 5 = permanent roof and walls c 1 = yes; 0 = no d 1 = male; 0 = female *Moderate magnitude; **Substantial magnitude; ***Very high magnitude
105
Perhaps the poorest farmer interviewed during the study was a grandmother who
lived in a tiny shack with her two grandchildren. She had to carry her water from a
stream. She had no animals at all, which was unusual. (Average number of animals
owned by individuals interviewed was 6.4 (SD = 8), with a range of 0 to 20.) She had 2.5
acres, but it was her brother’s land. There was no source of income from off of the farm.
She was a member of one group, a merry-go-round, and she said that she joined it to
increase income and to gain benefits.
There were costs for being in groups that were formally registered with the
government through the Department of Social Services. The advantage of being
registered was that groups could then request help from the government or organizations
that provide development assistance through groups. Even if the group did not charge
individual farmers for being a member, there were costs for the group to register. It cost
Ksh. 500 (100/- to the location (an administrative unit), 100/- to the division and 300/- to
the district) to register a group for the first time. Annual renewal was Ksh. 200 (50/- to
the location, 50/- to the division and 100/- to the district). A U.S. dollar bought about 75
shillings during the time of the research.
Within the dairy-goat groups, members had all contributed something to be a
member of the group. Therefore if a new person wanted to join, the group wanted them
to pay their fair share, so they might be asked to pay Ksh. 1000 (about USD 14) if they
joined the group late. Group members might say, “Why should so-and-so enjoy new
resources that we have worked for over the years?” Newcomers were made to pay
something to put them at par with older members. If a person does not have this money,

106
it could prevent him or her from joining the dairy-goat groups. Therefore the poor may
be kept out of such types of groups.
According to project documents and various informants, the FARM-Africa project
was designed to target poorer farmers in the communities. However, there were no
significant differences between dairy-goat group members and non-members with regard
to wealth rating by outside enumerators (X2 (2, n = 88) = 0.46; p < .29), number of
livestock, or other factors that contribute to wealth level such as size of land, years of
education, and remittances. Type of housing (X2 (4, n = 88) = 4.67; p < .32) and source
of water (X2 (3, n = 88) = 3.44; p < .33) were not significantly different for members and
non-members either. Table 4-11 shows the differences between members and non-
members.
Table 4-11. Frequencies for wealth indicators of dairy-goat group members and non-members (%) (n = 88)
Indicator Sublevel Dairy group member
Non-member Total no.
Nkia—below average 12 (14) 13 (15) 25 (28) Wealth level Gatonga—average 27 (31) 21 (24) 48 (55) Gitonga—above average 5 (6) 10 (11) 15 (17)
Permanent roof /stone walls 5 (6) 9 (10) 14 (16) House type Permanent roof/timber walls 27 (31) 27 (31) 54 (61) Permanent roof & mud walls 10 (11) 7 (8) 17 (19) Thatch roof & mud walls 0 (0) 2 (2) 2 (2) Other 0 (0) 1 (1) 1 (1)
Piped 19 (22) 25 (28) 44 (50) Water source Borehole/well 5 (6) 3 (3) 8 (9) Stream/river 1 (1) 3 (3) 4 (5)
Even within the dairy-goat groups, informants claimed that there were differences
in wealth. Additional dairy-goat groups were formed after the start of the project
(“extension groups”) that were not necessarily the “poorest of the poor.” Within the
project, informants felt that the FARM dairy-goat groups were poorer than the extension

107
dairy-goat groups, because the FARM groups were specifically chosen to be in the
project for their poverty. Extension group members, on the other hand, were people in
the community who simply decided they wanted to join the project. However, there was
no significant difference between wealth levels of FARM group members and extension
group members (Table 4-12).
Table 4-12. Wealth levels of dairy-goat members (divided into type of member) and non-members
n M SD F p FARM group member 18 1.67 0.69 1.24 0.29 Extension group member 25 1.96 0.54 Non-member 45 1.93 0.72 Note: 1 = below average; 2 = average; 3 = above average
If there were differences in wealth between dairy-goat group members and non-
members, or between FARM-Africa dairy-goat group members and non-members, the
differences were not apparent at the time of the study (Tables 4-11 and 4-12). Also, the
extension dairy-goat groups and the non-members of dairy-goat groups may have been
poor as well, since wealthy farmers with large land and dairy cattle may not have been
interested in dairy-goats.
It appeared that, as of the time of the study, most of dairy-goat group members
owned livestock such as cattle and goats. During the interviews, dairy-goat groups were
asked the number of members with no large livestock, those with goats only, or those
with goats and cows (or cows only). Only 8% of all of the dairy-goat group members had
no livestock, while 21% had goats only, and 71% had goats and cows (or cows only).
There were very few dairy-goat group members with no livestock whatsoever. This may
be due to the fact that the project was working; that is, it was designed to get dairy
animals in the hands of poor farmers, and succeeded in doing so. By many accounts from

108
informants, this is exactly what has happened. Below are some quotes from farmers
indicating this phenomenon:
• “A goat encourages someone to work hard; in homes with goats life is changing. With a goat you have milk and can sell [goats] at a higher price.”
• “We see that through goats, people have taken kids to school, built timber houses, put in water. . .”
• “Goats have bought cows.”
• “You can sell goats to solve the problem of school fees.”
• “I’ve come from far; I congratulate FARM. Nimeona mwanga (I’ve seen the light). I’m competing with the rest of the world.”
• “You can sell [goats] in an emergency and they are not a problem to feed because they don’t eat like cows; they give more milk than cows and more nutritious [milk].”
Wealth categories in Meru Wealth of farmers is still one important factor in discussing participation in groups
in general. Are the poorer farmers not able to participate due to lack of money, time or
resources? There were several categories of wealth in the Kimeru language. Many
people assigned three levels of wealth: the rich (gitonga), the poor (nkia) and the very
poor with nothing at all (nkia mukeo). Additional categories also used were gatonga
(average), gakia (very poor) and tebe (extremely poor). For this study, the main
categories used were nkia, gatonga and gitonga, which will refer to below average,
average and above average, respectively.
It is said that those in the gitonga category have improved or grade cows and
shambas (gardens). In this study the gitonga had between one and five improved cows,
with an average of three (Table 4-13).
Using Bonferroni post hoc analyses on the data in Table 4-13, it was determined
that there was a significant difference between below average and average (p < .00),

109
between below average and above average (p < .00), and between average and above
average (p < .03). Informants described gitonga as having water in their shambas. Their
shambas were bigger than those in other wealth categories. Both the husband and wife
might have regular salaries, permanent houses and cars5. They sometimes had a phone.
They had coffee income and/or a business, were employed. They appeared to have no
problem with money. They had more assets such as bicycles, solar panels or vehicles.
Table 4-13. Number of improved cattle owned by various wealth levels (n = 88) Wealth level n M SD F p Nkia (below average) 25 0.56 0.82 16.16 0.00*** Gatonga (average) 48 1.96 1.17 Gitonga (above average) 15 3.07 2.49 ***Highly significant
Gatonga, or average farmers, were below gitonga with regard to assets. They were
not likely to hold formal jobs, but might do casual labor. They might own a cart but not a
motor vehicle. Their land was smaller than gitonga farmers, and they had fewer cash
crops. Their houses were likely to be timber, not cut stone or cement. They had fewer
animals than the gitonga. However, they might still own an improved cow.
Nkia (below average) category farmers were poor but they had “something.” A
person called nkia had land and family, but no regular income. This farmer might rely on
coffee and have a very small income in terms of dairy. Informants said nkia farmers had
more children than gitonga. Depending on their location, they may or may not have
owned large livestock. In the lower zones it was more common to have local cattle and
goats, and so nkia farmers might own small number of these. They likely owned
chickens.
5 These are descriptions from people from all parts of the district, thus wealth levels are somewhat relative. Only a few farmers interviewed had vehicles or regular jobs; yet those without were still sometimes called gitonga.

110
The poor or nkia mkue people had no animals; they did not own anything. “They
do not even own a chicken.” They were the very poor, the poorest of poor. Their
children could not depend on them for their needs. These people had no independence;
they must depend on someone else. They needed to be facilitated and given resources.
Relatives sometimes cared for these farmers in terms of providing them with housing,
land to farm and occasionally cash. They would still be considered their own household
even if they were being cared for, because they would be cooking their own meals and
living in their own house.
Below are some of the variables that pointed to wealth categories, according to
informants in the study.
• House structure—stone (permanent), timber (semi-permanent), huts (mud). Within huts, mud + thatch or mud + mabati (tin roofs) were sub-categories.
• Land size—small versus big and marginal versus productive. Ten acres in marginal land did not make one rich.
• Livestock—number of cows, goats, chickens, sheep; some had no animals
• Literacy level—illiterate; primary school, secondary (rich)
• Family education—number of children in school
• Family employment—if they had children working, they were richer
• Number of children. The poorest family had “so many kids.” The wealthier had fewer children. Having many children used to be a sign of wealth if they were cared for. Now more kids equals more burdens.
• Piped water
• Assets—bikes, solar panels for power, vehicles
• Education of children. (Kids were cheap labor.)
Although informants stated that most of the poor (nkia) were members of various
groups, many of the groups had fees that very poor (nkia mkue) farmers might not be able

111
to afford. Two people were invited to join a particular group and were asked to pay Ksh.
1000 (USD 14). They did not join because the fee was too high. Eighty-four percent of
the dairy-goat groups had fees for joining the group. It appeared that there were more
non-members of dairy-goat groups who were classified as “gitonga” farmers, although
not statistically different (Table 4-11). The wealthier farmers may not have needed the
benefits gained from being in groups.
When asked whether the poor of the community were present in groups, individual
respondents ranged from “strongly agree” to “strongly disagree” on a Likert scale of 1-5,
with the average being 1.76, between strongly agree and agree somewhat (Table 4-14).
Regarding the rich, the average response for groups was 3.67 (Table 4-15).
Table 4-14. Individuals’ responses to participation in groups n M SD The poorest are present in groups 86 1.76 1.33 The richest are present in groups 85 2.28 1.58 Note. Mean based on Likert-scale items ranging from 1 = strongly agree to 5 = strongly disagree Table 4-15. Dairy-goat groups’ responses to participation in their group (n = 46) M SD The poorest are present in our group 1.54 1.31 The richest are present in our group 3.67 1.74 Our group has people from all wealth levels today 2.28 1.64 Note. Mean based on Likert-scale items ranging from 1 = strongly agree to 5 = strongly disagree
These answers seem to indicate that respondents felt the poor were more present in
their groups more than the rich. Many of the dairy-goat groups felt that all wealth levels
were represented in their groups, and a few were adamant that there were no rich people
in their group. “There are no rich people here,” stated one farmer.
112
Movement between wealth categories During the interviews farmers were asked what factors make people move between
the different wealth levels that were under discussion. The three typical wealth levels
gitonga (above average), gatonga (average) and nkia (below average) were used. Below
are some of their answers.
• “If you take a loan and can’t repay it you might move from gitonga to gatonga or even nkia”
• “One has to work hard to get to gatonga [from nkia]”
• “Moving from nkia to gitonga [immediately] is not possible unless you steal”
• “If you have a goat and it dies, you go down”
• “Sickness, laziness and carelessness can take you down”
• “Minus is not the same as plus. If you keep on subtracting without adding, you will go down.”
• “You have a red bag and a green bag. You put money in both but you don’t touch the money in the red bag. If you don’t touch that bag for a long time, you can move from nkia to gitonga.”
Social problems
Social problems may also prevent people from joining groups. One frequently
cited reason for why people were not in groups was drinking, or that “drunkards” were
not in groups. One reason cited for the problem with drunkenness in certain areas was
that people used to be busy with their coffee crop, but now that they cannot get a good
price for it, they sit around and drink instead of tending their crop. Others said that
people do not join groups because “they are criminals,” “they don’t fit in,” “they are
dishonest,” or “they can’t work with others.” During the stakeholder meeting at the end
of the research, some of the stakeholders said that social misfits, such as thieves, were not
in groups.

113
Time
Time constraints were sometimes mentioned as a reason for not joining groups.
During the stakeholder meeting, participants said that people felt groups were a waste of
time, or they did not see any quick benefits. Both individuals and groups brought up time
as a constraint. Household composition is an important factor in time and labor
availability for farmers. For instance, if there are many young children or older people
requiring care who do not perform much work on-farm or at the household, a farmer who
is a producer will have less time for her or his own work. As children get older, they can
take over some of the household responsibilities such as childcare, gathering firewood,
cooking and weeding. Sickness will also take time away from the farm work.
HIV/AIDS was prevalent in Kenya during the study. One informant stated that although
it was not yet contributing directly to agriculture in his area, there were indirect effects.
For instance, someone might have to go to the hospital, attend a funeral or have trouble
finding labor because of friends’ or neighbors’ illness. However, some informants
thought that those people not in groups perceived groups as a “waste of time.” Some
farmers believe that “they know where the market is.” They do not need services and can
market their products themselves. In other words, they have the resources and
knowledge, so it would be a waste of time to be in a group.
Gender
The dairy-goat groups seemed participatory with regard to gender. FARM-Africa
put strong emphasis on having women in the groups and in leadership positions. Women
made up 59% of group membership in the dairy-goat groups. A few dairy-goat groups
were entirely women. There were also many women in leadership positions in the dairy-

114
goat groups; 30% of the groups had female chairpersons, 44% had female secretaries and
76% had female treasurers.
There were cultural factors regarding the participation of women in groups,
especially the dairy-goat groups. In Meru culture, men own many assets such as land and
animals, while women usually do not. Although they may be encouraged to be in groups,
some women could find difficulties finding time for the group. With the dairy-goat
groups, the work added on by caring for the goats might be too much on top of the
household duties that a woman already had. Often, if just one spouse joined a dairy-goat
group, the other might get involved as well, although not necessarily officially. Since
women often cared for people and animals around the household, the chore of caring for
goats often fell on her, even if it was her husband who was in the group.
Household composition
Household composition also affected participation in groups. See Tables 4-5 and
the tables in Appendix A for more information on disaggregated household composition
and participation in groups. Although total number of household members does not show
producers, consumers or gender, it does give an overall indication of amount of people
that must be fed and clothed and cared for. Even if many more of the members were
producers, a large household would still create a larger workload.
The most common type of household was a married couple, both living on the farm
(74% of individual respondents). Other household types included single females (13%),
females whose husbands were away (11%) and single males (2%). This helps but does
not give a full picture of the stresses on the household; for instance, number, ages, and
gender of children or other people who may live on the farm such as hired workers.

115
An attempt was made to disaggregate total household composition. Two categories
were created, producers (age 11-50 years) and consumers (all of the household members).
Gender was not considered at this point. The number of producers divided by the number
of consumers made a producer to consumer ratio.
The producer to consumer ratio was then analyzed with regard to participation in
groups. To do this, the variable was split by the mean (0.63) and divided into those with
a low producer to consumer ratio and those with a high producer to consumer ratio.
There was a significant difference with regard to the number of groups that farmers
belonged between those households with low ratios and those with high (t = -2.10; p <
.04; df = 86). Those with a low ratio were in an average of 2.07 groups while those with
a high ratio were in an average of 2.72 groups. This shows that farmers with less
household stress are in more groups; likely because they have more time and even
resources.
Other reasons
According to individuals questioned, there were different reasons that people do
not belong to any group. Significantly, the most common answer was “there are no such
people.” However, there were diverse reasons that people do not join groups in general.
Some women were not allowed to by their husbands. The husbands might say that they
“will only go to gossip.” Some people see group conflict and feel that they do not want
to get involved with a group because of these types of issues. Non-members might also
be afraid to join groups, fearing that they may be taken advantage of. For instance, they
might donate money toward buying something for the group, and the money is misused.
They may not be ready to cooperate with others, or are simply uninterested in the group.
Other informants believed that “laggards” and “lazy people” do not participate in groups.

116
Some informants believed that the very rich or new settlers who have just arrived to the
area were the only people not in groups.
Many times young people, especially those who were unmarried, were not in
farmer groups, although there were groups specifically for young people as well. Some
groups would not allow young or unmarried people to join, because if they got married or
got a job, they would leave the group. Some people mentioned “youth” as people who
are not in groups, and others said the cucu (old people or grandparents) are not in groups.
There were some disadvantages to being in groups. Members must find time to
attend the meetings. It requires self-discipline to abide by the rules and regulations,
according to some informants. Almost all of the groups interviewed in the study had
fines for coming late or missing a meeting.
There was also the issue of “siasa,” problems or politics within groups.
Stakeholders felt that people did not join groups because of the hatred and conflict in
them. Some people did not join groups to avoid dealing with such relational problems.
People fear that their contributions may be mismanaged, especially after hearing such
stories from other groups. One of the two individuals interviewed who were not in any
group at all mentioned both siasa and fear of losing money. He said that one hears of
people going to town with the group’s money and using it for personal reasons instead of
for group business. He said it was discouraging to contribute and then “have your money
eaten,” so he could not see any benefit to being in a group. Extension agents estimated
that 20-30% of the dairy-goat groups had problems related to misappropriation of funds.
Several groups mentioned that they had problems with missing funds. Group members
and even outsiders might misuse group funds.
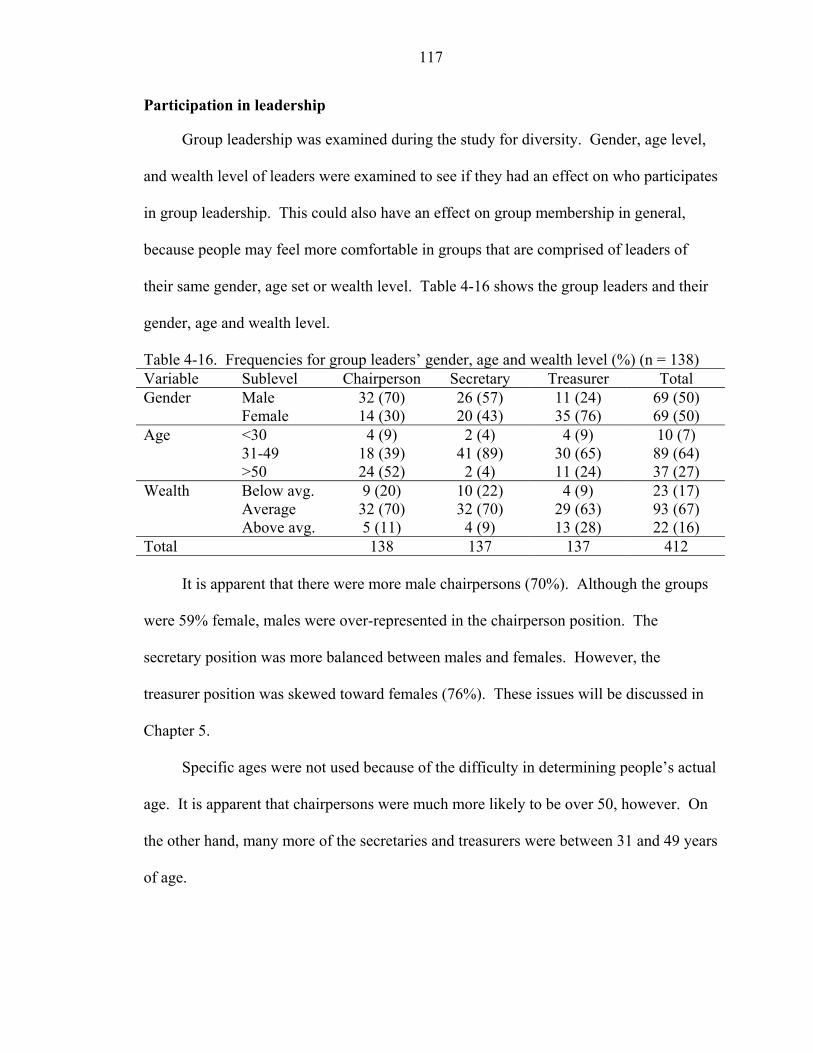
117
Participation in leadership
Group leadership was examined during the study for diversity. Gender, age level,
and wealth level of leaders were examined to see if they had an effect on who participates
in group leadership. This could also have an effect on group membership in general,
because people may feel more comfortable in groups that are comprised of leaders of
their same gender, age set or wealth level. Table 4-16 shows the group leaders and their
gender, age and wealth level.
Table 4-16. Frequencies for group leaders’ gender, age and wealth level (%) (n = 138) Variable Sublevel Chairperson Secretary Treasurer Total Gender Male 32 (70) 26 (57) 11 (24) 69 (50) Female 14 (30) 20 (43) 35 (76) 69 (50) Age <30 4 (9) 2 (4) 4 (9) 10 (7) 31-49 18 (39) 41 (89) 30 (65) 89 (64) >50 24 (52) 2 (4) 11 (24) 37 (27) Wealth Below avg. 9 (20) 10 (22) 4 (9) 23 (17) Average 32 (70) 32 (70) 29 (63) 93 (67) Above avg. 5 (11) 4 (9) 13 (28) 22 (16) Total 138 137 137 412
It is apparent that there were more male chairpersons (70%). Although the groups
were 59% female, males were over-represented in the chairperson position. The
secretary position was more balanced between males and females. However, the
treasurer position was skewed toward females (76%). These issues will be discussed in
Chapter 5.
Specific ages were not used because of the difficulty in determining people’s actual
age. It is apparent that chairpersons were much more likely to be over 50, however. On
the other hand, many more of the secretaries and treasurers were between 31 and 49 years
of age.

118
Most of the leaders seemed to be in the average wealth level. Treasurers seemed
more likely than secretaries or chairpersons to be above average.
Withdrawal from groups
Sometimes a member will withdraw from a group. A person might withdraw
because of the commitment, whether it be time, money, changes in household
composition or some other factor. They may also be unable to afford the contributions.
Other reasons for members leaving the group included expulsion, death, absenteeism,
illness, migration, domestic problems, and non-compliance (Mutia, P., FARM-Africa
Meru Tharaka-Nithi Dairy Goat and Animal Healthcare Project Progress Report, January
to June 1999).
This section examined who participates in groups and why. The next section will
examine the linkages of agricultural players in Meru Central District in general, and of
the dairy-goat farmer groups in particular.
Objective Two: Examine Linkages and Their Outcomes among Farmers and Other Extension Stakeholders
Introduction
In the previous section, participation in groups was considered. This section
examines the agricultural players and their links in Meru Central District, linkages that
dairy-goat groups have with other organizations and people, and what the outcomes of
those links were.
The goal of this study was to examine the role of farmer groups in technology
dissemination, and to assess what factors make groups effective in extending
technologies among small-scale dairy-goat farmers in Meru Central District of Kenya.
One of the objectives to meet this goal was to examine the groups’ linkages with outside

119
entities. Linkages are important both as possible mechanisms for dissemination
(Objective Three) and as a factor for success (Objective Four). Linkages were drawn out
from informants through informal interviewing, questionnaires, and Venn (chapati)
diagrams. A broad overview of linkages between agricultural players in Meru Central
District will be discussed, followed by the specific linkages that the dairy-goat groups
had, and finally the outcomes of these linkages at the group and district level.
Agricultural Players in Meru Central District
Meru is a major farming area in Kenya. It has many of the agroecological zones
found in the country, allowing for a wide variety of crops to be grown. Parts of the
district have high potential in terms of natural resources and infrastructure, which allows
farmers to both grow and market a number of crops. It is located about four hours by
tarmac road from the country’s capital city of Nairobi, and is along one of the main
routes to northern and eastern Kenya. The town of Meru is also the government district
headquarters.
Coffee was a major crop before world prices collapsed, and many farmers made
small fortunes on the crops. One informant stated, “If I were a boy now, I could not
[afford to] go to school.” Coffee money paid for many things in the 1970s and 1980s
such as school fees, vehicles, and houses. There are still a good number of well-off
people in Meru town due to coffee. This results in a certain amount of capacity6 in the
area, such as educated people, a variety of businesses, vehicles, and cash.
As a result of the factors mentioned above and the important cash enterprises in the
area (coffee, tea and dairy), there were a good number of agricultural players in the
6 “Capacity” is a word used in development that basically refers to training, skills, and capabilities of people, groups and organizations.

120
district, many of whom were linked. They worked together in various ways. For
instance, agribusinesses such as The Macadamia People and non-governmental
organizations like FARM-Africa would use government extension officers in their
training. They also preferred to work with community-based organizations such as the
farmer groups. They often funneled their projects through the churches and used the
chief barazas as venues.
There were agricultural players at the local, district, regional, national and
international levels (Table 4-17). The information shown in the table is a result of data
collected by the researcher.
Table 4-17. Agricultural players of Meru Central District Level Organization Type International International Centre for Research in the
Semi-Arid Tropics International research center
International Fund for Agricultural Development
International fund
International Livestock Research Institute
International research center
World Agroforestry Centre International research center National Agricultural Show of Kenya Government Agricultural Technologies Information
Response Initiative National government initiative
supported by World Bank British American Tobacco Private company Horticultural Crops Development
Authority Private company
Kenya Agricultural Research Institute Government Kenya Tea Development Authority Parastatal Ministry of Livestock Development &
Fisheries Government
National Agriculture and Livestock Extension Programme
Government
Radio/TV Government/private Provincial Banks Private EM Technology NGO Kari Embu Government Meru Animal Health Workers’ Group NGO/CBOa Meru Drylands Farming Project NGO Meru Goat Breeders’ Association NGO/CBO

121
(Table 4-17 continued) Plan Mbeere NGO District Catholic Church Church European Committee for Agricultural
Training NGO
Community Development Trust Fund NGO Kenya Forestry Research Institute Government Lewa Downs Private Meru Central Cooperative Parastatal/private Methodist Biointensive Centre Church Veterinarians Private Locational Agricultural Shows Government Chief baraza Government Christian Community Services Church Drug shops Private Homegrown Private company Kaguru Farmer Training Centre Government KARI Mariene Government Kamutune Tree Nursery Church The Macadamia People Private Village Churches Church Community Animal Health Workers Individuals Dairy-goat Groups CBO Savings and Credit Cooperatives CBO a Community-based organization
There were approximately five international players, seven non-governmental
organizations, 12 government institutions or parastatals, three church development
projects, four community-based players, and eight private players in the district.
As mentioned in Chapter 2, social capital is high in Kenya as a result of many
groups being formed at the village level since independence. There were therefore many
community-based organizations (CBOs) in Meru District. Sometimes such organizations
formed umbrella groups at a district or regional level. This was done through the FARM-
Africa project. The dairy-goat farmers could belong to two umbrella groups, the Meru
Goat Breeders’ Association (MGBA) and the Meru Animal Health Workers’ Group
(MAHWG). These groups represented them at locational (an administrative unit above

122
village level), district and regional levels. MAHWG also assisted private players such as
community animal health workers (CAHWs) to open rural drug shops.
Churches too were a major player in the Meru area. Nearly 100% of the farmers
interviewed called themselves Christians, and attended church. The Methodist and
Catholic churches were particularly strong, and both had agricultural programs. The
Anglican Church had an arm known as Christian Community Services (CCS), which ran
a training center for farmers in the district.
Non-governmental organizations were not quite as strong in Meru as in lower-
resource districts, but they played a role as well. Major non-governmental organizations
included FARM-Africa, SOS-Sahel, Effective Microorganisms (EM) Technology, and
the Italian water NGO Central European Farmers’ Association (CEFA). Food for the
Hungry International (FHI) was moving to Meru in 2004. With the exception of EM,
which conducted trainings throughout the district, FARM was the only NGO working in
the areas where the farmer groups were located.
There were government players at all levels in Meru. At the locational level (an
administrative level above the village) were the chiefs’ camps where barazas were held.
There were also different agricultural centers such as Kaguru Farmer Training Centre and
the Kenya Agricultural Research Institute Mariene Research Centre. Sometimes
government-run agricultural shows were held at the locational level.
Government players at the district level included the Ministry of Agriculture and
Rural Development (MOARD) and Ministry of Livestock Development and Fisheries
(MLDF). Parastatals were also present. The Kenya Tea Development Authority bought
and processed tea leaves in the tea zones. Coffee societies were very strong in the higher

123
zones. The Meru Central Cooperative worked with farmers with milk, coffee and various
other products. The two ministries MOARD and MLDF had international cooperation
with the Swedish government and the International Fund for Agricultural Development
(IFAD). The Swedes provided bilateral aid to government extension through the
National Agricultural and Livestock Extension Programme (NALEP). Donor countries
contribute 70% to the IFAD program and the national government 30%; at the time of the
study, Italy was supporting IFAD in Meru, promoting traditional food crops and
irrigation systems.
Other government organizations at a regional or national level in Meru Central
District included the Kenya Agricultural Research Institute (KARI) and Kenya Forestry
Research Institute (KEFRI). These often worked in collaboration with international
research centers such as the World Agroforestry Centre (WAC), International Livestock
Research Institute (ILRI) and the International Centre for Research in the Semi-Arid
Tropics (ICRISAT).
Private organizations and companies also played a role in agriculture. Companies
included The Macadamia People, Homegrown (for vegetables and fruit for export),
Horticulture Production Company, British American Tobacco and Mastermind. There
was also a cattle/wildlife ranch in the district with project that worked with farmers and
CBOs (Lewa Downs). Banks also played a role, providing credit for certain types of
farmers. Many of the community-based organizations such as the dairy-goat groups
maintained bank accounts. (Sixty-one percent of the dairy-goat groups interviewed had
bank accounts.)

124
Dairy-Goat Group Linkages
The information above shows the overall linkages within the area. This section
will examine linkages with the FARM-Africa dairy-goat groups in Meru Central District.
Every group had linkages with other players in the area, such as churches, the chief,
extension staff, and markets. The number of linkages the groups had varied from six to
sixteen, with the mode being ten linkages per group.
Dairy-goat group linkages were established using chapati or Venn diagrams.
Chapati diagrams are a participatory way of mapping social networking by allowing
respondents to show how one organization relates to other organizations (Figure 4-6). In
this case linkages were mapped by putting circles of various sizes on a piece of flip chart
paper. The dairy-goat group was placed in the middle of the paper. Informants were
given three sizes of chapatis (Table 4-18). The size of the chapati corresponded to the
amount of links the group had with the other organization. Position of the chapatis on
the paper signified how often the linkages occurred (Table 4-19). Usually, local terms
were used to make the farmers more comfortable.
The four major links that groups had in terms of importance (chapati size) were
government extension (“agriculture”), FARM-Africa, the church and chief baraza.
However, when they are ranked according to the total number of chapatis given, “other
farmers” moves up in rank from position seven to position four. Also, baraza moves up
to position two from position four, because it was mentioned more frequently by the
groups, but not given the highest level of importance by all of them.
Again, baraza was a link that had many chapatis given, but they were placed all
over the diagram, not just close to the group. Possible reasons for this are discussed in
Chapter 5. For “other farmers,” groups, and schools, the majority of the chapatis were

125
Figure 4-6. Chapati diagram by a dairy-goat group
Table 4-18. Sizes of chapatis given to various links with the dairy-goat groups (n = 46) Source Big Medium Small Total “Agriculture”a 36 9 1 46 FARM 27 8 0 35 Church 24 8 8 40 Baraza/ administration/chief 18 15 10 43 MGBAb 10 3 7 20 Indigenous knowledge 9 3 0 12 Other farmers 7 23 6 36 Groups 6 13 8 27 Schools 4 9 6 19 Radio/TV/mass media 3 9 5 17 Show 2 5 7 14 Market 1 1 6 8 Newspaper 0 0 6 6 a “Agriculture” refers to government extension b Meru Goat Breeders’ Association

126
placed somewhat far away. Likely all of these linkages had somewhat variable rates of
frequency of contact.
Table 4-19. Frequency of linkage with the dairy-goat groups as shown in chapati diagrams (n = 46)
Source
Touching
Farther away
Far away
Total # times mentioned
“Agriculture”a 31 13 2 46 Baraza/administration/chief 13 12 11 36 Church 23 8 8 40 Other farmers 8 27 1 36 FARM-Africa 17 13 5 35 Groups 7 18 2 27 Meru Goat Breeders’ Assoc. 7 9 4 20 Schools 5 14 0 19 Radio/TV/mass media 5 7 5 17 Show 0 5 9 14 Indigenous knowledge 7 5 0 12 Coffee society/factory 1 6 2 9 Tours/visits 2 5 2 9 Visitors 0 6 1 7 Market 0 4 4 8 Newspapers 0 1 5 6 Companies 1 0 4 5 Green Belt Movement 0 2 1 3 Clan meetings 1 2 0 3 Dairy society 0 3 0 3 a “Agriculture” refers to government extension Linkage Outcomes
Linkages in Meru District in general and with farmer groups have been described.
What was the outcome of these linkages? Associations between linkages that dairy-goat
groups had with their success in dissemination are examined in Objective Four. This
section describes some of the other major linkage outcomes.
Government extension, FARM-Africa, baraza and the church seemed to be some
of the most important linkages. This was an interesting mix of government and non-
government and of local and external links. During one interview, group members said,
127
“Extension, FARM and the church have made us to be here” (or “been our foundation”).
Sometimes a group would not specify extension (or “agriculture,” as they called it), but
would say the name of a certain extension agent. One group said that they knew
extension was an important link because if they call extension, “in a minute they are there
[to help them].” Government extension always arranged the tours and visits that groups
went on, said another group. Some groups relied on agricultural extension for advice.
Others said, “[we] do not see [extension] on the farms.”
Some groups explained that it was necessary to go through extension to get to
FARM. This seemed to be a sort of protocol or standard operating procedure. In a
similar vein, information flow sometimes seemed to move in the opposite direction. One
group said the “church gets its information from the chief, but chief gets it from
extension.”
FARM-Africa was also seen as one of the foundational linkages of the farmer
groups. One farmer said, “FARM ako ndani kabisa” (is completely inside) while
working on the chapati diagram, meaning that it was very closely linked to the group.
On the other hand, some groups felt that FARM was not very frequently linked to
them. One farmer stated,” FARM should be given a big chapati but placed in America
[very far].” Because FARM helped their original groups, but not the newer extension
ones, there were some hard feelings against the organization. One informant said,
“FARM gave goats to Igane and Ruiri [groups], but we had to buy them, so don’t even
give them a chapati.” His group did not learn directly from FARM but from the Igane
group where they bought the goats. It was common for the older FARM groups to train
the newer extension groups, who were not supported by FARM. Although FARM-Africa

128
was perceived as being far away from some of the groups at their office in Meru town,
they were an important source of information, training and technology. There were often
FARM personnel out on motorcycles traveling to various groups on business, so they
were frequently in the rural areas. Sometimes there were big arguments among group
members over both the size of the FARM chapati and its placement because of this. All
of this discussion seems to indicate that along with the successes of FARM, there were
also areas where they may have failed to help in ways that the farmers expected them to.
Another source of contention was the fact that the farmers did not go directly to
FARM, but had to use extension as an intermediary. However, sometimes the farmers
said that if they went to FARM-Africa, they were then sent to extension. Also, some
group members said that they did not know anyone from agricultural extension prior to
the FARM project, so they “knew agriculture through FARM.” They said that the
extension staff only came to them because of the project. In the argument, one farmer
said, “Remember your father—in all that we’re doing, FARM helped us.”
The chief baraza was also one of the most important links, according to many of
the groups. The chief’s office and the baraza were part of local government
administration, and were referred to as “administration.” One of the chief’s jobs is to
coordinate all of the development in the area. One group said that anyone who wants to
do anything in a community must go through administration.
Because Kenya recently had a major change of government, this affected the local
government administration as well. One group that gave administration a large chapati
said that if it were still the old government, they would have given it a small one. They
were very impressed with their chief and said, “If a problem arises even at night you go
129
to administration,” implying that it was very helpful. However, this often depended on
the individual chief. Some chiefs were very active while others were not. Again, there
was a flow of information involving the chief’s office. Extension or another entity gave
information to the chief, who then passed it on at the community level to groups,
churches and individuals.
The groups tended to link with churches more than NGOs. This was likely because
nearly all the farmers were members of a church, they were at the churches at least once a
week, and the churches were at the local level. A couple of the groups stated that the
church was one of their most important linkages, even part of their “foundation.”
However, some groups stated that “the church mostly deals with God,” and so either did
not give churches chapatis or gave them very small ones. One farmer said that the
church gets their information from the chief. Churches were mentioned as links in 40 of
the 46 groups, and were given a large chapati 24 times, a medium one eight times and a
small one eight times.
Although radio was not technically “linked” to the groups, it was often given a
chapati nevertheless, showing that it was important to many of the groups as an
information source. Radio (or the more general term mass media) was mentioned by 17
of the groups. In one case, farmers said that it was through radio that they were linked to
others; “someone may come from as far as Uganda because he has heard there are goats
in Meru.” Radio was important because they could listen to it every day. “Even today it
will tell us something,” said one farmer. Sometimes they got information secondhand
from the radio through other farmers.

130
There were different ways that the dairy-goat groups interacted with the various
entities that they had links with. The groups visited the other dairy-goat groups. For
instance, a group in Miriga Mieru might go on a study tour to Chuka (in another district)
to borrow ideas from them. Genetic material was traded and sold between groups.
Groups bought goats and obtained fodder germplasm from other groups.
Farmers from the Meru Goat Breeders’ Association and Meru Animal Health
Workers’ Group (MAHWG) and CAHWs also trained other farmers and groups. These
associations were important for linkages between the various farmers and groups,
because they were aware of much that was happening on a broader level in the entire
project area. Many of the older FARM-Africa groups had trained the newer extension
groups. One FARM dairy-goat group had helped two other groups to register their
groups and obtain goats. This group also trained the new groups.
One NGO in the area that also had dairy-goat groups, SOS-Sahel, tried to link
farmers with research institutes such as KARI, WAC, ICRISAT and the Ministry of
Agriculture and Rural Development. They also used field days. Extension informants
said that when the farmers helped to organize field days or demonstrations, they were
more powerful. Groups went to visit another sublocation for tours, to see what other
sublocations were doing. Such “cross-visits” were used to share experiences.
Workshops were a further means of disseminating information and technologies. SOS-
Sahel used what they called “village information supermarkets.” They showed videos
and pictures of various technologies to their groups, and farmers could then say, “We
want this.”
131
In conclusion, dairy-goat groups had important linkages that provided them with
information and services. It was difficult to say which ones exactly were the most
important, because they were for various purposes, provided different services and were
seen by the groups in varying degrees of frequency. However, the important linkages for
the dairy-goat groups appeared to be government extension, baraza, churches, other
farmers, FARM-Africa, and farmer groups. There was much interaction and cooperation
between all of the various players in agriculture in Meru Central District. However, there
was confusion among some of the farmers themselves as to which organizations the
individuals training them belonged to.
In this section, the links that farmer groups had with other organizations were
described. The next section examines the mechanisms that farmer groups use (many of
them involving these linkages) to disseminate information.
Objective Three: Identify the Mechanisms by Which Farmer Groups and Their Members Receive and Disseminate Information and New Technologies
The previous section discussed the linkages that dairy-goat groups have with other
entities, and the results of these linkages. This section discusses issues relating to the
third objective of the study, to identify the mechanisms by which dairy-goat groups both
disseminate and receive information and technologies.
How Dairy-Goat Groups Disseminate Information and Technology
All of the dairy-goat groups interviewed said that they told other farmers about new
information and technology. The dairy-goat groups in the study each told an average of
141 other farmers about new information and technology in the past year (the number
ranged from 0 to 3,000 farmers). The main methods that dairy-goat groups used to tell
132
other farmers about new technologies were through the chief baraza, in other farmer
groups, at the buck station, through training others, and by calling meetings.
Baraza is the community meeting held periodically by the chief. It is the
traditional method of informing villagers about various events, especially from the
government. Much information was passed along to farmers at the community level
through this forum. Extension agents often presented information at the baraza, as did
the dairy-goat groups. The merry-go-round groups often met at the chief’s camp, and so
this was another mechanism used to reach farmers with extension or other types of
messages. Trainings may also take place at the chief’s camp where baraza are held. One
dairy-goat group, for instance, had been asked by the assistant chief to teach farmers at
the baraza. Many of the dairy-goat groups (39%) mentioned that they have trained other
farmers at the baraza.
Most farmers in Meru District belonged to different types of groups, as was seen in
Objective One. Among the dairy-goat groups interviewed, 97% of these dairy-goat
farmers were in other groups. Individuals interviewed were in a number of groups
ranging from 0 to 10, with the average being 2.4 groups. During the interviews, both
dairy-goat members and non-members who had benefited from the group in some way
were targeted. Therefore 50% of the respondents belonged to dairy-goat groups. Other
types of groups that farmers belonged to are seen in Table 4-4.
Members of the dairy-goat groups also trained people in other groups that they
belonged to, such as clan and women’s groups. Through these groups, farmers from the
dairy-goat group communicated the new information and technologies they had learned.
One woman interviewed said that as they cleaned the church as a part of their women’s

133
group, they presented any new knowledge to one another. Within the dairy-goat groups,
most of the members were from different clans. This enabled a wide variety of people
from the various clans to learn about new technologies.
Buck stations were another main means that dairy-goat groups used to disseminate
information (Figure 4-7). The buck station was the center for breeding activities for a
group. A pure Toggenburg buck was kept at the buck station, and local goats and F1
crosses were brought here for breeding. The goats were usually kept in a zero-grazing
unit, where fodder was cut and carried to the goats. There were various rules for bringing
goats for service to the buck station. Often non-members were charged 50 shillings
(about 67 US cents) per service, while members paid around 25 shillings (33 cents), or
were allowed services for free. Most buck stations had pure Toggenburg bucks. There
were also three-quarter buck stations for the stabilization of F2 crosses (three-quarter
Toggenburg goats).
Seventy-four percent of individuals interviewed said that they received information
at the buck station when they took their goat there for service. At the buck stations, dairy-
goat groups reported having provided an average of four services to members and nine to
non-members in the past month. Seventeen percent of dairy-goat groups said “some” of
their neighbors had crossbred goats, and 70% said “many” neighbors had them. These
answers were crosschecked by asking the same question of external raters such as FARM
and extension staff, and averaging their answers. External raters said that in 37% of the
dairy-goat groups, “some” of the group’s neighbors had adopted dairy-goat technologies,
while they said that in 63% of the dairy-goat groups “many” had adopted them.
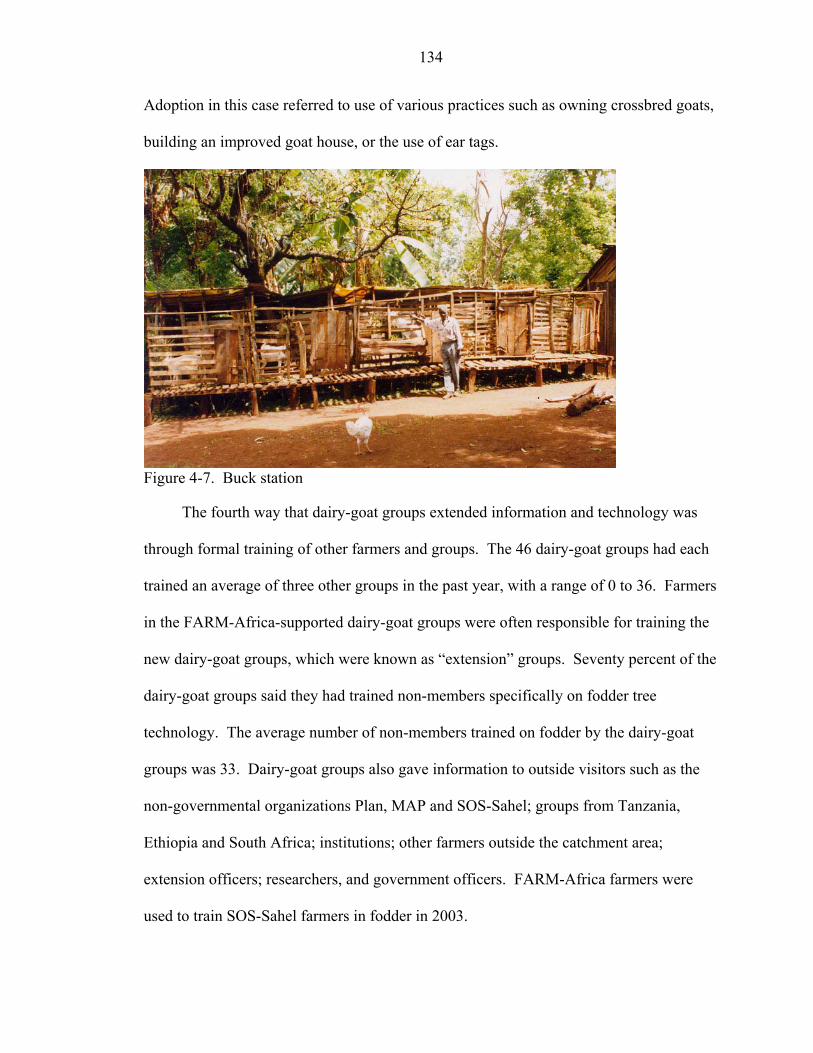
134
Adoption in this case referred to use of various practices such as owning crossbred goats,
building an improved goat house, or the use of ear tags.
Figure 4-7. Buck station
The fourth way that dairy-goat groups extended information and technology was
through formal training of other farmers and groups. The 46 dairy-goat groups had each
trained an average of three other groups in the past year, with a range of 0 to 36. Farmers
in the FARM-Africa-supported dairy-goat groups were often responsible for training the
new dairy-goat groups, which were known as “extension” groups. Seventy percent of the
dairy-goat groups said they had trained non-members specifically on fodder tree
technology. The average number of non-members trained on fodder by the dairy-goat
groups was 33. Dairy-goat groups also gave information to outside visitors such as the
non-governmental organizations Plan, MAP and SOS-Sahel; groups from Tanzania,
Ethiopia and South Africa; institutions; other farmers outside the catchment area;
extension officers; researchers, and government officers. FARM-Africa farmers were
used to train SOS-Sahel farmers in fodder in 2003.

135
Lastly, dairy-goat groups informed other farmers of new information and
technologies by calling meetings. For instance, if an extension agent was coming to train
the group, they may have invited their neighbors. When fodder was being distributed to
the dairy-goat groups, they often involved the whole community in both the training and
the distribution of fodder seedlings. Groups also held their own training sessions, or
invited other farmers to their meetings.
In addition to these five major ways of information dissemination (baraza, groups,
the buck station, training, and calling meetings), many other means were used to tell
others. Other ways that dairy-goat groups used to disseminate information and
technologies to other farmers included the breeding stations, community animal health
workers (CAHWs), fodder tree nurseries, churches, and through neighbors and visitors.
The dairy-goat group breeding stations were similar to the buck station, but their
purpose was to breed more pure Toggenburg goats. A breeding station consisted of a
buck and four does, all purebreds. The breeding station buck was only to serve pure does
and not local or F1 goats. One group member stated that when visitors came to their
breeding station [to learn about the project], she told non-group members to come and
learn from the visitors. Although non-member farmers were less likely to have contact
with a breeding station unless they were buying a pure goat, it was still a place that they
knew they could go to in order to find out more information on the goats or on fodder.
All of the breeding stations had fodder banks of improved trees, and several of the dairy-
goat groups mentioned that they were letting certain trees go to seed to provide
germplasm to others.

136
Informants mentioned that community animal health workers (CAHWs) were
another method that the group used to disseminate information and technology. The
CAHWs were trained in each of the FARM dairy-goat groups to provide basic animal
care. CAHWs then trained other farmers, especially dairy-goat group members, in animal
health. They were also certified to do basic treatment of animals in the local community,
and thus had a chance to make contact with many farmers. Eighty-five percent of
CAHW customers were non-members. Although there were CAHWs in each of the 20
FARM groups, not all of the 26 extension groups had CAHWs. This was because the
groups were formed after the CAHW training had taken place for the older FARM
groups, and the funding did not allow for further training sessions. These new groups
therefore had to arrange for their own training and cover the expenses.
Tree nurseries also provided a dissemination spot. Many of the dairy-goat groups
had nurseries for fodder and other trees, and some had “bulking sites” that were meant to
provide germplasm to farmers, and provide income through the sale of fodder for feed.
Nurseries were mentioned as a place for dissemination of information, and of course
technology in the form of germplasm. Almost all of the dairy-goat groups (91%) had
been trained on fodder technologies. Although quite a number of the dairy-goat groups
had nurseries or bulking plots, none of the groups sold fodder seedlings or seeds to other
farmers. However, 70% of dairy-goat groups said that they gave fodder seedlings or
seeds to people outside the group (Table 4-20).
Table 4-20. Amount of fodder seedlings given by dairy-goat groups to non-members n Minimum Maximum M SD Amount of seedlings 25 0 5000 292.96 995.08Number of people
receiving fodder 36 0 100 18.81 25.29
137
Churches were also focal points of the community and therefore for dissemination.
Because churches were so prevalent in Meru, they were often targeted as a venue for
information exchange. Many of the announcements made at chief barazas were also
made at churches. Also, FARM-Africa farmer extension workers (FEWs) in Meru would
request to be given 30 minutes after church services to talk about dairy-goat technologies.
One extension agent stated, “We use the churches to promote [technology].” Nearly one
hundred percent of farmers surveyed attended church. One farmer stated, “After seven
days we go to church,” which means that farmers were in church quite frequently.
Barazas could be held monthly or less frequently, depending on the chief. Although
churches were often used by extension and NGO projects mainly as a place to make
announcements, some churches had seminars and trainings. Thirty-five percent of
individual respondents listed churches in the top three places where they get agricultural
information. Sixty-two percent stated that they get information from their churches.
There was no significant difference in type of church attended and whether they obtained
information from their church.
One of the key ways in which dairy-goat groups passed along information and
technology was through people they casually came in contact with, such as neighbors and
visitors. The breeding facilities of the dairy-goat groups were located within the local
communities, in contrast to the traditional breeding stations at research sites. Once a
farmer adopted a technology such as an improved dairy-goat or fodder trees, neighbors
were able to see what he or she are doing and learn and copy from him or her. Dairy-goat
groups passed on information this way to other groups and individuals. Many farmers
learned things by copying their neighbors or seeing a technique on another farm.

138
Informants also mentioned that they told visitors about new technologies. Farmers
interviewed also said that they obtained information through discussion with other
farmers.
How Dairy-Goat Groups and Individuals Receive Information and Technology
It is also beneficial to look at where dairy-goat groups themselves get information
to more clearly understand the ways that information and technologies are passed along
at the community level. Despite the new pluralistic extension environment in Kenya,
some of the traditional providers such as government extension and local administration
(government baraza) came out as major sources.
Sources of Information for Dairy-Goat Groups
The most important sources of information for the dairy-goat groups were (a)
extension, (b) baraza, (c) FARM-Africa, (d) other farmers and (e) churches. The
percentages of times various sources were named are shown in Table 4-21.
Table 4-21. Most important sources of information listed by dairy-goat groups (n = 46) Source f % (of time in top 3) Government extension 39 85 Baraza 22 48 FARM-Africa 21 47 Farmers 13 28 Church 8 17 Note. These percentages do not add up to 100 because each row reflects the percent of times that the source appeared in the top three (for instance, 85% of the dairy-goat groups mentioned extension).
In 85% of the dairy-goat groups, government extension, known as “agriculture,”
was mentioned as one of the top three sources of information for their group. Sixty-three
percent of dairy-goat groups mentioned it as the number one source. Government
extension included extension agents at various levels from the Ministry of Agriculture
and Ministry of Livestock Development and government veterinarians. It also included

139
government-sponsored field days and demonstrations and agricultural shows that were
held at various administrative levels. This was a good opportunity for farmers not only to
learn from “experts” but from fellow-farmers on various information and technology.
Several dairy-goat groups mentioned that they trained others at shows.
Twenty percent of dairy-goat groups mentioned FARM as the number one source
of information, and 47% of the groups mentioned it in the top three sources. When the
data are examined after controlling for type of group (extension or FARM), 8% of
extension groups mentioned FARM as a number one source, while 35% of FARM groups
said FARM was the number one source of information. There was a significant
difference between groups as to the number one source of information (X2 (2, n = 38) =
11.83; p < .00) (Table 4-22).
Table 4-22. Number one source of information for dairy-goat groups by type of group (%)
Extension Source FARM Source Total FARM groups (n = 20) 12 (60) 7 (35) 19 (95)a Extension groups (n = 26) 17 (65) 2 (8) 19 (73)a Total 29 9 38 a The other groups listed a source besides extension or FARM
Although baraza was rarely mentioned as the number one choice, it appeared in the
top three in 48% of the dairy-goat groups surveyed. The baraza and churches came out
as important places for information and technology dissemination during the study. Both
training and announcements took place at these venues. If there was a new project or
technology in an area, government officials such as extension agents always used them
along with other places such as schools and markets through which to make
announcements. Many of the dairy-goat groups were invited to the baraza to share with

140
other farmers what they have learned. One group, which had trained 36 other groups in
the past year, said, “Wherever there is a meeting we go and talk.”
Churches were also a source of information. This was usually as a venue for
trainings or announcements, however, rather than as providers of extension services. In
extension, there are both extension providers and sources of information. For instance,
the government and some churches and NGOs had specific people who trained farmers in
different technologies. On the other hand, there were other sources of information that
did not necessarily train, such as other farmers, churches, and baraza. However, as with
the linkages, there were many gray areas where there was a crossover in extension
providers. For instance, government extension people often trained at churches or
baraza. This made it difficult to specify whether an agricultural player was an extension
provider/trainer, or simply a source or a channel for information at times. However, most
of the time, the information that the trainers had was supplied either by the government
extension or by FARM-Africa.
Sources of Information for Individual Farmers
The sources of information for individual farmers were very diverse. The most
important sources of information for individuals were (a) extension, (b) the church, (c)
other farmers, (d) indigenous knowledge, (e) groups, (f) baraza and (g) FARM-Africa
(Table 4-23). Other sources of information mentioned by key informants were mass
media, study tours, NGOs, research centers, salespeople, seminars, visitors, cooperatives,
coffee factories/societies, books, tobacco monitors, schoolchildren, hospitals, local
leaders, the MGBA, forefathers (indigenous knowledge), training centers, agricultural
students on attachment, agro vets, video shows and horticultural companies.
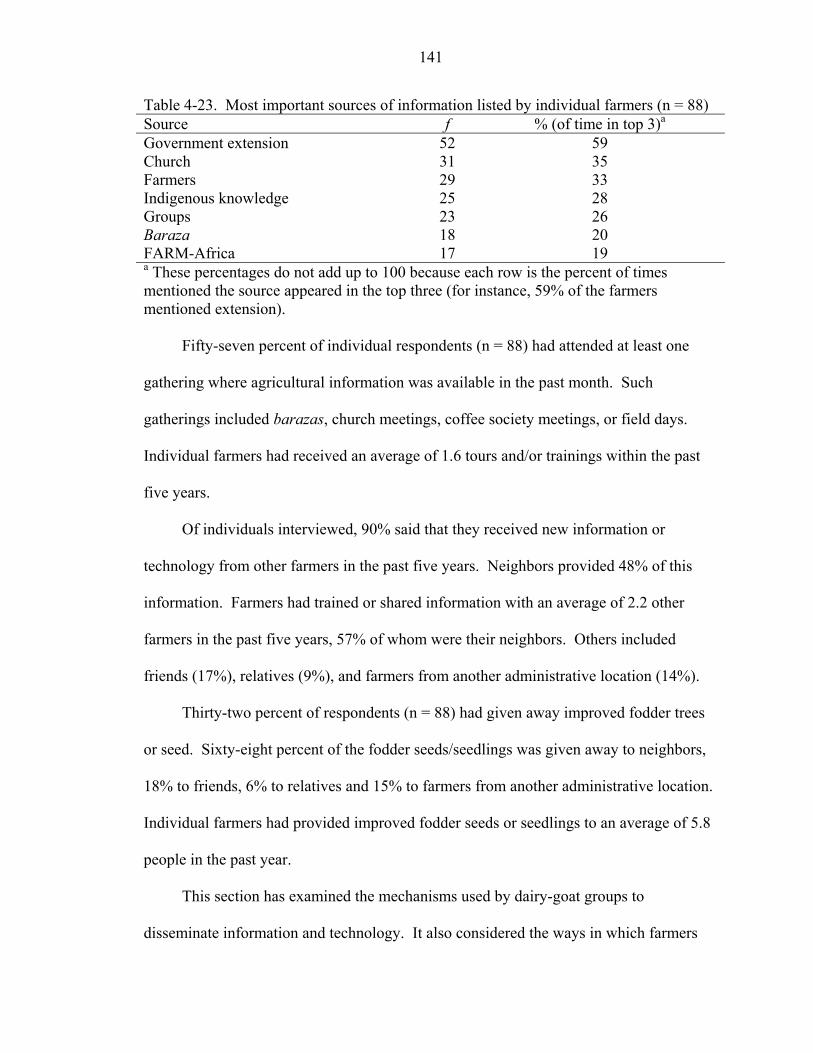
141
Table 4-23. Most important sources of information listed by individual farmers (n = 88) Source f % (of time in top 3)a Government extension 52 59 Church 31 35 Farmers 29 33 Indigenous knowledge 25 28 Groups 23 26 Baraza 18 20 FARM-Africa 17 19 a These percentages do not add up to 100 because each row is the percent of times mentioned the source appeared in the top three (for instance, 59% of the farmers mentioned extension).
Fifty-seven percent of individual respondents (n = 88) had attended at least one
gathering where agricultural information was available in the past month. Such
gatherings included barazas, church meetings, coffee society meetings, or field days.
Individual farmers had received an average of 1.6 tours and/or trainings within the past
five years.
Of individuals interviewed, 90% said that they received new information or
technology from other farmers in the past five years. Neighbors provided 48% of this
information. Farmers had trained or shared information with an average of 2.2 other
farmers in the past five years, 57% of whom were their neighbors. Others included
friends (17%), relatives (9%), and farmers from another administrative location (14%).
Thirty-two percent of respondents (n = 88) had given away improved fodder trees
or seed. Sixty-eight percent of the fodder seeds/seedlings was given away to neighbors,
18% to friends, 6% to relatives and 15% to farmers from another administrative location.
Individual farmers had provided improved fodder seeds or seedlings to an average of 5.8
people in the past year.
This section has examined the mechanisms used by dairy-goat groups to
disseminate information and technology. It also considered the ways in which farmers
142
and dairy-goat groups at the community level access information and technology. The
final section of Chapter 4 will discuss the factors characteristic of dairy-goat groups that
are successful in disseminating information and technologies to other farmers.
Objective Four: Identify the Factors Characteristic of Groups Successful in Disseminating Technology
In the previous section, the mechanisms used by dairy-goat groups in disseminating
information and technology were discussed. This section will look at the factors that are
associated with dairy-goat groups that are successful in extending information and
technology.
In the review of literature in Chapter 2, several characteristics of groups that were
successful in their performance were mentioned. This study looks specifically at one
aspect of performance, the groups’ function in disseminating information and technology
to other farmers. Some of the factors mentioned in Chapter 2 were the size of groups,
group age, cohesiveness, homogeneity of members, number of activities, training, group
purpose, whether that purpose had changed, and linkages with service providers.
During the study, local informants in Meru also discussed various factors that they
believed made the dairy-goat groups successful in dissemination or extension. According
to key informants and a FARM-Africa document resulting from a stakeholder meeting on
farmer-to-farmer dissemination, such factors included population density, agroecological
zone, distance from information sources, type of group (FARM-Africa or extension
assisted), group resources, poverty of members, leadership/leader commitment, gender
balance, record keeping, member commitment, group unity, discipline and management
(FARM-Africa minutes of the stakeholders meeting held on 15 May 2003).
143
The following factors will be discussed in this section: group location (including
population density, administrative division, altitude and agroecological zone), size of the
group, member participation, gender, age of the group, formality, leadership, number of
activities, homogeneity of members, cohesiveness/unity, jealousy7, number of
trainings/tours, number of linkages, and type of group. These factors were the
independent variables for this part of the study.
For the analysis, the dependent variable, success in dissemination, was measured
using a variety of indicators. These were determined through the groups’ own
perceptions of success in dissemination to other farmers, through external ratings of the
groups by extension and FARM staff, and through quantifiable variables such as number
of other farmers and groups trained by the group. The groups gave their perceptions of
their strength in dissemination to other farmers on a Likert scale of one to five. Three
external raters from FARM-Africa and government extension also rated each group’s
dissemination success. Groups and raters were also asked to estimate the number of the
group’s neighbors that have adopted the improved dairy goats/dairy-goat technologies on
a scale of one to four. Groups were asked to estimate figures such as number of fodder
seedlings distributed, number of other groups trained and number of people receiving
fodder seedlings from the group. Finally, the number of buck services provided by the
groups was available from group records. These factors were the dependent variables in
the analysis.
It is necessary to define what is meant by the term “adoption,” since the term is
used in identifying success factors. There are many ways of defining adoption. Due to
7 In this study, jealousy (roritho in Kimeru) refers to the feelings of rivalry and envy between people or groups, and the state of being desirous of another’s advantages.

144
the nature of the questionnaires and complexity of translating meanings into different
languages, farmers were simply asked whether neighbors possessed improved goats and
related technologies, without regard to number and length of time. Adoption here is not
referring to any formal measures of the construct, such as length of time or number of
goats or technologies used. (For example, with fodder shrubs for dairy goats, World
Agroforestry Centre defines adoption as having expanded fodder planting at least once
and possession of over 100 trees.) For the purposes of this study, however, adoption
refers to the use by farmers of the various dairy-goat technologies.
To more easily examine the effects of the various factors on success indicators, an
index was created. The “adoption index” is an average of the dairy-goat groups’ ratings
of number of neighbors adopting goats averaged together with the three external raters’
scores on the numbers of neighbors who have adopted dairy-goat technologies. These
scores could range from 1 to 4, where 1 = none, 2 = some, 3 = many, and 4 = all.
Cronbach’s alpha for this index was 0.69. This high alpha and the fact that the index
comes from more than one source make it a useful measure of success, and so the
adoption index was used the most for analysis. The other strong measure is number of
buck services, because the results came not only from what the group told the researcher
but also from the group records.
To better describe the data and in preparation for inferential analysis, correlations
between variables were examined (Table 4-24). Substantial correlations were found
between formality level of the group and perceived unity (r = .512), and member
participation and type of group (r = .686). Moderate correlations were found between the
adoption index and the age of the group (r = .492), between age of the group and number
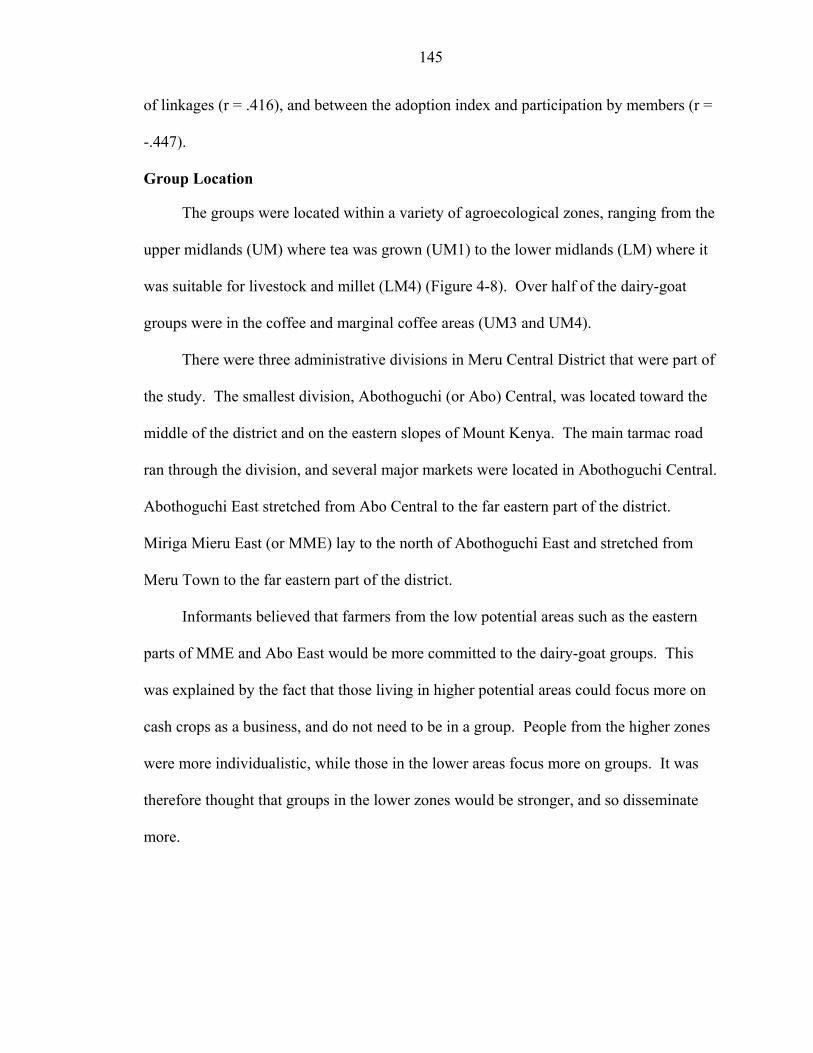
145
of linkages (r = .416), and between the adoption index and participation by members (r =
-.447).
Group Location
The groups were located within a variety of agroecological zones, ranging from the
upper midlands (UM) where tea was grown (UM1) to the lower midlands (LM) where it
was suitable for livestock and millet (LM4) (Figure 4-8). Over half of the dairy-goat
groups were in the coffee and marginal coffee areas (UM3 and UM4).
There were three administrative divisions in Meru Central District that were part of
the study. The smallest division, Abothoguchi (or Abo) Central, was located toward the
middle of the district and on the eastern slopes of Mount Kenya. The main tarmac road
ran through the division, and several major markets were located in Abothoguchi Central.
Abothoguchi East stretched from Abo Central to the far eastern part of the district.
Miriga Mieru East (or MME) lay to the north of Abothoguchi East and stretched from
Meru Town to the far eastern part of the district.
Informants believed that farmers from the low potential areas such as the eastern
parts of MME and Abo East would be more committed to the dairy-goat groups. This
was explained by the fact that those living in higher potential areas could focus more on
cash crops as a business, and do not need to be in a group. People from the higher zones
were more individualistic, while those in the lower areas focus more on groups. It was
therefore thought that groups in the lower zones would be stronger, and so disseminate
more.

Table 4-24. Pearson’s product moment correlations between variables affecting success (n = 46) 1 2 3 4 5 6 7 8 9 10 11 12 13 14 1. Homogeneity -- .147 -.416* -.030 -.230 -.283 .051 .123 -.148 .056 .227 .176 -.246 -.097
2. Leadership -- -.193 .320* -.101 .080 .005 -.178 .208 .242 .065 .316* -.148 -.038
3. No. activities -- .012 .195 .305* .207 .257 .030 .055 -.210 -.051 .250 .164
4. No. members in MGBAa -- -.144 .044 .057 -.076 .048 .209 -.050 .150 .196 -.071
5. No. linkages -- .195 .416* .118 .311* .082 -.321* -.061 -.023 .241
6. Formality -- .339* .512** .253 .286 .142 .280 .096 .170
7. Age of group -- .148 .322* .492* .160 .452* -.139 .210
8. Unity -- -.039 .084 -.297 -.081 -.063 .112
9. Jealousy -- .329* -.167 .347* -.035 .269
10. Adoption index -- -.447** .686** -.231 .347
11. Member participation -- .310* -.287 -.011
12. Type of groupb -- -.153 .426
13. Group size -- -.117
14. Group capacity-trainings --
146
a Meru Goat Breeders’ Association; b 0 = extension; 1 = FARM; *Moderate magnitude; **substantial magnitude

147
Figure 4-8. Agroecological zones in Meru Central District
On the other hand, it was expected by informants that dairy-goat groups in higher
potential zones such as coffee and tea would possibly disseminate more because of the
higher population density. This would include Abothoguchi Central and the western
parts of MME and Abo East. It would also include high altitude areas. These groups
should also be able to more easily access information. Population density was not
measured in specific locations. However, according to the district records, the expected
population density for 2004 for Abothoguchi Central was 552 persons per square
kilometer, Abothoguchi East was 187 and Miriga Mieru East was 364 (Meru Central
District Development Plan, 2002). Population density can also be projected from
agroecological zone, because the higher agroecological zones have higher population

148
densities, and vice versa. See Table 4-25 for correlations between division,
agroecological zone, altitude and indicators of success.
Table 4-25. Pearson’s product moment correlation coefficients between location and success indicators (n = 46)
Success Indicator Division a Agroecological zone b Altitude No. of farmers told -.174 .151 .200 No. of groups trained -.215 .303* .253 Amount of fodder given -.301* .059 .129 No. of people receiving fodder -.395* .273 .319* No. of neighbors planting fodder -.311* .177 .264 No. of neighbors adopting goats -.131 .238 .181 No. of buck services provided -.098 -.253 -.170 Index on adoption -.039 .106 .083 a 1 = Abo Central; 2 = Abo East; 3 = Miriga Mieru East b On a scale of 1-7 where 1 = Lower Midlands (LM) 5; 2 = LM4; 3 = LM3; 4 = Upper Midlands (UM) 4; 5 = UM 3; 6 = UM2; 7 = UM1 *Moderate magnitude
Correlations were negative for division because of the way administrative divisions
were coded. Abothoguchi Central was given a “1”; Abothoguchi East “2”; and Miriga
Mieru East “3.” Therefore higher levels of success were associated with the lower
numbers, or with Abo Central and Abo East Divisions. The number of people receiving
fodder seedlings from groups was moderately associated with the administrative division
(r = -.395). Adoption of improved fodder trees also appeared to be moderately correlated
with division (r = -.311).
There were significant differences between the divisions as to number of neighbors
planting fodder (X2 (6, n = 46) = 13.76; p < .03), indicating that farmers in Abothoguchi
Central (1) or Abothoguchi East (2) were disseminating more than farmers in Miriga
Mieru East (3). Other success indicators, such as the number of neighbors adopting goats
(X2 (2, n = 46) = 4.27; p < .37) and group rating of success (X2 (8, n = 46) = 8.78; p <

149
.36), were not significantly different by division. Possible reasons for this are discussed
in Chapter 5.
Location of dairy-goat groups may also be affected by availability of natural
resources such as rivers and forests (Figure 4-9). Judging natural resources in an area can
be difficult, however. Although a group may be located near a river, other groups might
have just as good water resources through a well or smaller stream. Although farmers
could obtain many benefits from forests, during the study period the forests were
officially closed to farmers and herders in Meru. Six dairy-goat groups were located in or
near the edge of the forest.
Location may also be affected by proximity to roads and markets (Figure 4-10).
Again, this map may not tell the full story. It shows major roads, but not the smaller
ones. However, the roads shown on the map are the ones that are more likely to be
passable during rains, since they are major roads that will be kept under better repair due
to heavier traffic. Even major roads are at times impassible, however (Figure 4-11), and
fares go up for passengers and luggage during rains. Major market towns include Meru
and Nkubu. However, other important markets such as Kariene, Gatimbi, Mitunguu and
Murika are not even shown. A few groups in Miriga Mieru East division and a good
number of the groups in Abothoguchi Central were located close to roads and/or markets.
The distance of dairy-goat groups to market was moderately correlated with the
number of buck services within groups (r = .442; n = 42). This gives an indication that
groups in the lower zones at a greater distance from markets might have been
disseminating more. It could also be due to the fact that there were more goats in the
lower regions, further from market areas. There were more livestock in the lower areas

150
because the land sizes were bigger and there was grazing land available. No other
success indicator had a high magnitude of covariance with this distance from market,
however.
Finally, elevation was an important component of dairy-goat group location (Figure
4-12; see also Figure 4-8 for agroecological zones). Altitude can affect rainfall,
temperature and other climatic conditions. There was a significant difference in success
in dissemination between groups that were located in low elevations (up to 1278 m) with
those in high (above 1278 m) (Table 4-26), such that it appeared that groups in higher
altitudes were more successful in dissemination of technologies. However, altitude was
not significantly different for the stronger success indicators “adoption index” and
“number of buck services,” the main success indicators discussed earlier in this section.
Rather, the indicators that had more to do with fodder in general and not necessarily
dairy-goat technologies per se. This is discussed further in Chapter 5.
Table 4-26. Effect of high and low group elevation on success indicators (n = 46) Success indicator Low elevation
(<1,278 m) High elevation (>1,278 m)
n M SD n M SD df t p No. of groups trained
20 1.60 2.21 21 5.19 7.73 39 -2.00 0.05**
No. people receiving fodder
17 5.71 12.05 19 30.53 28.42 34 -3.34 0.00***
No. of neighbors planting fodder
17 2.06 0.66 21 2.52 0.68 36 -2.13 0.04**
**Significant; ***highly significant Group Size and Member Participation
As discussed in Chapter 2, the size of the group has been shown to be associated
with the success of farmer groups. There was a range of 10 to 50 members per dairy-goat
group, with the average being 23. Number of members was substantially correlated with
the number of neighbors planting fodder trees (r = -.520; p < .00; n = 38).

151
Figure 4-9. Natural resources in Meru

152
Figure 4-10. Roads and towns in Meru Central District
Figure 4-11. A main road leading out of Meru town with vehicles stuck in the mud
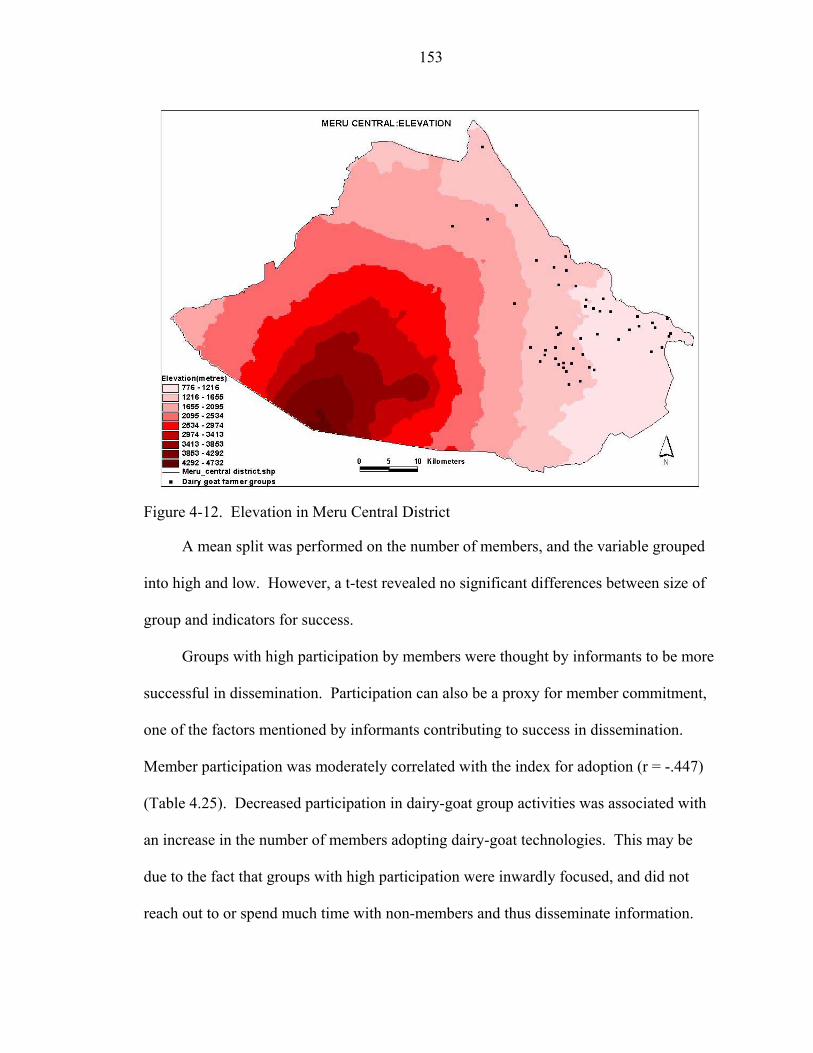
153
Figure 4-12. Elevation in Meru Central District
A mean split was performed on the number of members, and the variable grouped
into high and low. However, a t-test revealed no significant differences between size of
group and indicators for success.
Groups with high participation by members were thought by informants to be more
successful in dissemination. Participation can also be a proxy for member commitment,
one of the factors mentioned by informants contributing to success in dissemination.
Member participation was moderately correlated with the index for adoption (r = -.447)
(Table 4.25). Decreased participation in dairy-goat group activities was associated with
an increase in the number of members adopting dairy-goat technologies. This may be
due to the fact that groups with high participation were inwardly focused, and did not
reach out to or spend much time with non-members and thus disseminate information.

154
Perceptions on group member participation were skewed (4.43 on a scale of 1 to 5, where
1 = strongly disagree and 5 = strongly agree that members participate). However, this
variable did show up as an important contributor to group success in multivariate analysis
(Table 4.33).
Group Age
The age of the dairy-goat groups ranged from two to twelve years. Average age for
the groups was six years. There was a moderate correlation between age of the group and
the index for adoption (r = .492; n = 46).
The variable was split by mean age into two groups, coded as high group age and
low group age. A t-test was then performed on this variable with various indicators for
success (Table 4-27). This table shows some important differences between groups with
a low age (six years or less) with those of a high age (greater than six years).
Table 4-27. Effect of low and high group age on success indicators (n = 46) Success indicator Low age (<6 years) High age (>6 years) n M SD n M SD df t p Adoption index 23 2.55 0.29 23 2.87 0.31 44 -3.56 0.00***No. of buck services 21 10.57 10.65 21 16.33 9.11 40 -1.88 0.07* *Approaches significance; **significant; ***highly significant
Table 4-27 appears to indicate that groups with higher ages have higher rates of
dissemination. This issue is discussed further in Chapter 5.
Formality and Management
All of the dairy-goat groups but one were registered through the Department of
Social Services and with the Meru Goat Breeders’ Association (MGBA), showing a large
degree of formality. Most of the dairy-goat groups were quite similar to each other with
regard to degree of formality, because in order to register their group with the
Department of Social Services, they were required to have a constitution and by-laws.

155
Nearly all the groups had penalties such as fines and expulsion for certain behavior
within the group; therefore it is difficult to judge success through group discipline. An
index of formality was developed using registration with the Department of Social
Services and possession of a constitution, by-laws and a bank account. This index was
then split by the mean into two groups, and the high formality group compared to the low
formality group. There were no significant differences in level of success according to
level of formality.
Most of the dairy-goat groups (67%) met biweekly or monthly. Informants
believed that groups that met regularly and frequently (at least once a week) would be
more successful in dissemination. However, there were no significant correlations
between how often groups met and any indicators of success. After splitting the groups
into those that met with low frequency to those that met with high frequency, a t-test
revealed no significant differences for groups with high meeting frequency and those
with low.
Informants also believed that groups with good record keeping would be better
disseminators. Statistical analysis showed that record keeping was moderately associated
with the adoption index (r = -.323; n = 46). However, Likert-scale responses to the
statement “The group keeps good records on activities” were skewed toward strongly
agree (with an average of 4.24 on a scale of 1 to 5, where 1 = strongly disagree and 5 =
strongly agree). The negative correlation could be possibly due to dissatisfaction with
one individual who did not affect overall group performance. Also, the low educational
levels of the farmers in the study could affect record keeping negatively, while not
affecting overall success.

156
Leadership
Leadership of the dairy-goat groups may have a certain effect on the success of
groups in disseminating information and technologies. It was difficult to get varied
responses on the leadership of the groups. During the testing phase of the questionnaires,
groups were asked about how leaders were chosen and how decisions were made. All of
the responses were the same, and so those specific questions were removed. Because of
the FARM-Africa influence, the groups were supposed to hold regular elections, and
most claimed that they did. The question was probed during the group timeline
discussion to see if the elections were something only in name, or whether they actually
changed leaders. In most cases, they did change leaders.
The questions that remained on the survey regarding leadership were on a Likert-
scale-type question regarding whether members had a chance to participate in group
decision making, if they felt the leadership was good, and if the leadership was
participatory. All groups but one agreed strongly that they had the opportunity to
participate in group decision making, and that the leadership was participatory and/or
democratic. There was slightly more variation in responses to whether they felt that the
leadership was good. However, the mean for the variable was 4.59 on a scale of 1 to 5,
where 1 = strongly disagree and 5 = strongly agree, showing, a high skew toward the
perception that leadership was good. Sixty-eight percent of dairy-goat groups agreed
strongly that leadership was good, 14% agreed somewhat, 6% neither agreed nor
disagreed, and 4% disagreed somewhat. No groups said that they disagreed strongly that
their leadership was good.
One aspect of leadership that may have made a difference as to success of the
group was gender of the chairperson. Gender of the chairperson made a difference in

157
group success with results that approached significance (t = -1.96; p < .06; df = 44). This
t-test between groups that had female leaders and groups that had male leaders showed
the groups with male leaders had higher success rates on the index of adoption, with the
averages being 2.57 for females and 2.77 for males.
Informants felt that leadership affected the success in dissemination by groups.
Leaders that were capable and honest and not lazy would encourage the groups to work
well together, while dishonest or lazy leaders could cause the group to not work well
together or even to fall apart. In this case, the group would likely not do a good job in
dissemination. However, measurement and analysis of these constructs were beyond the
scope of the study.
Activities
There were no significant correlations between the number of activities the dairy-
goat groups conducted and indicators for success in dissemination. Mean number of
activities was 2.5, but the range was between zero (for a group that had stopped its
activities) and seven. Most groups took on one to three activities. Activities included
dairy goats, merry-go-rounds, tree nurseries, and farming. A t-test revealed no major
differences between groups with few activities and those with many.
Gender, Poverty and Individuals in the Group
The dairy-goat groups were mostly mixed male and female, with a few being only
one gender. Overall, the groups were 59% female. There were no significant
associations or differences in means between dairy-goat group success and the gender
balance of the groups.
There were mixed results when correlating wealth indicators with success
indicators (Table 4-28). There were negative correlations between the number of

158
members who have no livestock at all with the two success indicators, the adoption index
and number of buck services. There was a positive moderate association between land
size of group members and number of buck services (r = .311), while the association with
the adoption index was negative (r = -.305). Number of buck services was negatively
correlated with the average number of local cows per group (r = -.342).
These mixed associations point to the difficulty in assessing wealth levels of small-
scale farmers. There were no indications upon regressing the same variables on various
success indicators that they significantly contributed to predicting success in
dissemination. No model adequately explained the effects, if any, of wealth indicators on
success in dairy-goat group dissemination.
Informants felt that individual farmers might make a difference in dissemination for
a group. Some individuals might travel and talk about dairy goats. Others were highly
involved in MGBA, and were exposed to more farmers because of that. MGBA officials
(who were all dairy-goat group members) were often involved in training farmers in
dairy-goat technologies. Other dairy-goat group members became strong adopters and
experimenters, and because of this, their farm became a sort of demonstration site where
visitors were brought to learn. There were several groups where individuals played a
major role in providing information to the group. In one group, they had a member who
worked at a hospital, one who was an extension agent, and another who worked at a
university. Because of these contacts, the group had many different activities, including
putting in piped water, keeping chickens, planting grafted mangos, giving loans to
members, dairy goats and planting tissue-cultured bananas.

159
Table 4-28. Pearson’s product moment correlations between variables affecting success and wealth indicators for groups (n = 46)
1 2 3 4 5 6 7 8 1. No. members with no
livestock -- -.101 -.112 .143 .055 -.310* -.449* -.346*
2. No. members with goats only -- -.055 -.404* -.055 -.077 .111 .404*
3. Land size (average) -- -.126 .608** -.004 -.305* .311*
4. No. improved cows (average) -- .035 .052 -.258 -.342*
5. No. local goats (average) -- -.040 -.628** -.037
6. No. improved goats (average) -- .364* .096
7. Adoption index -- .309*
8. No. buck services --
*Moderate magnitude; **substantial magnitude Homogeneity of Members
The dairy-goat groups were homogeneous in many ways. Homogeneity within the
group was examined in terms of village, ethnic group, clan, gender, age, religion and/or
church, occupation and economic level. Almost all group members were from the same
ethnic group, called Meru. Nearly 100% of farmers interviewed considered themselves
to be Christians (the exception being Bahá'í). However, within the various categories
such as tribe and church there were some differences. For instance, although nearly all
group members were Meru, most were from different clans. While almost all were
Christians, most attended different churches, such as Methodist, Catholic, and Full
Gospel.
Amount of heterogeneity within the dairy-goat groups did not appear to have much
effect on the success of the group in disseminating technology, at least with regard to the

160
strong success indicators (the adoption index and number of buck services). There was,
however, a significant difference between groups with low homogeneity to those with
high homogeneity on the number of neighbors planting fodder (t = -2.47; p < .018; df =
36).
Group Cohesiveness
Informants felt that group cohesiveness was another characteristic of dairy-goat
groups good at extending technologies. Similarly, groups that had many conflicts were
considered by informants to not be very successful. There was some correlation between
perceived cohesiveness or unity of the group and some indicators of success (Table 4-29;
see also Table 4-24).
Table 4-29. Pearson’s product moment correlations between cohesiveness and success indicators
Variable 1 2 3 4 5 6 7 1. Adoption index -- .309* .084 .329* .102 .167 .043 2. No. buck services -- .035 .111 .334* .413* .037 3. Group unity -- -.039 .450* .345* -.542** 4. Group jealousy -- -.111 -.046 .059 5. Get on well -- .668** -.222 6. Group cooperation -- -.303* 7. Group conflict -- *Moderate magnitude; **substantial magnitude
Higher levels of group cooperation were associated with increased levels of buck
services (r = .413). Also, the perception that people in the group “got on well” was
moderately associated with the number of buck services (r = .334). Degree of group
jealousy was moderately correlated with the adoption index (r = .329).
Most of the responses regarding group unity or jealousy were skewed. For
instance, on a Likert scale of 1 to 5, where 1 = strongly disagree and 5 = strongly agree
that the construct was present in the group, the average response for unity was 4.59;
jealousy was 1.63; degree of getting along was 4.52, degree of cooperation was 4.48 and

161
group conflict was 1.40. Therefore it was not possible to divide the variables into groups
of high and low in order to perform tests of significance, as was done on some other
variables.
The concurrent farmer-to-farmer extension study taking place in Meru did reveal an
important role for jealousy in dissemination. Because of the role that jealousy seemed to
play among the farming community in Meru, it was discussed with informants. Jealousy
might affect dissemination of information by farmers and groups, because groups might
not want to share information and technology to keep ahead of their neighbors. Some
informants even mentioned that there was something in the group by-laws preventing the
sharing of information, although others discounted this idea. Some groups did agree to
keep some of their knowledge secret, at least until the group itself had benefited from
their knowledge. Informants said that this did not keep the more aggressive farmers from
getting information, however. Many of the dairy-goat groups thought that jealousy was
simply something that is a part of life, especially within groups, making statements such
as, “If you put eggs in a bucket, they will knock each other.”
Capacity
Capacity refers to training, skills and capabilities of farmers and groups.
Informants also saw trainings as very important to success of dairy-goat groups in
dissemination. They said that dairy-goat group members who received training were
expected to train other farmers. The dairy-goat groups have trained both newer dairy-
goat groups and farmers from outside the district and from other projects. Number of
trainings each dairy-goat group received since the start of the project ranged from 0 to 11,
with over 50% of groups having received 3 to 6 trainings. FARM-Africa, extension staff
or the MGBA usually conducted trainings. Individual members of dairy-goat groups

162
received significantly more training than individual non-members (t = 3.07; p < .00; df =
86). Basic training for groups was on goat husbandry, animal health care, leadership and
group dynamics. Further subjects included fodder management, nursery management,
breeding, fodder preservation, goat management, ear tagging, tattooing, judging and
inspection, hoof trimming, financial bookkeeping, and record keeping.
Both tours and trainings were types of capacity for groups. Trainings were the
most common way for capacity building in the groups. The variable number of trainings
was split into two by the mean of 5.37, to obtain a category of low-trained groups and
one of highly trained groups. This allowed for a comparison of group means on success
indicators (Table 4-30). The groups with a higher level of trainings had higher average
scores for the adoption index and number of neighbors adopting goats.
Table 4-30. Effect of low and high group training on success indicators (n = 46) Response Low training High training n M SD n M SD df t p Adoption indexa 27 2.60 0.35 19 2.86 0.25 44 -2.94 0.01 a Mean based on a scale of 1 (low adoption) to 4 (high adoption) **Significant
The amount of schooling that group members had received also contributed to
group capacity, and was hypothesized to make a difference in group performance in
dissemination. However, there were no more than low magnitudes of association
between the amount of total schooling received by group members and success
indicators. Total schooling was estimated by asking the group members present how
many of the entire group had completed primary or secondary school or higher. With one
success indicator, number of neighbors planting improved fodder trees, there was a
significant difference between groups with a high level of schooling and those with a low
163
level (t = 2.81; p < .01; df = 36). Groups with lower schooling had significantly more
neighbors planting fodder.
Linkages
Every group had linkages with other players in the area, such as churches, the chief,
extension staff and markets. The number of linkages a group had appeared to affect the
amount of dissemination that took place within a group, with those having greater
linkages disseminating more. Linkages were established through Venn or chapati
diagrams, where the group illustrated its relationships with outside entities through
placing various-sized chapatis on a piece of flip chart paper with their group at the center
(Figure 4-6).
There was a significant difference between dairy-goat groups with low numbers of
linkages (less than or equal to nine) and those with high linkages (greater than nine) with
regard to number of buck services (t = -2.31; p < .03; df = 40). Average number of buck
services for low linkage groups was 10.30 (SD = 6.56) while for high linkage groups it
was 17.26 (SD = 12.53). Number of linkages was also an important contributor to
overall group success (Table 4-33).
The Meru Goat Breeders’ Association was an important link for the dairy-goat
groups. As described earlier in this chapter, the MGBA was responsible for training
farmers in dairy-goat technologies and for safeguarding the breed. All of the dairy-goat
project records on sales and breeding were kept with the MGBA. Each of the dairy-goat
groups could register with MGBA and then have representation at various levels (from
administrative location up to the region). Most dairy-goat groups were registered with
the MGBA.

164
Individual farmers could also register with MGBA, even if they were part of a
dairy-goat group. Groups with many members registered with MGBA might therefore be
more successful at disseminating technologies due to increased linkages and/or capacity.
Although the number of members in MGBA was not significantly correlated with any
factors for success, it did have an impact on success. For further details on this factor and
how it affects success, see Table 4-33.
Type of Group (Project-Facilitated versus Non-Facilitated)
Type of dairy-goat group was a very important variable in the study. There were
basically two types of groups in the dairy-goat project, those groups assisted by FARM-
Africa and the other groups that formed after the project had begun, known within the
project as extension groups. Although many farmers learned of the project through
FARM-Africa coming to their areas to talk with the local chiefs, there were many others
who learned through word of mouth from their neighbors. According to FARM records,
there were more non-members than members benefiting from the buck services. There
were also more extension groups than FARM groups in the project. As mentioned earlier
in this chapter, all of the groups were working with both FARM-Africa and the Ministry
of Livestock Development and Fisheries. However, the older groups that originally were
formed under the FARM project were referred to as “FARM” groups, while the newer
groups that started during the project were called “extension” groups. This is because
they were assisted more by extension staff, the Meru Goat Breeders’ Association, and
farmers from FARM groups with regard to training and formation.
According to study informants, the FARM groups tended to be older, they had
received more trainings and tours, and they were comprised of poorer members (Table 4-
31). Project stakeholders also saw the extension groups as being demand-driven. The

165
FARM groups were chosen by outsiders, and were given a buck for community-based
breed improvement during the start of the project, and to qualify for this, group members
had to be classified as “poor.” The criteria for being poor were described under
Objective One. The extension groups, on the other hand, were formed on their own
initiative and criteria, and had to purchase their buck, which cost in the region of Ksh.
8000 (USD 107). The older dairy-goat groups received more training as part of the
FARM-Africa project. These old groups and extension staff trained many of the new
extension dairy-goat groups; however, training was more sporadic than with FARM
groups. Furthermore, the level of formality was significantly different, with the FARM
groups having higher levels of formality.
Table 4-31. Differences in FARM- and extension-facilitated dairy-goat groups (n = 46) Response FARM Group Extension Group n M SD n M SD df t p Trainings 20 6.75 2.69 26 4.31 2.67 44 3.07 0.00*** Tours 20 3.95 1.91 26 1.31 1.29 44 5.61 0.00*** Age of group 20 7.10 0.64 26 5.31 2.31 44 3.77 0.00*** Average improved cows 20 0.99 0.48 26 1.27 0.70 44 -1.59 0.12 Average land size (acres) 20 2.73 1.30 26 4.78 4.41 44 -2.25 0.03** Formality indexa 20 3.75 0.44 26 3.35 0.85 44 -1.94 0.06* Percent of members with
no livestock 20 2 0.04 26 11 0.13 44 3.33 0.00***
Percent of members with goats
20 28 0.14 25 16 0.15 44 -2.77 .00**
Jealousy in group 20 2.10 1.45 26 0.83 44 2.30 0.03** Leadership is good 20 4.30 0.92 4.81 0.63 44 -2.11 0.04** Member participation 20 4.10 1.02 4.69 0.84 44 -2.16 0.04**
1.27 2626
a On a scale of 0 – 4 with 0 = highly informal and 4 = highly formal *Approaches significance; **significant; ***highly significant
Differences in FARM and extension groups were not just structural, or with regard
to capacity and wealth indicators. There were also perceived relational or sociological
differences. As seen in Table 4-31, FARM groups had higher levels of jealousy, less
participation by members, and less of a perception that their leadership was good.
166
Because the FARM groups were in part chosen by outsiders, this may have contributed to
greater feelings of jealousy within the group. Because these groups did not form on their
own, it may be why there was less perceived participation by members and a feeling that
their leaders are not as good.
The extension groups were more spread out over agroecological zones. Only
extension groups were found in tea (UM1) and millet/livestock (LM5) zones. Many of
the FARM groups appeared to be concentrated in the coffee and marginal coffee zones,
while there were more extension groups in the more marginal areas.
Although type of group was an independent variable that was likely related to
success in dissemination, the differences between FARM and extension groups might not
be entirely due to support of these two organizations. Perhaps there was interaction or
some chain relationships between type of group and other variables such as group age or
capacity.
During the group interviews, members present were asked how many of their
members had no livestock, goats only or goats and cows. The extension groups had
higher percentages of members with no large livestock at all. FARM groups, on the other
hand, had higher percentages than extension groups of members with goats only (no
cows).
Because overall wealth of dairy-goat groups was not easily established, differences
in groups were analyzed through the number of livestock owned by group members and
average land size. These figures were obtained from the six group members present at
the interview and then averaged, and do not necessarily represent the entire group.
However, they provide useful measures to compare between groups.

167
Both extension and FARM-Africa staff mentioned that the newer “extension”
groups were better motivated, worked harder and did not expect handouts. They were
“more clever” and would go look for information on their own instead of waiting for it.
Many informants thought it was due to the dependency issue and the fact that the
extension groups had more resources. These groups might be expected to better extend
technologies to other farmers. The FARM groups were deliberately chosen as the poorest
of the community, and so they had a longer way to go, according to some informants.
There were moderate to substantial positive correlations between type of group (0 =
extension; 1 = FARM) and various factors for success, including the number of buck
services (r = .453; n = 42), groups’ self- ratings of success (r = .383; n = 46) and the
adoption index (r = .686; n = 46). There was a significant difference between the type of
group and number of buck services provided, with FARM groups providing more (Table
4-32). FARM groups were more likely to have a buck station, although there was not a
statistically significant difference in the number of buck stations between the types of
groups. From the data, therefore, it appeared that the FARM groups were disseminating
more. They had a higher percent of neighbors who had adopted goats, rated themselves
higher on dissemination and provided more buck services.
Table 4-32. Effect of type of group on success indicators (n = 46) Success indicator FARM Extension n M SD n M SD df t p No. of buck services 17 19.00 7.53 25 9.68 10.19 40 3.22 0.00***Success rating (by group) 0.91 44 2.75 0.01** No. neighbors planting
fodder 21 1.23
26 0.31 44 6.82 0.00***
a 20 4.10 26 3.31 1.01 17 2.47 0.62 2.19 0.75 36 0.23
Index of adoptionb 20 2.97 0.14 2.51a Mean based on a scale of 1—5 where 1 = strongly disagree and 5 = strongly agree that group is strong b Mean based on a scale of 1 (low adoption) to 4 (high adoption) **Significant; ***highly significant

168
Type of group alone accounts for 47% of variation in the dependent variable index
of adoption when regressing various factors on the adoption index. However, a model
that more fully explains high adoption rates among dairy-goat farmers in Meru Central is
detailed in Table 4-33. It includes type of group and the variables member participation
in groups, individual membership in the MGBA, and number of linkages, and was
developed using the backward method of model building, where all of the variables are
put in, and then those that do not contribute significantly to the outcome are dropped out
(George & Mallery, 2001). Variables that were dropped from the regression equation
included the amount of schooling of individuals within the group, meeting frequency of
the group, the number of activities, capacity level, location, size, age, level of formality,
cohesiveness and homogeneity of members.
This table shows the most important predictors of group success. The r-square
value of 0.61 means that the combination of these variables—type of group, member
participation, membership in MGBA, and number of linkages—explained 61% of the
variation in the adoption index, which was a measure of success of the group. Type of
group, MGBA membership, and number of linkages were positive, meaning that
increases in these variables lead to an increase in success of the group in dissemination.
Because type of group was binary, it means that the type of group variables that were
coded “1” (FARM) were contributing to group success.
Participation by members, however, is negative. This variable was a measure of
the groups’ perception of how much members participated, ranging from strongly
disagree (1) to strongly agree (5). Because it was negative, it means that as groups
tended to disagree that their member participation was high, groups tended to be more

169
successful in dissemination. Groups where members were perceived as participating less
were providing more buck services and had more neighbors adopting dairy-goat
technologies.
Table 4-33. Linear regression analysis of variables for prediction of success in dissemination (adoption index)
Variable Beta Std. Error t p Type of groupa 0.38 0.07 5.36 0.00*** Participation by members -0.13 0.04 -3.33 0.00** MGBA membership 0.01 0.00
0.02** 1.79 0.08*
Linkages 0.04 0.02 2.47 a 0 = extension-facilitated group; 1 = FARM- facilitated group Note. R2 = .61; * approaches significance; **significant; ***highly significant
The MGBA membership variable was the total number of dairy-goat group
members who were in that organization. Another way of dealing with this variable
would be to make it a percentage, so that one can see how many people out of the group
were in the MGBA, rather than just total numbers. Converting MGBA members to a
percentage rather than total numbers caused it to drop out of the regression equation.
However, total numbers of members was also a valid variable because it then showed that
greater linkages or connections with the MGBA led to greater success of the dairy-goat
groups.
Although type of group was a crucial factor in determining success in
dissemination, other factors played a role as well (Table 4-33). Member participation in
the dairy-goat groups was determined through a five-point Likert-scale question where
respondents were asked to (1) disagree strongly, (2) disagree somewhat, (3) neither agree
nor disagree, (4) agree somewhat or (5) agree strongly to whether group members
regularly participated in most group activities. MGBA membership was the number of

170
group members who are individually registered with MGBA. Linkages referred to the
number of associations that a dairy-goat group had with outside entities.
Dependent Variable
In summary, there were many different factors that affected success of dairy-goat
groups. Table 4-34 shows the effect of various factors, based on t-tests between high and
low levels of the factors, on various success indicators. This table will be further
discussed in Chapter 5.
Table 4-34. Effect of various group factors on success indicators based on t-tests
Independent Variable
No. of buck services
No. neighbors planting fodder
No. of groups trained
Self-rating of success
Adoption Index
Altitude ++ ++ Size of group Age of group +++ + Activities Homogeneity ++ Capacity + Linkages ++ Type of group +++ +++ ++ + Positive relationship approaching significance ++ Positive relationship significant at .05 level +++Positive relationship significant at .01 level Groups’ Own Indicators
The dairy-goat groups had their own indicators of what made them stronger or
weaker in dissemination. They were asked to rate themselves on their success in
dissemination information and technologies (Figure 4-13). Responses were on a Likert
scale of 1-5, with one being “very strong” and five being “very weak.”
One group considered themselves weak in dissemination because they only had one
person who was formally trained (the community animal health worker or CAHW). For
the original FARM-supported groups, both the buck keepers and CAHWs received
special training, and group members were more likely to have received training. In the

171
extension groups, there were very few CAHWs. Some groups and group members were
not comfortable training because “there are some questions we cannot answer.” They
therefore rated themselves as “neutral” in terms of strength in technology dissemination.
Groups' rating of strength in dissemination
26
26
37
9
2
0 5 10 15 20 25 30 35 40
Very strong
A little strong
Neutral
A little weak
Very weak
Figure 4-13. Groups’ self-ratings on success in dissemination (%)
Others said it was difficult to train others because it was hard to send people to do
so. Arrangements were complicated and took a lot of effort due to the lack of
transportation and communication. There were almost no telephones, mail or email
services available; messages were usually delivered by hand or word of mouth.
Transportation was difficult to obtain or the price prohibitive, and going by foot was also
challenging. The farmers were therefore not able to train as often as they would like.
Others felt that they were neither strong nor weak in dissemination because they would
go a long time in between training other groups. Also, when they do call a meeting, there
might be lack of interest or enthusiasm among non-members. One group considered
itself neutral because “[dissemination] is volunteer work.” If some group members did
not take the goat project seriously, the group also considered themselves weaker.
Some of the self-rated weaker groups in dissemination had run into problems, such
as the buck dying. It was difficult to teach others about dairy-goat technology with

172
almost nothing to show for it! Having a crossbred goat, a buck station or goat housing to
show people seemed to empower the farmers to tell others. One group was “very strong”
because they said people could come and see in reality what they were being trained
about.
One group said that the groups trained by FARM-Africa found it easy to train other
groups, and this was what many of them had done. Another group seemed very strong in
information dissemination. They had received seven trainings and four tours, had trained
two of the new extension groups and provided over 20 buck services in a month.
However, they rated themselves as neutral because they felt that they could do even
better than they have done. Others rated themselves through adoption by their neighbors,
and felt that if the farmers they had taught did not take action, that they were not very
strong in dissemination. Therefore, if many non-members brought goats to the buck
station, they were considered a strong group.
Another group rated themselves as only “a little strong” because “other groups are
stronger than we are.” A newer extension group was only “a little strong” because they
had never been taken for tours or trainings, and therefore did not feel very comfortable in
training others. One group rated themselves as very strong because they had helped four
other groups to form.
This section has examined the various factors that appear to make dairy-goat
groups more successful at disseminating information and technologies. The chapter
discussed the results of the four objectives regarding participation in groups, linkages,
mechanisms for dissemination and factors for success in dissemination. Chapter 5 will

173
discuss policy recommendations (the fifth study objective) and conclusions based upon
this chapter.

CHAPTER 5 CONCLUSIONS AND RECOMMENDATIONS
. . . agricultural improvement among small, traditional farmers is, and always will be, more an art than a science.
(Roland Bunch, Two Ears of Corn)
In the previous chapter the various results of the research on farmer groups’ roles in
extension were described. This chapter discusses those results, dividing the discussion by
the following study objectives: (a) examine participation in groups and identify what
factors, if any, affect participation in groups; (b) examine linkages and their outcomes, if
any, between farmer groups and other extension stakeholders; (c) identify the
mechanisms by which farmer groups and their members receive and disseminate
information and new technologies, especially fodder shrubs and improved dairy-goat
breeds; and (d) identify the factors characteristic of groups successful in disseminating
technology. Added to the discussion are results from a validation meeting that was held
at the end of the research study to present the results to various stakeholders, including
extension, farmers, and World Agroforestry Centre and Food and Agricultural Research
Management (FARM)-Africa personnel. The chapter finishes with the fifth objective, to
propose policy recommendations to extension and development policy makers and
practitioners regarding farmer groups’ roles in extension. Suggestions are also made for
further research.
The researchable problem addressed in this study was that the role of farmer groups
in extension was not known, nor were the factors (if any) that made them effective. The
174
study goals were therefore to determine the role of farmer groups in technology

175
dissemination, and to assess what factors make groups effective in extending
technologies among small-scale dairy-goat farmers in Meru Central District of Kenya. A
mixed-methods, multiple-stage approach was used to obtain data for the study. The
research techniques included participant observation, documentary analysis, semi-
structured interviews, social mapping, group timelines, and structured questionnaires.
Objective One: Examine Participation in Groups and Identify What Factors Affect Participation in Groups
The first study objective was to examine participation in groups and identify what
factors, if any, affect participation. This section first examines how poverty affects
participation in groups, and then other factors that play a role in participation.
Are Poorer People Participating in Groups in Meru?
As mentioned in Chapter 2, Esman and Uphoff (1984) believe that characteristics
of the poorer members of communities prevent them from taking part in local
organizations. However, Parkins (1997) found that the poorer farmers actually were
participating in groups along with those of a more average wealth level. The wealthier
farmers were not as heavily involved in groups in both Parkin’s study and in this study.
This study finds that although the very poor may be kept out of groups, the poor can be
enabled to join groups by working with them at the community level to provide skills
necessary to participate in groups, and so obtain the benefits of social capital.
According to study informants and to various documents regarding the project, the
original dairy-goat project-supported dairy-goat groups (“FARM” groups) were
comprised of farmers from the community who were below average poverty. Informants
176
indicated that the FARM groups were poorer and had less capacity8 than the extension
groups. The original dairy-goat group members were chosen mainly because of their
As stated in Chapter 4, “capacity” refers to training, skills and capabilities of people, groups and organizations.
poverty. However, once the project started, other groups formed (“extension” groups)
that were not based on poverty. These groups formed on their own initiative, and
purchased a breeding buck instead of being given one, as the FARM groups were. It is
important to note here that the dairy-goat project, known as the Meru Dairy Goat and
Animal Healthcare Project, was a collaboration between the NGO (non-governmental
organization) FARM-Africa and the Ministry of Livestock Development and Fisheries of
the Government of Kenya. Although both FARM and government personnel worked
with all of the groups, they were termed “FARM” and “extension” groups to differentiate
between those groups formally supported by the project and those that came along later,
working under the project but not receiving official assistance.
Although all of the farmers in the dairy-goat project, especially the FARM-Africa-
supported groups, were supposed to be poorer than the rest of the community members,
almost all of the data show no difference in wealth between farmers in the communities
who were dairy-goat group members and those who were non-members. Nor were there
significant differences between the FARM and extension types of dairy-goat groups (see
Table 4-12).
Perhaps there was originally a difference in poverty levels between dairy-goat
group members and non-members, or between the FARM and extension types of dairy-
goat group members. However, the evidence seems to indicate that the dairy-goat group
members had actually improved their standard of living during the course of the project. 8

177
Several informants did mention that the dairy-goat groups were much better off at the
time of the study (2003-2004) than when they originally formed (1996-1997). However,
because much of this evidence was based on informants’ comments rather than baseline
data, this finding needs to be treated with caution.
It appeared that having improved goats (crosses between local goats and
Toggenburg dairy-goats) provided farmers with cash. Farmers felt that goats bred and
grew more rapidly than cows, allowing farmers to more quickly make a sale. The
improved goats also fetched a higher price than local goats. For instance, one farmer sold
a one year-old goat to the Meru Goat Breeders’ Association (MGBA) for Ksh. 6,250
(about USD 83). Full grown local goats, both bucks and does, fetch between 1,000/- and
1,500/- (USD 13-20). Farmers and other informants said that through the improved
goats, farmers (both dairy-goat group members and non-members) have “sent kids to
school, built timber houses and put in [piped] water.”
Perhaps by breeding and then selling improved goats, farmers in the project were
also able to purchase more and better animals. An interesting correlation in this regard is
the number of livestock owned by individual farmers. Table 4-10 shows a substantial
correlation between number of improved goats and the number of livestock in general (r
= .752). Although this does not imply causation; that is, that the high numbers of
improved goats caused high numbers of total livestock, informants did mention the fact
that “goats have bought cows.” Several farmers mentioned using money obtained from
selling improved goats to purchase grade cows.
Finally, other evidence supporting the theory that the dairy-goat project has
improved the wealth of farmers is the number of cattle owned by dairy-goat group

178
members. Having fewer cows than the rest of the community was one of the criteria for
membership in the original FARM-supported dairy-goat groups. Nevertheless, at the
time of the study, although the extension group members had greater numbers of
improved and local cattle, there was no significant difference between FARM and
extension dairy-goat groups. Tests of significance between numbers of cattle owned by
individual farmers also revealed no significant differences between dairy-goat group
members and non-members. Again, this evidence must be treated with caution, as the
evidence regarding the number of cattle of dairy-goat members was anecdotal rather than
from baseline data.
According to Table 4-31, extension group members had larger land sizes than
FARM members. This cannot be used solely as a judge of wealth, however, because
larger land size could have been due to physical location; that is, in the lower zones
where land is poorer, rather than wealth. Land size is better used as a wealth indicator
within the various agroecological zones.
Although no data actually showed that dairy-goat group members were poorer than
those farmers not in dairy-goat groups, as claimed by many in the study, there were some
indications that perhaps show that the dairy-goat group members were poorer (or had
been at one time). Poverty and wealth are difficult constructs to define and measure;
however, other variables can also be used to indicate wealth. None of the typical wealth
measures such as type of housing, number of livestock, or remittances showed dairy-goat
group members to be significantly poorer than their non-member neighbors. The only
indications that dairy-goat group members may actually be (or were at one time) less
well-off than their neighbors came from data showing that the dairy-goat members have a

179
more stressed household composition (Table 4-5). In a poverty assessment in Kenya in
1999, the poor farmers were shown to have larger households (6.4 people per household
versus 4.6 for non-poor) (Government of Kenya, 1999). Larger households, and
especially stressed ones, with a low ratio of producers to consumers, put severe
limitations on time, money, and other assets. The fact that dairy-goat group members had
more stressed households is especially interesting in light of the fact that other major
groups that participants were in, such as women’s groups, water groups, and church
groups, seemed to be comprised of people who had less household stress.
Perhaps a difference in poverty between farmers who were in groups and those who
were not may have been found if enough individuals had been surveyed who were not in
any group whatsoever. However, from what the researcher saw, and according to
informants and other researchers in the area, those individuals in no groups at all were
very few and were not the norm. Most farmers in the area were in groups (K. Karanja,
personal communication; 12 August 2003; Place et al., 2002).
Although many of the individual respondents were rated as average, there were
dairy-goat members who ranked below average. The fact that poor people were in the
dairy-goat groups does not mean that all poor people in a community are able to
participate in groups, however. The fees that were part of the group structure would
certainly keep out some community members. However, the FARM-Africa project
specifically sought poorer people and worked with them through the local chiefs to
enable them to take part in the groups and the project. The farmers were trained and
given various types of support. These findings are positive, because they seem to
indicate that even if poor people are unable to join groups by their own means, they can

180
be enabled to do so. Certain types of groups can actually help these farmers to improve
their standard of living, so that a few years down the road it is hard to tell a difference
between them and their “richer” neighbors. People seem to realize the value of groups
and seek to join them. A study by the World Bank entitled “Voices of the Poor” showed
that poor people identified the capacity to organize as the one thing that would make the
greatest difference in their lives (Narayan, 2000 in Collion & Rondot, 2001).
Although no major wealth differences were found between dairy-goat group
members and non-members, there were some differences in wealth/wealth indicators for
other types of groups. Clan group members received fewer remittances than non-
members with results approaching significance. Merry-go-round members had smaller
land sizes with results that approached significance. Overall wealth rating of farmers
(given by enumerators) was associated with belonging to water groups. This shows that
some groups are more accessible to the poorest of the communities than others. Also, it
is yet another indication that there are various reasons that people join groups, and
different benefits that people receive.
In summary, wealth was a factor for participation in some groups. Wealthy people
did not seem to be participating in certain groups. At the same time, poorer people were
participating in the dairy-goat groups and other types of groups. Furthermore, careful
attention must be paid to factors related to wealth, such as household composition, and
especially changes in household composition, and how these affect participation in
groups over time. Perhaps a longitudinal study of group participation, examining
changes in income/expenditures, household composition, and other factors would be
useful in this regard. Other factors besides wealth also affected participation in dairy-

181
goat groups and farmer groups in general in Meru Central District, some of which are
discussed below.
What Affects Participation in Groups of Any Kind?
There were different reasons that people had for participating or not participating in
groups. The data revealed certain differences between members and non-members of
different types of groups such as dairy-goat groups, clan groups, church groups, water
groups, and women’s groups.
Clan group and dairy-goat group members appeared to have a more stressful
household composition than non-members. These groups perhaps functioned as more of
a safety net type of group. Clan groups were often designed to help people in
emergencies. Perhaps these farmers joined clan groups for that very reason. Farmers
with larger and more stressful households may have had more needs in terms of school
fees, weddings, and funerals. As mentioned above, the dairy-goat project was designed
to help poor farmers in Meru. The household composition was the main evidence
pointing to dairy-goat groups’ poverty; however, it appeared that these farmers had
increased in wealth since the start of the project.
Church group and women’s group members appeared to have a less stressful
household composition. Church members had a higher ratio of producers to consumers.
They had fewer total household members. Even though they were poorer, perhaps they
had more time because of their household composition. Women’s group members
appeared to be wealthier than non-members, at least judging by land size. It appeared
that women’s group members might have had more time and resources as compared to
other group members. Those belonging to women’s groups had a lower number of
females under 10 and a lower number of consumers than non-members. This makes it

182
appear that those farmers with less household stress were more likely to belong to church
and women’s groups. These findings seem different from Obonyo’s findings in Western
Kenya in 2000. She found that church group members tended to be poorer than the rest
of the community. These differences between the two areas could be due to factors such
as culture and geography, however.
Many times the reason why people appeared to join groups was to obtain physical
benefits. In Kenya, Alawy (1998) found that women felt they benefited from being in the
group through training, cash, financial assistance, knowledge gained, and food. Narayan
and Pritchett (1999) found a link between social capital and wealth in Tanzania, in which
an increase in social capital led to an increase in income. De Haan (1999) also found
links between social capital and access to assets. She found that social capital was
important in gaining access to goats. For this study, a one-way ANOVA obtained results
approaching statistical differences among the farmers from the three wealth levels and the
number of groups that farmers belonged to. Wealthier farmers tended to be in more
groups (those with below average wealth belonged to 1.84 groups; average was 2.35 and
above average was 2.93; F = 2.98; p < .06; df = 2). Bonferroni post hoc analysis revealed
that the main differences were between the above average farmers and the below average
farmers (p < .05).
Group politics (siasa) was apparently an issue in participation in groups. During
the group interviews, groups were asked about fines and penalties that the group imposed
on members. During this discussion, the issue of “backbiting,” or gossiping about the
group often came up, where members who did this were fined. These issues were also
important in other groups in other parts of the country as well (de Haan, Valdivia, Njeru
183
& Sheikh, 1996). Both individual farmers and groups brought up siasa as a reason for
avoiding groups. One group said that members who had left “Wameshindwa kwa sababu
ya sheria,” that is, they had been “defeated” because of the group’s laws. Apparently this
was a problem that groups faced with their members, and was something that people
avoided by staying out of groups.
In summary, there were different reasons why people participated in groups. This
study has revealed certain differences between members and non-members of various
types of groups. The main factors affecting participation varied from group to group, but
included aspects such as gender, age, household composition, and whether a farmer was a
member of another group. Just as there is diversity within small-scale farm families and
livelihoods, there is a diversity of groups that farmers join, and many different reasons for
joining. Therefore when one looks at participation in groups in general, one cannot make
a blanket statement about the characteristics of people who participate or do not
participate in groups. One has to look at different kinds of groups and what the group
purpose is. A farmer who joins a type of safety net group such as a clan group likely
joins it for much different reasons than one who joins a coffee marketing group. Policy
makers must pay attention to such factors when working with groups in the rural areas.
Objective Two: Examine Linkages and Their Outcomes between Farmers and Other Extension Stakeholders
The second study objective was to examine linkages and their outcomes, if any,
between farmer groups and other extension stakeholders. This section specifically
examines the linkages that dairy-goat groups had with outside entities. The findings
throw some light on the state of extension in Kenya today. One interesting observation
with the dairy-goat groups’ linkages was the number of extension/agriculture and baraza

184
linkages (Tables 4-18 and 4-19). Again, baraza is the public meeting held at the chief’s
camp, a local means of government administration. The government was apparently seen
as a major source of information for these farmers and groups in Meru Central District.
This is noteworthy in light of the trend today toward privatized and non-governmental
sources of extension. It adds validity to Rivera and Alex’s argument that the state needs
to continue to play a role in extension (2004).
However, of the major links, baraza was the link placed furthest away from the
groups in most of the cases (Table 4-19). This signified the infrequency of that linkage.
Farmers at the stakeholder meeting, held to present research findings at the end of the
study, said that they thought barazas were rare. Both extension and farmer stakeholders
were surprised that baraza rated above FARM-Africa as an important linkage. This
showed that baraza was an important contributor to agricultural extension that had a
variable track record. Therefore one way of improving rural development in Kenya could
be through strengthening the local government administration that occurs at the chief’s
camp. Baraza apparently can be very useful. However, when there was an ineffective
chief, farmers did not see much value in baraza. Apparently, the new government has
already recognized the importance of baraza. The chiefs were being retrained, and were
required to pass a test and know a certain amount of English to retain their posts at the
time of the study. However, in addition to retraining, the government needs to have a
way to deal with ineffective chiefs.
The chapati (Venn) diagrams also revealed a mix of both local and external
linkages. The dairy-goat groups were linked with other farmers, groups, churches, and
baraza at the local level. However, they also had outside links with government, NGOs,

185
and sometimes private companies. A similar study in Kenya found comparable linkages
with the public sector, the private sector, NGOs, community-based organizations (CBOs),
and churches (Rees et al., 2000). The concurrent farmer-to-farmer research study by
FARM-Africa in Meru also interviewed both dairy-goat group members and non-
members. Rather than linkages in general, they looked at sources of information for the
farmers. They also found both local and external links, with 35 sources of information in
the village, 27 at the district, and 10 beyond the district (FARM-Africa stakeholder
meeting held 29-30 October, 2003 at the Transit Hotel, Chogoria).
Both extension personnel and farmers were surprised when they learned at the
stakeholder validation meeting that churches were rated above FARM-Africa as an
important link for dairy-goat groups. However, this may be due to the fact that the point
of the chapati diagrams was to show any sort of relationship the groups had, not just
those that were related to agriculture/livestock and technical information. As mentioned
in Chapter 4, nearly every farmer interviewed was a member of a church. The church
thus played an important role in rural life in Meru Central District. Rees et al. (2000)
also found that churches were significant sources of information in their study on
agricultural knowledge and information systems. Farmers are regularly in church; at
least once a week, and as such, churches provide an excellent channel for communication
to people in rural areas. Linking service provision with churches would be a useful way
to reach most in communities where churches are so prevalent.
Another interesting issue was the role that non-governmental organizations play in
extension. Their role in extension in Kenya has been documented (Davis & Place, 2002,
Non-governmental organizations as an important actor in agricultural extension in

186
semiarid East Africa, unpublished manuscript, University of Florida, Gainesville, FL;
Omolo, Sanders, McMillan & Georgis, 2001). In this study, the role of NGOs was
important in extension; however, there was not the plethora of them that there are in low
potential zones. Rees et al. (2000) obtained similar findings in Kiambu, a district on the
other side of Mount Kenya. In higher potential zones, therefore, it might be advisable to
focus on private companies and government and international research organizations in
extension, while in the low potential areas, NGOs should be targeted for extension
purposes.
Another issue that this study brings up is with regard to linkages of farmer groups
with projects or other sorts of outside assistance. De Haan et al. (1996) found that dairy-
goat groups in Kenya that had the most face-to-face contact with the project had the most
successful rates of dissemination of the goats. The fact that the number of dairy-goat
group members who were in the Meru Goat Breeders’ Association (MGBA) was an
important contributor to overall group success validates her findings, and shows that
linkages with supporting organizations are crucial (Table 4-33). The MGBA was
important for groups as a source of information and germplasm and for marketing.
Increasing links with the MGBA or similar organizations would likely increase success of
groups in dissemination. Similarly, strengthening community-based organizations such
as the MGBA is another way to improve extension in rural communities. By training
farmers in organizations such as the MGBA, and then providing for them to train other
farmers, dissemination can be more effective and less costly.
Dairy-goat groups that had more linkages were more successful in dissemination.
In the FARM-Africa project described in this study, strong emphasis was put on linkages
187
between all of the players involved in the project, including the private sector,
government extension, and various research players. Perhaps this was one of the reasons
why project reviewers have seen the dairy-goat project as quite successful. Involving
multiple players allowed FARM-Africa to use the strengths of each one and to cut costs
for their project.
Group formation also appears to increase the number of linkages in rural areas.
Geran found in her 1996 study in Zimbabwe that group formation led to increased links
with service providers, as did Rouse in Zambia (1996). Obonyo (2000) also found that
one of the benefits from being in a group in western Kenya was access to external
agencies. Finally, Esman and Uphoff stated in 1984: “Those [local] organizations with
links to political or administrative centers that provide information are also more
effective.”
Finally, location of the groups appeared to affect linkages. For instance,
government extension was more prevalent in the higher potential areas. This was likely
due to the fact that it was easier for farmers to get to government extension and vice versa
in the high potential zones, which were closer to district and divisional headquarters
where the government offices were. Private companies and international/national
research centers were also more visible in the higher potential areas, and had more links
with these groups.
Although some of the main markets were in the higher zones and close to the
tarmac road, markets were also very important for certain groups in the lower zones. One
market that seemed quite important to certain groups was called Murika. These groups
were all located on the eastern edge of Miriga Mieru East or Abothoguchi East Divisions.

188
Across the border from these divisions was another district called South Tharaka, which
was characterized by low potential land and problems achieving food security. Farmers
in eastern Meru Central District thus found a good market in Murika, where buyers often
purchased produce for sale in Tharaka.
Also in the lower zones, churches were found to be more important as a source of
information for farmers and groups, according to FARM-Africa (stakeholder meeting
held 29-30 October, 2003 at the Transit Hotel, Chogoria). Another issue regarding
location was government administration. Some groups appeared to have an incompetent
chief, while others rated chiefs as very high in terms of value of the link and frequency of
contact. Therefore, when considering linkages for groups, it is crucial to pay attention to
the location with regard to its administrative and physical characteristics.
In summary, dairy-goat groups had many different linkages with local and external
and with government and private organizations. Based on this and other research studies,
it appears that strengthening linkages will increase the success of groups in disseminating
information.
Objective Three: Identify the Mechanisms by Which Farmer Groups and Their Members Receive and Disseminate Information and New Technologies
The third objective of the study was to identify the mechanisms by which farmer
groups and their members both received and disseminated information and technologies,
especially fodder shrub seedlings and improved dairy-goat breeds. Results revealed a
variety of both means and sources.
As detailed in Chapter 4, the main methods that dairy-goat groups used to tell other
farmers about new technologies were through the chief barazas, in other farmer groups,
at the buck station, through training others and by calling meetings at their group.
189
Further means included the breeding stations, community animal health workers
(CAHWs), fodder tree nurseries, churches, and through neighbors and visitors.
The most important sources of information for the dairy-goat groups were (a)
government extension, (b) baraza, (c) FARM-Africa, (d) other farmers, and (e) churches
(Table 4-21). The most important sources of information for individuals were (a)
government extension, (b) churches, (c) other farmers, (d) indigenous knowledge, (e)
groups, (f) baraza, and (g) FARM-Africa (Table 4-22). During the preliminary phase,
the researcher was able to take part in another study regarding farmer-to-farmer
dissemination among the dairy-goat groups. That study revealed that there were about
six main sources of information for groups and farmers regarding agriculture. They were
(a) government extension, (b) baraza, (c) other farmers, (d) markets, (e) churches, and (f)
radio (FARM-Africa stakeholder meeting held 29-30 October 2003 at the Transit Hotel,
Chogoria).
Although there are some differences between the sources of information shown
above, viewing these results together helps to draw some interesting conclusions.
Government extension was viewed without doubt as the most important source of
information for both individual farmers and dairy-goat groups in Meru Central District.
Following extension, baraza, other farmers, and churches came out as some of the top
sources of information for farmers.
In looking particularly at farmers as a source of information for other farmers, some
details emerge. Individual farmers received information from and shared information
with their neighbors more than any other type of farmer. Neighbors were perhaps a quick
and easy source of information or place for dissemination. One issue of dissemination

190
that came up during the preliminary research and while talking to dairy-goat groups was
the power of actually seeing technologies, or experiential learning. Although community
breeding stations were harder to manage than research station breeding centers, there
were definite benefits to having these stations at the local level. This gave ownership to
the farmers and caused them to become the experts.
In terms of viewing farmers as an important source of information, it is interesting
to look at their levels of training (not formal education but informal training). Individual
farmers appeared to have very low training levels. Individual farmers (both dairy-goat
group members and non-members) had received an average of 1.6 tours and/or trainings
within the past five years. However, there was a significant difference in amount of
training received by dairy-goat group members as compared to non-members. Members
of dairy-goat groups received significantly more training than non-members (2.36
trainings per individuals in dairy-goat groups versus 0.84 for those not in dairy-goat
groups; t = 2.92; p < .00; df = 86). None of the other types of groups (women’s, water,
clan, merry-go-round, and church) had a significant difference in trainings between
members and non-members. Dairy-goat groups, on the other hand, had received an
average of 7.8 tours and trainings in the past five years.
Apparently farmers in Meru Central District were sharing information, technology,
and germplasm with each other; and with their neighbors more than anyone else.
Neighbors were easily accessible. Farmers also valued interactive sources where they
could ask questions and get feedback (FARM-Africa stakeholder meeting held 29-30
October, 2003 at the Transit Hotel, Chogoria). However, accessibility of information
may conflict with reliability. For instance, neighbors were always available, but might

191
not have the right information. Farmers also valued expertise (FARM-Africa stakeholder
meeting held 29-30 October, 2003 at the Transit Hotel, Chogoria). Therefore, a farmer
who is in a group receiving agricultural/livestock training can have a tremendous impact
on her or his neighbors. He or she is not only accessible, but through participation in the
group, also possesses expertise.
Therefore there are key people who should be targeted within the groups for more
effective dissemination. In the FARM-Africa project, the buck keeper was a key trainer
since he or she was a main contact point for the groups’ neighbors. Buck keepers usually
give information to those bringing goats for service, such as information on the breeding
cycle, goat housing, and medicine. The community animal health worker was another
key person for extending information and technologies outside the group. According to
one project reviewer, the project has given people initiative through training farmers.
When they get a chance to share their knowledge, they are empowered.
Stakeholders did have issues with some of the dissemination mechanisms presented
during the meeting at the end of the study. The farmer stakeholder subgroup wondered
why churches were given a higher position than groups, which had “worked hard for a
long time with individual farmers” (Table 4-23). They said that groups were being used a
lot to teach. This may be due to the fact that churches rated higher than groups for
individual respondents, who were not necessarily members of dairy-goat groups and so
would not have those contacts that the dairy-goat group members would. However, it
was also noted during the stakeholder meeting that the importance of churches for
dissemination points was increasing, since farmer extension workers (FEWs), who were
part of the dairy-goat project, had just started using churches to make presentations on

192
dairy-goat technologies. Finally, stakeholders noted that the church was not necessarily a
source of agricultural information, but a channel for information.
The FARM-Africa subgroup of stakeholders noted that barazas were very useful
during the initial stages of the project, but that FARM now had more contact with the
farmers than baraza did. This shows that it is important to use different extension players
at different points and for different reasons. For instance, baraza is good for social
reasons such as introductions to the community and for announcements.
In summary, farmers and dairy-goat groups in Meru were both obtaining and
disseminating information and technology through a variety of means. Individual
farmers, especially neighbors, appeared to be a very important mechanism for
dissemination. However, different mechanisms were valuable for different purposes.
Some mechanisms were sources of information, such as extension, while others were
channels, such as churches. These mechanisms should be further explored and
capitalized on for those wishing to promote various technologies in the area. Groups and
individuals have been disseminating, and should be empowered to conduct more farmer-
to-farmer dissemination. Capacity building among farmer groups thus should be an
important goal for practitioners and policy makers.
Objective Four: Identify the Factors Characteristic of Groups Successful in Disseminating Technology
The fourth objective of the study was to identify the factors characteristic of groups
successful in disseminating technology. There were certain factors that appeared to
contribute to the dairy-goat groups’ success in extension in Meru Central District. These
included the group location, age of the group, homogeneity of members,

193
jealousy/cohesiveness of the group, capacity level, number of linkages, and type of
group.
As mentioned in Chapter 4, defining and measuring success was a difficult task.
Different indicators for success were used in this study (some are shown in Table 4-34).
Interestingly, when groups talked about how strong and weak they were in dissemination,
they spoke in terms of training others and of adoption of technologies by neighbors.
Also, for dissemination, experiential learning was important. Farmers valued seeing
something rather than just hearing it (FARM-Africa stakeholder meeting held 29-30
October, 2003 at the Transit Hotel, Chogoria). Even more, they valued learning about
new technologies from other farmers in their fields. Franzel, Wambugu and Tuwei
(2003) found that “seeing and discussing calliandra with experienced farmers was an
effective means to promote calliandra planting and to provide a forum for farmers to
learn about its growth, management and use” (p. 6). Therefore it is very important to
have technologies “on the ground” with farmers and with farmer groups.
Table 4-34 shows that there were different factors affecting success at various
levels of significance. As mentioned in Chapter 4, there were different variables that
were used as indicators for success. The adoption index was an average of the group and
three external rater responses to number of neighbors adopting technologies from the
groups (Cronbach’s alpha for the index was 0.69). Number of buck services referred to
the number of goats brought to the buck station for breeding by both members and non-
members over a one-month period. These numbers were obtained from the group and/or
the group record book. Number of neighbors planting fodder was an estimate by the
group of how many of their neighbors had planted fodder. Number of groups trained
194
refers to the number of other groups that a dairy-goat group had trained in the past year.
Finally, self-rating of success was a perception measure where groups rated themselves
on a scale of 1 to 5 from very weak to very strong in dissemination.
Table 4-34 reveals some phenomena that this study has in common with Place et
al.’s 2002 study on farmer groups in Kenya. As noted by these researchers, and as seen
in Table 4-34, there is no one formula or recipe for building a group that will be
successful in dissemination. There are many factors that contribute to success. These
explanatory factors do not follow any particular pattern in contributing to the various
dependent variables, however. Different group factors significantly affect only one or
two success indicators, according to Table 4-34. There is no one overall success
indicator/index that can be used to compare the effects of various explanatory variables.
This underscores the complexity of such social science studies, and the difficulty of
reaching hard and fast conclusions when constructs are difficult to both define and
measure. To help shed some light on these issues, however, some of the factors affecting
success are discussed in greater detail below.
Altitude/location. The data show that groups in higher altitude areas were
disseminating more information and technology to farmers than farmers from lower
zones. This may be due to the fact that the upper zones had a higher population density
and greater access to markets and sources of information. However, one aspect that may
be important to note is that the technologies were not solely dairy-goat technologies
(Table 4-26). Goats were much more common in the lower agroecological zones, while
in the upper zones, dairy cattle were an important livelihood activity. Perhaps groups in
high altitudes were successful more in fodder technology dissemination than dairy-goat

195
technology dissemination, because there were more grade cows in higher altitudes and
less goats. This shows the importance of adapting extension messages to the various
farming systems and recommendation domains. People may be adopting a technology,
but not for the exact purpose for which it was designed. Farmers have also been adapting
fodder technologies to meet their needs, or coming up with new innovations (Franzel et
al., 2003). This is why it is necessary for research and extension to be flexible and to
involve farmers in the technology generation and dissemination process.
Location also affected communication networks, marketing, extension services, and
other development issues, according to project stakeholders. Infrastructure also played a
role; for instance, roads may have been impassible in certain parts of the district. In the
lower zones there might be greater distances between the groups. Place et al. (2002)
found both positive and negative effects of geographical location on group performance.
Size of group. Morton et al. (2002) found both negative and positive effects from
size. Stringfellow, Coulter, Lucey, McKone & Hussain (1997) found that small groups
were more successful. Place et al. (2002) found that middle-sized groups were the best-
performing groups. The only piece of data related to group size and success in this study
was the substantial negative correlation between group size and the number of neighbors
planting fodder. The groups that were smaller thus were associated with higher numbers
of neighbors planting fodder. Perhaps in the smaller groups, members got more training,
or they were more likely to invite neighbors to trainings. Size of group is a variable that
has been examined over the years for its effects on group success, with varying results
(see, for example, Olson, 1965, in Agrawal & Goyal, 2001; Agrawal & Goyal, 2001 and

196
the studies mentioned above). Further studies are necessary to show what, if any, effect
size has upon success of groups.
Group age. This study found a positive relationship between group age and
success. De Haan (1999) studied performance of dairy-goats groups in Tanzania and also
found that older groups performed better. Place et al. (2002) found no effect of age on
group performance.
Even if the older groups were more successful, as shown in Table 4-27, it is
difficult to determine what it is about age that makes the older groups more successful.
Perhaps some of the advantages of time include greater opportunities to improve group
cohesiveness, and to learn and grow through trial and error. A similar study in a few
years, when the younger groups have also had more opportunity to unify and learn
together, and the project funding has ended, may increase understanding of the
differences, if any, that age makes.
Formality/record-keeping. The data revealed no significant differences between
groups with high levels of formality and those with low levels. Informants thought those
groups that kept good records would be better disseminators. The negative correlation
between the adoption index measure of success and record keeping may be due to the fact
that those groups that were more successful were more focused on dissemination, and
less on administrative tasks. Farmers in the study tended to have low levels of education,
which may have affected record keeping and success in dissemination in different ways.
Leadership. Most of the questions regarding leadership had very little variation in
response on both the group and individual questionnaires. Part of the reason for the lack
of variation in responses regarding group leadership could be due to a cultural tendency

197
to say what the respondent feels will please the researcher, or to “save face,” combined
with the traditional respect for leaders. However, even with probing, respondents
maintained their responses. Leaders were present during the interviews, and to maintain
an open atmosphere they remained for the discussion on leadership, but did not take part.
Again, this may have contributed to reticence on the part of members, but they were
encouraged to speak freely and their responses were probed. When individual farmers
were asked about the dairy-goat group leaders, the average response was 4.75 on a scale
of 1 to 5 where 1 = “strongly disagree that leadership is good” and 5 = “strongly agree
that leadership is good.” This was even higher than the groups’ average response of 4.59.
In other words, even with no leaders present, farmers claimed that the dairy-goat group
leadership was quite good.
Stakeholders at the meeting where research results were presented said that they
thought that leadership did affect success in dissemination. Irresponsible leaders made
information unavailable or distorted, according to the extension subgroup at the
stakeholders’ meeting. Stakeholders also thought that leaders were the ones to source
(obtain) information. Fear of competition and jealousy caused leaders to hide
information. Farmer stakeholders said that the extension groups were good because they
had good leaders, and as a result, formed more groups (outnumbering the FARM groups).
FARM-Africa stakeholders thought that acceptance and trust, which resulted from good
leadership, encouraged success in dissemination. If the leaders were not good,
stakeholders felt that non-members would not come to consult with the group. On the
other hand, leaders who were good would have good public relations with outsiders and

198
provide them with welcoming gestures, thereby attracting more activities at the buck
stations.
Leadership vis-à-vis gender, wealth and age. Farmers agreed at the stakeholders’
meeting at the end of the fieldwork that the figures regarding leadership and gender
seemed correct (Table 4-16). One of the results was the high number of male
chairpersons. Issues discussed were the traditional role of men in the Meru society, and
the fact that men might be able to more strongly represent the group before the chief, in
government offices, and so forth. This may also be part of the reason why men were
sometimes allowed into women’s groups. The fact that groups with male leaders had a
slightly higher adoption index score may add credence to these arguments.
Chairpersons tended to be higher in age (Table 4-16). Perhaps this was because the
groups saw the chairperson position as one of respect, and in the Meru culture the wazee
(old people) are respected. For the secretary and treasurer positions, perhaps age was not
so important, or they needed someone with more energy and/or perhaps more schooling.
Another phenomenon discussed at the stakeholders’ meeting was the high number
of female treasurers. Most treasurers were female (76%). Stakeholders felt that this was
because men were less trusted with money and were not transparent with accounts. Men
“have a lot of movements outside the home,” whereas women tended to stay around the
farm and home. Also, there was a cultural issue at work; in Kenya, men tend to be
owners while females are managers. Females may therefore have been viewed as more
likely to properly manage the funds.
It was noted during the stakeholder meeting that many of the treasurers appeared to
be in a higher wealth category than the other leaders (28% of treasurers were above
199
average, while 11% of chairpersons and 9% of secretaries were above average).
According to the stakeholders present at the meeting, having treasurers who were
wealthier perhaps provided a means for the group to get their money back if the treasurer
misused it. The wealth of the treasurer thus provided a sort of collateral; if the need to
take legal action against the treasurer arose, group members would have a better chance
of getting their money back.
Wealth. There were mixed results for correlations of wealth indicators of the dairy-
goat group members with success indicators. A study on individual dissemination by
farmers in Central Kenya revealed no association between wealth level and dissemination
(Franzel et al., 2003). Because it was so difficult to see the effects of wealth on
participation in groups, perhaps further research with a different approach, using more
qualitative tools or analyses such as path models would be useful to describe the effects
of wealth on participation.
However, looking at wealth indicators of dairy-goat groups does help to explain
some phenomena in the project. In the lower zones where land productivity was lower,
land holdings were larger, and there were greater numbers of goats and local cattle. This
may explain why larger shambas (farming plots; an indicator of wealth) were positively
correlated with one success indicator, number of buck services. So while being an
indicator of wealth, because of the differences in agricultural potential, land size is not an
indicator that alone can show that groups were wealthy. Land size could be useful for
comparisons within agroecological zones, however. This positive correlation between
land size and buck services could also explain why higher numbers of improved cows

200
were associated with fewer buck services (r = -.342; n = 42). In the lower zones where
there were bigger shambas, farmers had fewer improved cattle.
Activities. De Haan (1999) found that older groups with multiple functions were
more successful at dissemination of the technology. This study found no relationship
between number of activities and group success in dissemination. Groups that had many
activities and those that had few showed no difference in dissemination performance.
However, Place et al. (2002) found that groups that changed their purpose over time were
more successful. The key here may be that groups that can conduct activities according
to the felt needs of the group, even if it means changing their focus, are able to more
successfully perform as a group.
Homogeneity. Homogeneity among members was significantly related to just one
success indicator, the number of neighbors planting fodder, with more homogeneous
groups having greater success. Stakeholders in the research study thought that groups
with more homogeneity among their members were better disseminators for several
reasons. They believed that homogeneity would increase understanding within the group.
They thought that heterogeneity through variables such as wealth, ideology, and political
stance would lead to undermining the group. Members who are similar have common
interests, language, goals, history, culture and objectives. They also have unity.
Jealousy. Jealousy in this study was measured within the group itself, not between
the group and outside members. As defined in Chapter 4, jealousy in this study referred
to the state of being desirous of another’s advantages. It is an important factor to
consider in dissemination studies, because people may not want others to get ahead of
them materially. They may even be afraid to get ahead of others because of fear of

201
jealousy by others. Moderate correlations were found between the dependent variable the
adoption index and perceived jealousy among members (r = .329; n = 46) (Table 4-24).
This is not a strong correlation, and the groups’ responses to perceived jealousy in the
groups were highly skewed toward low levels of it (1.63 on a scale of 1 to 5, with 5 being
high jealousy). Perhaps the groups that were getting out and disseminating more had
internal arguments regarding whether or not they should do this or keep the knowledge to
themselves, and so were more likely to perceive their group as having more jealousy.
In the concurrent farmer-to-farmer study taking place in Meru in which the
researcher participated, 54 primary causes of lack of information flow were discovered,
15 of them being socio-cultural. One of the main ones was jealousy. Jealousy was
therefore seen as a barrier in farmer-to-farmer dissemination of information. According
to the farmer-to-farmer study, jealousy was restricting the flow of knowledge and
information in the greater Meru area (FARM-Africa stakeholder meeting held 29-30
October, 2003 at the Transit Hotel, Chogoria). However, the exact way that jealousy
affects dissemination is not known, and should be a consideration for further research.
Cohesiveness. Unity was another variable with a skewed response (4.59 on a scale
of 1 to 5, with 5 being high unity), and it had no significant relationships with indicators
of success. However, de Haan et al. (1996) found problems in groups that had been
established solely for the purpose of another dairy-goat project in Kenya. Such groups
had problems of unity and working together. They therefore recommended working with
existing groups that already have a social base established, rather than forming new and
artificial groups.

202
Capacity. Morton et al. (2002) found that training led to greater success in self-
help groups and dairy cooperatives in Kenya. This study revealed similar findings.
Furthermore, this study shows that capacity can be built. The FARM groups were below
the extension groups in terms of wealth and capacity to begin with, but have
outperformed extension groups thus far in terms of dissemination of information and
technology. Once again, this emphasizes the importance of building capacity for rural
development.
Type of group. The dairy-goat groups consisted of two types of dairy-goat groups,
FARM groups and extension groups. Although both types of groups worked with both
FARM and extension staff, they were called by these terms to differentiate the FARM
groups, which were officially part of the dairy-goat project (which was a collaboration
between FARM and the Kenyan government), and the extension groups, which were
formed later. The FARM groups had been chosen because of their poverty, and formed
into groups with the project and chief’s help. Extension groups were formed later, having
decided to form in order to obtain dairy goats. They purchased a buck themselves, rather
than being given the buck as the FARM groups were.
The extension groups were for the most part newer than the FARM groups, and
therefore less likely to have a buck that was ready to serve (breed). The FARM groups
had been around longer than most of the extension groups, and this may have been an
important factor in the differences of dissemination success between the two groups. The
older FARM groups’ neighbors would have had a greater chance to obtain crossbred
goats. Also, some of the extension buck stations were very new, and so it was unlikely
that their neighbors would have had a chance to fully adopt dairy-goat technologies.
203
Even if they had bred their local goats, they may not have obtained kids or have been able
to sell them. Because of this, it would be useful to conduct a similar study in a few years’
time to see more clearly the differences between FARM and extension groups.
There was another type of group that was interviewed, but the results not included
in the data analysis in Chapter 4. It was mentioned in Chapter 4 that four dairy-goat
groups in the district, but not part of FARM-Africa, were interviewed during the study.
They had been started by the NGO called Meru Drylands Farming Project (MDFP),
which was part of a larger NGO called SOS-Sahel. Again, the results of these interviews
were not included in any of the data analyses for Chapter 4. However, certain differences
did stand out between the FARM-Africa groups and the MDFP groups. The
agroecological zones were very different. While trees, especially grevillea, were a
characteristic of the landscape in the rest of Meru, Buuri division where the MDFP
groups were was devoid of trees except in hedgerows. The area appeared much drier,
and wheat was an important crop. MDFP groups conducted more activities than FARM,
had larger land size, more members, more member schooling, and more total livestock.
Level of formality, homogeneity of members and number of linkages was similar for both
types of groups. Government extension was not such a significant player in the MDFP
area. There were different NGOs in the area than where FARM worked, and they were
major sources of information for the group (MDFP was one and the European Committee
for Agricultural Training, CEFA, another). Of course, the data for the MDFP groups is
too limited to determine how significant these differences were, but it does show that the
supporting organization and the location of the project make an important difference.
These differences and the differences between groups from different areas in the FARM-

204
Africa project point to the need to increase flexibility in projects to deal with the diversity
among people, farming systems, and agroecological zones.
In summary, the variables that appeared to affect success of dairy-goat groups in
disseminating information and technologies included the location, age of the group,
homogeneity, capacity, linkages, and type of group. Table 5-1 relates the study findings
to what other researchers have found on the variables that affect group success. Only de
Haan (1999) was specifically examining success in dissemination; however, it can be
argued that dissemination can be one aspect of group performance that the other
researchers were examining.
Table 5-1. Studies examining the effect of group factors on success Stringfellow et
al. (1997) de Haan (1999)
Morton et al. (2002)
Place et al. (2002)
Davis (2004)
Altitude +/-? + Size of group - +/- +/- -? Age of group + 0 + Activities - + - 0 Homogeneity + + 0 + Capacity + + Linkages + + Type of groupa + a 0 = Extension-facilitated; 1 = FARM-facilitated + positive relationship - negative relationship
Summary
Use of Groups in Extension
Groups play an important role in agricultural extension in Kenya today. The
current extension program, National Agriculture and Livestock Programme (NALEP),
encourages the use of “common interest groups,” as do many other extension players
such as non-governmental organizations and bilateral aid organizations. Some projects in
Africa make group formation a prerequisite for assistance (Stringfellow et al., 1997).

205
Groups increase the efficiency, effectiveness and equity of service provision and also
help to empower farmers (Esman & Uphoff, 1984; Geran, 1996). Franzel et al. (2003)
found that using groups helped not only to economize on training skills, but ensured more
farmer-to-farmer engagement and extension. Krishna (2001, p. 938) describes the
importance of capable agencies such as farmer groups, and their role in development:
“Capable agents help villagers overcome these obstacles [lack of information, poor
communication networks etc.] to effective collective action and social capital is made
more productive when such agents are available in the village.” This study shows
positive, significant linear relationships between the number of groups that farmers are in
with the amount of tours/trainings they have received and the number of other farmers to
whom they have disseminated information/technologies. Groups are thus an effective
and efficient way to target extension.
Farmer groups in Meru Central District were targeted with information from
churches, schools, government extension and chief baraza and told to “tell other
[farmers].” Extension or other agricultural players often trained the dairy-goat groups,
who would then act as consultants to other farmers. Many dairy-goat farmers became
members of the MGBA, which was comprised of dairy-goat farmers from the project
area. The MGBA conducted trainings for other farmers. For instance, in June 2003,
farmers in Meru trained those in the Meru Drylands Farming Project on goat
management and leadership. Farmers who have been trained are “very vocal” in telling
others of new technologies, according to informants.
Farmer groups are key to practitioners and policy makers interested in improving
rural livelihoods, reducing poverty, and stimulating growth of the agricultural sector. As

206
mentioned earlier, studies in Tanzania have shown that investing in social capital such as
groups can have a far greater effect upon household income than investment in human
capital such as education (Narayan & Pritchett, 1999).
Farmer groups and other forms of community-based services are a way of ensuring
sustainability of extension and development programs. With NGOs, government and
international research stations, funds can run out or be withdrawn according to donors’
objectives. This does not mean that the national extension service or other extension
partners are obsolete. The farmer, however, is the beginning and end of extension, and
should play a large role in extension and therefore in up-scaling technologies. According
to this study, community-level groups are a major way for farmers to obtain information
and training and to be better extensionists to their neighbors.
In areas like Meru, where social capital is already high, farmer groups should be
targeted as a vehicle for extension and other rural development initiatives. Mechanisms
for working with farmer groups need to be improved. For instance, the Ministry of
Culture, Gender and Social Services must be able to liaise with the government extension
staff, with other development providers and with the local administration in the form of
the chief’s office. Some mechanism needs to be established in order to prevent
replication of efforts and alienation of certain groups. The chief’s camp would perhaps
be a suitable clearinghouse for groups seeking assistance or development organizations
seeking groups.
For groups to play an effective role in extension, an enabling environment is
necessary. Groups need to be able to approach the government or other development
players for assistance. The Kenyan government should facilitate the registration of

207
groups with the Department of Social Services. There should then be a standard
operating procedure for groups to follow to obtain development assistance, or for the
mechanism to work the opposite way: for development players to seek groups that they
can then work with. It was mentioned above that local administration and the chief’s
office need to be strengthened, because they are an important player in agricultural
extension. Another institution that needs strengthening is the District Development
Committee. This committee is meant to oversee all of the development issues in the
district. However, this does not always happen in all districts, and so there must be a way
to improve this mechanism.
For areas where social capital is not so strong, or where poverty or other factors
prevent people from joining groups, other steps must first be taken. Social capital must
be built. It is not advisable that development agencies arbitrarily form groups at the
community level. Where there is limited social capital, for whatever reason, it may be
helpful to work through established community networks, such as churches or the local
council of elders or tribal chief.
Formal registration of groups is something that is necessary to for the government
to be able to help groups. However, this process also may prevent farmers from joining
groups or from registering their group. Fees may keep some groups out, while illiteracy,
physical distance, and fear of the government may keep others from registering (groups
are required to develop by-laws and to elect officers, processes that some farmers may
not fully understand). Where poverty and other factors inhibit the joining of groups,
perhaps a limited form of providing subsidies for such groups would enable them to be
able to register. There must be some way for groups to register, if not formally with the

208
Department of Social Services, at least informally at the chief’s camp, which is much
more accessible and approachable than district government offices for some farmers.
Finally perhaps churches or other local organizations could work with farmer groups at
the community level to assist them to approach the chief or other government officials or
development players for help.
When forming groups, the NALEP model used in Kenya today may be good to
follow. Under NALEP, extension staff focus on administrative locations for a year.
During that time, experts come, and using the forum of the chief’s baraza, they teach
farmers in the area about different techniques. Depending on what the farmers are
interested in, they then form common interest groups that receive training. A key goal
here would be to train newly-formed groups on issues such as group dynamics,
leadership, record-keeping and so forth.
How Do Groups Fit in a Pluralistic Extension System?
What is happening in Meru is a useful model of how farmers, community-based
organizations, government extension, NGOs and international research centers can all
work together to bring about rural development and to provide a pluralistic model of
agricultural extension. The dairy-goat project’s approach has been quite successful in
disseminating new information and technology to other farmers using a variety of means,
and thus extension policy makers and practitioners would do well to note what made it
successful. The project greatly increased since its start in 1996, going from 44 to over
100 dairy-goat groups. Over 20,000 buck services have been recorded and milk yields
have increased six-fold (FARM-Africa Progress Report, 2002). FARM established the
Meru Goat Breeders’ Association and the Meru Animal Health Workers’ Group. Goats

209
have been sold in over 30 districts and three countries, and many farmers and NGOs have
traveled to Meru to see the project.
A number of factors likely made the FARM-Africa project successful. The project
focused heavily on training of both farmers and extension staff. FARM also emphasized
linkages with the chief, government extension, the private sector, international research
centers, and other NGOs. FARM-Africa provided transport for government extension
personnel, whose salaries were being paid by the Kenyan government. Extension officers
and farmers were used to train other farmers. The private sector was brought in to
provide animal healthcare. The project established the Meru Goat Breeders’ Association
to carry on the work. Experience-sharing was written into the project—dairy-goat
farmers from Meru traveled to other parts of Kenya and Tanzania, Uganda, and Ethiopia
to meet with and train other farmers. FARM also focused heavily on monitoring,
evaluation, and feedback from participants.
All of the actors in extension should be able to work together in such a way,
concentrating on the strengths of each, so that by all means necessary the information and
technologies spread. Such a pluralistic model must take advantage of the strengths of
each of the players. For instance, Parkins (1997) found that formal organizations tended
to provide information to farmers, while informal organizations usually provided
materials. This study found that certain players were useful during the project start and
others in the midst of the project. Some of the ingredients for success of such a
pluralistic system, based upon the FARM-Africa/Government of Kenya project model,
appear to be the facilitation of government extension workers, capacity building among

210
farmers and farmer groups, paying attention to the whole system (for instance, making
sure that animal health care was available), and networking among the various players.
Now that the FARM project has shown that such linkages are workable, perhaps
development players might want to consider other potential players or channels for
information flow. For instance, the Ministry of Health often gets out to the rural areas on
inoculation campaigns. Perhaps there might be some way to link government extension
personnel with such a campaign, so that when people are gathered for inoculations they
could also learn about new technologies, or how they can form into groups to obtain
development assistance.
Government extension policy in Kenya today is to work with farmer groups.
Policy makers should continue to incorporate an integrated or pluralistic approach to
extension, in which grass-roots organizations play a key role. The emphasis today is on
extension systems that are demand-driven, participatory, pluralistic/multi-stakeholder,
decentralized, and privatized. This means involving all players. Groups are one
important vehicle for extension; however, they are no “silver bullet.” Groups should be
used, but not solely focused on as a means of extension. It is unlikely that farmer groups
in rural areas will be doing formal-type extension on their own. It is in conjunction with
other players such as NGOs, government and private players that farmer groups will be
most effective.
The role of groups needs to be examined not just from an extension standpoint, but
an overall holistic approach to rural development. Farmer groups, community-based
organizations, local organizations (Esman & Uphoff, 1984), and rural people
organizations (RPOs) (Collion & Rondot, 2001) play an important role in rural

211
development today. Groups allow for federalization and lobbying, and give farmers a
voice. Farmer groups have multiple roles to play. Extension is never a stand-alone
activity for farmer organizations; it is one of many activities (P. Rondot, personal
communication, 16 May 2003). Farmer groups are important in terms of access to
various types of capital, such as social, physical, and natural. Furthermore, farmer groups
are not only an important support system for rural people in developing countries.
Wibberly (1997) studied “Farmer-Dominant Study Groups” (FDSG) in the United
Kingdom and found that farmers not only shared knowledge with each other, but
provided mutual support and friendship. Some of the highest ratings of the benefits of
FDSGs were with regard to cohesion; giving friendship, problem sharing, and enjoyment
received the highest marks.
Researchers, policy makers, and practitioners should better understand farmer
groups’ role in development, and their strengths and weaknesses. Farmers are an
important source of information for other farmers. However, they need to be able to
access information and technologies to be able to show, tell, and learn. A study on
adoption and dissemination of fodder shrubs in central Kenya (Franzel et al., 2003)
concluded with
Extension approaches are needed to enable farmers groups, on their own, to access information on new practices. Governments and development partners should not see their role as simply transferring technology and information to farmers. Rather, they should focus on assisting farmers groups to mobilise their own resources and enhance their ability to obtain information on improved practices from outside their villages (p. i).
Recommendations for Policymakers and Practitioners
In light of the summaries on each of the first four study objectives,
recommendations are made below for policy makers, practitioners, and others who are
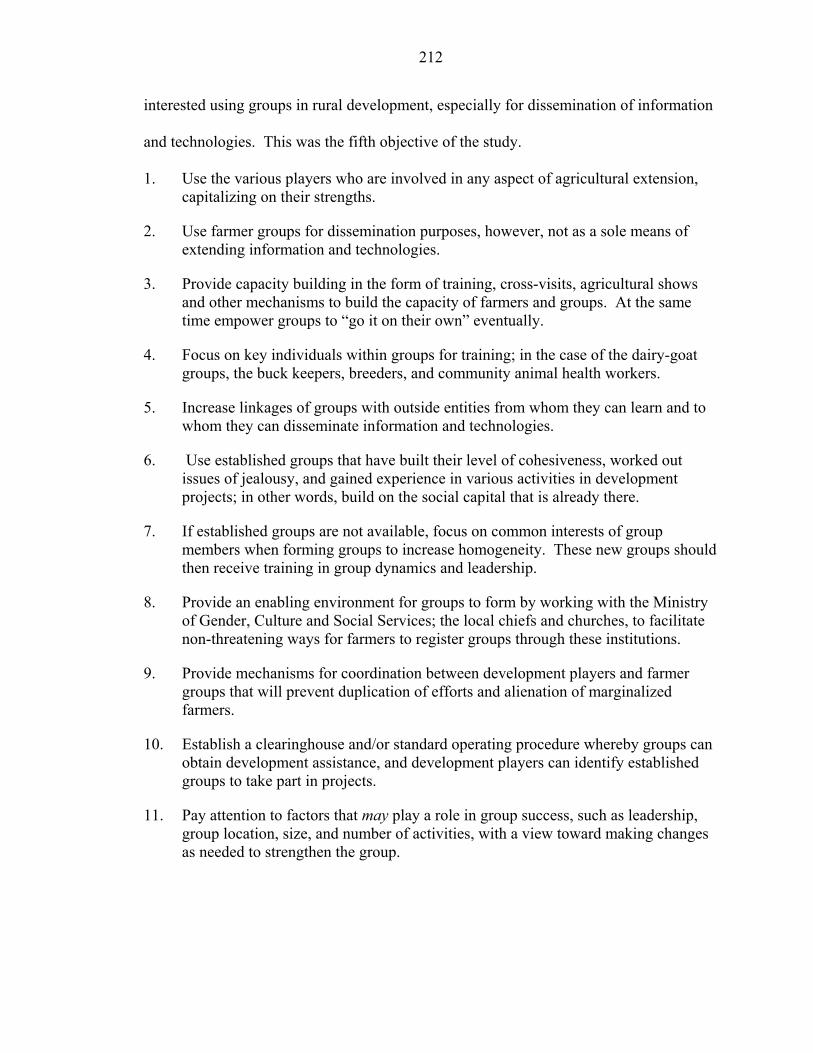
212
interested using groups in rural development, especially for dissemination of information
and technologies. This was the fifth objective of the study.
1. Use the various players who are involved in any aspect of agricultural extension, capitalizing on their strengths.
2. Use farmer groups for dissemination purposes, however, not as a sole means of extending information and technologies.
3. Provide capacity building in the form of training, cross-visits, agricultural shows and other mechanisms to build the capacity of farmers and groups. At the same time empower groups to “go it on their own” eventually.
4. Focus on key individuals within groups for training; in the case of the dairy-goat groups, the buck keepers, breeders, and community animal health workers.
5. Increase linkages of groups with outside entities from whom they can learn and to whom they can disseminate information and technologies.
6. Use established groups that have built their level of cohesiveness, worked out issues of jealousy, and gained experience in various activities in development projects; in other words, build on the social capital that is already there.
7. If established groups are not available, focus on common interests of group members when forming groups to increase homogeneity. These new groups should then receive training in group dynamics and leadership.
8. Provide an enabling environment for groups to form by working with the Ministry of Gender, Culture and Social Services; the local chiefs and churches, to facilitate non-threatening ways for farmers to register groups through these institutions.
9. Provide mechanisms for coordination between development players and farmer groups that will prevent duplication of efforts and alienation of marginalized farmers.
10. Establish a clearinghouse and/or standard operating procedure whereby groups can obtain development assistance, and development players can identify established groups to take part in projects.
11. Pay attention to factors that may play a role in group success, such as leadership, group location, size, and number of activities, with a view toward making changes as needed to strengthen the group.

213
Recommendations for Further Research
This study and others (de Haan, 1999; Morton et al., 2002; Place et al., 2002;
Stringfellow et al., 1997) have shown some of the key factors affecting success of groups.
Based upon the results of these studies, empirical analyses are now needed to rigorously
examine specific factors affecting success. Also, since farmer groups play such a large
and at times successful role in extension, it is imperative that researchers take a rigorous
look at group participation, to see who is in the groups and who is not. Attempting to
obtain a large sample size of groups would be helpful to future researchers to run more
complex multivariate analyses. Longitudinal studies related to changes in wealth levels
and relating them to factors such as activities and trainings would also help to pinpoint
exactly how projects and groups help in rural development. Finally, it is recommended
that organizations such as FARM-Africa and other extension players who are working
with farmer groups at the grassroots level combine their knowledge, experience and
resources with well-designed, rigorous studies to further the effects of their programs.
Conclusion
Government extension in Kenya today is unable to provide many small-scale
farmers with pertinent technologies and information to bring about rural development.
Other providers do not have the resources or incentives to effectively reach such farmers.
The issue then is how best to disseminate these technologies to benefit farmers despite
limited extension coverage. One answer to this dilemma is to emphasize the use of local
resources/capacity, such as farmer groups, to reach smallholders in an appropriate way.
Today in Kenya, many technology dissemination approaches exist, with few
studies to show their effectiveness. One important need in the new extension paradigm,
which includes community-based extension, has been to determine the role that

214
community groups play in extending technologies, and how they go about disseminating
information to other farmers. Knowing these mechanisms will contribute to the effort in
scaling up the impact of agricultural research. This study has addressed these issues,
examining the role that farmer groups play in dissemination, who participates in the
groups and why, what linkages the groups have, how groups disseminate information,
and finally, what factors are the key to successful groups.
Using community-based mechanisms within the context of a pluralistic extension
model will capitalize on the strengths of each player, increase benefits and cut costs.
Farmer-led extension has been shown to be an important means of spreading technology
(Chambers, 1997; Esman & Uphoff, 1984; Scarborough, Killough, Johnson &
Farrington, 1997). Farmer groups are therefore an important actor in the extension scene
and can be a major tool for community-based extension. As such, it would behoove
policy makers to create an enabling environment to strengthen and empower farmer
groups for this crucial role.
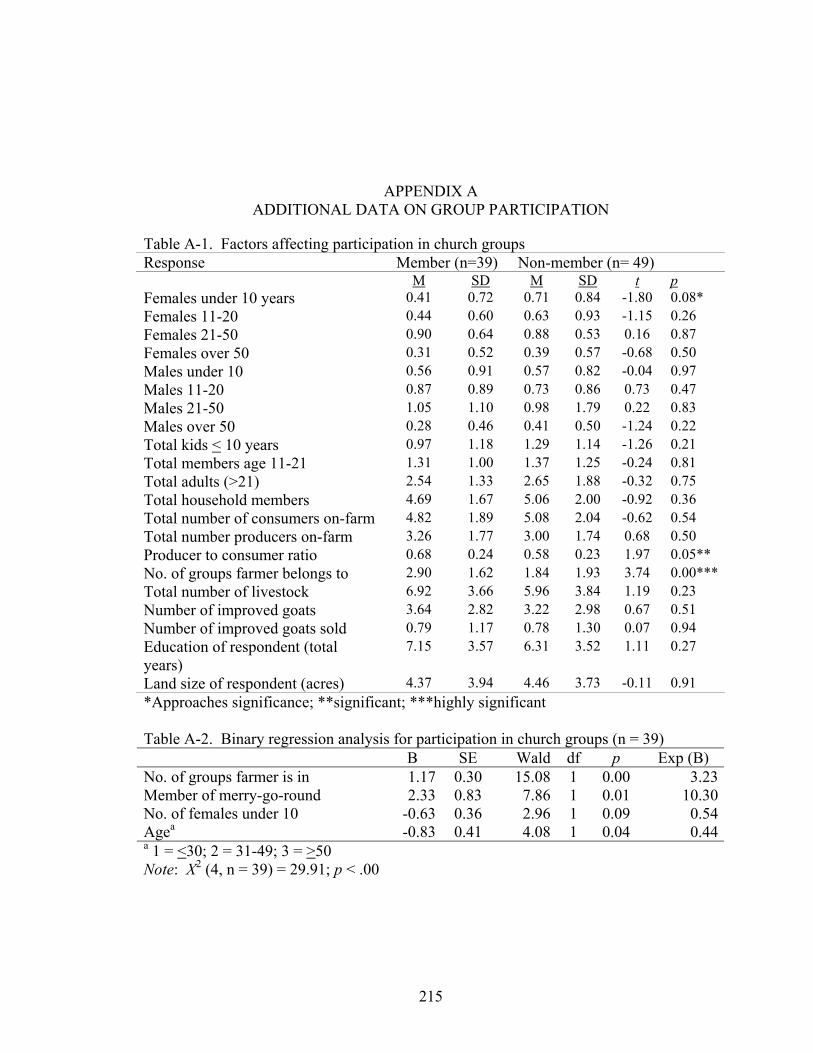
APPENDIX A ADDITIONAL DATA ON GROUP PARTICIPATION
Table A-1. Factors affecting participation in church groups Response Member (n=39) Non-member (n= 49) M SD M SD t p Females under 10 years 0.41 0.72 0.71 0.84 -1.80 0.08* Females 11-20 0.44 0.60 0.63 0.93 -1.15 0.26 Females 21-50 0.90 0.64 0.88 0.53 0.16 0.87 Females over 50 0.31 0.52 0.39 0.57 -0.68 0.50 Males under 10 0.56 0.91 0.57 0.82 -0.04 0.97 Males 11-20 0.87 0.89 0.73 0.86 0.73 0.47 Males 21-50 1.05 1.10 0.98 1.79 0.22 0.83 Males over 50 0.28 0.46 0.41 0.50 -1.24 0.22 Total kids < 10 years 0.97 1.18 1.29 1.14 -1.26 0.21 Total members age 11-21 1.31 1.00 1.37 1.25 -0.24 0.81 Total adults (>21) 2.54 1.33 2.65 1.88 -0.32 0.75 Total household members 4.69 1.67 5.06 2.00 -0.92 0.36 Total number of consumers on-farm 4.82 1.89 5.08 2.04 -0.62 0.54 Total number producers on-farm 3.26 1.77 3.00 1.74 0.68 0.50 Producer to consumer ratio 0.68 0.24 0.58 0.23 1.97 0.05** No. of groups farmer belongs to 2.90 1.62 1.84 1.93 3.74 0.00***Total number of livestock 6.92 3.66 5.96 3.84 1.19 0.23 Number of improved goats 3.64 2.82 3.22 2.98 0.67 0.51 Number of improved goats sold 0.79 1.17 0.78 1.30 0.07 0.94 Education of respondent (total years)
7.15 3.57 6.31 3.52 1.11 0.27
Land size of respondent (acres) 4.37 3.94 4.46 3.73 -0.11 0.91 *Approaches significance; **significant; ***highly significant Table A-2. Binary regression analysis for participation in church groups (n = 39) B SE Wald df p Exp (B) No. of groups farmer is in 1.17 0.30 15.08 1 0.00 3.23Member of merry-go-round 2.33 0.83 7.86 1 0.01 10.30No. of females under 10 -0.63 0.36 2.96 1 0.09 0.54Agea -0.83 0.41 4.08 1 0.04 0.44a 1 = <30; 2 = 31-49; 3 = >50 Note: X2 (4, n = 39) = 29.91; p < .00
215

216
Table A-3. Factors affecting participation in clan groups Response Member (n=23) Non-member (n=65) M SD M SD t p Females under 10 years 0.43 0.66 0.63 0.84 -1.01 0.31 Females 11-20 0.52 0.85 0.55 0.79 -0.16 0.87 Females 21-50 0.87 0.55 0.89 0.59 -0.16 0.87 Females over 50 0.39 0.58 0.34 0.54 0.40 0.69 Males under 10 0.83 0.94 0.48 0.81 1.70 0.09* Males 11-20 0.74 0.81 0.82 0.90 -0.36 0.72 Males 21-50 1.30 2.42 0.91 1.03 1.08 0.28 Males over 50 0.39 0.50 0.34 0.48 0.45 0.65 Total kids < 10 years 1.26 1.18 1.11 1.16 0.54 0.59 Total members age 11-21 1.26 1.01 1.37 1.19 -0.39 0.70 Total adults (>21) 2.96 2.23 2.48 1.39 1.20 0.23 Total household members 5.04 1.64 4.85 1.95 0.43 0.67 Total number of consumers on-farm 5.00 1.60 4.95 2.10 0.10 0.92 Total number producers on-farm 2.96 1.26 3.17 1.90 -0.60 0.55 Producer to consumer ratio 0.63 0.23 0.63 0.24 -0.05 0.96 No. of groups farmer belongs to 2.96 1.22 2.08 1.42 2.65 0.01**Total number of livestock 6.22 2.98 6.45 4.03 -0.25 0.81 Number of improved goats 3.70 2.32 3.31 3.09 0.55 0.59 Number of improved goats sold 0.70 1.06 0.82 1.30 -0.40 0.69 Education of respondent (total years) 6.13 2.87 6.88 3.76 -0.87 0.39 Land size of respondent (acres) 4.28 3.92 4.47 3.79 -0.21 0.84 *Approaches significance; **significant Table A-4. Contingency table on gender and participation in clan groups Gender Member Non-member Total Female 6 37 43 Male 17 28 45 Total 23 65 88 Note: X2 (1, n = 88) = 6.47; p < .01 Table A-5. Binary regression analysis for participation in clan groups (n = 23) B SE Wald df p Exp (B) No. of groups farmer is in 0.84 0.28 9.34 1 0.00 2.32 Member of water group 2.17 0.87 6.27 1 0.01 8.74 Gendera -2.02 0.66 9.34 1 0.00 0.13 a 0 = female; 1 = male Note: X2 (3, n = 23) = 20.97; p < .00

217
Table A-6. Factors affecting participation in merry-go-rounds Response Member (n=18) Non-member (n=70) M SD M SD t p Females under 10 years 0.61 0.78 0.57 0.81 0.19 0.85 Females 11-20 0.61 0.70 0.53 0.83 0.39 0.70 Females 21-50 0.94 0.54 0.87 0.59 0.49 0.63 Females over 50 0.28 0.46 0.37 0.57 -0.65 0.52 Males under 10 0.78 1.06 0.51 0.79 1.17 0.25 Males 11-20 0.61 0.70 0.84 0.91 -1.00 0.32 Males 21-50 1.06 1.00 1.00 1.62 0.14 0.89 Males over 50 0.28 0.46 0.37 0.49 -0.74 0.46 Total kids < 10 years 1.39 1.20 1.09 1.15 0.99 0.33 Total members age 11-21 1.22 0.88 1.37 1.21 -0.49 0.62 Total adults (>21) 2.56 1.69 2.61 1.65 -0.13 0.89 Total household members 5.11 1.97 4.84 1.85 0.54 0.59 Total number of consumers on-farm 5.17 2.07 4.91 1.95 0.48 0.63 Total number producers on-farm 3.22 1.93 3.09 1.72 0.29 0.77 Producer to consumer ratio 0.58 0.22 0.64 0.24 -0.89 0.38 No. of groups farmer belongs to 3.39 2.03 2.03 1.06 3.92 0.01** Total number of livestock 6.94 2.98 6.24 3.95 0.70 0.49 Number of improved goats 0.67 1.03 0.81 1.29 1.15 0.25 Number of improved goats sold 0.67 1.03 0.81 1.29 -0.45 0.65 Education of respondent (total years) 7.06 3.49 6.59 3.58 0.50 0.62 Land size of respondent (acres) 3.41 1.86 4.68 4.13 -1.27 0.06* *Approaches significance; **significant Table A-7. Contingency table on gender and participation in merry-go-rounds Gender Member Non-member Total Female 14 29 43 Male 4 41 45 Total 18 70 88 Note: X2 (1, n = 88) = 7.57; p < 0.0 Table A-8. Binary regression analysis for participation in merry-go-rounds (n = 18) B S.E. Wald df p Exp (B)No. of groups farmer is in 1.43 0.40 12.72 1 0.00 4.18Gendera 2.92 0.88 10.97 1 0.00 18.49Women’s group 1.76 1.05 2.80 1 0.09 5.80Church group 2.69 0.94 8.27 1 0.00 14.76a 0 = female; 1 = male Note: X2 (4, n = 18) = 36.44; p < .00

218
Table A-9. Factors affecting participation in water groups Response Member (n = 18) Non-member (n = 70) M SD M SD t p Females under 10 years 0.61 0.85 0.57 0.79 0.19 0.85 Females 11-20 0.44 0.86 0.57 0.79 -0.60 0.55 Females 21-50 1.00 0.77 0.86 0.52 0.94 0.35 Females over 50 0.39 0.50 0.34 0.56 0.32 0.75 Males under 10 0.44 0.70 0.60 0.89 -0.67 0.49 Males 11-20 0.72 0.75 0.81 0.91 -0.40 0.69 Males 21-50 1.11 1.02 0.99 1.62 0.31 0.76 Males over 50 0.44 0.51 0.33 0.47 0.91 0.36 Total kids < 10 years 1.06 1.16 1.17 1.17 -0.38 0.71 Total members age 11-21 1.17 1.10 1.39 1.16 -0.72 0.47 Total adults (>21) 2.94 1.30 2.51 1.73 0.99 0.32 Total household members 5.22 1.63 4.81 1.92 0.83 0.41 Total number of consumers on-farm 5.17 1.58 4.91 2.06 0.48 0.63 Total number producers on-farm 3.28 1.67 3.07 1.78 0.44 0.66 Producer to consumer ratio 0.61 0.29 0.63 0.23 -0.31 0.76 No. of groups farmer belongs to 3.56 1.82 1.99 1.10 4.67 0.00*** Total number of livestock 6.72 4.93 6.30 3.45 0.42 0.67 Number of improved goats 3.28 2.74 3.44 2.96 -0.21 0.83 Number of improved goats sold 0.72 1.02 0.80 1.29 -0.24 0.81 Education of respondent (total years) 7.72 3.66 6.41 3.50 1.40 0.16 Land size of respondent (acres) 5.38 5.04 4.17 3.42 1.21 0.23 ***Highly significant Table A-10. Contingency table on gender and participation in water groups Gender Member Non-member Total Female 4 39 43 Male 14 31 45 Total 18 70 88 Note: X2 (1, n = 88) = 6.43; p < .01 Table A-11. Contingency table on water source and participation in water groups (n = 18) Water Source Member Non-member Total Piped 11 33 44 Borehole/well 1 7 8 Stream/river 6 26 32 Other 0 4 4 Total 18 70 88 Note: X2 (3, n = 88) = 1.96; p < .58

219
Table A-12. Contingency table on wealth level and participation in water groups (n = 18) Wealth Level Member Non-member Total Below average 3 22 25 Average 9 39 48
Above average 6 9 15 Total 18 70 88 Note: X2 (2, n = 88) = 4.71; p < .10 Table A-13. Binary regression analysis for participation in water groups (n = 18) B S.E. Wald df p Exp (B) Gendera -2.95 0.93 10.01 1 0.00 0.05 No. of groups farmer is in 1.85 0.46 15.93 1 0.00 6.34 Clan group member 2.77 0.99 7.81 1 0.01 16.03 a 0 = female; 1 = male Note: X2 (3, n = 18) = 37.68; p < .00 Table A-14. Factors affecting participation in women’s groups Response Member (n=39) Non-member (n=49) M SD M SD t p Females under 10 years 0.29 0.61 0.64 0.82 -1.51 0.13 Females 11-20 0.71 0.99 0.51 0.76 0.86 0.39 Females 21-50 0.79 0.58 0.91 0.58 -0.71 0.48 Females over 50 0.57 0.76 0.31 0.49 -1.18 0.23 Males under 10 0.14 0.36 0.65 0.90 -2.07 0.00*** Males 11-20 0.71 0.83 0.81 0.89 -0.38 0.71 Males 21-50 1.00 1.18 1.01 1.57 -0.03 0.98 Males over 50 0.21 0.43 0.38 0.49 -1.18 0.21 Total kids < 10 years 0.43 0.65 1.28 1.19 -3.87 0.00*** Total members age 11-21 1.43 1.55 1.32 1.06 0.31 0.76 Total adults (>21) 2.57 1.45 2.61 1.69 -0.08 0.94 Total household members 4.43 2.06 4.99 1.82 -1.03 0.31 Total number of consumers on-farm 4.43 2.07 5.07 1.95 -1.12 0.27 Total number producers on-farm 3.21 2.01 3.09 1.71 0.23 0.82 Producer to consumer ratio 0.67 0.28 0.62 0.23 0.78 0.44 No. of groups farmer belongs to 2.50 1.16 2.27 1.46 0.55 0.58 Total number of livestock 6.71 3.89 6.32 3.77 0.35 0.73 Number of improved goats 3.07 3.25 3.47 2.85 -0.47 0.64 Number of improved goats sold 0.50 0.94 0.84 1.28 -0.94 0.35 Education of respondent (total years) 7.07 4.16 6.61 3.45 0.45 0.66 Land size of respondent (acres) 5.81 5.14 4.16 3.48 1.50 0.14 ***Highly significant

220
Table A-15. Binary regression analysis for participation in women’s groups (n = 14) B S.E. Wald df p Exp (B)No. of groups farmer is in 0.74 0.37 3.92 1 0.05 2.09Agea -2.60 0.95 7.49 1 0.01 0.07Total kids under 10 years -3.47 1.11 9.88 1 0.00 0.03Church group member 1.56 0.95 2.71 1 0.10 4.76Genderb 3.36 1.25 7.26 1 0.01 28.86Total number of producers 0.59 0.29 4.11 1 0.04 1.81Producer to consumer ratio -9.46 3.78 6.27 1 0.01 0.00a 1 = <30; 2 = 31-49; 3 = >50 b 0 = female; 1 = male Note: X2 (7, n =14) = 37.50; df = 7; p < .00

221
APPENDIX B SEMI-STRUCTURED INTERVIEW TOPIC GUIDE
Extending Technologies Among Small-Scale Farmers in Meru:
Ingredients for Success in Farmer Groups Date: _________________________ Name: ___________________________________ Address: _____________________________________________________________________ Gender: ___________________ Position: ___________________________________ Tell me about your group or organization or what you do in extension: What organizations or groups are providing agricultural services in your area? Where do farmers get agricultural information? What are the best/most reliable/most accessible/most frequent sources according to the farmers?

222
What percent of farmers in this area would you say are in groups? Why do they join?
Do groups and/or their members have a role to play in disseminating technologies and information to other farmers? If so how do they do so? Has information on fodder trees or fodder germplasm for dairy animals been disseminated by you, your group or anyone else in your area? If so, to whom & how? How do you define a successful farmer group in terms of extending information and technologies? How would you say ICRAF/FARM Africa/the farmers define them? What makes farmer groups successful at disseminating information and technology? How do you know that farmers have adopted a technology?

223
Does everybody in a community participate in groups? How do they decide to participate? Who doesn’t participate? Why not? How do you define the poor/most vulnerable farmers in your area? What would characterize the poorest farmers in a community? Can you categorize by most vulnerable group, the least vulnerable and the average? Do farmer groups work or link with other farmer groups? If so give examples. Do farmer groups network or link with other service providers in the area? If so who? How can farmers and farmer groups best be facilitated in disseminating information?

224
Do you have any other comments to add?

APPENDIX C LETTER OF INVITATION TO INTERVIEW FOR GROUPS
8 December 2003
Ndika Ndoto Dairy Goat Group
Bwana/Madame Chairperson:
Group meeting on Monday 15 December 2003
Kristin Davis, together with FARM-Africa, World Agroforestry Centre (ICRAF) and the University of Florida is researching the role of farmer groups in the spread of technology and information in Meru Central District.
We are happy to inform you that your group has been chosen to take part in this study. Your contribution will be greatly appreciated and will help to provide all stakeholders with valuable information on the dissemination of technology among farmers, and the role that farmer groups play in this important aspect of rural development.
In order to get the information we need, as well as out of respect to the group members’ schedules at this time of year, we would respectfully request that you only send six members to the meeting. Because we would like to have a balance of people, please send two leaders and four group members. Please also try to make a balance between male and female members (three of each if possible) as well as between wealthier and less wealthy farmers. However, remember we want no more than six group members in all.
The research team will arrive at your group at 10:00 am to begin the meeting promptly, and will leave by 12:00 pm. We thank you for your cooperation in this research project.
Sincerely, Kristin Davis PhD Researcher
225

APPENDIX D INTERVIEW SCHEDULE FOR GROUPS
Schedule # _______ Interviewer (translator): _______________________________
Date & Time: ___________________ Observer(s) _____________________
1. Group Name: _________________ 2. Village: _____________________ 3. Sub-location: _________________ 4. Location: ____________________ 5. Division: ____________________ 6. Agroecological zone (circle one) 1 UM2 (high potential) 2 UM3 (medium potential) 3 LM4 (low potential)
8. Altitude __________ 9. Latitude ____________________ 10. Longitude __________________ 11. Number of members in group:___ 12. Number of men: _____________ 13. Number of women: __________ 14. When group started: __________
7. Number Interviewed: __________ (See attached sheet for particulars)
226
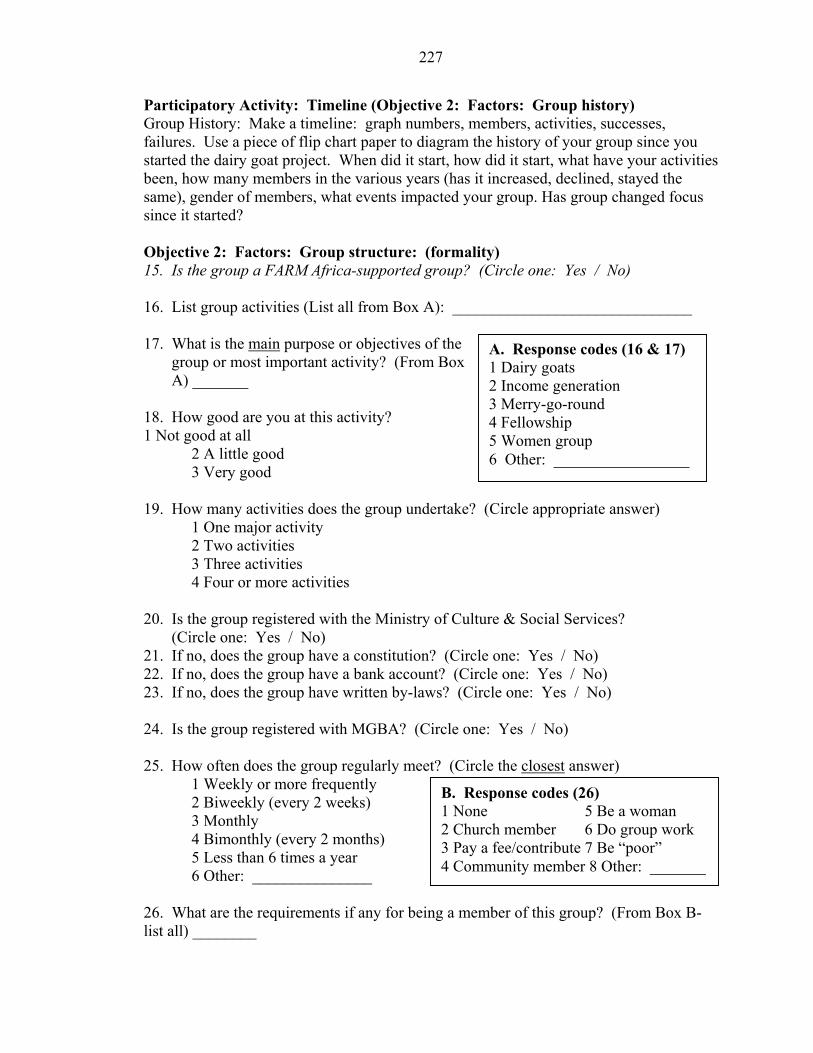
227
Participatory Activity: Timeline (Objective 2: Factors: Group history) Group History: Make a timeline: graph numbers, members, activities, successes, failures. Use a piece of flip chart paper to diagram the history of your group since you started the dairy goat project. When did it start, how did it start, what have your activities been, how many members in the various years (has it increased, declined, stayed the same), gender of members, what events impacted your group. Has group changed focus since it started? Objective 2: Factors: Group structure: (formality) 15. Is the group a FARM Africa-supported group? (Circle one: Yes / No) 16. List group activities (List all from Box A): ______________________________ 17. What is the main purpose or objectives of the group or most important activity? (From Box A) _______ 18. How good are you at this activity? 1 Not good at all 2 A little good 3 Very good 19. How many activities does the group undertake? (Circle appropriate answer) 1 One major activity 2 Two activities 3 Three activities 4 Four or more activities 20. Is the group registered with the Ministry of Culture & Social Services? (Circle one: Yes / No) 21. If no, does the group have a constitution? (Circle one: Yes / No) 22. If no, does the group have a bank account? (Circle one: Yes / No) 23. If no, does the group have written by-laws? (Circle one: Yes / No) 24. Is the group registered with MGBA? (Circle one: Yes / No) 25. How often does the group regularly meet? (Circle the closest answer) 1 Weekly or more frequently 2 Biweekly (every 2 weeks) 3 Monthly 4 Bimonthly (every 2 months) 5 Less than 6 times a year 6 Other: _______________ 26. What are the requirements if any for being a member of this group? (From Box B- list all) ________
A. Response codes (16 & 17) 1 Dairy goats 2 Income generation 3 Merry-go-round 4 Fellowship 5 Women group 6 Other: _________________
B. Response codes (26) 1 None 5 Be a woman 2 Church member 6 Do group work 3 Pay a fee/contribute 7 Be “poor” 4 Community member 8 Other: _______
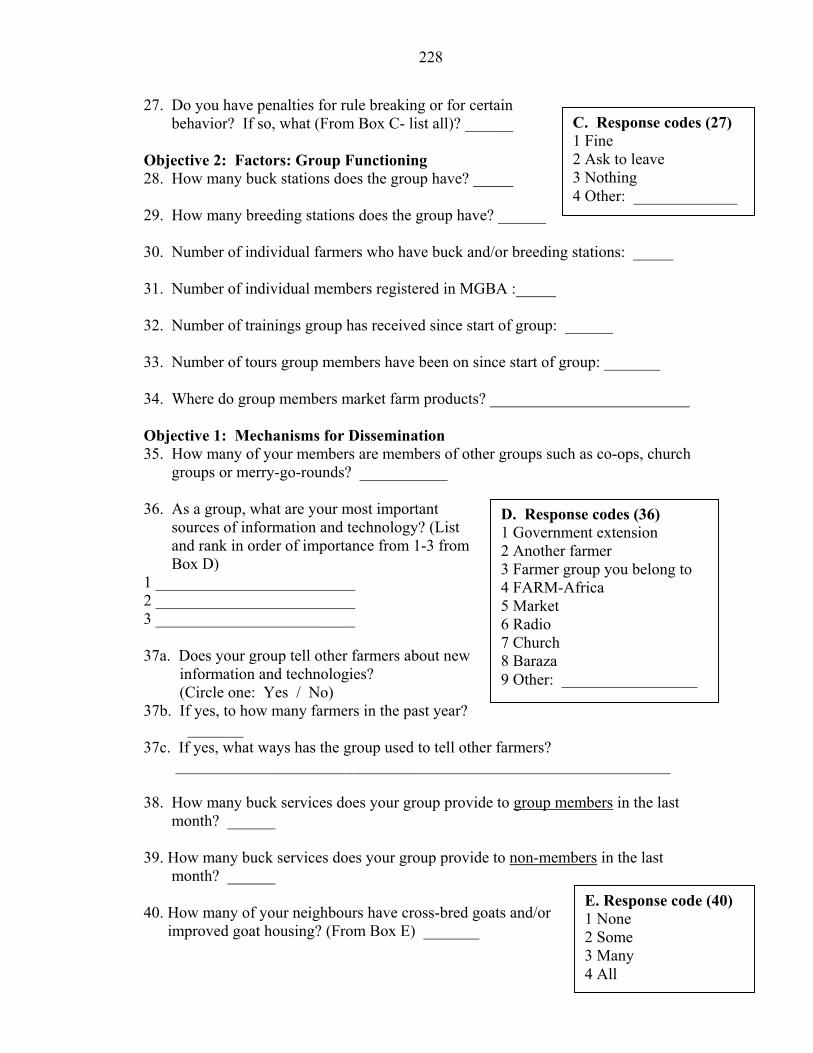
228
27. Do you have penalties for rule breaking or for certain behavior? If so, what (From Box C- list all)? ______ Objective 2: Factors: Group Functioning 28. How many buck stations does the group have? _____ 29. How many breeding stations does the group have? ______ 30. Number of individual farmers who have buck and/or breeding stations: _____ 31. Number of individual members registered in MGBA :_____ 32. Number of trainings group has received since start of group: ______ 33. Number of tours group members have been on since start of group: _______ 34. Where do group members market farm products? _________________________ Objective 1: Mechanisms for Dissemination 35. How many of your members are members of other groups such as co-ops, church groups or merry-go-rounds? ___________ 36. As a group, what are your most important sources of information and technology? (List and rank in order of importance from 1-3 from Box D) 1 _________________________ 2 _________________________ 3 _________________________ 37a. Does your group tell other farmers about new information and technologies? (Circle one: Yes / No) 37b. If yes, to how many farmers in the past year? _______ 37c. If yes, what ways has the group used to tell other farmers? ______________________________________________________________ 38. How many buck services does your group provide to group members in the last month? ______ 39. How many buck services does your group provide to non-members in the last month? ______ 40. How many of your neighbours have cross-bred goats and/or improved goat housing? (From Box E) _______
C. Response codes (27) 1 Fine 2 Ask to leave 3 Nothing 4 Other: _____________
D. Response codes (36) 1 Government extension 2 Another farmer 3 Farmer group you belong to 4 FARM-Africa 5 Market 6 Radio 7 Church 8 Baraza 9 Other: _________________
E. Response code (40) 1 None 2 Some 3 Many 4 All

229
41a. Does your group train other farmer groups? (Circle one: Yes / No) 41b. If yes, number of times the group did so in the last year ___ 42. How do you rate your group as far as success in disseminating information and technologies? 1 Very strong 2 A little strong 3 Neutral 4 A little weak 5 Very weak 43a. Has the group received training on improved fodder for livestock? (Circle one: Yes / No) 43b. If yes, who trained the group (Box F)? _______ 43c. If yes, how many members were trained? _______ 43d. If yes, did the group train other farmers outside the group? (Circle one: Yes / No) 43e. If yes, how many non-members? _______ 44. Estimate the number of members who have planted improved fodder trees on- farm specifically for dairy animals (From Box G): Amount of fodder trees Number of members0 a. 1-50 b. 51-100 c. >100 d. 45a. Has your group sold improved fodder trees or seed? (Circle one: Yes / No) 45b. If yes, how much/many? _________ 45c. Has your group given improved fodder trees or seed? (Circle one: Yes / No) 45d. If yes, how much/many? ________ 45e. If yes to a) and c), to approximately how many people? _____sold;______given 45f. How many of your neigbours have planted improved fodder (From Box G)? ___ 46. List three names of people who’ve received breeding services from your group: _____________________________________________________________________ Objective 2: Factors: Leadership Quality (degree of democracy/participation) 47. Group leaders: fill in chart Group leaders’ names Position Age Gender Wealth level*
*Wealth levels 1 Below average for the group 2 Average 3 Above average
G. Response code (44 & 45f)1 None 2 Some 3 Many 4 All
F. Response code (43b) 1 FARM 2 Extension 3 KARI 4 Other: _________

230
How do you feel about the following statements: (write in appropriate number) 1 Agree strongly 2 Agree somewhat 3 Neither agree nor disagree 4 Disagree somewhat 5 Disagree strongly 48. We have the opportunity to participate in group decision making. ________ 49. We feel that the group leadership is good. ________ 50. Group leadership is participatory. ________ Objectives 2 & 3: Factors: Group Heterogeneity; Participation 51. When you think about the members of this group, are most of them of the same or different…(tick appropriate column)
Same Different
A. Village or community B. Ethnic group or tribe C. Clan D. Gender E. Age F. Religion/church G. Occupation H. Economic group or wealth ranking
52a. How many members of your group finished secondary school? _______ 52b. How many members of your group finished primary school? _______ How do you feel about the following statements: (write in appropriate number) 1 Agree strongly 2 Agree somewhat 3 Neither agree nor disagree 4 Disagree somewhat 5 Disagree strongly 53. The group keeps good records on activities. ________ 54. Group members regularly participate in most group activities. ________ 55. The benefits from the group are the same for every member. ________ 56. This group is very unified. ________ 57. There is much jealousy in this group. ________ 58. People get along very well in this group. ________ 59. There is a lot of cooperation in this group. ________ 60. Our group has many conflicts. _________ 61. The poorest farmers in the village are present in our group today. ________ 62. The richest farmers in the village are present in our group today. ________ 63. Our group has people from all wealth levels today. ________
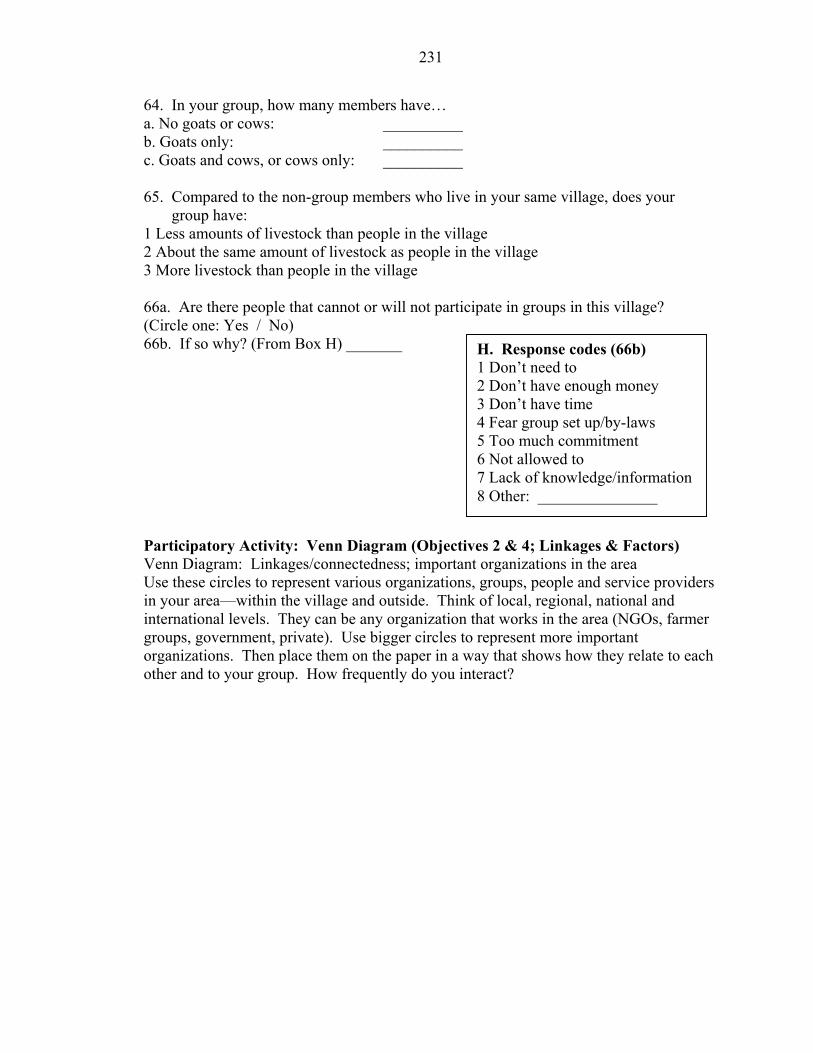
231
64. In your group, how many members have… a. No goats or cows: __________ b. Goats only: __________ c. Goats and cows, or cows only: __________ 65. Compared to the non-group members who live in your same village, does your group have: 1 Less amounts of livestock than people in the village 2 About the same amount of livestock as people in the village 3 More livestock than people in the village 66a. Are there people that cannot or will not participate in groups in this village? (Circle one: Yes / No) 66b. If so why? (From Box H) _______ Participatory Activity: Venn Diagram (Objectives 2 & 4; Linkages & Factors) Venn Diagram: Linkages/connectedness; important organizations in the area Use these circles to represent various organizations, groups, people and service providers in your area—within the village and outside. Think of local, regional, national and international levels. They can be any organization that works in the area (NGOs, farmer groups, government, private). Use bigger circles to represent more important organizations. Then place them on the paper in a way that shows how they relate to each other and to your group. How frequently do you interact?
H. Response codes (66b) 1 Don’t need to 2 Don’t have enough money 3 Don’t have time 4 Fear group set up/by-laws 5 Too much commitment 6 Not allowed to 7 Lack of knowledge/information8 Other: _______________

232
APPENDIX E INTERVIEW SCHEDULE FOR INDIVIDUALS
Schedule # _______ Interviewer (translator): _______________________________
Date & Time: ___________________ Observer(s) _____________________
Basic Information 1. Name of respondent: _______________________________ 2. Name of household head: (if different): _______________________ 3. Gender of respondent (circle):
1 Female
4. Village ______________________ 5. Sub-location _________________ 6. Location______________________ 7. Division ______________________
2 Male 8. List and rank (From Box A): Household’s three most important food crops: 1 _________________________ 2 _________________________ 3 _________________________ 9. List and rank (From Box A): Household’s three most important cash enterprises: 1 _________________________ 2 _________________________ 3 _________________________
A. Response codes (8 & 9)1 Bananas 2 Beans 3 Coffee 4 Cotton 5 Dairy 6 Goats 7 Maize 8 Mango 9 Papaya 10 Potatoes 11 Sorghum 12 Sweet potatoes 13 Tobacco 14 Other: ______________

233
10. Animals on farm and sales. Give numbers of: Description/Activity Cows-
improved Cows-local Goats-
improved Goats- local
Dairy animals a. b. c. d. Animals sold last year e. f. g. h. Objective 1: Mechanisms of Diffusion 11. What are your most important sources of information and technology? (List from Box B and rank from 1-3 in order of importance) 1 _________________________ 2 _________________________ 3 _________________________ 12a. Do you get information on agriculture and/or livestock through your church? (Circle one: Yes / No) 12b. Which church do you attend? (Circle one) 1 None 4 Full Gospel 2 Anglican 5 Methodist 3 Catholic 6 Other: ________________________ 13. In the past month, how many times if any did you attend meetings where agricultural information is available? (Circle closest answer) 1 Zero 3 Twice 2 Once 4 Three or more 14a. How many tours and/or trainings have you been on in the past 5 years? _______ 14b. What were they for or about? ________________________________________ 15a. Have you received anything new and/or information on agriculture and/or livestock from other farmers in the past 5 years? (Circle one: Yes / No) 15b. If yes, what was the last information/technology you received from other farmers? __________________________________ 15c. If yes, from whom? (From Box C-list all) ________ 15d. If yes, have you used it? (Circle one: Yes / No) 15e. If yes, how useful was it? (Circle one) 1 Not very useful 3 Quite useful 2 Somewhat useful 4 Very useful 16a. Have you trained and/or told other farmers about new technologies or information in the past 5 years? (Circle one: Yes / No) 16b. If yes, to whom? (From Box C-list all) ________
B. Response codes (11) 1 Government extension 2 Another farmer 3 Farmer group you belong to 4 FARM-Africa 5 Market 6 Radio 7 Church 8 Baraza 9 Other: _________________
C. Response codes (15c & 16c) 1 Neighbour 2 Friend 3 Relative 4 Farmer from another location 5 Other: ____________

234
16c. If yes, approximate how many farmers (Box D)_____ 16d. If yes, have they used it? (Circle one: Yes / No) 17a. Have you purchased and/or been given an improved dairy goat or crossbred? (Circle one: Yes / No) 17b. If yes, did you also receive information with it? (Circle one: Yes / No) 17c. If so, from where? (From Box E-list all) _____ 17d. If yes, how useful was it? (Circle one) 1 Not very useful 3 Quite useful 2 Somewhat useful 4 Very useful 18a. How long does it take to get to the closest buck stat18b. Have you taken your local goats for cross-breeding (Circle one: Yes / No) 18c. If yes, how many cross-bred kids have you obtained18d. If yes, did you also receive information on the goat18e. What was it about? _________________________ 18f. If yes, have you used the information? (Circle one:18g. If yes, how useful was the information? (Circle on 1 Not very useful 3 Quite useful 2 Somewhat useful 4 Very useful 18h. Will you continue to take local goats for breeding?18i. Have you built or do you know how to build an imp (Circle one: Yes / No) 19a. Do you have improved fodder trees for goats plante (Circle one: Yes / No) 19b. If so, where did you obtain the improved fodder pla 1 FARM-Africa 3 From another farm 2 Government extension 4 KARI/ICRAF 3 Local nursery 5 Other: ________ 19c. If so, give types and number (see codes):
Type Nu
20a. Have you given away or sold any improved fodder (Circle one: Yes / No) 20b. If yes, what kinds? _________________________
E. Response codes (17c)1 Buck keeper 2 Dairy goat group 3 Extension 4 FARM-Africa 5 Neighbour 6 Other:
io w
?s?_
Ye)
(ro
d
ne
__
m
pl
__
D. Response code (16b)1 Few (1-5) 2 Some (6-10) 3 Many (>11)
n? ____________(min) ith improved dairy goats?
_____ (Circle one: Yes / No) ____________________
es / No)
Circle one: Yes / No) ved goat house?
on your farm?
ts? (Circle all that apply) r
____
ber
ants or seed?
_____________________
1 Calliandra 2 Leucaena 3 Sesbania 4 Other:______

235
20c. If yes, to whom (From Box C)? ______ 20d. If yes, how many seeds/seedlings? _______ 20e. If yes, to about how many people in the past year? ______ 20f. If yes, list some names of people you’ve given/sold to: ____________________ Objective 2: Household Characteristics 21. Household head: (put age code in the “age” box and write in years of schooling) A. Gender
B. Age* (years) C. Level of <30 31-49 >50 education
Male Female
22a. How many people live on the farm more than six months of the year? ______ 22b. Of these people, place the number of household members in age category:
Age (years) Gender Under 10 11-20 21-50 Over 50
Female i. ii. iii. iv. Male v. vi. vii. viii. 23. Type of household: 1 Male with spouse(s) 4 Female- husband away (she makes decisions) 2 Male- single 5 Female- single 3 Male- wife away 6 Other: _________________________ 24. Total size of land at household, away from household, rented and owned ______(acres) 25. Do you have a title deed to your land where you live? (Circle one: Yes / No) 26. Do you have any source of income off the farm? (Circle one: Yes / No) Objectives 2 & 3: Leadership & Participation in Groups 27. How many groups are you a member of? (Circle appropriate number*) 0 1 2 3 or more groups *If 0……………………………………………………………… skip to question #47 28. Names/types of groups (Box F): ______________________________________ 29a. Is one of them a dairy goat group? (Circle one: Yes / No) 29b. If yes, which one? ___________________ 29c. If no, which is the most important group to which you belong (From Box F)?*_____ ……………………….….* skip to question #35
*Age code 1 <30 years 2 31-49 3 >50
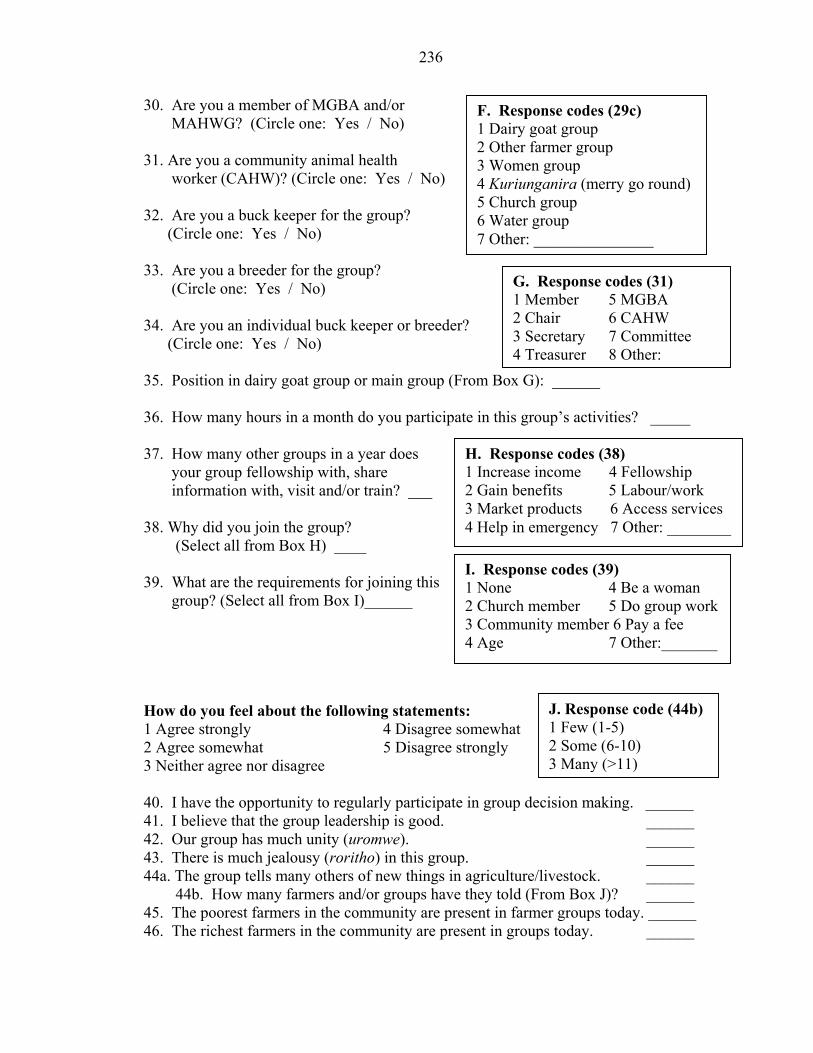
236
30. Are you a member of MGBA and/or MAHWG? (Circle one: Yes / No) 31. Are you a community animal health worker (CAHW)? (Circle one: Yes / No) 32. Are you a buck keeper for the group? (Circle one: Yes / No) 33. Are you a breeder for the group? (Circle one: Yes / No) 34. Are you an individual buck keeper or breeder? (Circle one: Yes / No) 35. Position in dairy goat group or main group (From Box G): ______ 36. How many hours in a month do you participate in this group’s activities? _____ 37. How many other groups in a year does your group fellowship with, share information with, visit and/or train? ___ 38. Why did you join the group? (Select all from Box H) ____ 39. What are the requirements for joining this group? (Select all from Box I)______ How do you feel about the following statement1 Agree strongly 4 Disagree s2 Agree somewhat 5 Disagree s3 Neither agree nor disagree 40. I have the opportunity to regularly participate41. I believe that the group leadership is good. 42. Our group has much unity (uromwe). 43. There is much jealousy (roritho) in this grou44a. The group tells many others of new things in 44b. How many farmers and/or groups have45. The poorest farmers in the community are pr46. The richest farmers in the community are pre
H. Response codes (38) 1 Increase income 4 Fellowship 2 Gain benefits 5 Labour/work 3 Market products 6 Access services 4 Help in emergency 7 Other: ________
F. Response codes (29c) 1 Dairy goat group 2 Other farmer group 3 Women group 4 Kuriunganira (merry go round)5 Church group 6 Water group 7 Other: _______________
I. Response codes (39) 1 None 4 Be a woman 2 Church member 5 Do group work 3 Community member 6 Pay a fee 4 Age 7 Other:_______
s: omewhtrongly
in gro
p. agricu they toesent insent in
G. Response codes (31) 1 Member 5 MGBA 2 Chair 6 CAHW 3 Secretary 7 Committee 4 Treasurer 8 Other:
at
up dec
lture/lld (Fr farmgroup
J. Response code (44b)1 Few (1-5) 2 Some (6-10) 3 Many (>11)
ision making. ______ ______ ______ ______
ivestock. ______ om Box J)? ______ er groups today. ______ s today. ______
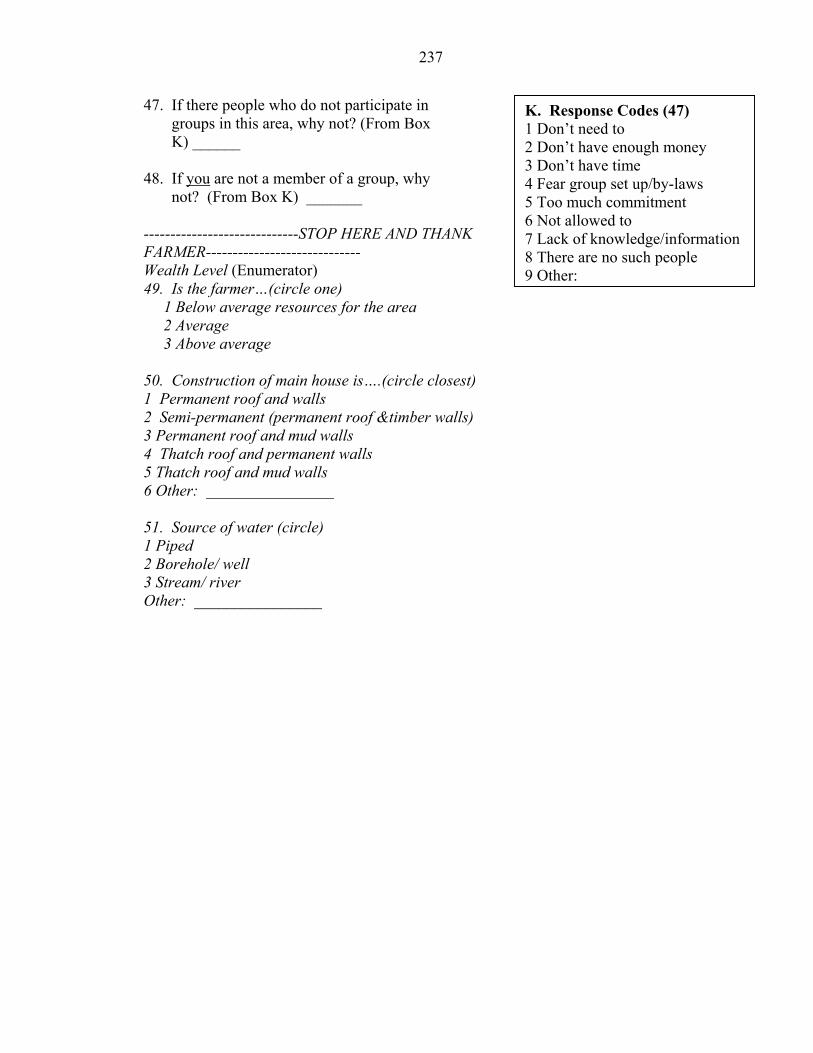
237
47. If there people who do not participate in groups in this area, why not? (From Box K) ______ 48. If you are not a member of a group, why not? (From Box K) _______ -----------------------------STOP HERE AND THANK FARMER----------------------------- Wealth Level (Enumerator) 49. Is the farmer…(circle one) 1 Below average resources for the area 2 Average 3 Above average 50. Construction of main house is….(circle closest) 1 Permanent roof and walls 2 Semi-permanent (permanent roof &timber walls) 3 Permanent roof and mud walls 4 Thatch roof and permanent walls 5 Thatch roof and mud walls 6 Other: ________________ 51. Source of water (circle) 1 Piped 2 Borehole/ well 3 Stream/ river Other: ________________
K. Response Codes (47) 1 Don’t need to 2 Don’t have enough money 3 Don’t have time 4 Fear group set up/by-laws 5 Too much commitment 6 Not allowed to 7 Lack of knowledge/information8 There are no such people 9 Other:
APPENDIX F INFORMED CONSENT
Protocol Title: Increasing Fodder Tree Usage Among Small-Scale Farmers
Dissemination by Dairy Goat Farmers in Meru, Kenya My name is Kristin Davis. I am a student in agriculture from the University of
Florida and am working with Steve Franzel of ICRAF, the International Centre for Research in Agroforestry. I would like to talk to you about your farm or organization and the agricultural extension providers in the area where you live or work. The purpose of this research study is to learn more about how groups promote technologies.
Thank you for agreeing to participate in this study. I would like to ask you some
238
questions about your farming practices and the groups that you are a part of. By answering the questions you have agreed to take part in the study. Your participation is completely voluntary. You are free to answer only the questions you choose and to stop the interview at any time. The interview should take about one hour. Please let me know if you have any questions about the interview or study.
With your permission I might record the interview with an audiocassette. If so
only I will have access to it and will destroy the tape after collecting the data and removing your name. All your answers will be confidential. Your answers will not be linked with your name in the study—when I compile the data I will remove all names. There is no penalty for not participating. There is no compensation for participating. There are no known benefits or risks.
The results of this study will be made available to the farmer groups involved and
to ICRAF. If you'd like to learn more about this study, please contact me by email at [email protected] or by post via ICRAF (PO Box 30677, Nairobi; Tel. 524000/ email [email protected]. If you have questions about your rights as a research participant, please contact the UFIRB Office, Box 112250, University of Florida, Gainesville, FL, 32611-2250, USA; tel. 352-392-0433.
Agreement: By answering the questions, I voluntarily agree to participate in the procedure. Participant_________________________________________ Date:___________ Principal Investigator_________________________________ Date:___________
LIST OF REFERENCES
Agresti, A. & Finlay, B. (1997). Statistical methods for the social sciences (3rd ed.). Upper Saddle River, NJ: Prentice Hall.
Agrawal, A. & Goyal, S. (2001). Group size and collective action: Third-party monitoring in common-pool resources. Comparative Political Studies 34(1).
Ahuya, C. O., Okey, A. M., Kitalyi, A., Mutia, P. & Oduo, J. (2003). FARM-Africa dairy goat and animal healthcare project: A successful case of agricultural research and sustainable development partnership. Poster presented at Global Forum on Agricultural Research Conference, Dakar, Senegal.
Alawy, A. S. (1998). Accessibility of women’s groups to agricultural extension services
239
ed.). Orlando, FL: Harcourt Brace & Company.
in Kenya: An exploratory and descriptive study of factors, needs, and problems. Unpublished doctoral dissertation, Ohio State University, Columbus, Ohio.
AMREF. (1997). The second participatory poverty assessment—Kenya. Volume I. African Medical and Research Foundation and the Human Resources Social Services Department of the Office of the Vice-President and Ministry of Planning and National Development. Nairobi, Kenya: AMREF.
Anderson, J. & Crowder, L. V. (2000). The present and future of public sector extension in Africa: Contracting out or contracting in? Public Administration and Development 20, 373-384.
Andreata, S. (2000, October). Focusing on change: Utilising facilitated farmer groups as learning vehicles. Paper presented at Australasia-Pacific Extension Network National Forum, Melbourne, Australia.
Apantaku, S. O., Fakoya, E. O. & Sodiya, C. I. (2002). Stakeholder-groups willingness to counterpart-fund agricultural extension service in Osun State, Nigeria. Journal of Extension Systems (18), 73-88.
Arbab, F. & Prager, M. (1991). An approach to promoting tree growing in Africa: The World Neighbors experience in Northern Ghana. In B. Haverkort, J. Van de Kamp, & A. Waters-Bayer, (Eds.). (1991). Joining farmers’ experiments: Experiences in participatory technology development. (pp. 65-76). London, UK: Intermediate Technology Publications.
Ary, D., Jacobs, L. C., & Razavieh, A. (1996). Introduction to research in education (5th

240
Ashby, L. A. & Sperling, L. (1994, July) . Institutionalising participatory, client-driven research and technology development in agriculture. AgREN Network Paper No. 49. London, UK: The Overseas Development Institute.
Babbie, E. A. (1986). The practice of social research. Belmont, CA: Wadsworth Publishing Co.
Barkland, A. (2001). Introduction. In Nyakuni, A. (2001). ULAMP extension approach. Nairobi, Kenya: Regional Land Management Unit.
Bastidas, E. P. (2001). Assessing potential response to changes in the livelihood systems of diverse, limited-resource farm households in Carchi, Ecuador: Modeling livelihood strategies using participatory methods and linear programming. Unpublished doctoral dissertation, University of Florida, Gainesville, Florida.
Bebbington, A., Merrill-Sands, D. & Farrington, J. (1994, July). Farmer and Community Organisations in Agricultural Research and Extension: Functions, Impacts and Questions. AgREN Network Paper No. 47. London, UK: The Overseas Development Institute.
Bindlish, V. & Evenson, R. (1993). Evaluation of the performance of T&V extension in Kenya . Washington, DC: The World Bank.
Bottorff, J. (2002). Writing qualitative research proposals. Unpublished presentation, School of Nursing, University of British Columbia, Vancouver, Canada. Retrieved February 5, 2003 from http://www.vchri.ca/i/presentations/QualitativeProposals/tsld001.htm
Bowen, K. A. (1996). The sin of omission—punishable by death to internal validity: An argument for integration of qualitative and quantitative research methods to strengthen internal validity. Unpublished manuscript, Cornell University, Ithaca, NY. Retrieved June 21, 2004 from http://www.bowensevaluation.com/papers/SinOfOmission/main.htm
Bunch, R. (1982). Two ears of corn: A guide to people-centered agricultural improvement. Oklahoma City, OK: World Neighbors.
Casely, D. J. & Kumar, K. (1988). The collection, analysis, and use of monitoring and evaluation data. Baltimore, MD: The Johns Hopkins University Press.
Cernea, M. M. (1985). Putting people first: Sociological variables in rural development (2nd ed.). Washington, DC: The World Bank.
Chambers, R. (1997). Whose reality counts? Putting the last first. London, UK: Intermediate Technology Publications.

241
germplasm in Kenya. Unpublished thesis, Université Laval, Québec, Canada.
Chambers, R. & Ghildyal, B. P. (1984, March). Agricultural research for resource-poor farmers: The “farmer first and last” model. Paper for the National Agricultural Research Project Workshop, Hyderabad, India.
Cohen, J. M. (1993). Importance of public sector reform: The case of Kenya. The Journal of Modern African Studies 31(3), 449-476.
Collinson, M. (Ed.). (2000). A history of farming systems research. Oxon, UK: Food and Agricultural Organization of the United Nations and CABI Publishing.
Collion, M-H. & Rondot, P. (2001, December). Investing in rural producer organizations for sustainable agriculture. Work in progress for public discussion. Sustainable Agriculture Systems, Knowledge and Information, Rural Development Family, World Bank. Washington, DC: The World Bank.
Cooper, P. J. M. & Denning, G. L. (1999, September). Scaling up the impact of agroforestry research. Report of the agroforestry dissemination workshop. Nairobi, Kenya: International Centre for Research in Agroforestry.
Crowder, L. V. (1996, June). Partners in sustainable development: Linking agricultural education institutions and farmer organizations. Sustainable Development Department of the Food and Agriculture Organization of the United Nations. Retrieved May 15, 2004 from http://www.fao.org/sd/exdirect/exan0007.htm
Debus, M. (1986). Methodological review: A handbook for excellence in focus group research. Washington, DC: Academy for Educational Development.
De Haan, N., Valdivia, C., Njeru, G. & Sheikh, D. (1996, December). Of goats, groups and gender. Technical Report TR-MU 96-01. University of Missouri-Columbia, Missouri and Kenya Agricultural Research Institute, Nairobi, Kenya.
De Haan, N. (1999). Stocking rural livelihoods: Social capital, goats and development projects in Tanzania. Unpublished dissertation, University of Missouri, Columbia, Missouri.
Dorward, A., Anderson, S., Clark, S., Keane, B., & Moguel, J. (2002). Asset functions and livelihood strategies: A framework for pro-poor analysis, policy and practice. ADU Working Paper 01/01. Ashford, UK: Department for International Development.
Dunn, T., Humphreys, L., Muirhead, W., Plunkett, M., Croker, N. & Nickl, M. (1996). Changing paradigms for farmer-researcher-extensionist relationships: Exploring methods and theories of farmer participation in research. European Journal of Agricultural Education and Extension 3(3), 167-181.
Edouard, J. (1998). Characteristics of demand and supply of agroforestry tree

242
Eponou, T. (1996). Partners in technology generation and transfer: Linkages between research and farmers organizations in three selected African countries. ISNAR Research Report No. 9. The Hague, Netherlands: International Service for National Agricultural Research.
Escobar, G. (2000). My initiation into FSR in Latin America. In Collinson, M. (Ed.). A history of farming systems research. Oxon, UK: Food and Agricultural Organization of the United Nations and CABI Publishing.
Esman, M. J. & Uphoff, N. T. (1984). Local organizations: Intermediaries in rural development. Ithaca, NY: Cornell University Press.
FAOSTAT Data. (2004). Food and Agricultural Organization of the United Nations, Rome, Italy. Retrieved May 14, 2004 from http://faostat.fao.org/faostat/collections?version=ext&hasbulk=0&subset= agriculture
Feder, G., Willet, A. & Zijp, W. (1999). Agricultural extension: Generic challenges and some ingredients for solutions. Policy Research Working Paper 2129. Washington, DC: The World Bank.
Franzel, S. (1984). Comparing the results of an informal survey with those of a formal survey: A case study of farming systems research/extension (FSR/E) in middle Kirinyaga, Kenya. Paper presented at the Farming Systems Research/Extension Symposium, Manhattan, Kansas.
Franzel, S., Cooper, P. & Denning, G. L. (2001). Scaling up the benefits of agroforestry research: Lessons learned and research challenges. Development in Practice 11(4), 524-534.
Franzel, S. & Wambugu, C. (2004, March). Building farmers’ capacities: Scaling up of the adoption of fodder shrubs in Kenya. Poster presented at World Agroforestry Centre’s Eastern and Southern Africa Technical & Planning Workshop, Nairobi, Kenya.
Franzel, S., Wambugu, C. & Tuwei, P. (2003). The adoption and dissemination of fodder shrubs in central Kenya. AgREN Network Paper No. 131. London, UK: The Overseas Development Institute.
Gautam, M. (2000). Agricultural extension: The Kenya experience. An impact evaluation. Washington, DC: The World Bank.
George, D. & Mallery, P. (2001). SPSS for windows step by step: A simple guide and reference. 10.0 update ( 3rd ed.). Needham Heights, MA: Allyn & Bacon.
243
Geran, J. M. (1996). Effect of group formation on rural women’s access to services in Western Province, Zambia. Sustainable Development Department and Food and Agriculture Organization of the United Nations. Retrieved June 25, 2004 from http://www.fao.org/waicent/faoinfo/sustdev/PPdirect/PPre0010.htm
of farming systems research. Oxon, UK: Food and Agricultural Organization of the United Nations and CABI Publishing.
Godfrey, M. (1986). Kenya to 1990: Prospects for growth. EIU, the Economist Intelligence Unit. Special Report No. 1052.
Government of Kenya. (1999, June). A popular version of the first poverty report in Kenya. Central Bureau of Statistics and the Human Resources and Social Services Departments, Nairobi, Kenya.
Grootaert, C. (2001). Does social capital help the poor? A synthesis of findings from the local level institutions studies in Bolivia, Burkina Faso and Indonesia. Local Level Institutions Working Paper Number 10. Washington, DC: Social Development Department, the World Bank.
Gubbels, P. A. (1991). An approach to promoting tree growing in Africa: The World Neighbors experience in Northern Ghana. In B. Haverkort, J. Van de Kamp, & A. Waters-Bayer, (Eds.). (1991). Joining farmers’ experiments: Experiences in participatory technology development. (pp. 49-54). London, UK: Intermediate Technology Publications.
Gugerty, M. K. & Kremer, M. (2002, March). Does development assistance help build social capital? Social Capital Initiative Working Paper No. 20. Washington, DC: The World Bank.
Hambly (2000). The implementation and institutionalisation of agroforestry in western Kenya: A gender and agency analysis. Unpublished thesis, York University, Toronto, Canada.
Hansen, A. & McMillan, D. E. (1986). Food in sub-Saharan Africa. Boulder, CO: Lynne Rienner Publishers.
Harwood, R. (2000). In Collinson, M. (Ed.). A history of farming systems research. Oxon, UK: Food and Agricultural Organization of the United Nations and CABI Publishing.
Haverkort, B. Van de Kamp, J. & Waters-Bayer, A. (Eds.). (1991). Joining farmers’ experiments: Experiences in participatory technology development. London, UK: Intermediate Technology Development Group.
Hildebrand, P. E. (1981). Combining disciplines in rapid appraisal: The sondeo approach. Agricultural Administration 8, 423-432.
Hildebrand, P. E. (2000). A personal history in FSR. In Collinson, M. (Ed.). A history

244
Huxley, P. A. & van Houten, H. (1997). Glossary for agroforestry. Nairobi, Kenya: International Centre for Research in Agroforestry.
Ikiara, G. K., M. A. Jama & J. O. Amadi. (1992). Agriculture and structural adjustment in Kenya. Nairobi, Kenya: University of Nairobi.
Jick, T. D. (1983). Mixing qualitative and quantitative methods: Triangulation in action. In John Van Maanen (Ed.). Qualitative methodology. Newbury Park, CA: Sage Publications.
Jones, G. W., & Garforth, C. (1997). The history, development, and future of agricultural extension. In Swanson, B.E., Bentz, R. P. & Sofranko, A. J. (Eds.) (1997). Improving agricultural extension: A reference manual. (pp. 3-12) Rome: Food and Agriculture Organization of the United Nations.
Kandie, E. K. (1997). Proposals to improve effectiveness of the agricultural extension services in Kenya. Ministry of Agriculture, Livestock and Marketing and Detusch Gesellschaft fur Technische Zusammenarbeit. Nairobi, Kenya: The Agricultural Extension Policy Project.
Krishna, A. (2001). Moving from the stock of social capital to the flow of benefits: The role of agency . World Development 29(6) 925-943.
Marshall, C. & Rossman, G. B. (1999). Designing qualitative research 3rd Edition. Thousand Oaks, CA: Sage Publications.
Maseko, P., Scoones, I. & Wilson, K. An approach to promoting tree growing in Africa: The World Neighbors experience in Northern Ghana. In Haverkort, B., Van de Kamp, J. & Waters-Bayer, A. (Eds.). (1991). Joining farmers’ experiments: Experiences in participatory technology development. (pp. 49-54). London, UK: Intermediate Technology Publications.
McMillan, D. E., Hussein, A. & Sanders, J. H. (2001, November). What institutional model for agricultural extension in the semi-arid horn of Africa? Paper presented at the IGAD/INSORMIL Conference in Nairobi, Kenya.
Meru Central District Development Plan. (2002). Effective management for sustainable economic growth and poverty reduction, 2002-2008. Nairobi, Kenya: Republic of Kenya Ministry of Finance and Planning.
Misiko, M. (2000). The potential of community institutions in dissemination and adoption of agricultural technologies in Emuhaya, Western Kenya. Thesis draft, University of Nairobi, Nairobi, Kenya.
Moris, J. (1991). Extension alternatives in tropical Africa. London, UK: Overseas Development Institute.

245
Morton, J. Coulter, J., Miheso, V. Staal, S., Kenjanjui, M. & Tallontire, A. (2002). Provision of agricultural services through co-operatives and self-help groups in the Kenyan dairy sub-sector. Draft Report to DFID (Research Project R6117). Chatham, UK: Natural Resources Institute.
Muturi, S. N. (Ed.). (2001). Marketing of smallholder produce: A synthesis of case studies in the highlands of central Kenya. Nairobi, Kenya: Regional Land Management Unit (RELMA)/Sida.
Narayan, D. & Pritchett, L. (1999). Cents and sociability: Household income and social capital in rural Tanzania. Economic Development & Cultural Change 47(4), 871.
Noordin, Q., Niang, A., Jama, B. & Nyasimi, M. (2001). Scaling up adoption and impact of agroforestry technologies: Experiences from western Kenya. Development in Practice 11(4), 509-523.
Norman, D. (2000). FSR: A personal evolution. In Collinson, M. (Ed.). A history of farming systems research. Oxon, UK: Food and Agricultural Organization of the United Nations and CABI Publishing.
Norman, D. (2002, November). The farming systems approach: A historical perspective. Paper presented at the 17th Symposium of the International Farming Systems Association, Lake Buena Vista, Florida.
Nyakuni, A. (2001). ULAMP extension approach. Nairobi, Kenya: Regional Land Management Unit.
Nyangito, H. & J. Okello. (1998). Kenya’s agricultural policy and sector performance: 1964 to 1996. Occasional Paper No. OP/04/98. Nairobi, Kenya: IPAR.
Obonyo, E. (2000). The adoption potential of biomass transfer technology in western Kenya. Unpublished master’s thesis, Egerton University, Molo, Kenya.
Omolo, E. O., Sanders, J. H., McMillan D. E. & Georgis, K. (2001). Agricultural technology for the semiarid African horn. Country Study: Kenya. IGAD/INTSORMIL/USAID-RESDO. Lincoln, NE: INTSORMIL.
Parkins, J. R. (1997). Farm forestry networking: Farmer group development in Kenya. Unpublished dissertation, University of Alberta, Edmonton, Alberta, Canada.
Paterson, R. T., Kiruiro, E. & Arimi, H. K. (1999). Calliandra calothyrsus as a supplement for milk production in the Kenya highlands. Tropical Animal Health Production 32(2), 115-126.

246
Payson, K., Ganpat, W., Hartmann, M., Peters, L. & Place, N. (2004, May). Engaging the periphery: Farmer facilitators as an alternative approach for constructive collaboration with small farmers in Trinidad, W.I. Paper presented at the 20th Annual Conference of the Association for International Agricultural and Extension
2004. Volume 1. Nairobi, Kenya: Ministry of Finance and Planning.
Education, Dublin, Ireland.
Pearson, S. Monke, E. Argwings-Kodhek, G. Avillez, F. Mukumbu, M & Pagiola, S. (1995). Agricultural policy in Kenya: Applications of the policy analysis matrix. Ithaca, NY: Cornell University Press.
Phiri, D, Franzel, S., Mafongoya, P., Jere, I., Katanga, R. & Phiri, S. (2004). Who is using the new technology? The association of wealth status and gender with the planting of improved tree fallows in Eastern Province, Zambia. Agricultural Systems 79(4), 131-144.
Picciotto, R. & Anderson, J.R. (1997). Reconsidering agricultural extension. Washington, DC: The World Bank.
Place, F., Kariuki, G., Wangila, J., Kristjanson, P., Makauki, A. & Ndubi, J. (2002, October). Assessing the factors underlying differences in group performance: Methodological issues and empirical findings from the highlands of central Kenya. CAPRi Working Paper No. 25. CGIAR Systemwide Program on Collective Action and Property Rights.
Pretty, J. & Ward, H. (2001). Social capital and the environment. World Development 29(2), 209-227.
Purcell, D. L. and J. R. Anderson. (1997). Agricultural extension and research: Achievements and problems in national systems. Washington, DC: The World Bank.
Put, M. (1998). Innocent farmers? A comparative evaluation into a government and an NGO project located in semi-arid Andhra Pradesh (India), meant to induce farmers to adopt innovations for dryland agriculture. Amsterdam, Netherlands: Thela Publishers.
Raussen, T. Ebong, G. & Musiime, J. (2001). More effective natural resource management through democratically elected, decentralized government structures in Uganda. Development in Practice 11(4), 460-470.
Rees, D., Momanyi, M., Wekundah, J., Ndungu, F., Odondi, J. & Oyure, A. O. (2000). Agricultural knowledge and information systems in Kenya—Implications for technology dissemination and development. AgREN Network Paper No. 107, Agricultural Research and Extension Network, Overseas Development Institute.
Republic of Kenya. (2001). Poverty Reduction Strategy Paper for the Period 2001-

247
Rhoades, R. E. & Booth, R. H. (1982). Farmer-back-to-farmer: A model for generating acceptable agricultural technology. Lima, Perú : International Potato Center.
Rivera, W. M. & Alex, G. (2004, May). The continuing role of government in pluralistic thextension systems. Paper presented at the 20 Annual Conference of the
Association for International Agricultural and Extension Education, Dublin, Ireland.
Robinson, L. J., Siles, M. E. & Schmid, A. A. (2002, September). Social capital and poverty reduction: Toward a mature paradigm. Paper presented at International Invitational Conference “Social Capital and Poverty Reduction in Latin America and the Caribbean: Toward a New Paradigm,” Santiago, Chile.
Rogers, E. M. (1995). Diffusion of innovations (4th ed.). New York, NY: The Free Press.
Roothaert, R. L. & Paterson, R. T. (1997). Recent work on the production and utilization of tree fodder in East Africa. Animal Feed Science and Technology 69, 39-51.
Rouse, J. (1996, June). Empowering Zambian rural women through small farmer groups. Sustainable Development Department of the Food and Agriculture Organization of the United Nations. Retrieved May 15, 2004 from http://www.fao.org/waicent/faoinfo/sustdev/PPdirect/PPan0005.htm
Saito, K. (1994). Raising agricultural productivity of women farmers in sub-Saharan Africa. Washington, DC: The World Bank.
Sanders, J., Shapiro, B. I. & Ramaswamy, S. (1996). The economics of agricultural technology in semiarid sub-Saharan Africa. Baltimore, MD: The Johns Hopkins University Press.
Scarborough, V. Killough, S., Johnson, D. A. & Farrington, J. (Eds.) (1997). Farmer-led extension: Concepts and practices. London, UK: Intermediate Technology Development Group.
Schwartz, L. A. & Kampen, J. (1992). Agricultural extension in East Africa. Washington, DC: The World Bank.
Scoones, I. (1996). Hazards and opportunities: Farming livelihoods in dryland Africa: lessons from Zimbabwe. London, UK: Zed Books Ltd.
Scoones, I. & Cousins, B. (1996). A participatory model of agricultural research and extension: The case of vleis, trees, and grazing schemes in the dry south of Zimbabwe. Harare, Zimbabwe: Centre for Applied Social Sciences, University of Zimbabwe.

248
Shapouri, S. & Rosen, S. (2001, June). Toll on agriculture from HIV/AIDS in sub-Saharan Africa. Issues in Food Security Agriculture Information Bulletin No. 765-9. Washington, DC: The United States Agency for International Development Economic Research Service.
Were, G. S. & Wandibba, S. (Eds.). (1988). . Nairobi, Kenya: Government of Kenya.
Sigman, V. A., Chibwana C. & Matenje, I. (1994). Reaching Malawian smallholders with agricultural extension programs: A case for increased use of women-farmer groups. Journal of Agricultural and Extension Education 1(2).
Stringfellow, R., Coulter, J., Lucey, T., McKone, C. & Hussain, A. (1997). Improving the access of smallholders to agricultural services in sub-Saharan Africa: Farmer cooperation and the role of the donor community. Natural Resource Perspectives 20. Overseas Development Institute.
Swanson, B.E., Bentz, R. P. & Sofranko, A. J. (Eds.) (1997). Improving agricultural extension: A reference manual. Rome, Italy: Food and Agriculture Organization of the United Nations.
Teel, W. (1985). A pocket directory of trees and seeds in Kenya. Nairobi, Kenya: KENGO.
Umali, D. L. & Schwartz, L. (1994). Public and private agricultural extension: Beyond traditional frontiers. Washington, DC: The World Bank.
Uphoff, N & Wijayaratna, C. M. (2000). Demonstrated benefits from social capital: The productivity of farmer organizations in Gal Oya, Sri Lanka. World Development Vol. 28 No. 11, 1875-1890.
Van den Ban, A. W. (2000). Different ways of financing agricultural extension. AgREN Network Paper No. 106b. London, UK: The Overseas Development Institute.
Varughese, G. & Ostrom, E. (2001). The contested role of heterogeneity in collective action: Some evidence from community forestry in Nepal. World Development 29(5), 747-765.
Venkatesan, V. & Kampen, J. (1998). Evolution of agricultural services in sub-Saharan Africa: Trends and prospects. Washington, DC: The World Bank.
Wambugu, C., Franzel, S., Tuwei, P. & Karanja, G. (2001). Scaling up the use of fodder shrubs in central Kenya. Development in Practice 11(4), 487-494.
Wellard, K. & J. G. Copestake. (Eds.). (1993). Non-governmental organizations and the state in Africa: Rethinking roles in sustainable agricultural development. New York, NY: Routledge.
Meru District socio-cultural profile

249
Wibberley, E. J. (1997). The role of farmer groups and farmers’ knowledge in optimising cereal growing systems. Aspects of Applied Biology 50, 471-480.
Winrock International. (1992). Assessment of animal agriculture in sub-Saharan Africa. Little Rock, AR: Winrock International Institute for Agricultural Development.
World Bank, 2003. Social capital for development. Unpublished manuscript. Washington, DC. Retrieved May 14, 2004 from http://www.worldbank.org/poverty/scapital/
World Bank, 2004. Kenya data profile. Unpublished manuscript. Washington, DC. Retrieved May 14, 2004 from http://devdata.worldbank.org/external/CPProfile.asp?SelectedCountry=KEN&CCODE=KEN&CNAME=Kenya&PTYPE=CP
Zijp, W. (2002). Promoting pluralism: The need for transition. Unpublished presentation, the World Bank, Washington, DC. Retrieved May 18, 2004 from http://wbln0018.worldbank.org/ESSD/susint.nsf/a816cbacda716c9d85256ab40002d5cd/2fc4edaabc319ca9852569d800780b8d?OpenDocument

BIOGRAPHICAL SKETCH
Kristin Elizabeth Davis was born December 6, 1969 in Syracuse, New York. With
her missionary parents, she moved to Kenya when she was two years old. She grew up in
the Pokot tribal area of Baringo District, and attended Rift Valley Academy in Kenya.
Upon graduation from high school, she returned to the United States for college, where
she received a B.S. in biology at Messiah College near Harrisburg, Pennsylvania.
Following her undergraduate degree, she interned at Educational Concerns for Hunger
Organization (ECHO) where she learned about tropical agriculture and the particular
problems facing small-scale farmers. This was followed by a stint in Kenya, working in
agricultural development for three and a half years. During this time, she saw the need
for further studies in order to be more effective in this field, and returned to Florida to
pursue a degree in farming systems and international agricultural extension.
250