technology education journalpreferred learning styles 45 jeremy ernst and aaron clark ... the...
TRANSCRIPT

North Carolina Council on Technology Teacher Education
TECHNOLOGY EDUCATION JOURNAL
Volume IX 2007

NCCTTE Journal Volume IX
2
NCCTTE Technology Education Journal
Volume IX, 2007
Table of Contents
Acknowledgments iii Refereed Articles Engineering Student Outcomes for Grades 9-12 4 Vincent Childress and Craig Rhodes Analysis of Problem Solving Techniques Used by Students When Learning About New technologies 28 Terri Varnado and William DeLuca Effects of Instructional Presentation On Dominant Preferred Learning Styles 45 Jeremy Ernst and Aaron Clark
Going Wiki in Online Technology Education Courses: Promoting Online Learning and Service Learning through Wikis 58 Pam Carpenter and Edward Roberts
Non-Refereed Articles Use of Take-home Exams in an Introductory College-level Physics Course 65 Robert Ehrlich and James Haynie
NCCTTE Journal Volume IX
3
Acknowledgments
The Technology Education Journal, Volume IX, is a refereed journal published by the North Carolina Council on Technology Teacher Education. The ninth volume of the publication is the result of the contributions of numerous technology education professionals. Articles included in the journal represent the most current research and insights of the technology teacher education faculty in North Carolina. Uniquely, this is the first volume of the NCCTTE Journal to include an article by an author from a discipline other than Technology Education. The non-refereed article by Ehrlich, a physics professor, loosely applies some experimental methodology developed by Haynie in a non TE setting. This volume includes scholarly works completed in 2006-7. The following authors are recognized for their contributions to this volume: Dr. Pam Carpenter, Dr. Aaron C. Clark, Dr. William DeLuca, Dr Jeremy V. Ernst, Dr. W. J. Haynie, Mr. Edward Roberts, and Dr. Terri E. Varnado -- North Carolina State University, Raleigh, North Carolina; Dr. Vincent Childress, and Dr. Craig Rhodes – North Carolina A&T State University; and Dr. Roberrt Ehrlich – George Mason University. Special thanks are extended to the teacher educators and professors who donated their time and expertise in reviewing articles for this volume. Additionally, the Council acknowledges the sustained effort of the reviewers: Dr. Vince Childeress, NC A&T State University Dr. Craig Rhodes, NC A&T State University Dr. W. J. Haynie, NC State University Dr. Aaron Clark, NC State University Dr. Pam Carpenter, NC State University Dr. Marie Hoepfl, Appalachian State University W. J. Haynie, III, Ph.D. Executive Editor

NCCTTE Journal Volume IX
4
Refereed Articles
Engineering Student Outcomes for Grades 9 -12
Vincent Childress and Craig Rhodes
North Carolina A&T State University Greensboro, North Carolina
The National Center for Engineering and Technology Education
Utah State University Logan, Utah
Introduction
In the fall of 2004, the National Center for Engineering and Technology Education (NCETE), secured
funding from the National Science Foundation (NSF) in order to fulfill the following long-term goals:
Prepare graduate students who will become educational leaders engaged in teacher preparation…with the
knowledge and skill to integrate engineering into technology education.
Conduct research on how students learn technological concepts, …and how to better prepare technology and
engineering teachers.
Conduct research on professional development for grade 9-12 teachers…that enhances science, technology,
engineering, and mathematics (STEM).
Increase the number and diversity in the pathway of students selecting STEM careers.
Purpose and Research Questions
As a basic step in reaching the goals above, the researchers in cooperation with the NCETE designed a study
to answer the following specific research question:
For grades 9- 12, what should be included in a technology education curriculum that infuses engineering
design, where the goal of the curriculum is technological literacy?

NCCTTE Journal Volume IX
5
However, as a prerequisite to that question, the Center needed to determine what engineers believe students should
learn in high school. To frame that prerequisite part of the study, the researchers posed the following preliminary
research question, which is the focus of this article:
What are the engineering student outcomes that prospective engineering students in grades 9- 12 should know
and be able to do prior to entry into a post-secondary engineering program?
For the purpose of answering this prerequisite question, statements of outcomes of student achievement were sought
through a modified Delphi study.
Selected Related Literature
Bordogna (1997) has characterized an emerging view on engineering, which is contrary to the traditional
view when he wrote:
To be personally successful in today's world and simultaneously promote prosperity, engineers need more
than first-rate technical and scientific skills. In an increasingly competitive world, engineers need to make the
right decisions about how enormous amounts of time, money, and people are tasked to a common end. I like
to think of the engineer as someone who not only knows how to do things right but also knows the right thing
to do. This requires engineers to have a broad, holistic background. Since engineering itself is an integrative
process, engineering education must focus on this end (n.p.).
It seems the profession of engineering is trying to develop a more broad perspective on the nature of engineering and
the role of broad goals in engineering education. In describing the setting in which engineers will work in the year
2020, the National Academy of Engineering (2004) simultaneously describes the technological society in which all
citizens will live.
• [Those] involved with or affected by technology (e.g., designers, manufacturers, distributors, users) will be increasingly diverse and multidisciplinary.
• Social, cultural, political, and economic forces will continue to shape and affect the success of technological innovation.
• The presence of technology in our everyday lives will be seamless, transparent, and more significant than ever. (p. 53)
In the sense that technological literacy is needed by all citizens, the rationale for technological literacy is not
only an economic one. In Technically Speaking…, Pearson and Young (National Academy of Engineering, 2002)

NCCTTE Journal Volume IX
6
make a strong case for “technical literacy” better insuring the economic well being of the United States. However,
while the rationale for technological literacy is certainly economic, in part, it is developed to benefit all citizens.
Infusing Engineering Design Processes into the Technology Education Curriculum
In order to improve the level of acceptance that technology education can gain in the public schools and in
order to better represent the essence of engineering as it relates to technology for the improved achievement of
students, Wicklein (2006) proposes infusing engineering design into the technology education curriculum more
deliberately. He outlines broad categories for the infusion of engineering design into technology education. In terms
of those broad areas of engineering that should be infused into the curriculum he includes, “…narrative descriptions,
graphical explanations, analytical calculations, physical creation” (p. 7). He also describes courses that might
represent a technology education curriculum that infuses engineering design. The courses include, “Introduction to
Technology, Engineering Graphics, Research and Design, Engineering Applications” (p. 6). He includes as essential
in the curriculum optimization, analysis, and prediction. Wicklein also implies that students should take all of the
science and mathematics courses that are available in high school.
Selected Existing Efforts to Identify and Integrate K-12 Engineering Concepts
Lewis (2004) has also done a comprehensive job of summarizing efforts within technology education to
integrate the curriculum with science, engineering, and mathematics. However, there are also efforts outside of the
field of technology education. Programs such as those in the Centers for Learning and Teaching (2005), supported
by the National Science Foundation (NSF), are attempting, in some form, to integrate STEM education at the public
school level. NSF funding has also included money for informal STEM education targeted at the K-12 and family
levels. The Boston Museum of Science (2005) is one example of such outreach efforts.
McREL
Mid-Continent Research for Education and Learning (McREL) (2004) is an example of a U.S. Department of
Education effort to provide standards for the integration of STEM and other school subjects. McREL is charged with
creating reform in education through systemic initiatives, and its fourth edition of a compilation of school-wide
content standards provides, perhaps, one of the most comprehensive sets of standards available to teachers. McREL
and the Benchmarks for Science Literacy are the two best, easily accessible resources to find core engineering
NCCTTE Journal Volume IX
7
concepts that should be taught at the high school level in terms of breadth of coverage. The engineering section for
McREL is substantial.
Science Standards and Engineering
Among the science standards projects, the most explicit statements of what students should know and be
able to do related to interfaces among STEM subjects, and those especially related to engineering and technology
are identified in the Benchmarks for Science Literacy (1993). The Benchmarks... provides the most well phrased
items available regarding core engineering concepts for high school students and is worth a closer examination. In
the context of the more broadly learned engineer described by Bordogna (1997) and the integration of STEM
content described by Salinger (2003), the Benchmarks (AAAS, 1993) describes the interaction of technology and
science such that students should leave school with the understanding that technological innovation is often
enhanced by science knowledge and processes of inquiry. The Benchmarks describes the interaction and
interdependence of technology and society including detailed statements about the economy, government
regulations, and human needs. The Designed World is a set of standards related to a variety of specific technologies
such as agriculture, medicine, communication, and manufacturing. Benchmarks for Science Literacy even has a
section on mathematics, statistical analysis, uncertainty, and mathematical symbolism. The group of standards most
closely related to engineering and engineering design is included in a section called "Design and Systems." Design
and Systems standards provide some of the core engineering concepts that would need to be included in a high
school level engineering design course.
Standards for Technological Literacy
In 1996, the International Technology Education Association (ITEA), with funding from the NSF and the
National Aeronautics and Space Administration began the Technology for All Americans Project, which culminated
in 20 standards, and their benchmarks, for technology education and other programs that contribute toward
developing technological literacy in public school students. In 2000, ITEA published the Standards for
Technological Literacy: Content for the Study of Technology. In addition to helping teachers develop curricula
related to technology as it is broadly defined, these standards and their benchmarks call for students to understand a

NCCTTE Journal Volume IX
8
number of concepts related to engineering, including optimization, trade-offs, engineering design, and design skills
and knowledge.
The Dearing and Daugherty Modified Delphi Study
Dearing and Daugherty (2004) describe a modified Delphi study that they conducted with technology
teachers, technology teacher educators, and engineering educators participating. The purpose of the study was to
identify those concepts that are necessary to teach high school students in order to prepare them for postsecondary
engineering education, while preserving the mission of teaching technological literacy. Dearing and Daugherty
developed a predetermined list of concepts based on information from Project Lead The Way, Principles of
Technology, the Standards for Technological Literacy, American Society of Engineering Education, and others.
Participants were to decide if a concept should be included in a curriculum or not included in a curriculum. Fifty-
two concepts on their list met the criterion for consensus and were retained. Items were then ranked in order of
importance.
There has been a progression of events leading up to the study described herein. The desire to improve
student achievement is chief in the motivation to infuse engineering design processes into the technology education
curriculum. Improving the perception of technology education is an important part of the motivation to integrate
technology and engineering at the 9-12 level. The study described herein, seeks to build on the foundation that has
already been laid by the aforementioned national standards projects and identify outcomes for student achievement
in high school engineering education and later in technology education programs by infusing engineering design into
the technology education curriculum.
Methodology
Modified Delphi Study
This main thrust of the outcomes study used a modified Delphi approach that started with preexisting
outcome items selected from national standards projects, the phase one focus groups, and additional resources. The
modified Delphi study extended for three rounds with 34 participants as of Round 2 and 32 participants as of Round
3 (Dalkey, 1972; Custer, Scarcella, & Stewart, 1999).
Identification of Pre Selected Outcomes
NCCTTE Journal Volume IX
9
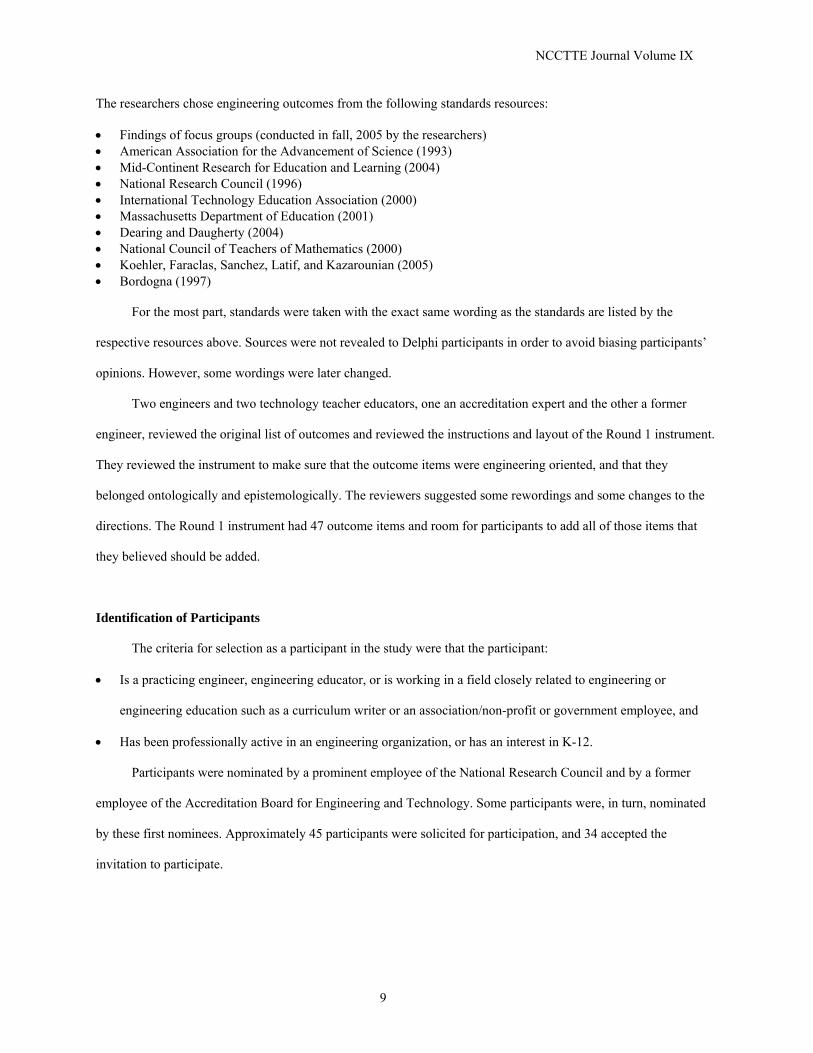
The researchers chose engineering outcomes from the following standards resources:
• Findings of focus groups (conducted in fall, 2005 by the researchers) • American Association for the Advancement of Science (1993) • Mid-Continent Research for Education and Learning (2004) • National Research Council (1996) • International Technology Education Association (2000) • Massachusetts Department of Education (2001) • Dearing and Daugherty (2004) • National Council of Teachers of Mathematics (2000) • Koehler, Faraclas, Sanchez, Latif, and Kazarounian (2005) • Bordogna (1997)
For the most part, standards were taken with the exact same wording as the standards are listed by the
respective resources above. Sources were not revealed to Delphi participants in order to avoid biasing participants’
opinions. However, some wordings were later changed.
Two engineers and two technology teacher educators, one an accreditation expert and the other a former
engineer, reviewed the original list of outcomes and reviewed the instructions and layout of the Round 1 instrument.
They reviewed the instrument to make sure that the outcome items were engineering oriented, and that they
belonged ontologically and epistemologically. The reviewers suggested some rewordings and some changes to the
directions. The Round 1 instrument had 47 outcome items and room for participants to add all of those items that
they believed should be added.
Identification of Participants
The criteria for selection as a participant in the study were that the participant:
• Is a practicing engineer, engineering educator, or is working in a field closely related to engineering or
engineering education such as a curriculum writer or an association/non-profit or government employee, and
• Has been professionally active in an engineering organization, or has an interest in K-12.
Participants were nominated by a prominent employee of the National Research Council and by a former
employee of the Accreditation Board for Engineering and Technology. Some participants were, in turn, nominated
by these first nominees. Approximately 45 participants were solicited for participation, and 34 accepted the
invitation to participate.
NCCTTE Journal Volume IX
10
Findings
Focus Groups
It is important to note that focus groups were conducted prior to the modified Delphi study. The focus groups turned
out to be effective at identifying issues related to infusing engineering content into the technology education
curriculum. They were fairly successful at yielding content. Only an abridged list of focus group outcomes findings
is presented in Table 1.
Table 1. Abridged summary of focus group findings as they related to engineering outcomes.
• It is important to determine how we define engineering • Re engineer and re design things that exist to develop problem solving skills and conceptual skill • Engineering disciplines mechanical, civil, electrical, computer engineering, biomedical • Thermodynamics, Statics, Design concepts • What separates engineering design from general design is the actual process of applying standards
and functionality to what you are doing • How math and science play a part in the field, Equations are used for simulations and used to design
Modified Delphi Study
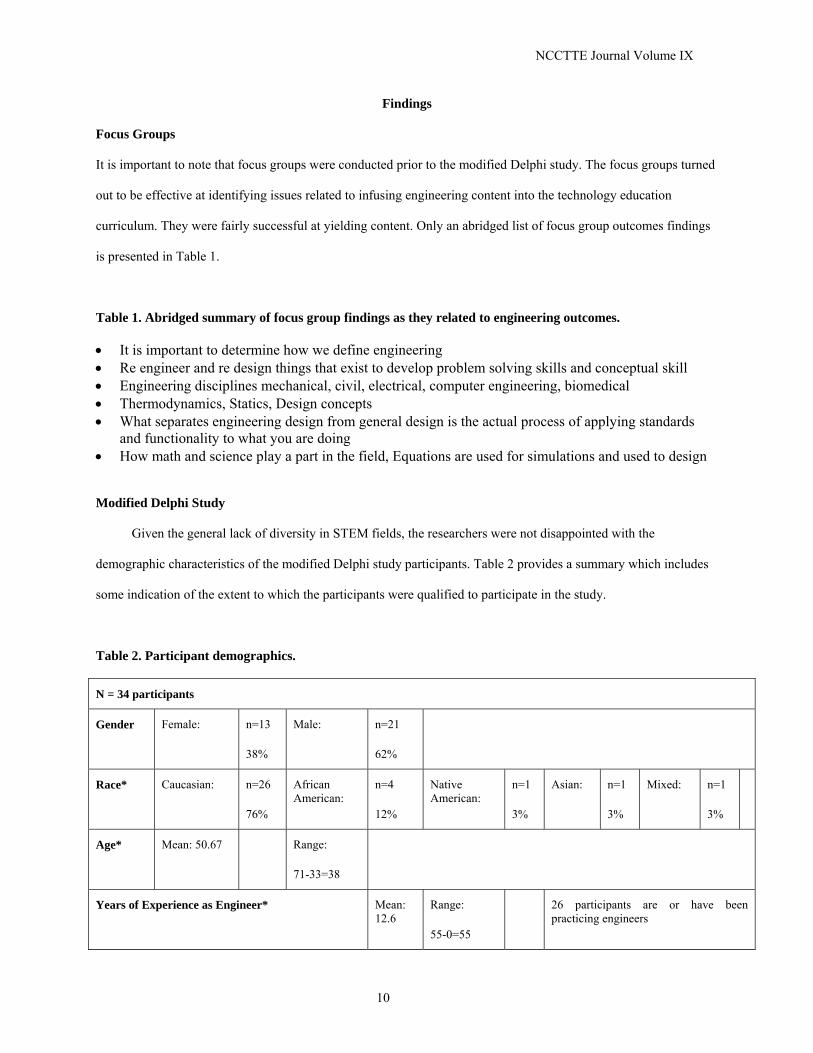
Given the general lack of diversity in STEM fields, the researchers were not disappointed with the
demographic characteristics of the modified Delphi study participants. Table 2 provides a summary which includes
some indication of the extent to which the participants were qualified to participate in the study.
Table 2. Participant demographics.
N = 34 participants
Gender Female: n=13
38%
Male: n=21
62%
Race* Caucasian: n=26
76%
African American:
n=4
12%
Native American:
n=1
3%
Asian: n=1
3%
Mixed: n=1
3%
Age* Mean: 50.67 Range:
71-33=38
Years of Experience as Engineer* Mean: 12.6
Range:
55-0=55
26 participants are or have been practicing engineers
NCCTTE Journal Volume IX
11
Years of Experience as Engineering Educator* Mean: 14.18
Range:
40-0=40
28 are or have been engineering educators
Years of Experience in Engineering Related Position*
Mean: 2.67
Range:
26-0=26
5 are in jobs related to engineering with a mean: 17.2
*One participant did not respond to the demographic part of the instrument.
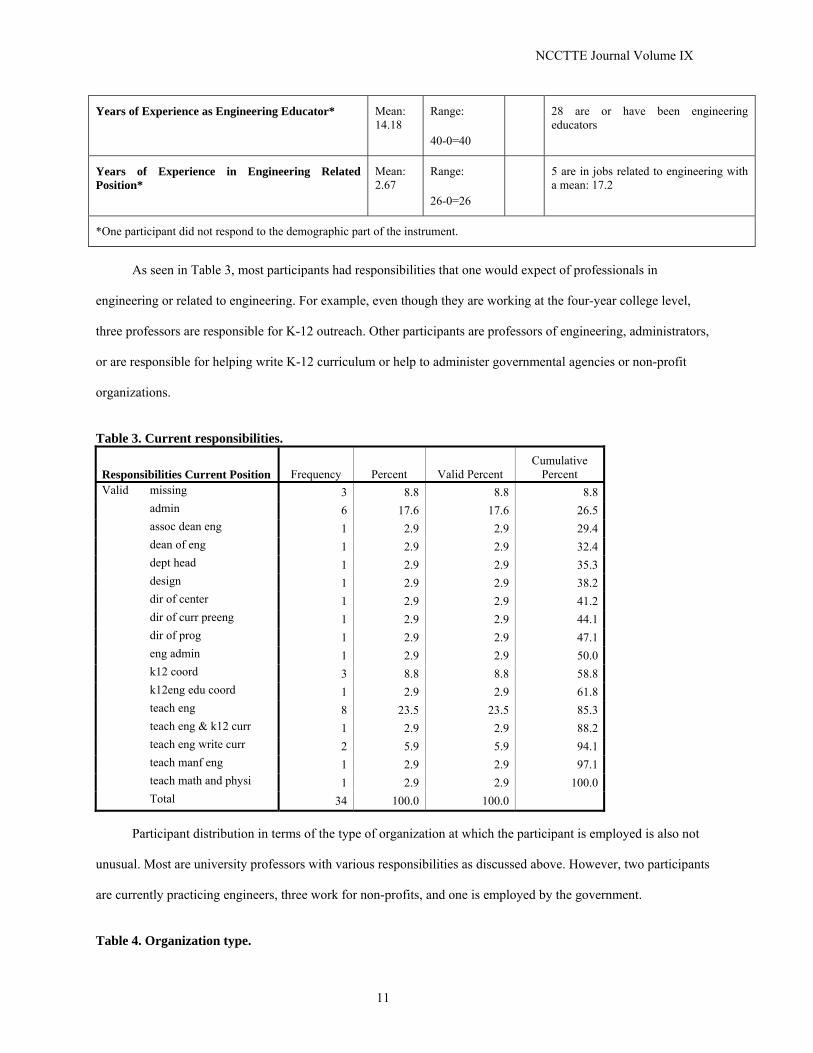
As seen in Table 3, most participants had responsibilities that one would expect of professionals in
engineering or related to engineering. For example, even though they are working at the four-year college level,
three professors are responsible for K-12 outreach. Other participants are professors of engineering, administrators,
or are responsible for helping write K-12 curriculum or help to administer governmental agencies or non-profit
organizations.
Table 3. Current responsibilities.
Responsibilities Current Position Frequency Percent Valid Percent Cumulative
Percent Valid missing 3 8.8 8.8 8.8
admin 6 17.6 17.6 26.5 assoc dean eng 1 2.9 2.9 29.4 dean of eng 1 2.9 2.9 32.4 dept head 1 2.9 2.9 35.3 design 1 2.9 2.9 38.2 dir of center 1 2.9 2.9 41.2 dir of curr preeng 1 2.9 2.9 44.1 dir of prog 1 2.9 2.9 47.1 eng admin 1 2.9 2.9 50.0 k12 coord 3 8.8 8.8 58.8 k12eng edu coord 1 2.9 2.9 61.8 teach eng 8 23.5 23.5 85.3 teach eng & k12 curr 1 2.9 2.9 88.2 teach eng write curr 2 5.9 5.9 94.1 teach manf eng 1 2.9 2.9 97.1 teach math and physi 1 2.9 2.9 100.0 Total 34 100.0 100.0
Participant distribution in terms of the type of organization at which the participant is employed is also not
unusual. Most are university professors with various responsibilities as discussed above. However, two participants
are currently practicing engineers, three work for non-profits, and one is employed by the government.
Table 4. Organization type.

NCCTTE Journal Volume IX
12
Organization Frequency Percent Valid Percent Cumulative
Percent Valid university 21 61.8 65.6 65.6
community college 5 14.7 15.6 81.3 government agency 1 2.9 3.1 84.4 engineering firm 2 5.9 6.3 90.6 non-profit 3 8.8 9.4 100.0 Total 32 94.1 100.0
Missing System 2 5.9 Total 34 100.0
Participants were asked to identify the engineering discipline in which they were educated. Five participants
are not engineers, and one participant did not respond, see Table 5.
Table 5. Engineering discipline.
Engineering Discipline Frequency Percent Valid non-engineer 5 14.7 biomedical 1 2.9 chemical 1 2.9 civil 2 5.9 electrical 10 29.4 electrical and mecha 1 2.9 electronic and mecha 1 2.9 industrial 1 2.9 manufacturing 1 2.9 materials 1 2.9 mechanical 8 23.5 metalurgical 1 2.9
missing 1 2.9 Total 34 100.0
Round 1, Engineering Outcome Ratings
In Round 1, for engineering outcomes for grades 9-12 for students who want to pursue engineering after
graduation, participants were asked to rate items, reword items if needed, add new items and rate any new items that
they added, and provide comments. An explanation of the rating scale is provided in Table 6. Many of the outcome
items were very long. Therefore, they are abbreviated below in Table 7.
Table 6. Explanation of ratings. The instrument asked participants to rate outcome items on a five point Likert scale (Clark & Wenig, 1999). The ratings are described below.
1. Least Important: Not necessary for an engineering-related high school curriculum. 2. Less Important: Less than necessary for an engineering-related high school curriculum. 3. Important: Necessary for inclusion in an engineering-related high school curriculum. 4. More Important: Essential for inclusion in an engineering-related high school curriculum.

NCCTTE Journal Volume IX
13
5. Most Important: Most essential for inclusion in an engineering-related high school curriculum.
The interquartile range (IQR) was used as the statistic for variability of rating responses (Rojewski & Meers,
1991, Wells, 1994), and an IQR of 1 was determined by the researchers to indicate consensus on an item (Wicklein,
1993). Because in the beginning, the researchers were attempting to group items by their ratings, the median was
used to represent the rating that most closely characterizes the importance of the item and due to low a participant
pool. Twenty items achieved consensus after Round 1. Each of these items’ median ratings was either 3 or 4.
Round 2
In Round 2, for engineering outcomes for grades 9-12 for students who want to pursue engineering after
graduation, participants were provided with their own ratings per item respectively from Round 1, were provided the
ratings that fell within the IQR per item, were asked to rate items with the majority (within the IQR) or to justify
why they did not join the majority, and provide comments. Only 32 of 34 Round-2 instruments were returned. The
rewordings and added items that were submitted from Round 1 were juried by the researchers and an engineer. An
IQR of 1 or less represents consensus on an item’s rating. On the Round 2 and Round 3 instruments the range of
majority responses was always rounded out to the outer whole number rating.
Thirty-one of 47 originally listed items achieved consensus after Round 2 as shown in Table 7. Three of
seven new items (added by participants) achieved consensus after Round 2 for a total of 34 items in consensus. Each
of these items’ median ratings was either 3 or 4. Therefore, no items could be dropped because of low median
ratings. Thus the list grew instead of getting smaller. Items which remained at an IQR of 2 or more after Round 2
were, therefore, dropped from Round 3, because the researchers had received several complaints from participants
about the length of the instrument, and the researchers wanted to maintain a good response rate.
There were numerous comments posted in the Round 1 and Round 2 instruments which reveal how some of
the participating engineers think about these outcomes at the high school level. These comments were listed on each
of the Round 2 and Round 3 instruments.
Round 3
In Round 3, for engineering outcomes for grades 9-12 for students who want to pursue engineering after
graduation, participants were provided with their own ratings per item respectively from Round 2, were provided the
ratings that fell within the IQR per item and the median rating, were asked to rate items with the majority (within the
IQR) or to justify why they did not join the majority, and provide comments. In order to keep the response rate high,

NCCTTE Journal Volume IX
14
it was decided to not ask participants to rank or order items. Going into Round 3, approximately 20 items were rated
at 3 and a similar number were rated at 4. There were no other ratings. Participants were not, therefore, asked to rank
or order outcome items within a rating because it would be considered a hardship to ask them to rank 20 items in
only two categories while still asking them to complete other tasks.
Forty-three of the 54 total items achieved consensus after Round 3. Thus, Round 3 provided participants
with the opportunity to agree on nine additional items. Once again, ratings only consisted of 3 and 4. Twenty-one
items were rated at 3 or Important to include in the curriculum and 21 items were rated at 4 or More Important to
include in the curriculum. One item was rated at a 4.5 median, which may conceptually mean Most Important
(mode=5). Table 7 below shows a comparison of the first three rounds of the modified Delphi study.
Table 7: A Comparison of the Analyses of the First Three Rounds Rounds 1, 2, & 3 Analyses Compared Round 3 Round 2 Round 1
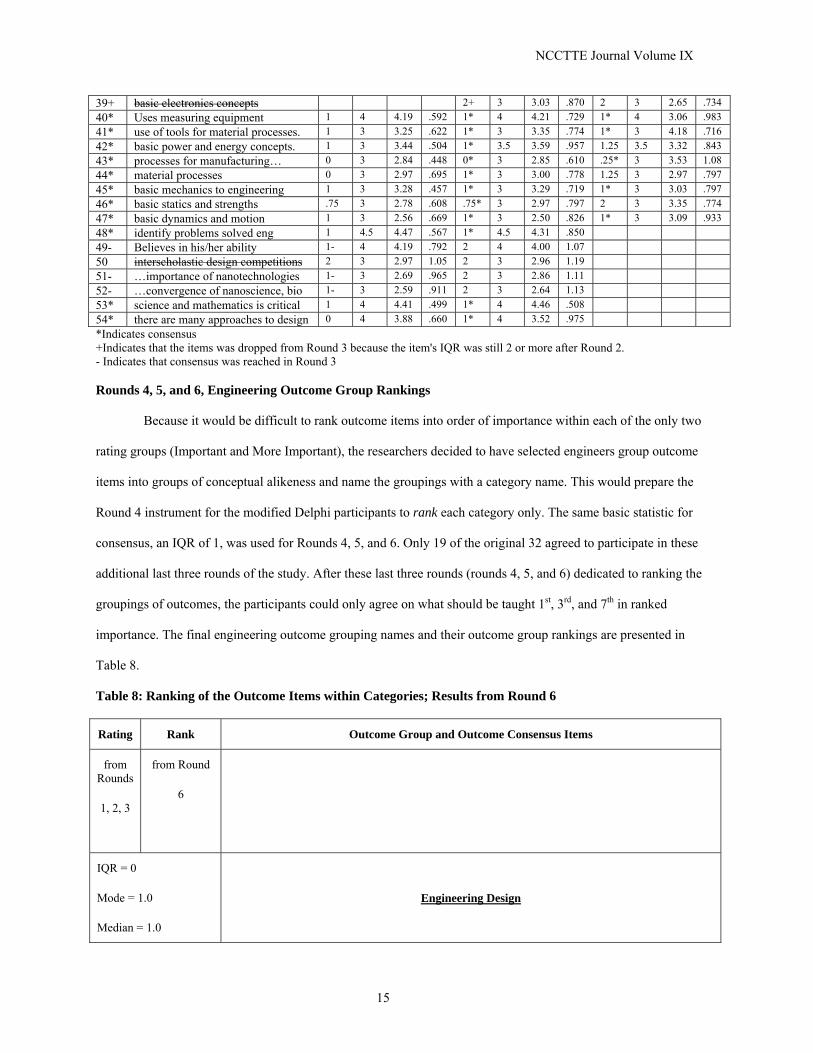
Item Outcome IQR Mdn Mn SD IQR Mdn Mn SD IQR Mdn Mn SD 1+ Is able to define engineering. 2+ 4 4.03 1.17 2 4 Mn SD 2- engineering future career 1- 4 4.09 .963 1.75 4.5 4.21 .946 1.25 4.5 4.03 1.19 3+ disciplines of engineering 2.75 3 3.38 1.26 2.25 3 4.18 .999 4* use, manage, assess technology. 1 4 3.75 .568 1* 4 3.88 .808 1.5 4 3.44 1.24 5* Practices engineering ethics. 1 3 3.44 .914 1* 3.5 3.5 1.11 1.25 4 3.91 .805 6+ Works effectively in teams 2+ 4 3.85 .989 2 4 3.56 1.16 7+ engineering design includes… 2+ 4 4.12 .880 1.25 4 3.82 1.03 8* Uses models to study processes 1 4 3.50 .718 1* 4 3.53 .825 1* 4 4.18 .869 9- design is iterative...optimization 1- 4 4.22 .751 1.75 4.5 4.24 .890 1.25 5 3.59 .988 10* Organizes design process… 1 4 3.56 .564 1* 4 3.56 .705 1* 4 4.26 .898 11* …economics…influence a solution. 1 4 3.75 .762 1* 4 3.74 .864 2 4 3.62 .853 12* …engineering principles…applied 1 4 3.53 .950 1* 4 3.62 1.07 1.25 4 3.79 .880 13* … other factors… considered 1 4 3.69 .644 1* 4 3.65 .691 1* 3.5 3.65 1.10 14* Uses optimization techniques 1 3 2.53 .621 1* 3 2.50 .749 1* 3 3.68 .843 15* Applies mathematics and science 1 4 4.28 .581 1* 4 4.26 .790 1* 4 2.59 .857 16* Uses a physical or math model 1 3 2.53 .718 1* 3 2.71 .938 2 3 4.26 .898 17* …reverse engineering…can analyze 1 3 3.34 .787 1* 3 3.35 .774 1* 3.5 2.94 1.21 18+ design includes… improvement… 1.75 4 4.00 .739 2 4 3.35 .917 19* …creativity is…important 1 4 4.41 .615 1* 4.5 4.26 .790 1* 4.5 3.94 .814 20- Applies research and development 1- 3 3.28 .729 1.75 3 3.21 1.01 1.25 3 4.26 .864 22* Designs, produces, tests prototypes 1 4 3.69 .693 1* 4 3.5 .992 1.25 4 3.26 1.14 23 … no perfect design. 0- 4 3.97 .647 1.5 4 4.03 .758 2 4 3.59 1.08 24* Takes human values when designing 1 4 3.66 .602 1* 4 3.68 .727 1* 4 3.85 .989 25- solution to one problem create prob. .75- 4 3.97 .695 1.75 4 3.94 .814 2 4 3.74 .864 26+ Design…requires taking constraints 2+ 4 3.94 .776 1.25 4 3.97 .883 27+ Uses graphs to show relationships 2+ 4 4.06 .886 1.25 4 3.85 .857 28* …personal computer operations 1 4 4.06 .948 1* 4 4.18 .936 1* 4 4.12 .913 29* …basic technical presentations 1 4 4.16 .808 1* 4 4.21 .914 1* 4 4.18 .904 30* engineering design portfolio. 1 3 3.09 .734 1* 3 3.15 1.16 2 3 4.24 .890 31* Uses technical drawings 1 4 3.63 .707 1* 4 3.56 .927 1* 4 3.18 1.22 32- computer-aided engineering. 0- 3 2.88 .751 1.5 3 2.94 .952 2 3 3.64 1.03 33* scale and proportion in design. 1 3 3.47 .507 1* 3 3.44 .705 1* 3 3.00 .985 34* Visualizes in three dimensions. 1 3.5 3.47 .803 1* 4 3.44 .960 1* 4 3.56 .824 35+ Uses technical sketching 2+ 3 3.62 1.02 1.25 3.5 3.68 .976 36* dimensioning and tolerancing. 1 3 2.66 .865 1* 3 2.68 1.01 1* 3 3.53 1.09 37* Uses computer-aided design 1 3 2.72 .813 1* 3 2.68 .912 1.25 3 2.76 1.08 38* basic ergonomics 1 3 2.63 .492 1* 3 2.56 .705 1* 3 2.71 .970
NCCTTE Journal Volume IX
15
39+ basic electronics concepts 2+ 3 3.03 .870 2 3 2.65 .734 40* Uses measuring equipment 1 4 4.19 .592 1* 4 4.21 .729 1* 4 3.06 .983 41* use of tools for material processes. 1 3 3.25 .622 1* 3 3.35 .774 1* 3 4.18 .716 42* basic power and energy concepts. 1 3 3.44 .504 1* 3.5 3.59 .957 1.25 3.5 3.32 .843 43* processes for manufacturing… 0 3 2.84 .448 0* 3 2.85 .610 .25* 3 3.53 1.08 44* material processes 0 3 2.97 .695 1* 3 3.00 .778 1.25 3 2.97 .797 45* basic mechanics to engineering 1 3 3.28 .457 1* 3 3.29 .719 1* 3 3.03 .797 46* basic statics and strengths .75 3 2.78 .608 .75* 3 2.97 .797 2 3 3.35 .774 47* basic dynamics and motion 1 3 2.56 .669 1* 3 2.50 .826 1* 3 3.09 .933 48* identify problems solved eng 1 4.5 4.47 .567 1* 4.5 4.31 .850 49- Believes in his/her ability 1- 4 4.19 .792 2 4 4.00 1.07 50 interscholastic design competitions 2 3 2.97 1.05 2 3 2.96 1.19 51- …importance of nanotechnologies 1- 3 2.69 .965 2 3 2.86 1.11 52- …convergence of nanoscience, bio 1- 3 2.59 .911 2 3 2.64 1.13 53* science and mathematics is critical 1 4 4.41 .499 1* 4 4.46 .508 54* there are many approaches to design 0 4 3.88 .660 1* 4 3.52 .975 *Indicates consensus +Indicates that the items was dropped from Round 3 because the item's IQR was still 2 or more after Round 2. - Indicates that consensus was reached in Round 3
Rounds 4, 5, and 6, Engineering Outcome Group Rankings
Because it would be difficult to rank outcome items into order of importance within each of the only two
rating groups (Important and More Important), the researchers decided to have selected engineers group outcome
items into groups of conceptual alikeness and name the groupings with a category name. This would prepare the
Round 4 instrument for the modified Delphi participants to rank each category only. The same basic statistic for
consensus, an IQR of 1, was used for Rounds 4, 5, and 6. Only 19 of the original 32 agreed to participate in these
additional last three rounds of the study. After these last three rounds (rounds 4, 5, and 6) dedicated to ranking the
groupings of outcomes, the participants could only agree on what should be taught 1st, 3rd, and 7th in ranked
importance. The final engineering outcome grouping names and their outcome group rankings are presented in
Table 8.
Table 8: Ranking of the Outcome Items within Categories; Results from Round 6
Rating Rank Outcome Group and Outcome Consensus Items
from Rounds
1, 2, 3
from Round
6
IQR = 0
Mode = 1.0
Median = 1.0
Engineering Design
NCCTTE Journal Volume IX
16
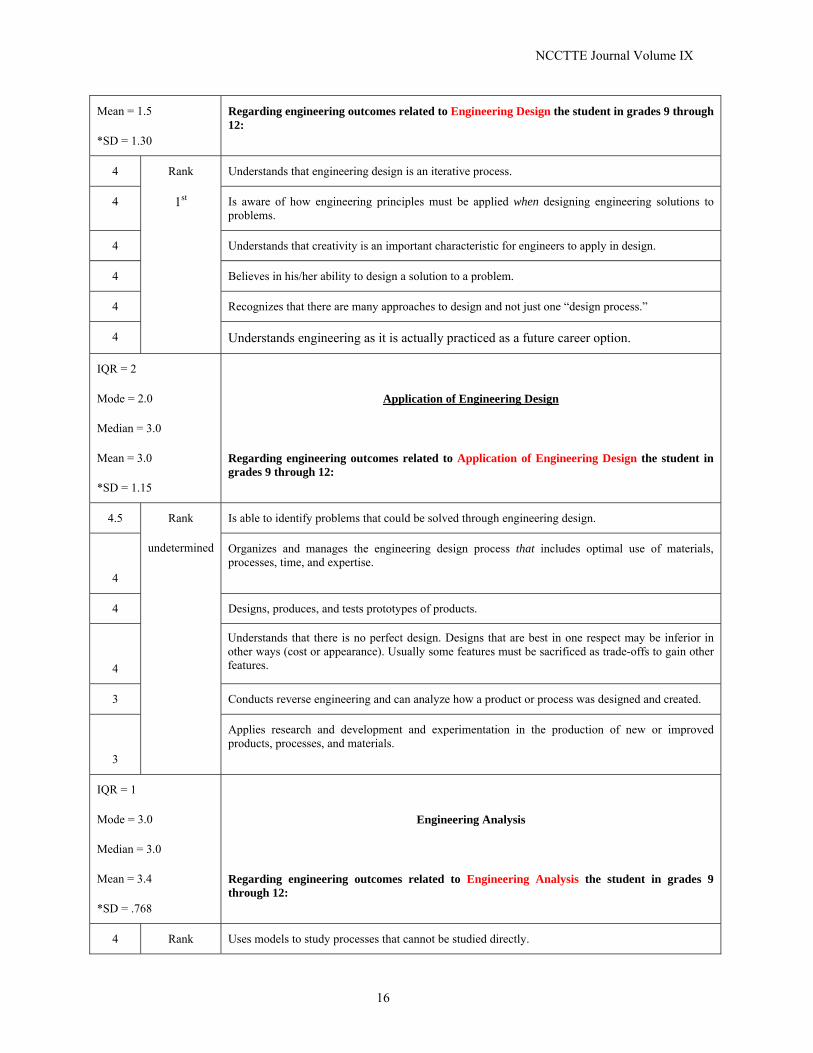
Mean = 1.5
*SD = 1.30
Regarding engineering outcomes related to Engineering Design the student in grades 9 through 12:
4 Rank
1st
Understands that engineering design is an iterative process.
4 Is aware of how engineering principles must be applied when designing engineering solutions to problems.
4 Understands that creativity is an important characteristic for engineers to apply in design.
4 Believes in his/her ability to design a solution to a problem.
4 Recognizes that there are many approaches to design and not just one “design process.”
4 Understands engineering as it is actually practiced as a future career option.
IQR = 2
Mode = 2.0
Median = 3.0
Mean = 3.0
*SD = 1.15
Application of Engineering Design
Regarding engineering outcomes related to Application of Engineering Design the student in grades 9 through 12:
4.5 Rank
undetermined
Is able to identify problems that could be solved through engineering design.
4
Organizes and manages the engineering design process that includes optimal use of materials, processes, time, and expertise.
4 Designs, produces, and tests prototypes of products.
4
Understands that there is no perfect design. Designs that are best in one respect may be inferior in other ways (cost or appearance). Usually some features must be sacrificed as trade-offs to gain other features.
3 Conducts reverse engineering and can analyze how a product or process was designed and created.
3
Applies research and development and experimentation in the production of new or improved products, processes, and materials.
IQR = 1
Mode = 3.0
Median = 3.0
Mean = 3.4
*SD = .768
Engineering Analysis
Regarding engineering outcomes related to Engineering Analysis the student in grades 9 through 12:
4 Rank Uses models to study processes that cannot be studied directly.
NCCTTE Journal Volume IX
17
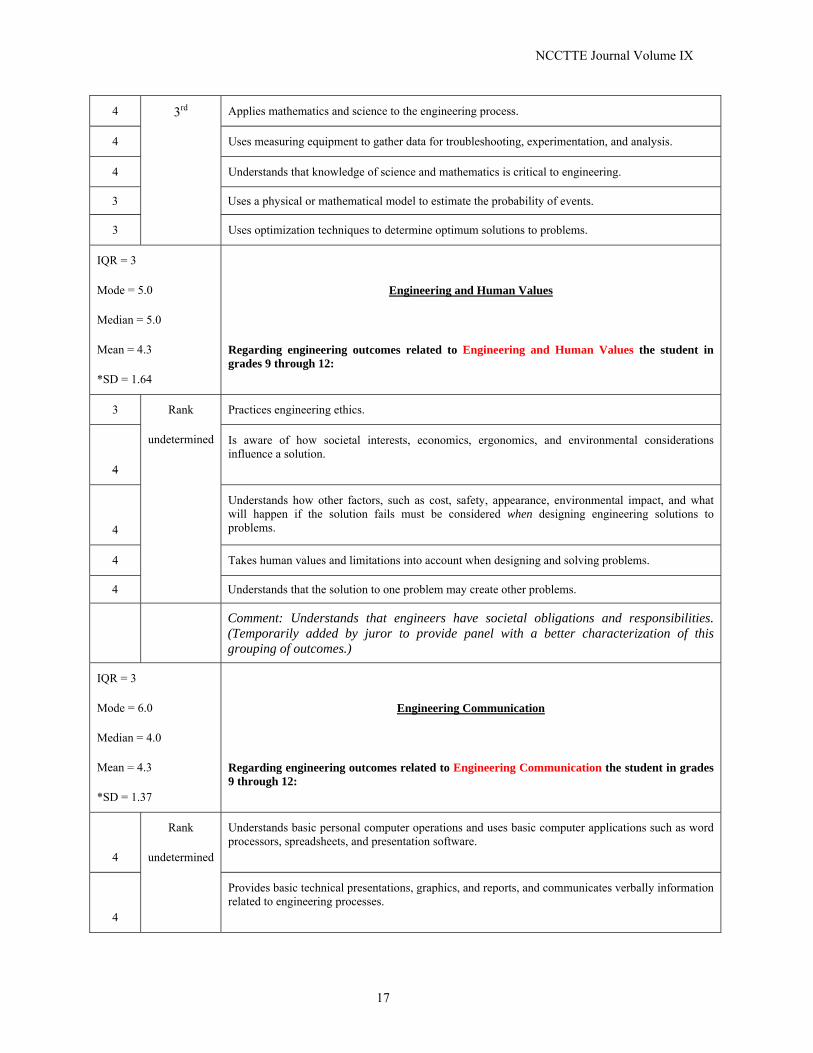
4 3rd Applies mathematics and science to the engineering process.
4 Uses measuring equipment to gather data for troubleshooting, experimentation, and analysis.
4 Understands that knowledge of science and mathematics is critical to engineering.
3 Uses a physical or mathematical model to estimate the probability of events.
3 Uses optimization techniques to determine optimum solutions to problems.
IQR = 3
Mode = 5.0
Median = 5.0
Mean = 4.3
*SD = 1.64
Engineering and Human Values
Regarding engineering outcomes related to Engineering and Human Values the student in grades 9 through 12:
3 Rank
undetermined
Practices engineering ethics.
4
Is aware of how societal interests, economics, ergonomics, and environmental considerations influence a solution.
4
Understands how other factors, such as cost, safety, appearance, environmental impact, and what will happen if the solution fails must be considered when designing engineering solutions to problems.
4 Takes human values and limitations into account when designing and solving problems.
4 Understands that the solution to one problem may create other problems.
Comment: Understands that engineers have societal obligations and responsibilities. (Temporarily added by juror to provide panel with a better characterization of this grouping of outcomes.)
IQR = 3
Mode = 6.0
Median = 4.0
Mean = 4.3
*SD = 1.37
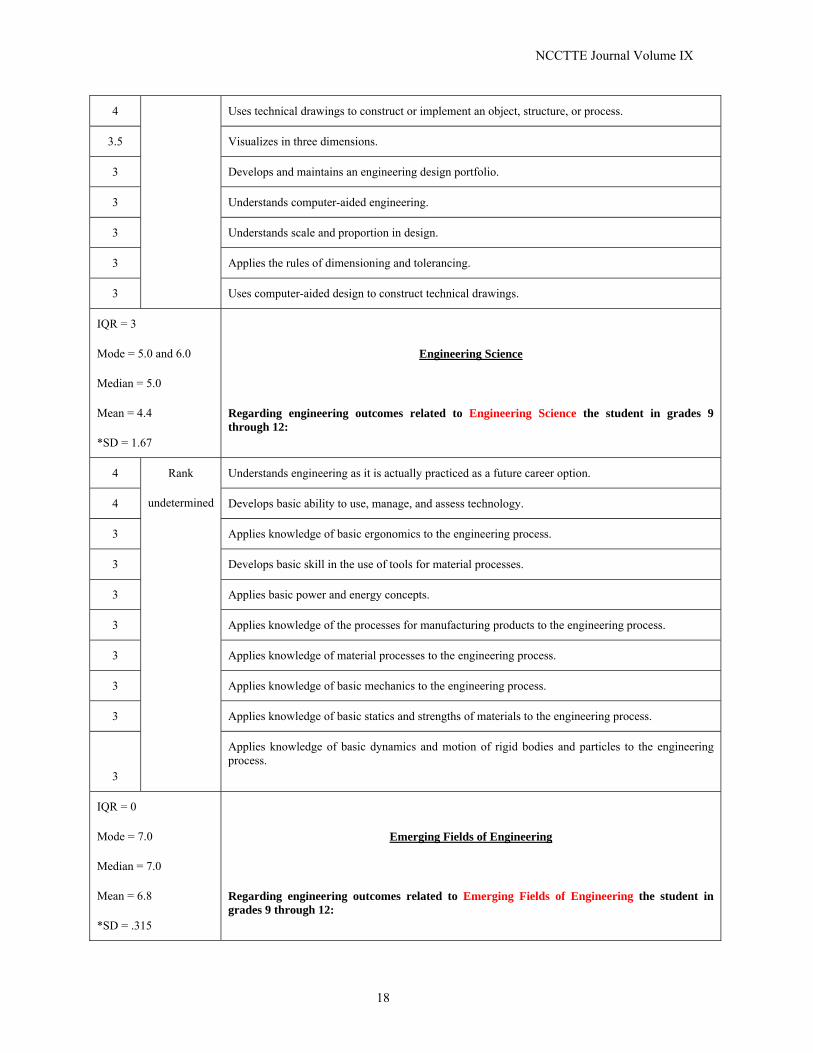
Engineering Communication
Regarding engineering outcomes related to Engineering Communication the student in grades 9 through 12:
4
Rank
undetermined
Understands basic personal computer operations and uses basic computer applications such as word processors, spreadsheets, and presentation software.
4
Provides basic technical presentations, graphics, and reports, and communicates verbally information related to engineering processes.
NCCTTE Journal Volume IX
18
4 Uses technical drawings to construct or implement an object, structure, or process.
3.5 Visualizes in three dimensions.
3 Develops and maintains an engineering design portfolio.
3 Understands computer-aided engineering.
3 Understands scale and proportion in design.
3 Applies the rules of dimensioning and tolerancing.
3 Uses computer-aided design to construct technical drawings.
IQR = 3
Mode = 5.0 and 6.0
Median = 5.0
Mean = 4.4
*SD = 1.67
Engineering Science
Regarding engineering outcomes related to Engineering Science the student in grades 9 through 12:
4 Rank
undetermined
Understands engineering as it is actually practiced as a future career option.
4 Develops basic ability to use, manage, and assess technology.
3 Applies knowledge of basic ergonomics to the engineering process.
3 Develops basic skill in the use of tools for material processes.
3 Applies basic power and energy concepts.
3 Applies knowledge of the processes for manufacturing products to the engineering process.
3 Applies knowledge of material processes to the engineering process.
3 Applies knowledge of basic mechanics to the engineering process.
3 Applies knowledge of basic statics and strengths of materials to the engineering process.
3
Applies knowledge of basic dynamics and motion of rigid bodies and particles to the engineering process.
IQR = 0
Mode = 7.0
Median = 7.0
Mean = 6.8
*SD = .315
Emerging Fields of Engineering
Regarding engineering outcomes related to Emerging Fields of Engineering the student in grades 9 through 12:

NCCTTE Journal Volume IX
19
3 Rank
7th
Understands the importance of nanotechnologies in developing the next generation of innovations (less power, smaller).
3
Understands the convergence of nanoscience, biotechnology, information technology and how cognitive science creates opportunities for the improvement of industrial productivity and quality of human life.
Comment: Understands that engineering is a set of living and evolving fields from which new technologies and concepts emerge constantly. (Temporarily added by juror to provide panel with a better characterization of this grouping of outcomes.)
*The mean and standard deviation are included for reference only. Please note that only 19 participants were involved with the
grouping extension of the study (rounds 4, 5, and 6).
Discussion
It is an important finding that participants could not agree on an outcome that would likely be considered
important by pre engineering teachers and other educators. Item seven still had an IQR of 2 after Round 2. The
wording of the item follows below.
Regarding engineering outcomes related to Engineering Design the student in grades 9 through 12:
Item 7: Understands that engineering design involves identifying needs for technical solutions, using human information resources to obtain ideas, considering constraints, generating alternative solutions, developing drawings with measurements and details of construction, constructing models, testing the solution against design specifications, and suggesting modifications for improvement.
However, in Round 2, the following item, which was added by the participants in Round 1, gained consensus.
Regarding engineering outcomes related to Engineering Design the student in grades 9 through 12:
Item 54: IQR 1, Mdn 4 Recognizes that there are many approaches to design and not just one “design process.”
It is plausible that one reason that consensus could not be formed regarding Item 7 above is that it was
worded so long and had so many individual components. One indicator that lends support to this theory is that a
participant commented, “This item is too complex to rate fairly. I have different reactions to different parts of it.”
Another indicator of this plausibility is that the individual components that make up Item 7 appear individually as
separate items which did gain consensus.
Wicklein’s (2006) premise that the use of mathematics and science in order to optimize solutions prior to
implementation, for modeling and predictive analysis, and to generally support the engineering design process tends
to be validated by the findings. However, while the NCETE tends to place a great deal of importance on
optimization and prediction because those tend to be missing in practice in technology education programs, the

NCCTTE Journal Volume IX
20
participants found those outcomes to be necessary or important but not essential or more important. Some comments
were posted that these processes (below) were beyond the abilities of high school students.
IQR 1, Mdn 4
Applies mathematics and science to the engineering process. IQR 1 Mdn 3
Uses optimization techniques to determine optimum solutions… IQR 1 Mdn 3
Uses a physical or mathematical models to estimate…probability of events. It is interesting that consensus items had medians of either 3 (meaning the item is necessary or important) or
4 (meaning the item is essential or more important). It is plausible that this finding is due to the fact that those
standards published by the resources cited above are valid in terms of engineering outcomes. Furthermore, the
narrow range of ratings for consensus items means that educators can use those consensus outcomes with a fair level
of confidence regarding their validity.
Of further interest is that so many items tend to support the conclusions of the NAE regarding the
competencies and attributes of future engineers. For example, Item 19 (IQR 1, Mdn 4) emphasizes the NAE's
conclusion that creativity is a key engineering attribute. It states, "Understands that creativity is an important
characteristic for engineers to apply in design." Regarding the NAE's conclusion that flexibility will be a more
important attribute, it is interesting that participants added and reached consensus on Item 54 (IQR 0, Mdn 4),
"Recognizes that there are many approaches to design and not just one design process.” Participants, like the NAE,
may recognize that flexibility will be needed in solving a wide variety of problems through engineering, and this
may also be based on their experiences. As a matter of efficiently managing complexity, the NAE concludes that the
engineer's ability to organize the engineering process will be even more important in the future. Item 10 directly
addresses that concern. Item 10 states, "Organizes and manages the engineering design process that includes optimal
use of materials, processes, time, and expertise." The NAE emphasizes that future engineers will have to understand
the various influences on designs and design tradeoffs and practice ethics, and it is interesting to note that Items 5,
11, and 13 (see Table 7) reflect those same concerns.
The NAE concludes that engineers will need to have broader foundations of knowledge regarding emerging
or revolutionary technologies, to the extent that an extra year or two may need to be added to traditional
undergraduate engineering education. It is noteworthy that nanotechnology was included as Important in both Items
51 and 52 each with IQRs of 1 and medians of 3. These items were added by participants. No other emerging
NCCTTE Journal Volume IX
21
technologies such as biotechnology were identified by participants. The addition of nanotechnology may suggest
that there is concern that students understand emerging technologies, and perhaps that concern has not yet peaked
among engineers.
It is also interesting to note from a technology education point of view, that the participants could not reach
consensus regarding the necessity of including technical sketching but did find that CAD is necessary. This
somewhat contradicts the findings of the Dearing and Daugherty study. However, that study included technology
educators in addition to engineering educators, and it is plausible that technology educators place more importance
on sketching than do engineers. When it came to making models and prototypes for testing and analysis, participants
found that this was essential with a median of 4, however, some participants commented that “this sounds
suspiciously like shop class” and suggested on more than one occasion that such hands-on activities would be a turn
off to students. It is not clear whether such a perspective is contrary to guidelines developed by Douglas, Iverson,
and Kavandurg (2004), which call for engineering education at the K-12 level to be a hands-on learning experience.
After all, it is quite possible to have hands-on learning experiences without actually making an authentic prototype.
Additionally, the NAE concludes that engineers will need to work in teams, including teams that include
non-engineers. However, the participating engineers and engineering educators did not reach consensus on the
study's related item, "Works effectively in teams." There were comments written by participants questioning the
need for students to work in groups. Also noteworthy is the lack of consensus on Items 1 and 3. They respectively
read, "Is able to define engineering," and "Understands the disciplines of engineering." Comments made by
participants regarding these items allude to the trivial nature of such outcome items and that more emphasis should
be placed on outcomes that make students want to be engineers.
The fact that the participants were only able to reach consensus on the rankings of three of the outcomes
groupings appears to be explained by fundamental disagreement as to which groupings of outcomes should be
taught first, second, et cetera. Like in the first three rounds of the study, participants had to post comments if they
did not vote with the majority. These comments indicated a sustained disagreement. Nevertheless, with IQR’s of 0
(zero) it is clear that participants were able to agree that Engineering Design should be ranked first in importance, or
the most important to get taught in a limited time frame and that Emerging Fields of Engineering was last in
importance, or the least important to get taught in a limited time frame.

NCCTTE Journal Volume IX
22
Some researchers who have seen the results of this study prior to publication were surprised that the
outcomes that reached consensus were not more “global” such as those promoted by the NAE committee that
provided input for the conclusions reached in The Engineer of 2020. Two of these researchers have suggested that
the participants should have only included engineering professors who teach freshmen level engineering courses at
the college level. However, the researchers of this study were advised to seek nominations by the NAE and ABET.
Recommendations from other researchers in the NCETE, ABET, and the NAE focused on including collegiate
engineering educators who are familiar with K-12 education as much as possible and to include engineering
professors and practicing engineers as much as possible for balance. Nevertheless, having a homogeneous group
such as, only freshmen level engineering design professors, would be an excellent approach for future studies that
are similar to this one.
Regarding the usefulness of the outcomes study, the reader should understand that Delphi studies use
relatively small participant sizes because the process is dependent upon the participants being experts in their fields.
It organizes expert opinion. Therefore, one should not be reluctant to consider these findings as input to curriculum
decisions. It is interesting that consensus items had medians of either 3 (meaning the item is Important or necessary)
or 4 (meaning the item is More Important or essential). It is plausible that this finding is due to the fact that those
standards published by the resources cited above are valid in terms of engineering outcomes. Furthermore, the
narrow range of ratings for consensus items means that educators can use those consensus outcomes with a good
level of confidence. However, were the study to be repeated, the researchers should consider constraining
participants to the number of outcomes that can hold a particular rating. For example, only one-fifth of the outcomes
can be rated at 1, Least Important, and so on. The researchers were reluctant to do this for fear of obscuring the
possible reality of what could be true about these outcomes. In other words, it may very well be true that a
preponderance of these outcomes actually is Important and More Important, and forcing participants to only rate
one-fifth of them as Least Important would obscure that truth. Future researchers should also consider expanding the
rating scale from a five-point scale to a 10-point scale. However, in doing so they should be prepared to extend the
number of rounds that the study will run. Certainly, the Delphi process used for this study was influenced by
"regression toward the mean" as indicated by the fact that only one consensus item achieved a mode of 5 as its
rating. No consensus items achieved ratings of 1 or 2. Nevertheless, participants had the opportunity to rate items,
and there was not consensus regarding any item being rated at the 1 or 2 level. Moreover, the interquartile range was

NCCTTE Journal Volume IX
23
deliberately used to narrow the influence of out-lying data on the determination of consensus, which also provides
an additional level of confidence in the use of these findings in high school engineering curricula. To date, no
correlations among demographic variables and outcome ratings have been run.
Selected Recommendations
The following recommendations will be of interest to educators.
1. Have a person with influence and stature (who can convince engineers to participate in focus groups) to lead
focus groups of prominent engineers. Such a person may also be able to convince engineers to participate in a
Delphi study that is not modified.
2. One advantage of conducting a Delphi study is that people who may have outstanding stature or who may tend
to dominate discussions, have less biasing influence on the consensus-building process, but some decisions are
best made in face-to-face meetings. Therefore, conduct a workshop on engineering outcomes, in which experts
have a chance to more deliberately persuade one another about the importance of outcomes.
3. Enhance technology education by infusing selected engineering outcomes into the technology education
curriculum for non-pre engineering curricula. The researchers believe that adding selected outcomes is useful.
Therefore, they recommend conducting a similar study in which technology educators identify those
engineering consensus outcomes identified herein for inclusion in technology education programs which focus
on technological literacy.
4. Use these outcomes to aid in the design and review of pre engineering programs.
5. Upon findings in the technology education study recommended above, recommend a listing of engineering
outcomes that can be infused into technology education programs for the purpose of providing technological
literacy.
Implications for Technology Education Curriculum and Instruction
It is clear that engineering education at the K-12 level should be hands-on (Douglas,
Iverson, & Kavandurg, 2004). So it would be necessary to include outcomes such as those
related to conducting reverse engineering, research and development, and the fabrication of

NCCTTE Journal Volume IX
24
prototypes. It also seems fairly obvious that any program would include a breadth of engineering
communication activities related to presenting findings, to using CAD, to using the computer as
a means to control data and communicate engineering processes. Any program that taught
engineering would benefit from having students apply mathematics and science principles to the
solutions that they design. If there is limited time in the curriculum, the focus should be on those
items listed under the Engineering Design grouping.
What engineering outcomes should be included in a high school technology education
program that focuses on providing students with technological literacy? Certainly, those
outcomes that most closely correspond to the Standards for Technological Literacy, such as
optimization, the realization that there are many societal factors that influence engineered
solutions, and any outcome that will help students become better designers and understand the
essence of what engineering is in real life, such as prototyping, creativity, and clearly managing
the design process. Research and development and analysis are also important.
What engineering outcomes should be included in a high school technology education
program that focuses on pre engineering? All of those consensus outcomes from the study were
identified on the premise that they were to be taught to high school students who want to pursue
engineering after they graduate. However, a crowded curriculum, which leaves no time for
application, diminishes its effect on student achievement and motivation. Consider dividing
content so it is studied over a sequence of courses over a sequence of grade levels, while
avoiding too many prerequisite courses that will limit enrollment.
Having identified those core engineering concepts that should be taught to high school students, under what
circumstances should one go about teaching the concepts? Douglas, Iverson, and Kavandurg (2004) in summarizing
the results of an ASEE analysis of current practices in K-12 engineering education, developed guidelines for the
future of K-12 engineering education. One, engineering education should be hands-on in order to motivate students

NCCTTE Journal Volume IX
25
by couching engineering problems in interesting and relevant social contexts. Two, engineering education should be
taught in an interdisciplinary approach in order to show the relevancy of mathematics, science, and other subjects,
by making engineering a conceptual place for the application of these subjects. Three, develop K-12 standards for
use in lesson plans that help teachers teach mathematics and science concepts in the classroom. Douglas, Iverson,
and Kavandurg suggest that state-developed K-12 standards should be developed like Massachusetts has published.
References
American Association for the Advancement of Science (1993). Benchmarks for science literacy.
New York: Oxford University Press. Retrieved June 25, 2005 from:
http://www.project2061.org/tools/benchol/bolintro.htm
Accreditation Board for Engineering and Technology. (2005). Criteria for accrediting engineering programs.
Washington, DC: author. Retrieved June 25, 2005 from: http://www.abet.org/Linked%20Documents-
UPDATE/Criteria%20and%20PP/05-06-EAC%20Criteria.pdf
Bordogna J. A. (1997) Next-generation engineering: Innovation through integration. Paper presented at the
Engineering Education Innovation Conference, Arlington, VA. In Best Practices Summary Report.
Washington, DC: National Science Foundation. Retrieved June 25, 2005 from:
http://www.nsf.gov/pubs/1998/nsf9892/start.htm
Boston Museum of Science (2005). Engineering the future. Boston, MA: author. Retrieved June
25, 2005 from: http://www.mos.org/doc/1408
Centers for Learning and Teaching –Network (2005). Centers. Washington, DC: National
Science Foundation. Retrieved June 25, 2005 from:
http://cltnet.org/cltnet/do/CltnetAction?ROOM_ID=1&state=displayCentersTab
Clark, A. C., & Wenig, R. E. (1999). Identification of quality characteristics for technology
education programs: A North Carolina case study. Journal of Technology Education, 11(1).
Retrieved September 23, 2005 from
http://scholar.lib.vt.edu/ejournals/JTE/v11n1/clark.html

NCCTTE Journal Volume IX
26
Council on Technology Teacher Education (2004). Folio reviewer assessment instrument: ITEA/CTTE/NCATE
curriculum standards for initial programs in technology education. Reston, VA: author. Retrieved June 25,
2005 from: http://teched.vt.edu/CTTE/ImagesPDFs/CTTE_FolioReviewAssessForms.pdf
Cunningham, C., & Knight, M. (2005) Pre-College Engineering for Teachers. Retrieved March 5, 2006 from:
http://www.ceeo.tufts.edu/pcet/.
Custer, R. L., Scarcella, J. A., & Stewart, B. R. (1999). The modified Delphi technique - A rotational modification.
Journal of Vocational and Technical Education, 15(2). Retrieved September 23, 2005 from
http://scholar.lib.vt.edu/ejournals/JVTE/v15n2/custer.html
Dalkey, N. C. (1972). The Delphi method: an experimental application of group opinion. In N. C. Dalkey, D. L.
Rourke, R. Lewis, & D. Snyder (Eds.) Studies in the quality of life. Lexington, MA: Lexington Books.
Dearing, B. M., & Daugherty, M. K. (2004). Delivering engineering content in technology education. The
Technology Teacher, 64(3), 8-11.
Douglas, J., Iversen, E., & Kalyandurg, C. (2004). Engineering in the K – 12 classroom: An
analysis of current practices and guidelines for the future. Washington, DC: American
Society for Engineering Education. Retrieved June 25, 2005 from:
http://www.engineeringk12.org/Engineering_in_the_K-12_Classroom.pdf
International Technology Education Association. (2000). Standards for technological literacy:
Content for the study of technology. Reston, VA: author.
International Technology Education Association. (2004). Engineering design: A standards-based
high school model course guide. Reston, VA: author.
Lewis, T. (2004). A turn to engineering: The continuing struggle of technology education for legitimization as a
school subject. Journal of Technology Education, 16(1). Retrieved June 25, 2005 from:
http://scholar.lib.vt.edu/ejournals/JTE/v16n1/lewis.html
Mid-Continent Research for Education and Learning (2004). Content knowledge (fourth edition):
A compilation of content standards for K-12 curriculum in both searchable and browse-
NCCTTE Journal Volume IX
27
able formats. Aurora, CO: author. Retrieved June 25, 2005 from:
http://www.mcrel.org/standards-benchmarks/
National Academy of Engineering (2002). Technically speaking: Why all Americans need to
know more about technology. G. Pearson and A. T. Young (Eds). Washington, DC:
National Academy Press.
National Academy of Engineering (2004). The engineer of 2020: Visions of engineering in the
new century. Washington, DC: National Academies Press.
Rogers, G.E. (2005). Pre-engineering’s place in technology education and its effects on technological literacy as
perceived by technology education teachers. Journal of Industrial Teacher Education, 42(3)
Rojewski, J.W., & Meers, G.D. (1991). Directions for future research in vocational special needs education. Urbana
Champaign, IL: University of Illinois: Department of Vocational Technical Education, Leadership
Development Program in Transition and Vocational Special Education. (ERIC Document Reproduction
Service)
Salinger, G. (2003). Engineering in the K-12 curriculum. Paper presented at the American-Australian Technology
Education Forum, Gold Coast, Australia. In G. Martin and H. Middleton, (Eds.) (2003). Initiatives in
technology education: Comparative perspectives, pp. 86-96. Nathan, Queensland: Technical Foundation of
America and the Centre for Technology Education Research, Griffith University.
Wells, J. (1994). Establishing a taxonometric structure for the study of biotechnology in secondary school
technology education. Journal of Technology Education, 6(1). Retrieved September 23, 2005 from
http://scholar.lib.vt.edu/ejournals/JTE/v6n1/wells.jte-v6n1.html
Wicklein, R. C. (1993). Identifying critical issues and problems in technology education using a modified-Delphi
technique. Journal of Technology Education, 5(1). Retrieved September 23, 2005 from
http://scholar.lib.vt.edu/ejournals/JTE/v5n1/wicklein.jte-v5n1.html
Wicklein, R. C. (2006). Five good reasons for engineering design as the focus for technology education. The
Technology Teacher, (65)7, 25-29.

NCCTTE Journal Volume IX
28
Analysis of Problem Solving Techniques Used by Students When Learning About New Technologies
T.E. Varnado and V.W. Deluca
North Carolina State University
Introduction Now more than ever before, new and emerging technologies are prevalent in education, the workforce, and our daily lives causing 21st century citizens to face new challenges. Making informed decisions about technologies that affect their health, home, and happiness, students, employees, and people in general must not only know how to use certain technologies, but must also understand how the technology works and how it will affect them when encountered. While new technologies can be beneficial, problems also arise. So, what do people do when faced with using new technologies? How do they learn to solve technological problems? Answers to these questions might seem to include learning through K-12 and post-secondary education, training and development, some sort of continuing education, or some people may choose to trust those dealing with the technology, not knowing if the information they receive is accurate. Hence, technology educators strive to teach students technological problem solving skills through active, hands-on, experiential learning situations. However, as technology emerges, so must the strategies and methodologies used to teach problem solving skills.
What is Technological Problem Solving? A problem is an obstacle, a task (Soden, 1994), a situation (Andre, 1986), a challenge, or a question. It is “a state of difficulty that needs to be resolved” (Miller, 2004). Problems may involve “the discovery of a logical principle, acquisition of an experimental method, and/or the interpretation of the physical world” (Saxena, 1983, p. 16). Problems can be perplexing. “First, a problem is an unknown entity in some context. Second, finding or solving for the unknown must have some social, cultural, or intellectual value” (Jonassen, 2004). But no matter how one looks

NCCTTE Journal Volume IX
29
at a problem, thought and skill are required to envision a functional outcome and to derive a solution to the problem. According to Andre (1986), problems consist of four components: The goal(s), the givens, the obstacles, and the methods or operations. Paraphrasing Newell and Simon (1972), Andre agrees, “A problem is a situation in which the individual wants to do something but does not know the course of action needed to get what he or she wants” (p. 170). Also based on Newell and Simon’s concept of goal space (resources, processes, and goal thrust), Custer (1999) categorizes problems into three general classifications: social/interpersonal, natural/ecological, and technological. “Intellectually, problems vary in at least four ways: structuredness, complexity, dynamicity, and domain specificity or abstractedness” (Jonessen, 2004).
General Problem Solving Problem solving is a dynamic process that is seen as a search for associations (Hill, 1979). It is the “application of relevant knowledge” (Soden, 1994, p. 26), which involves three components:
▪ Thinking (cognitive) ▪ Emotional or motivational ▪ Behavioral (Andre, 1986)
Representative of the emotional element is the confidence level a student possesses in the ability to solve a problem (Andre). Motivational and behavioral components involved in real-life problem solving are prominent (Andre). Many researchers have studied problem solving and developed definitions of the process. While each description may vary, two terms are common throughout the literature: thinking and learning. In The Conditions of Learning, Gagné (1977) asserts problem solving to be a process of applying previously learned rules to arrive at a solution, which theoretically yields new learning. This new learning involves a higher order rule, "which enables individuals to solve other problems of a similar type" (p. 156). Problem solving is considered a form of learning in which new knowledge is acquired, at which time an "individual's capability is more or less permanently changed" (Gagné, p. 157). The test of problem solving occurrence is that a solution has been reached and transferred. Cohen (1971) explains problem solving as:
Using basic thinking processes to resolve a known or defined difficulty: assemble facts about the difficulty and determine additional information needed; infer or suggest alternate solutions and test them for appropriateness; potentially reduce to simpler levels of explanation and eliminate discrepancies; [and] provide solution checks for generalizable value (p. 5).
To show the relevance in similarities between the thinking required in problem solving and the thinking of everyday life, de Bono (1972) defines problem solving in everyday terms:
▪ Dealing with a situation ▪ Overcoming an obstacle ▪ Bringing about a desired effect ▪ Making something happen (p. 11)
NCCTTE Journal Volume IX
30
Leone Burton (in Hill, 1979) postulates that “for Gagné, problem solving is at the pinnacle of the hierarchy for learning, for Duncker there is ‘thinking in general or problem solving in particular,’ [and] Mayer claims that thinking is problem solving”(pp. 8-9). “Barnes (1989) speaks of problem solving as a universal model for transforming knowledge” (Lodermeier, 1989, p. 5). The capacity to construct problem solutions by applying prior knowledge is considered an important aspect of problem solving (Berkemer, 1989). Problem solving generates “a framework of thinking for recognizing problems, thinking of possible solutions, and testing or evaluating the solutions” (Berkemer, p. 18). In problem solving, students learn “to make use of known concepts and rules to define a problem and find its solution; learning involves using internal process categories in seeking a solution” (Anderson and Krathwohl, 2001, pp. 264-265). “Problem solving involves the process of coordinating previous experience, knowledge, and intuition in an attempt to determine a method for resolving a situation whose outcome is not known (Charles & Lester, 1982, p. 10). It “is a critical skill that involves virtually all aspects of existence” (Custer, 1995, p. 232). Students’ cognitive, affective, and experience factors collaborate to determine success in problem solving (Charles and Lester). Several kinds of problem-solving experiences exist. In readiness experiences students engage the emotional/motivational component. Charles & Lester (1982) concluded, “A willingness to engage in problem solving and self-confidence in one’s ability to succeed [are] probably the most important characteristics a student can bring to the problem-solving situation” (p. 16). Other experiences include “exploring essential problem-solving strategies” and “solving various types of problems and discussing their solutions.” Appropriate and relevant experiences will help to “establish positive attitudes toward problem solving” and will “enhance the development of the ability to visualize mentally the key components of a problem” (Charles & Lester, p. 16). Processes and Strategies In solving problems, certain processes, including divergent thinking, are engaged. These certain processes “refer to the mental operations that problem solvers employ to think about the representation of goals and givens to try to transform the givens into the goals and find a solution” (Andre, 1996, p. 181). Based on the work of Anderson, 1980, Newell & Simon, 1972, and others, Andre (1986) lists four problem solving approaches:
▪ Information or schemata (productions) in long-term memory ▪ Heuristic approaches ▪ Algorithms for problem solutions where available ▪ Metaphorical relationships with other representations
“Heuristics indicate likely directions to pursue or approaches to follow (Andre, 1986, p. 181). Following steps in a heuristic approach may lead to problem solutions and is most useful to problem solvers when they are unfamiliar with the subject matter of the problem (Andre). While prioritizing tasks to solve a problem is important in applying the heuristic approach, typical components of this process might include
▪ Recognizing the problem ▪ Defining the problem ▪ Selecting a strategy
NCCTTE Journal Volume IX
31
▪ Attempting to solve by acting on a strategy ▪ Drawing conclusions and checking results (Lodermeier, 1989)
Over the years, many components and phases of problem solving approaches have been developed. Including as few as three stages and as many as ten, it seems that the underlying principles remain the same. Consequently, “efforts have been needed to more clearly define the primary processes involved [specifically] in technological problem solving” (Hill & Wicklein, 1999, p. 6). At first glance, strategies for solving problems may seem similar to typical problem solving procedures. However, they differ in that procedures in general may have but one solution (Siegler & Jenkins, 1989). Accordingly, groups of students may employ any number of strategies to solve a problem, but every group will travel different paths and arrive at different solutions. For example, Lawson (1990) found that scientists are problem oriented and use analysis in their problem solving methods, and that architects are solution oriented and use synthesis in their problem solving methods; however, no significant differences in their use of strategies occurred. This would stand to reason, since strategies are deliberate, “goal-directed, mental operations that are aimed at solving” problems (Bjorklund, Muir-Broaddus, & Schneider, 1990, p. vi).
Technological Problem Solving The concept of general problem solving involving a definite focus on technological problems is known as technological problem solving (Halfin, 1973; Hill and Wicklein, 1999; Hutchinson and Hutchinson, 1991; Hutchinson and Karsnitz, 1994; ITEA, 2000; Todd, 1990). Technological problem solving involves hands-on, active learning situations that promote lateral thinking and cyclic processes, yielding no one correct answer (Davis et al., 1997; ITEA). Jonassen (2004) agrees, “Learning and problem solving are active processes. Learning from activity requires reflection on that activity” (p. xxiv). Two individuals can arrive at the same solution to a problem using different, correct methods (Charles & Lester, 1982, p. 12). Any number of a variety of approaches may be applied (Hill & Wicklein, 1999; Johnson, 1994; Johnson, 1996; Maley, 1986; Pucel, 1995; Savage and Sterry, 1990; Tidewater Technology Associates, 1986; Waetjin, 1989; Wicklein, 1986; Wright, Israel, & Lauda, 1993). Hill and Wicklein recommend considering this context when determining how problem-solving skills can best be developed. Solving problems is fundamental to all aspects of technology (Tidewater Technology Associates, 1986; ITEA, 2000). Problem solving skills must be taught, “to ensure that our citizens will be able to adapt to the ever-changing world, [and] to meet personal needs as well as [the] needs of society as a whole” (Tidewater Technology Associates, p. 15). Developing problem solving abilities at an early age is essential to generating students’ technological literacy (Custer et al., 2001). For example, Standards for Technological Literacy: Chapter 3-The Nature of Technology, Standard 1F states, “In order to comprehend the scope of technology, students in grades 6-8 should learn that new products and systems can be developed to solve problems or to help do things that could not be done without the help of technology” (ITEA, p. 27). Technological problems feature invention, development, and the employ of tools and objects for human purposes (Custer, 1999). Four major categories of technological problems include design, procedures, invention, and troubleshooting (Custer). Problem solving process literacy requires
NCCTTE Journal Volume IX
32
cognitive and procedural knowledge as well as familiarity with the processes carried out in making a product or system (ITEA, 2000). The ITEA identifies other problem types such as, invention and innovation, experimentation, research and development, and troubleshooting (ITEA). Technological problem solving involves real-world, practical problem-solving methods. Technological design also promotes teamwork as a method by which people work together to accomplish a common goal. “If students know how problem-solving methods work, they can gain a better appreciation and understanding of technology” (ITEA, 2000, p. 90). Applying problem solving methods gives students the opportunity to practice interdisciplinary skills:
▪ Performing measurements, making estimates and doing calculations—using a variety of tools
▪ Working with two- and three-dimensional models ▪ Presenting complex ideas clearly ▪ Devising workable solutions to problems (ITEA, p. 90)
Processes and Activities
Traditionally, teaching problem solving has been associated with school subjects like math, science, and social studies (Yi, 1996). In the mid-1980s problem solving procedures and techniques specifically begin to appear in the technology education literature (Baker and Dugger, 1986; Johnson, 1989; Tidewater Technology Associates, 1986). In the 37
th Yearbook of the
Council on Technology Teacher Education (CTTE), Hatch (1988) wrote a chapter entitled, the Problem Solving Approach, in which he emphasizes the connection between problem types and thinking processes. Savage & Sterry (1990) suggest the technological problem solving process parallels the scientific method. Hein (1987), however, determined that while the discipline of science embodies the theory of problem solving skills, there had been no definition of a progressive development. The technological problem solving process involves “a rational series of steps that the problem solver presumably goes through in solving a problem” (Andre, 1986, p. 174). Common factors among reviewed problem solving processes include:
▪ Identifying and defining the problem ▪ Researching and analyzing relevant information ▪ Generating and implementing solutions to the problem ▪ Evaluating and revising the best possible solution
The phases pertinent to successful technological problem solving comprise components in a process that may sometimes be used simultaneously, successively and/or iteratively (Hill & Wicklein, 1999). “By integrating these processes, technology educators can create comprehensive approaches to technological problem solving that are not limited to tools, equipment, and laboratories” (Hill & Wicklein, Recommendations, ¶ 34). “Through carefully selected activities, students can increase their problem solving and decision making skills” (Lodermeier, 1989, pp. 1-2). Brusic (1991) defines a technological activity as a project devised to strengthen specific concepts by encouraging students to apply creativity, knowledge, and resources to solve practical problems. Berkemer (1989) found that projects

NCCTTE Journal Volume IX
33
“appear to emphasize problem solving (as opposed to creativity) to a greater extent than [he] originally assumed” (p. 186). This may be accomplished “through teaching a framework of thinking that facilitates creative three-dimensional, technical solution development” (Berkemer, p. 172). A technological activity ought to be “guided by criteria and constraints” (Custer et al., 2001, p. 6). The objective of a problem solving activity is “to enhance creativity in students by helping them to understand and internalize that methodology, a repeatable and transferable framework for creative problem solving” (Berkemer, 1989, p. ii). Problem solving activities should “involve heuristics and creative problem solving processes which enhance higher levels of thinking” (Lodermeier, 1989, p. 62).
Methodology Design
This descriptive study was one of convenience and focused on technology education graduate students in an emerging technologies laboratory course. The researchers assumed that all graduate students participating in the study during the 2006 fall semester had no previous experience with the technologies described below. Four pairs of graduate students and one group of three were faced with eight different emerging technologies used to teach technology education. Each group was asked to complete prescribed tasks; therefore, no problem identification was required, so this part of the process was uniform. Students were expected to employ all other aspects of the problem solving process as required. At the time any problem was encountered during each work station, participants were asked to describe the problem. As the problem solving process was carried out, participants were to determine the cause of the problem, decide the relevant thinking processes employed, and to list the problem solving processes used to solve the problem. The researchers determined that processes and procedures occurring 50% of the time or more would be examined more closely.
The Emerging Technologies Each of the nine emerging technologies and the prescribed tasks participants were asked to accomplish in the given time are described as follows. 1. Computer Numeric Control (CNC) Lathe
The spectraLIGHT Turning Center, a two-axis (X and Z) lathe, is run directly from a PC. The control program accepts standard EIA RS-274D G&M codes recognized by CNC machine tools. Participants were asked to program the lathe to produce the part described in the tutorial. Once familiar with the workstation, participants were asked to design their own part and program the lathe to produce it. Sketches, including dimensions, and tool clearance considerations were required to be submitted for pre-approval. They were also instructed to create the part geometry and then produce it.
2. PSIM 2000 A programmable logic controller (PLC) simulator, this computer program emulates the operation of industry ladder logic applications. Four input and output branches are supported. Participants were required to familiarize themselves with ladder logic programming by following the prepared instruction manual. The task at this station was to complete exercises 1-4, Batch Mixer, Silo, Traffic Light, and I/O simulators.
3. Mastercam Milling Mastercam CAD/CAM NC offline programming software allows for toolpath creation and cutting parts in a time saving fashion. Two- and three-dimensional geometry creation can be used to analyze single points, between points, angles, and entire entities (CNC Software, Inc., 2007) that can be produced using the spectraLIGHT Machining Center.
NCCTTE Journal Volume IX
34
Participants were to design and mill alphanumeric characters to create a logo or plaque. Once familiar with the workstation, participants were asked to design their own product and program the mill to produce it. Sketches of the design and the required dimensions were submitted for pre-approval.
4. VEX™ Robotics Design System VEX™ is a compilation of more than 500 parts, including structure, motion, power, sensor, control, logic, and programming subsystems. It allows for the construction and programming of an autonomous robot that can be used for problem solving and prototyping. Participants were instructed to follow the instructions in the inventor’s guide book to build a squarebot, and then using the easyC programming platform, write a simple program to perform a given task.
5. SCORBOT This scale model industrial robot arm trainer is vertically articulated and has five rotational degrees of freedom. It is supported by SCORBASE robotics programming and control software and is designed to function in stand-alone operations and in integrated automated workcell applications. Participants were to familiarize themselves with the control environment by programming a simple pick and place operation, and then program the robot arm to build a tower made of three different sized blocks. The robot arm must be programmed to autonomously select the proper size blocks and place them in order from largest to smallest using specific commands in the program structure.
6. LEGO™ Mindstorms LEGOs™ are miniature plastic bricks, beams and connectors. Mindstorms adds components such as motors, servos, sensors, a microprocessor, and RoboLab programming software. This design set encourages creative invention and problem solving. One set comes with over 800 parts for designing and constructing unique robots that can be programmed to accomplish many different tasks. Participants were asked to follow the tutorial to build and program a vehicle that would autonomously navigate a prescribed course.
7. Feature Based Modeling Using parameters to control various geometric properties of an entity (i.e. height, width, depth, length, diameter, radius, etc.), feature-based modeling adds operations for the creation of “holes, fillets, chamfers, bosses, and pockets to be associated with specific edges and faces” of the entity (Marr, 1996, ¶ 5). When faces or edges are changed or regenerated, the original geometric relationships remain in tact. Participants were to complete Lab #1 – Creating Simple Parts, retrievable from http://courses.ncsu.edu/gc120/common/solidworks_labs.htm. Once completed, create and print a simple feature-based model in SolidWorks that could be used by teachers to introduce ninth grade students to feature-based modeling.
8. Animation TrueSpace is a freeform three dimensional modeling, rendering, and animation program. Participants were to review basic commands associated with TrueSpace animation software, and then go to http://www2.ncsu.edu:8010/scivis/modelprob.html to complete the animation tutorial for making a canon shoot a ball. Once familiarized with TrueSpace, participants were asked to make a table top with three marbles and have one marble animated to roll off the table within 45-60 frames or 1.5-3.0 seconds. They were to save the animation file as an .avi file with 75% compression, and use rendering commands to color the scenes.
Research Questions
Understanding how people think about solving problems related to emerging technologies will allow for enhancing current teaching methods and developing new ones. To determine this, three research questions were asked. When confronted with a new technology:
1. What do users perceive as the cause of the problem?

NCCTTE Journal Volume IX
35
2. What thinking processes were used to solve the problem? 3. What problem solving processes were used to solve the problem?
Instrumentation
V.W. DeLuca (1992) developed, tested and evaluated, and revised a Problem Solving Log over a period of 14 years. The instrument was developed based on the current research and theories of problem solving at that time. The validity of the instrument is supported by current research as cited in the following two sections. Problem Solving Process Problem solving is a process of resolving a known difficulty. Anderson (1980) emphasizes the processes undertaken during the act of problem solving by defining this behavior as goal directed sequence of operations-- an organized sequence of mental steps. Accordingly, several different problem-solving processes have been documented. Brightman (1981) discussed a process model first proposed by John Dewey in 1933. The three step process included the diagnosis phase, analysis phase, and solution phase. Other, more specific, models have been described by Bransford & Stein (1984), Devore (1987), Hatch (1988), Polya (1971), Seymour (1987), and Soloway (1988). Following are summaries of these problem-solving processes.
▪ Troubleshooting/Debugging: Isolate the problem, identify possible cause, test, implement solution, test solution
▪ Scientific Process: Observation, develop hypothesis, experimentation, draw conclusion ▪ Design Process: Ideation/brainstorm, identify possible solution, prototype, finalize design ▪ Research and Development: Conceptualize the project, select research procedure, finalize research design,
develop proposal, conduct research, analyze result, report result, evaluate research project ▪ Project Management: Identify project goal, identify tasks to reach the goal, develop a plan to accomplish
the tasks, implement the plan, and evaluate the plan The problem type determines the appropriate process to select and use. Therefore, the task of the problem solver is to select the best process for a given problem. To select from these processes, the problem solver must understand each process and how and when to use the appropriate one. Advanced problem solvers perceive the process of solving problems as a cycle and selected processes or subprocesses are used when needed. Thinking Skills The mental abilities needed to solve problems are not fully understood because of the many levels and integrations of knowledge sets that are manifested in the act of solving problems. In its simplest form, problem solving involves the application of recalled knowledge. Woods (1987) discusses the importance of a knowledge base pertinent to the content of the problem and further explains the value of the problem solver's ability to identify, locate, and evaluate missing information needed in the problem-solving process. These thinking skills, as they relate to technology education, may be classified as follows:
▪ Prior Technological Knowledge: Knowledge and skills gained from previous study in technology education class.
▪ Related Knowledge: Knowledge gained from classes other than technology education such as math and science.
▪ Knowledge Seeking: Ability to identify missing information, and locate and obtain relevant information. Higher order thinking skills involve the processing of knowledge in memory. In this respect, thinking is the process of changing knowledge. Comparing ordinary thinking and good thinking, Lipman (1988) uses terms such as estimating, evaluating, classifying, assuming, and hypothesizing to define good thinking. Similar thinking processes have been identified by Bloom (1956), Duke (1985), Feuerstein, Rand, Hoffman, & Miller (1980), and Kurfman & Cassidy (1977). Presseisen (1985) classified thinking skills in five categories that describe ways people mentally process knowledge to change its form and function.
1. Qualifications--finding unique characteristics: units of basic identity, definitions, facts, problem/task recognition.
2. Causations--establishing cause and effect, assessment: predictions, inferences, judgments, evaluations. 3. Transformation--relating known to unknown characteristics, creating meanings: analogies, metaphors,
logical inductions. 4. Relationships--Detecting regular operations: parts and wholes, patterns, analysis and synthesis, sequence
and order, logical deduction.

NCCTTE Journal Volume IX
36
5. Classification--determining common qualities: similarities and differences, grouping and sorting, comparisons, either/or distinctions. (p. 45)
The instrument consisted of a two page (one sheet printed two sides) check list that included the problem-solving process and thinking skill listed. Students were instructed to complete a form whenever a problem was encountered. Since problem solving processes and thinking skills were not mutually exclusive, students checked all that applied to the problem situation encountered.
Findings Overall results of the descriptive analyses, as collected with the Problem Solving Log, are presented by frequencies and percentages in Table 1. Data is representative of all groups of participants for all eight workstations. Data indicating about 50% or greater are indicated with bold typeface for emphasis.
Research Question One When participants encountered a problem they were asked to describe the specific task or event in which the problem took place. At that point, they identified their perception of the cause of the problem. Sixty-five percent of the time, participants primarily perceived the problem cause to originate from a lack of knowledge or understanding. Lack of technical skills was indicated 18% of the time, equipment problems 19%, and something other 11% of the time.
Research Question Two Three thinking processes and their respective subprocesses were gathering information (from manuals, instructor, classmates, or other), recalling relevant information (by brainstorming, relating or associating knowledge items, or other), and processing knowledge (by qualifying, analyzing, transforming, relating, and classifying). Two thinking processes were most indicated: Gathering information from manuals (50%); and processing knowledge by analysis (50%). Though indicated less than 50% of the time, brainstorming and relating or associating knowledge items were used 43% of the time to recall relevant information.
Research Question Three As previously discussed, six categories in the problem solving process were listed on the Problem Solving Log. Trial and error (49%) and troubleshooting (52%) were the two most used problem solving processes. Although recorded less than 50% of the time, it is worth noting that experimentation was indicated 27% of the time. Table 1. Overall Frequencies and percentages: Groups 1-5 and Work Stations 1-9.
Problem Solving Log Component Codes and Descriptions N=97
ƒ %
C1 Cause of the Problem Lack of knowledge/understanding 63 64.9
C2 Lack of technical skills 17 17.5
C3 Equipment Problem 18 18.6
C4 Other 11 11.3
Thinking Process
TPG1 Gather Information Manuals 48 49.5
TPG2 Instructor 26 26.8
TPG3 Classmates 25 25.8
NCCTTE Journal Volume IX
37
TPG4 Other 17 17.5
TPR1 Recalled Relevant Information Brainstorming 42 43.3
TPR2 Relating or associating knowledge items 42 43.3
TPR3 Other 14 14.4
TPP1 Processed knowledge Qualifying 22 22.7
TPP2 Analyzing 48 49.5
TPP3 Transforming 11 11.3
TPP4 Relating 30 30.9
TPP5 Classifying 6 6.2
PS1 Problem Solving Process Trial and Error 47 48.5
PS2 Troubleshoot/Debugg 50 51.5
PS3 Experiment 26 26.8
PS4 Design 8 8.2
PS5 Research and Development 2 2.1
PS6 Manage 6 6.2
Indications by Work Station The range of problems encountered at each work station varied by group. While previous knowledge is a factor in how people solve problems, it is clear that the eight emerging technologies provided different levels of complexity (Table 2). Some required greater levels of problem solving skills than others. For example, the manufacturer recommends that LEGO™ Mindstorms be used by those aged eight years or more. However, participants in this study (graduate students) encountered more problems (18) with this platform than any other, citing lack of knowledge/understanding as the cause of the problem. Likewise, participants cited problems with the Mastercam Milling (15) and the SCORBOT (15) workstations to be caused by lack of knowledge/understanding. While problems with the Feature Based Modeling and Animation work stations were perceived to be related to lack of knowledge/understanding, lack of technical skills was also significant. All cause and process data is reported in Table 3.
Table 2. Range of problems encountered for each station.
Workstation Range Total problems reported
Computer Numeric Control (CNC) Lathe 0-6 14
PSIM 2000 1-7 14
Mastercam Milling 2-5 15
VEX™ Robotics Design System 0-6 10

NCCTTE Journal Volume IX
38
SCORBOT 0-6 15
LEGO™ Mindstorms 1-8 18
Feature Based Modeling 0-2 4
Animation 0-2 3
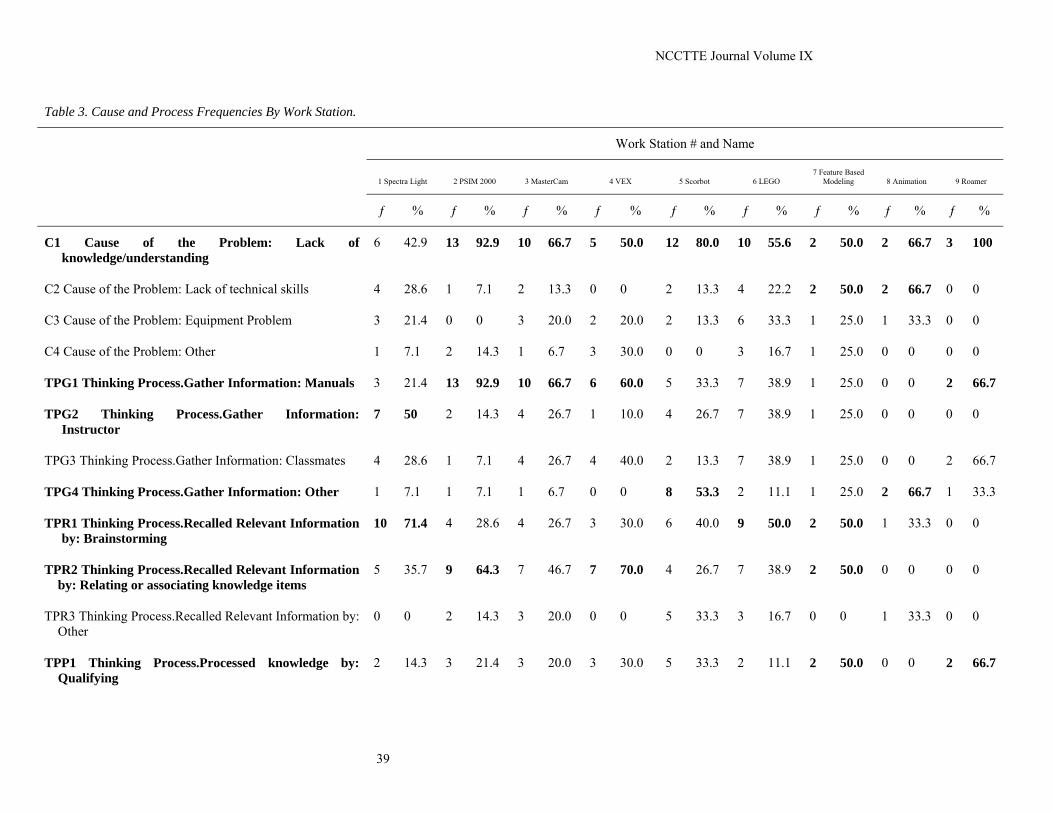
NCCTTE Journal Volume IX
39
Table 3. Cause and Process Frequencies By Work Station.
Work Station # and Name
1 Spectra Light 2 PSIM 2000 3 MasterCam 4 VEX 5 Scorbot 6 LEGO 7 Feature Based
Modeling 8 Animation 9 Roamer
ƒ % ƒ % ƒ % ƒ % ƒ % ƒ % ƒ % ƒ % ƒ %
C1 Cause of the Problem: Lack of knowledge/understanding
6 42.9 13 92.9 10 66.7 5 50.0 12 80.0 10 55.6 2 50.0 2 66.7 3 100
C2 Cause of the Problem: Lack of technical skills 4 28.6 1 7.1 2 13.3 0 0 2 13.3 4 22.2 2 50.0 2 66.7 0 0
C3 Cause of the Problem: Equipment Problem 3 21.4 0 0 3 20.0 2 20.0 2 13.3 6 33.3 1 25.0 1 33.3 0 0
C4 Cause of the Problem: Other 1 7.1 2 14.3 1 6.7 3 30.0 0 0 3 16.7 1 25.0 0 0 0 0
TPG1 Thinking Process.Gather Information: Manuals 3 21.4 13 92.9 10 66.7 6 60.0 5 33.3 7 38.9 1 25.0 0 0 2 66.7
TPG2 Thinking Process.Gather Information: Instructor
7 50 2 14.3 4 26.7 1 10.0 4 26.7 7 38.9 1 25.0 0 0 0 0
TPG3 Thinking Process.Gather Information: Classmates 4 28.6 1 7.1 4 26.7 4 40.0 2 13.3 7 38.9 1 25.0 0 0 2 66.7
TPG4 Thinking Process.Gather Information: Other 1 7.1 1 7.1 1 6.7 0 0 8 53.3 2 11.1 1 25.0 2 66.7 1 33.3
TPR1 Thinking Process.Recalled Relevant Information by: Brainstorming
10 71.4 4 28.6 4 26.7 3 30.0 6 40.0 9 50.0 2 50.0 1 33.3 0 0
TPR2 Thinking Process.Recalled Relevant Information by: Relating or associating knowledge items
5 35.7 9 64.3 7 46.7 7 70.0 4 26.7 7 38.9 2 50.0 0 0 0 0
TPR3 Thinking Process.Recalled Relevant Information by: Other
0 0 2 14.3 3 20.0 0 0 5 33.3 3 16.7 0 0 1 33.3 0 0
TPP1 Thinking Process.Processed knowledge by: Qualifying
2 14.3 3 21.4 3 20.0 3 30.0 5 33.3 2 11.1 2 50.0 0 0 2 66.7

NCCTTE Journal Volume IX
40
TPP2 Thinking Process.Processed knowledge by: Analyzing
8 57.1 4 28.6 7 46.7 6 60.0 7 46.7 11 61.1 2 50.0 1 33.3 1 33.3
TPP3 Thinking Process.Processed knowledge by: Transforming
2 14.3 0 0 0 0 3 30.0 0 0 4 22.2 0 0 0 0 2 66.7
TPP4 Thinking Process.Processed knowledge by: Relating
3 21.4 11 78.6 5 33.3 0 0 3 20.0 6 33.3 2 50.0 0 0 0 0
TPP5 Thinking Process.Processed knowledge by: Classifying
0 0 2 14.3 0 0 2 20.0 1 6.7 1 5.6 0 0 0 0 0 0
PS1 Problem Solving Process: Trial and Error 5 35.7 6 42.9 8 53.3 5 50.0 9 60.0 7 38.9 2 50.0 0 0 2 66.7
PS2 Problem Solving Process: Troubleshoot/Debugg 8 57.1 7 50.0 6 40.0 7 70.0 7 46.7 11 61.1 1 25.0 1 33.3 2 66.7
PS3 Problem Solving Process: Experiment 3 21.4 4 28.6 1 6.7 3 30.0 1 6.7 7 38.9 3 75.0 1 33.3 0 0
PS4 Problem Solving Process: Design 1 7.1 1 7.1 1 6.7 3 30.0 0 0 1 5.6 0 0 0 0 1 33.3
PS5 Problem Solving Process: Research and Development 1 7.1 0 0 0 0 0 0 1 6.7 0 0 0 0 0 0 0 0
PS6 Problem Solving Process: Manage 1 7.1 0 0 1 6.7 1 10.0 0 0 2 11.1 0 0 0 0 1 33.3

NCCTTE Journal Volume IX
41
Implications for teaching new technologies Several implications for technology education are disclosed as a result of this study. Namely that the number one cause of problems participants’ perceived was lack of knowledge/understanding. This indicates the importance of teaching what is needed for students to be successful. Students must learn how to solve problems. There are two approaches that can be taken to insure that students have the knowledge and skill background needed to succeed. The operational skill specific to each machine can be taught or the problem solving skills can be taught so students can learn the operational skills. One way to develop problem solving skills is to teach students how to solve problems then provide them with the opportunity to practice. Providing students with technological problem solving activities that involve troubleshooting and trial and error affords them opportunities to practice the problem solving process through hands-on experience. Teaching students to identify problems, gather information, recall relevant information, and process knowledge may assist in building the skills necessary for critical thinking and gaining confidence in problem solving abilities. Manuals were the medium of choice for participants when gathering information to solve identified problems. Often times, technical manuals are difficult to understand and use to carry out specific tasks. To ensure student success in problem solving activities, work station manuals, tutorials, and problem scenarios should be made relevant, age appropriate, and especially, kept up to date as the technology emerges. New information presented in this manner can maintain student interest. It may also encourage problem solving strategy transfer and promote realization of the applications to other content areas, such as math and science, and subsequently to real world problems in personal and professional situations.
Recommendations The results of this study indicate several opportunities for problem solving curriculum development and further research. First, adding a qualitative component to the research design and methodology will enhance the data analysis. Better insight could be provided by observing and interviewing participants while the problem solving task is in progress. Furthermore, it should be determined whether perceptions of problem causes and the processes used to solve problems have changed as technologies have emerged and become more complicated. This information would be beneficial for forecasting scenarios with which students will learn to solve problems. However, before problem solving curriculum development can begin, this research should be continued across content areas at the various levels of education. To develop relevant, age appropriate and up to date manuals, tutorials, and problem scenarios for emerging technologies, data should be collected and compared. Workstation comparisons, as in Table 3, can assist researchers in determining which tools could best be used to teach troubleshooting, trial and error, and experimentation procedures and strategies in learning new technologies.
References
Anderson, J. (1980). Cognitive psychology and its implications. San Francisco: W.H. Freeman & Co. Anderson, L.W., & Krathwohl, D.R. (2001). A taxonomy for learning, teaching, and assessing: A revision. NY:
Addison Wesley Longman, Inc.
NCCTTE Journal Volume IX
42
Andre, T. (1986). In Phye, G.D., & Andre, T. (Eds.). (1986). Cognitive classroom learning: Understanding, thinking, and problem solving. Orlando: Academic Press, Inc., Harcourt Brace Jovanovich, Publishers.
Baker, G.E., & Dugger, J.C. (1986). Helping students develop problem solving skills. The Technology Teacher,
45(4), 10-13. Berkemer, Robert Allen. (1989). Evaluating the effectiveness of a design course in teaching creative problem
solving. Unpublished Doctoral Dissertation, University of Minnesota. Bjorklund, D.F., Muir-Broaddus, and Schneider.(1990). The role of knowledge in the development of strategies. In
Bjorklund, D.F. (Ed.). (1990). Children's strategies: Contemporary views of cognitive development. Hillsdale, New Jersey: Lawrence Erlbaum Associates, Inc.
Bloom, B.S. (Ed.). (1956). Taxonomy of educational objectives: The classification of educational goals. Handbook
I: Cognitive Domain. NY: David McKay Company, Inc. Bransford, J., & Stein, B. (1984). The ideal problem solver: A guide for improving thinking, learning, and creativity.
San Francisco: W.H. Freeman. Brightman, H.J. (1981). Problem solving: A logical and creative approach. Atlanta: Business Publication Division,
College of Business Administration. Brusic, S.A. (1991). Determining effects on fifth grade students' achievement and curiosity when a technology
education activity is integrated with a unit in science. Unpublished Doctoral Dissertation, Virginia Tech, Blacksburg, Virginia.
CNC Software, Inc. (2007). Mastercam. You’ve got the power. Retrieved March 23, 2007 from
http://www.mastercam.com/Products/Mill/MillX2lorez.pdf Charles, R., & Lester, F. (1982). Teaching Problem Solving: What, Why & How. Palo Alto, CA: Dale Seymour
Publications. Cohen, J. (1971). Thinking. Chicago: Rand McNally & Company. Custer, R.L. (1995). Examining the dimensions of technology. International Journal of Technology and Design
Education, 5: 219-244. Custer, R.L. (1999, September). Design and problem solving in technology education. National Association of
Secondary School Principals (NASSP) Bulletin, 83(608), 24-33. Custer, R.L., Valesey, B.G. and Burke, B.N. (2001). An assessment model for a design approach to technological
problem solving. Journal of Technology Education, 12(2), 5-20). Davis, M., Hawley, P. McMullan, & B. Spilka, G. (1997). Design as a catalyst for learning. Alexandria, VA:
Association for Supervision and Curriculum Development. de Bono, E. (1972). Children Solve Problems. London: Allen Lane The Penguin Press. Deluca, V.W. (1992). The problem solving log. Unpublished manuscript. Devore, P. (1987). A perspective for technical research. In E. Israel & R. Wright (Eds.), Conducting technical
research. Mission Hills, CA: Glencoe Publishing Co. Duke, L.E. (1985). Seven cardinal principles for teaching higher-order thinking. The Social Studies, 76(3), 129-132.
NCCTTE Journal Volume IX
43
Feuerstein, R., Rand, Y., Hoffman, M., & Miller, R. (1980). Instructional enrichment. Baltimore: University Park.
Gagné, R.M. (1977). The conditions of Learning (3rd
edition). NY: Holt, Rinehart and Winston. Halfin, H.H. (1973). Technology: A process approach. Unpublished Doctoral Dissertation, West Virginia
University, Morgantown. WV.
Hatch, L. (1988). Problem solving approach. In Kemp, W.H., & Schwaller, A.E. (Eds.). (1988). The 37th
Yearbook of the Council on Technology Teacher Education. Instructional strategies for technology education. Mission Hills, CA: Glencoe Publishing Company.
Hein, G.E. (1987, October). The right test for hands-on learning? Science and Children, October, 1987, pp. 8-12. Hill, C.C. (1979). Problem solving: Learning and teaching. An annotated bibliography. NY: Nichols Publishing . Hill, R.B., & Wicklein, R.C. (1999). A factor analysis of primary mental processes for technological problem
solving. Journal of Industrial Teacher Education, 36(2). Retrieved February 24, 2002, from http://scholar.lib.vt.edu/ejournals/JITE/v36n2/hill.html
Hutchinson, J. and Hutchinson, P. (1991). Process-based technology education. The Technology Teacher, 50(8), 3-7. Hutchinson, J. and Karsnitz, J. (1994). Design and problem solving in technology. Peoria, IL: Delmar. Hutchinson, J. and Hutchinson, P. (1991). Process-based technology education. The Technology Teacher, 50(8), 3-7. Hutchinson, J. and Karsnitz, J. (1994). Design and problem solving in technology. Peoria, IL: Delmar. International Technology Education Association. (2000). Standards for technological literacy: Content standards for
the study of technology. Reston, VA: Author. Johnson, J.R. (1989). Project 2061, Technology: Report of the Project 2061™ Phase I Technology Panel.
Washington, D.C.: The American Association for the Advancement of Science, Inc. Johnson, S.D. (1996). Technology education as the focus of research. The Technology Teacher, 55(8), 47-49. Johnson, S.D. (1994). Research on problem solving: What works, what doesn't. The Technology Teacher, 53(6), 27. Jonassen, D.H. (2004). Learning to solve problems: An instructional design guide. San Francisco, CA: Pfeiffer: A
Wiley Imprint. Kurfman, D., & Cassidy, E. (1977). Developing decision-making skills. Arlington, VA: The National Council for
the Social Studies.
Lawson, Bryan (1990). How Designers Think, 2nd
edition. London: Butterworth Architecture. Lipman, M. (1988). Critical thinking -- What can it be? Educational Leadership, 46(1), 38-43. Lodermeier, W.D. (1989, August). Perceptions and identification of problem solving: activities in secondary
industrial arts and technology education programs in Montana. Unpublished Masters’ Thesis: Montana State University.
Maley, D. (1986). Research and experimentation in technology education: Problem-solving and decision-making in
the technology laboratory. Reston, VA: International Technology Education Association.

NCCTTE Journal Volume IX
44
Marr, G. (1996). Feature Based Modeling. . Retrieved April 10, 2007 from
http://alum.wpi.edu/~gregm/thesis/node11.html Miller, G.A. (2004). WordNet: A lexical database for the English language. Retrieved April 5, 2004 from the
Princeton University Cognitive Science Laboratory web site: http://wordnet.princeton.edu/index.shtml Newell, A. and Simon, H.A. (1972). Human problem solving. Englewood Cliffs, N.J.: Prentice-Hall, Inc. Polya, G. (1971). How to solve it. Princeton: Princeton University Press. Presseisen, B.Z. (1985). Thinking skills: Means and models. In Arthur L. Costa (Ed.), Developing minds: A
resource book for teaching thinking. Alexandria, VA: Association for Supervision and Curriculum Development.
Pucel, D.J. (1995). Developing technological literacy: A goal for technology education. The Technology Teacher,
55(3), 35-43. Savage, E. and Sterry, L. (1990). A conceptual framework for technology education. Reston, VA: International
Technology Education Association. Saxena, M. (1983). Children: Voyage into problem space. New Delhi: Shakti Malik, Abhinav Publications. Seymour, R.D. (1987). A model of the technical research project. In E. Israel & R. Wright (Eds.), Conducting
technical research. Mission Hills, CA: Glencoe Publishing Co. Siegler, R.S., & Jenkins, E. (1989). How children discover new strategies. Hillsdale, New Jersey: Lawrence
Erlbaum Associates, Inc. Soden, R. (1994). Teaching problem solving in vocational education. London: Routledge. Soloway, A. (1988). Do you know what your children are learning? In R. Nickerson (Ed.), Technology in education:
Looking toward 2020. Hillsdale, NJ: Lawrence Erlbaum Associates. Tidewater Technology Associates. (1986). Problem-solving: Why learn about problem solving? The Technology
Teacher, 46(2), 15-22. Todd, R.D. (1990). The teaching and learning environment. The Technology Teacher, 50(3), 3-7. Waetjen, W.B. (1989). Technological problem solving: A proposal. Technology Education Advisory Council.
Reston, VA: International Technology Education Association. Wicklein, R.C. (1986). The effects of learning styles and instructional sequencing of program controlled and learner
controlled interactive video programs on student achievement and task completion rates (Locus-of-Control) (Doctoral dissertation, Virginia Polytechnic Institute and State University, 1986). Dissertation Abstracts Online, 47, 10A, (1986): 3740.
Woods, D.R. (1987). How might I teach problem solving? In James Stice (Ed.), Developing critical thinking and
problem solving abilities. San Francisco: Jossey Bass Inc. Wright, R.T., Israel, E.N. and Lauda, D.P. (1993). Teaching technology: A teacher's guide. Reston, VA:
International Technology Education Association. Yi, Sangbong. (1996). Problem solving in technology education at the secondary level as perceived by technology
educators in the United Kingdom and the United States. Unpublished Doctoral Dissertation, The Ohio State University. Dissertation Abstracts Online Accession No: AAG971069
NCCTTE Journal Volume IX
45
Effects of Instructional Presentation On Dominant Preferred Learning Styles
Jeremy V. Ernst Aaron C. Clark
North Carolina State University
Abstract - The objective of this study is to identify changes in dominant preferred learning styles of students based on instructional presentation of course content. This study evaluates dominant preferred learning styles of two groups of university students. The first group of students is enrolled in a course that introduces graphical representation. In this course, information is primarily conveyed to students through visual-based demonstration. The second group of students is enrolled in a course focusing on materials processing. Course content is reiterated to students through laboratory discovery experiences in materials testing and construction of multi-material projects. Students’ dominant preferred learning styles are evaluated with the VARK Questionnaire and categorized as visual, aural, reading, or kinesthetic. The VARK Questionnaire is distributed to both student groups before the onset of instruction. The VARK Questionnaire is distributed once more to student groups at the midterm of each course. Changes in dominant preferred learning styles of students are evaluated. Cross group comparisons are made to identify variations in dominant preferred learning styles provided through the two instructional approaches. Introduction
Learning preferences and patterns of students’ relationships to instructional practices
have been topics of wide debate spanning from the late 1970’s. Prior to this time, the bulk of
student learning research focused primarily on cognitive processing strategies and motivation
(Vermunt and Vermetten, 2004). While associations between student successes and cognitive
and motivational strategies have been made (Curran and Smith, 2005; Fuhler, Farris, and Nelson,
2006; Komarchuk, Swenson, and Warkocki, 2000; Soares, Lemos, and Almeida, 2005),
researchers continue to argue the relationships between student learning preference and

NCCTTE Journal Volume IX
46
instructional approach. The learning style and instructional approach theme has continuing
regard despite the lack of supporting evidence and research in the areas (Stahl, 1999).
Just as students have preferred ways of learning, university faculty have preferred ways
of teaching. Student learning styles often form the encounters that students have with faculty.
Learning styles are shaped by experiences; consequently, instructional approaches can further
shape the learning styles of students (Grasha, 2002). Course designs are generally structured to
appeal to varied senses for the acquisition of information. However, it is inherent that certain
content will call for a focused instructional approach that does not proportionally appeal to
sensory channels. Fleming and Mills (1992), conclude through longitudinal observations that the
“most realistic approach to the accommodation of learning styles in teaching programs should
involve empowering students through knowledge of their own learning styles to adjust their
learning behavior to the learning programs they encounter.” Presented with the statements and
findings from Grasha (2002), Fleming and Mills (1992), and lack of research and supporting
evidence cited by Stahl (1999), further research is needed to identify changes in learning styles
of students based on instructional presentation of course content. To address this identified need,
a study on effects of instructional presentation on dominant preferred learning styles in
university students was conducted.
Methodology
In the spring semester of 2007, two groups of North Carolina State University students
were selected to participate in a research preferred learning style study. The first group of
students was enrolled in a course that introduces graphical representation. Course competencies
are based on generating solutions for 2D and 3D spatial problems. Information is primarily

NCCTTE Journal Volume IX
47
conveyed to students through a visual-based demonstration approach where the instructor
provides an overview of the fundamentals and applications of computer graphics and computer-
aided design. The second group of students was enrolled in a course focusing on materials
processing. This course introduces the students to basic content and skills needed to process
common materials and produce functional products using woods, metals, plastics, and composite
materials. This course also includes laboratory safety, use of hand tools, and operation of
machinery. Course content is reiterated to students through laboratory discovery experiences in
materials testing and construction of multi-material projects.
The VARK Questionnaire and the demographics survey were distributed to the
instructors of the visual-based demonstration course and the hands-on materials testing and
construction course. Both instructors administered the VARK Questionnaire and demographics
survey to their students, where they were informed that they were not required to take the
questionnaire and survey. The willing student participants completed the VARK Questionnaire
and the demographics survey, which takes approximately 5-7 minutes. The VARK
Questionnaire and demographics survey were collected by the instructor and returned to the
researchers in a sealed envelope.
The VARK Questionnaire and the second round demographics survey was distributed
once more to student groups at the midterm of each course. The second round demographics
survey was an abbreviated form of the original demographics survey. The purpose of altering
the instrument was to reduce the acquisition and entry of duplicate information. Both instructors
administered the VARK Questionnaire and the second round demographics survey to their
students, and they were once again informed that they were not required to take the questionnaire
and survey. The willing student participants completed the VARK Questionnaire and

NCCTTE Journal Volume IX
48
demographics survey, and they were again collected by the instructor and returned to the
researchers in a sealed envelope. Both rounds of preferred learning style data and demographics
information for the two groups were entered and analyzed for differences and associations.
VARK Questionnaire
The VARK Questionnaire is used in this study to assess learning preferences of
university students. The questionnaire is employed to determine if the students’ dominant
preferred learning styles are visual, aural, read/write, or kinesthetic. Fleming (1995) identifies
visual learners, coded with “V” by the VARK Questionnaire, as those who prefer information to
appear in the form of graphs, charts, and flow diagrams. The most familiar method for
information transfer in our society is speech. Speech is recognized through hearing and is
consequently coded as aural (A) by the VARK questionnaire. The outcomes for other
respondents could reveal a partiality for accessing information from written words. Respondents
with these questionnaire outcomes are coded read/writers (R) since they use reading and writing
as their primary preference for information acquisition. The final group in the four-component
typology is composed of learners who would rather experience learning by using all their senses,
including touch, hearing, smell, taste and sight. This group is commonly depicted in literature as
kinesthetic (K) learners. They desire tangible, multi-sensory experiences in their learning.
The VARK Questionnaire is composed of 16 questions that assist in identifying preferred
learning styles. Participants are directed to choose the answer that best explains their preference
and circle the letter(s) beside it (Fleming, 2006). If any single answer does not match their
perception, then the participant is asked to circle more than one answer. Also, participants are
permitted to leave blank any question that does not apply. Once participants have completed the

NCCTTE Journal Volume IX
49
VARK Questionnaire, they are to use the marking guide found on the last page of the
questionnaire. The scoring chart is completed by circling the letter V, A, R, or K in the column
that corresponds to the answer selection on the questionnaire. Once the scoring chart is
completed, participants calculate their scores by totaling the number of Vs, As, Rs, and Ks.
Demographical Information
The two groups in this study are composed of 53 university student participants. The two
groups represent a variety of majors ranging from engineering to education. The 53 participants
are predominately male. The study only has only three female participants, two in the visual-
based instruction group and one in the hands-on materials testing and construction group. The
majority of the students in the visual-based instruction group are ages 18-20 (90%) and report
their academic levels as either freshman or sophomore (95%). Refer to Table 1 for further
gender, age and academic level breakdown of the visual-based instruction group.
Table 1: Gender, Age, and Academic Level for Visual-Based Instruction Group
Gender
Age
Academic Level Male - 95% 18 or less - 54% Freshman - 65% Female - 5% 19-20 - 36% Sophomore - 30%
21-22 - 5% Junior - 5% 23-24 - 5% Senior - 0% 25 or more - 0% Graduate - 0%
The hands-on materials testing and construction group represents a broader variety of
student ages and academic levels. Collectively, participants in group two appear to be slightly
older than the visual-based instruction group and have higher academic classification levels.
Refer to Table 2 for further gender, age and academic level breakdown of the hands-on materials
testing and construction group.

NCCTTE Journal Volume IX
50
Table 2: Gender, Age, and Academic Level for Hands-On Materials Testing and Construction Group
Gender
Age
Academic Level
Male - 94% 18 or less - 19% Freshman - 25% Female - 6% 19-20 – 44% Sophomore - 19%
21-22 -37% Junior - 19% 23-24 - 0% Senior - 37% 25 or more - 0% Graduate - 0%
Data Analysis
Several statistical procedures were used to evaluate preferred learning styles of the two
groups of students’ pre instruction and post instruction. The principal research question for this
study is: Does instructional presentation style have a measurable effect on the dominant
preferred learning styles of university students? The VARK Questionnaire results indicate that
before the onset of instruction the visual-based instruction group has fairly evenly distributed
preferred learning style ratings with a slight kinesthetic learning preference (Table 3). Similarly,
the VARK questionnaire ratings after instruction has occurred present a slight kinesthetic
learning preference (Table 4).
Table 3: Preferred Learning Style Pre Treatment Ratings for Visual-Based Instruction Group
Learning Style Percentage Visual 22% Aural 24%
Reading 22% Kinesthetic 32%
Table 4: Preferred Learning Style Post Treatment Ratings for Visual-Based Instruction Group
Learning Style Percentage
Visual 24%

NCCTTE Journal Volume IX
51
Aural 23% Reading 20%
Kinesthetic 33%
Much like the visual-based instruction group, the VARK Questionnaire results indicate
that, before the beginning of instruction, the hands-on materials testing and construction group
has fairly evenly distributed preferred learning style ratings with a slight kinesthetic learning
preference (Table 5). Similarly, the VARK questionnaire ratings after instruction has occurred
present a slight kinesthetic learning preference (Table 6).
Table 5: Preferred Learning Style Pre Treatment Ratings for Hands-On Materials Testing and Construction Group
Learning Style Percentage
Visual 26% Aural 24%
Reading 18% Kinesthetic 32%
Table 6: Preferred Learning Style Post Treatment Ratings for Hands-On Materials Testing and Construction Group
Learning Style Percentage
Visual 26% Aural 19%
Reading 23% Kinesthetic 32%
Hypothesis tests were conducted to provide greater insight of instructional presentation
style and its effect on the dominant preferred learning styles of the university student
participants. Prior to the analysis, eight null hypotheses were formed: 1) There is no change in
student visual learning preference when exposed to visual-based demonstration; 2) There is no
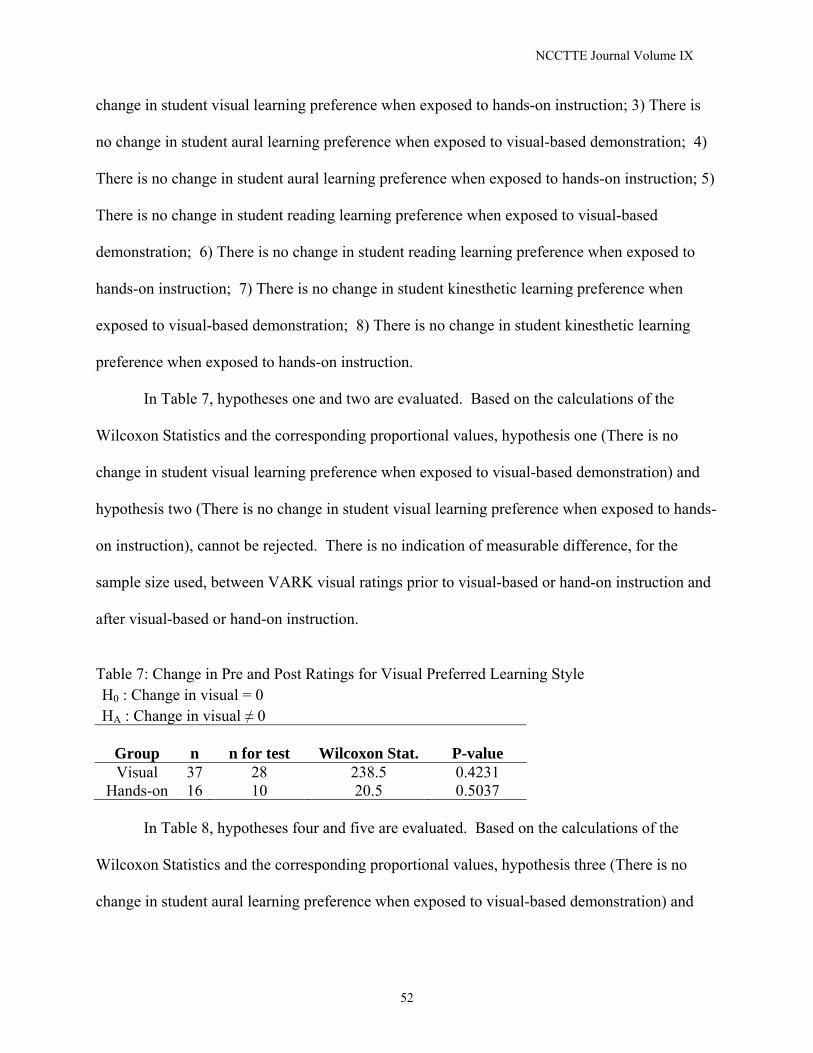
NCCTTE Journal Volume IX
52
change in student visual learning preference when exposed to hands-on instruction; 3) There is
no change in student aural learning preference when exposed to visual-based demonstration; 4)
There is no change in student aural learning preference when exposed to hands-on instruction; 5)
There is no change in student reading learning preference when exposed to visual-based
demonstration; 6) There is no change in student reading learning preference when exposed to
hands-on instruction; 7) There is no change in student kinesthetic learning preference when
exposed to visual-based demonstration; 8) There is no change in student kinesthetic learning
preference when exposed to hands-on instruction.
In Table 7, hypotheses one and two are evaluated. Based on the calculations of the
Wilcoxon Statistics and the corresponding proportional values, hypothesis one (There is no
change in student visual learning preference when exposed to visual-based demonstration) and
hypothesis two (There is no change in student visual learning preference when exposed to hands-
on instruction), cannot be rejected. There is no indication of measurable difference, for the
sample size used, between VARK visual ratings prior to visual-based or hand-on instruction and
after visual-based or hand-on instruction.
Table 7: Change in Pre and Post Ratings for Visual Preferred Learning Style H0 : Change in visual = 0 HA : Change in visual ≠ 0
Group n n for test Wilcoxon Stat. P-value Visual 37 28 238.5 0.4231
Hands-on 16 10 20.5 0.5037
In Table 8, hypotheses four and five are evaluated. Based on the calculations of the
Wilcoxon Statistics and the corresponding proportional values, hypothesis three (There is no
change in student aural learning preference when exposed to visual-based demonstration) and
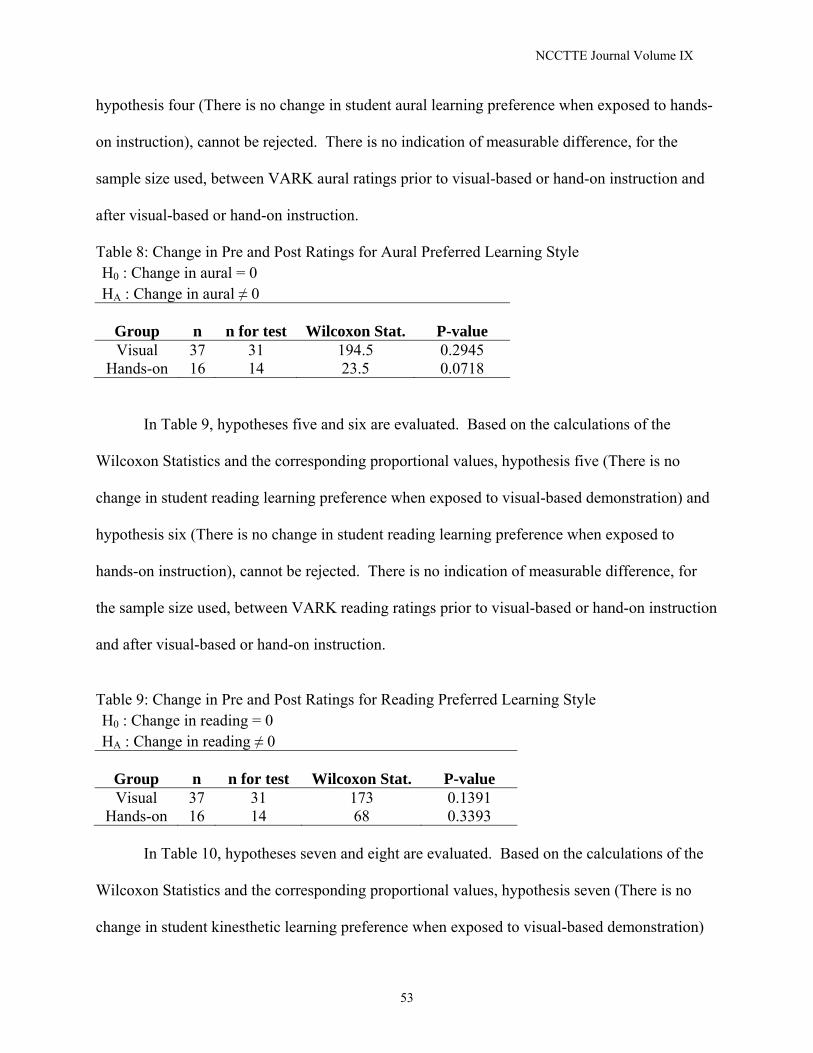
NCCTTE Journal Volume IX
53
hypothesis four (There is no change in student aural learning preference when exposed to hands-
on instruction), cannot be rejected. There is no indication of measurable difference, for the
sample size used, between VARK aural ratings prior to visual-based or hand-on instruction and
after visual-based or hand-on instruction.
Table 8: Change in Pre and Post Ratings for Aural Preferred Learning Style H0 : Change in aural = 0 HA : Change in aural ≠ 0
Group n n for test Wilcoxon Stat. P-value Visual 37 31 194.5 0.2945
Hands-on 16 14 23.5 0.0718
In Table 9, hypotheses five and six are evaluated. Based on the calculations of the
Wilcoxon Statistics and the corresponding proportional values, hypothesis five (There is no
change in student reading learning preference when exposed to visual-based demonstration) and
hypothesis six (There is no change in student reading learning preference when exposed to
hands-on instruction), cannot be rejected. There is no indication of measurable difference, for
the sample size used, between VARK reading ratings prior to visual-based or hand-on instruction
and after visual-based or hand-on instruction.
Table 9: Change in Pre and Post Ratings for Reading Preferred Learning Style H0 : Change in reading = 0 HA : Change in reading ≠ 0
Group n n for test Wilcoxon Stat. P-value Visual 37 31 173 0.1391
Hands-on 16 14 68 0.3393
In Table 10, hypotheses seven and eight are evaluated. Based on the calculations of the
Wilcoxon Statistics and the corresponding proportional values, hypothesis seven (There is no
change in student kinesthetic learning preference when exposed to visual-based demonstration)

NCCTTE Journal Volume IX
54
and hypothesis eight (There is no change in student kinesthetic learning preference when
exposed to hands-on instruction), cannot be rejected. There is no indication of measurable
difference, for the sample size used, between VARK kinesthetic ratings prior to visual-based or
hand-on instruction and after visual-based or hand-on instruction.
Table 10: Change in Pre and Post Ratings for Kinesthetic Preferred Learning Style H0 : Change in kinesthetic = 0 HA : Change in kinesthetic ≠ 0
Group n n for test Wilcoxon Stat. P-value Visual 37 27 215.5 0.5299
Hands-on 16 14 47 0.7519
Additionally, two correlation matrixes were developed from calculated change in VARK
pretest and posttest ratings to show how strongly each preferred learning style is related, given
the visual-based demonstration method of instruction for group one and the hands-on materials
testing and construction method of instruction for group two. Based on the correlation
coefficients in the matrix (Table 11), there are no preferred learning style ratings that indicate a
strong relationship in group one. The strongest relationship is noted between aural and
kinesthetic preferred learning styles (r = 0.356). Other preferred learning styles in the VARK
rating of the visual-based demonstration group, such as aural and reading (r = 0.271), visual and
reading (r = 0.239), and visual and aural, show minimal relationships.
Table 11. Correlation Matrix for VARK Rating of the Visual-based Demonstration Group
V-Change A-Change R-change A-Change 0.203 R-change 0.239 0.271 K-change 0.064 0.356 0.075
Based on the correlation coefficients in the matrix (Table 12), there are numerous
preferred learning style ratings that indicate relationship in group two. The strongest
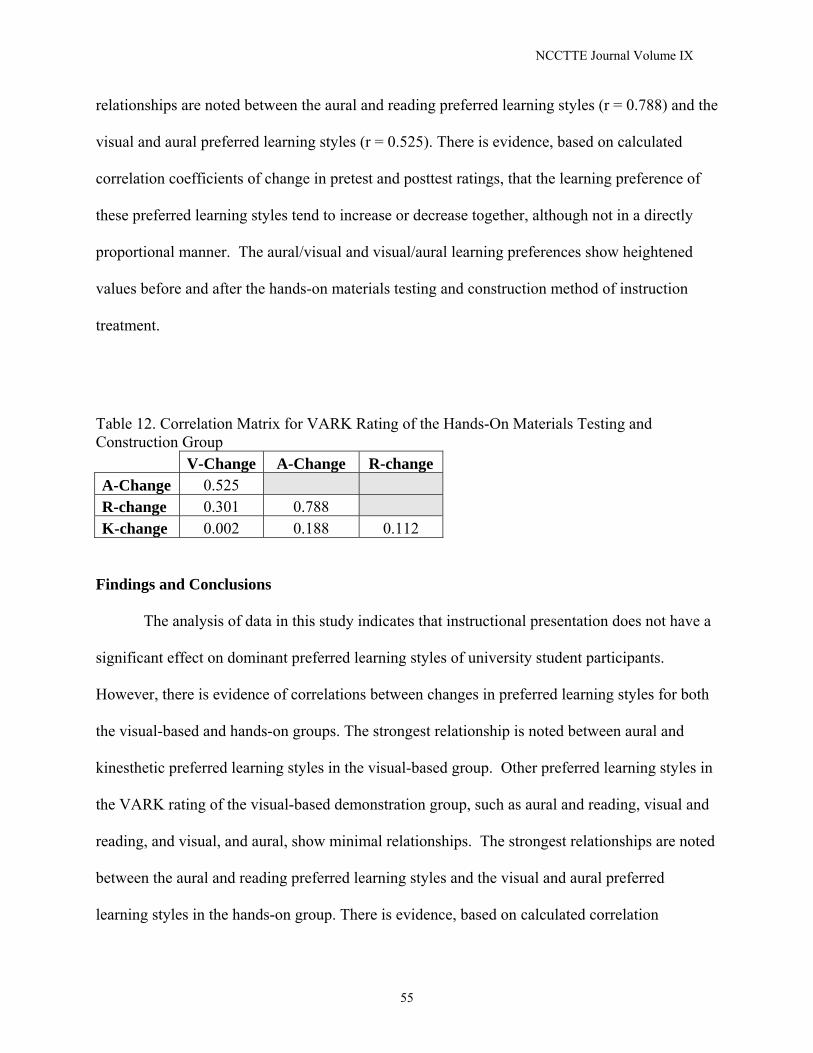
NCCTTE Journal Volume IX
55
relationships are noted between the aural and reading preferred learning styles (r = 0.788) and the
visual and aural preferred learning styles (r = 0.525). There is evidence, based on calculated
correlation coefficients of change in pretest and posttest ratings, that the learning preference of
these preferred learning styles tend to increase or decrease together, although not in a directly
proportional manner. The aural/visual and visual/aural learning preferences show heightened
values before and after the hands-on materials testing and construction method of instruction
treatment.
Table 12. Correlation Matrix for VARK Rating of the Hands-On Materials Testing and Construction Group
V-Change A-Change R-change A-Change 0.525 R-change 0.301 0.788 K-change 0.002 0.188 0.112
Findings and Conclusions
The analysis of data in this study indicates that instructional presentation does not have a
significant effect on dominant preferred learning styles of university student participants.
However, there is evidence of correlations between changes in preferred learning styles for both
the visual-based and hands-on groups. The strongest relationship is noted between aural and
kinesthetic preferred learning styles in the visual-based group. Other preferred learning styles in
the VARK rating of the visual-based demonstration group, such as aural and reading, visual and
reading, and visual, and aural, show minimal relationships. The strongest relationships are noted
between the aural and reading preferred learning styles and the visual and aural preferred
learning styles in the hands-on group. There is evidence, based on calculated correlation

NCCTTE Journal Volume IX
56
coefficients of change in pretest and posttest ratings, that the learning preference of these
preferred learning styles tend to increase or decrease together, although not in a directly
proportional manner.
The strategies, techniques, and approaches that the instructors in this study used to
facilitate learning within the visual-based and hands-on groups do not appear to be significantly
influential when it comes to learning preference. The age of the students could be a contributing
factor. Younger students may be heavily influenced by instructional approach, as opposed to
older students who have solidly formed their learning preferences. Given this possibility,
additional research is needed to evaluate the influence that instructors have on his or her
students, especially in lab-based courses.
A learning assessment is recommended to compare actual learning style to preferred
learning style within the same types of content, visual-based graphics and hands-on materials
testing and construction. It is recommended that stratification be utilized to include more female
participants. For future research at the post-secondary level, graduate students can be included to
provide a greater variety of age ranges and educational experiences. Differences in student
participants need to be controlled to provide for comparison of like samples. For example, the
visual-based student participants come from a variety of colleges and majors at North Carolina
State University while the hands-on student participants primarily come from the College of
Education and are majoring in Technology Education.
The debate of preferred learning styles and instructional approaches is ongoing (She,
2005). Further preferred and actual learning style research is recommended based on gender,
background, educational level, and cultural influence.

NCCTTE Journal Volume IX
57
Resources Curran, MJ. and Smith, E.C. (2005). The Imposter: A motivational strategy to encourage
reading in adolescents. Journal of Adolescent and Adult Literacy. 49(3), 186-190. Fleming, N.D. (1995). I'm different; not dumb. Modes of presentation (VARK) in the tertiary
classroom, in Zelmer,A., (ed.) Research and Development in Higher Education, Proceedings of the 1995 Annual Conference of the Higher Education and Research Development Society of Australasia (HERDSA),HERDSA, Volume 18, pp. 308 – 313.
Fleming, N.D. (2006). VARK: A guide to learning styles. Retrieved March 24, 2007, from
http://www.vark-learn.com/english/page.asp?p=advice Fuhler, C.J., Farris, P.J., and Nelson, P.A. (2006). Building literacy skills across the curriculum:
Forging connections with the past through artifacts. Reading Teacher, 59(7), 14. Grasha, A. F. (2002). Teachingw ith style: A practical guide to enhancing learning by
understanding teaching and learning styles. Pittsburgh, PA: Alliance. Komarchuk, N., Swenson, A., and Warkocki, L. (2000). Improving secondary student academic
success through the implementation of motivational strategies. Chicago: IL: Action Research Project. (ERIC Document Reproduction Service No. ED 444087).
She, H. (2005). Promoting students’ learning of air pressure concepts: The interrelationship of
teaching approaches and student learning characteristics. The Journal of Experimental Education. 44(1), 29-51.
Soares, I., Lemos, M.S. and Almeida, C. (2005). Attachment and motivational strategies in
adolescence: Exploring links. Adolescence San Diego. 40(157), 129-165. Stahl, S. A. (1999). Different strokes for different folks? A critique of learning styles. American
Educator, 23(3), 27–31.

NCCTTE Journal Volume IX
58
Going Wiki in Online Technology Education Courses:
Promoting Online Learning and Service Learning through Wikis
Pam Carpenter and
Edward Roberts
North Carolina State University
Abstract Online learning continues to grow at an exponential rate with more institutions offering courses and degree programs for students. The flexibility and convenience of online courses are attractive components for potential students who may not have other educational opportunities available. Technology Education is a program that involves both collaborative and kinesthetic learning opportunities for students, yet with online learning students may be limited in opportunities to connect with other students and the opportunity to gain valuable hands-on experience. Wikis may be the beginning of a way to offer a collaborative learning opportunity for online Technology Education students while incorporating the component of service learning. A survey of North Carolina State University Technology Education graduate students reveals some interesting insights about the possibilities of using wikis in online Technology Education programs and courses.
Online education and experiential learning
Online learning provides educational opportunities for students distanced by time and geographic constraints to enroll in courses that may not be available in a traditional classroom setting. Online learning offers the flexibility and convenience for students who may be constrained by work, other responsibilities, and travel time to enroll in traditional on-campus courses and programs. Academic institutions are offering more courses and programs online, but online education has yet to reach a plateau according to a study conducted by the Allen and Seaman, (2004) in their report released by the Sloan Consortium 2002-03. According to the study, there are some significant statistical data predicting the continued growth of online education.
• Over 1.9 million students were studying online in the fall of 2003. • Schools expect the number of online students to grow to over 2.6 million by the fall of 2004. • Schools expect online enrollment growth to accelerate — the expected average growth rate for online
students for 2004 is 24.8%, up from 19.8% in 2003. • The majority of all schools (53.6%) agree that online education is critical to its long-term strategy. • The larger the institution, the more likely it believes that online education is critical. • Three quarters of all academic leaders believe that online learning quality will be equal to or superior to
face-to-face instruction in three years. (Allen et al., 2004, pp. 6-7).
Educational institutions are responding to the changes by offering online versions of a number of traditional campus-based programs and in some cases creating a virtual campus (Hiltz, 1993). While much attention has been given to the quality of online courses or components of courses, much less focus has been given to the evaluation of online degree programs as a whole. Past research has compared online learning to face-to-face learning (Hoben, Neu, & Castle, 2002), explored the effectiveness of online tools such as discussion boards and chat rooms (Spatariu, Hartley, & Bendixen, 2004), assessed interactive aspects of courses (Roblyer & Ekhaml, 2000), addressed evaluating effective online instruction (Graham, Cagiltay, Lim, Craner, & Duffy, 2001; Wentling & Johnson, 1999), and assessed the value of online courses in specific fields of study (Carmichael, 2001; McMaster, 2002). There have also been articles concerning the success or failure of a variety of
NCCTTE Journal Volume IX
59
technologies used in this environment (Feldman, 2002; Smith, 1998) and administrative control processes (Dobbs & Allen, 2004).
Online learning is becoming much more prevalent in the delivery of course material, but it must be interactive and dynamic in order to retain students in online programs and for students to engage in a meaningful learning experience. Palloff and Pratt (2005) support this claim with their collaborative learning model, which is comprised of the elements of presence, collaboration, reflective/transformative learning, technology, social constructivism, and interaction/communication that shape collaboration and a sense of community. Online learning may also be referred to as e-learning. Experiential learning is the process of actively engaging students in the learning process that will have real life consequences and fosters student reflection upon the experience which may lead to new attitudes, skills, and approaches to thinking about a topic (Stevens & Richards, 1992). Service learning is a form of experiential learning in which students apply what they are learning in the classroom to address community issues and concerns. Bonnette (2006) asserts that service learning involves teaching real world concepts and skills along with providing an opportunity to connect students, teachers, and community members in service projects that focus on community needs. As the demand for online courses increases, there is a need to involve students in learning experiences that will foster service learning.
Flowers (2001) suggests the greatest need in online Technology Education programs was to
provide degree programs at the master’s level, doctoral level, and continuing education credit. An issue concerning taking an online course was there would be little interaction with instructors and peers resulting in an impersonal approach while an attraction to online education was the sense of convenience in both the flexibility of schedules and decreased travel time to a campus location. Enter the wikis in e-learning and service learning where student collaboration can be fostered and encouraged through shared learning experiences across space and time. What’s a wiki?
Wikis are collaborative web sites that allow multiple authors to create and edit information on the web site. The most recognized wiki is Wikipedia, which is an online encyclopedia that allows anyone to post and edit information. (Riddell, 2006) The technology was the invention of Ward Cunningham in 1994 developed to allow both novice and expert users to participate as active members of a community. Wikis may also foster computer supported collaborative learning (CSCL) which is collaboration with technology to enhance the learning experience. Lipponen (2002) asserts that CSCL assists in the facilitation of peer interaction and shared knowledge among learners. (Augar, Raitman, and Zhou, 2004) Augar et al. claim that wikis are an appropriate tool to promote collaboration in the online environment and used wikis as a tool for facilitating social interaction through an online icebreaker exercise at Deakin University in Victoria, Australia. Ten students were placed into wiki groups along with an online facilitator. The icebreaker wiki contained information about the group’s online facilitator to introduce the instructor, model appropriate use of the wiki, and establish social presence which is a critical element of fostering positive online engagement to avoid a sense of isolation. The icebreaker contained several questions to assist students in finding and responding to other students with similarities. Students were able to connect with the facilitator and other students through the icebreaker event along with posting responses, responding to questions, biographies, and posting a personal photograph. Wikis have multiple purposes from expediting information to the masses to students working collaboratively to create knowledge in a particular domain that may be shared with other students in a particular academic discipline. Several institutions, including Georgia Tech, have been using wikis for a number of years to promote knowledge sharing and collaboration.
CoWeb, developed by Guzdial, (2001) was based on the concept of the wiki.
Dieberger and Guzdial (2002) state that collaborative Webs (CoWebs) are collaborative web tools that have been used by Georgia Tech and other institutions for a number of years. Guzdial (2000) identifies four general areas of CoWeb’s use: - Collaborative artifact creation - Review activities - Case library creation

NCCTTE Journal Volume IX
60
- Distributing information” (Dieberger & Guzdial, 2002, p. 5). Wikis may be another tool to foster virtual communities of shared knowledge while providing an open source of information to other students. There is perhaps another way that wikis may be used to foster collaboration and that is service learning. E-service learning
Strait & Sauer (2004) discovered a critical need to address in online education for teacher education students. The shortage of teachers in the United States and the barriers to rural and urban students who cannot attend a traditional campus-based teacher education program led to Bemidji State University’s Distributed Learning in Teacher Education (DLiTE) program. Service learning, termed as e-service, has been integrated into the teacher education courses at the beginning of the second semester. The students are located throughout the state of Minnesota, so each student participates in individual e-service placements. Students engage in reflection about their e-service through discussion boards, group projects, and journals. While the students found the e-service component a valuable experience, the community partners welcomed the help and assistance provided by the students. Online students gain experience in their field and the community from their service and contributions. Students become involved and knowledgeable of their own community needs while developing beneficial skills in an online learning environment. (Strait et al. 2004) When asked to recall the highlight of academic careers, students will remember a project which involved their time, energy, and passion. (Stevens et al. 1992) When e-service is implemented into a program, students may well recall the learning and service process of the experience. While the DLiTE program did not use wikis, there are a number of ways that wikis may be considered when incorporating service learning into an online course.
Wikis, online learning, and e-service
Students can be grouped in wikis according to a particular kind of community service so that students with common service projects can share ideas, relate the theories, concepts, and methodologies to the e-service, and assist one another in brainstorming and problem solving. Wikis would provide that essential collaborative space for students to interact and create a sense of community avoiding the impersonal feel of online education that sometimes accompanies the online learning experience. Wikis would provide a place for reflection with text, graphics, and images that allow for more interaction and visual cues versus only text-based discussion. Future students in the program could benefit from former students’ e-service experiences and expand upon the existing reflections and knowledge by adding their own contributions to the wiki. Wikis were introduced in a graduate Technology Education course in the spring of 2006 to explore possibilities of how wikis may be used in Technology Education courses. Wiki survey among graduate students
A graduate course titled “Creative Problem Solving” is offered every two years in the masters and doctoral program in the Technology Education program at North Carolina State University and is taught by Dr. Richard Peterson. A presentation was delivered on the use of wikis incorporating e-learning and service learning in Technology Education programs in higher education. After the presentation, graduate students were divided into groups consisting of three students and given an ill-defined problem related to Technology Education. Groups worked on their problems using seedwiki.com to generate possible solutions. The individual students were then asked to complete a survey reflecting upon their experience using a wiki and possible implications of wikis being used for Technology Education courses.
Participants
Twelve participants (seven males and five females) participated in the wiki survey. The majority of the respondents (59%) indicated that a master’s was their highest degree; 33% indicated bachelor’s, and 8% did not respond to the question. When asked if they were currently teaching 42% reported that they were currently teaching with 80% of the respondents teaching at the university level and 20% teaching in a K-12 educational institution. (Table 1)

NCCTTE Journal Volume IX
61
Table 1 Participant characteristics Category Percentage n=12 Gender
Female 33% Male 67%
Highest degree Bachelor’s degree 33% Masters’s degree 59% No Response 8% Currently Teaching Yes 42% No 58% Teaching Environment of Current Teachers K-12 20% University 80% ______________________________________________________________________ Wiki use The majority of respondents (50%) have used wikis in the past and 42% have not had previous experience using wikis. 66% of the respondents have never used wikis in the classroom; 17% have used wikis as a teaching tool in the classroom, and 17% did not respond (Table 2). Table 2 Summary of Participant Wiki Experience Participant Wiki Experience Percentage n=12 Previous experience with wikis Yes 50% No 42%
No response 8% Experience with wikis as teaching tools
Yes 66% No 17% No response 17% ______________________________________________________________________ The respondents (51%) indicated that they were competent with using online instructional technologies; 33% of the participants were not sure if they felt competent using a wiki for classroom instruction; 25% did not feel comfortable

NCCTTE Journal Volume IX
62
using a wiki in the classroom, and 17% felt competent using a wiki for classroom instruction. Thirty-three percent reported that wikis may be a good tool for both teaching and learning; 25% were unsure, and 17% disagreed that wikis would be a good teaching and learning tool. Nine percent strongly agreed that wikis would be effective collaborative problem solving; 36% agreed, and 55% were not sure that wikis would provide an effective collaborative problem solving experience. 8% of the respondents strongly agreed that wikis would provide a good learning experience for technology education students; 42% agreed, and 42% reported that they were unsure. The majority (25% strongly agreed and 25% agreed) that wikis facilitate group learning. (Table 3) Table 3 Summary of Participants’ perspective of wikis
Survey Results Table
Question Strongly Agree
Agree Not Sure Disagree Strongly Disagree
Not Answered
(#8) I am competent with online instructional technologies.
51%
33%
8%
8%
0%
0%
(#9) I am competent using a wiki for instruction.
17%
17%
33%
8%
25%
0%
(#10) Wikis are good tool for teaching and learning.
8%
33%
25%
17%
17%
0%
(#11) Wikis are effective for collaborative problem solving.
9%
36%
55%
0%
0%
0%
(#12) Wikis could provide a useful learning tool for technology education students.
8%
42%
42%
0%
0%
8%
(#13) Wikis facilitate group learning.
25%
25%
25%
17%
0%
8%
(#14) Wikis foster experiential

NCCTTE Journal Volume IX
63
learning 8%
42% 25% 8% 0% 17%
(#15) Wikis are easy to use.
0%
20% 50% 10% 10% 10%
(#16) Wikis are useful in online learning environments.
8%
25%
42%
17%
0%
8%
Summary
Lamb (2004), states that wikis support writing skills while another consideration, particularly in Technology Education programs, is that wikis may foster “network literacy” (p. 45). According to Walker, a hypertext theorist, network literacy is the ability to write in a distributed and collaborative environment and support learning and teaching with emergent technologies. (Lamb, 2004) An increase in the demand for online courses and programs, combined with service learning, this combination may attract new students to the Technology Education field while providing critical learning experiences for the students and the needed benefits the communities receive during students’ e-service to their own local communities.
References
Allen, I.E. & Seaman, J. (2004). Entering the mainstream: The quality and extent of online education in the United States, 2003 and 2004. Retrieved 11/10/04 from http://www.sloan-c.org/resources/entering_mainstream.pdf. ht Augar, N., Raitman, R., & Zhou, W. (2004). Teaching and learning online with
wikis. Proceedings from Australasian Society for Computers in Learning in Tertiary Education. Retrieved 2/14/06. https://secure.ascilite.org.au/conferences/perth04/procs/augar.html.
Bonnett, R. (2006). Out of the classroom and into the community: Service learning reinforces classroom instruction. The Technology Teacher. v65, 5. (February 2006).
Carmichael, D. E. (2001). An educational evaluation of WebCT: A case study using the conversational framework. Paper presented at the ED-MEDIA 2001 World Conference on Educational Multimedia, Hypermedia & Telecommunications, and Tampere , Finland
Dieberger, A. and Guzdial, M. (2002). CoWeb: Experiences with collaborative web spaces. Retrieved 3/15/06 http://homepage.mac.com/juggle5/WORK/publications/CoWebChapter.pdf.
Dobbs, R. L., & Allen, W. C. (2004). Designing an assessment model for a implementing a quality online degree program. Paper presented at the 2004 Academy of Human Resource Development International Research Conference , Austin , TX .

NCCTTE Journal Volume IX
64
Feldman, M. (2002). LMS breakdown. T & D, 56 (10), 66-70.
Flowers, J. (2001). Online learning needs in technology education. Journal of Technology Education. v13,1. Fall 2001. Retrieved 3/20/06 http://scholar.lib.vt.edu/ejournals/JTE/v13n1/flowers.html
Graham, C., Cagiltay, K., Lim, B., Craner, J., & ,Duffy, T. (2001), Seven principles of effective teaching: a practical lens for evaluating online courses, retrieved from the World Wide Web April 3, 2001, http://horizon.unc.edu/TS/default.asp?show=article&id=839.
Hiltz, S.R. (1993). Correlates of learning in a virtual classroom. International Journal of Man-Machine Studies, 39, 71-98.
Hoben, G., Neu, B., & Castle, S. R. (2002). Assessment of student learning in an educational administration online program. Paper presented at the 2002 Annual Meeting of the American Educational Research Association, New Orleans , LA. Lamb, B. (2004). Wide open spaces: Wikis, ready or not. EDUCAUSE. v39,5 (September/October 2004): 36-48. Retrieved 2/28/06
http://www.educause.edu/pub/er/erm04/erm0452.asp?bhcp=1. McMaster, M. (2002). Online learning from scratch. Sales and Marketing
Palloff, R.M., & Pratt, K. (2005). Collaborating online:
Learning together in a virtual community. San Francisco: Jossey-Bass Publishing.
Palloff, R.M., & Pratt, K. (2005). Collaborating online: Learning together in a virtual community. San Francisco: Jossey-Bass Publishing.
Riddell, R. (2006). Wikis test students' research skills 'Information literacy' is key in dealing with online sources. eSchool News. Retrieved 2/24/06 http://eschoolnews.com/news/showStory.cfm?ArticleID=6069.
Roblyer M.D. & Ekhaml, L. (Summer 2000). How interactive are your distance courses? A rubric for assessing interaction in distance learning. Online Journal of Distance Learning Adminstration, v3, 2. Retrieved March 2, 2006, from http://www.westga.edu/%7Edistance/roblyer32.html.
Smith, B. (1998, November 1998). Higher education and enterprise learning management systems. Converge Magazine . Retrieved October 27, 2005
from http://www.centerdigitaled.com/converge/?pg=magstory&id=4822. Stevens, P. and Richards, A. (1992). Changing schools through experiential
Education. ERIC Clearinghouse on Rural Education and Small Schools Charleston WV. Retrieved 2/28/06 http://www.ericdigests.org/1992-3/changing.htm.
Strait, J. and Sauer, T. (2004). Constructing experiential learning for online courses: The birth of e-serivce. Educause Quarterly, 1. Wentling, T. L., & Johnson, S. D. (1999). The Design and Development of an
Academy Evaluation System for Online Instruction. Paper presented at the of Human Resource Development, Washington, D.C.
NCCTTE Journal Volume IX
65
Non-Refereed Articles
Use of take-home exams in an introductory college-level physics course
Robert Ehrlich, George Mason University, Fairfax, VA and W. James. Haynie, North Carolina State University, Raleigh, NC
Abstract: As an experiment, one of us based the grades on several exams in an algebra-based introductory college level physics course on a substantial take-home component. This paper considers the value of this type of grading in the context of introductory physics, and the results are not reassuring. In the Fall 2005 semester, after having his students perform especially poorly on their first in-class exam, compared to past years, one of us (R.E.) tried the unusual experiment of having a substantial component (40%) of the remaining two course exams done on a take-home basis. The particular course was the algebra-based course populated by approximately 230 students, of whom biology majors (or “pre-meds”), and females each constitute 60 % to 70 % of the class. Take-home exams in physics courses are generally used only in advanced undergraduate or graduate courses, although three physics colleagues of R.E. (out of 13 responding to an informal survey), acknowledged sometimes giving them in introductory courses. The most common concerns about take-home exams in introductory courses expressed by those colleagues who avoided this practice were that (a) introductory students are more likely to cheat or collaborate in inappropriate ways, (b) the instructor wants to evaluate individual students, not whether they happen to know the most able of their classmates, and (c) students might not study as much for an exam that was either of the open book or take-home variety. Although these concerns probably have merit, the idea of take-home exams was justified on the following grounds. First, many students in introductory physics complain about lack of time on exams, and time-pressure is entirely alleviated for take-home exams. The alternative solution is to give shorter exams, but in that case the instructor may not be able to cover the desired amount of material and also make the exam reasonably challenging for better students. Second, the virtues of collaborative learning are well-understood by most education researchers. Students were explicitly encouraged to collaborate with classmates in doing the take-home portion of the exams, but they were instructed to write the results up on their own. This is not unlike the practice usually followed with lab reports in introductory courses. One might imagine alternative instructions asking students on their honor not to collaborate, but the inability to enforce such a ban, and the great temptation to collaborate seemed to make that alternative impractical. Third, less than half of the exam grade (40%) was determined using the take-home part. Thus, any artificial inflation of grades that resulted from collaboration – appropriate or inappropriate – still allowed ample opportunity for individual assessment, and probably removed the other concern as well, about students not studying as much for the exam.
NCCTTE Journal Volume IX
66
Let us consider how closely the in-class and take-home components of the exams were correlated – for example see figure 1, showing the results for the third exam. The following three features of this data are noteworthy: (a) the average on the take-home component (87 %) was significantly higher than the in-class component (43 %), (b) many students (41%) got perfect scores on the take-home component, and students having the entire range of in-class scores achieved such perfect take-home scores. (c) grades on the two components tend to be somewhat correlated (correlation coefficient r = 0.46), although not quite as highly correlated as the grades between this exam and either exam one (r = 0.58) or exam two (r = 0.62). If the two components were truly measures of an individual student’s capability on the material, and there were no collaboration, one might expect all three correlation coefficients to be about the same. The fact that they are not extremely different suggests that there was not a huge amount of inappropriate collaboration. Despite a possible concern about inflated grades when using a take-home exam, the distribution of exam grades when combining the take-home and in-class components was nearly as broad as that found on standard in-class exams, and the average on the exam – even with a take-home component – was a disappointing 58%. Some leaders in the physics education establishment take the view that instructors who give exams having very low averages are themselves part of the multifaceted problem facing physics education. For example, Bernard Khoury CEO of the AAPT asks reproachfully of his fellow physics teachers, “If you teach at the college level have you ever designed and given an exam intended to produce a class average of 40% to 50% to display that your students still had a lot to learn?”1
While many students often find exams challenging in introductory physics courses, and do not perform as well as they or their instructors would wish, few instructors probably have the motivation that Dr. Khoury ascribes to them, nor do they desire to “weed out” under-performing students when they give those D’s and F’s at the end of the semester. Not surprisingly, most of the students who were surveyed about having a take-home component of the exams were quite positive about its value. This format was contrasted with that on the first exam, which was entirely in-class, but on which extra bonus points could be earned by redoing the multiple choice component at home, and only 30% of the class preferred that earlier format. Moreover, students claimed to have studied more (48%) or the same amount (43%) as when they prepared for a conventional in-class exam. With regard to inappropriate types of collaboration or “cheating,” most students downplayed this possibility. For example only 5.6% of students said that “many people probably just relied on others to get right answers, and didn’t really learn much,” while 61.9% opined that “many people may have relied on others to get right answers, but probably learned the material.” Student surveys are especially tricky in an area such as this, where it was made known that the take-home component was an experiment, and the format of future exams in the course would hinge on
NCCTTE Journal Volume IX
67
how well the experiment worked out. Given many students’ self-interest in getting higher grades on an exam, without perhaps putting in the individual effort, it is unclear how seriously to take these survey results. There are, in fact, some indicators that some amount of inappropriate student collaboration did take place. For example, several of the better students did complain after the third exam that they were very frustrated after having spent a good deal of individual effort on their take-home component to come to class and observe many students hastily copying answers from someone else right before class – which in one case brazenly occurred right in front of the instructor, and which was not in conformity with the ground rules. To discourage mindless copying of answers without effort the problems on the exam were of the “algorithmic” type, meaning that when students downloaded the take-home component from the course web site random numbers were used for certain variables in each problem. This fact was not announced, however, and as a result a number of exams that were submitted (perhaps 5%) had solutions using different values of the variables that were printed on the exam itself. Such a disagreement between the numbers could indicate either mindless copying, or more innocently, printing out a second clean copy on which to write one’s solutions after originally working them out using the previous set of random numbers, which is what was claimed by some students. Some faculty who give take-home exams in introductory physics believe that intentional cheating occurs only very rarely, although it is unclear how this is known. According to Professor N. E. Davidson of the University of Manitoba, for example, “What more often happens is that two students will briefly discuss the problems and then get carried away...“ 2 Incredibly, Dr. Davidson, in an otherwise sensible page of advice to his physics students, then goes on to advise them that if they insist on cheating, they should at least do it well, so as to make the cheating undetectable and “Change the methods a bit, use different numbers, and preferably add a couple of errors of your own. Also, never collaborate inappropriately with a C or C+ student.” 2
Apart from issues involving inappropriate collaboration, the main educational concern about take-home exams is whether they result in more or less learning than in class tests. . One of us (W.J.H.) has investigated this issue in the context of technology education courses. Interestingly, he found that students who took take-home tests significantly outscored others in a control group on those questions involving “previously represented information,” but did much more poorly when dealing with questions involving novel information.3 Haynie concluded that students taking a take-home exam hunted only for the exact information needed on the take-home test, while other students studied more broadly, so as to be better prepared to deal with novel information.3
In order to test this finding within the context of an introductory physics course, one problem on the final exam was chosen as a variation of one previously used on the take-home component of the third exam. Students were told in advance that the final would be variations of questions on their previous exams, and the concept of what a “variation” might consist of was said to be not limited to a simple change of numbers. In fact, examples of possible variations were explicitly given for a particular question. Since the average grade on the take-home exam component was quite high (87%), the issue was whether students who did very well on that exam would also do well on a variation of that problem on the final? Two different versions of the final were used in the two sections of the class. In one version a problem involving a two-dimensional inelastic collision between two vehicles was

NCCTTE Journal Volume IX
68
changed only in the most superficial way, by changing the numbers: In the second version of the question the principle needed to solve the problem was the same (conservation of vector momentum), but slightly more cosmetic components were changed, because the problem was couched in terms of a package having some specified initial velocity exploding into two pieces. The exact wording of both versions, which were each accompanied by a diagram showing the relevant directions is as follows A M1 = 1000 kg car traveling at 10 m/s along a direction 370 north of east collides on ice with a M2 = 2000 kg SUV traveling at 5 m/s along 370 west of north – see figure. Assuming that the two vehicles stick together on impact, find the speed of the wreckage after the collision that travels in some unknown direction. A package of mass 10 kg falling vertically at 10 m/s explodes into two pieces. Right after the explosion one piece of mass M1 = 2 kg moves along a direction 370 above the horizontal at a speed of 40 m/s. Find the speed of the other (M2 = 8 kg) piece right after the explosion. Drawing shows the two pieces after the explosion. (Ignore the effects of gravity.) The section of the class who took the exam with the car-collision version scored an average of 4.9 out of 10 on the problem, while the other section which did the exploding package version scored slightly lower: 4.3 out of 10. A score of 4 would be given to a student who either did not use x and y momentum components or used them improperly. Recall that on the take-home component of the third exam (given a month before the final) where the colliding vehicle problem appeared nearly all students got very high scores. Clearly, the ability to do well on a take-home exam problem does not appear to result in any long-term understanding on average. In contrast, one question on the final exam was almost identical to a problem done on the in-class component of the second exam. This problem involved finding the tension in a string when a mass was whirled in a vertical circle, at both the top and bottom of the circle. On this final exam question the average score was a respectable 6.9 out of 10, which was virtually indistinguishable from their score on this question given on the second exam. To the extent that the problems can be regarded as being of comparable difficulty, it would appear that prior exposure to physics problems on in-class tests is more likely to result in long-term understanding than is exposure to take-home problems. References. 1. Bernard Khoury, Summer 2005 issue of the AAPT Announcer. 2. N.E. Davison, essay on take-home exams, at: www.physics.umanitoba.ca/~davison/takehome.html 3. W.J. Haynie, III, “Effects of Take-Home Tests and Study Questions on Retention Learning in Technology Education,” Journal of Technology Education 14 (2) Spring 2003, 6-18.

NCCTTE Journal Volume IX
69
0
10
20
30
40
50
60
70
80
90
100
0 20 40 60 80 100take-home part %
in-c
lass
par
t %
Figure 1: In-class versus take-home grades for third exam.