tela%de%abertura%da% studies(of(future(scenarios( opção2 ... ·...
TRANSCRIPT

Studies of future scenarios for tropical forages
Dra. Patricia Menezes Santos Embrapa Southeast Livestock
Tela de abertura da apresentação: opção 2

Prospec>ve studies
“The study of the future to develop strategies for
building a desirable future”
Mayerhoff (2008)
Tela de conteúdo (somente texto): opção 1

Scenarios Studies
“Method to prospect the future through systema:c building of alterna:ve ways, determining possible
scenarios”
Mayerhoff (2008)
Tela de conteúdo (somente texto): opção 1

“Special Report on Emissions Scenarios”
Tela de conteúdo (somente texto): opção 1
Fonte: IPCC, 2000

“Special Report on Emissions Scenarios”
• A1: a future world of very rapid economic growth, global popula>on that peaks in mid-‐century and declines thereaRer, and rapid introduc>on of new and more efficient technologies • A2: a very heterogeneous world with con>nuously increasing global popula>on and regionally oriented economic growth that is more fragmented and slower than in other storylines.
Tela de conteúdo (somente texto): opção 1

“Special Report on Emissions Scenarios”
• B1: a convergent world with the same global popula>on as in the A1 but with rapid changes in economic structures toward a service and informa>on economy, with reduc>ons in material intensity, and the introduc>on of clean and resource-‐efficient technologies • B2: a world in which the emphasis is on local solu>ons to economic, social, and environmental sustainability, with con>nuously increasing popula>on (lower than A2) and intermediate economic development.
Tela de conteúdo (somente texto): opção 1

“Representa>ve Concentra>on Pathways Scenarios”
• RCP 2.6: very low GHG concentra>on levels; radia>ve forces peaks around 3.1 W/m2 mid century and returns to 2.6 W/m2 by 2100; GHG emissions are reduced substan>ally over >me
• RCP 4.5: stabiliza>on scenario; radia>ve forcing is stabilized before 2100 by employment of technologies and strategies for reducing GHG emissions
Tela de conteúdo (somente texto): opção 1

“Representa>ve Concentra>on Pathways Scenarios”
• RCP 6.0: stabiliza>on scenario; radia>ve forcing is stabilized aRer 2100 without overshoot by employment of technologies and strategies for reducing GHG emissions
• RCP 8.5: representa>ve for high GHG concentra>on levels with increasing GHG emissions over >me
Tela de conteúdo (somente texto): opção 1

Scenarios for tropical forages
• IPCC scenarios • ETA and PRECIS models used for regional climate projec>on • Approaches:
-‐ Climate suitability -‐ Forage produc>on – empirical models -‐ Forage produc>on – mechanis>c models
Tela de conteúdo (somente texto): opção 1
Climate suitability

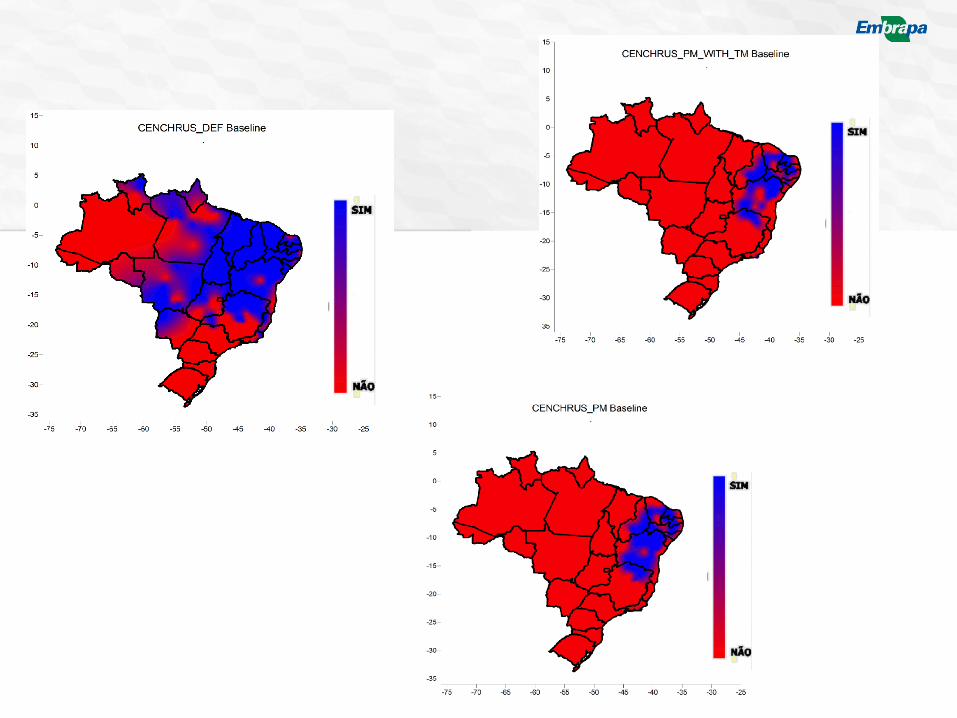
Climate suitability -‐ Cenchrus ciliaris
Tela de conteúdo (somente texto): opção 1
• Search of climate characteris>cs of na>ve areas and places where species is cul>vated: • Rainfall = 348 a 1.027 mm • Mean temperature = 22 a 29oC • Water deficit = 246 a 971 mm
• Criteria: • Rainfall • Water deficit • Mean temperature and rainfall
• Maps: • Geographic Informa>on Systems -‐ GIS • 20% of pixels with occurrence >= 0,6
Tela de conteúdo (somente texto): opção 1

Tela de conteúdo (somente texto): opção 1

Tela de conteúdo (somente texto): opção 1
hhp://tecnologias.cppse.embrapa.br/scafforragem/

Empirical models

Tela de conteúdo (somente texto): opção 1
Grass Variable Slope Inter-cept R² Reference
B. brizanta cv. Marandu Tmin 11.93 -134.95 0.73 Cruz et al. (2011) B. brizanta cv. Marandu Tmincorr 5.78 -17.24 0.75 Cruz et al. (2011) B. brizanta cv. Marandu GDDcorr 12.9 6.52 0.75 Cruz et al. (2011) Brachiaria Group 1§ Tmin 8.19 -94.92 0.5 Tonato et al. (2010) Brachiaria Group 2¶ Tmin 10.66 -128.07 0.6 Tonato et al. (2010) Cynodon Group 1† Tmin 9.06 -84.69 0.6 to 0.7 Tonato et al. (2010) Cynodon Group 2§§ Tmin 7.97 -67.01 0.6 to 0.7 Tonato et al. (2010) Panicum Group1¶¶ Tmin 6.36 -55.22 <0.4 Tonato et al. (2010) Panicum Group 2†† Tmin 5.93 -29.15 <0.4 Tonato et al. (2010) P. maximum cv. Mombaça ƩUF 0.226 600.01 0.86 Araujo et al. (2013) P. maximum cv. Mombaça ƩICC 368.14 -311.94 0.83 Araujo et al. (2013) P. maximum cv. Mombaça ƩGDD 11.52 -304.8 0.78 Araujo et al. (2013) P. maximum cv. Tanzânia AET 34.73 -21.58 0.87 Pezzopane et al. (2012) P. maximum cv. Tanzânia GDDcorr 18.80 -17.02 0.84 Pezzopane et al. (2012) P. maximum cv. Tanzânia GDDcorr 18.90 -6.38 0.87 Pezzopane et al. (2012) P. maximum cv. Tanzânia CGI 330.09 -12.88 0.84 Pezzopane et al. (2012)
Empirical models
Tela de conteúdo (somente texto): opção 1
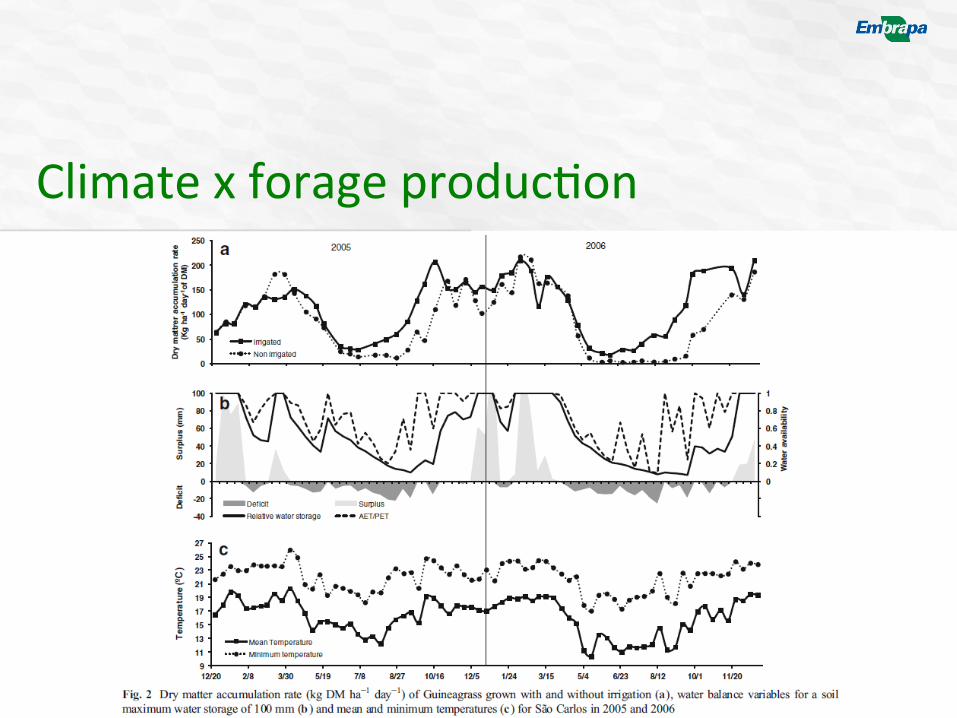
Climate x forage produc>on

Tela de conteúdo (somente texto): opção 1
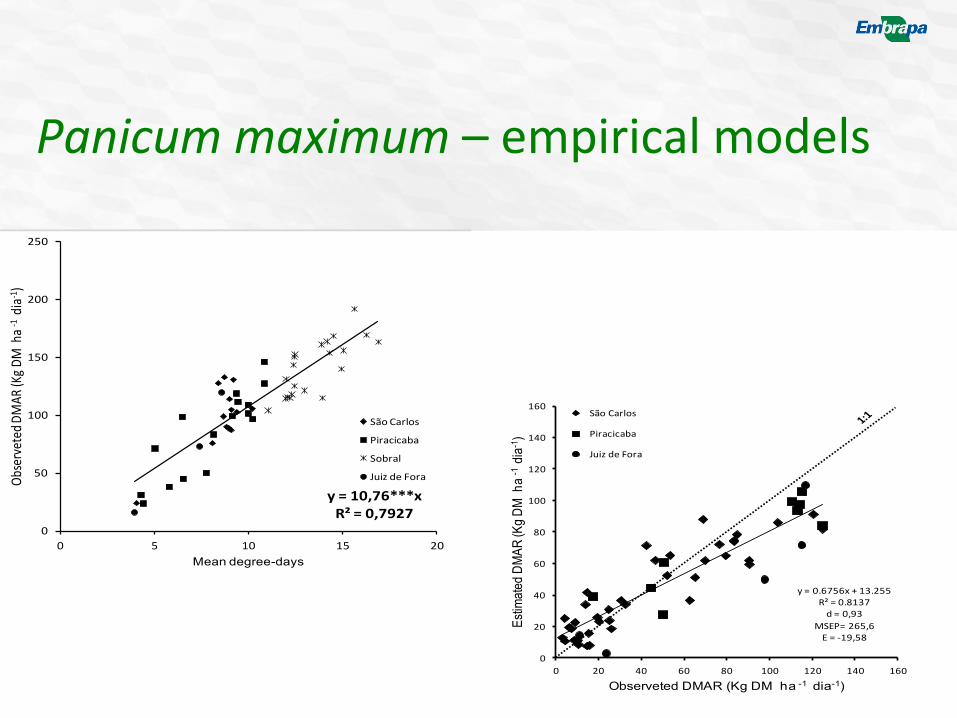
Panicum maximum – empirical models
Tela de conteúdo (somente texto): opção 1
y = 10,76***xR² = 0,7927
0
50
100
150
200
250
0 5 10 15 20
Observeted
DMAR
(Kg D
M ha -‐
1 dia-‐1
)
Mean degree-days
São Carlos
Piracicaba
Sobral
Juiz de Fora
y = 0.6756x + 13.255R² = 0.8137d = 0,93
MSEP= 265,6E = -‐19,58
0
20
40
60
80
100
120
140
160
0 20 40 60 80 100 120 140 160
Estim
ated
DM
AR (K
g DM
ha
-1 d
ia-1
)
Observeted DMAR (Kg DM ha -1 dia-1)
São Carlos
Piracicaba
Juiz de Fora

Actual scenario -‐ Panicum
Tela de conteúdo (somente texto): opção 1

Future scenarios -‐ Panicum Tela de conteúdo (somente texto): opção 1

Future scenarios -‐ Panicum
Tela de conteúdo (somente texto): opção 1
0
0,1
0,2
0,3
0,4
0,5
0,6
0,7
0,8
0,9
1
0 5000 10000 15000 20000 25000 30000 35000 40000 45000
Prob
abilit
y
Annual Production (kg DM ha-1 year-1)
BaselineETA B2 2042-2070ETA A2 2042-2070PRECIS B2 2042-2070PRECIS A2 2042-2070
0
15
30
45
60
75
90
105
120
135
150
Jan Feb Mar Apr May Jun Jul Aug Sep Oct Nov Dec
Dry
mat
ter (
kg D
M h
a-1.d
ay)
Month
Baseline
ETA B2 2042-2070
ETA A2 2042-2070
PRECIS B2 2042-2070
PRECIS A2 2042-2070
Accumulated probability of annual produc>on
Seasonal herbage accumula>on rate

Actual scenario – Brachiaria
Tela de conteúdo (somente texto): opção 1

Future scenarios -‐ Brachiaria Tela de conteúdo (somente texto): opção 1

10000
15000
20000
25000
30000
35000
1963
1967
1971
1975
1979
1983
1987
1991
1995
1999
2003
2007
2011
2015
2019
2023
2027
2031
2035
2039
2043
2047
2051
2055
2059
2063
2067
Ann
ual y
ield
(kg
DM
ha-
1ye
ar-1
)
Years
Moi 60 mmObserved climatePRECIS HIPRECIS LOWETA-CPTEC HIETA-CPTEC LOW
Mean Brachiaria brizantha produc>on in Sao Paulo State

Mean Brachiaria brizantha produc>on in Sao Paulo State
0
20
40
60
80
100
120
140
Jan Feb Mar Apr May Jun Jul Aug Sep Oct Nov Dec
DM
AR
(kg
DM
ha-1
day-1
)
DMAR atualDMAR A.E. 2013-2040DMAR A.E. 2043-2070DMAR B.E. 2013-2040DMAR B.E. 2043-2070
0102030405060708090
100
Jan Feb Mar Apr May Jun Jul Aug Sep Oct Nov DecVa
riat
ion
(%)
Moi 40Moi 60Moi 100
0
20
40
60
80
100
120
140
Jan Feb Mar Apr May Jun Jul Aug Sep Oct Nov Dec
DMAR
(kg
DM h
a-1da
y-1)
DMAR atualDMAR A.E. 2013-2040DMAR A.E. 2043-2070DMAR B.E. 2013-2040DMAR B.E. 2043-2070
0102030405060708090
100
Jan Feb Mar Apr May Jun Jul Aug Sep Oct Nov Dec
Varia
tion
(%)
Moi 40Moi 60Moi 100

Limita>ons of meteorological empirical models
• Soil proper>es • Fer>liza>on • Pasture management • CO2 concentra>on
Tela de conteúdo (somente texto): opção 1

Mechanis>c models

Mechanis>c models – Cropgro Perennial Forage Model
Tela de conteúdo (somente texto): opção 1
Does not simulate more than 10,000 days!

Mechanis>c models – Cropgro Perennial Forage Model
Tela de conteúdo (somente texto): opção 1
Simula>on stops under extreme water deficit!

Mechanis>c models – Cropgro Perennial Forage Model
Tela de conteúdo (somente texto): opção 1
Higher temperature (C5, C6 e C7) = Lower produc>on and higher dispersion Lower temperature (C4) = slight increase in produc>on

Mechanis>c models – Apsim
Tela de conteúdo (somente texto): opção 1
0
5000
10000
15000
20000
25000
-‐3 atual 3 6 9
Aragarças
Pelotas
Porto dos Gaúchos
São Carlos
Sobral
Votuporanga

Mechanis>c models – Apsim
Tela de conteúdo (somente texto): opção 1
