telecom new zealand strategy update
TRANSCRIPT

Telecom New ZealandTelecom New ZealandStrategy Update 16 May 2013
Gen-i – Tim Miles

Gen-i
Gen-i is Telecom Group’s channel to the Business and Government markets, using converged ICT solutions to differentiate in market.
#1 i b i i bil
Government Commercial Enterprise
CorporateBusiness
#1 in business voice, mobile and data
Deepest set of IT capability TransTasman
Enterprise
Telecom Connect P d t
Network ICT Services
Prof.Services Partners
p p p yand infrastructure assets
Client intimacy and value th h d ICT
p
Products
Telecom C t
through converged ICT approach
Over 4,000 public and private Connect
, p psector clients on both sides of the Tasman
O $1b
2
Over $1bn revenue

Observations
Our clients and our market are going through fundamental changes –driving opportunity for converged telco and IT players
Client Demands
Competitive cost driven market.Agility, flexibility and value drives
X-as-a-Service
Maturity of cloud services drives real uptake in managed,
Converged ICT is
clients future business models. They need to focus on their own core business
hosted ICT servicescrucial to enabling
our clients’ future
Data explosion
Exponential increases in the i d
Enterprise Mobility
“Anytime, anywhere, hi ” h b
business models and delivering our own
creation, transport and analysis of data driving real-time decision making
anything” approach to business radically changes enterprise IT
growth ambitions
3

Strategic Shift
From To
These fundamental changes accelerate the Gen-i journey
A provider of telecommunication services
and IT services
A converged ICT proposition with competitive
differentiation
A defensive mindset Pro-active profitable growth
A provider of telco or IT “inputs” to our clients
Providing managed ICT services to enable broader
client CXO outcomes
Owning all the parts of a solution
A partnering approach to clients, each playing to
appropriate strengths
4
appropriate strengths

1. Revolutionise Customer Experiences
We are a relationship-led business - ICT creates a culture of client-centricityWe will make it easier to deal with us through those relationships
Recent ActionsRe-oriented our sales and delivery teams around our clients and their unique industriesDramatically increased our Wellington andDramatically increased our Wellington and Government relationships Brought support functions closer to the “frontline”
Challenging legacy processes to up the tempoPropositions aligned to customer needs – not one size fits all
Focus for FY14size fits allProactively leading clients’ journey to the future through our thought leadershipLeveraging partners to enhance our proposition
5
g g p p p

2. Simplify the Business
Our scale and scope has driven complexity and cost into our business.To be cost competitive and agile for our clients, we are moving quickly to address this
Changed our cost model - delivering the client experience at an acceptable market costCreated the Gen-i ServCo, bringing pricing, finance and
Recent Actions
commercial capabilities into Gen-i to streamline the commercial engineRefocused our Australian operations on Trans-Tasman
Reduce focus on mature / lower margin portfoliosFocus for FY14Simplifying what we sell to whomPartnering to access the capability clients need and manage risk
6

3. Win Key Markets
We’re investing or partnering in high-growth services that make the major Group investments relevant and valuable to our client base
Mobile + IT Fixed + IT
Device Management
M2M
Mobile Applications
Security & Management
Cloud Services
Collaboration & Video
Business Market Services
>25% EBITDA Margin Targets Device Management
D t
Security & Managementg g
Indicative Revenue Growth Rates (CAGR)
3G (Voice)
4G (Data)
DataCentres
20%Core Group
OTN 5%
Core Group Investments
7

4. Win the Future
Unrivalled depth of expertise OurselvesPartners
L di ICT i f t t
Partners
+Leading ICT infrastructure
+Forward facing portfolio
+Moving faster than the market
From provider of inputs to enabler of
8
business outcomes

Key success criteria - to deliver shareholder value
Area of Critical Focus FY14 Outcome
4% point increase through cost IT Margin Improvement
4% point increase through cost transformation, improving cost to serve and portfolio focus
Deliver $15m IaaS EBITDA through
Networked ICT Growth
Deliver $15m IaaS EBITDA through Revera acquisitionCommission Christchurch Data CentrePre-sell initial build in Auckland Data C tCentre
Mobile Market Share Maintain strong current market share position
Data Market Share Grow share in the Corporate segment through launch of two specific offerings
Client perception Improve client ratings in surveyed
9
Client perception metrics

Telecom New ZealandTelecom New ZealandStrategy Update 16 May 2013
Telecom Connect – David Havercroft

The simplification agenda
OUTCOMESNetwork Economics
Mobile Evolution1Better network economics
Better network experience
2Optical Transport Network (OTN) Better network features
Simplifying our businessAgility in market
3 Re-engineeringEffortless customer experiences
Lower cost architecture for the business
11

Mobile evolution
Two year programme to deliver better network economics and better network capabilities
Estimated Avg. Mobile data cost, cents/MBSpectrum optimisation
maximise the use of all existing spectrumspectrum
prepare to take advantage of the digital dividend at 700 MHz
Spectr m allocation needs to beSpectrum allocation needs to be fair and economic
Optimise 3G network for “best network” service and economicsnetwork service and economics
New packet core / HSS - 4G enabled
New LTE 4G RAN
FY13 FY20
12

Optical Transport Network
Two year programme to deliver very high speeds ranging up to 100 Gb/s with guaranteed bit rates, g g p g ,improved levels of resiliency and industry leading cost per Gigabyte
Augmenting and upgrading fibre sections with national fibre routes
Deploying a new optical transport network
Carrier ethernet edge and applicationCarrier ethernet edge and application assurance across the network
Removes existing end of life high cost transport network and positions for future
PHASE 1 OTN Deployment Sites
data growth at lowest cost
Provides a cost effective backhaul
y
PHASE 2 OTN Deployment Sites
13

Re-engineering overview
Investing $150m to $200m over three years to deliver re-engineering of products, processes and BSS/OSS platforms
Simplified customer experiencesSimplified customer experiences
Re-usable building blocks and agile architecture
Limited need for new technology investments
Approach leverages existing investments in world class components (e.g. Siebel, Singl.eView) and re-architects to deliver simplified end state
Most of the new base capabilities delivered in the first 18 monthsp
Mobile will be the first portfolio to transition
Targeting $100m to $200m of ongoing annualised benefits
Benefits driven from business simplification, rationalisation of in market offers and products, not just technology
Benefit realisation predominantly from FY15
14
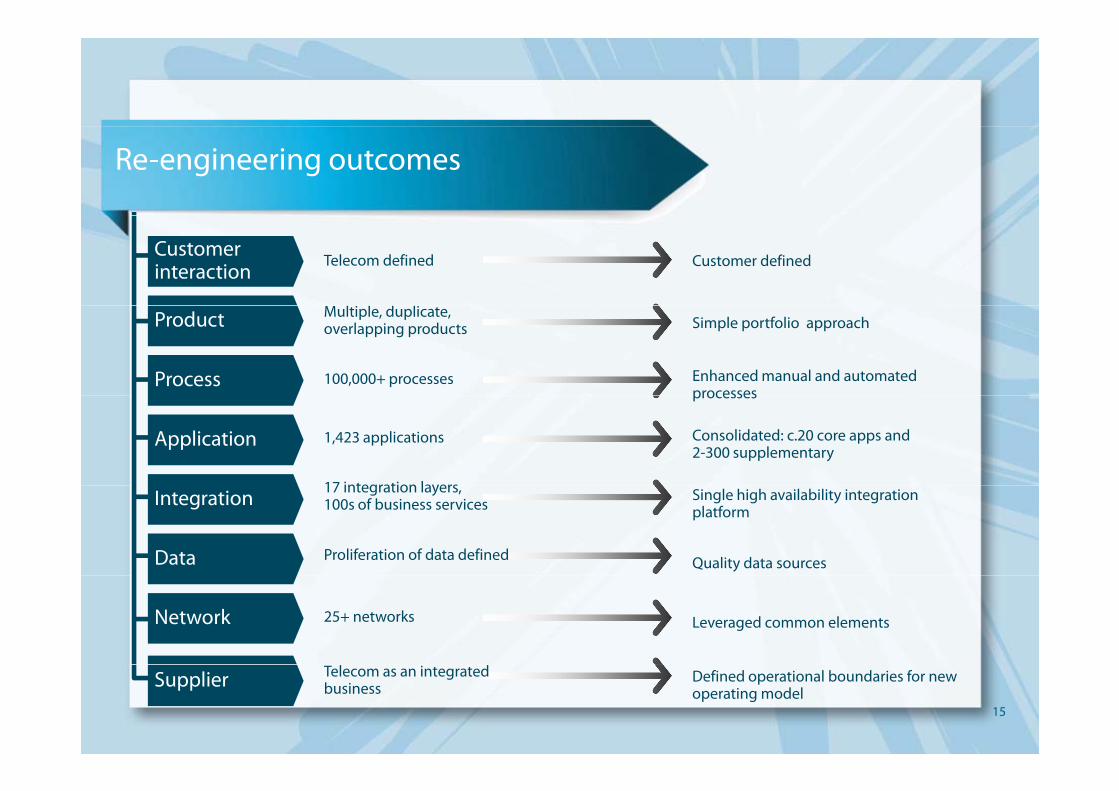
Re-engineering outcomes
Telecom defined
l l d l
Customer definedCustomerinteraction
100,000+ processes
Multiple, duplicate, overlapping products Simple portfolio approach
Enhanced manual and automated processes
Product
Process
1,423 applications
17 integration layers
processes
Consolidated: c.20 core apps and 2-300 supplementary
Application
Proliferation of data defined
17 integration layers,100s of business services Single high availability integration
platform
Quality data sources
Integration
Data
25+ networks Leveraged common elementsNetwork
15
Telecom as an integrated business
Defined operational boundaries for new operating model
Supplier

Investment profile
Major Programmes - 60%
Average capital envelope of $400m to $500m per year for the next 3 years (phasing could vary)
OTN
Mobile Evolution
Sustain, incremental growth and innovation - 40%
Re-engineering
Legacy network, IT and facilities sustain
Capacity management
facilities sustain
Target innovations (refer to Digital Ventures)
16
60% of the capital investment will focus on the outcomes delivered by the three key programmes

Key success criteria – to delivershareholder value
Key outcomes to look for in 12 months time
Fixed evolutionMobile evolution
Fibre launch – LFC pilots
VDSL in market
LTE launch – 4G live
Mobile completely re-platformedNew on line channelNew on line channelNew CRMNew billing & pricing compatibility
Simplified bill format to enhance customer experience
100 Gb/s transport launch
E h d i t l t Gb/
17
Enhanced services, at lower cost per Gb/s

Telecom New ZealandTelecom New ZealandStrategy Update 16 May 2013
Telecom Digital Ventures – Rod Snodgrass
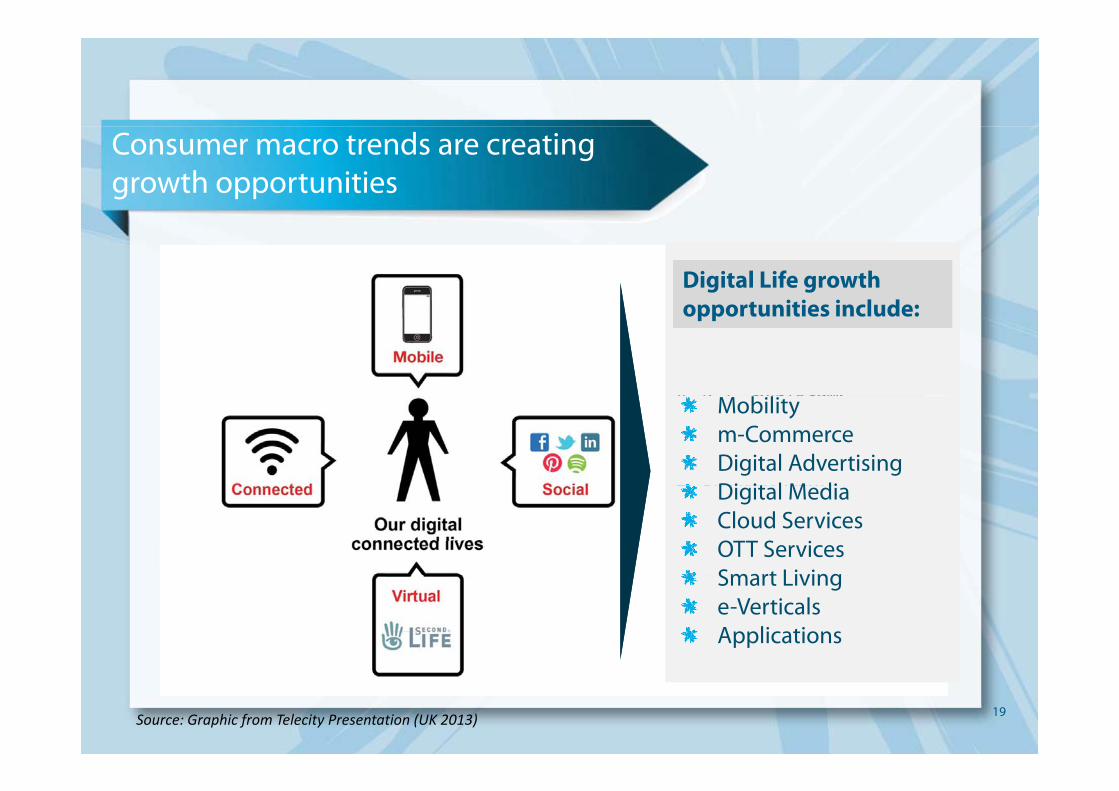
Consumer macro trends are creating growth opportunities
Digital Life growth opportunities include:Digital Life growth opportunities include:
The digital future?
4 5 ) $6#$78*$9%'#(
opportunities include:opportunities include:
4 5, ) . $6#$78$9%#(4 : ') 879#94 ; $<'&$8- *+%'=$*9#'+64 >6&*$9?'6) 8<'*#, 9%'?9#'+64 >6#$*6$#8+=8#@'6) ?
Mobilitym-CommerceDigital AdvertisingDi it l M di
Mobilitym-CommerceDigital AdvertisingDi it l M di4 >6#$ 6$#8+ 8#@6) ?
4 A '&*+&@'- 8'. - %96#?4 A 9&@'6$8#+8. 9&@'6$8
&+. . , 6'&9#'+6?4 B$9%4#'. $8@$9%#@&9*$
Digital MediaCloud ServicesOTT ServicesSmart Living
Digital MediaCloud ServicesOTT ServicesSmart Living4 B$9%4#. $8@$9%#@&9 $Smart Livinge-VerticalsApplications
Smart Livinge-VerticalsApplications
19Source: Graphic from Telecity Presentation (UK 2013)

A bold aspiration and new approach is being adopted
A New A Focussed Delivering new Digital Life services5+ new businesses
A Bold Aspiration
Approach Strategy$300m of new revenue; 20+% EBITDA ROI hurdles metNew capability and cultureStrategic optionality
D di t d B i U it ti t CEODedicated Business Unit reporting to CEOClear mandateStart small and scale with growthOperating at arms length
A New Approach Operating at arms length
Bias for action; fail fast, fail cheapAgile processes; open partnering
Approach
20

With a clear and focussed approach to market selection
S l C biliti d itP fit l i i C
Market Filters Market selection, validation and prioritisation
Structural attractiveness analysis
Capabilities and capacity assessment
Profit pool sizing and trajectory
A B C
NZ mass market focus
Li t f th t
Under-served core or adjacent markets
Emerging list of priorities
Input of ideas from range of idea generation lenses
List of largest industry opportunities
List of the most structurally attractive ideasGrowing
markets
Right to play/natural advantage
21

Significant opportunity exists in adjacent markets Emerging Focus
Areas
Mobility
mCommerce
Digital AdvertisingDigital Advertising
Video, Media & Cloud Services
Smart Living
e-Verticals
Applications
22
ApplicationsSingTel Investor Day Extract: March 2013

To deliver new consumer experiences and businesses
Examples
Mobility
p
Extending mobility to support ubiquitous connectivity and reach under served segments
mCommerce
Digital Advertising
Mobilising the wallet to deliver a range of services including credit cards, vouchers, etc
Delivery of a digital platform to enable highly targeted and Digital Advertising
Video, Media & Cloud Services
relevant marketing to consumers
Delivery of rich OTT consumer experiences anywhere, anytime and on any device
Smart Living Delivery of trusted home services including storage, automation and management
e-Verticals
Applications
Delivery of technology, information and services into verticals to improve outcomes
Delivery of an API platform to help developers take apps
23
Applications y p p p ppand web services to market

Growth portfolio is developing quickly to address opportunities
Concept Feasibility Build Launch In Life
SkinnyWi-Fi HotspotsWi-Fi Phase 2Wi-Fi Phase 3Mobility SkinnyWi Fi HotspotsWi Fi Phase 2Wi Fi Phase 3
TSM - JVmCommerce -Next Phase
m-WalletmCommerce
Mobility
Platform Exploration
OTT S i 1
Partnering Opportunity
OTT Service 2
Digital Advertising
Video, Media & OTT Service 1OTT Service 2
Concept Development
Cloud Services
Smart Living
Key vertical concepts
App Platform
e-verticals
Applications
24
ScopingApplications

Example: mCommerce through industry collaboration
Low cost ubiquitous utility, leveraging existing assets and relationships…
…delivering a seamless customer experience
mCommerce MNO Partnership
NZ TSM Joint Venture“Mobilise My Wallet”
Everywhere
“Mobilise My Wallet”
EverywheremCommerce MNO Partnership
Cashless Payment Services
y
Simple to use
V l f
y
Simple to use
V l fCashless Payment Services
M bil M S i
Value for money
Integrated with eCommerce
Value for money
Integrated with eCommerceMobile Money Services
Business Services
eCommerce
Consistent across networks & services
eCommerce
Consistent across networks & services
25
Business Services

Update: Extending Skinny to address a wider opportunity
Expanding the brand and iti
“Living Skinny”“Living Skinny”proposition
Edgy
Beyond Youth
Edgy
Beyond YouthPreparing the platform for next Beyond Youth
Auckland
Beyond Youth
Auckland
Preparing the platform for next growth phase
Accelerating customer growth; continuing ARPU growth
Simple
Value
Simple
Value
Shift and extend go-to-market and service model
Digital
Self Service
Digital
Self Service
26

What’s next – to create shareholder value
Mobility EXTEND BUILDOUT
mCommerce
Digital BUILD CREATE D g ta
Advertising
Video, Media & Cloud Services
OUT CASE
Smart Living
CREATE CASE
CREATE CASE
e-verticals
ApplicationsBUILD
PLATFORMBUILD
TALENT
27

Telecom New ZealandTelecom New ZealandStrategy Update – Concluding Comments16 May 2013
Chief Executive – Simon MoutterChairman – Mark Verbiest

FY13 guidance reiterated, expecting to be near lower end of EBITDA range
FY13
Adjusted EBITDA
FY13
$1,040m to $1,060m1
90% payoutDividend
Capex ~$460m
$1,060m
90% payoutDividend
1 E cl des one off costs in H2 associated ith strateg implementation estimated to1 Excludes one off costs in H2 associated with strategy implementation, estimated to be between $100m and $130m
FY14 dividend policy to be provided at full year profit announcement in August
29

Strategic shift
FROM a traditional fixed and mobile infrastructure company . . .
TO a future oriented competitive provider of
y
TO a future-oriented, competitive provider of communication, entertainment and IT services
delivered over our networks and the Cloud
30
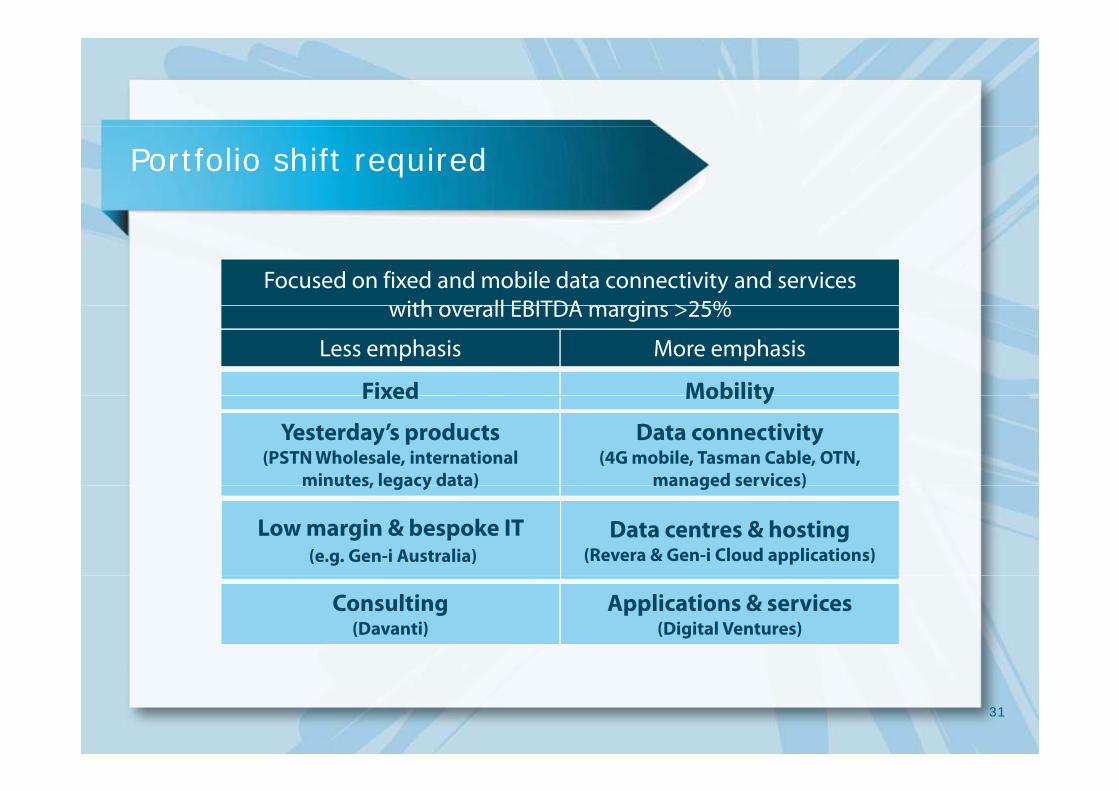
Portfolio shift required
Focused on fixed and mobile data connectivity and services with overall EBITDA margins >25%
Less emphasis More emphasis
with overall EBITDA margins >25%
Fixed Mobility
Yesterday’s products(PSTN Wholesale, international
minutes, legacy data)
Data connectivity(4G mobile, Tasman Cable, OTN,
managed services)
Fixed Mobility
minutes, legacy data) managed services)
Data centres & hosting (Revera & Gen-i Cloud applications)
Low margin & bespoke IT(e.g. Gen-i Australia)
Consulting(Davanti)
Applications & services (Digital Ventures)
31

Four clear strategic priorities
1. Revolutionise Customer Experiences
2. Simplify the Business
3 Wi K M k3. Win Key Markets
4 Win the Future4. Win the Future
32

Aiming to end FY14 with
Competitive Organisation
A new winning culture which is performance driven, agile and competitive
On track to crystallising $100-$200m of annualised benefits from re-engineering, cost y g g gout and simplification programmes (relative to FY14)
Market Success
1 2% i t i i bil k t h1-2% point increase in mobile market revenue share
Mobile completely re-platformed, 4G launched
Stable broadband market connection share
VDSL and fibre products launched
Double digit revenue growth from Gen-i networked ICT
Future SuccessFuture Success
At least four new highly differentiated offers to consumer & SME customers
Clear path forward for Australia
33
Digital Ventures having launched a portfolio of new products and services

Summary
Our strategy is focused firmly on creating long-term shareholder value
near term focus on stabilising revenue/margin and reducing costs
longer term focus aiming to drive market revenue/margin growth with control over unit costs
We are executing against this strategy and will update you on progressWe are executing against this strategy and will update you on progress
34

Disclaimer
Forward-looking statements and disclaimerThis announcement includes forward-looking statements within the meaning of the U.S. Private Securities Litigation Reform Act of 1995 regarding future events and the future financial performance of Telecom. Such forward-looking statements are based on the beliefs of management as well as on assumptions made by and information currently available at the time such statements were made.These forward-looking statements can be identified by words such as ‘anticipate’, ‘believe’, ‘estimate’, ‘expect’, ‘intend’, ‘will’, ‘plan’, ‘may’, ‘could’ and similar expressions. Any statements in this announcement that are not historical facts are forward-looking statements. These forward-looking statements are not guarantees or predictions of future performance, and involve known and unknown risks, uncertainties and other factors, many of which are beyond Telecom’s control, and which may cause actual results to differ materially from those projected in the forward-looking statements contained in this release. Factors that could cause actual results or performance to differ materially from those expressed or implied in the forward-looking statements are discussed herein and also include Telecom's anticipated growth strategies, Telecom's future results of operations and financial condition, economic conditions in New Zealand and Australia; the regulatory environment in New Zealand; competition in the markets in which Telecom operates; risks related to the sharing arrangements with Chorus, other factors or trends affecting the telecommunications industry generally and Telecom’s financial condition in particular and risks detailed in Telecom's filings with the U.S. Securities and Exchange Commission. Except as required by law or the listing rules of the stock exchanges on which Telecom is listed, Telecom undertakes no obligation to update any forward-looking statements whether as a result of new information, future events or otherwise.The securities referred to in this announcement have not been, and will not be, registered under the United States Securities Act of 1933 or under the securities laws of , , gany state or other jurisdiction of the United States. This announcement does not constitute an offer of securities in the United States or to any person to whom it would not be lawful outside Australia and New Zealand. Any securities described herein may not be offered or sold in the United States absent registration under the Securities Act or pursuant to an applicable exemption from registration, or to any person to whom it would not be lawful outside Australia and New Zealand.
Non-GAAP financial measuresTelecom results are reported under IFRS. This release includes non-GAAP financial measures which are not prepared in accordance with IFRS. The non-GAAP financial measures used in this presentation include:1.EBITDA. Telecom calculates EBITDA by adding back (or deducting) depreciation, amortisation, finance expense/(income), share of associates’ (profits)/losses and taxation expense to net earnings/(loss) from continuing operations.2.Adjusted EBITDA. Adjusted EBITDA excludes significant one-off gains, expenses and impairments.3.Capital expenditure. Capital expenditure is the additions to property, plant and equipment and intangible assets, excluding goodwill and other non-cash additions that may be required by IFRS such as decommissioning costs.4.ARPU. Telecom calculates ARPU as revenue for the period (for mobile this is only voice and data) divided by an average number of customers.5.Free cash flow. Free cash flow is defined as EBITDA less capital expenditure.
f f f f f6.Adjusted free cash flow. Adjusted free cash flow utilises adjusted EBITDA rather than underlying EBITDA defined above.7.Adjusted operating revenue. Adjusted operating revenue excludes significant one-off gains.8.Adjusted net earnings. Adjusted net earnings are net earnings for the year adjusted by the same items to determine adjusted EBITDA, together with any adjustments to depreciation, amortisation and financing costs, whilst also allowing for any tax impact of those items.9.Pro-forma EBITDA. EBITDA adjusted to reflect changes in Chorus trades upon demerger
Telecom believes that these non-GAAP financial measures provide useful information to readers to assist in the understanding of the financial performance, financial i i f T l b h h h ld b i d i i l i id d b i f d i d i h IFRS N GAAP
35
position or returns of Telecom, but that they should not be viewed in isolation, nor considered as a substitute for measures reported in accordance with IFRS. Non-GAAP financial measures as reported by Telecom may not be comparable to similarly titled amounts reported by other companies.