telecommunication traffic & mobile communications statistics › itu-d › ict › wtim99 ›...
TRANSCRIPT

Telecommunication traffic & mobile communications statistics
- International traffic & tariff indicatorsMr. T. Kelly, ITU, Switzerland
- Mobile communications indicatorsMr. M. Minges, ITU, Switzerland
- Mobile communications questionnaireMr. M. Minges, ITU, Switzerland
- Telecommunication statistics in TogoMr. S. Mensah, Togo Telecom
- Data definition, data collected by different entities, data on the InternetMr. M. Minges, ITU, Switzerland
- Challenges to the Network 1999Mr. B. Petrazzini & Ms. L. Männistö, ITU, Switzerland

2nd World Telecommunication Indicators Meeting(Geneva, 29 - 31 March 1999)
SOURCE: MR. TIM KELLY, ITU/BDT
TITLE: INTERNATIONAL TRAFFIC & TARIFF STATISTICS
________
INTERNATIONAL TELECOMMUNICATION UNION
TELECOMMUNICATIONDEVELOPMENT BUREAUINFORMATION SYSTEMS UNIT
Document WTIM99/13-E12 March 1999Original: English

International traffic andInternational traffic andtariff statisticstariff statistics
Dr Tim Kelly *,Strategic Planning Unit,
International Telecommunication Union,WTIM ‘99, March 30, 1999
* The views expressed in this presentation are those of the author, and do not necessarily reflect the opinions ofthe ITU or its membership. Tim Kelly can be contacted by email at Tim.Kelly@ itu.int.

International traffic and tariff statistics
AgendaAgendalWhy traffic and tariff statistics matterð Measuring “globalisation”ð Death of distanceð Trade in telecommunication
lMinutes, megabytes or circuits?ð Telephone/fax traffic versus Internet trafficð Tariff comparisons
l ITU/TeleGeography activitiesð Data collectionð Reports, Databases, Projects
lWhat does it all add up to?

0
250
500
750
1'000
1'250
1'500
1995 1996 1997 1998 1999 2000 2001 2002 2003 2004 2005
Sub
scri
bers
(mill
ion)
0
50
100
150
200
250
300
Bill
ions
of m
inut
es o
f int
’l tr
affic
Fixed main lines
Mobile subscribers
Total int'l traffic
Projection of growth trends, Projection of growth trends, fixed andfixed andcellular subscribers and int’l traffic, 1995-2005cellular subscribers and int’l traffic, 1995-2005
Source: ITU.

International traffic and tariff statistics
Why measure minutes ofWhy measure minutes ofinternational traffic?international traffic?
lTraffic = Tradeð International telephone, telex, fax and e-mail
traffic closely mirror international trade flows
lMinutes = Moneyð Under the international accounting rate system,
net balances of minutes of traffic translate intocash payments
lPhone calls = Familiesð Bilateral calling patterns bear imprint of historical
migration patterns between countries

Traffic flows showTraffic flows show globalisation globalisation in action in action
A visualisation of a sample of Internet Traffic Flows:Source: Stephen Eick, Bell Labs.

1
10
100
1'000
10'000
100'000
TAT-71983
TAT-81988
TAT-91991
TAT-101992
T-111993
T-12/131995
Gemini1998
TAT-142000
Cos
t per
voi
ce p
ath
(US
$)
1
10
100
1'000
10'000
100'000
1'000'000
100'000'000
Cap
acity
(voi
ce p
aths
)
Cost per voice path (US$), declining by
41% p.a.
Infrastructure capacity and costs,Infrastructure capacity and costs,TransAtlanticTransAtlantic cables, 1983-2000 cables, 1983-2000
Source: ITU, TeleGeography Inc., FCC.Note: Voice-path numbers assume a compression ratio of 5:1 to number of circuits.
10'000'000
Capacity (voice
64% p.a.paths), growing by

“The death of distance“The death of distanceas a determinant of theas a determinant of thecost of communicatingcost of communicating
will probably be thewill probably be thesingle most importantsingle most importantfactor shaping societyfactor shaping societyin the first half of thein the first half of the
next century.”next century.”
Frances Cairncross, “The Death ofDistance”, 1997

International traffic and tariff statistics
What should we measure? TrafficWhat should we measure? TrafficlMeasure minutes?ð Traditional approach, useful for telephone and fax
traffic. Good statistics for end-to-end traffic due toexchange of international accounts.
ð BUT, competition and technological change areeroding the relevance of minutes
lMeasure megabytes?ð Would seem to be a logical evolution from minutes for
measuring mixed data/voice/video flowsð BUT, in IP networks, traffic rarely flows end-to-end
lMeasure circuits?ð Best technology-neutral measure of capacityð BUT, does not measure end-to-end interaction

Circuit capacity shows shift fromCircuit capacity shows shift fromTelephone to Internet. Telephone to Internet. Usage of int’lUsage of int’lcircuits between US & UK, 1995-97circuits between US & UK, 1995-97
Source: ITU, adapted from TeleGeography, FCC.
0
10'000
20'000
30'000
40'000
50'000
60'000
1995 1996 1997
International private lines (mainly Internet)
Public telephone
Idle circuits

International traffic and tariff statistics
What should we measure? TariffsWhat should we measure? TariffslMeasure retail prices?ð Retail prices (e.g., 3 minute call from X to Y) are the
indicator of most relevance to consumersð BUT, widespread availability of discounts, offers &
surcharges makes headline prices less relevant
lMeasure wholesale prices?ð Settlement rates have traditionally set floor for telecom
prices. Wholesale prices mirror settlement rates.ð BUT, emerging paradigm is for national interconnect
lMeasure revenue per minute of traffic?ð Effectively captures differences in availability of
discountsð BUT, only limited data is available

Divergence over time between retail andDivergence over time between retail andwholesale prices. wholesale prices. USA, 1990-97USA, 1990-97
Source: ITU, adapted from FCC.Note: “Average US revenue per billed minute” = total int’l IMTS revenue divided by total outgoing int’l minutes.
US
$ pe
r m
inut
e
0.32
0.64
0.68
0.83
0.20.30.40.50.60.70.80.9
11.11.2
1990 1991 1992 1993 1994 1995 1996 1997
Average US settlement rate per minute
Average US revenue per billed int'l minute
Mark-up over gross settlement rate130%
212%

0 500 1000 1500 2000
Switzerland, SwissCom
Japan, NTT
Canada, Bell
Spain, Telefonica
Australia, Telstra
USA, Nynex, NY + AT&T
Italy, T.I.
Germany, DT.
UK, BT
France, FT.
Ireland, Telecom
Finland, Sonera
Netherlands, KPN
Norway, Telenor , Basis
Denmark, Telecom
Sweden, Telia
Fixed chargesUsage charges
TariffTariffbasketsbaskets
NationalNationalbusinessbusinessbasket,basket,Feb 1999Feb 1999in US$in US$
Source: OECD/Eurodata Foundation.

International traffic and tariff statistics
Data collection questionnaireData collection questionnairel Incoming and outgoing traffic minutes to major
(top 20) traffic destinationsð by countryð (where necessary, by carrier, if no aggregated
statistics exist)ð by year
lPeak and off-peak cost of a 3 minute direct-dialled call to major destinationsð for major carriersð by yearð in local currency
lPublished settlement rate data (e.g., US, UK, NZ)

International traffic and tariff statistics
ITU/ITU/TeleGeographyTeleGeography activities activitieslPublicationsð “Direction of Traffic” report and databaseð “TeleGeography” annual report
(http://www.telegeography.com)
l ITU-T Study Group 3 Focus Groupð Analysis of settlement rates, transit rates
(http://www.itu.int/intset/focus/index.html)ð Use of “average of lowest 20%” to define
indicative target ratesð 13 country case studies commissioned by ITU,
CTO, EU (http://www.itu.int/wtpf/cases/index.htm)
l ITU Asia-Pacific Regional Officeð Tariff comparisons for Asia-Pacific region

International traffic and tariff statistics
“Direction of Traffic”“Direction of Traffic”
l 1994: Trends ininternational telephonetraffic
l 1996: Trends ininternational telephonetariffs
l 1999: Trading TelecomMinutes (forthcoming,July 1999)
For more information: http://www.itu.int/ti/publications/index.htm#TRAFFIC96

2nd World Telecommunication Indicators Meeting(Geneva, 29 - 31 March 1999)
SOURCE: MR. MICHAEL MINGES, ITU/BDT
TITLE: MOBILE COMMUNICATION STATISTICS
________
INTERNATIONAL TELECOMMUNICATION UNION
TELECOMMUNICATIONDEVELOPMENT BUREAUINFORMATION SYSTEMS UNIT
Document WTIM99/12-E12 March 1999Original: English

Mobile CommunicationStatistics
Michael MingesTelecommunication Development
Bureau (BDT)International Telecommunication Union
(ITU)

Contents
• Importance of mobile communication statistics• Types of mobile communication statistics• Collection by national regulatory authorities

Importance of mobilecommunications
• In terms of subscribers,revenue and otherindicators mobilecellular is growing muchfaster than fixednetworks
• In Finland, mobilepenetration exceedsfixed while in Cambodia,there are more mobilecellular subscribers thanfixed
205
55
142
90
3411 2316
1990
1991
1992
1993
1994
1995
1996
1997
0%
5%
10%
15%
20%
25%
Mobile cellular subscribers worldwide
(m)
As % of total telephone
subscribers
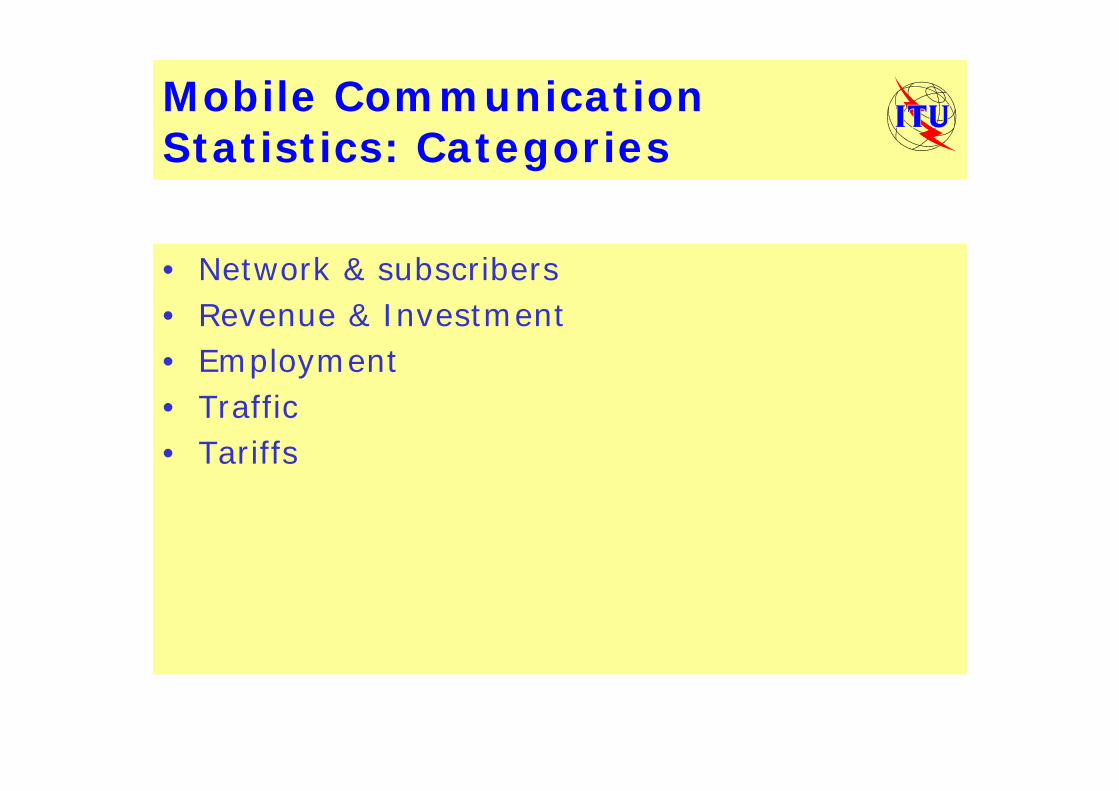
Mobile CommunicationStatistics: Categories
• Network & subscribers• Revenue & Investment• Employment• Traffic• Tariffs

Mobile network &subscriber statistics
• Number of mobilecellular subscribers– Analogue
• AMPS• NMT• TACS• Other
– Digital• D-AMPS• GSM• CDMA• Other
• Number of prepaidmobile cellularsubscribers
• Number of base stations• % of population covered• % of territory covered

Mobile staff, investment &revenue statistics
• Staff employed by mobilecellular operators
• Investment in mobilecellular networks
• Revenue from mobilecellular– Connection charges– Subscription charges– Call charges
• Local• National• International• Roaming

Mobile traffic statistics
• Units:– Both minutes and calls
• Could further divide by:– Mobile-fixed– Fixed-Mobile– Mobile-Mobile
• Incoming• Outgoing
– Local– National– International
• Roaming
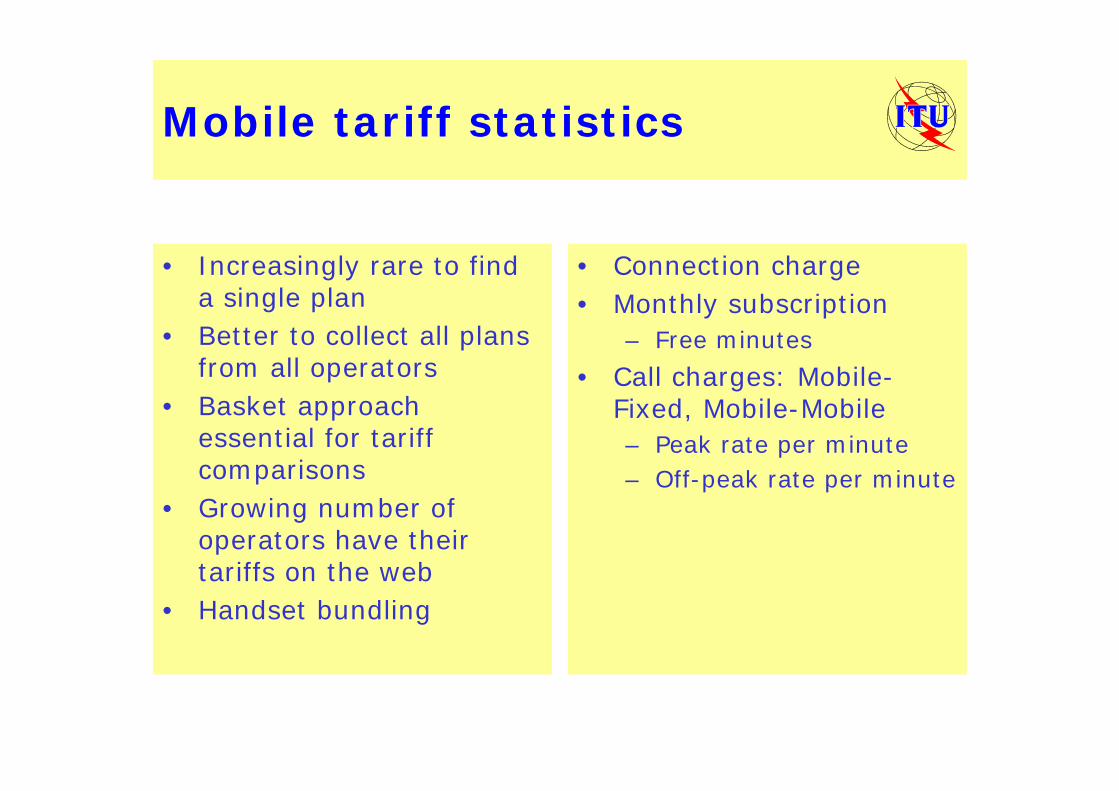
Mobile tariff statistics
• Increasingly rare to finda single plan
• Better to collect all plansfrom all operators
• Basket approachessential for tariffcomparisons
• Growing number ofoperators have theirtariffs on the web
• Handset bundling
• Connection charge• Monthly subscription
– Free minutes• Call charges: Mobile-
Fixed, Mobile-Mobile– Peak rate per minute– Off-peak rate per minute

Mobile tariffs

Mobile communicationsstatistics on the Internet
• Colombia - Ministry of Communications• France - Telecommunication Regulatory
Authority (ART)• Hong Kong SAR - Office of Telecommunication
Authority (OFTA)• United States - Cellular Telecommunication
Industry Association (CTIA)

Colombia

France
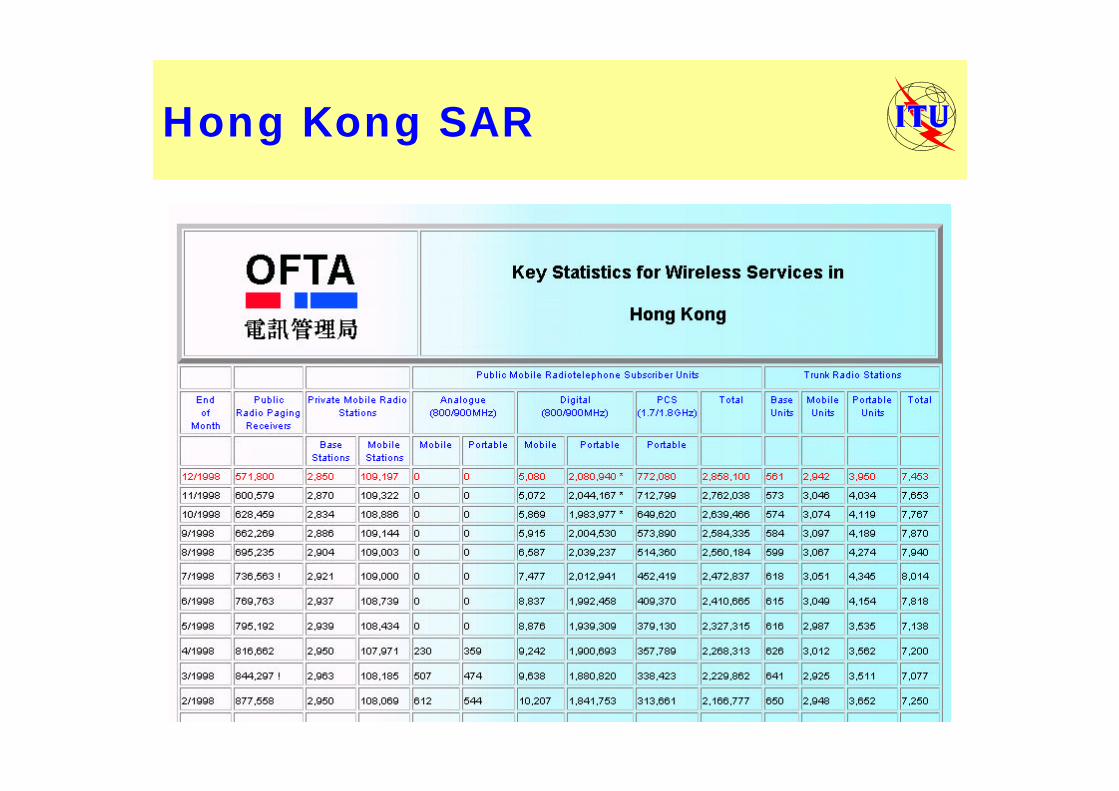
Hong Kong SAR

USA

Mobile statistics in action:Tele Yearbook Denmark ‘97
Mobile subscribers 1’444’016 NMT (Analogue) 232’610 GSM (Digital) 1’211’406Mobile subscribers per100 inhabitants
27.3
Outgoing mobile traffic(1’000 minutes)
1’301’430
Outgoing mobileminutes per subscriber
943
Base stations 3’441Mobile telephonyrevenue (DKK million)
5’030

Mobile tariff statistics inaction: ITU basket for Africa
Operator Connect- Subscr- Peak Off-peak Basket ExchangeCountry Plan ion iption minute minute * Rank rate (to US$) Note
Cote d'Ivoire Comstar 60.35$ 31.04$ 0.32$ 0.32$ 67.97$ 8 579.92 No mention of whether tax is included or not.
Madagascar Sacel Ravinala 28.30$ 15.58$ 0.32$ 0.26$ 46.95$ 5 5300 No mention of whether tax is
included or not.
Malawi TNM 20.41$ 6.80$ 0.02$ 0.02$ 10.77$ 1 44.1 No mention of whether tax is included or not.
Morocco IAM 64.41$ 25.76$ 0.34$ 0.31$ 63.92$ 7 9.315 Excludes tax. Includes roaming.
Mozambique mCel Executivo 93.43$ 42.04$ 0.37$ 0.19$ 77.86$ 9 12416 Including 20% tax.
Namibia MTC 42.46$ 16.99$ 0.24$ 0.15$ 40.40$ 3 5.8875 Includes tax.
South Africa MTN Companion 15.80$ 18.93$ 0.42$ 0.11$ 34.83$ 2 6.0228
Includes 14% VAT. Includes 15 minutes peak and 85 minutes off-peak.
South Africa Vodacom Family Call 15.77$ 18.26$ 0.42$ 0.11$ 46.06$ 4 6.0228 Includes 14% VAT.
ZambiaTelecel IN TOUCH 60 49.00$ 43.50$ 0.40$ 0.28$ 58.78$ 6 1
Excluding tax. Includes 60 free minutes. Prices quoted in US$.
AVERAGE 43.33$ 24.32$ 0.32$ 0.20$ 49.73$


2nd World Telecommunication Indicators Meeting(Geneva, 29 - 31 March 1999)
SOURCE: ITU, SWITZERLAND
TITLE: WORLD TELECOMMUNICATION DEVELOPMENT REPORT 1999MOBILE COMMUNICATIONS QUESTIONNAIRE
________
INTERNATIONAL TELECOMMUNICATION UNION
TELECOMMUNICATIONDEVELOPMENT BUREAUINFORMATION SYSTEMS UNIT
Document WTIM99/30-E26 March 1999Original: English

World Telecommunication Development Report 1999Mobile Communications Questionnaire
Name of country: Fiscal Year to which data refer:? Ending 31 Dec 98 ? Ending 31 March 99 ? Ending 30 June 98 ? Ending 30 September 98
I. Mobile Indicators
Actual Forecast1997 1998 2000 2005 2010
Number of mobile cellularsubscribers Of which: - Analogue-AMPS - Analogue-TACS - Analogue-NMT - Analogue-Other (pleasespecify________________) -Digital-GSM -Digital-D-AMPS (TDMA) -Digital-CDMA -Digital-Other (please specify_______________________)Number of prepaid mobilecellular subscribersNumber of base stations% of population covered% of territory coveredStaff employed by mobilecellular operatorsInvestment in mobile cellularnetworksRevenue from mobile cellular Of which Connection charges Subscription charges Call charges Local National InternationalRoaming charges National InternationalTraffic Incoming minutes to mobilecellular networks Outgoing minutes from mobilecellular networks Of which international roaming

World Telecommunication Development Report 1999Mobile Communications Questionnaire
II. Mobile Cellular Policy and Regulatory2.a. Mobile cellular licensesPlease provide the information below on mobile cellular licenses issued:
Operator Date oflicense
Licensearea
Amount paidfor license
(US$)
Start-update of
operations
System SubscribersDecember
1998
2.b.: Do mobile cellular license holders have any universal service / access obligations?? Yes ? NoIf yes please specify (e.g. coverage requirements, public payphones, tariffs, etc.)
2.c.: Are mobile cellular tariffs regulated? ? Yes ? NoComments:
2.d.: Is Calling Party Pays available? ? Yes ? NoComments:
2.e.: Is there an air interface (e.g., GSM, CDMA, AMPS, TDMA, etc.) standard in your country?? Yes ? No
Comments (including frequency issues, analog phase-out issues, etc.)
2.e.: Please indicate any other relevant mobile cellular policy and regulatory issues:

World Telecommunication Development Report 1999Mobile Communications Questionnaire
III. Mobile Cellular Tariffs
Mobile cellular tariffs are increasingly complex with many plans and options. Therefore we preferthat you attach a document containg all the tariff options for one (or all) of the mobile cellularoperators in your country (preferably the largest by market share). However if such a document isnot available, please complete the table below.
Entry level 100 minutes Pre-paidConnection chargeMonthly RentalPeak rate minute tofixed networkOff peak rate minute tofixed networkPeak rate minute tosame mobile cellularnetworkOff peak rate minute tosame mobile cellularnetworkPeak rate minute toanother mobile cellularnetworkOff peak rate minute toanother mobile cellularnetworkFree minutes includedAre taxes included(Yes/No)Tax rate (in percent)Note (e.g. handsetincluded? If so is itfree or is there apayment?)
What demoninationsdo pre-paid cardscome in?
Any information about handsets would be useful such as models available, prices, import duties,restrictions, etc.

2nd World Telecommunication Indicators Meeting(Geneva, 29 - 31 March 1999)
SOURCE: TOGO TELECOM, TOGO
TITLE: COLLECTION AND DISSEMINATION OF STATISTICS
________
INTERNATIONAL TELECOMMUNICATION UNION
TELECOMMUNICATIONDEVELOPMENT BUREAUINFORMATION SYSTEMS UNIT
Document WTIM99/31-E10 May 1999Original: French

REPUBLIQUE TOGOLAISETRAVAIL - LIBERTE – PATRIE
TOGO TELECOMSECOND WORLD TELECOMMUNICATION
INDICATORS MEETINGGeneva, 29 - 31 March 1999
COLLECTION AND DISSEMINATION OFSTATISTICS
In the TOGO TELECOM company one division deals essentially with statistics andkey business indicators: the Statistics and Key Business Indicators Division (DSTB).
The key business indicators provide the input for the TelecommunicationManagement Information System (SIGET) from which the statistical data as at 31December are extracted.
Indicator collectors and correspondents have been made responsible for the variousstages of the process.
All these players follow a precise transmission schedule and precise informationcircuits which are installed in the the attached diagrams.
Indicators are currently calculated on paper, but an Intranet project is beingdeveloped and the whole system will be automated during 1999.
The Directorate of National Statistics provides us with projections and estimates ondemographic and macroeconomic data.
The division provides statistical data for national and international institutions onrequest.
Lomé, 26 March 1999Chief, Statistics and Key Business Indicators Division
William Séwa D. MENSAH
SOCIETE DES TELECOMMUNICATIONS DU TOGO
Avenue Nicolas GrunitzkyBoîte Postale: 333 LOME - TOGO
Téléphone: 21 – 44 – 01Fax: 21 – 03 - 73
Télex: 5245Télégramme: TOGOTEL TG
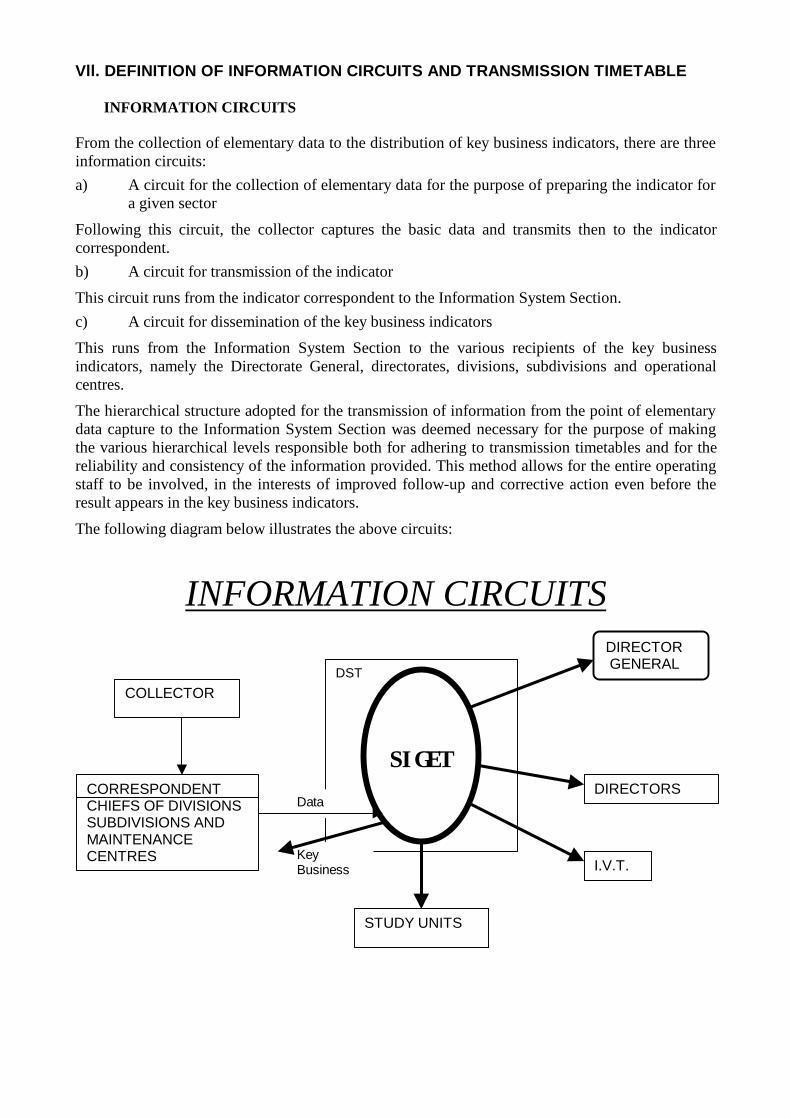
Vll. DEFINITION OF INFORMATION CIRCUITS AND TRANSMISSION TIMETABLE
INFORMATION CIRCUITS
From the collection of elementary data to the distribution of key business indicators, there are threeinformation circuits:a) A circuit for the collection of elementary data for the purpose of preparing the indicator for
a given sector
Following this circuit, the collector captures the basic data and transmits then to the indicatorcorrespondent.b) A circuit for transmission of the indicator
This circuit runs from the indicator correspondent to the Information System Section.c) A circuit for dissemination of the key business indicators
This runs from the Information System Section to the various recipients of the key businessindicators, namely the Directorate General, directorates, divisions, subdivisions and operationalcentres.
The hierarchical structure adopted for the transmission of information from the point of elementarydata capture to the Information System Section was deemed necessary for the purpose of makingthe various hierarchical levels responsible both for adhering to transmission timetables and for thereliability and consistency of the information provided. This method allows for the entire operatingstaff to be involved, in the interests of improved follow-up and corrective action even before theresult appears in the key business indicators.
The following diagram below illustrates the above circuits:
INFORMATION CIRCUITS
DST
SIGET
COLLECTOR
CORRESPONDENTCHIEFS OF DIVISIONSSUBDIVISIONS ANDMAINTENANCECENTRES
DIRECTORS
I.V.T.
STUDY UNITS
Data
DIRECTOR GENERAL
KeyBusiness
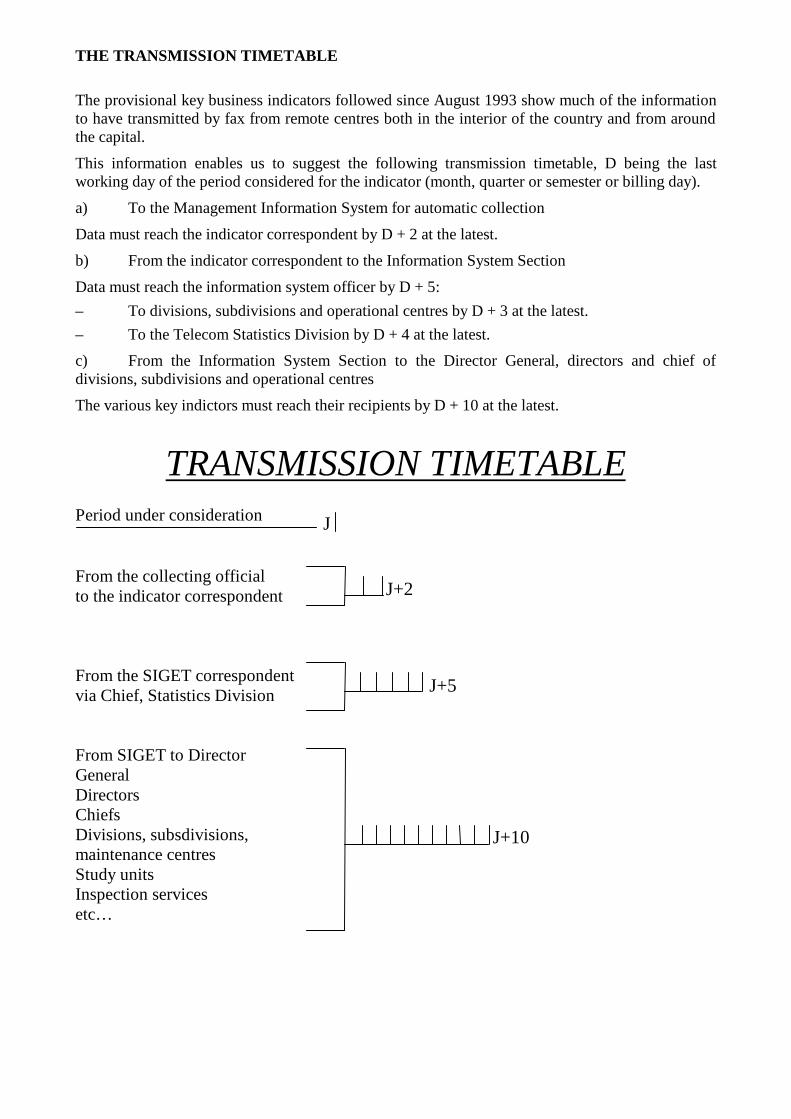
THE TRANSMISSION TIMETABLE
The provisional key business indicators followed since August 1993 show much of the informationto have transmitted by fax from remote centres both in the interior of the country and from aroundthe capital.
This information enables us to suggest the following transmission timetable, D being the lastworking day of the period considered for the indicator (month, quarter or semester or billing day).
a) To the Management Information System for automatic collection
Data must reach the indicator correspondent by D + 2 at the latest.
b) From the indicator correspondent to the Information System Section
Data must reach the information system officer by D + 5:– To divisions, subdivisions and operational centres by D + 3 at the latest.– To the Telecom Statistics Division by D + 4 at the latest.
c) From the Information System Section to the Director General, directors and chief ofdivisions, subdivisions and operational centres
The various key indictors must reach their recipients by D + 10 at the latest.
TRANSMISSION TIMETABLEPeriod under consideration
From the collecting officialto the indicator correspondent
From the SIGET correspondentvia Chief, Statistics Division
From SIGET to DirectorGeneralDirectorsChiefsDivisions, subsdivisions,maintenance centresStudy unitsInspection servicesetc…
J+10
J+5
J+2
J

SYNTHESIS OF STATISTICAL DATA AT 31 DECEMBER 19981994 1995 1996 1997 1998
A - PRODUCTION
I. TELEPHONEInstalled capacity (subscriber equipment)Number of main lines (ML) in serviceTelephone density (ML/100 inhab.)Number of main lines in service in LoméPublic telephones (Payphones + public booths)Private booths declaredFax terminals (estimated)Telephone operation products (millions CFA)Telephone products collected (millions CFA)Staff (employees)Productivity (employees/1000 ML)GSM cellular telephony (installed capacity)Number of subscribers (GSM)
II. TELEXCapacity installed and equipped (circuits and
subscribers)Number of telex lines in service (LPX)Telex products in MFCFATelex products collected in MFCFA
II. OTHER NETWORKSDATA TRANSMISSIONNumber of videotex subscribersInformation providersations
23 61421 400
0,5216 315
145856
4 00012 02010 210
89342
1 497
317220190
853
23 61421 715
0,5316 432
152868
10 00013 80011 730
88841
1 497
301214182
853
26 11224 050
0,5518 545
168962
12 00017 40013 920
86036
1 497
286120102
853
26 11224 920
0,6019 481
1911 163
15 00018 12011 500
85033
10 0003 5000
1 497
2306545
853
47 10431 395
0,7124 705
3211 712
18 00021 06711 793
84126
10 0007 500
1 497
20016068
853

1994 1995 1996 1997 1998Subscribers to X.25 serviceLeased circuitsProducts in MFCFAProducts collected in MFCFAINTERNET ACCESS NODECISCO routersISP (Internet service providers)Users contracts
B. SERVICE QUALITY
I. SWITCHINGEFFICIENCY RATE (%)Local efficiencyLong-distance efficiencyInternational efficiency
II. TRANSMISSIONAVAILABILITY (%)Urban connectionsLong-distance connectionsInternational connections
III. LOCAL NETWORKSClearance speed in 24 hours %Clearance speed in 48 hours %Clearance speed in the month
4162210179
706045
10099,90
98
859599
8164415353
706045
10099,90
99
9097
100
8165165372
706045
10099,90
99
9599
100
8165675230
36
247
706045
10099,90
99
9599
100
8165540210
38
615
706045
10099,90
99
959799

1994 1995 1996 1997 1998
IV. COMMERCIALCollection rate (%) (private subscriber)Global collection rate (%)
V. FINANCIALTurnover (MFCFA)
VI. INTERNATIONAL TRAFFIC (minutes charged)OutgoingIncomingInternational circuits (Number)Including digital (IDR)
C. ENVIRONMENT (MACRO-ECONOMIC DATA
Population (10 X 3) inhabitantsGDP (10 X 9) FCFAGNP (10 X 9) FCFA
8575
14 061
9 003 46410 573 029
296
4 010534.8497.6
8575
15 868
8 487 44711 787 229
275
4 138605.6607.9
8070
19 703
8 637 18316 737 925
225161
4 201704.7
6255
20 192
7 935 89019 892 590
225161
4 264
7560
20 213
314222
4 406

TOGO TELECOMTHE TELECOMMUNICATION LEADER IN TOGO
WITH TOGO TELECOM, LIFE IS EASIER

INTRODUCTION TO TOGO
Togo covers an area of 56 600 km2 and is bounded to the north by Burkina Faso, to the east by Benin, tothe west by Ghana and to the south by the Atlantic Ocean. The population is estimated to be 4 500 000,with a growth rate of 2% per annum. The urbanization rate was 33% in 1997 and about 70% of thepopulation live in rural areas. The telephone density is 0.6 main lines per 100 inhabitants.
Togo is a member of various telecommunication organizations, including:– ITU: International Telecommunication Union;– PATU: Pan-African Telecommunications Union;– INTELSAT: International Telecommunications Satellite Organization;– RASCOM: Regional African Satellite Communications Organization.- etc
SECTORAL POLICY
In order adapt the regulatory and institutional framework of the telecommunication sector to customerrequirements and the world context of globalization and general liberalization of commerce, in February1996 the Togolese Government issued a sectoral policy declaration in which it reaffirmed its will topromote an appropriate policy with a view to encouraging global growth in the sector through marketmechanisms. This will allow private operators to participate in sector development and to satisfy theincreasingly diverse and pressing customer requirements. The principles of this policy are based onseparation of the regulatory and operating functions and the introduction of an objective and independentregulator. A law has just been passed by the National Assembly providing for the establishment of aregulatory body which will be in charge of applying this new sectoral policy of the government.
TOGO TELECOM
TOGO TELECOM is a state-owned company created by the division of OPTT into two such companies. Itis governed by Act No. 90-26 of 4 December 1990 reforming the institutional and legal framework of stateenterprises. It is a legal entity and enjoys financial autonomy, with a capital of 4 billion CFA francs. TOGOTELECOM is responsible for equipping and operating the public telecommunication service and is underthe technical auspices of the Ministry of Posts and Telecommunications. It is planned to open TOGOTELECOM to private investment during 1999.

TOGO TELECOM INFRASTRUCTURES
1- Switched telephone network
TOGO TELECOM has a totally digital automatic telephone network with a capacity of around 26 000 main lines, ofwhich 19 500 serving Lomé. A project nearing completion will increase this capacity to over 46 000 main lines.
The network is piloted by three central switches: two at Lomé and one at Kara. The customer junction units and thecentral switches are interconnected by radio or optical fibre links. Interconnection at the international level is via a type Aearth station. A project is under way to install a second earth station at Kara.
2- Rural telephony network
TOGO TELECOM has a rural telephony network serving over thirty municipalities, essentially prefecture and sub-prefecture administrative centres, through rural service radio equipment. The second phase of this project which began in1997, will also serve around 30 municipalities, continuing the policy of linking up all the regions of Togo, with a target ofone telephone in a radius of 5 km by the year 2000.
3- Telex network
TOGO TELECOM has in service a telex network with a 1 500 line capacity and around 250 subscribers. The network isdeclining in keeping with world trends and is increasingly being replaced by fax and more sophisticated forms of datatransmission.
4- Réseau de transmission de donnéss par Paquets (TOGOPAC)
TOGO TELECOM has a data transmission network using the X.25 connection. The network was brought into service in1988 and its present capacity is 88 ports. It is built around two exchanges, situated at Lomé and Kara. The Loméexchange is linked to the Paris international transit node for international access.
5- GSM Network
TOGO TELECOM has a GSM cellular telephony network with a capacity of 10 000 subscribers, expandable to 150 000subscribers. It was brought into service in September 1997. The network covers all the large towns in Togo and theirsuburbs , making all subscribers potentially reachable. It is planned to establish a subsidiary in which TOGO TELECOMwill have a holding of 40% and will be in charge of technical and commercial operations.
6- Internet access node
TOGO TELECOM has an Internet access node, operational since October 1997. This node provides to the internationalsystem at 256 kbits/s, extendable to 2 Mbits/s, enabling worldwide connectivity.

TOGO TELECOM PRODUCTS AND SERVICES
TOGO TELECOM markets a large number of products and services, including:
ü telephony;ü fax;ü telegraphy;ü mobile telephony (GSM standard);ü Internetü data transmissionü dedicated links;ü community telephony;ü payphone service;ü videotex;ü file transfer;ü value added services (call transfer, call waiting, voice messaging, itemized billing, reminder services,
personal code, etc.)
COMMUNITY TELEPHONY
Community telephony is a new product which TOGO TELECOM has made available torural and urban communities. It allows people in these communities virtually to have atelephone line. They can be called on the telephone number of their locality.
DIRECTION GENERALE / DIRECTION COMMERCIALEAvenue Nicolas GRUNITZKY BP 333 Lomé - TOGO
Tel: 21 44 01 Fax: 21 03 73 Telex: 5245 LE-mail: Togo.télé[email protected]

TELECOMMUNICATIONS NETWORK
GHANABENIN
GULF OF BENIN
BURKINA FASO
Administrative centre withautomatic exchangeDigital radio-relay arteryPlanned linksExisting linksCentral stationsTerminalsPlanned terminalsRelay stationsPlanned relay stations
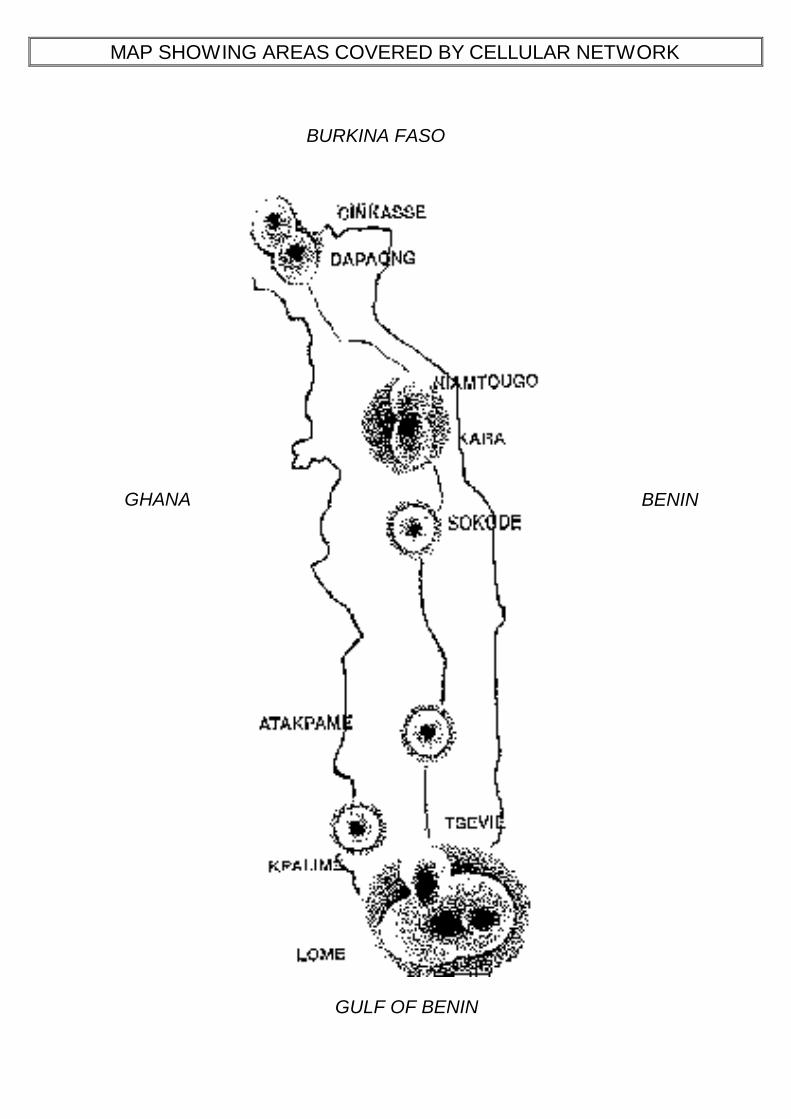
MAP SHOWING AREAS COVERED BY CELLULAR NETWORK
BURKINA FASO
BENINGHANA
GULF OF BENIN


2nd World Telecommunication Indicators Meeting(Geneva, 29 - 31 March 1999)
SOURCE: ITU, SWITZERLAND
TITLE: DATA DEFINITION, DATA COLLECTED BY DIFFERENT ENTITIES (REGULATORS,OPERATORS, STATISTICAL AGENCIES, INDUSTRY ASSOCIATIONS), DATA ONINTERNET
________
INTERNATIONAL TELECOMMUNICATION UNION
TELECOMMUNICATIONDEVELOPMENT BUREAUINFORMATION SYSTEMS UNIT
Document WTIM99/34-E26 March 1999Original: English

Telecom statistics:Definitions, sources & the
Internet
Michael Minges

Telecom statistics definitions
• Definition describing the data• What data to collect• Problems

Telecom statistics definitions
• ITU TelecommunicationIndicator Handbook– Lists most important
indicators and providesdefinitions
– Issued in 1994• National
telecommunicationstatistic publications
http://www.itu.int/ti/papers/handbook/handbook.pdf
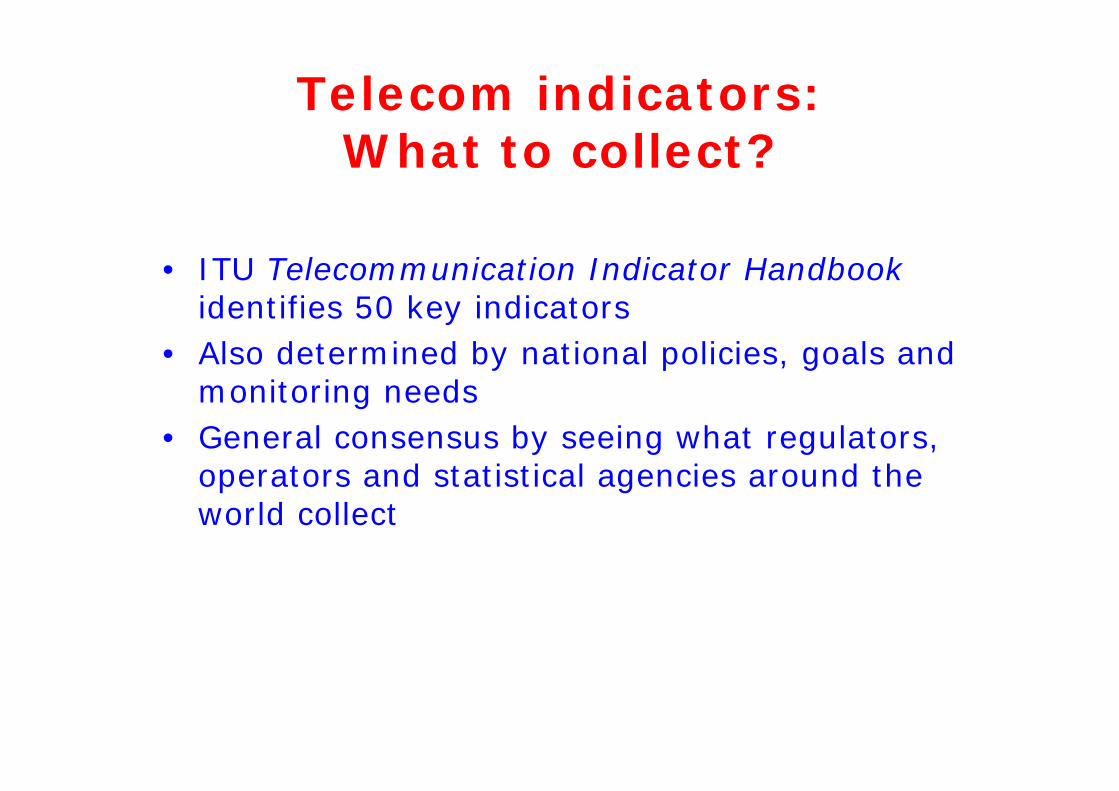
Telecom indicators:What to collect?
• ITU Telecommunication Indicator Handbookidentifies 50 key indicators
• Also determined by national policies, goals andmonitoring needs
• General consensus by seeing what regulators,operators and statistical agencies around theworld collect

Definition issues
• Few problems for network and subscriber data• Financial data more problematic
– Double counting problem– Scope of telecommunication industry

Double counting
• Preferable to covernetwork operators andnot resellers
• Interconnection can leadto double counting
Carrier 1:Revenue 1’000 Telecom service 800 Interconnection 200Costs Interconnection 100
Carrier 2:Revenue 1’000 Telecom service 900 Interconnection 100Costs Interconnection 200
Country revenue:Reported by carriers: 2’000Actual country netrevenue: 1’700

Scope of telecom servicemarket
• Telephone service• Mobile service• Data communications including Internet• Broadcasting (cable and premium television)

Sources of telecom statistics
• Telecom regulators / ministries• National statistical agencies• Operators• Industry associations• Consultants, market researchers• International, regional & bi-lateral government
agencies

Telecom regulators & ministries:Statistics on the Web
•Asia–MPT (Japan)
•http://www.mpt.go.jp/data/index-e.html
–Ofta (Hongkong SAR)•http://www.ofta.gov.hk/index_eng1.html
–TAS (Singapore)•http://www.tas.gov.sg/website/home.nsf/html/indexOnlineServices
–MIC (Korea (Rep.))•http://www.kisdi.re.kr/kisdi/event/mwp9815.gif
•Europe–NTA (Denmark)
•http://www.tst.dk/uk/html/statistics.htm
–OPTA (Norway)•http://www.npt.no/publikasjoner/statistikk/eng_index.htm
–ART (France) (mobile)•http://www.telecom.gouv.fr/english/activ/telecom/mobidec.htm
T-Reg for regulatory links:http://www7.itu.int/treg/queries/z_url.idc
•Americas–CFT (Mexico)
•http://www.cft.gob.mx/html/5_est/indest.html
–MC (Columbia) (Mobile)•http://www.mincomunicaciones.gov.co/estadisticas/index.htm
–FCC (USA)•http://www.fcc.gov/indstats.html

OFTA - Hong Kong SAR
SeeDocument
29

Market InformationOFTEL collects and publishes facts and figures onthe UK telecommunications market directly from
the operators and service providers. Currently over 30 fixedlink operators and the four cellular network operators aretaking part. A full summary of the information is published atthe end of each year and four quarterly updates contain figuresfor the latest quarter available.
Oftel - UK
See Document 21

National statistical agencies
• Very few collect telecomstatistics
• Those that do often haveout-of-date or irrelevantdata
• Generally categorizedunder “Transport andcommunications”
• Source for householdtelephone penetration
• Good examples:– Statistics Canada– Statistics South Africa
(for householdpenetration)
• Good pointer toworldwide statisticalagencies:– Statistics Sweden
http://www.scb.se/scbeng/statbuen.htm

Statistics Canada
http://www.statcan.ca/english/IPS/Data/56-002-XIB.htm

NSO’s relevancy?
Data fromNSOs notalways
relevant orup-to-date
http://www.scb.se/scbeng/svsiffror/svsiffrortrafikeng.htm

Operators
• Many telecom operators have annual reportsand a growing number publish them on theInternet
• In some cases single PTO reflects situation incountry (at least for fixed)
• Some PTOs also publish additional usefulinformation

Operator data

International & bi-lateralagencies
• International organizations: ITU, OECD,Eurostat
• Regional telecom organizations: RCC,Comtelca
• Bi-lateral


Industry associations
Cellular Telecommunication Industry Association(USA)http://www.wow-com.com/statsurv/survey/datasurvey_index.cfm
• Telephone andmobile cellularindustry haveassociations insome countriesthat compilestatistics

Consultants
• Consultants and market researchorganizations also “collect” telecom data
• Methodology often unclear• Reports often very expensive• Exception: When consultants are hired by
regulators to prepare market reports(Sweden)

EMC


Conclusions
• Start now on small scale and refine…• Learn from others...

OFTA - Hong Kong SAR


Denmark

Norway

FCC

Mexico

Colombia


2nd World Telecommunication Indicators Meeting(Geneva, 29 - 31 March 1999)
SOURCE: MS. LAURA MÄNNISTÖ & MR. BEN PETRAZZINI, STRATEGIC PLANNINGUNIT, ITU
TITLE: CHALLENGES TO THE NETWORK 1999
________
INTERNATIONAL TELECOMMUNICATION UNION
TELECOMMUNICATIONDEVELOPMENT BUREAUINFORMATION SYSTEMS UNIT
Document WTIM99/36-E14 May 1999Original: English

Edition 1999Edition 1999ITUITU
The views expressed in this paper are those of the author and do not necessarily reflect the opinions of the ITUor its membership.
Challenges toChallenges tothe Network:the Network:
Internet forInternet forDevelopmentDevelopment

Table of contentsTable of contents
lChap. 1: What is so special about the Internet
lChap 2: Internet in developing countries
lChap 3: Internet for commerce
lChap 4: Internet for health
lChap 5: Internet for education
lChap 6: Internet for PTOs
lChap 7: To regulate or not to regulate

What is so special about theWhat is so special about theInternet (Chap 1)Internet (Chap 1)
lUnderlying technology
lPricing
lTraffic flows and value flows
lUS-centric
lPace of diffusion

1.3 2.24.8
9.4
16.1
29.6
43.2
0
5
10
15
20
25
30
35
40
45
1993 1994 1995 1996 1997 1998 1999
Internet hosts worldwide, millions
Pace of diffusionPace of diffusion
Source: ITU 1999 “Challenges to the Network: Internet for Development”

WWW
Television
PC
Radio
Telephone
4
13
16
38
74
WWW
Television
PC
Radio
Telephone
Years it took to reach 50 million users
Pace of diffusionPace of diffusion

Canada & US
64.1%
Europe24.3%
LAC*1.2%
Africa0.5%
Developing Asia-Pacific
2.9%Other4.6%
Australia, Japan & New
Zealand7.0%
Developed:Developed:312312 host per 10’000 host per 10’000
peoplepeople
Developing:Developing:66 host per 10’000 host per 10’000
peoplepeople
… but quite uneven… but quite uneven
Source: ITU 1999 “Challenges to the Network: Internet for Development”

Global Internet distributionGlobal Internet distribution
l 96% of Internet host computers are inhigh income countries which have only16% of population
lThere are more Internet hosts in Finlandthat in the whole of Latin America and theCaribbean
lThe city of New York has more Internethosts than the whole of Africa

Internet in Developing CountriesInternet in Developing Countries(Chap 2)(Chap 2)
lStatus of Internet in developing countries
lWho is connected
ð wealth - education - gender - location - age
lProblems connecting
ð prices of net access - market structure -
infrastructure - content and language
lGeography of Cyberspace

Commerce on the Internet (Chap 3)Commerce on the Internet (Chap 3)
lGlobal trends
lTrends in developing countries
lRecent developments by region
l Industry analysis
lCost and benefits of e-commerce for
developing countries

4%
4%
6%
17%
35%
56%
Other (Speed,free software)
Availability ofhome page
Marketingopportunities
Low costaccess
E-mail andconnectivity
Better access toinformation
Most positive aspects of the
Internet(% of developing
country firms surveyed)
Why e-commerce?Why e-commerce?

Internet for Health (Chap 4)Internet for Health (Chap 4)
lPoor information, poor health
lConsultation over the Net
lMedical publications and databases
lMedical records online
lEpidemics and natural disasters
lRegulating and financing online health
lTelemedicine and the ITU
Internet for Education (Chap 5)Internet for Education (Chap 5)
lPrimary and secondary education
lTertiary education and research
lTraining and continuing education
lFinancing
lComplementarity & substitution
lEducation in the 21st century

Internet for Education (Chap 5)Internet for Education (Chap 5)
Country Institution Established Students Budget (US$ m.) FacultyTurkey Anadolu University 1982 577’804 [95] 30 1’260China China TV University System 1979 530’000 [94] 1.2 31’000Indonesia Universitas Terbuka 1984 353’000 [95] 21 5’791India Indira Gandhi National Open Univ. 1985 242’000 [95] 10 13’652Thailand Sukhothai Thammathirat Open Univ. 1978 216’800 [95] 46 3’536Korea Korea National Open University 1982 210’578 [96] 79 2’840France Centre Nat. d'Enseignement à Dist. 1939 184’614 [94] 56 4’800UK The Open University 1969 157’450 [95] 300 8’191South Africa University of South Africa 1873 130’000 [95] 128 3’311Iran Payame Noor University 1987 117’000 [95] 13.3 3’665Spain Univ. Nac. de Educación a Distancia 1972 110’000 [95] 129 4’600

Internet for Internet for PTOsPTOs (Chap 6) (Chap 6)
lA new form of competition
lPrice and service trends
l Internet telephony
lNew markets, new applications
lCost and benefits of e-commerce for
developing countries

To regulateTo regulateor not to regulate?or not to regulate?
(Chap 7)(Chap 7)
lContent
lCopyright
lPrivacy
lDomain names
l Jurisdiction
lCompetition policy