traffic safety report statistics - washington, d.c
TRANSCRIPT

d. District Department of Transportation Traffic Safety Division
D.C. Traffic Safety Report Statistics
Traffic Safety Report Statistics
Submitted by:
Michael Baker Jr., Inc.
Submitted to:
2002-2004
June 2005
Table of Contents Introduction ................................................................................................................................. 2 Summary of Findings............................................................................................................ 3 Section 1: General Overview of Crash Trends From 2002-2004........... 4
1.1 Overview of Three Year Trend ....................................................................................4 1.2 Crash Trends – Monthly Summary ..............................................................................6 1.3 Crash Trends – Daily Summary ...................................................................................7 1.4 Crash Trends – Time of Day Summary ........................................................................8 1.5 Crash Trends – Location by DC Quadrant & Police District.......................................10 1.6 Crash Trends – Bridges..............................................................................................12 1.7 Crash Trends – Circles...............................................................................................12 1.8 Crash Trends – Interstates..........................................................................................13 1.9 Crash Trends – Ramps ...............................................................................................13 1.10 Crash Trends – Underpass .........................................................................................14 1.11 Crash Trends – Crashes at Intersections .....................................................................15 1.12 Crash Trends – Crashes by Intersection Control Type ................................................16 1.13 Crash Trends – Type of Collision ..............................................................................17 1.14 Crash Trends – Vehicle Types ...................................................................................19 1.15 Crash Trends – Human Related Major Cause/Contributing Factors – .........................20 1.16 Crash Trends – Pedestrian Crashes ............................................................................22 1.17 Crash Trends – Roadway Illumination Related Factors ..............................................23 1.18 Crash Trends – Roadway Weather Related Factors ....................................................24 1.19 Crash Trends – Hit and Run Summary.......................................................................25 1.20 Crash Trends – Work Zone Summary ........................................................................26 1.21 Crash Trends – Fatalities by Occupant .......................................................................27 1.22 Crash Trends – Fatalities by Gender ..........................................................................27 1.23 Crash Trends – Fatalities by Age ...............................................................................28
Section 2: High Crash Intersections/Corridors................................................ 29 2.1 Introduction ...............................................................................................................29 2.2 Analysis of the Top High Crash Intersections: ...........................................................34 2.3 Analysis of High Crash Corridors/Segments: .............................................................40 2.4 High Crash Corridor: 14th Street, NW .......................................................................42 2.5 High Crash Corridor: New York Avenue, NE & NW.................................................49 2.6 High Crash Corridor: North Capitol Street, NE & NW...............................................57 2.7 High Crash Corridor: Benning Road, NE & SE..........................................................65 2.8 High Crash Corridor: Southern Ave, SE.....................................................................71 2.9 High Crash Corridor: Georgia Ave, NW ....................................................................76 2.10 High Crash Corridor: Florida Ave, NE & NW ...........................................................82 2.11 High Crash Corridor: 16th Street, NW .......................................................................86 2.12 High Crash Corridor: Pennsylvania Ave, SE..............................................................90 2.13 High Crash Corridor: H Street, NW ...........................................................................95 2.14 High Crash Corridor: K Street, NW & NE ...............................................................100 2.15 High Crash Segment: U St, NW...............................................................................104 2.16 High Crash Segment: Rhode Island Ave, NE & NW................................................108

2.17 High Crash Segment: Eastern Ave, NE ....................................................................111 2.18 High Crash Segment: CONSTITUTION AVE, NW.................................................114
Appendix .................................................................................................................................... 117 Section A: General Overview of Crash Trends ....................................................................117

List of Tables Table 1: Total Traffic Crashes in the District of Columbia.....................................................4 Table 2: Pedestrian Crashes ..................................................................................................22 Table 3: High Pedestrian Crash Intersection........................................................................22 Table 4: High Crash Intersections.........................................................................................29 Table 5: High Crash Intersections by City Quadrants .........................................................30 Table 6: High Crash Intersections Fatality Number ............................................................30 Table 7: 2004 Top High Crash Intersections ........................................................................31 Table 8: 2003 Top High Crash Intersections ........................................................................32 Table 9: 2002 Top High Crash Intersections ........................................................................33 Table 10: Top 25 High Crash Intersections ..........................................................................34 Table 11: Top 25 High Crash Intersections by City Quadrants...........................................35 Table 12: Top 25 High Crash Intersections by Wards .........................................................35 Table 13: Type of Collisions at Top 25 High Crash Intersections........................................36 Table 14: Contributing Circumstances at Top 25 High Crash Intersections ......................37 Table 15: Probable Causes for Different Types of Accidents...............................................39 Table 16: High Crash Corridors/Segments...........................................................................40 Table 17: High Crash Corridor: 14th Street, NW ................................................................42 Table 18: High Crash Corridor: 14th Street - Contributing Circumstances.......................43 Table 19: High Crash Corridor: New York Avenue, NE & NW..........................................49 Table 20: High Crash Corridor: New York Avenue - Contributing Circumstances...........50 Table 21: High Crash Corridor: North Capitol Street, NE & NW......................................57 Table 22: High Crash Corridor: North Capitol Street - Contributing Circumstances .......58 Table 23: High Crash Corridor: Benning Road, NE & SE ..................................................65 Table 24: High Crash Corridor: Benning Road - Contributing Circumstances .................65 Table 25: High Crash Corridor: Southern Ave, SE..............................................................71 Table 26: High Crash Corridor: Southern Ave - Contributing Circumstances ..................71 Table 27: High Crash Corridor: Georgia Ave, NW..............................................................76 Table 28: High Crash Corridor: Georgia Ave - Contributing Circumstances ....................76 Table 29: High Crash Corridor: Florida Ave, NE & NW ....................................................82 Table 30: High Crash Corridor: Florida Ave - Contributing Circumstances .....................82 Table 31: High Crash Corridor: 16th Street, NW ................................................................86 Table 32: High Crash Corridor: 16th Street - Contributing Circumstances.......................86 Table 33: High Crash Corridor: Pennsylvania Ave, SE.......................................................90 Table 34: High Crash Corridor: Pennsylvania Ave - Contributing Circumstances ...........90 Table 35: High Crash Corridor: H Street, NW ....................................................................95 Table 36: High Crash Corridor: H Street - Contributing Circumstances...........................95 Table 37: High Crash Corridor: K Street, NW & NE........................................................100 Table 38: High Crash Corridor: K Street - Contributing Circumstances.........................100 Table 39: High Crash Segment: U St, NW..........................................................................104 Table 40: High Crash Segment: U St - Contributing Circumstances ................................104 Table 41: High Crash Segment: Rhode Island Ave, NE & NW .........................................108 Table 42: High Crash Segment: Rhode Island Ave - Contributing Circumstances ..........108 Table 43: High Crash Segment: Eastern Ave, NE ..............................................................111 Table 44: High Crash Segment: Eastern Ave - Contributing Circumstances ...................111

Table 45: High Crash Segment: Constitution Ave, NW .....................................................114 Table 46: High Crash Segment: Constitution Ave - Contributing Circumstances............114

List of Figures Figure 1: Total Crashes 2002-2004...........................................................................................4 Figure 2: Injury Crashes 2002-2004.........................................................................................5 Figure 3: Number of Persons Injured 2002-2004.....................................................................5 Figure 4: Fatalities 2002-2004...................................................................................................5 Figure 5: Total Crashes by Month - 2002-2004........................................................................6 Figure 6: Fatalities by Month - 2002-2004 ...............................................................................6 Figure 7: Total Crashes by Day of Week 2002-2004................................................................7 Figure 8: Fatalities by Day of Week 2002-2004........................................................................7 Figure 9: Peak Hour Crashes ...................................................................................................8 Figure 10: Peak Hour Fatalities................................................................................................8 Figure 11: Time of Highest Crash Occurrence ........................................................................9 Figure 12: Time of Highest Fatalities Occurrence ...................................................................9 Figure 13: City Quadrant Crashes .........................................................................................10 Figure 14: City Quadrant Fatalities .......................................................................................10 Figure 15: Police District Crashes ..........................................................................................11 Figure 16: Police District Fatalities ........................................................................................11 Figure 17 Type of Collisions of the Crashes at Bridges ........................................................12 Figure 18 Type of Collisions of the Crashes at Circles .........................................................13 Figure 19 Type of Collisions of the Crashes at Ramps .........................................................14 Figure 20: Crashes at Intersection .........................................................................................15 Figure 21: Fatalities at Intersection........................................................................................15 Figure 22: Crashes by Intersection Control Type..................................................................16 Figure 23: Fatalities by Intersection Control Type................................................................16 Figure 24: Crashes by Collision Types ...................................................................................17 Figure 25: Fatalities by Collision Types ................................................................................18 Figure 26: Crashes by Vehicle Type.......................................................................................19 Figure 27: Fatalities by Vehicle Type.....................................................................................19 Figure 28: Crashes by Major Cause/Contributing Factors...................................................20 Figure 29: Fatalities by Major Cause/Contributing Factors .................................................21 Figure 30: Crashes by Illumination Conditions.....................................................................23 Figure 31: Fatalities by Illumination Conditions...................................................................23 Figure 32: Crashes by Weather Conditions ...........................................................................24 Figure 33: Fatalities by Weather Conditions .........................................................................24 Figure 34: Hit & Run Crashes................................................................................................25 Figure 35: Hit & Run Fatalities..............................................................................................25 Figure 36: Work Zone Crashes ..............................................................................................26 Figure 37: Work Zone Fatalities ............................................................................................26 Figure 38: Fatalities by Occupant ..........................................................................................27 Figure 39: Fatalities by Gender..............................................................................................27 Figure 40: Fatalities by Age....................................................................................................28 Figure 41: Type of Collisions at Top 25 High Crash Intersections ......................................36 Figure 42: Major Contributing Circumstances at Top 25 High Crash Intersections..........38 Figure 43: GIS Map for High Crash Intersections ...............................................................41 Figure 44: 14TH ST AND CONSTITUTION AVE, NW......................................................43

Figure 45: 14TH ST AND PENNSYLVANIA AVE, NW.....................................................44 Figure 46: 14TH ST AND U ST, NW ....................................................................................44 Figure 47: 14TH ST AND RHODE ISLAND AVE, NW ......................................................45 Figure 48: 14TH ST AND IRVING ST, NW.........................................................................45 Figure 49: 14TH ST AND COLUMBIA RD, NW.................................................................46 Figure 50: 14TH ST AND P ST, NW.....................................................................................46 Figure 51: 14TH ST AND SPRING RD, NW........................................................................46 Figure 52: 14TH ST AND EUCLID ST, NW........................................................................47 Figure 53: 14TH ST AND F ST, NW.....................................................................................47 Figure 54: 14TH ST AND FLORIDA AVE, NW..................................................................48 Figure 55: 14TH ST AND MILITARY RD, NW ..................................................................48 Figure 56: BLADENSBURG RD AND NEW YORK AVE, NE...........................................50 Figure 57: FLORIDA AVE AND NEW YORK AVE, NE ...................................................51 Figure 58: NORTH CAPITOL ST AND NEW YORK AVE, NE/NW ................................51 Figure 59: NEW JERSEY AVE AND NEW YORK AVE, NW...........................................52 Figure 60: MONTANA AVE AND NEW YORK AVE, NE.................................................52 Figure 61: 1ST ST AND NEW YORK AVE, NW.................................................................53 Figure 62: 1ST ST AND NEW YORK AVE, NE..................................................................53 Figure 63: 3RD ST AND NEW YORK AVE, NW................................................................54 Figure 64: 4TH ST AND NEW YORK AVE, NW................................................................54 Figure 65: NEW YORK AVE AND SOUTH DAKOTA AVE, NE......................................54 Figure 66: FENWICK ST AND NEW YORK AVE, NE......................................................55 Figure 67: 16TH ST AND NEW YORK AVE, NE ...............................................................55 Figure 68: FAIRVIEW AVE AND NEW YORK AVE, NE .................................................56 Figure 69: KENDALL ST AND NEW YORK AVE, NE......................................................56 Figure 70: NORTH CAPITOL ST AND NEW YORK AVE ...............................................58 Figure 71: NORTH CAPITOL ST AND MICHIGAN AVE ................................................59 Figure 72: NORTH CAPITOL ST AND CHANNING ST ...................................................59 Figure 73: NORTH CAPITOL ST AND H ST .....................................................................60 Figure 74: NORTH CAPITOL ST AND FLORIDA AVE ...................................................60 Figure 75: NORTH CAPITOL ST AND MASSACHUSETTS AVE ...................................61 Figure 76: NORTH CAPITOL ST AND NEW HAMPSHIRE AVE ...................................61 Figure 77: NORTH CAPITOL ST AND K ST .....................................................................61 Figure 78: NORTH CAPITOL ST AND M ST.....................................................................62 Figure 79: NORTH CAPITOL ST AND RHODE ISLAND AVE .......................................62 Figure 80: NORTH CAPITOL ST AND P ST......................................................................62 Figure 81: NORTH CAPITOL ST AND BRYANT ST ........................................................63 Figure 82: NORTH CAPITOL ST AND HAREWOOD RD................................................63 Figure 83: NORTH CAPITOL ST AND L ST......................................................................63 Figure 84: BENNING RD AND MINNESOTA AVE, NE....................................................66 Figure 85: BENNING RD AND SOUTHERN AVE, SE.......................................................66 Figure 86: EAST CAPITOL ST AND BENNING RD, NE & SE.........................................67 Figure 87: BENNING RD AND OKLAHOMA AVE, NE....................................................67 Figure 88: 34TH ST AND BENNING RD, NE......................................................................67 Figure 89: 17TH ST AND BENNING RD, NE......................................................................68 Figure 90: BENNING RD AND G ST, SE.............................................................................68 Figure 91: 16TH ST AND BENNING RD, NE......................................................................68 Figure 92: 42ND ST AND BENNING RD, NE......................................................................69

Figure 93: ANACOSTIA AVE AND BENNING RD, NE ....................................................69 Figure 94: 21ST ST AND BENNING RD, NE ......................................................................69 Figure 95: 26TH ST AND BENNING RD, NE......................................................................70 Figure 96: Southern Ave and Wheeler Rd ............................................................................72 Figure 97: Chesapeake St and Southern Ave........................................................................72 Figure 98: 13th St and Southern Ave ....................................................................................73 Figure 99: NAYLOR RD AND SOUTHERN AVE ..............................................................73 Figure 100: S Capitol St and Southern Ave ..........................................................................74 Figure 101: East Capitol St and Southern Ave .....................................................................74 Figure 102: Pennsylvania Ave and Southern Ave.................................................................74 Figure 103: BENNING RD AND SOUTHERN AVE ...........................................................75 Figure 104: Central Ave and Southern Ave, SE ...................................................................75 Figure 105: GEORGIA AVE AND MISSOURI AVE, NW...................................................77 Figure 106: BARRY PL AND GEORGIA AVE, NW...........................................................77 Figure 107: GEORGIA AVE AND KENYON ST, NW........................................................78 Figure 108: FLORIDA AVE AND GEORGIA AVE, NW ...................................................78 Figure 109: GEORGIA AVE AND PEABODY ST, NW......................................................78 Figure 110: GEORGIA AVE AND KALMIA RD, NW .......................................................79 Figure 111: GEORGIA AVE AND MORTON ST, NW.......................................................79 Figure 112: GEORGIA AVE AND RANDOLPH ST, NW ..................................................79 Figure 113: GEORGIA AVE AND PARK RD, NW.............................................................80 Figure 114: GEORGIA AVE AND IRVING ST...................................................................80 Figure 115: Florida Ave and New York Ave, NE..................................................................83 Figure 116: North Capitol St and Florida Ave, NE & NW...................................................83 Figure 117: Florida Ave and Georgia Ave, NW....................................................................83 Figure 118: Florida Ave and Rhode Island Ave, NW ...........................................................84 Figure 119: 7th St and Florida Ave, NW...............................................................................84 Figure 120: Florida Ave and West Virginia Ave...................................................................85 Figure 121: 4th St and Florida Ave .......................................................................................85 Figure 122: 14th St and Florida Ave .....................................................................................85 Figure 123: 16th St and U St..................................................................................................87 Figure 124: 16th St and Euclid St..........................................................................................87 Figure 125: 16th St and L St..................................................................................................87 Figure 126: 16th St and Lamont St .......................................................................................88 Figure 127: 16th St and Irving St ..........................................................................................88 Figure 128: 16th St and V St..................................................................................................88 Figure 129: 16th St and Park St ............................................................................................89 Figure 130: 16th St and K St .................................................................................................89 Figure 131: MINNESOTA AVE AND PENNSYLVANIA AVE, SE ...................................91 Figure 132: BRANCH AVE AND PENNSYLVANIA AVE, SE ..........................................91 Figure 133: LENFANT SQ AND PENNSYLVANIA AVE, SE............................................92 Figure 134: FAIRLAWN AVE AND PENNSYLVANIA AVE, SE......................................92 Figure 135: 27TH ST AND PENNSYLVANIA AVE, SE.....................................................92 Figure 136: ALABAMA AVE AND PENNSYLVANIA AVE, SE .......................................93 Figure 137: 30TH ST AND PENNSYLVANIA AVE, SE.....................................................93 Figure 138: PENNSYLVANIA AVE AND SOUTHERN AVE, SE .....................................93 Figure 139: 6th St and H St, NW...........................................................................................96 Figure 140: North Capitol St and H St, NW & NE...............................................................96

Figure 141: 2nd St and H St...................................................................................................97 Figure 142: 7th St and H St ...................................................................................................97 Figure 143: 15th St and H St .................................................................................................98 Figure 144: 6th St and H St ...................................................................................................98 Figure 145: 11th St and H St .................................................................................................99 Figure 146: North Capitol St and K St................................................................................101 Figure 147: 14th St and K St ...............................................................................................101 Figure 148: 16th St and K St ...............................................................................................102 Figure 149: 15th St and K St ...............................................................................................102 Figure 150: 1st St and K St ..................................................................................................103 Figure 151: 17th St and K St ...............................................................................................103 Figure 152: 18th St and K St ...............................................................................................103 Figure 153: 14th St and U St................................................................................................105 Figure 154: 16th St and U St................................................................................................105 Figure 155: 13th St and U St................................................................................................106 Figure 156: 15th St and U St................................................................................................106 Figure 157: 11th St and U St................................................................................................107 Figure 158: 12th St and U St................................................................................................107 Figure 159: North Capitol St and Rhode Island Ave, NE & NW.......................................109 Figure 160: 14th St and Rhode Island Ave, NW.................................................................109 Figure 161: 4th St and Rhode Island Ave............................................................................109 Figure 162: 1st St and Rhode Island Ave ............................................................................110 Figure 163: Florida Ave and Rhode Island Ave..................................................................110 Figure 164: New Jersey Ave and Rhode Island Ave ...........................................................110 Figure 165: Eastern Ave and Minnesota Ave, NE ...............................................................112 Figure 166: Eastern Ave and New Hampshire Ave, NE......................................................112 Figure 167: Eastern Ave and Olive St, NE...........................................................................113 Figure 168: Eastern Ave and Sheriff Rd, NE.......................................................................113 Figure 169: Eastern Ave and Kenilworth Ave, NE..............................................................113 Figure 170: 14th St and Constitution Ave, NW ...................................................................115 Figure 171: 12th St and Constitution Ave, NW ...................................................................115 Figure 172: 9th St and Constitution Ave, NW .....................................................................115 Figure 173: 15th St and Constitution Ave, NW ...................................................................116

List of Appendix Tables
Table A-1: Month of Year.....................................................................................................117 Table A- 2: Month of Year (Percentages) ............................................................................117 Table A- 3 Day of the Week.................................................................................................118 Table A- 4 Day of the Week (Percentages)..........................................................................118 Table A- 5 Rush Hour Crashes............................................................................................118 Table A- 6 Rush Hour Crashes (Percentages of Total).......................................................118 Table A- 7 Time of the Day..................................................................................................119 Table A- 8 Time of the Day (Percentage) ............................................................................120 Table A- 9 City Quadrants ..................................................................................................121 Table A- 10 City Quadrants (Percentage) ...........................................................................121 Table A- 11 Police District ...................................................................................................121 Table A- 12 Police District (Percentage) .............................................................................122 Table A- 13 Crashes by Bridges, Circles, Interstates, Ramps, Underpass.........................122 Table A- 14 2004 Crashes at Underpass..............................................................................122 Table A- 15 2004 Crashes at Circles....................................................................................123 Table A- 16 2004 Crashes at Bridges...................................................................................124 Table A- 17 2004 Crashes at Ramps....................................................................................125 Table A- 18 2004 Crashes along Interstate 395...................................................................126 Table A- 19 2004 Crashes along Interstate 295...................................................................126 Table A- 20 Type of Collision the Crashes at Bridges ........................................................127 Table A- 21 Type of Collision the Crashes at Circles .........................................................128 Table A- 22 Type of Collision the Crashes at Ramps .........................................................129 Table A- 23 Crash by Intersections .....................................................................................130 Table A- 24 Crash by Intersections (Percentages) ..............................................................130 Table A- 25 Intersection Controller Type ...........................................................................131 Table A- 26 Intersection Controller Type (Percentages) ....................................................131 Table A- 27 Type of Collision ..............................................................................................132 Table A- 28 Type of Collision (Percentages) .......................................................................133 Table A- 29 Vehicle Type.....................................................................................................134 Table A- 30 Vehicle Type (Percentages)..............................................................................134 Table A- 31 Major Cause-Contributing Factors.................................................................135 Table A- 32: Major Cause-Contributing Factors (Cont.)...................................................136 Table A- 33 Major Cause-Contributing Factors (Percentages) .........................................137 Table A- 34 Major Cause-Contributing Factors (Cont.) ....................................................138 Table A- 35 Illumination Condition ....................................................................................138 Table A- 36 Weather............................................................................................................139 Table A- 37 Fatality by Type (Percentages) ........................................................................139 Table A- 38 Fatality by Gender (Percentages) ....................................................................140 Table A- 39 Fatality By Ward .............................................................................................140 Table A- 40 Fatality by Age Group (Percentages) ..............................................................141 Table A- 41 Pedestrian Fatalities & Percent of Total Fatalities .........................................141 Table A- 42 Hit & Run Accidents........................................................................................142 Table A- 43 Work zone ........................................................................................................142 Table A- 44 Holiday Crashes & Fatalities...........................................................................143
D.C. Traffic Safety Report Statistics 2002-2004 Michael Baker Jr., Inc. 2
Introduction This project represents the efforts by Baker staff to produce a traffic safety report for calendar years 2002 - 2004 for the District of Columbia. The objective is not only to describe traffic safety facts as well as accident statistics, but also to identify high crash intersections, corridors, and segments to reveal accident patterns in terms of type of collision and cause of accident and to recommend methods to reduce accidents/fatalities. Compared to previously published traffic safety facts, this report incorporates the following new features:
• A more detailed study of total crash, broken out by day of week, month of year, time period, type of collision and major causes;
• More detailed listing of high crash intersections, corridors and segments; • Traffic accident patterns for high crash intersections and corridors; • Major causes for high crash intersections identified and countermeasures suggested.
It utilizes police crash reports to summarize statistical data and locate high risk areas for motorists. Analysis of police collision reports assists in understanding the underlying reasons for collisions, identifying high crash locations that need improvement and developing appropriate countermeasures. Currently the Traffic Safety Division of DDOT compiles traffic accident reports filed by Metropolitan Police Department (MPD) into the Traffic Accident Reporting and Analysis System (TARAS) database. Collision reports are collected and entered on a daily basis. Currently, the system contains reports from 1997 - 2004. All collisions involving injuries are included in the police reports; however, for those crashes resulting only in property damage, a police report is written only when the damage is greater than $1,200. This report provides insight into the various causes and consequences of all types of motor vehicle crashes and assists DDOT in attaining its goal of reducing accidents and fatalities. The report consists of two parts. The first part summarizes traffic safety facts from 2002 to 2004, with accidents categorized by influencing factors, such as time, location, type of collision and major causes. The report provides a review of fatalities data, hit and run and work zone safety data. The second part defines and analyzes locations most prone to accidents, i.e., high crash locations, the accident patterns and suggested countermeasures.

D.C. Traffic Safety Report Statistics 2002-2004 Michael Baker Jr., Inc. 3
Summary of Findings
• Location: The District’s NW quadrant experienced the highest number of crashes with a relatively high amount of fatalities.
• Cause of Crashes: Driver inattention was the major factor in crashes.
• Cause: Speeding was the major factor in fatal crashes.
• Day of Week: On Friday and Saturday, the highest amount of crashes and fatalities
occurred.
• Time of Day: Late evening, 1AM - 3AM, accounted for the majority of fatal crashes.
• Vehicle Occupants: Proportionally, drivers suffered the majority of fatalities.
• Gender: Male drivers experienced the greatest proportional amount of fatalities.
• Age: The age group 21 - 30 experienced the majority of fatalities.
• Fatalities: Pedestrians hit by vehicle represented a significant proportion of fatalities.
• Crash Type: Right angle crashes resulted in the majority of vehicle-to-vehicle fatality collisions.

D.C. Traffic Safety Report Statistics 2002-2004 Michael Baker Jr., Inc. 4
Section 1: General Overview of Crash Trends From 2002-2004 1.1 Overview of Three Year Trend Typically a 3-year span is an insufficient study period when examining long term overall Crash Trends; however, these observations can indicate which areas experience high rate of crashes. Beginning with general trends, Table 1 and Figure 1 display the total number of crashes that occurred from 2002 to 2004 within the DC area. Figure 2 and Figure 3 show that in 2003 the amount of total crashes, injury crashes, persons injured, and numbers of vehicles involved were all declining in comparison to 2002. Unfortunately, this declining trend did not continue into 2004, except for fatalities. Figure 4 indicates that 2004 had the lowest fatality rate in all three years.
Table 1: Total Traffic Crashes in the District of Columbia
2002 2003 2004
Total Crashes 17,768 17,710 18,262
Injury Crashes 5,640 4,735 5,486
Persons Injured 8,804 8,050 8,109
Fatalities 50 68 45
Number of Vehicles Involved 36,585 36,309 36,516
Figure 1: Total Crashes 2002-2004
17768
17710
18262
17400 17600 17800 18000 18200 18400
2002
2003
2004

D.C. Traffic Safety Report Statistics 2002-2004 Michael Baker Jr., Inc. 5
4200 4400 4600 4800 5000 5200 5400 5600 5800
2002
2003
2004
Figure 2: Injury Crashes 2002-2004
Figure 3: Number of Persons Injured 2002-2004
Figure 4: Fatalities 2002-2004
0 10 20 30 40 50 60 70 80
2002
2003
2004
8804
8050
8109
7600 7800 8000 8200 8400 8600 8800 9000
2002
2003
2004

D.C. Traffic Safety Report Statistics 2002-2004 Michael Baker Jr., Inc. 6
1.2 Crash Trends – Monthly Summary Figure 5 and Figure 6 show the distribution by month of total crashes and fatalities, respectively. March and April of 2004 experienced a relatively high amount of crashes and fatalities, with 18.2% of total fatalities occurring in April. Table A-1 and Table A- 2 in Appendix A list the summarized data totals.
Figure 5: Total Crashes by Month - 2002-2004
Figure 6: Fatalities by Month - 2002-2004
0.00%2.00%4.00%6.00%8.00%
10.00%12.00%14.00%16.00%18.00%20.00%
Janu
ary
Februa
ryMarc
hApri
lMay
June Ju
ly
Augus
t
Septem
ber
Octobe
r
Novem
ber
Decem
ber
2002 Fatality2003 Fatality2004 Fatality
0.00%
2.00%
4.00%
6.00%
8.00%
10.00%
12.00%
Janu
ary
Februa
ryMarc
hApri
lMay
June Ju
ly
Augus
t
Septem
ber
Octobe
r
Novem
ber
Decem
ber
2002 Crashes2003 Crashes2004 Crashes

D.C. Traffic Safety Report Statistics 2002-2004 Michael Baker Jr., Inc. 7
1.3 Crash Trends – Daily Summary Figure 7 and Figure 8 show the distribution by day of total crashes and fatalities, respectively. Friday and Saturday during the week experienced higher amounts of crashes and fatalities, with on average 15% and 18% of the crashes and fatalities occurring on these days. Table A- 3 and Table A- 4 in Appendix A list the summarized data totals.
Figure 7: Total Crashes by Day of Week 2002-2004
Figure 8: Fatalities by Day of Week 2002-2004
0.00%2.00%4.00%6.00%8.00%
10.00%12.00%14.00%16.00%18.00%
Sunda
y
Monda
y
Tuesd
ay
Wedne
sday
Thursd
ayFrid
ay
Saturda
y
2002 Crashes2003 Crashes2004 Crashes
0.00%5.00%
10.00%15.00%20.00%25.00%30.00%35.00%
Sunda
y
Monda
y
Tuesd
ay
Wed
nesd
ay
Thursd
ayFrid
ay
Saturda
y
2002 Fatality2003 Fatality2004 Fatality

D.C. Traffic Safety Report Statistics 2002-2004 Michael Baker Jr., Inc. 8
1.4 Crash Trends – Time of Day Summary Total crashes and fatalities distributed by peak hour and time of highest occurrence are displayed in Figure 9, Figure 10, Figure 11 and Figure 12. Experienced and familiar with the local area, morning commuters had lower occurrences of crashes. Generally the afternoon period, which includes drivers who are less experienced or familiar with the area experience more crashes. Late evening crashes, a minor fraction of total crashes, account for the majority of total fatalities. Table A- 5, Table A- 6, Table A- 7 and Table A- 8 in Appendix A list the summarized data totals.
Figure 9: Peak Hour Crashes
Figure 10: Peak Hour Fatalities
0.00%
5.00%
10.00%
15.00%
20.00%
25.00%
7-9 AM 4-7 PM
2002 Crashes2003 Crashes2004 Crashes
0.00%
5.00%
10.00%
15.00%
20.00%
25.00%
7-9 AM 4-7 PM
2002 Fatality2003 Fatality2004 Fatality

D.C. Traffic Safety Report Statistics 2002-2004 Michael Baker Jr., Inc. 9
Figure 11: Time of Highest Crash Occurrence
Figure 12: Time of Highest Fatalities Occurrence
0%1%
2%3%4%5%
6%7%8%9%
10%
Fatality Crashes Fatality Crashes Fatality Crashes
2002 2002 2003 2003 2004 2004
3:00 PM4:00 PM5:00 PM
0%
2%
4%
6%
8%
10%
12%
14%
Fatality Crashes Fatality Crashes Fatality Crashes
2002 2002 2003 2003 2004 2004
9:00 PM
10:00 PM
1:00 AM
2:00 AM
3:00 AM

D.C. Traffic Safety Report Statistics 2002-2004 Michael Baker Jr., Inc. 10
1.5 Crash Trends – Location by DC Quadrant & Police District Total crashes and fatalities distributed by DC Quadrant and DC Police District are displayed in Figure 13, Figure 14, and Figure 15, Figure 16. The NW quadrant experienced the highest amount of crashes as well as a relatively high amount of fatalities. In contrast, NE experienced a lower amount of crashes but a proportionally higher amount of fatalities. Similarly, Police District 1 experienced the highest amount of crashes, but Police District 6 experienced the highest average number of fatalities and District 7 the highest number of fatalities in any one year. Table A- 9, Table A- 10, Table A- 11, and Table A- 12 in Appendix A summarize this data.
Figure 13: City Quadrant Crashes
Figure 14: City Quadrant Fatalities
0%
10%
20%
30%
40%
50%
60%
NW NE SE SW Other
2002 Crashes2003 Crashes2004 Crashes
0%
5%
10%
15%
20%
25%
30%
35%
40%
45%
50%
NW NE SE SW Other
2002 Fatality2003 Fatality2004 Fatality

D.C. Traffic Safety Report Statistics 2002-2004 Michael Baker Jr., Inc. 11
Figure 15: Police District Crashes
Figure 16: Police District Fatalities
0%
5%
10%
15%
20%
25%
1 2 3 4 5 6 7
Unkno
wn
2002 Crashes2003 Crashes2004 Crashes
0%5%
10%15%20%25%30%35%40%
1 2 3 4 5 6 7
Unkno
wn
2002 Fatality2003 Fatality2004 Fatality

D.C. Traffic Safety Report Statistics 2002-2004 Michael Baker Jr., Inc. 12
1.6 Crash Trends – Bridges Table A- 13 in Appendix A summarizes total crashes happened at Bridges, Circles, Interstate 295, Interstate 395, Ramps and Underpass. Table A- 16 list by location in descending order of 2004 Crash at Bridges. Interstate 395 and 14th St Bridge has the highest number of crashes among all accidents on bridges, followed by 14TH ST AND D ST. Figure 17, and shows type of collisions for crashes at Bridges. Rear-End and Sideswiped crashes are the most happened type of crashes.
Figure 17 Type of Collisions of the Crashes at Bridges
0 10 20 30 40 50 60 70
Rear End
Side Swiped
Fixed Object
Head On
Non-Collision Accident
Left Turn Hit Veh.
Backing Hit Parked Veh.
Other
200420032002
1.7 Crash Trends – Circles Table A- 15 list by location in descending order of 2004 Crashes at Circles. Dupont Circle has the highest number of crashes among circles, followed by NEBRASKA AVE AND WARD CIR and 23RD ST AND WASHINGTON CIR. Figure 18 shows type of collisions for crashes at Circles. Rear-End and Sideswiped crashes are the most happened type of crashes, followed by Fixed Objects.

D.C. Traffic Safety Report Statistics 2002-2004 Michael Baker Jr., Inc. 13
Figure 18 Type of Collisions of the Crashes at Circles
0 20 40 60 80 100
Side Swiped
Rear End
Right Angle
Right Turn Hit Veh.
Fixed Object
Parked Vehicle
Ran Off Roadway
Left Turn Hit Veh.
Head On
Straight Hit Ped.
Backing Hit Stopped Vehicle
200420032002
1.8 Crash Trends – Interstates Table A- 18 and Table A- 19 list by location in descending order of 2004 Crashes along Interstate 395 and Interstate 295. INTERSTATE 395 AND THIRD ST and INTERSTATE 395 AND FOURTEENTH ST have the most crashes along Interstate 395. Eastern Ave and Kenilworth Ave has the most crashes along Interstate 295, followed by HOWARD RD AND INTERSTATE 295. 1.9 Crash Trends – Ramps Table A- 17 list by location in descending order of 2004 Crashes at Ramps. INTERSTATE 395 AND PENNSYLVANIA AVE Ramp has the highest number of crashes among ramps. Figure 19 shows type of collisions for crashes at Ramps. Rear-End and Sideswiped crashes are the most happened type of crashes, followed by Fixed Object.

D.C. Traffic Safety Report Statistics 2002-2004 Michael Baker Jr., Inc. 14
Figure 19 Type of Collisions of the Crashes at Ramps
0 10 20 30 40 50 60 70
Rear End
Side Swiped
Fixed Object
Right Turn Hit Veh.
Ran Off Roadway
Left Turn Hit Veh.
Unknown
Straight Hit Ped.
Other
Right Angle
Non-Collision Accident
Head On
200420032002
1.10 Crash Trends – Underpass Table A- 14 list by location in descending order of 2004 Crashes at Underpass.

D.C. Traffic Safety Report Statistics 2002-2004 Michael Baker Jr., Inc. 15
1.11 Crash Trends – Crashes at Intersections Figure 20 and Figure 21 show the total crashes and fatalities within close proximity to an intersection. As can be expected, both crashes and fatalities have a higher frequency of occurrence at intersections. The next section examines the effect of intersection control types. Table A- 23 and Table A- 24 in Appendix A list the summarized data totals.
Figure 20: Crashes at Intersection
Figure 21: Fatalities at Intersection
0%
5%
10%
15%
20%
25%
30%
35%
40%
45%
Not at Intersection At Intersection Within 100' ofIntersection
N/A
2002 Crashes2003 Crashes2004 Crashes
0%
10%
20%
30%
40%
50%
60%
Not at Intersection At Intersection Within 100' ofIntersection
N/A
2002 Fatality2003 Fatality2004 Fatality

D.C. Traffic Safety Report Statistics 2002-2004 Michael Baker Jr., Inc. 16
1.12 Crash Trends – Crashes by Intersection Control Type
Figure 22 and Figure 23 display the distribution of total crashes and fatalities by intersection control type. Signalized intersections have the highest occurrence of crashes and fatalities relative to other control types. Opposing movements and significant amounts of traffic traveling through signalized intersections result in an environment prone to crashes in comparison to other intersection controls. Table A- 25 and Table A- 26 in Appendix A list the summarized data totals.
Figure 22: Crashes by Intersection Control Type
Figure 23: Fatalities by Intersection Control Type
0%
10%
20%
30%
40%
50%
60%
70%
Signalized Stop Sign Yield None Other
2002 Crashes2003 Crashes2004 Crashes
0%
10%
20%
30%
40%
50%
60%
70%
80%
Signalized Stop Sign Yield None Other
2002 Fatality2003 Fatality2004 Fatality
D.C. Traffic Safety Report Statistics 2002-2004 Michael Baker Jr., Inc. 17
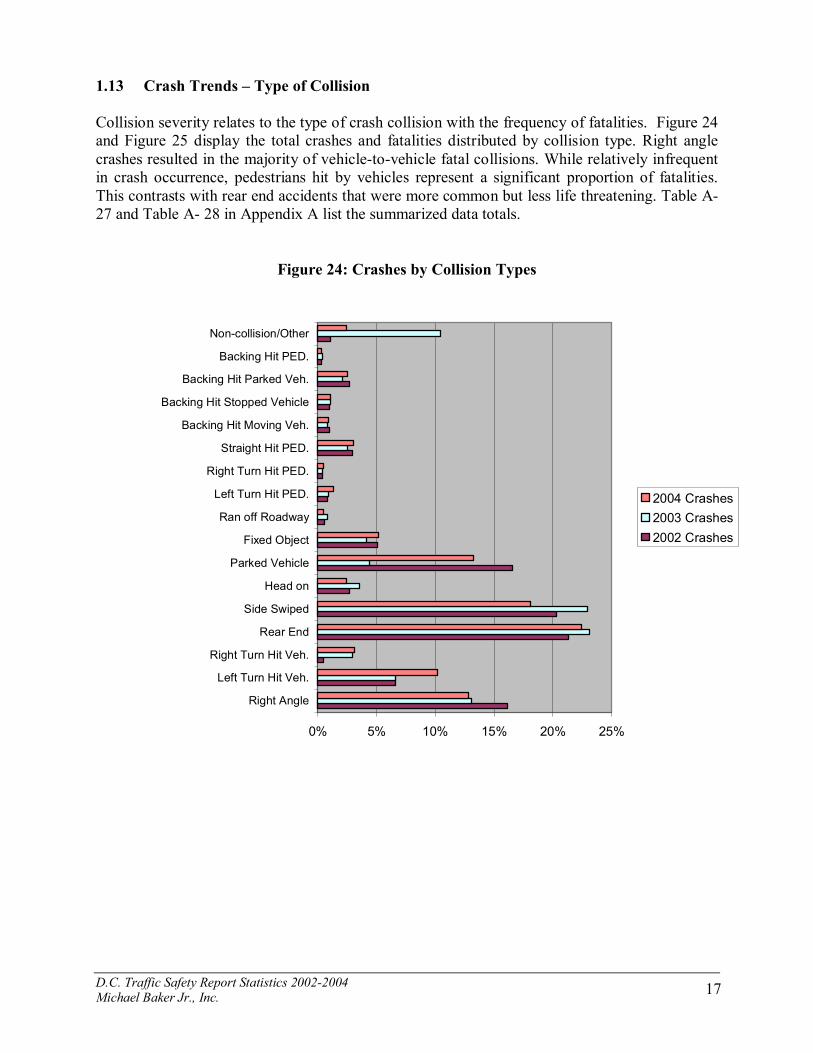
1.13 Crash Trends – Type of Collision Collision severity relates to the type of crash collision with the frequency of fatalities. Figure 24 and Figure 25 display the total crashes and fatalities distributed by collision type. Right angle crashes resulted in the majority of vehicle-to-vehicle fatal collisions. While relatively infrequent in crash occurrence, pedestrians hit by vehicles represent a significant proportion of fatalities. This contrasts with rear end accidents that were more common but less life threatening. Table A- 27 and Table A- 28 in Appendix A list the summarized data totals.
Figure 24: Crashes by Collision Types
0% 5% 10% 15% 20% 25%
Right Angle
Left Turn Hit Veh.
Right Turn Hit Veh.
Rear End
Side Swiped
Head on
Parked Vehicle
Fixed Object
Ran off Roadway
Left Turn Hit PED.
Right Turn Hit PED.
Straight Hit PED.
Backing Hit Moving Veh.
Backing Hit Stopped Vehicle
Backing Hit Parked Veh.
Backing Hit PED.
Non-collision/Other
2004 Crashes2003 Crashes2002 Crashes

D.C. Traffic Safety Report Statistics 2002-2004 Michael Baker Jr., Inc. 18
Figure 25: Fatalities by Collision Types
0% 5% 10% 15% 20% 25% 30% 35% 40%
Right Angle
Left Turn Hit Veh.
Right Turn Hit Veh.
Rear End
Side Swiped
Head on
Parked Vehicle
Fixed Object
Ran off Roadway
Left Turn Hit PED.
Right Turn Hit PED.
Straight Hit PED.
Backing Hit Moving Veh.
Backing Hit Stopped Vehicle
Backing Hit Parked Veh.
Backing Hit PED.
Non-collision/Other
2004 Fatality2003 Fatality2002 Fatality

D.C. Traffic Safety Report Statistics 2002-2004 Michael Baker Jr., Inc. 19
1.14 Crash Trends – Vehicle Types Figure 26 and Figure 27 display the total crashes and fatalities correlated to vehicle type. Table A- 29 and Table A- 30 in Appendix 1.A show the numeric totals.
Figure 26: Crashes by Vehicle Type
Figure 27: Fatalities by Vehicle Type .
0%
10%
20%
30%
40%
50%
60%
70%
80%
90%
Passe
nger A
uto
Taxi C
ab Bus
Motorcy
cle
Truck/Trai
ler
Police
Other/U
nkno
wn
2002 Crashes2003 Crashes2004 Crashes
0%
10%
20%
30%
40%
50%
60%
70%
80%
90%
Passe
nger
Auto
Taxi Cab
Bus
Motorcy
cle
Truck/T
railer
Police
Other/U
nkno
wn
2002 Fatality2003 Fatality2004 Fatality

D.C. Traffic Safety Report Statistics 2002-2004 Michael Baker Jr., Inc. 20
1.15 Crash Trends – Human Related Major Cause/Contributing Factors – Figure 28 and Figure 29 display the human related major causes/contributing factors to crashes and fatalities. The majority of crashes resulted from driver inattention, whereas excess speed caused the majority of fatalities. Table A- 31 and Table A- 33 in Appendix 1.A show the numeric totals.
Figure 28: Crashes by Major Cause/Contributing Factors
0% 5% 10% 15% 20% 25% 30% 35%
Speed
Alcohol Inf luence
Defective Brakes
Follow ing to Close
Auto Right of Way
PED. Right of Way
Improper Turn
Yield Sign
Stop/Go Light
Flashing Light
Directional Light
Stop Sign
Improper Passing
Wrong Way -One Way Street
Wrong Side of the Street
Improper Starting
Other Defects
Pedestrian Violation
Driver Inattention
Changing Lanes W/O Caution
Fail to Set Parking Brake
Open Door To Traff ic
Drug Inf luence
Improper Backing
Defective Lighting
Pedestrian Drunk
Road Defects
Driver Vision Obstructed
Right Turn on Red
Other
2004 Crashes2003 Crashes2002 Crashes

D.C. Traffic Safety Report Statistics 2002-2004 Michael Baker Jr., Inc. 21
Figure 29: Fatalities by Major Cause/Contributing Factors
0% 10% 20% 30% 40% 50% 60% 70%
Speed
Alcohol Influence
Auto Right of Way
PED. Right of Way
Stop/Go Light
Stop Sign
Wrong Side of the Street
Pedestrian Violation
Driver Inattention
Drug Influence
Other
2004 Fatality2003 Fatality2002 Fatality

D.C. Traffic Safety Report Statistics 2002-2004 Michael Baker Jr., Inc. 22
1.16 Crash Trends – Pedestrian Crashes Table 2 lists Pedestrian Crashes. Table 3 lists High Pedestrian Crash Intersection.
Table 2: Pedestrian Crashes
2002 2003 2004
Total Pedestrian Crashes 730 640 681
Pedestrians Injured 734 617 665
Pedestrian Fatalities 8 19 10
Table 3: High Pedestrian Crash Intersection
Location Quad 2002 2003 2004 Total 18TH ST AND COLUMBIA RD NW 3 2 4 9 BENNING RD AND MINNESOTA AVE NE 2 1 4 7 FLORIDA AVE AND GEORGIA AVE NW 2 1 4 7 BLADENSBURG RD AND NEW YORK AVE NE 2 2 3 7 14TH ST AND RHODE ISLAND AVE NW 3 2 2 7 ALABAMA AVE AND STANTON RD SE 4 1 2 7 15TH ST AND I ST NW 5 1 1 7 GEORGIA AVE AND IRVING ST NW 3 3 1 7 HOWARD RD AND MARTIN LUTHER KING AVE SE 5 1 1 7 4TH ST AND RHODE ISLAND AVE NE 0 2 4 6 CHESAPEAKE ST AND SOUTHERN AVE SE 2 0 4 6 16TH ST AND LAMONT ST NW 2 1 3 6 NORTH CAPITOL ST AND K ST NW 3 0 3 6 14TH ST AND SPRING RD NW 3 1 2 6 1ST ST AND K ST NE 3 1 2 6 BLAINE ST AND MINNESOTA AVE NE 3 1 2 6 S CAPITOL ST AND SOUTHERN AVE SE 3 1 2 6 NORTH CAPITOL ST AND NEW YORK AVE NW 4 1 1 6 12TH ST AND PENNSYLVANIA AVE NW 1 0 4 5 13TH ST AND U ST NW 1 1 3 5 GEORGIA AVE AND PARK RD NW 1 1 3 5 14TH ST AND TAYLOR ST NW 2 1 2 5 4TH ST AND M ST SW 1 2 2 5 6TH ST AND H ST NW 1 2 2 5 CONNECTICUT AVE AND L ST NW 2 1 2 5 16TH ST AND BENNING RD NE 2 2 1 5 GEORGIA AVE AND LAMONT ST NW 1 4 0 5 13TH ST AND F ST NW 0 1 3 4 21ST ST AND PENNSYLVANIA AVE NW 0 1 3 4 25TH ST AND GOOD HOPE RD SE 0 1 3 4 29TH ST AND M ST NW 1 0 3 4 14TH ST AND L ST NW 2 0 2 4 7TH ST AND PENNSYLVANIA AVE NW 0 2 2 4 DIX ST AND MINNESOTA AVE NE 2 0 2 4

D.C. Traffic Safety Report Statistics 2002-2004 Michael Baker Jr., Inc. 23
1.17 Crash Trends – Roadway Illumination Related Factors Figure 30 and Figure 31 display the total crashes and fatalities due to roadway illumination conditions. The majority of crashes occurred during daylight conditions, ruling illumination out as a contributing factor. The majority of fatalities occurred during the evening hours, which matches the time of day findings. Table A- 35 in Appendix 1.A shows the numeric totals.
Figure 30: Crashes by Illumination Conditions
Figure 31: Fatalities by Illumination Conditions
0%
10%
20%
30%
40%
50%
60%
70%
Daylight Night/Dark Dawn/Dusk Unknown
2002 Fatality2003 Fatality2004 Fatality
0%
10%
20%
30%
40%
50%
60%
70%
Daylight Night/Dark Daw n/Dusk Unknow n
2002 Crashes
2003 Crashes
2004 Crashes

D.C. Traffic Safety Report Statistics 2002-2004 Michael Baker Jr., Inc. 24
1.18 Crash Trends – Roadway Weather Related Factors Figure 32 and Figure 33 display the total crashes and fatalities distributed by weather condition. The majority of crashes and fatalities occurred when the weather was clear lessening weather as a major cause of crashes. Table A- 36 in Appendix 1.A shows the numeric totals.
Figure 32: Crashes by Weather Conditions
Figure 33: Fatalities by Weather Conditions
0%
10%
20%
30%
40%
50%
60%
70%
80%
90%
100%
Fog/Mist Clear Snow Rain Unknown
2002 Fatality2003 Fatality2004 Fatality
0%
10%
20%
30%
40%
50%
60%
70%
80%
90%
Fog/Mist Clear Snow Rain Unknown
2002 Crashes2003 Crashes2004 Crashes

D.C. Traffic Safety Report Statistics 2002-2004 Michael Baker Jr., Inc. 25
1.19 Crash Trends – Hit and Run Summary Figure 34 and Figure 35 show the correlation of Hit and Run crashes to total crashes and fatalities. Fatalities do not result in the majority of hit and run accidents. Table A- 42 in Appendix 1.A shows the numeric totals.
Figure 34: Hit & Run Crashes
Figure 35: Hit & Run Fatalities
0%
10%
20%
30%
40%
50%
60%
70%
80%
90%
100%
Injury Property Damage Only N/A
200220032004
0.00%
0.02%
0.04%
0.06%
0.08%
0.10%
0.12%
Fatality
2002
20032004

D.C. Traffic Safety Report Statistics 2002-2004 Michael Baker Jr., Inc. 26
1.20 Crash Trends – Work Zone Summary Figure 36 and Figure 37 summarize the total number of crashes and fatalities in relation to Work Zones. Table A- 43 in Appendix 1.A shows the numeric totals.
Figure 36: Work Zone Crashes
Figure 37: Work Zone Fatalities
0
50
100
150
200
250
300
350
Work zone Property Damage Crashes Work zone Injury Crashes
2002
2003
2004
0
0.5
1
1.5
2
2.5
3
3.5
Work zone Fatal Crashes
2002
2003
2004

D.C. Traffic Safety Report Statistics 2002-2004 Michael Baker Jr., Inc. 27
1.21 Crash Trends – Fatalities by Occupant Figure 38 relates the total amount of fatalities with the vehicle occupant. Drivers are the vehicle occupants most likely to suffer the fatality. Table A- 37, Appendix 1.A shows the numeric totals.
Figure 38: Fatalities by Occupant 1.22 Crash Trends – Fatalities by Gender Figure 39 displays the total amount of fatalities by gender. Male drivers experience the greatest amount of fatalities. Table A- 38, Appendix 1.A shows the numeric totals.
Figure 39: Fatalities by Gender
0%
10%
20%
30%
40%
50%
60%
Driver Passenger Pedestrian Motorcycle Bicycle
2002 Fatality
2003 Fatality
2004 Fatality
0%
10%
20%
30%
40%
50%
60%
70%
80%
90%
100%
Male Female N/A
2002 Fatality2003 Fatality2004 Fatality

D.C. Traffic Safety Report Statistics 2002-2004 Michael Baker Jr., Inc. 28
1.23 Crash Trends – Fatalities by Age Figure 40 displays the total amount of fatalities correlated to age. The majority of fatalities correspond to driver in Age Group 21-30. Table A- 40 in Appendix 1.A shows the numeric totals.
Figure 40: Fatalities by Age
0%
5%
10%
15%
20%
25%
30%
35%
40%
45%
50%
Under 10 11 to 20 21 to 30 31 to 40 41 to 50 51 to 60 61 to 70 Over 70 N/A
2002 Fatality2003 Fatality2004 Fatality

D.C. Traffic Safety Report Statistics 2002-2004 Michael Baker Jr., Inc. 29
Section 2: High Crash Intersections/Corridors 2.1 Introduction A high crash intersection is defined as one where more than 10 crashes occur. Applying this standard in a TARAS1 query generates a full list of high crash locations for years 2002-2004. Table 2 indicates that for 2004, 330 intersections have more than 10 accidents, while for 2003 176 intersections have accidents more than 10 accidents. Similarly for 2002, 259 intersections have more than 10 accidents. The number of crashes at these locations in 2002, 2003 and 2004 are 4079, 2685 and 5443, respectively. Although these high crash intersections only reflect 7.6%, 5.5% and 9.2% of the total number of intersections with accidents, the ratios of crashes at high crash intersections to total crashes overall are much higher at 23%, 15.2% and 30%. To reduce the number of crashes in the District, attention should be focused on these locations. Table 2 infers the downtrend from 2003 to 2002 did not continue into 2004. In 2004 the number of high crash intersections and number of crashes spiked. The reason for this jump is not yet known, but may reflect more traffic exposure or better data collection in 2004.
Table 4: High Crash Intersections
Year High Crash Intersections
Crashes at High Crash
Intersections
Intersections with
Accidents (District-
wide)
Total Crashes (District-
wide)
Ratio High Crash
Intersection to Total
Intersections
Ratio of crashes at
High Crash Intersections
to Total Crashes
2002 259 4079 3398 17768 7.6% 23.0% 2003 176 2685 3208 17710 5.5% 15.2% 2004 330 5443 3594 18262 9.2% 29.8%
1 TARAS……

D.C. Traffic Safety Report Statistics 2002-2004 Michael Baker Jr., Inc. 30
In terms of geographic distribution by city quadrants, NW consistently had the highest concentration of high crash locations, followed by NE. SW had the lowest number of high crash locations. This distribution is also generally in line with the total crash and fatality distribution by quadrant (also see previous table).
Table 5: High Crash Intersections by City Quadrants
2002 2003 2004 Number Percent Number Percent Number Percent NW 136 52.5% 101 57.4% 185 56.1% NE 49 18.9% 31 17.6% 69 20.9% SE 46 17.8% 25 14.2% 45 13.6% SW 5 1.9% 1 0.6% 6 1.8%
NE/NW 14 5.4% 12 6.8% 16 4.8% SW/SE 6 2.3% 3 1.7% 6 1.8% NE/SE 3 1.2% 3 1.7% 3 0.9% Total 259 100% 176 100% 330 100%
Fatality numbers are another indicator of high crash intersections. Table 4 indicates that, on average, 15% all fatalities happened at these high crash intersections. At high crash intersections crashes are 4 to 6 times more likely to be fatal than at other intersections.
Table 6: High Crash Intersections Fatality Number
Year Fatality Number Total Fatality Number Percent
2002 5 50 10.0% 2003 13 68 19.1% 2004 7 45 15.6%
Table 5 lists the top 50 high crash intersections for 2004. Other key information is included such as District Quadrant, Number of Accidents, Number of Injuries (number of people injured not number of injury crashes), and fatalities. For better comparison, 2003 and 2002 rank2 also listed.
2 The ranking order is determined by the number of accidents, primarily, then by the number of injuries and then the number of fatalities. If there is the same number of accidents, the order is determined by the number of injuries, if the number of injuries is the same, then it the order is determined by fatalities. If all three numbers are equal, then the intersections have a tied ranking.

D.C. Traffic Safety Report Statistics 2002-2004 Michael Baker Jr., Inc. 31
Table 7: 2004 Top High Crash Intersections 2004 Rank2 Location Quad Accidents Injuries Fatality 2003 Rank2 2002 Rank2
1 BLADENSBURG RD AND NEW YORK AVE NE 71 40 0 1 1 2 FLORIDA AVE AND NEW YORK AVE NE 59 41 0 5 5 3 BENNING RD AND MINNESOTA AVE NE 55 33 0 10 8 4 NORTH CAPITOL ST AND NEW YORK AVE NE/NW 52 33 0 2 2 5 NEW JERSEY AVE AND NEW YORK AVE NW 49 18 0 3 4 6 NORTH CAPITOL ST AND MICHIGAN AVE NE/NW 46 28 0 28 21 7 MONTANA AVE AND NEW YORK AVE NE 45 23 0 4 36 8 FIRTH STERLING AVE AND SUITLAND PKWY SE 44 48 0 9 13 9 S CAPITOL ST AND M ST SW/SE 39 29 0 26 18 10 S CAPITOL ST AND I ST SW/SE 39 15 0 7 9 11 MINNESOTA AVE AND PENNSYLVANIA AVE SE 39 14 0 8 3 12 STANTON RD AND SUITLAND PKWY SE 38 39 0 16 6 13 14TH ST AND CONSTITUTION AVE NW 38 18 1 6 12 14 14TH ST AND PENNSYLVANIA AVE NW 37 8 0 56 14 15 18TH ST AND COLUMBIA RD NW 37 6 0 24 35 16 SOUTHERN AVE AND WHEELER RD SE 36 21 0 31 24 17 NORTH CAPITOL ST AND H ST NE/NW 32 13 0 34 7 18 1ST ST AND NEW YORK AVE NW 31 14 0 21 46 19 BRANCH AVE AND PENNSYLVANIA AVE SE 30 28 0 91 16 20 CHESAPEAKE ST AND SOUTHERN AVE SE 30 22 0 64 97 21 BENNING RD AND SOUTHERN AVE SE 30 20 0 137 62 22 M ST AND WISCONSIN AVE NW 30 3 0 22 15 23 BENNING RD AND OKLAHOMA AVE NE 29 28 0 112 25 24 1ST ST AND NEW YORK AVE NE 29 14 0 12 23 25 GEORGIA AVE AND MISSOURI AVE NW 29 13 0 19 61 26 14TH ST AND K ST NW 29 11 0 18 22 27 EASTERN AVE AND KENILWORTH AVE NE 28 8 0 29 116 28 14TH ST AND U ST NW 28 6 0 13 11 29 NORTH CAPITOL ST AND CHANNING ST NE/NW 27 22 0 175 203 30 LENFANT SQ AND PENNSYLVANIA AVE SE 27 17 0 32 N/A 31 NORTH CAPITOL ST & NEW HAMPSHIRE AVE NE/NW 27 14 0 N/A 99 32 CONNECTICUT AVE AND NEBRASKA AVE NW 27 11 1 44 52 33 EAST CAPITOL ST AND BENNING RD NE/SE 27 11 0 11 10 34 14TH ST AND L ST NW 26 17 0 42 65 35 3RD ST AND D ST NW 25 25 0 N/A N/A 36 NORTH CAPITOL ST AND FLORIDA AVE NE/NW 25 21 0 20 20 37 4TH ST AND RHODE ISLAND AVE NE 25 11 0 86 186 38 NORTH CAPITOL ST & MASSACHUSETTS AVE NE/NW 25 9 0 46 N/A 39 MOUNT OLIVET RD AND WEST VIRGINIA AVE NE 24 17 0 62 53 40 NORTH CAPITOL ST AND K ST NE/NW 24 7 0 15 17 40 14TH ST AND W ST NW 24 6 0 N/A 228 42 FAIRLAWN AVE AND PENNSYLVANIA AVE SE 24 6 0 N/A 19 43 3RD ST AND NEW YORK AVE NW 23 22 0 N/A 104 44 9TH ST AND CONSTITUTION AVE NW 23 19 0 97 213 45 4TH ST AND NEW YORK AVE NW 23 14 0 30 47 46 14TH ST AND INDEPENDENCE AVE SW 23 13 0 36 94 47 34TH ST AND BENNING RD NE 23 11 1 61 190 48 GOOD HOPE RD AND NAYLOR RD SE 23 9 0 N/A 114 49 HOWARD RD AND INTERSTATE 295 NW 23 7 0 N/A N/A 50 14TH ST AND F ST NW 23 6 0 49 44

D.C. Traffic Safety Report Statistics 2002-2004 Michael Baker Jr., Inc. 32
Table 8: 2003 Top High Crash Intersections 2003 Rank2 Location Quad Accidents Injuries Fatality 2002 Rank2
1 BLADENSBURG RD AND NEW YORK AVE NE 82 50 0 1 2 NORTH CAPITOL ST AND NEW YORK AVE NE/NW 49 43 0 2 3 NEW JERSEY AVE AND NEW YORK AVE NW 40 30 0 4 4 MONTANA AVE AND NEW YORK AVE NE 40 22 0 36 5 FLORIDA AVE AND NEW YORK AVE NE 36 19 0 5 6 14TH ST AND CONSTITUTION AVE NW 35 17 0 12 7 S CAPITOL ST AND I ST SW/SE 32 22 0 9 8 MINNESOTA AVE AND PENNSYLVANIA AVE SE 32 21 0 3 9 FIRTH STERLING AVE AND SUITLAND PKWY SE 30 35 0 13 10 BENNING RD AND MINNESOTA AVE NE 30 25 0 8 11 EAST CAPITOL ST AND BENNING RD NE/SE 30 17 0 10 12 1ST ST AND NEW YORK AVE NE 27 20 0 23 13 14TH ST AND U ST NW 27 8 0 11 14 BLADENSBURG RD AND SOUTH DAKOTA AVE NE 26 19 0 69 15 NORTH CAPITOL ST AND K ST NE/NW 25 12 0 17 16 STANTON RD AND SUITLAND PKWY SE 23 19 0 6 17 CALVERT ST AND CONNECTICUT AVE NW 22 13 0 59 18 14TH ST AND K ST NW 22 9 0 22 19 GEORGIA AVE AND MISSOURI AVE NW 21 16 0 61 20 NORTH CAPITOL ST AND FLORIDA AVE NE/NW 21 11 0 20 21 1ST ST AND NEW YORK AVE NW 21 10 3 46 22 M ST AND WISCONSIN AVE NW 21 0 0 15 23 14TH ST AND EUCLID ST NW 20 12 0 119 24 18TH ST AND COLUMBIA RD NW 20 7 0 35 25 7TH ST AND PENNSYLVANIA AVE SE 20 5 0 N/A 26 S CAPITOL ST AND M ST SW/SE 20 4 0 18 27 16TH ST AND U ST NW 20 3 0 27 28 NORTH CAPITOL ST AND MICHIGAN AVE NE/NW 19 17 1 21 29 EASTERN AVE AND KENILWORTH AVE NE 19 6 0 116 30 4TH ST AND NEW YORK AVE NW 18 12 0 47 31 SOUTHERN AVE AND WHEELER RD SE 18 16 0 24 32 LENFANT SQ AND PENNSYLVANIA AVE SE 18 15 0 N/A 33 MINNESOTA AVE AND NANNIE HELEN BURROUGHS AVE NE 18 13 0 43 34 NORTH CAPITOL ST AND H ST NE/NW 18 11 1 7 35 NORTH CAPITOL ST AND HAREWOOD RD NE 18 9 0 N/A 36 14TH ST AND INDEPENDENCE AVE SW 18 5 0 94 37 21ST ST AND K ST NW 18 4 0 N/A 38 GEORGIA AVE AND KALMIA RD NW 17 23 0 109 39 12TH ST AND CONSTITUTION AVE NW 17 8 0 28 39 17TH ST AND BENNING RD NE 17 8 0 33 41 15TH ST AND PENNSYLVANIA AVE NW 17 6 0 N/A 42 14TH ST AND L ST NW 16 29 0 65 43 EAST CAPITOL ST AND SOUTHERN AVE NE/SE 16 17 1 72 44 CONNECTICUT AVE AND NEBRASKA AVE NW 16 14 0 52 45 ALABAMA AVE AND STANTON RD SE 16 10 1 30 46 NORTH CAPITOL ST AND MASSACHUSETTS AVE NE/NW 16 10 0 N/A 47 GEORGIA AVE AND PARK RD NW 16 6 0 111 48 EASTERN AVE AND OLIVE ST NE 16 5 1 158 49 14TH ST AND F ST NW 16 4 0 44 50 CALVERT ST AND WISCONSIN AVE NW 16 1 0 51
D.C. Traffic Safety Report Statistics 2002-2004 Michael Baker Jr., Inc. 33
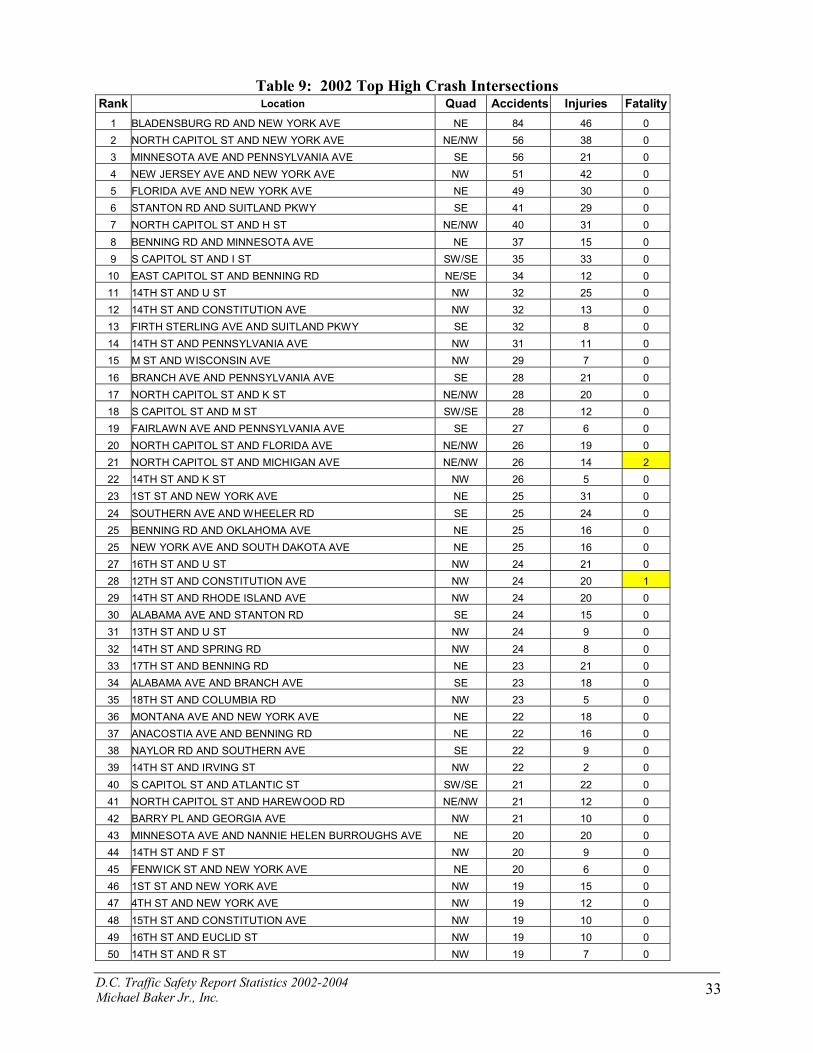
Table 9: 2002 Top High Crash Intersections Rank Location Quad Accidents Injuries Fatality
1 BLADENSBURG RD AND NEW YORK AVE NE 84 46 0 2 NORTH CAPITOL ST AND NEW YORK AVE NE/NW 56 38 0 3 MINNESOTA AVE AND PENNSYLVANIA AVE SE 56 21 0 4 NEW JERSEY AVE AND NEW YORK AVE NW 51 42 0 5 FLORIDA AVE AND NEW YORK AVE NE 49 30 0 6 STANTON RD AND SUITLAND PKWY SE 41 29 0 7 NORTH CAPITOL ST AND H ST NE/NW 40 31 0 8 BENNING RD AND MINNESOTA AVE NE 37 15 0 9 S CAPITOL ST AND I ST SW/SE 35 33 0 10 EAST CAPITOL ST AND BENNING RD NE/SE 34 12 0 11 14TH ST AND U ST NW 32 25 0 12 14TH ST AND CONSTITUTION AVE NW 32 13 0 13 FIRTH STERLING AVE AND SUITLAND PKWY SE 32 8 0 14 14TH ST AND PENNSYLVANIA AVE NW 31 11 0 15 M ST AND WISCONSIN AVE NW 29 7 0 16 BRANCH AVE AND PENNSYLVANIA AVE SE 28 21 0 17 NORTH CAPITOL ST AND K ST NE/NW 28 20 0 18 S CAPITOL ST AND M ST SW/SE 28 12 0 19 FAIRLAWN AVE AND PENNSYLVANIA AVE SE 27 6 0 20 NORTH CAPITOL ST AND FLORIDA AVE NE/NW 26 19 0 21 NORTH CAPITOL ST AND MICHIGAN AVE NE/NW 26 14 2 22 14TH ST AND K ST NW 26 5 0 23 1ST ST AND NEW YORK AVE NE 25 31 0 24 SOUTHERN AVE AND WHEELER RD SE 25 24 0 25 BENNING RD AND OKLAHOMA AVE NE 25 16 0 25 NEW YORK AVE AND SOUTH DAKOTA AVE NE 25 16 0 27 16TH ST AND U ST NW 24 21 0 28 12TH ST AND CONSTITUTION AVE NW 24 20 1 29 14TH ST AND RHODE ISLAND AVE NW 24 20 0 30 ALABAMA AVE AND STANTON RD SE 24 15 0 31 13TH ST AND U ST NW 24 9 0 32 14TH ST AND SPRING RD NW 24 8 0 33 17TH ST AND BENNING RD NE 23 21 0 34 ALABAMA AVE AND BRANCH AVE SE 23 18 0 35 18TH ST AND COLUMBIA RD NW 23 5 0 36 MONTANA AVE AND NEW YORK AVE NE 22 18 0 37 ANACOSTIA AVE AND BENNING RD NE 22 16 0 38 NAYLOR RD AND SOUTHERN AVE SE 22 9 0 39 14TH ST AND IRVING ST NW 22 2 0 40 S CAPITOL ST AND ATLANTIC ST SW/SE 21 22 0 41 NORTH CAPITOL ST AND HAREWOOD RD NE/NW 21 12 0 42 BARRY PL AND GEORGIA AVE NW 21 10 0 43 MINNESOTA AVE AND NANNIE HELEN BURROUGHS AVE NE 20 20 0 44 14TH ST AND F ST NW 20 9 0 45 FENWICK ST AND NEW YORK AVE NE 20 6 0 46 1ST ST AND NEW YORK AVE NW 19 15 0 47 4TH ST AND NEW YORK AVE NW 19 12 0 48 15TH ST AND CONSTITUTION AVE NW 19 10 0 49 16TH ST AND EUCLID ST NW 19 10 0 50 14TH ST AND R ST NW 19 7 0

D.C. Traffic Safety Report Statistics 2002-2004 Michael Baker Jr., Inc. 34
2.2 Analysis of the Top High Crash Intersections: Due to time and budget limits, only most top high crash intersections are analyzed. As seen from Table 4 through Table 6, significant intersections remain in the list although their individual ranking could vary each year. The top 25 high crash intersections are selected based on the following criteria
• Having 30 or more accidents in 2004, or • Ranking remains within top 25 for each year.
For example, 14TH ST AND U ST, NW had 28 accidents in 2004, however, it ranked 13th and 11th in 2003 and 2002, respectively. In 2002 it had 32 accidents, therefore it shows in the list at 24th place.
Table 10: Top 25 High Crash Intersections
Location Quad Ward Acc Injuries Fatality 2004 Rank
2003 Rank
2002 Rank
1 BLADENSBURG RD AND NEW YORK AVE NE 5 71 40 0 1 1 1
2 FLORIDA AVE AND NEW YORK AVE NE 5/6 59 41 0 2 5 5
3 BENNING RD AND MINNESOTA AVE NE 7 55 33 0 3 10 8
4 NORTH CAPITOL ST AND NEW YORK AVE NE/NW 5/6 52 33 0 4 2 2
5 NEW JERSEY AVE AND NEW YORK AVE NW 6 49 18 0 5 3 4
6 NORTH CAPITOL ST AND MICHIGAN AVE NE/NW 5 46 28 0 6 28 21
7 MONTANA AVE AND NEW YORK AVE NE 5 45 23 0 7 4 36
8 FIRTH STERLING AVE AND SUITLAND PKWY SE 8 44 48 0 8 9 13
9 S CAPITOL ST AND M ST SW/SE 6 39 29 0 9 26 18
10 S CAPITOL ST AND I ST SW/SE 6 39 15 0 10 7 9
11 MINNESOTA AVE AND PENNSYLVANIA AVE SE 7/8 39 14 0 11 8 3
12 STANTON RD AND SUITLAND PKWY SE 8 38 39 0 12 16 6
13 14TH ST AND CONSTITUTION AVE NW 2 38 18 1 13 6 12
14 14TH ST AND PENNSYLVANIA AVE NW 2 37 8 0 14 56 14
15 18TH ST AND COLUMBIA RD NW 1 37 6 0 15 24 35
16 SOUTHERN AVE AND WHEELER RD SE 8 36 21 0 16 31 24
17 NORTH CAPITOL ST AND H ST NE/NW 6 32 13 0 17 34 7
18 1ST ST AND NEW YORK AVE NW 5/6 31 14 0 18 21 46
19 BRANCH AVE AND PENNSYLVANIA AVE SE 7 30 28 0 19 91 16
20 CHESAPEAKE ST AND SOUTHERN AVE SE 8 30 22 0 20 64 97
21 BENNING RD AND SOUTHERN AVE SE 7 30 20 0 21 137 62
22 M ST AND WISCONSIN AVE NW 2 30 3 0 22 22 15
23 1ST ST AND NEW YORK AVE NE 5/6 29 14 0 24 12 23
24 14TH ST AND U ST NW 1/2 28 6 0 28 13 11
25 EAST CAPITOL ST AND BENNING RD NE/SE 7 27 11 0 33 11 10
Table 10 lists the Top 25 High Crash Intersections meeting those criteria. All top 20 intersections stay in the list each year.
D.C. Traffic Safety Report Statistics 2002-2004 Michael Baker Jr., Inc. 35
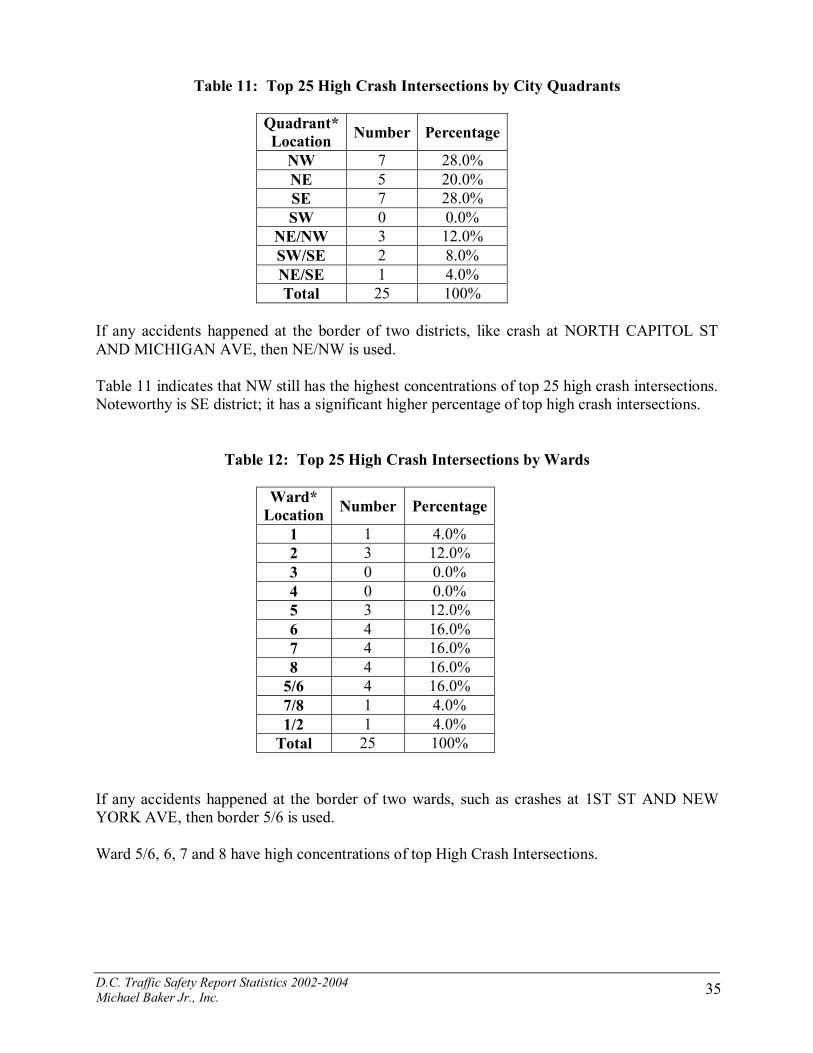
Table 11: Top 25 High Crash Intersections by City Quadrants
Quadrant* Location Number Percentage
NW 7 28.0% NE 5 20.0% SE 7 28.0% SW 0 0.0%
NE/NW 3 12.0% SW/SE 2 8.0% NE/SE 1 4.0% Total 25 100%
If any accidents happened at the border of two districts, like crash at NORTH CAPITOL ST AND MICHIGAN AVE, then NE/NW is used. Table 11 indicates that NW still has the highest concentrations of top 25 high crash intersections. Noteworthy is SE district; it has a significant higher percentage of top high crash intersections.
Table 12: Top 25 High Crash Intersections by Wards
Ward* Location Number Percentage
1 1 4.0% 2 3 12.0% 3 0 0.0% 4 0 0.0% 5 3 12.0% 6 4 16.0% 7 4 16.0% 8 4 16.0%
5/6 4 16.0% 7/8 1 4.0% 1/2 1 4.0%
Total 25 100% If any accidents happened at the border of two wards, such as crashes at 1ST ST AND NEW YORK AVE, then border 5/6 is used. Ward 5/6, 6, 7 and 8 have high concentrations of top High Crash Intersections.

D.C. Traffic Safety Report Statistics 2002-2004 Michael Baker Jr., Inc. 36
Table 13: Type of Collisions at Top 25 High Crash Intersections
Type of Collision 2002 2003 2004 Total Rear End 303 216 320 839 Side Swiped 218 144 199 561 Right Angle 124 102 151 377 Left Turn Hit Veh. 95 68 121 284 Other 5 57 17 79 Straight Hit Ped. 28 12 36 76 Fixed Object 30 15 27 72 Parked Vehicle 26 5 31 62 Right Turn Hit Veh. 6 22 33 61 Head On 15 25 15 55 Backing Hit Parked Veh. 12 7 7 26 Backing Hit Stopped Vehicle 6 12 8 26 Backing Hit Moving Veh. 8 0 5 13 Right Turn Hit Ped. 4 3 4 11 Ran Off Roadway 5 2 4 11 Left Turn Hit Ped. 1 5 4 10 Non-Collision Accident 2 3 3 8 Unknown 0 1 4 5 Backing Hit Ped. 1 2 1 4
Figure 41: Type of Collisions at Top 25 High Crash Intersections
839
561
377
284
79
7672
62 61 552626
Rear End
Side Swiped
Right Angle
Left Turn Hit Veh.
Other
Straight Hit Ped.
Fixed Object
Parked Vehicle
Right Turn Hit Veh.
Head On
Backing Hit Parked Veh.
Backing Hit Stopped Vehicle

D.C. Traffic Safety Report Statistics 2002-2004 Michael Baker Jr., Inc. 37
Table 11 and Figure 39 clearly indicate the majority of crashes for these high crash intersections fall under the type Read End, Side Swiped, Right Angle and Left Turn Hit Vehicle.
Table 14: Contributing Circumstances at Top 25 High Crash Intersections
Contributing Circumstances 2002 2003 2004 Total
Other 240 186 260 686 Driver Inattention 130 109 145 384 Following to Close 102 74 130 306 Auto Right of Way 97 70 99 266 Changing Lanes W/O Caution 74 64 83 221
Stop/Go Light 42 49 63 154 Improper Turn 46 55 53 154 Speed 45 36 49 130 No Violation 44 35 8 87 Improper Backing 17 14 15 46 Pedestrian Violation 12 8 18 38 Improper Passing 15 8 9 32 Alcohol Influence 9 5 14 28 Defective Brakes 9 4 5 18 Ped. Right of Way 6 4 7 17 Wrong Side of the Street 4 2 8 14 Driver Vision Obstructed 5 2 7 14 Open Door to Traffic 5 1 5 11 Other Defects 1 4 2 7 Directional Light 2 1 2 5 Road Defects 2 1 2 5 Yield sign 1 1 2 4 Stop Sign 0 2 1 3 Drug Influence 0 1 2 3 Flashing light 1 0 0 1 Right Turn on Red 0 0 1 1

D.C. Traffic Safety Report Statistics 2002-2004 Michael Baker Jr., Inc. 38
Figure 42: Major Contributing Circumstances at Top 25 High Crash Intersections
686
384
306
266
221
154
154
13087
46383228 Other
Driver Inattention
Following to Close
Auto Right of Way
Chaning Lanes W/O Caution
stop/Go Light
Improper Turn
Speed
No Violation
Improper Backing
Pedestrian Violation
Improper Passing
Alcohol Influence
Table 12 and Figure 40 indicate that the recorded major contributing circumstances for these crashes are Driver Inattention, Following to Close, Auto Right-of-Way, Changing Lanes without Caution, Stop/Go Light, Improper Turn and Speeding. The current TARAS system has certain limitations, such as the lack of police officer accidents charts and descriptions, poor descriptions (“Following Too Close” or “Changing Lanes without Caution”), which do not offer adequate information about the incident. Table 12 lists the general engineering judgment regarding the causes for common crash patterns.

D.C. Traffic Safety Report Statistics 2002-2004 Michael Baker Jr., Inc. 39
Table 15: Probable Causes for Different Types of Accidents
Accident Pattern Probably Cause
Left-turn head-on collisions
• Large volume of left-turns • Restricted sight distance • Too short amber phase • Absence of special left-turning
phase • Excessive speed on approaches
Rear-end collisions at signalized intersections
• Slippery surface • Large number of turning vehicles • Poor visibility of signals • Inadequate signal timing • Unwarranted signals • Inadequate roadway lighting
Right-angle collisions at signalized intersections
• Restricted sight distance • Excessive speed on approaches • Poor visibility of signal • Inadequate signal timing • Inadequate roadway lighting • Inadequate advance intersection
warning signs • Large total intersection volume

D.C. Traffic Safety Report Statistics 2002-2004 Michael Baker Jr., Inc. 40
2.3 Analysis of High Crash Corridors/Segments: From the list of High Crash Intersections above and Figure 43, 11 major high crash corridors and 4 high crash segments can be identified in Table 16. Each meets the following criteria:
1. The intersections in the corridor had at least 30 total crashes from 2002-2004, or an average of at least 10 crashes each year;
2. The Corridor has more than 6 High Crash Intersections on it; and 3. The High Crash Intersections on the Corridor must be reasonably close.
To determine the crash patterns along the corridor, the crashes at each intersection are categorized by type of collision.
Table 16: High Crash Corridors/Segments
High Crash Corridor Number of Intersections
1 14th Street, NW 15 2 New York Avenue, NE & NW 14 3 North Capitol Street, NE & NW 14 4 Benning Rd, NE & SE 12 5 Georgia, NW 10 6 Southern Ave, SE 9 7 Pennsylvania Ave, SE 8 8 Florida Ave, NE& NW 8 9 16th Street, NW 8 10 H Street, NW 7 11 K Street, NW & NE 7 12 U St, NW 6 13 Rhode Island Ave 6 14 Eastern Ave, NE 5 15 Constitution Ave, NW 4

D.C. Traffic Safety Report Statistics 2002-2004 Michael Baker Jr., Inc. 41
Figure 43: GIS Map for High Crash Intersections

D.C. Traffic Safety Report Statistics 2002-2004 Michael Baker Jr., Inc. 42
2.4 High Crash Corridor: 14th Street, NW
Table 17: High Crash Corridor: 14th Street, NW High Crash Corridors High Crash Intersections Total
Crashes Quadrant
14TH ST AND CONSTITUTION AVE 104 NW 14TH ST AND PENNSYLVANIA AVE 82 NW 14TH ST AND U ST 87 NW 14TH ST AND K ST 77 NW 14TH ST AND L ST 59 NW 14TH ST AND W ST 42 NW 14TH ST AND RHODE ISLAND AVE 56 NW 14TH ST AND IRVING ST 56 NW 14TH ST AND COLUMBIA RD 49 NW 14TH ST AND P ST 38 NW 14TH ST AND SPRING RD 42 NW 14TH ST AND EUCLID ST 44 NW 14TH ST AND F ST 58 NW 14TH ST AND FLORIDA AVE 38 NW
14th Street, NW
14TH ST AND MILITARY RD 31 NW
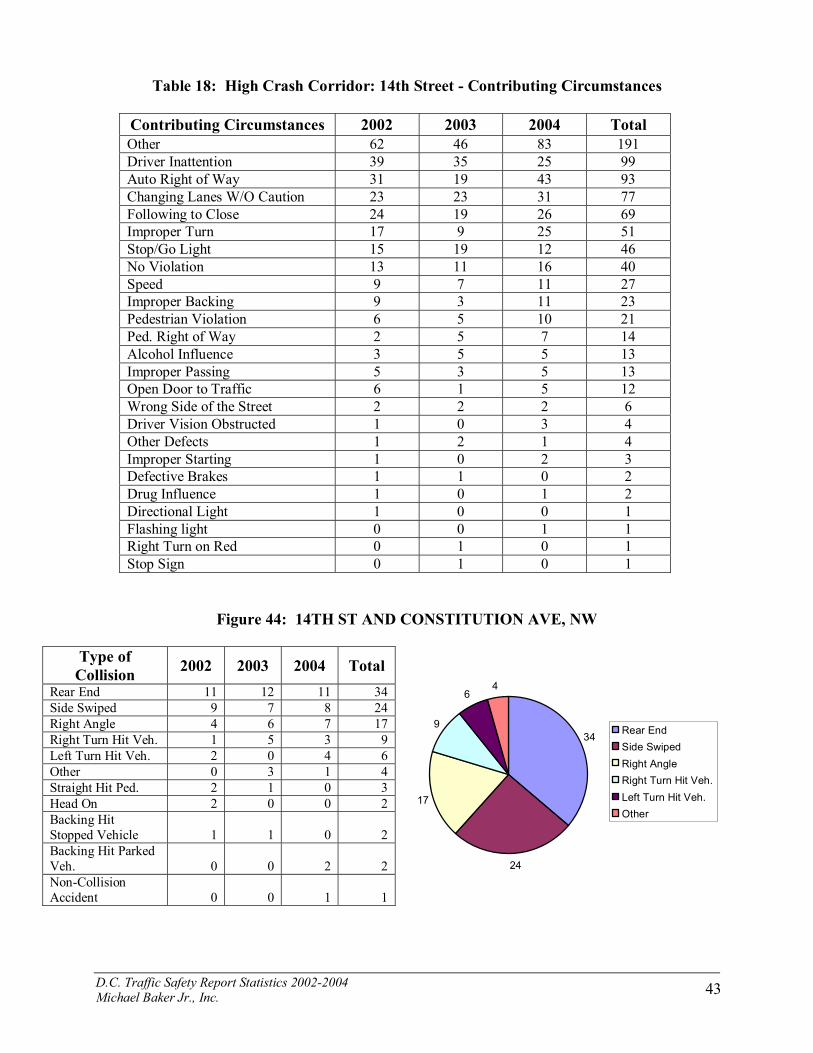
D.C. Traffic Safety Report Statistics 2002-2004 Michael Baker Jr., Inc. 43
Table 18: High Crash Corridor: 14th Street - Contributing Circumstances
Contributing Circumstances 2002 2003 2004 Total Other 62 46 83 191 Driver Inattention 39 35 25 99 Auto Right of Way 31 19 43 93 Changing Lanes W/O Caution 23 23 31 77 Following to Close 24 19 26 69 Improper Turn 17 9 25 51 Stop/Go Light 15 19 12 46 No Violation 13 11 16 40 Speed 9 7 11 27 Improper Backing 9 3 11 23 Pedestrian Violation 6 5 10 21 Ped. Right of Way 2 5 7 14 Alcohol Influence 3 5 5 13 Improper Passing 5 3 5 13 Open Door to Traffic 6 1 5 12 Wrong Side of the Street 2 2 2 6 Driver Vision Obstructed 1 0 3 4 Other Defects 1 2 1 4 Improper Starting 1 0 2 3 Defective Brakes 1 1 0 2 Drug Influence 1 0 1 2 Directional Light 1 0 0 1 Flashing light 0 0 1 1 Right Turn on Red 0 1 0 1 Stop Sign 0 1 0 1
Figure 44: 14TH ST AND CONSTITUTION AVE, NW
Type of Collision 2002 2003 2004 Total
Rear End 11 12 11 34 Side Swiped 9 7 8 24 Right Angle 4 6 7 17 Right Turn Hit Veh. 1 5 3 9 Left Turn Hit Veh. 2 0 4 6 Other 0 3 1 4 Straight Hit Ped. 2 1 0 3 Head On 2 0 0 2 Backing Hit Stopped Vehicle 1 1 0 2 Backing Hit Parked Veh. 0 0 2 2 Non-Collision Accident 0 0 1 1
34
24
17
9
64
Rear EndSide SwipedRight AngleRight Turn Hit Veh.Left Turn Hit Veh.Other

D.C. Traffic Safety Report Statistics 2002-2004 Michael Baker Jr., Inc. 44
Figure 45: 14TH ST AND PENNSYLVANIA AVE, NW
Type of Collision 2002 2003 2004 Total
Side Swiped 12 3 8 23 Rear End 7 3 10 20 Left Turn Hit Veh. 4 0 7 11 Right Angle 1 3 6 10 Straight Hit Ped. 2 1 2 5 Parked Vehicle 2 0 2 4 Backing Hit Moving Veh. 2 0 0 2 Backing Hit Parked Veh. 1 1 0 2 Backing Hit Stopped Vehicle 0 1 1 2 Head On 0 1 0 1 Left Turn Hit Ped. 0 1 0 1 Right Turn Hit Veh. 0 0 1 1
23
20
11
10
54
Side SwipedRear EndLeft Turn Hit Veh.Right AngleStraight Hit Ped.Parked Vehicle
Figure 46: 14TH ST AND U ST, NW
Type of Collision 2002 2003 2004 Total
Side Swiped 16 8 7 31 Rear End 6 5 8 19 Backing Hit Parked Veh. 5 1 1 7 Other 0 5 1 6 Left Turn Hit Veh. 2 1 3 6 Parked Vehicle 1 2 1 4 Right Turn Hit Veh. 0 1 3 4 Right Angle 1 1 1 3 Head On 0 2 0 2 Straight Hit Ped. 1 0 1 2 Backing Hit Ped. 0 1 0 1 Backing Hit Moving Veh. 0 0 1 1 Right Turn Hit Ped. 0 0 1 1
31
19
7
6
6
44 3 Side Swiped
Rear End
Backing Hit ParkedVeh.Other
Left Turn Hit Veh.
Parked Vehicle
Right Turn Hit Veh.
Right Angle

D.C. Traffic Safety Report Statistics 2002-2004 Michael Baker Jr., Inc. 45
Figure 47: 14TH ST AND RHODE ISLAND AVE, NW
Type of Collision 2002 2003 2004 Total
Rear End 9 4 7 20 Side Swiped 6 1 3 10 Parked Vehicle 2 0 3 5 Right Angle 2 2 0 4 Backing Hit Parked Veh. 1 0 3 4 Straight Hit Ped. 1 1 1 3 Left Turn Hit Veh. 0 0 3 3 Left Turn Hit Ped. 1 0 1 2 Other 0 1 1 2 Fixed Object 1 0 0 1 Head On 1 0 0 1
Backing Hit Ped. 0 1 0 1
20
10
5
4
4
33 Rear End
Side Swiped
Parked Vehicle
Right Angle
Backing Hit ParkedVeh.Straight Hit Ped.
Left Turn Hit Veh.
Figure 48: 14TH ST AND IRVING ST, NW
Type of Collision 2002 2003 2004 Total
Side Swiped 11 2 10 23 Rear End 1 3 6 10 Right Angle 4 1 0 5 Parked Vehicle 1 1 3 5 Straight Hit Ped. 2 1 0 3 Backing Hit Stopped Vehicle 1 1 0 2 Left Turn Hit Ped. 0 2 0 2 Right Turn Hit Veh. 0 2 0 2 Fixed Object 1 0 0 1 Head On 1 0 0 1 Backing Hit Parked Veh. 0 1 0 1 Left Turn Hit Veh. 0 0 1 1
23
10
5
5
3
Side Sw iped
Rear End
Right Angle
Parked Vehicle
Straight Hit Ped.

D.C. Traffic Safety Report Statistics 2002-2004 Michael Baker Jr., Inc. 46
Figure 49: 14TH ST AND COLUMBIA RD, NW
Type of Collision 2002 2003 2004 Total
Side Swiped 5 9 7 21 Parked Vehicle 3 0 2 5 Right Angle 2 1 2 5 Straight Hit Ped. 1 1 3 5 Other 0 3 0 3 Rear End 0 1 2 3 Head On 1 0 1 2 Backing Hit Stopped Vehicle 1 0 0 1 Fixed Object 1 0 0 1 Right Turn Hit Ped. 1 0 0 1 Backing Hit Moving Veh. 0 0 1 1 Right Turn Hit Veh. 0 0 1 1
21
5
5
5
33
Side Sw iped
Parked Vehicle
Right Angle
Straight Hit Ped.
Other
Rear End
Figure 50: 14TH ST AND P ST, NW
Type of Collision 2002 2003 2004 Total
Rear End 3 3 6 12 Side Swiped 5 1 4 10 Right Angle 0 2 3 5 Left Turn Hit Veh. 0 2 1 3 Parked Vehicle 2 0 1 3 Other 0 2 0 2 Backing Hit Parked Veh. 0 0 2 2 Left Turn Hit Ped. 0 0 1 1
12
10
5
3
3
Rear End
Side Sw iped
Right Angle
Left Turn Hit Veh.
Parked Vehicle
Figure 51: 14TH ST AND SPRING RD, NW
Type of Collision 2002 2003 2004 Total
Parked Vehicle 8 0 3 11 Side Swiped 8 0 2 10 Rear End 2 1 1 4 Right Angle 2 0 2 4 Left Turn Hit Ped. 0 2 1 3 Straight Hit Ped. 1 1 0 2 Backing Hit Parked Veh. 0 0 2 2 Left Turn Hit Veh. 0 0 2 2 Fixed Object 1 0 0 1 Head On 1 0 0 1 Right Turn Hit Veh. 1 0 0 1 Right Turn Hit Ped. 0 0 1 1
11
104
4
3
22
2 Parked Vehicle
Side Sw iped
Rear End
Right Angle
Left Turn Hit Ped.
Straight Hit Ped.
Backing Hit ParkedVeh.Left Turn Hit Veh.

D.C. Traffic Safety Report Statistics 2002-2004 Michael Baker Jr., Inc. 47
Figure 52: 14TH ST AND EUCLID ST, NW
Type of
Collision 2002 2003 2004 Total Right Angle 4 3 1 8 Side Swiped 2 4 2 8 Rear End 0 6 1 7 Left Turn Hit Veh. 2 2 1 5 Parked Vehicle 3 0 1 4 Other 0 2 1 3 Head On 1 0 2 3 Straight Hit Ped. 0 2 0 2 Backing Hit Parked Veh. 1 0 0 1 Right Turn Hit Ped. 0 1 0 1 Backing Hit Stopped Vehicle 0 0 1 1 Right Turn Hit Veh. 0 0 1 1
8
8
7
5
4
33
Right Angle
Side Sw iped
Rear End
Left Turn Hit Veh.
Parked Vehicle
Other
Head On
Figure 53: 14TH ST AND F ST, NW
Type of
Collision 2002 2003 2004 Total Rear End 7 5 5 17 Side Swiped 5 6 6 17 Right Turn Hit Veh. 2 1 3 6 Left Turn Hit Veh. 2 0 4 6 Right Angle 1 2 1 4 Parked Vehicle 0 2 1 3 Head On 1 0 0 1 Left Turn Hit Ped. 1 0 0 1 Backing Hit Moving Veh. 0 0 1 1 Backing Hit Stopped Vehicle 0 0 1 1 Non-Collision Accident 0 0 1 1
17
17
6
6
43
Rear End
Side Sw iped
Right Turn Hit Veh.
Left Turn Hit Veh.
Right Angle
Parked Vehicle

D.C. Traffic Safety Report Statistics 2002-2004 Michael Baker Jr., Inc. 48
Figure 54: 14TH ST AND FLORIDA AVE, NW
Type of Collision 2002 2003 2004 Total
Rear End 2 2 5 9 Left Turn Hit Veh. 3 2 2 7 Right Angle 4 1 0 5 Side Swiped 1 0 4 5 Parked Vehicle 2 0 1 3 Right Turn Hit Veh. 1 1 1 3 Backing Hit Moving Veh. 2 0 0 2 Backing Hit Stopped Vehicle 0 1 0 1 Backing Hit Parked Veh. 1 0 0 1 Left Turn Hit Ped. 0 0 1 1 Straight Hit Ped. 0 0 1 1
9
7
5
5
3
3
2 1Rear End
Left Turn Hit Veh.
Right Angle
Side Swiped
Parked Vehicle
Right Turn Hit Veh.
Backing Hit M oving Veh.
Backing Hit Stopped Vehicle
Figure 55: 14TH ST AND MILITARY RD, NW
Type of Collision 2002 2003 2004 Total
Right Angle 3 4 3 10 Rear End 1 3 3 7 Left Turn Hit Veh. 1 1 4 6 Fixed Object 0 1 2 3 Parked Vehicle 0 0 2 2 Side Swiped 0 0 2 2
Right Turn Hit Veh. 0 1 0 1
10
7
6
3
22
Right Angle
Rear End
Left Turn Hit Veh.
Fixed Object
Parked Vehicle
Side Sw iped
The two most common collision types along 14th St, NW were Rear-End and Side Swipes. Three intersections, 14TH ST AND U ST, 14TH ST AND IRVING ST, 14TH ST AND COLUMBIA RD were the locations of a large number of Side-Swiped crashes. The intersection of 14TH ST AND SPRING RD had many Parked Vehicle Accident problems. Parked vehicles were involved in accidents at each intersection along the corridor during the 3 year study period. The intersection of 14TH ST AND EUCLID ST had more serious Right-Angle problems than Rear-End or any other type of crashes. Pedestrians were struck at all but one intersection along the corridor at some point over the 3 years.

D.C. Traffic Safety Report Statistics 2002-2004 Michael Baker Jr., Inc. 49
2.5 High Crash Corridor: New York Avenue, NE & NW
Table 19: High Crash Corridor: New York Avenue, NE & NW
Corridor Intersections Total Crashes Quad
BLADENSBURG RD AND NEW YORK AVE 237 NE
FLORIDA AVE AND NEW YORK AVE 144 NE NORTH CAPITOL ST AND NEW YORK AVE 157 NE/NW
NEW JERSEY AVE AND NEW YORK AVE 139 NW
MONTANA AVE AND NEW YORK AVE 107 NE 1ST ST AND NEW YORK AVE 71 NW 1ST ST AND NEW YORK AVE 81 NE 3RD ST AND NEW YORK AVE 43 NW 4TH ST AND NEW YORK AVE 60 NW NEW YORK AVE AND SOUTH DAKOTA AVE 61 NE
FENWICK ST AND NEW YORK AVE 50 NE 16TH ST AND NEW YORK AVE 44 NE FAIRVIEW AVE AND NEW YORK AVE 36 NE
New York Avenue, NE & NW
KENDALL ST AND NEW YORK AVE 39 NE

D.C. Traffic Safety Report Statistics 2002-2004 Michael Baker Jr., Inc. 50
Table 20: High Crash Corridor: New York Avenue - Contributing Circumstances
Contributing Circumstances 2002 2003 2004 Total Other 90 68 96 254Following to Close 75 52 77 204Driver Inattention 61 57 77 195Changing Lanes W/O Caution 39 34 52 125Auto Right of Way 34 27 29 90Stop/Go Light 23 29 22 74Speed 23 17 33 73Improper Turn 21 32 19 72No Violation 20 21 18 59Alcohol Influence 2 5 8 15Improper Backing 3 9 3 15Improper Passing 4 4 3 11Defective Brakes 3 3 3 9Driver Vision Obstructed 2 2 5 9Other Defects 3 4 1 8Pedestrian Violation 2 3 3 8Ped. Right of Way 2 1 1 4Wrong Side of the Street 1 0 3 4Directional Light 2 0 1 3Road Defects 2 0 1 3Yield Sign 1 1 1 3Stop Sign 0 1 1 2Drug Influence 0 1 0 1Flashing light 1 0 0 1
Figure 56: BLADENSBURG RD AND NEW YORK AVE, NE
Type of Collision 2002 2003 2004 TotalRear End 35 31 30 96 Side Swiped 19 16 14 49 Left Turn Hit Veh. 10 6 11 27 Right Angle 7 9 3 19 Fixed Object 6 4 4 14 Backing Hit Stopped Vehicle 2 5 0 7
Other 0 7 0 7 Straight Hit Ped. 2 1 3 6 Head On 2 0 2 4 Right Turn Hit Veh. 0 1 2 3 Ran Off Roadway 0 1 1 2 Backing Hit Parked Veh. 0 0 1 1
Left Turn Hit Ped. 0 1 0 1 Parked Vehicle 1 0 0 1
96
49
27
19
147 7 6 43
Rear End
Side Sw iped
Left Turn Hit Veh.
Right Angle
Fixed Object
Backing Hit Stopped Vehicle
Other
Straight Hit Ped.
Head On
Right Turn Hit Veh.

D.C. Traffic Safety Report Statistics 2002-2004 Michael Baker Jr., Inc. 51
Figure 57: FLORIDA AVE AND NEW YORK AVE, NE
Type of Collision 2002 2003 2004 TotalRear End 31 20 32 83 Side Swiped 8 10 9 27 Right Angle 4 4 10 18 Left Turn Hit Veh. 2 1 1 4 Right Turn Hit Veh. 1 0 2 3 Fixed Object 1 0 1 2 Head On 0 1 1 2 Other 0 0 2 2 Backing Hit Stopped Vehicle 1 0 0 1
Left Turn Hit Ped. 1 0 0 1
Parked Vehicle 0 0 1 1
8327
18
32 4 22Rear End
Side Sw iped
Right Angle
Right Turn Hit Veh.
Other
Left Turn Hit Veh.
Head On
Fixed Object
Figure 58: NORTH CAPITOL ST AND NEW YORK AVE, NE/NW
Type of Collision 2002 2003 2004 Total
Side Swiped 15 11 15 41 Rear End 15 12 13 40 Right Angle 7 10 4 21 Left Turn Hit Veh. 10 4 6 20 Other 0 6 2 8 Straight Hit Ped. 4 2 2 8 Head On 0 3 2 5 Parked Vehicle 2 0 2 4 Right Turn Hit Veh. 1 0 3 4
Fixed Object 1 0 1 2 Right Turn Hit Ped. 1 0 0 1
Backing Hit Parked Veh. 0 1 0 1
Non-Collision Accident 0 0 1 1
Backing Hit Stopped Vehicle 0 0 1 1
41
4021
20
88 5
Side SwipedRear EndRight AngleLeft Turn Hit Veh.OtherStraight Hit Ped.Head On

D.C. Traffic Safety Report Statistics 2002-2004 Michael Baker Jr., Inc. 52
Figure 59: NEW JERSEY AVE AND NEW YORK AVE, NW
Type of
Collision 2002 2003 2004 Total Right Angle 30 15 23 68 Side Swiped 8 7 12 27 Rear End 6 3 8 17 Left Turn Hit Veh. 1 5 0 6 Other 0 3 1 4 Right Turn Hit Veh. 1 0 3 4
Head On 0 3 0 3 Right Turn Hit Ped. 2 0 0 2
Fixed Object 1 1 0 2 Straight Hit Ped. 0 0 2 2 Parked Vehicle 1 0 0 1 Ran Off Roadway 1 0 0 1 Left Turn Hit Ped. 0 1 0 1 Unknown 0 1 0 1
68
27
17
6 4 4
Right AngleSide SwipedRear EndLeft Turn Hit Veh.OtherRight Turn Hit Veh.
Figure 60: MONTANA AVE AND NEW YORK AVE, NE
Type of Collision 2002 2003 2004 Total
Rear End 14 19 19 52 Side Swiped 6 7 14 27 Right Angle 1 6 4 11 Left Turn Hit Veh. 1 4 2 7 Other 0 2 1 3 Right Turn Hit Veh. 0 1 1 2
Backing Hit Stopped Vehicle 0 1 0 1
Backing Hit Parked Veh. 0 0 1 1
Parked Vehicle 0 0 1 1 Straight Hit Ped. 0 0 1 1 Unknown 0 0 1 1
52
27
11
7 3
Rear EndSide SwipedRight AngleLeft Turn Hit Veh.Other

D.C. Traffic Safety Report Statistics 2002-2004 Michael Baker Jr., Inc. 53
Figure 61: 1ST ST AND NEW YORK AVE, NW
Type of
Collision 2002 2003 2004 Total Rear End 7 11 18 36 Side Swiped 4 5 8 17 Right Angle 3 2 1 6 Left Turn Hit Veh. 3 1 2 6 Head On 1 0 1 2 Fixed Object 1 0 0 1 Right Turn Hit Ped. 0 1 0 1
Right Turn Hit Veh. 0 1 0 1
Left Turn Hit Ped. 0 0 1 1
36
17
6
6
Rear EndSide SwipedRight AngleLeft Turn Hit Veh.
Figure 62: 1ST ST AND NEW YORK AVE, NE
Type of Collision 2002 2003 2004 Total
Rear End 11 5 13 29 Left Turn Hit Veh. 4 5 7 16 Side Swiped 6 4 2 12 Right Angle 2 6 2 10 Straight Hit Ped. 1 1 1 3 Right Turn Hit Veh. 0 1 2 3
Head On 0 1 1 2 Non-Collision Accident 1 0 0 1
Other 0 1 0 1 Backing Hit Ped. 0 1 0 1 Fixed Object 0 1 0 1 Parked Vehicle 0 1 0 1 Backing Hit Moving Veh. 0 0 1 1
29
16
12
10
3 3
Rear End
Left Turn Hit Veh.
Side Sw iped
Right Angle
Straight Hit Ped.
Right Turn Hit Veh.

D.C. Traffic Safety Report Statistics 2002-2004 Michael Baker Jr., Inc. 54
Figure 63: 3RD ST AND NEW YORK AVE, NW
Type of Collision 2002 2003 2004 Total
Rear End 5 3 12 20 Side Swiped 3 1 5 9 Left Turn Hit Veh. 2 0 3 5 Fixed Object 3 0 0 3 Right Angle 0 2 0 2 Right Turn Hit Veh. 0 0 2 2
Parked Vehicle 1 0 0 1
Right Turn Hit Ped.
0 0 1 1
20
9
5
3
Rear EndSide SwipedLeft Turn Hit Veh.Fixed Object
Figure 64: 4TH ST AND NEW YORK AVE, NW
Type of Collision 2002 2003 2004 Total
Rear End 9 7 6 22 Side Swiped 3 5 6 14 Left Turn Hit Veh. 2 3 2 7 Fixed Object 4 0 1 5 Head On 0 0 4 4 Right Angle 1 2 0 3 Straight Hit Ped. 0 1 0 1 Backing Hit Moving Veh. 0 0 1 1 Ran Off Roadway 0 0 1 1 Right Turn Hit Ped. 0 0 1 1 Right Turn Hit Veh. 0 0 1 1
22
14
7
5
43
Rear End
Side Sw iped
Left Turn Hit Veh.
Fixed Object
Head On
Right Angle
Figure 65: NEW YORK AVE AND SOUTH DAKOTA AVE, NE
Type of Collision 2002 2003 2004 Total
Rear End 16 5 13 34 Side Swiped 4 5 5 14 Fixed Object 3 2 4 9 Backing Hit Stopped Vehicle 1 0 0 1 Other 1 0 0 1 Head On 0 1 0 1
Non-Collision Accident 0 1 0 1
3414
9
Rear End
Side Sw iped
Fixed Object

D.C. Traffic Safety Report Statistics 2002-2004 Michael Baker Jr., Inc. 55
Figure 66: FENWICK ST AND NEW YORK AVE, NE
Type of
Collision 2002 2003 2004 Total Rear End 10 3 11 24 Side Swiped 6 2 4 12 Straight Hit Ped. 0 2 1 3 Left Turn Hit Veh. 1 0 2 3 Right Angle 2 0 0 2 Backing Hit Stopped Vehicle 0 1 1 2 Fixed Object 1 0 1 2 Other 0 1 0 1
Head On 0 0 1 1
24
12
3
32 2 2 Rear End
Side Swiped
Straight Hit Ped.
Left Turn Hit Veh.
Right Angle
Backing HitStopped VehicleFixed Object
Figure 67: 16TH ST AND NEW YORK AVE, NE
Type of Collision 2002 2003 2004 Total
Rear End 10 7 11 28 Side Swiped 2 3 2 7 Left Turn Hit Veh. 2 0 1 3 Right Angle 1 0 2 3 Other 1 1 0 2
Backing Hit Moving Veh. 0 0 1 1
28
7
33
Rear End
Side Sw iped
Left Turn Hit Veh.
Right Angle

D.C. Traffic Safety Report Statistics 2002-2004 Michael Baker Jr., Inc. 56
Figure 68: FAIRVIEW AVE AND NEW YORK AVE, NE
Type of Collision 2002 2003 2004 Total
Rear End 8 3 9 20 Side Swiped 2 2 2 6 Right Angle 1 0 2 3 Parked Vehicle 2 0 0 2 Left Turn Hit Veh. 0 1 1 2 Other 1 0 0 1 Head On 0 0 1 1
Right Turn Hit Veh. 0 0 1 1
206
3
22
Rear EndSide SwipedRight AngleParked VehicleLeft Turn Hit Veh.
Figure 69: KENDALL ST AND NEW YORK AVE, NE
Type of Collision 2002 2003 2004 Total
Rear End 12 7 5 24 Side Swiped 0 3 1 4 Left Turn Hit Veh. 0 1 3 4 Head On 2 0 0 2 Ran Off Roadway 2 0 0 2 Fixed Object 1 1 0 2
Backing Hit Stopped Vehicle 0 1 0 1
24
4
4
Rear End
Side Sw iped
Left Turn Hit Veh.
The four most common collision types on New York Ave were Read-End, Side-Swipes, Right Angle and Left Turn Hit Vehicle. Read-Ends occurred most frequently at most intersections along the New York Avenue Corridor, followed by Side Swipes. An exception to this trend is the intersection of New Jersey Ave and New York Ave, where the majority of accidents were Right Angles. At a majority of the intersections, a pedestrian was struck. Although less significant, incidents with parked vehicles occurred at more than half of the intersections and incidents involving fixed objects occurred at most intersections. Head on collisions were not common, but did occur at all but three of the intersections along this corridor during the 2002-2004 time period.
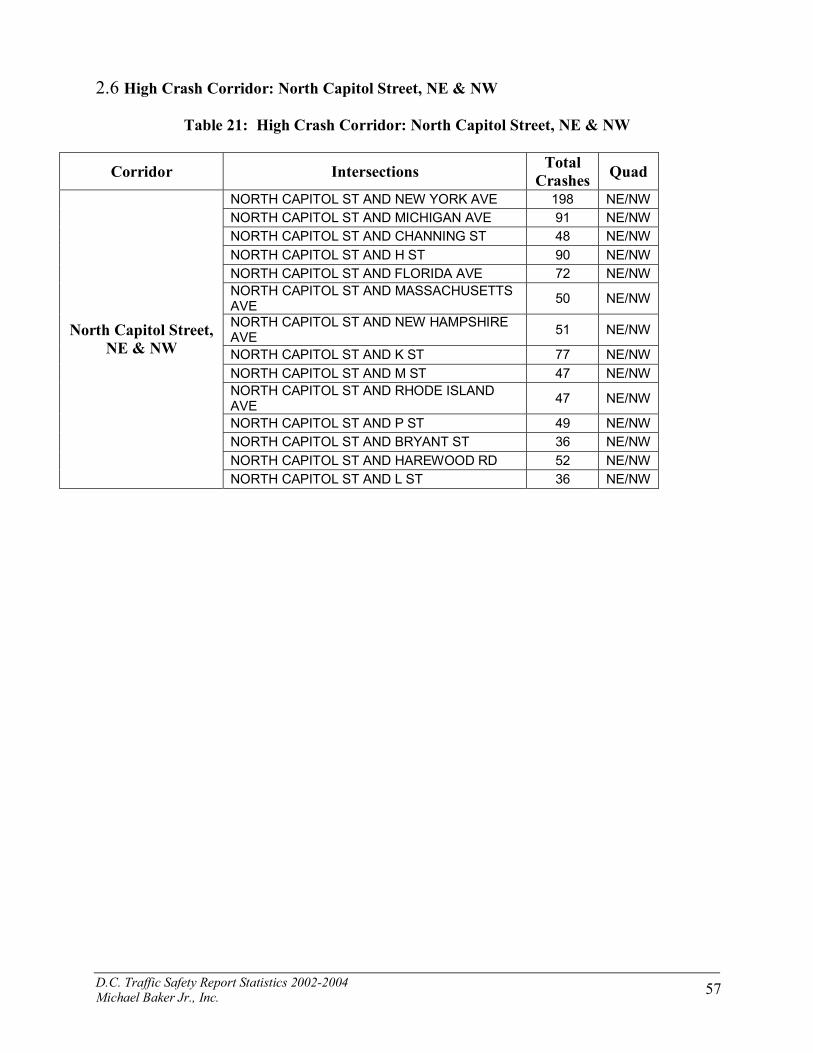
D.C. Traffic Safety Report Statistics 2002-2004 Michael Baker Jr., Inc. 57
2.6 High Crash Corridor: North Capitol Street, NE & NW
Table 21: High Crash Corridor: North Capitol Street, NE & NW
Corridor Intersections Total Crashes Quad
NORTH CAPITOL ST AND NEW YORK AVE 198 NE/NW NORTH CAPITOL ST AND MICHIGAN AVE 91 NE/NW NORTH CAPITOL ST AND CHANNING ST 48 NE/NW NORTH CAPITOL ST AND H ST 90 NE/NW NORTH CAPITOL ST AND FLORIDA AVE 72 NE/NW NORTH CAPITOL ST AND MASSACHUSETTS AVE 50 NE/NW
NORTH CAPITOL ST AND NEW HAMPSHIRE AVE 51 NE/NW
NORTH CAPITOL ST AND K ST 77 NE/NW NORTH CAPITOL ST AND M ST 47 NE/NW NORTH CAPITOL ST AND RHODE ISLAND AVE 47 NE/NW
NORTH CAPITOL ST AND P ST 49 NE/NW NORTH CAPITOL ST AND BRYANT ST 36 NE/NW NORTH CAPITOL ST AND HAREWOOD RD 52 NE/NW
North Capitol Street, NE & NW
NORTH CAPITOL ST AND L ST 36 NE/NW

D.C. Traffic Safety Report Statistics 2002-2004 Michael Baker Jr., Inc. 58
Table 22: High Crash Corridor: North Capitol Street - Contributing Circumstances
Contributing Circumstances 2002 2003 2004 Total Other 65 63 70 198 Driver Inattention 42 39 55 136 Following to Close 53 24 40 117 Auto Right of Way 31 30 41 102 Changing Lanes W/O Caution 25 19 47 91 Improper Turn 19 16 22 57 Stop/Go Light 11 18 14 43 No Violation 12 14 12 38 Speed 11 10 7 28 Pedestrian Violation 4 6 7 17 Improper Passing 6 4 5 15 Improper Backing 5 3 6 14 Defective Brakes 3 3 2 8 Alcohol Influence 4 1 2 7 Ped. Right of Way 2 2 3 7 Wrong Side of the Street 1 1 2 4 Directional Light 0 1 2 3 Driver Vision Obstructed 2 0 1 3 Open Door to Traffic 0 2 1 3 Other Defects 1 2 0 3 Road Defects 1 1 1 3 Drug Influence 1 0 0 1 Stop Sign 1 0 0 1 Wrong Way - One Way Street 1 0 0 1
Figure 70: NORTH CAPITOL ST AND NEW YORK AVE
Type of Collision 2002 2003 2004 Total
Side Swiped 15 11 15 41 Rear End 15 12 13 40 Right Angle 7 10 4 21 Left Turn Hit Veh. 10 4 6 20 Other 0 6 2 8 Straight Hit Ped. 4 2 2 8 Head On 0 3 2 5 Parked Vehicle 2 0 2 4 Right Turn Hit Veh. 1 0 3 4 Fixed Object 1 0 1 2 Right Turn Hit Ped. 1 0 0 1 Backing Hit Parked Veh. 0 1 0 1 Non-Collision Accident 0 0 1 1 Backing Hit Stopped Vehicle 0 0 1 1 Side Swiped 15 11 15 41
41
40
21
20
88 5
Side SwipedRear EndRight AngleLeft Turn Hit Veh.OtherStraight Hit Ped.Head On

D.C. Traffic Safety Report Statistics 2002-2004 Michael Baker Jr., Inc. 59
Figure 71: NORTH CAPITOL ST AND MICHIGAN AVE
Type of Collision 2002 2003 2004 Total
Rear End 10 7 20 37 Side Swiped 3 5 9 17 Left Turn Hit Veh. 4 1 7 12 Right Angle 3 1 8 12 Fixed Object 2 1 1 4 Other 1 1 0 2 Straight Hit Ped. 1 0 1 2 Backing Hit Parked Veh. 1 0 0 1 Parked Vehicle 1 0 0 1 Head On 0 1 0 1 Left Turn Hit Ped. 0 1 0 1 Right Turn Hit Veh. 0 1 0 1
37
17
12
124
Rear End
Side Sw iped
Left Turn Hit Veh.
Right Angle
Fixed Object
Figure 72: NORTH CAPITOL ST AND CHANNING ST
Type of
Collision 2002 2003 2004 Total Rear End 6 7 6 19 Left Turn Hit Veh. 1 2 15 18 Right Angle 2 0 2 4 Parked Vehicle 1 0 2 3 Fixed Object 1 0 2 3
Side Swiped 0 1 0 1
19
18
43
Rear End
Left Turn Hit Veh.
Right Angle
Parked Vehicle

D.C. Traffic Safety Report Statistics 2002-2004 Michael Baker Jr., Inc. 60
Figure 73: NORTH CAPITOL ST AND H ST
Type of Collision 2002 2003 2004 Total
Side Swiped 13 3 14 30 Rear End 11 6 6 23 Left Turn Hit Veh. 8 1 3 12 Right Angle 2 6 3 11 Other 0 1 2 3 Head On 1 0 1 2 Backing Hit Moving Veh. 1 0 0 1 Backing Hit Parked Veh. 1 0 0 1 Backing Hit Stopped Vehicle 1 0 0 1 Fixed Object 1 0 0 1 Right Turn Hit Ped. 1 0 0 1 Straight Hit Ped. 0 1 0 1 Backing Hit Ped. 0 0 1 1 Left Turn Hit Ped. 0 0 1 1 Unknown 0 0 1 1
30
23
12
113 2
Side SwipedRear EndLeft Turn Hit Veh.Right AngleOtherHead On
Figure 74: NORTH CAPITOL ST AND FLORIDA AVE
Type of Collision 2002 2003 2004 Total
Rear End 8 8 6 22 Side Swiped 8 4 7 19 Right Angle 5 1 3 9 Straight Hit Ped. 1 4 1 6 Left Turn Hit Veh. 1 1 3 5 Right Turn Hit Veh. 0 1 4 5 Other 0 1 1 2 Fixed Object 1 0 0 1 Right Turn Hit Ped. 1 0 0 1 Unknown 0 1 0 1 Backing Hit Stopped Vehicle 1 0 0 1
22
19
9
6
55
Rear End
Side Sw iped
Right Angle
Straight Hit Ped.
Left Turn Hit Veh.
Right Turn Hit Veh.

D.C. Traffic Safety Report Statistics 2002-2004 Michael Baker Jr., Inc. 61
Figure 75: NORTH CAPITOL ST AND MASSACHUSETTS AVE
Type of Collision 2002 2003 2004 Total
Side Swiped 2 2 8 12 Left Turn Hit Veh. 2 3 4 9 Right Angle 2 3 3 8 Rear End 2 2 0 4 Parked Vehicle 0 2 2 4 Right Turn Hit Veh. 0 2 2 4 Straight Hit Ped. 1 0 3 4 Other 0 1 1 2 Unknown 0 1 0 1 Backing Hit Ped. 0 0 1 1 Backing Hit Stopped Vehicle 0 0 1 1
12
98
4
4
4
4Side SwipedLeft Turn Hit Veh.Right AngleRear EndParked VehicleRight Turn Hit Veh.Straight Hit Ped.
Figure 76: NORTH CAPITOL ST AND NEW HAMPSHIRE AVE
Type of Collision 2002 2003 2004 Total
Side Swiped 5 2 11 18 Rear End 4 0 7 11 Right Angle 3 2 4 9 Left Turn Hit Veh. 1 1 2 4 Head On 1 1 0 2 Other 0 2 0 2 Right Turn Hit Veh. 0 0 2 2 Fixed Object 1 0 0 1 Ran Off Roadway 0 1 0 1 Unknown 0 0 1 1
18
11
9
4
Side SwipedRear EndRight AngleLeft Turn Hit Veh.
Figure 77: NORTH CAPITOL ST AND K ST
Type of Collision 2002 2003 2004 Total
Side Swiped 9 12 4 25 Rear End 11 2 4 17 Right Turn Hit Veh. 1 3 4 8 Left Turn Hit Veh. 2 1 3 6 Parked Vehicle 2 1 1 4 Straight Hit Ped. 1 0 3 4 Other 0 3 0 3 Backing Hit Stopped Vehicle 0 1 1 2 Fixed Object 0 1 1 2 Right Angle 0 1 1 2 Right Turn Hit Ped. 1 0 1 2 Backing Hit Ped. 1 0 0 1 Backing Hit Parked Veh. 0 0 1 1
25
17
8
6
4
43
Side Sw iped
Rear End
Right Turn Hit Veh.
Left Turn Hit Veh.
Parked Vehicle
Straight Hit Ped.
Other
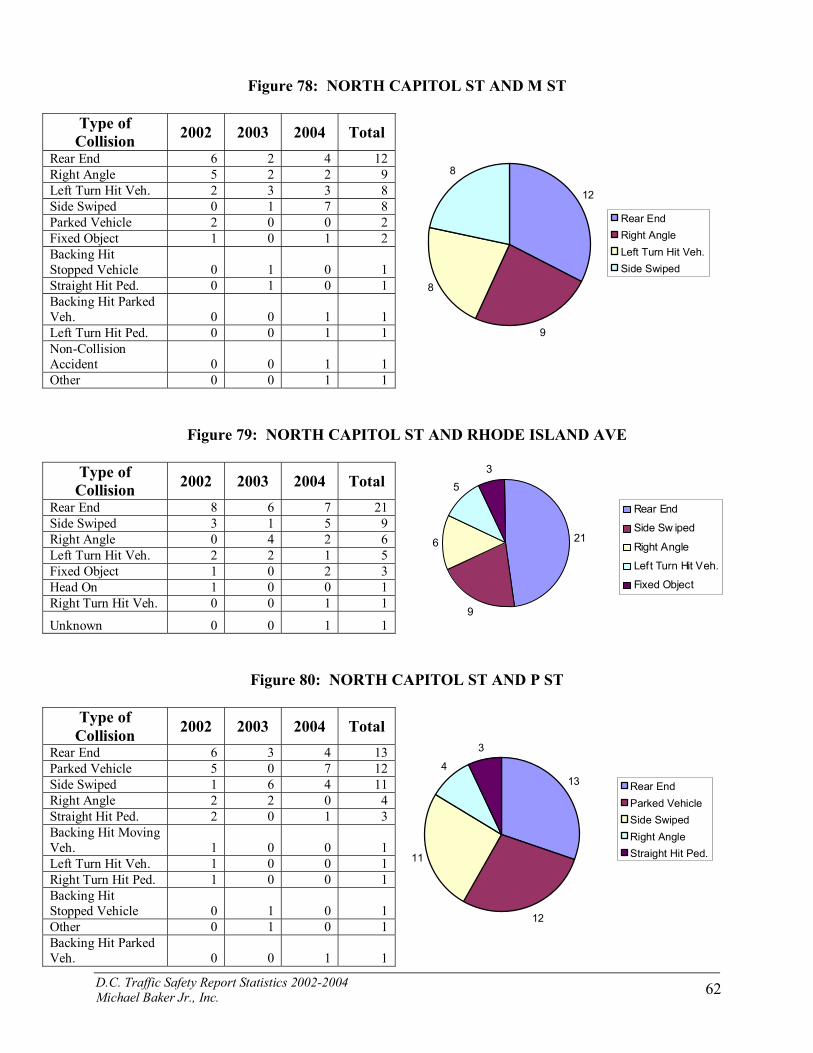
D.C. Traffic Safety Report Statistics 2002-2004 Michael Baker Jr., Inc. 62
Figure 78: NORTH CAPITOL ST AND M ST
Type of Collision 2002 2003 2004 Total
Rear End 6 2 4 12 Right Angle 5 2 2 9 Left Turn Hit Veh. 2 3 3 8 Side Swiped 0 1 7 8 Parked Vehicle 2 0 0 2 Fixed Object 1 0 1 2 Backing Hit Stopped Vehicle 0 1 0 1 Straight Hit Ped. 0 1 0 1 Backing Hit Parked Veh. 0 0 1 1 Left Turn Hit Ped. 0 0 1 1 Non-Collision Accident 0 0 1 1 Other 0 0 1 1
12
9
8
8
Rear EndRight AngleLeft Turn Hit Veh.Side Swiped
Figure 79: NORTH CAPITOL ST AND RHODE ISLAND AVE
Type of Collision 2002 2003 2004 Total
Rear End 8 6 7 21 Side Swiped 3 1 5 9 Right Angle 0 4 2 6 Left Turn Hit Veh. 2 2 1 5 Fixed Object 1 0 2 3 Head On 1 0 0 1 Right Turn Hit Veh. 0 0 1 1
Unknown 0 0 1 1
21
9
6
53
Rear End
Side Sw iped
Right Angle
Left Turn Hit Veh.
Fixed Object
Figure 80: NORTH CAPITOL ST AND P ST
Type of Collision 2002 2003 2004 Total
Rear End 6 3 4 13 Parked Vehicle 5 0 7 12 Side Swiped 1 6 4 11 Right Angle 2 2 0 4 Straight Hit Ped. 2 0 1 3 Backing Hit Moving Veh. 1 0 0 1 Left Turn Hit Veh. 1 0 0 1 Right Turn Hit Ped. 1 0 0 1 Backing Hit Stopped Vehicle 0 1 0 1 Other 0 1 0 1 Backing Hit Parked Veh. 0 0 1 1
13
12
11
4
3
Rear EndParked VehicleSide SwipedRight AngleStraight Hit Ped.

D.C. Traffic Safety Report Statistics 2002-2004 Michael Baker Jr., Inc. 63
Figure 81: NORTH CAPITOL ST AND BRYANT ST
Type of Collision 2002 2003 2004 Total
Rear End 5 5 3 13 Side Swiped 3 4 3 10 Left Turn Hit Veh. 1 1 5 7 Parked Vehicle 2 0 1 3 Right Angle 0 1 0 1 Head On 0 0 1 1
Other 0 0 1 1
13
10
7
3
Rear End
Side Sw iped
Left Turn Hit Veh.
Parked Vehicle
Figure 82: NORTH CAPITOL ST AND HAREWOOD RD
Type of Collision 2002 2003 2004 Total
Rear End 8 3 6 17 Left Turn Hit Veh. 5 2 1 8 Right Angle 3 3 2 8 Side Swiped 2 4 1 7 Fixed Object 1 1 1 3 Other 0 2 0 2 Right Turn Hit Veh. 1 1 0 2 Backing Hit Stopped Vehicle 0 2 0 2 Backing Hit Moving Veh. 1 0 0 1 Head On 0 0 1 1 Ran Off Roadway 0 0 1 1
17
8
8
7
3
Rear End
Left Turn Hit Veh.
Right Angle
Side Sw iped
Fixed Object
Figure 83: NORTH CAPITOL ST AND L ST
Type of Collision 2002 2003 2004 Total
Rear End 5 6 3 14 Left Turn Hit Veh. 4 3 1 8 Side Swiped 4 2 1 7 Right Angle 1 1 2 4 Parked Vehicle 1 0 0 1 Backing Hit Stopped Vehicle 0 0 1 1
Unknown 0 0 1 1
14
8
7
41
Rear End
Left Turn Hit Veh.
Side Sw iped
Right Angle
Parked Vehicle

D.C. Traffic Safety Report Statistics 2002-2004 Michael Baker Jr., Inc. 64
Similar to New York Avenue, the four most common collision types on North Capitol Street were Rear-Ends, Side-Swipes, Right Angle and Left Turn Hit Vehicle. The intersection of North Capitol St and Massachusetts Ave had no Rear-End problems. Right-Turn hits posed a more significant problem at the intersection of North Capitol St and K St than Right-Angles. Parked cars and fixed objects were involved at 10 of the 14 intersections along this corridor. Forty one accidents involved pedestrians at 8 different intersections over the 3 year period.

D.C. Traffic Safety Report Statistics 2002-2004 Michael Baker Jr., Inc. 65
2.7 High Crash Corridor: Benning Road, NE & SE
Table 23: High Crash Corridor: Benning Road, NE & SE
High Crash Corridor Intersections Total
Crashes Quadrant
BENNING RD AND MINNESOTA AVE 122 NE BENNING RD AND SOUTHERN AVE 59 SE EAST CAPITOL ST AND BENNING RD 91 NE/SE BENNING RD AND OKLAHOMA AVE 65 NE 34TH ST AND BENNING RD 48 NE 17TH ST AND BENNING RD 58 NE BENNING RD AND G ST 46 SE 16TH ST AND BENNING RD 36 NE 42ND ST AND BENNING RD 35 NE ANACOSTIA AVE AND BENNING RD 45 NE 21ST ST AND BENNING RD 35 NE
Benning Rd, NE & SE
26TH ST AND BENNING RD 36 NE
Table 24: High Crash Corridor: Benning Road - Contributing Circumstances
Contributing Circumstances 2002 2003 2004 Total Other 48 24 53 125 Auto Right of Way 29 36 34 99 Driver Inattention 31 30 30 91 Chaning Lanes W/O Caution 20 23 27 70 Speed 16 18 34 68 Following to Close 9 14 20 43 stop/Go Light 12 8 17 37 Improper Turn 14 6 10 30 No Violation 6 6 9 21 Improper Passing 5 5 6 16 Pedestrian Violation 7 4 5 16 Alcohol Influence 5 4 2 11 Ped. Right of Way 4 3 3 10 Improper Backing 2 2 4 8 Defective Brakes 2 1 2 5 Wrong Side of the Street 1 1 2 4 Other Defects 1 2 0 3 Driver Vision Obstructed 0 0 2 2 Open Door to Traffic 2 0 0 2 Road Defects 1 1 0 2 Directional Light 1 0 0 1 Drug Influence 0 0 1 1 Improper Starting 1 0 0 1 Stop Sign 0 0 1 1

D.C. Traffic Safety Report Statistics 2002-2004 Michael Baker Jr., Inc. 66
Figure 84: BENNING RD AND MINNESOTA AVE, NE
Type of Collision 2002 2003 2004 Total
Rear End 11 8 14 33
Side Swiped 8 6 10 24
Left Turn Hit Veh. 4 6 10 20
Right Angle 4 1 8 13
Straight Hit Ped. 2 2 6 10
Head On 2 3 0 5
Fixed Object 3 0 2 5
Right Turn Hit
Veh. 0 1 2 3
Other 0 2 0 2
Backing Hit
Stopped Vehicle 0 1 1 2
Backing Hit Parked
Veh. 1 0 0 1
Non-Collision
Accident 1 0 0 1
Parked Vehicle 1 0 0 1
Backing Hit Moving
Veh. 0 0 1 1
Right Turn Hit
Ped. 0 0 1 1
33
2420
13
10
55 3 2 2 Rear End
Side Swiped
Left Turn Hit Veh.
Right Angle
Straight Hit Ped.
Head On
Fixed Object
Right Turn Hit Veh.
Other
Backing Hit Stopped Vehicle
Figure 85: BENNING RD AND SOUTHERN AVE, SE
Type of Collision 2002 2003 2004 Total
Left Turn Hit Veh. 6 5 9 20 Right Angle 4 2 9 15 Side Swiped 1 2 4 7 Rear End 2 1 2 5 Other 1 1 1 3 Head On 1 0 1 2 Right Turn Hit Veh. 1 0 1 2 Backing Hit Moving Veh. 1 0 0 1 Parked Vehicle 1 0 0 1 Fixed Object 0 0 1 1 Straight Hit Ped. 0 0 1 1 Unknown 0 0 1 1
20
15
7
5
32 2
Left Turn Hit Veh.
Right Angle
Side Sw iped
Rear End
Other
Head On
Right Turn Hit Veh.

D.C. Traffic Safety Report Statistics 2002-2004 Michael Baker Jr., Inc. 67
Figure 86: EAST CAPITOL ST AND BENNING RD, NE & SE
Type of Collision 2002 2003 2004 Total
Rear End 10 9 6 25 Side Swiped 12 6 7 25 Right Angle 5 6 7 18 Left Turn Hit Veh. 1 2 2 5 Fixed Object 1 2 1 4 Straight Hit Ped. 2 0 1 3 Parked Vehicle 2 0 0 2 Other 0 2 0 2 Backing Hit Stopped Vehicle 1 0 1 2 Head On 0 1 1 2 Left Turn Hit Ped. 0 1 0 1 Right Turn Hit Veh. 0 1 0 1 Unknown 0 0 1 1
25
25
18
54 3
Rear End
Side Sw iped
Right Angle
Left Turn Hit Veh.
Fixed Object
Straight Hit Ped.
Figure 87: BENNING RD AND OKLAHOMA AVE, NE
Type of Collision 2002 2003 2004 Total
Rear End 7 3 8 18 Side Swiped 9 2 5 16 Left Turn Hit Veh. 6 1 8 15 Right Angle 1 2 2 5 Head On 1 1 2 4 Other 0 1 1 2 Parked Vehicle 1 0 1 2 Unknown 0 1 0 1 Fixed Object 0 0 1 1 Right Turn Hit Veh. 0 0 1 1
18
16
15
54
Rear End
Side Sw iped
Left Turn Hit Veh.
Right Angle
Head On
Figure 88: 34TH ST AND BENNING RD, NE
Type of Collision 2002 2003 2004 Total
Side Swiped 2 4 11 17 Rear End 5 4 7 16 Left Turn Hit Veh. 1 1 3 5 Head On 1 1 0 2 Other 0 2 0 2 Fixed Object 0 1 1 2 Right Turn Hit Ped. 1 0 0 1 Right Angle 0 1 0 1 Straight Hit Ped. 0 1 0 1 Backing Hit Moving Veh. 0 0 1 1
17
16
5
22 2
Side SwipedRear EndLeft Turn Hit Veh.Head OnOtherFixed Object

D.C. Traffic Safety Report Statistics 2002-2004 Michael Baker Jr., Inc. 68
Figure 89: 17TH ST AND BENNING RD, NE
Type of Collision 2002 2003 2004 Total
Rear End 4 6 5 15 Side Swiped 5 2 8 15 Left Turn Hit Veh. 3 3 3 9 Right Angle 2 1 2 5 Parked Vehicle 3 1 0 4 Straight Hit Ped. 2 1 0 3 Ran Off Roadway 1 1 0 2 Left Turn Hit Ped. 1 0 0 1 Other 0 1 0 1 Backing Hit Moving Veh. 0 1 0 1 Right Turn Hit Veh. 0 0 1 1 Unknown 0 0 1 1
15
15
9
5
4
3 2
Rear EndSide SwipedLeft Turn Hit Veh.Right AngleParked VehicleStraight Hit Ped.Ran Off Roadway
Figure 90: BENNING RD AND G ST, SE
Type of Collision 2002 2003 2004 Total
Right Angle 3 3 4 10 Left Turn Hit Veh. 2 2 4 8 Rear End 1 2 5 8 Side Swiped 2 3 1 6 Head On 2 2 0 4 Fixed Object 1 0 3 4 Other 0 2 1 3 Parked Vehicle 2 0 0 2 Backing Hit Stopped Vehicle 0 0 1 1
10
8
8
6
4
4
Right AngleLeft Turn Hit Veh.Rear EndSide SwipedHead OnFixed Object
Figure 91: 16TH ST AND BENNING RD, NE
Type of Collision 2002 2003 2004 Total
Rear End 4 0 5 9 Right Angle 0 4 2 6 Straight Hit Ped. 2 2 1 5 Side Swiped 1 3 0 4 Left Turn Hit Veh. 3 0 0 3 Other 0 2 0 2 Unknown 1 1 0 2 Right Turn Hit Veh. 0 1 1 2 Fixed Object 0 0 2 2
Parked Vehicle 0 0 1 1
9
6
5
4
3
2
2
22
Rear End
Right Angle
Straight Hit Ped.
Side Swiped
Left Turn Hit Veh.
Other
Unknown
Right Turn Hit Veh.
Fixed Object

D.C. Traffic Safety Report Statistics 2002-2004 Michael Baker Jr., Inc. 69
Figure 92: 42ND ST AND BENNING RD, NE
Type of Collision 2002 2003 2004 Total
Right Angle 5 1 3 9 Rear End 3 1 2 6 Side Swiped 0 4 0 4 Left Turn Hit Veh. 3 0 1 4 Parked Vehicle 2 0 2 4 Fixed Object 0 1 1 2 Right Turn Hit Veh. 1 0 0 1 Backing Hit Parked Veh. 0 1 0 1 Head On 0 1 0 1 Straight Hit Ped. 0 1 0 1 Backing Hit Stopped Vehicle 0 0 1 1 Right Turn Hit Ped. 0 0 1 1
9
64
4
4
2
Right AngleRear EndSide SwipedLeft Turn Hit Veh.Parked VehicleFixed Object
Figure 93: ANACOSTIA AVE AND BENNING RD, NE
Type of Collision 2002 2003 2004 Total
Rear End 9 7 3 19 Side Swiped 6 1 4 11 Parked Vehicle 3 0 0 3 Fixed Object 1 1 0 2 Right Angle 1 1 0 2 Left Turn Hit Veh. 0 0 2 2 Ran Off Roadway 1 0 0 1 Straight Hit Ped. 1 0 0 1 Other 0 1 0 1 Backing Hit Stopped Vehicle 0 1 0 1 Right Turn Hit Veh. 0 1 0 1 Head On 0 0 1 1
19
11
3
22
2
Rear EndSide SwipedParked VehicleFixed ObjectRight AngleLeft Turn Hit Veh.
Figure 94: 21ST ST AND BENNING RD, NE
Type of Collision 2002 2003 2004 Total
Rear End 4 2 5 11 Side Swiped 3 2 3 8 Right Angle 3 3 1 7 Left Turn Hit Veh. 0 0 3 3 Parked Vehicle 1 0 1 2 Straight Hit Ped. 1 0 1 2 Fixed Object 0 0 1 1
Left Turn Hit Ped. 0 0 1 1
11
8
7
3
22
Rear End
Side Sw iped
Right Angle
Left Turn Hit Veh.
Parked Vehicle
Straight Hit Ped.

D.C. Traffic Safety Report Statistics 2002-2004 Michael Baker Jr., Inc. 70
Figure 95: 26TH ST AND BENNING RD, NE
Type of Collision 2002 2003 2004 Total
Rear End 4 6 5 15 Side Swiped 3 1 3 7 Right Angle 1 0 4 5 Fixed Object 1 0 1 2 Parked Vehicle 1 0 1 2 Left Turn Hit Veh. 0 0 2 2 Other 0 1 0 1 Right Turn Hit Ped. 0 1 0 1 Head On 1 0 0 1
15
7
5
2
22
Rear End
Side Sw iped
Right Angle
Fixed Object
Parked Vehicle
Left Turn Hit Veh.
The two most common collision types along Benning Rd, NE & SE were Rear-End and Side Swipes. BENNING RD AND SOUTHERN AVE had a problem with left-turn hit vehicles Two intersections, BENNING RD AND G ST, and 42ND ST AND BENNING RD have more serious right-angle problems.

D.C. Traffic Safety Report Statistics 2002-2004 Michael Baker Jr., Inc. 71
2.8 High Crash Corridor: Southern Ave, SE
Table 25: High Crash Corridor: Southern Ave, SE
High Crash Corridor High Crash Intersections Quadrant
Southern Ave and Wheeler Rd SE Chesapeake St and Southern Ave SE 13th St and Southern Ave SE Naylor Rd and Southern Ave SE S Capitol St and Southern Ave SE East Capitol St and Southern Ave SE Pennsylvania Ave and Southern Ave SE Benning Rd and Southern Ave SE
Southern Ave, SE
Central Ave and Southern Ave SE
Table 26: High Crash Corridor: Southern Ave - Contributing Circumstances
Contributing Circumstances 2002 2003 2004 Total Auto Right of Way 25 32 26 83 Other 20 26 28 74 Driver Inattention 22 13 21 56 Speed 16 14 26 56 Following to Close 11 8 7 26 stop/Go Light 5 3 11 19 Improper Turn 2 8 7 17 Chaning Lanes W/O Caution 6 2 7 15 Pedestrian Violation 5 3 5 13 Improper Passing 3 6 2 11 No Violation 3 4 4 11 Alcohol Influence 3 0 3 6 Ped. Right of Way 3 0 3 6 Wrong Side of the Street 1 0 4 5 Improper Backing 2 0 2 4 Defective Brakes 2 0 1 3 Directional Light 1 0 1 2 Driver Vision Obstructed 0 0 1 1 Drug Influence 0 0 1 1 Open Door to Traffic 0 0 1 1 Other Defects 0 0 1 1 Stop Sign 0 1 0 1

D.C. Traffic Safety Report Statistics 2002-2004 Michael Baker Jr., Inc. 72
Figure 96: Southern Ave and Wheeler Rd
Type of Collision 2002 2003 2004 Total
Rear End 10 4 11 25 Left Turn Hit Veh. 5 6 4 15 Right Angle 4 1 3 8 Side Swiped 1 2 5 8 Parked Vehicle 4 0 3 7 Head On 1 2 2 5 Other 0 1 1 2 Fixed Object 0 0 2 2 Ran Off Roadway 0 0 2 2 Non-Collision Accident 0 1 0 1 Right Turn Hit Veh. 0 1 0 1 Left Turn Hit Ped. 0 0 1 1 Right Turn Hit Ped. 0 0 1 1 Straight Hit Ped. 0 0 1 1
25
158
8
7
52 2 2 Rear End
Left Turn Hit Veh.
Right Angle
Side Sw iped
Parked Vehicle
Head On
Other
Fixed Object
Ran Off Roadw ay
Figure 97: Chesapeake St and Southern Ave
Type of Collision 2002 2003 2004 Total
Rear End 5 5 9 19 Side Swiped 4 4 2 10 Left Turn Hit Veh. 1 3 5 9 Right Angle 2 2 4 8 Straight Hit Ped. 2 0 6 8 Parked Vehicle 0 0 3 3 Other 0 1 1 2
Fixed Object 1 0 0 1
19
109
8
8
3 2
Rear End
Side Sw iped
Left Turn Hit Veh.
Right Angle
Straight Hit Ped.
Parked Vehicle
Other

D.C. Traffic Safety Report Statistics 2002-2004 Michael Baker Jr., Inc. 73
Figure 98: 13th St and Southern Ave
Type of Collision 2002 2003 2004 Total
Rear End 3 4 3 10 Right Angle 2 1 1 4 Side Swiped 0 2 2 4 Fixed Object 1 0 3 4 Left Turn Hit Veh. 1 1 1 3 Other 0 2 0 2 Backing Hit Stopped Vehicle 1 0 1 2 Head On 1 0 1 2 Right Turn Hit Veh. 0 1 1 2 Non-Collision Accident 1 0 0 1 Parked Vehicle 1 0 0 1 Backing Hit Parked Veh. 0 1 0 1 Straight Hit Ped. 0 1 0 1
10
4
44
3
2
2
22 Rear End
Right Angle
Side Sw iped
Fixed Object
Left Turn Hit Veh.
Other
Backing Hit StoppedVehicleHead On
Right Turn Hit Veh.
Figure 99: NAYLOR RD AND SOUTHERN AVE
Type of Collision 2002 2003 2004 Total
Left Turn Hit Veh. 10 3 2 15 Right Angle 2 3 3 8 Head On 3 0 2 5 Rear End 2 1 1 4 Fixed Object 2 0 1 3 Parked Vehicle 1 0 1 2 Side Swiped 1 0 1 2 Straight Hit Ped. 1 0 0 1
Other 0 1 0 1
15
8
5
4
3
22
Left Turn Hit Veh.
Right Angle
Head On
Rear End
Fixed Object
Parked Vehicle
Side Sw iped

D.C. Traffic Safety Report Statistics 2002-2004 Michael Baker Jr., Inc. 74
Figure 100: S Capitol St and Southern Ave
Type of
Collision 2002 2003 2004 Total Right Angle 2 3 5 10 Left Turn Hit Veh. 1 4 4 9 Rear End 2 3 4 9 Straight Hit Ped. 1 1 1 3 Fixed Object 2 0 0 2 Other 0 2 0 2 Side Swiped 0 1 1 2 Backing Hit Moving Veh. 1 0 0 1 Backing Hit Stopped Vehicle 1 0 0 1 Parked Vehicle 1 0 0 1 Right Turn Hit Ped. 1 0 0 1 Left Turn Hit Ped. 0 0 1 1
10
99
3
22
2Right Angle
Left Turn Hit Veh.
Rear End
Straight Hit Ped.
Fixed Object
Other
Side Sw iped
Figure 101: East Capitol St and Southern Ave
Type of Collision 2002 2003 2004 Total
Rear End 5 6 3 14 Left Turn Hit Veh. 5 3 2 10 Right Angle 3 2 4 9 Straight Hit Ped. 3 0 0 3 Fixed Object 1 1 1 3 Head On 0 2 1 3 Side Swiped 0 1 2 3 Other 0 1 0 1
Unknown 0 0 1 1
14
109
3
3
33
Rear End
Left Turn Hit Veh.
Right Angle
Straight Hit Ped.
Fixed Object
Head On
Side Sw iped
Figure 102: Pennsylvania Ave and Southern Ave
Type of Collision 2002 2003 2004 Total
Side Swiped 4 6 0 10 Rear End 5 3 2 10 Left Turn Hit Veh. 0 2 5 7 Parked Vehicle 3 0 1 4 Right Angle 3 0 0 3 Other 0 2 0 2 Head On 0 1 0 1
Right Turn Hit Veh. 0 0 1 1
10
107
4
32 1
Side Sw iped
Rear End
Left Turn Hit Veh.
Parked Vehicle
Right Angle
Other
Head On

D.C. Traffic Safety Report Statistics 2002-2004 Michael Baker Jr., Inc. 75
Figure 103: BENNING RD AND SOUTHERN AVE
Type of
Collision 2002 2003 2004 Total Left Turn Hit Veh. 6 5 9 20 Right Angle 4 2 9 15 Side Swiped 1 2 4 7 Rear End 2 1 2 5 Other 1 1 1 3 Head On 1 0 1 2 Right Turn Hit Veh. 1 0 1 2 Backing Hit Moving Veh. 1 0 0 1 Parked Vehicle 1 0 0 1 Fixed Object 0 0 1 1 Straight Hit Ped. 0 0 1 1 Unknown 0 0 1 1
20
15
7
5
32 2 Left Turn Hit Veh.
Right Angle
Side Sw iped
Rear End
Other
Head On
Right Turn Hit Veh.
Figure 104: Central Ave and Southern Ave, SE
Type of Collision 2002 2003 2004 Total
Rear End 2 5 1 8 Left Turn Hit Veh. 2 1 4 7 Right Angle 2 2 1 5 Parked Vehicle 1 1 1 3 Side Swiped 1 1 1 3 Left Turn Hit Ped. 0 1 1 2 Right Turn Hit Veh. 0 1 1 2 Backing Hit Stopped Vehicle 1 0 0 1 Other 0 1 0 1 Straight Hit Ped. 0 1 0 1 Fixed Object 0 0 1 1 Head On 0 0 1 1
8
75
3
3
22
Rear End
Left Turn Hit Veh.
Right Angle
Parked Vehicle
Side Sw iped
Left Turn Hit Ped.
Right Turn Hit Veh.

D.C. Traffic Safety Report Statistics 2002-2004 Michael Baker Jr., Inc. 76
2.9 High Crash Corridor: Georgia Ave, NW
Table 27: High Crash Corridor: Georgia Ave, NW
High Crash Corridor Intersections Quadrant
GEORGIA AVE AND MISSOURI AVE NW BARRY PL AND GEORGIA AVE NW GEORGIA AVE AND KENYON ST NW FLORIDA AVE AND GEORGIA AVE NW GEORGIA AVE AND PEABODY ST NW GEORGIA AVE AND KALMIA RD NW GEORGIA AVE AND MORTON ST NW GEORGIA AVE AND RANDOLPH ST NW GEORGIA AVE AND IRVING ST NW
GEORGIA AVE, NW
GEORGIA AVE AND PARK RD NW
Table 28: High Crash Corridor: Georgia Ave - Contributing Circumstances
Contributing Circumstances 2002 2003 2004 Total Other 31 32 36 99 Driver Inattention 28 16 31 75 Auto Right of Way 20 20 16 56 Following to Close 17 16 14 47 Chaning Lanes W/O Caution 10 9 9 28 Speed 5 9 6 20 Improper Turn 4 8 4 16 Improper Passing 5 4 6 15 stop/Go Light 4 5 6 15 No Violation 5 5 4 14 Alcohol Influence 5 3 4 12 Pedestrian Violation 6 2 3 11 Ped. Right of Way 1 5 4 10 Open Door to Traffic 2 1 5 8 Improper Backing 4 2 0 6 Driver Vision Obstructed 2 1 0 3 Directional Light 1 1 0 2 Wrong Side of the Street 0 1 1 2 Defective Brakes 0 1 0 1 Improper Starting 0 0 1 1 Other Defects 0 1 0 1 Wrong Way - One Way Street 1 0 0 1

D.C. Traffic Safety Report Statistics 2002-2004 Michael Baker Jr., Inc. 77
Figure 105: GEORGIA AVE AND MISSOURI AVE, NW
Type of Collision 2002 2003 2004 Total
Rear End 7 11 11 29 Side Swiped 8 3 11 22 Right Angle 1 4 1 6 Right Turn Hit Veh 0 1 3 4 Fixed Object 2 0 0 2 Backing Hit Stopped Vehicle 0 1 1 2
Head On 0 1 0 1 Left Turn Hit Veh. 0 0 1 1
Parked Vehicle 0 0 1 1
29
22
6
42 2
Rear End
Side Swiped
Right Angle
Right Turn Hit Veh.
Fixed Object
Backing Hit StoppedVehicle
Figure 106: BARRY PL AND GEORGIA AVE, NW
Type of Collision 2002 2003 2004 Total
Parked Vehicle 9 2 4 15 Side Swiped 4 5 6 15 Rear End 5 0 1 6 Right Angle 2 0 1 3 Backing Hit Parked Veh. 0 2 0 2
Right Turn Hit Veh 0 1 1 2 Straight Hit Ped. 0 0 2 2 Fixed Object 1 0 0 1 Backing Hit Moving Veh. 0 1 0 1
Left Turn Hit Veh. 0 1 0 1 Backing Hit Stopped Vehicle 0 0 1 1
Head On 0 0 1 1
15
15
6
3
22 2 Parked Vehicle
Side Swiped
Rear End
Right Angle
Backing Hit ParkedVeh.Right Turn Hit Veh.
Straight Hit Ped.

D.C. Traffic Safety Report Statistics 2002-2004 Michael Baker Jr., Inc. 78
Figure 107: GEORGIA AVE AND KENYON ST, NW
Type of Collision 2002 2003 2004 Total
Right Angle 6 2 3 11 Parked Vehicle 3 1 6 10 Side Swiped 4 2 3 9 Rear End 1 4 4 9 Straight Hit Ped. 1 2 0 3 Fixed Object 1 0 1 2 Backing Hit Parked Veh. 1 0 0 1
Right Turn Hit Veh.
1 0 0 1
11
109
9
32
Right Angle
Parked Vehicle
Side Sw iped
Rear End
Straight Hit Ped.
Fixed Object
Figure 108: FLORIDA AVE AND GEORGIA AVE, NW
Type of Collision 2002 2003 2004 Total
Side Swiped 7 3 5 15 Rear End 5 3 4 12 Left Turn Hit Ped. 1 0 3 4 Other 0 2 1 3 Right Angle 2 0 1 3 Left Turn Hit Veh. 0 1 1 2 Parked Vehicle 1 0 0 1 Straight Hit Ped. 1 0 0 1 Right Turn Hit Veh. 0 1 0 1
Right Turn Hit Ped. 0 0 1 1
15
12
4
3
32
Side SwipedRear EndLeft Turn Hit Ped.OtherRight AngleLeft Turn Hit Veh.
Figure 109: GEORGIA AVE AND PEABODY ST, NW
Type of Collision 2002 2003 2004 Total
Rear End 2 3 5 10 Parked Vehicle 3 0 4 7 Right Angle 0 4 1 5 Side Swiped 2 1 1 4 Straight Hit Ped. 1 1 1 3 Left Turn Hit Veh. 2 1 0 3 Right Turn Hit Veh. 0 1 0 1
Backing Hit Parked Veh. 0 0 1 1
Fixed Object 0 0 1 1 Left Turn Hit Ped. 1 0 0 1 Other 0 1 0 1
10
75
4
3
3
Rear End
Parked Vehicle
Right Angle
Side Sw iped
Straight Hit Ped.
Left Turn Hit Veh.

D.C. Traffic Safety Report Statistics 2002-2004 Michael Baker Jr., Inc. 79
Figure 110: GEORGIA AVE AND KALMIA RD, NW
Type of Collision 2002 2003 2004 Total
Right Angle 2 7 2 11 Rear End 3 4 4 11 Left Turn Hit Veh. 5 0 4 9 Side Swiped 2 3 0 5 Other 0 2 0 2 Head On 0 1 1 2 Parked Vehicle 1 0 0 1 Straight Hit Ped. 1 0 0 1 Backing Hit Parked Veh. 0 0 1 1
Ran Off Roadway 0 0 1 1
11
11
9
5
22
Right Angle
Rear End
Left Turn Hit Veh.
Side Sw iped
Other
Head On
Figure 111: GEORGIA AVE AND MORTON ST, NW
Type of
Collision 2002 2003 2004 Total Side Swiped 2 3 4 9 Parked Vehicle 3 1 1 5 Right Angle 3 1 1 5 Backing Hit Parked Veh. 1 1 1 3
Fixed Object 2 0 0 2 Backing Hit Moving Veh. 1 1 0 2
Left Turn Hit Veh. 0 2 0 2 Left Turn Hit Ped. 1 0 1 2 Rear End 0 1 1 2 Straight Hit Ped. 1 0 1 2 Head On 0 0 1 1 Right Turn Hit Ped. 0 0 1 1
9
5
53
2
2
2
2
22 Side Sw iped
Parked Vehicle
Right Angle
Backing Hit ParkedVeh.Fixed Object
Backing Hit MovingVeh.Lef t Turn Hit Veh.
Lef t Turn Hit Ped.
Rear End
Straight Hit Ped
Figure 112: GEORGIA AVE AND RANDOLPH ST, NW
Type of
Collision 2002 2003 2004 Total Rear End 5 4 3 12 Side Swiped 2 4 3 9 Right Angle 0 2 2 4 Parked Vehicle 2 0 0 2 Left Turn Hit Veh. 0 1 1 2 Backing Hit Parked Veh. 1 0 0 1
Fixed Object 0 1 0 1 Head On 0 0 1 1
Straight Hit Ped. 0 0 1 1
12
9
4
22
Rear End
Side Sw iped
Right Angle
Parked Vehicle
Left Turn Hit Veh.

D.C. Traffic Safety Report Statistics 2002-2004 Michael Baker Jr., Inc. 80
Figure 113: GEORGIA AVE AND PARK RD, NW
Type of Collision 2002 2003 2004 Total
Rear End 2 5 2 9 Side Swiped 3 4 2 9 Right Angle 3 1 1 5 Left Turn Hit Veh. 2 2 0 4 Parked Vehicle 2 0 2 4 Straight Hit Ped. 0 1 2 3 Backing Hit Parked Veh. 0 2 0 2
Backing Hit Ped. 1 0 0 1 Head On 1 0 0 1 Other 0 1 0 1
Left Turn Hit Ped. 0 0 1 1
9
95
4
4
32
Rear End
Side Swiped
Right Angle
Left Turn Hit Veh.
Parked Vehicle
Straight Hit Ped.
Backing Hit ParkedVeh.
Figure 114: GEORGIA AVE AND IRVING ST
Type of Collision 2002 2003 2004 Total
Side Swiped 6 2 4 12 Rear End 3 2 4 9 Straight Hit Ped. 2 1 1 4 Parked Vehicle 2 0 2 4 Right Angle 1 1 1 3 Backing Hit Parked Veh. 1 0 0 1 Left Turn Hit Ped. 1 0 0 1 Head On 0 1 0 1 Other 0 1 0 1 Fixed Object 0 0 1 1 Left Turn Hit Veh. 0 0 1 1
Unknown 0 0 1 1
12
9
4
4
31 1
Side Sw iped
Rear End
Straight Hit Ped.
Parked Vehicle
Right Angle
Backing Hit ParkedVeh.Left Turn Hit Ped.

D.C. Traffic Safety Report Statistics 2002-2004 Michael Baker Jr., Inc. 81
Georgia Ave had significant Rear-End and Side Swiped crashes, but unlike other corridors, it had a very high number of Parked Vehicle accidents. Four intersections, BARRY PL AND GEORGIA AVE, GEORGIA AVE AND KENYON ST, GEORGIA AVE AND PEABODY ST, and GEORGIA AVE AND MORTON ST had a high number of Parked Vehicle accidents. GEORGIA AVE AND KALMIA RD had higher right angle crashes.

D.C. Traffic Safety Report Statistics 2002-2004 Michael Baker Jr., Inc. 82
2.10 High Crash Corridor: Florida Ave, NE & NW
Table 29: High Crash Corridor: Florida Ave, NE & NW
High Crash Corridor High Crash Intersections Quadrant
Florida Ave and New York Ave NE North Capitol St and Florida Ave NE & NW Florida Ave and Georgia Ave NW Florida Ave and Rhode Island Ave NW 7th St and Florida Ave NW Florida Ave and West Virginia Ave NE 4th St and Florida Ave NE
Florida Ave, NE & NW
14th St and Florida Ave NW
Table 30: High Crash Corridor: Florida Ave - Contributing Circumstances
Contributing Circumstances 2002 2003 2004 Total Following to Close 15 32 28 75 Other 33 16 23 72 Driver Inattention 20 17 30 67 Chaning Lanes W/O Caution 15 10 21 46 Auto Right of Way 10 9 15 34 stop/Go Light 9 7 13 29 Improper Turn 9 5 10 24 No Violation 13 7 4 24 Speed 10 5 4 19 Improper Passing 4 3 1 8 Pedestrian Violation 2 3 2 7 Alcohol Influence 0 0 5 5 Ped. Right of Way 1 2 2 5 Driver Vision Obstructed 0 0 4 4 Improper Backing 4 0 0 4 Improper Starting 0 0 3 3 Open Door to Traffic 1 0 2 3 Defective Brakes 1 0 1 2 Drug Influence 1 0 1 2 Fail to Set Parking Brake 1 0 0 1 Other Defects 1 0 0 1 Right Turn on Red 0 1 0 1 Road Defects 1 0 0 1

D.C. Traffic Safety Report Statistics 2002-2004 Michael Baker Jr., Inc. 83
Figure 115: Florida Ave and New York Ave, NE
Type of Collision 2002 2003 2004 Total
Rear End 31 20 32 83 Side Swiped 8 10 9 27 Right Angle 4 4 10 18 Left Turn Hit Veh. 2 1 1 4 Right Turn Hit Veh. 1 0 2 3 Fixed Object 1 0 1 2 Head On 0 1 1 2 Other 0 0 2 2 Backing Hit Stopped Vehicle 1 0 0 1 Left Turn Hit Ped. 1 0 0 1 Parked Vehicle 0 0 1 1
8327
18
4 3 2 2 2
Rear End
Side Sw iped
Right Angle
Left Turn Hit Veh.
Right Turn Hit Veh.
Fixed Object
Head On
Other
Figure 116: North Capitol St and Florida Ave, NE & NW
Type of Collision 2002 2003 2004 Total
Rear End 8 8 6 22 Side Swiped 8 4 7 19 Right Angle 5 1 3 9 Straight Hit Ped. 1 4 1 6 Left Turn Hit Veh. 1 1 3 5 Right Turn Hit Veh. 0 1 4 5 Other 0 1 1 2 Fixed Object 1 0 0 1 Right Turn Hit Ped. 1 0 0 1 Unknown 0 1 0 1 Backing Hit Stopped Vehicle 1 0 0 1
22
19
9
6
5
5 2
Rear End
Side Sw iped
Right Angle
Straight Hit Ped.
Left Turn Hit Veh.
Right Turn Hit Veh.
Other
Figure 117: Florida Ave and Georgia Ave, NW
Type of Collision 2002 2003 2004 Total
Side Swiped 7 3 5 15 Rear End 5 3 4 12 Left Turn Hit Ped. 1 0 3 4 Other 0 2 1 3 Right Angle 2 0 1 3 Left Turn Hit Veh. 0 1 1 2 Parked Vehicle 1 0 0 1 Straight Hit Ped. 1 0 0 1 Right Turn Hit Veh. 0 1 0 1 Right Turn Hit Ped. 0 0 1 1
15
12
4
3
32 1
Side Sw iped
Rear End
Left Turn Hit Ped.
Other
Right Angle
Left Turn Hit Veh.
Parked Vehicle

D.C. Traffic Safety Report Statistics 2002-2004 Michael Baker Jr., Inc. 84
Figure 118: Florida Ave and Rhode Island Ave, NW
Type of Collision 2002 2003 2004 Total
Rear End 2 3 9 14 Right Angle 5 3 5 13 Side Swiped 1 1 4 6 Left Turn Hit Veh. 1 1 1 3 Fixed Object 1 0 0 1
Head On 0 0 1 1
14
13
6
31 1
Rear End
Right Angle
Side Sw iped
Left Turn Hit Veh.
Fixed Object
Head On
Figure 119: 7th St and Florida Ave, NW
Type of Collision 2002 2003 2004 Total
Rear End 1 10 6 17 Side Swiped 6 0 3 9 Right Turn Hit Veh. 1 2 0 3 Right Angle 1 1 1 3 Left Turn Hit Veh. 0 0 2 2 Left Turn Hit Ped. 1 0 0 1 Other 0 1 0 1
Straight Hit Ped. 0 1 0 1
17
9
3
3
2 1 1
Rear End
Side Sw iped
Right Turn Hit Veh.
Right Angle
Left Turn Hit Veh.
Left Turn Hit Ped.
Other

D.C. Traffic Safety Report Statistics 2002-2004 Michael Baker Jr., Inc. 85
Figure 120: Florida Ave and West Virginia Ave
Type of
Collision 2002 2003 2004 Total Rear End 4 5 4 13 Left Turn Hit Veh. 5 1 1 7 Right Angle 1 2 1 4 Parked Vehicle 1 0 2 3 Side Swiped 1 1 0 2 Straight Hit Ped. 1 1 0 2 Other 0 1 0 1 Backing Hit Stopped Vehicle 0 0 1 1 Fixed Object 0 0 1 1 Right Turn Hit Ped. 0 0 1 1 Right Turn Hit Veh. 0 0 1 1
13
7
4
3
22 1
Rear End
Left Turn Hit Veh.
Right Angle
Parked Vehicle
Side Sw iped
Straight Hit Ped.
Other
Figure 121: 4th St and Florida Ave
Type of Collision 2002 2003 2004 Total
Rear End 5 4 4 13 Right Angle 3 2 2 7 Side Swiped 3 0 3 6 Left Turn Hit Veh. 2 1 2 5 Parked Vehicle 1 0 1 2 Fixed Object 1 0 0 1
Head On 0 0 1 1
13
7
6
5
2 1 1
Rear End
Right Angle
Side Sw iped
Left Turn Hit Veh.
Parked Vehicle
Fixed Object
Head On
Figure 122: 14th St and Florida Ave
Type of Collision 2002 2003 2004 Total
Rear End 2 2 5 9 Left Turn Hit Veh. 3 2 2 7 Right Angle 4 1 0 5 Side Swiped 1 0 4 5 Parked Vehicle 2 0 1 3 Right Turn Hit Veh. 1 1 1 3 Backing Hit Moving Veh. 2 0 0 2 Backing Hit Stopped Vehicle 0 1 0 1 Backing Hit Parked Veh. 1 0 0 1 Left Turn Hit Ped. 0 0 1 1 Straight Hit Ped. 0 0 1 1
9
7
5
5
3
3
2Rear End
Left Turn Hit Veh.
Right Angle
Side Sw iped
Parked Vehicle
Right Turn Hit Veh.
Backing Hit MovingVeh.

D.C. Traffic Safety Report Statistics 2002-2004 Michael Baker Jr., Inc. 86
2.11 High Crash Corridor: 16th Street, NW
Table 31: High Crash Corridor: 16th Street, NW High Crash Corridors High Crash Intersections Quadrant
16th St and U St NW 16th St and Euclid St NW 16th St and L St NW 16th St and Lamont St NW 16th St and Irving St NW 16th St and V St NW 16th St and Park St NW
16th St, NW
16th St and K St NW
Table 32: High Crash Corridor: 16th Street - Contributing Circumstances
Contributing Circumstances 2002 2003 2004 Total Other 18 17 24 59 Driver Inattention 13 10 9 32 Chaning Lanes W/O Caution 11 6 12 29 Auto Right of Way 8 3 16 27 Following to Close 5 9 6 20 Improper Turn 9 4 6 19 stop/Go Light 2 4 12 18 No Violation 6 3 3 12 Ped. Right of Way 3 3 4 10 Pedestrian Violation 3 2 3 8 Alcohol Influence 0 1 5 6 Speed 2 2 2 6 Improper Backing 1 2 2 5 Defective Brakes 0 2 2 4 Improper Passing 2 2 0 4 Open Door to Traffic 3 0 0 3 Other Defects 1 0 1 2 Wrong Side of the Street 0 1 1 2 Wrong Way - One Way Street 0 1 1 2 Directional Light 0 0 1 1 Driver Vision Obstructed 0 0 1 1 Drug Influence 0 0 1 1 Improper Starting 1 0 0 1 Ped. Drunk 0 0 1 1

D.C. Traffic Safety Report Statistics 2002-2004 Michael Baker Jr., Inc. 87
Figure 123: 16th St and U St
Type of Collision 2002 2003 2004 Total
Side Swiped 8 3 3 14 Rear End 3 6 5 14 Right Turn Hit Veh. 1 4 3 8 Left Turn Hit Veh. 2 2 4 8 Right Angle 4 1 1 6 Parked Vehicle 3 0 3 6 Other 0 2 1 3 Straight Hit Ped. 1 1 0 2 Left Turn Hit Ped. 1 0 0 1 Right Turn Hit Ped. 1 0 0 1 Head On 0 1 0 1 Backing Hit Stopped Vehicle 0 0 1 1 Fixed Object 0 0 1 1
14
14
8
8
6
6
3 2 Side Sw iped
Rear End
Right Turn Hit Veh.
Left Turn Hit Veh.
Right Angle
Parked Vehicle
Other
Straight Hit Ped.
Figure 124: 16th St and Euclid St
Type of Collision 2002 2003 2004 Total
Side Swiped 4 1 5 10 Left Turn Hit Veh. 3 1 6 10 Rear End 3 4 1 8 Right Angle 3 2 2 7 Parked Vehicle 5 0 1 6 Left Turn Hit Ped. 1 0 1 2 Backing Hit Moving Veh. 0 1 0 1 Backing Hit Stopped Vehicle 0 1 0 1 Head On 0 1 0 1 Straight Hit Ped. 0 1 0 1 Right Turn Hit Ped. 0 0 1 1 Right Turn Hit Veh. 0 0 1 1
10
10
8
7
6
2 1 Side Sw iped
Left Turn Hit Veh.
Rear End
Right Angle
Parked Vehicle
Left Turn Hit Ped.
Backing Hit MovingVeh.
Figure 125: 16th St and L St
Type of Collision 2002 2003 2004 Total
Rear End 4 2 4 10 Right Angle 4 1 5 10 Side Swiped 5 3 0 8 Other 0 2 2 4 Left Turn Hit Ped. 1 0 1 2 Left Turn Hit Veh. 0 1 1 2 Fixed Object 0 1 0 1 Parked Vehicle 0 0 1 1
Straight Hit Ped. 0 0 1 1
10
10
8
4
22 1
Rear End
Right Angle
Side Swiped
Other
Left Turn Hit Ped.
Left Turn Hit Veh.
Fixed Object

D.C. Traffic Safety Report Statistics 2002-2004 Michael Baker Jr., Inc. 88
Figure 126: 16th St and Lamont St
Type of Collision 2002 2003 2004 Total
Rear End 5 2 1 8 Side Swiped 0 3 4 7 Parked Vehicle 3 0 2 5 Straight Hit Ped. 2 0 2 4 Right Angle 1 2 0 3 Left Turn Hit Veh. 0 0 2 2 Backing Hit Parked Veh. 1 0 0 1 Fixed Object 1 0 0 1 Head On 0 1 0 1 Left Turn Hit Ped. 0 1 0 1 Right Turn Hit Ped. 0 1 0 1 Backing Hit Moving Veh. 0 0 1 1 Backing Hit Stopped Vehicle 0 0 1 1
8
75
4
3
2 1 Rear End
Side Sw iped
Parked Vehicle
Straight Hit Ped.
Right Angle
Left Turn Hit Veh.
Backing Hit ParkedVeh.
Figure 127: 16th St and Irving St
Type of Collision 2002 2003 2004 Total
Side Swiped 3 5 6 14 Rear End 3 3 2 8 Left Turn Hit Veh. 1 0 2 3 Parked Vehicle 1 0 2 3 Straight Hit Ped. 2 0 0 2 Right Angle 0 1 1 2 Other 0 1 0 1 Head On 0 0 1 1
Right Turn Hit Ped. 0 0 1 1
14
8
3
3
22 1
Side Sw iped
Rear End
Left Turn Hit Veh.
Parked Vehicle
Straight Hit Ped.
Right Angle
Other
Figure 128: 16th St and V St
Type of Collision 2002 2003 2004 Total
Right Angle 0 6 9 15 Rear End 0 3 5 8 Parked Vehicle 4 0 3 7 Side Swiped 1 1 2 4 Head On 0 1 0 1 Fixed Object 0 0 1 1
Straight Hit Ped. 0 0 1 1
15
8
7
4
1 1 1Right Angle
Rear End
Parked Vehicle
Side Sw iped
Head On
Fixed Object
Straight Hit Ped.

D.C. Traffic Safety Report Statistics 2002-2004 Michael Baker Jr., Inc. 89
Figure 129: 16th St and Park St
Type of
Collision 2002 2003 2004 Total Side Swiped 4 5 6 15 Rear End 4 1 1 6 Right Angle 0 2 2 4 Parked Vehicle 1 1 1 3 Fixed Object 1 0 0 1 Straight Hit Ped. 1 0 0 1 Left Turn Hit Veh. 0 1 0 1
Backing Hit Moving Veh. 0 0 1 1
15
6
4
3
1 1 1Side Sw iped
Rear End
Right Angle
Parked Vehicle
Fixed Object
Straight Hit Ped.
Left Turn Hit Veh.
Figure 130: 16th St and K St
Type of Collision 2002 2003 2004 Total
Side Swiped 5 0 3 8 Right Angle 2 1 4 7 Right Turn Hit Veh. 1 2 4 7 Other 0 3 0 3 Backing Hit Stopped Vehicle 1 0 2 3 Left Turn Hit Veh. 1 0 2 3 Rear End 0 1 2 3 Parked Vehicle 0 1 1 2 Right Turn Hit Ped. 0 0 2 2 Left Turn Hit Ped. 1 0 0 1 Straight Hit Ped. 1 0 0 1 Backing Hit Ped. 0 1 0 1
8
7
7
3
3
3
32 Side Sw iped
Right Angle
Right Turn Hit Veh.
Other
Backing HitStopped VehicleLeft Turn Hit Veh.
Rear End
P k d V hi l
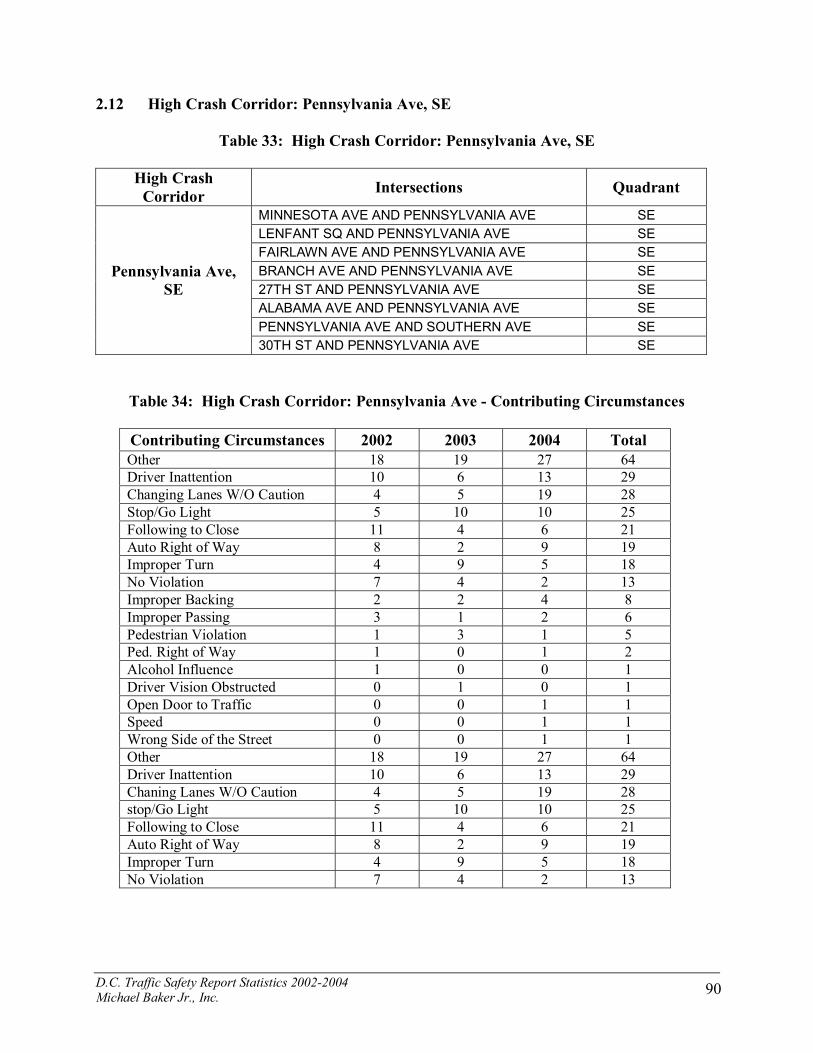
D.C. Traffic Safety Report Statistics 2002-2004 Michael Baker Jr., Inc. 90
2.12 High Crash Corridor: Pennsylvania Ave, SE
Table 33: High Crash Corridor: Pennsylvania Ave, SE
High Crash Corridor Intersections Quadrant
MINNESOTA AVE AND PENNSYLVANIA AVE SE LENFANT SQ AND PENNSYLVANIA AVE SE FAIRLAWN AVE AND PENNSYLVANIA AVE SE BRANCH AVE AND PENNSYLVANIA AVE SE 27TH ST AND PENNSYLVANIA AVE SE ALABAMA AVE AND PENNSYLVANIA AVE SE PENNSYLVANIA AVE AND SOUTHERN AVE SE
Pennsylvania Ave, SE
30TH ST AND PENNSYLVANIA AVE SE
Table 34: High Crash Corridor: Pennsylvania Ave - Contributing Circumstances
Contributing Circumstances 2002 2003 2004 Total Other 18 19 27 64 Driver Inattention 10 6 13 29 Changing Lanes W/O Caution 4 5 19 28 Stop/Go Light 5 10 10 25 Following to Close 11 4 6 21 Auto Right of Way 8 2 9 19 Improper Turn 4 9 5 18 No Violation 7 4 2 13 Improper Backing 2 2 4 8 Improper Passing 3 1 2 6 Pedestrian Violation 1 3 1 5 Ped. Right of Way 1 0 1 2 Alcohol Influence 1 0 0 1 Driver Vision Obstructed 0 1 0 1 Open Door to Traffic 0 0 1 1 Speed 0 0 1 1 Wrong Side of the Street 0 0 1 1 Other 18 19 27 64 Driver Inattention 10 6 13 29 Chaning Lanes W/O Caution 4 5 19 28 stop/Go Light 5 10 10 25 Following to Close 11 4 6 21 Auto Right of Way 8 2 9 19 Improper Turn 4 9 5 18 No Violation 7 4 2 13

D.C. Traffic Safety Report Statistics 2002-2004 Michael Baker Jr., Inc. 91
Figure 131: MINNESOTA AVE AND PENNSYLVANIA AVE, SE
Type of Collision 2002 2003 2004 Total
Rear End 16 9 10 35 Right Angle 15 5 15 35 Side Swiped 15 9 8 32 Other 1 6 0 7 Left Turn Hit Veh. 4 0 1 5 Fixed Object 2 1 1 4 Parked Vehicle 1 0 2 3 Straight Hit Ped. 2 0 0 2 Right Turn Hit Veh. 0 0 2 2
Head On 0 1 0 1 Right Turn Hit Ped. 0 1 0 1
35
35
32
75 4 3
Rear EndRight AngleSide SwipedOtherLeft Turn Hit Veh.Fixed ObjectParked Vehicle
Figure 132: BRANCH AVE AND PENNSYLVANIA AVE, SE
Type of Collision 2002 2003 2004 Total
Rear End 13 4 9 26 Right Angle 4 2 6 12 Left Turn Hit Veh. 4 2 4 10 Side Swiped 3 0 4 7 Fixed Object 2 0 2 4 Backing Hit Parked Veh. 0 2 0 2
Backing Hit Moving Veh. 1 0 1 2
Backing Hit Stopped Vehicle 0 1 1 2
Other 0 1 1 2 Parked Vehicle 1 0 1 2 Right Turn Hit Veh. 0 1 1 2
26
12
10
7
4
Rear End
Right Angle
Left Turn Hit Veh.
Side Swiped
Fixed Object
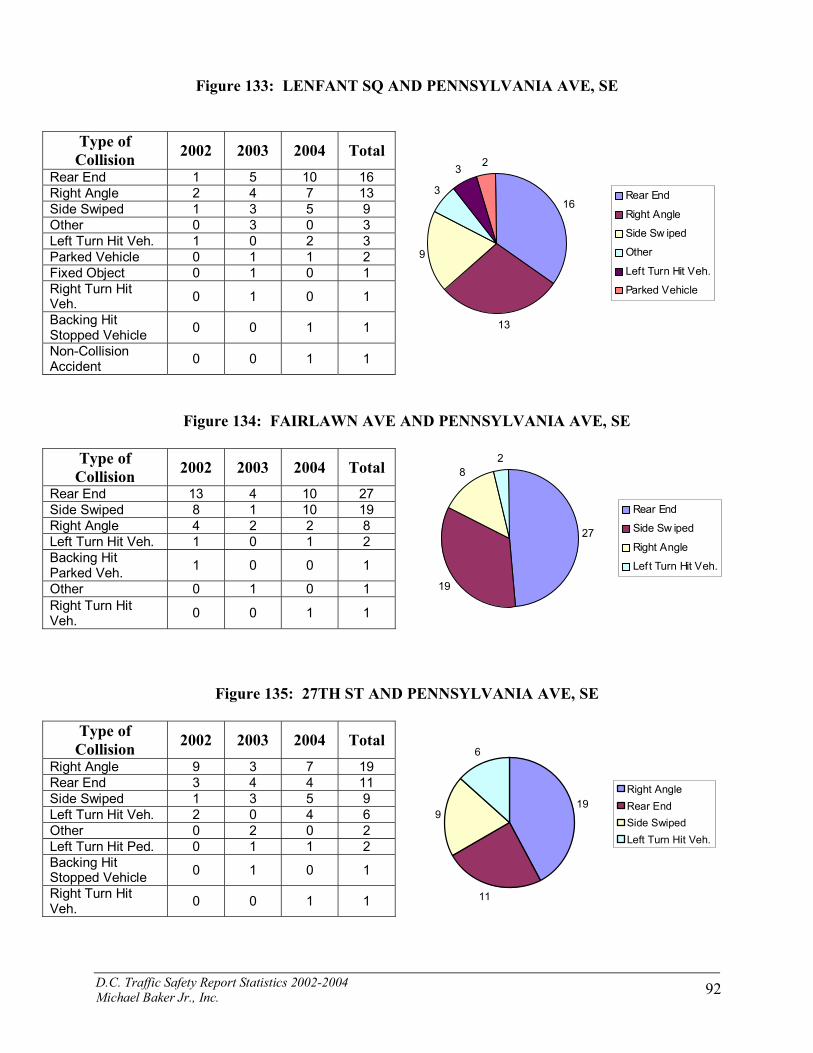
D.C. Traffic Safety Report Statistics 2002-2004 Michael Baker Jr., Inc. 92
Figure 133: LENFANT SQ AND PENNSYLVANIA AVE, SE
Type of Collision 2002 2003 2004 Total
Rear End 1 5 10 16 Right Angle 2 4 7 13 Side Swiped 1 3 5 9 Other 0 3 0 3 Left Turn Hit Veh. 1 0 2 3 Parked Vehicle 0 1 1 2 Fixed Object 0 1 0 1 Right Turn Hit Veh. 0 1 0 1
Backing Hit Stopped Vehicle 0 0 1 1
Non-Collision Accident 0 0 1 1
16
13
9
3
3 2
Rear End
Right Angle
Side Sw iped
Other
Left Turn Hit Veh.
Parked Vehicle
Figure 134: FAIRLAWN AVE AND PENNSYLVANIA AVE, SE
Type of Collision 2002 2003 2004 Total
Rear End 13 4 10 27 Side Swiped 8 1 10 19 Right Angle 4 2 2 8 Left Turn Hit Veh. 1 0 1 2 Backing Hit Parked Veh. 1 0 0 1
Other 0 1 0 1 Right Turn Hit Veh. 0 0 1 1
27
19
82
Rear End
Side Sw iped
Right Angle
Left Turn Hit Veh.
Figure 135: 27TH ST AND PENNSYLVANIA AVE, SE
Type of Collision 2002 2003 2004 Total
Right Angle 9 3 7 19 Rear End 3 4 4 11 Side Swiped 1 3 5 9 Left Turn Hit Veh. 2 0 4 6 Other 0 2 0 2 Left Turn Hit Ped. 0 1 1 2 Backing Hit Stopped Vehicle 0 1 0 1
Right Turn Hit Veh. 0 0 1 1
19
11
9
6
Right AngleRear EndSide SwipedLeft Turn Hit Veh.

D.C. Traffic Safety Report Statistics 2002-2004 Michael Baker Jr., Inc. 93
Figure 136: ALABAMA AVE AND PENNSYLVANIA AVE, SE
Type of Collision 2002 2003 2004 Total
Rear End 4 6 7 17 Right Angle 2 2 5 9 Left Turn Hit Veh. 1 2 3 6 Side Swiped 0 1 5 6 Parked Vehicle 2 1 0 3 Other 1 1 0 2 Backing Hit Stopped Vehicle 0 2 0 2
Left Turn Hit Ped. 1 0 0 1
17
9
6
6
3
Rear EndRight AngleLeft Turn Hit Veh.Side SwipedParked Vehicle
Figure 137: 30TH ST AND PENNSYLVANIA AVE, SE
Type of Collision 2002 2003 2004 Total
Side Swiped 4 1 5 10 Right Angle 2 3 3 8 Left Turn Hit Veh. 2 2 4 8 Rear End 4 1 2 7 Other 1 3 0 4 Parked Vehicle 1 0 0 1
Right Turn Hit Veh. 0 0 1 1
10
88
7
4
Side Sw iped
Right Angle
Left Turn Hit Veh.
Rear End
Other
Figure 138: PENNSYLVANIA AVE AND SOUTHERN AVE, SE
Type of Collision 2002 2003 2004 Total
Side Swiped 4 6 0 10 Rear End 5 2 2 9 Left Turn Hit Veh. 0 2 5 7 Parked Vehicle 3 0 1 4 Right Angle 3 0 0 3 Other 0 2 0 2 Head On 0 1 0 1
Right Turn Hit Veh. 0 0 1 1
10
97
4
3
2 1 1Side Swiped
Rear End
Left Turn Hit Veh.
Parked Vehicle
Right Angle
Other
Head On
Right Turn Hit Veh.

D.C. Traffic Safety Report Statistics 2002-2004 Michael Baker Jr., Inc. 94
PENNSYLVANIA AVE still had significant Rear-End crashes, but compared to other corridors, it had a large number of Right Angle accidents at each intersections. At two intersections in particular, MINNESOTA AVE AND PENNSYLVANIA AVE and 27TH ST AND PENNSYLVANIA AVE there were more Right-Angle crashes than Rear-End crashes.
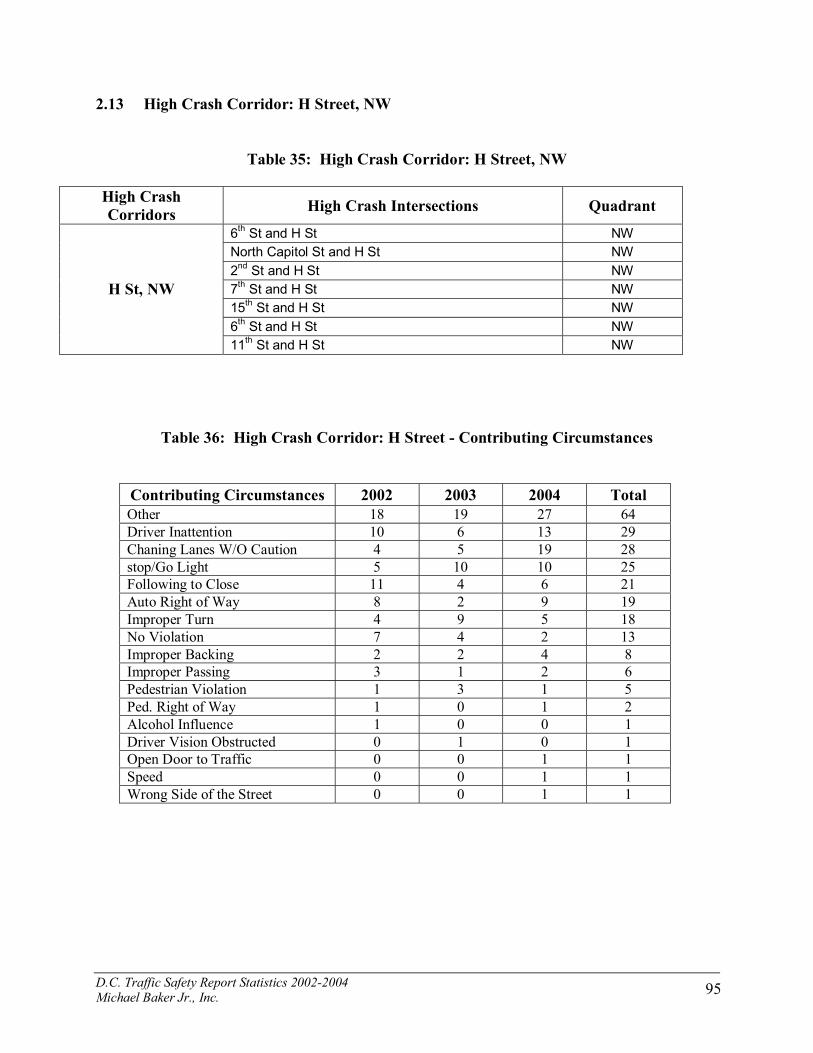
D.C. Traffic Safety Report Statistics 2002-2004 Michael Baker Jr., Inc. 95
2.13 High Crash Corridor: H Street, NW
Table 35: High Crash Corridor: H Street, NW High Crash Corridors High Crash Intersections Quadrant
6th St and H St NW North Capitol St and H St NW 2nd St and H St NW 7th St and H St NW 15th St and H St NW 6th St and H St NW
H St, NW
11th St and H St NW
Table 36: High Crash Corridor: H Street - Contributing Circumstances
Contributing Circumstances 2002 2003 2004 Total Other 18 19 27 64 Driver Inattention 10 6 13 29 Chaning Lanes W/O Caution 4 5 19 28 stop/Go Light 5 10 10 25 Following to Close 11 4 6 21 Auto Right of Way 8 2 9 19 Improper Turn 4 9 5 18 No Violation 7 4 2 13 Improper Backing 2 2 4 8 Improper Passing 3 1 2 6 Pedestrian Violation 1 3 1 5 Ped. Right of Way 1 0 1 2 Alcohol Influence 1 0 0 1 Driver Vision Obstructed 0 1 0 1 Open Door to Traffic 0 0 1 1 Speed 0 0 1 1 Wrong Side of the Street 0 0 1 1

D.C. Traffic Safety Report Statistics 2002-2004 Michael Baker Jr., Inc. 96
Figure 139: 6th St and H St, NW
Type of Collision 2002 2003 2004 Total
Side Swiped 4 6 5 15 Left Turn Hit Veh. 2 1 1 4 Right Angle 1 2 1 4 Parked Vehicle 1 1 2 4 Rear End 2 1 0 3 Backing Hit Parked Veh. 1 1 0 2 Right Turn Hit Ped. 0 2 0 2 Fixed Object 1 1 0 2 Straight Hit Ped. 1 0 1 2 Backing Hit Moving Veh. 1 0 0 1 Backing Hit Ped. 0 0 1 1 Right Turn Hit Veh. 0 0 1 1
15
44
4
3
2
2
22 Side Swiped
Left Turn Hit Veh.
Right Angle
Parked Vehicle
Rear End
Backing HitParked Veh.Right Turn Hit Ped.
Fixed Object
Straight Hit Ped.
Figure 140: North Capitol St and H St, NW & NE
Type of Collision 2002 2003 2004 Total
Side Swiped 13 3 14 30 Rear End 11 6 6 23 Left Turn Hit Veh. 8 1 3 12 Right Angle 2 6 3 11 Other 0 1 2 3 Head On 1 0 1 2 Backing Hit Moving Veh. 1 0 0 1 Backing Hit Parked Veh. 1 0 0 1 Backing Hit Stopped Vehicle 1 0 0 1 Fixed Object 1 0 0 1 Right Turn Hit Ped. 1 0 0 1 Straight Hit Ped. 0 1 0 1 Backing Hit Ped. 0 0 1 1 Left Turn Hit Ped. 0 0 1 1 Unknown 0 0 1 1
30
23
12
11
3 2 11 1Side Swiped
Rear End
Left Turn Hit Veh.
Right Angle
Other
Head On
Backing Hit Moving Veh.
Backing Hit Parked Veh.

D.C. Traffic Safety Report Statistics 2002-2004 Michael Baker Jr., Inc. 97
Figure 141: 2nd St and H St
Type of Collision 2002 2003 2004 Total
Right Angle 5 8 8 21 Left Turn Hit Veh. 3 1 3 7 Rear End 1 3 2 6 Side Swiped 2 2 2 6 Parked Vehicle 1 0 1 2 Other 0 1 0 1
Right Turn Hit Veh. 0 0 1 1
21
7
6
6
2 1 1
Right Angle
Left Turn Hit Veh.
Rear End
Side Sw iped
Parked Vehicle
Other
Right Turn Hit Veh.
Figure 142: 7th St and H St
Type of Collision 2002 2003 2004 Total
Side Swiped 2 7 9 18 Rear End 6 0 2 8 Right Angle 3 0 0 3 Left Turn Hit Veh. 2 0 1 3 Other 0 1 1 2 Straight Hit Ped. 0 1 1 2 Non-Collision Accident 0 0 2 2 Right Turn Hit Ped. 1 0 0 1 Right Turn Hit Veh. 0 1 0 1 Backing Hit Parked Veh. 0 0 1 1 Backing Hit Stopped Vehicle 0 0 1 1 Parked Vehicle 0 0 1 1
18
8
3
3
2
22 1
Side Swiped
Rear End
Right Angle
Left Turn Hit Veh.
Other
Straight Hit Ped.
Non-CollisionAccidentRight Turn Hit Ped.

D.C. Traffic Safety Report Statistics 2002-2004 Michael Baker Jr., Inc. 98
Figure 143: 15th St and H St
Type of Collision 2002 2003 2004 Total
Rear End 6 3 6 15 Side Swiped 4 3 8 15 Left Turn Hit Veh. 0 2 1 3 Right Turn Hit Veh. 0 1 1 2 Parked Vehicle 1 0 0 1 Right Turn Hit Ped. 1 0 0 1 Backing Hit Stopped Vehicle 0 1 0 1 Straight Hit Ped. 0 1 0 1 Backing Hit Ped. 0 0 1 1 Fixed Object 0 0 1 1
Other 0 0 1 1
15
15
3
21 1 1
Rear End
Side Swiped
Left Turn Hit Veh.
Right Turn Hit Veh.
Parked Vehicle
Right Turn Hit Ped.
Backing HitStopped Vehicle
Figure 144: 6th St and H St
Type of Collision 2002 2003 2004 Total
Side Swiped 4 6 5 15 Left Turn Hit Veh. 2 1 1 4 Right Angle 1 2 1 4 Parked Vehicle 1 1 2 4 Rear End 2 1 0 3 Backing Hit Parked Veh. 1 1 0 2 Right Turn Hit Ped. 0 2 0 2 Fixed Object 1 1 0 2 Straight Hit Ped. 1 0 1 2 Backing Hit Moving Veh. 1 0 0 1 Backing Hit Ped. 0 0 1 1 Right Turn Hit Veh. 0 0 1 1
15
44
4
3
2
22
Side Sw iped
Left Turn Hit Veh.
Right Angle
Parked Vehicle
Rear End
Backing Hit ParkedVeh.Right Turn Hit Ped.

D.C. Traffic Safety Report Statistics 2002-2004 Michael Baker Jr., Inc. 99
Figure 145: 11th St and H St
Type of
Collision 2002 2003 2004 Total Side Swiped 5 1 10 16 Right Turn Hit Veh. 0 5 1 6 Rear End 3 2 0 5 Right Angle 1 1 1 3 Parked Vehicle 1 0 2 3 Head On 0 1 0 1 Non-Collision Accident 0 1 0 1 Other 0 1 0 1 Straight Hit Ped. 0 0 1 1
Backing Hit Stopped Vehicle 0 0 1 1
16
6
5
3
31 1 1
Side Sw iped
Right Turn Hit Veh.
Rear End
Right Angle
Parked Vehicle
Head On
Non-CollisionA id t

D.C. Traffic Safety Report Statistics 2002-2004 Michael Baker Jr., Inc. 100
2.14 High Crash Corridor: K Street, NW & NE
Table 37: High Crash Corridor: K Street, NW & NE High Crash Corridors High Crash Intersections Quadrant
North Capitol St and K St NE&NW 14th St and K St NW 16th St and K St NW 15th St and K St NW 1st St and K St NE 17th St and K St NW
K St, NE & NW
18th St and K St NW
Table 38: High Crash Corridor: K Street - Contributing Circumstances
Contributing Circumstances 2002 2003 2004 Total Other 30 34 34 98 Auto Right of Way 13 13 22 48 Driver Inattention 15 13 14 42 Chaning Lanes W/O Caution 14 8 10 32 Following to Close 11 8 12 31 Improper Turn 12 8 8 28 No Violation 7 7 4 18 Pedestrian Violation 7 2 4 13 Speed 1 4 4 9 stop/Go Light 1 3 4 8 Ped. Right of Way 2 1 4 7 Improper Passing 4 1 1 6 Improper Backing 1 0 4 5 Wrong Side of the Street 3 0 1 4 Alcohol Influence 2 1 0 3 Open Door to Traffic 1 1 0 2 Directional Light 1 0 0 1 Driver Vision Obstructed 1 0 0 1 Improper Starting 0 0 1 1 Other Defects 0 1 0 1 Ped. Drunk 1 0 0 1

D.C. Traffic Safety Report Statistics 2002-2004 Michael Baker Jr., Inc. 101
Figure 146: North Capitol St and K St
Type of Collision 2002 2003 2004 Total
Side Swiped 9 12 4 25 Rear End 11 2 4 17 Right Turn Hit Veh. 1 3 4 8 Left Turn Hit Veh. 2 1 3 6 Parked Vehicle 2 1 1 4 Straight Hit Ped. 1 0 3 4 Other 0 3 0 3 Backing Hit Stopped Vehicle 0 1 1 2 Fixed Object 0 1 1 2 Right Angle 0 1 1 2 Right Turn Hit Ped. 1 0 1 2 Backing Hit Ped. 1 0 0 1 Backing Hit Parked Veh. 0 0 1 1
25
17
8
6
4
43 2 2
Side Sw iped
Rear End
Right Turn Hit Veh.
Left Turn Hit Veh.
Parked Vehicle
Straight Hit Ped.
Other
Backing Hit
Figure 147: 14th St and K St
Type of Collision 2002 2003 2004 Total
Side Swiped 10 6 8 24 Rear End 7 3 6 16 Right Angle 2 4 5 11 Left Turn Hit Veh. 2 1 2 5 Right Turn Hit Veh. 0 3 2 5 Other 0 2 1 3 Straight Hit Ped. 1 0 2 3 Head On 1 1 0 2 Backing Hit Moving Veh. 1 0 1 2 Fixed Object 1 0 1 2 Parked Vehicle 0 1 1 2 Backing Hit Stopped Vehicle 0 1 0 1 Backing Hit Ped. 1 0 0 1
24
1611
5
5
33
2 2 2 Side Sw iped
Rear End
Right Angle
Left Turn Hit Veh.
Right Turn Hit Veh.
Other
Straight Hit Ped.
Head On
Backing Hit Moving

D.C. Traffic Safety Report Statistics 2002-2004 Michael Baker Jr., Inc. 102
Figure 148: 16th St and K St
Type of Collision 2002 2003 2004 Total
Side Swiped 5 0 3 8 Right Angle 2 1 4 7 Right Turn Hit Veh. 1 2 4 7 Other 0 3 0 3 Backing Hit Stopped Vehicle 1 0 2 3 Left Turn Hit Veh. 1 0 2 3 Rear End 0 1 2 3 Parked Vehicle 0 1 1 2 Right Turn Hit Ped. 0 0 2 2 Left Turn Hit Ped. 1 0 0 1 Straight Hit Ped. 1 0 0 1 Backing Hit Ped. 0 1 0 1
8
7
7
3
3
3
32
Side Sw iped
Right Angle
Right Turn Hit Veh.
Other
Backing HitStopped VehicleLeft Turn Hit Veh.
Rear End
Parked Vehicle
Figure 149: 15th St and K St
Type of Collision 2002 2003 2004 Total
Side Swiped 5 4 3 12 Rear End 4 3 5 12 Right Angle 3 2 0 5 Parked Vehicle 2 1 1 4 Left Turn Hit Veh. 1 1 2 4 Straight Hit Ped. 1 2 0 3 Head On 0 0 2 2 Other 1 0 0 1 Right Turn Hit Veh. 1 0 0 1 Left Turn Hit Ped. 0 1 0 1 Non-Collision Accident 0 0 1 1 Fixed Object 0 0 1 1 Backing Hit Parked Veh. 0 0 1 1
12
125
4
4
32 1
Side Sw iped
Rear End
Right Angle
Parked Vehicle
Left Turn Hit Veh.
Straight Hit Ped.
Head On
Other

D.C. Traffic Safety Report Statistics 2002-2004 Michael Baker Jr., Inc. 103
Figure 150: 1st St and K St
Type of Collision 2002 2003 2004 Total
Rear End 3 3 4 10 Side Swiped 6 1 1 8 Left Turn Hit Veh. 1 2 3 6 Parked Vehicle 0 0 5 5 Straight Hit Ped. 2 1 1 4 Right Turn Hit Veh. 1 1 0 2 Backing Hit Moving Veh. 0 0 2 2 Backing Hit Ped. 1 0 0 1 Left Turn Hit Ped. 1 0 0 1 Right Angle 0 0 1 1 Right Turn Hit Ped. 0 0 1 1
10
86
5
4
22 Rear End
Side Swiped
Left Turn Hit Veh.
Parked Vehicle
Straight Hit Ped.
Right Turn Hit Veh.
Backing HitMoving Veh.
Figure 151: 17th St and K St
Type of Collision 2002 2003 2004 Total
Side Swiped 5 6 1 12 Rear End 2 1 2 5 Straight Hit Ped. 1 3 0 4 Head On 3 0 0 3 Left Turn Hit Veh. 1 1 1 3 Parked Vehicle 2 0 1 3 Right Angle 1 1 1 3 Other 1 1 0 2
Right Turn Hit Veh. 0 0 2 2
12
54
3
3
3
3 Side Sw iped
Rear End
Straight Hit Ped.
Head On
Left Turn Hit Veh.
Parked Vehicle
Right Angle
Figure 152: 18th St and K St
Type of Collision 2002 2003 2004 Total
Rear End 2 1 6 9 Side Swiped 3 1 4 8 Left Turn Hit Veh. 2 1 2 5 Other 0 4 0 4 Right Angle 1 2 0 3 Right Turn Hit Veh. 0 2 0 2 Straight Hit Ped. 0 0 2 2 Backing Hit Parked Veh. 1 0 0 1 Ran Off Roadway 0 1 0 1 Parked Vehicle 0 0 1 1
9
85
4
3
22
Rear End
Side Sw iped
Left Turn Hit Veh.
Other
Right Angle
Right Turn Hit Veh.
Straight Hit Ped.

D.C. Traffic Safety Report Statistics 2002-2004 Michael Baker Jr., Inc. 104
2.15 High Crash Segment: U St, NW
Table 39: High Crash Segment: U St, NW High Crash Corridors High Crash Intersections Quadrant
14th St and U St NW 16th St and U St NW 13th St and U St NW 15th St and U St NW 11th St and U St NW
U St, NW
12th St and U St NW
Table 40: High Crash Segment: U St - Contributing Circumstances
Contributing Circumstances 2002 2003 2004 Total Other 18 18 33 69 Driver Inattention 14 10 10 34 Chaning Lanes W/O Caution 12 9 12 33 Following to Close 9 9 10 28 No Violation 6 2 20 28 Auto Right of Way 11 5 11 27 Improper Turn 11 3 8 22 Improper Backing 5 4 1 10 Open Door to Traffic 4 1 5 10 Speed 2 4 4 10 Ped. Right of Way 2 4 2 8 Pedestrian Violation 3 2 3 8 stop/Go Light 3 2 3 8 Wrong Side of the Street 3 2 2 7 Improper Passing 2 1 2 5 Alcohol Influence 1 2 0 3 Other Defects 2 0 1 3 Defective Brakes 0 1 1 2 Driver Vision Obstructed 0 0 2 2 Improper Starting 1 1 0 2

D.C. Traffic Safety Report Statistics 2002-2004 Michael Baker Jr., Inc. 105
Figure 153: 14th St and U St
Type of Collision 2002 2003 2004 Total
Side Swiped 16 8 7 31 Rear End 6 5 8 19 Backing Hit Parked Veh. 5 1 1 7 Other 0 5 1 6 Left Turn Hit Veh. 2 1 3 6 Parked Vehicle 1 2 1 4 Right Turn Hit Veh. 0 1 3 4 Right Angle 1 1 1 3 Head On 0 2 0 2 Straight Hit Ped. 1 0 1 2 Backing Hit Ped. 0 1 0 1 Backing Hit Moving Veh. 0 0 1 1 Right Turn Hit Ped. 0 0 1 1
31
19
7
6
6
44 3 Side Sw iped
Rear End
Backing Hit ParkedVeh.Other
Left Turn Hit Veh.
Parked Vehicle
Right Turn Hit Veh.
Right Angle
Figure 154: 16th St and U St
Type of Collision 2002 2003 2004 Total
Side Swiped 8 3 3 14 Rear End 3 6 5 14 Right Turn Hit Veh. 1 4 3 8 Left Turn Hit Veh. 2 2 4 8 Right Angle 4 1 1 6 Parked Vehicle 3 0 3 6 Other 0 2 1 3 Straight Hit Ped. 1 1 0 2 Left Turn Hit Ped. 1 0 0 1 Right Turn Hit Ped. 1 0 0 1 Head On 0 1 0 1 Backing Hit Stopped Vehicle 0 0 1 1 Fixed Object 0 0 1 1
14
14
8
8
6
63
Side Sw iped
Rear End
Right Turn Hit Veh.
Left Turn Hit Veh.
Right Angle
Parked Vehicle
Other

D.C. Traffic Safety Report Statistics 2002-2004 Michael Baker Jr., Inc. 106
Figure 155: 13th St and U St
Type of Collision 2002 2003 2004 Total
Rear End 6 5 5 16 Side Swiped 9 0 5 14 Parked Vehicle 2 1 3 6 Straight Hit Ped. 1 3 1 5 Right Angle 4 0 0 4 Head On 2 0 1 3 Other 0 2 0 2 Right Turn Hit Veh. 0 1 1 2 Left Turn Hit Ped. 0 0 2 2 Backing Hit Stopped Vehicle 0 1 0 1 Non-Collision Accident 0 1 0 1 Backing Hit Parked Veh. 0 1 0 1
16
14
6
5
4
32 2
Rear End
Side Sw iped
Parked Vehicle
Straight Hit Ped.
Right Angle
Head On
Other
Right Turn Hit Veh.
Figure 156: 15th St and U St
Type of Collision 2002 2003 2004 Total
Side Swiped 6 1 4 11 Rear End 4 2 4 10 Right Angle 1 2 5 8 Parked Vehicle 1 1 3 5 Backing Hit Parked Veh. 3 0 0 3 Left Turn Hit Veh. 0 1 1 2 Straight Hit Ped. 0 0 2 2 Backing Hit Moving Veh. 1 0 0 1 Backing Hit Ped. 1 0 0 1 Backing Hit Stopped Vehicle 0 0 1 1 Head On 0 0 1 1 Right Turn Hit Veh. 0 0 1 1
11
108
5
3
2 2Side Sw iped
Rear End
Right Angle
Parked Vehicle
Backing Hit ParkedVeh.Left Turn Hit Veh.
Straight Hit Ped.

D.C. Traffic Safety Report Statistics 2002-2004 Michael Baker Jr., Inc. 107
Figure 157: 11th St and U St
Type of Collision 2002 2003 2004 Total
Right Angle 2 2 3 7 Side Swiped 2 2 2 6 Parked Vehicle 3 0 1 4 Rear End 0 2 1 3 Other 0 2 0 2 Backing Hit Parked Veh. 0 1 1 2 Left Turn Hit Veh. 0 0 2 2 Head On 1 0 0 1 Straight Hit Ped. 1 0 0 1 Backing Hit Moving Veh. 0 1 0 1 Unknown 0 1 0 1 Left Turn Hit Ped. 0 0 1 1 Right Turn Hit Veh. 0 0 1 1
7
64
3
2
22
Right Angle
Side Sw iped
Parked Vehicle
Rear End
Other
Backing Hit ParkedVeh.Left Turn Hit Veh.
Figure 158: 12th St and U St
Type of Collision 2002 2003 2004 Total
Side Swiped 2 1 4 7 Rear End 3 1 1 5 Left Turn Hit Veh. 0 1 4 5 Right Angle 2 2 0 4 Head On 1 2 0 3 Parked Vehicle 1 0 2 3 Backing Hit Parked Veh. 1 1 0 2 Other 0 1 0 1
Straight Hit Ped. 0 0 1 1
7
5
5
4
3
3
2Side Swiped
Rear End
Left Turn Hit Veh.
Right Angle
Head On
Parked Vehicle
Backing HitParked Veh.

D.C. Traffic Safety Report Statistics 2002-2004 Michael Baker Jr., Inc. 108
2.16 High Crash Segment: Rhode Island Ave, NE & NW
Table 41: High Crash Segment: Rhode Island Ave, NE & NW High Crash Corridors High Crash Intersections Quadrant
North Capitol St and Rhode Island Ave NE & NW 14th St and Rhode Island Ave NW 4th St and Rhode Island Ave NE 1st St and Rhode Island Ave NW Florida Ave and Rhode Island Ave NW
Rhode Island Ave, NE & NW
New Jersey Ave and Rhode Island Ave NW
Table 42: High Crash Segment: Rhode Island Ave - Contributing Circumstances
Contributing Circumstances 2002 2003 2004 Total Other 11 24 18 53 Driver Inattention 14 12 17 43 Auto Right of Way 5 25 11 41 Following to Close 6 8 14 28 Speed 4 14 4 22 stop/Go Light 6 5 10 21 Improper Turn 3 7 7 17 Chaning Lanes W/O Caution 6 3 5 14 No Violation 2 7 2 11 Improper Passing 2 6 2 10 Improper Backing 1 0 5 6 Pedestrian Violation 2 2 2 6 Alcohol Influence 3 0 2 5 Defective Brakes 2 0 0 2 Driver Vision Obstructed 1 0 1 2 Ped. Right of Way 0 0 2 2 Drug Influence 0 0 1 1 Open Door to Traffic 0 0 1 1 Other Defects 0 0 1 1 Right Turn on Red 0 0 1 1 Road Defects 0 0 1 1 Stop Sign 0 1 0 1

D.C. Traffic Safety Report Statistics 2002-2004 Michael Baker Jr., Inc. 109
Figure 159: North Capitol St and Rhode Island Ave, NE & NW
Type of Collision 2002 2003 2004 Total
Rear End 8 6 7 21 Side Swiped 3 1 5 9 Right Angle 0 4 2 6 Left Turn Hit Veh. 2 2 1 5 Fixed Object 1 0 2 3 Head On 1 0 0 1 Right Turn Hit Veh. 0 0 1 1
Unknown 0 0 1 1
21
9
6
5
31 1
Rear End
Side Swiped
Right Angle
Left Turn Hit Veh.
Fixed Object
Head On
Right Turn Hit Veh.
Figure 160: 14th St and Rhode Island Ave, NW
Type of Collision 2002 2003 2004 Total
Rear End 9 4 7 20 Side Swiped 6 1 3 10 Parked Vehicle 2 0 3 5 Right Angle 2 2 0 4 Backing Hit Parked Veh. 1 0 3 4 Straight Hit Ped. 1 1 1 3 Left Turn Hit Veh. 0 0 3 3 Left Turn Hit Ped. 1 0 1 2 Other 0 1 1 2 Fixed Object 1 0 0 1 Head On 1 0 0 1 Backing Hit Ped. 0 1 0 1
20
10
5
4
4
33 2 Rear End
Side Sw iped
Parked Vehicle
Right Angle
Backing Hit ParkedVeh.Straight Hit Ped.
Left Turn Hit Veh.
Left Turn Hit Ped.
Figure 161: 4th St and Rhode Island Ave
Type of Collision 2002 2003 2004 Total
Rear End 3 3 7 13 Right Angle 2 3 2 7 Side Swiped 1 1 4 6 Left Turn Hit Veh. 1 3 1 5 Parked Vehicle 3 0 2 5 Fixed Object 1 0 4 5 Straight Hit Ped. 0 2 2 4 Left Turn Hit Ped. 0 0 2 2 Backing Hit Parked Veh. 0 1 0 1
Right Turn Hit Ped. 0 0 1 1
13
7
65
5
5
42 Rear End
Right Angle
Side Swiped
Left Turn Hit Veh.
Parked Vehicle
Fixed Object
Straight Hit Ped.
Left Turn Hit Ped.

D.C. Traffic Safety Report Statistics 2002-2004 Michael Baker Jr., Inc. 110
Figure 162: 1st St and Rhode Island Ave
Type of
Collision 2002 2003 2004 Total Right Angle 1 3 3 7 Side Swiped 4 2 0 6 Rear End 4 1 1 6 Left Turn Hit Veh. 1 2 1 4 Parked Vehicle 2 0 2 4 Backing Hit Parked Veh. 0 0 3 3 Other 0 2 0 2 Straight Hit Ped. 0 2 0 2 Right Turn Hit Veh. 0 1 0 1 Backing Hit Stopped Vehicle 0 0 1 1 Right Turn Hit Ped. 0 0 1 1
7
6
6
4
4
3
22 Right Angle
Side Sw iped
Rear End
Left Turn Hit Veh.
Parked Vehicle
Backing Hit ParkedVeh.Other
Straight Hit Ped.
Figure 163: Florida Ave and Rhode Island Ave
Type of Collision 2002 2003 2004 Total
Rear End 2 3 9 14 Right Angle 5 3 5 13 Side Swiped 1 1 4 6 Left Turn Hit Veh. 1 1 1 3 Fixed Object 1 0 0 1
Head On 0 0 1 1
14
13
6
31 1
Rear End
Right Angle
Side Sw iped
Left Turn Hit Veh.
Fixed Object
Head On
Figure 164: New Jersey Ave and Rhode Island Ave
Type of Collision 2002 2003 2004 Total
Right Angle 3 3 7 13 Rear End 0 3 3 6 Right Turn Hit Veh. 0 1 3 4 Fixed Object 0 1 1 2 Straight Hit Ped. 0 1 1 2 Left Turn Hit Veh. 0 0 2 2 Head On 1 0 0 1 Side Swiped 1 0 0 1 Other 0 1 0 1
Right Turn Hit Ped. 0 1 0 1
13
6
4
2
2
2 1Right Angle
Rear End
Right Turn Hit Veh.
Fixed Object
Straight Hit Ped.
Lef t Turn Hit Veh.
Head On

D.C. Traffic Safety Report Statistics 2002-2004 Michael Baker Jr., Inc. 111
2.17 High Crash Segment: Eastern Ave, NE
Table 43: High Crash Segment: Eastern Ave, NE
High Crash Corridors
Number of High Crash Locations
High Crash Intersections Quadrant
Eastern Ave and Minnesota Ave NE Eastern Ave and New Hampshire Ave NE Eastern Ave and Olive St NE Eastern Ave and Sheriff Rd NE
Eastern Ave, NE 5
Eastern Ave and Kenilworth Ave NE
Table 44: High Crash Segment: Eastern Ave - Contributing Circumstances
Contributing Circumstances 2002 2003 2004 Total Other 14 16 17 47 Auto Right of Way 14 16 11 41 Driver Inattention 11 8 13 32 Speed 6 9 8 23 Following to Close 7 2 13 22 Chaning Lanes W/O Caution 7 5 6 18 Improper Turn 6 7 4 17 No Violation 4 3 4 11 stop/Go Light 0 4 5 9 Wrong Side of the Street 1 2 4 7 Improper Passing 2 1 0 3 Pedestrian Violation 1 2 0 3 Improper Backing 0 1 1 2 Stop Sign 1 0 1 2 Alcohol Influence 0 0 1 1 Defective Brakes 1 0 0 1 Directional Light 0 1 0 1 Driver Vision Obstructed 0 1 0 1 Other Defects 0 1 0 1 Ped. Right of Way 0 1 0 1 Yield Sign 0 0 1 1

D.C. Traffic Safety Report Statistics 2002-2004 Michael Baker Jr., Inc. 112
Figure 165: Eastern Ave and Minnesota Ave, NE
Type of Collision 2002 2003 2004 Total
Rear End 5 4 6 15 Left Turn Hit Veh. 4 4 5 13 Parked Vehicle 2 0 3 5 Head On 4 0 0 4 Side Swiped 2 1 1 4 Right Angle 0 1 3 4 Right Turn Hit Veh. 0 1 2 3 Straight Hit Ped. 0 1 1 2
Other 0 1 0 1
15
13
5
4
4
43
Rear End
Left Turn Hit Veh.
Parked Vehicle
Head On
Side Sw iped
Right Angle
Right Turn Hit Veh.
Figure 166: Eastern Ave and New Hampshire Ave, NE
Type of Collision 2002 2003 2004 Total
Right Angle 6 8 4 18 Left Turn Hit Veh. 7 2 3 12 Rear End 2 1 3 6 Side Swiped 2 0 2 4 Other 0 2 1 3 Parked Vehicle 1 0 0 1 Ran Off Roadway 0 1 0 1
Non-Collision Accident 0 0 1 1
18
12
6
4
3 1 1Right Angle
Left Turn Hit Veh.
Rear End
Side Sw iped
Other
Parked Vehicle
Ran Off Roadw ay
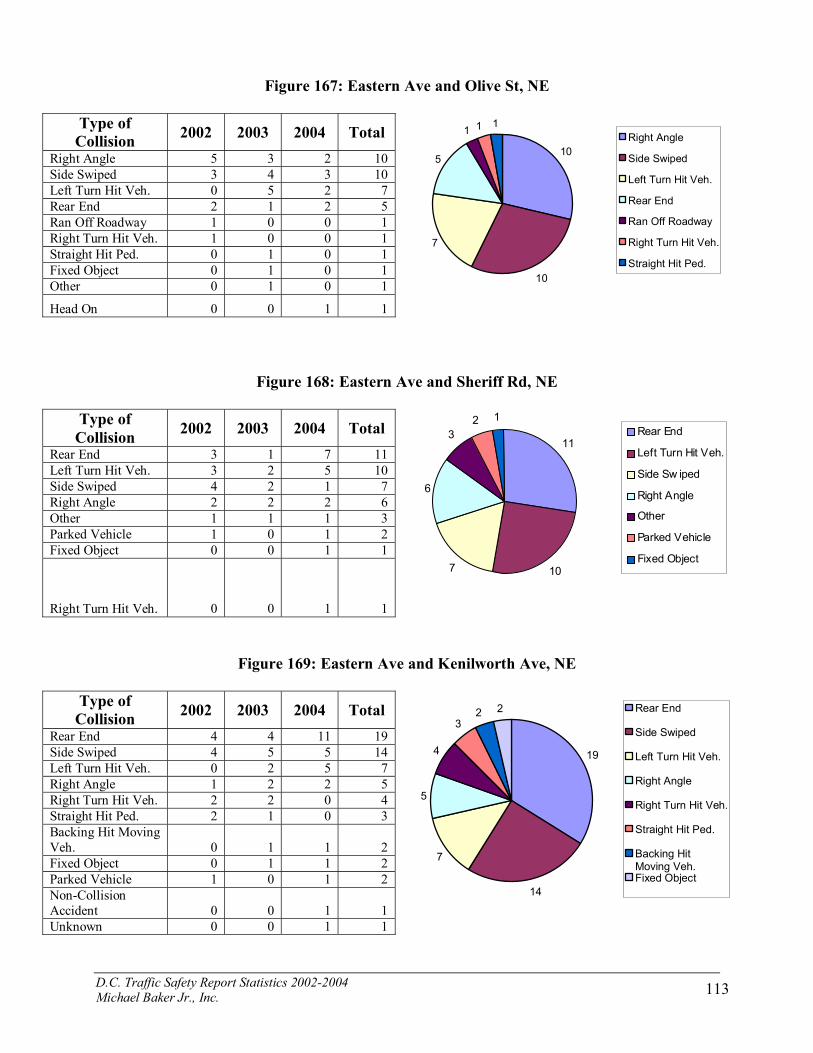
D.C. Traffic Safety Report Statistics 2002-2004 Michael Baker Jr., Inc. 113
Figure 167: Eastern Ave and Olive St, NE
Type of Collision 2002 2003 2004 Total
Right Angle 5 3 2 10 Side Swiped 3 4 3 10 Left Turn Hit Veh. 0 5 2 7 Rear End 2 1 2 5 Ran Off Roadway 1 0 0 1 Right Turn Hit Veh. 1 0 0 1 Straight Hit Ped. 0 1 0 1 Fixed Object 0 1 0 1 Other 0 1 0 1
Head On 0 0 1 1
10
10
7
5
1 1 1Right Angle
Side Swiped
Left Turn Hit Veh.
Rear End
Ran Off Roadway
Right Turn Hit Veh.
Straight Hit Ped.
Figure 168: Eastern Ave and Sheriff Rd, NE
Type of Collision 2002 2003 2004 Total
Rear End 3 1 7 11 Left Turn Hit Veh. 3 2 5 10 Side Swiped 4 2 1 7 Right Angle 2 2 2 6 Other 1 1 1 3 Parked Vehicle 1 0 1 2 Fixed Object 0 0 1 1
Right Turn Hit Veh. 0 0 1 1
11
107
6
32 1
Rear End
Left Turn Hit Veh.
Side Sw iped
Right Angle
Other
Parked Vehicle
Fixed Object
Figure 169: Eastern Ave and Kenilworth Ave, NE
Type of Collision 2002 2003 2004 Total
Rear End 4 4 11 19 Side Swiped 4 5 5 14 Left Turn Hit Veh. 0 2 5 7 Right Angle 1 2 2 5 Right Turn Hit Veh. 2 2 0 4 Straight Hit Ped. 2 1 0 3 Backing Hit Moving Veh. 0 1 1 2 Fixed Object 0 1 1 2 Parked Vehicle 1 0 1 2 Non-Collision Accident 0 0 1 1 Unknown 0 0 1 1
19
14
7
5
4
32 2 Rear End
Side Swiped
Left Turn Hit Veh.
Right Angle
Right Turn Hit Veh.
Straight Hit Ped.
Backing HitMoving Veh.Fixed Object

D.C. Traffic Safety Report Statistics 2002-2004 Michael Baker Jr., Inc. 114
2.18 High Crash Segment: CONSTITUTION AVE, NW
Table 45: High Crash Segment: Constitution Ave, NW
High Crash Corridors
Number of High Crash Locations
High Crash Intersections Quadrant
14th St and Constitution Ave NW 12th St and Constitution Ave NW 9th St and Constitution Ave NW
Constitution Ave, NW 4
15th St and Constitution Ave NW
Table 46: High Crash Segment: Constitution Ave - Contributing Circumstances
Contributing Circumstances 2002 2003 2004 Total Other 20 15 26 61 Driver Inattention 9 14 11 34 stop/Go Light 7 14 10 31 Chaning Lanes W/O Caution 7 6 11 24 Following to Close 10 2 6 18 No Violation 2 7 6 15 Improper Turn 4 5 5 14 Auto Right of Way 7 0 5 12 Speed 7 1 2 10 Pedestrian Violation 0 2 2 4 Alcohol Influence 1 0 2 3 Directional Light 1 0 1 2 Improper Backing 0 0 2 2 Driver Vision Obstructed 0 0 1 1 Drug Influence 1 0 0 1 Improper Passing 1 0 0 1 Stop Sign 0 1 0 1 Wrong Side of the Street 0 1 0 1 Wrong Way - One Way Street 0 1 0 1

D.C. Traffic Safety Report Statistics 2002-2004 Michael Baker Jr., Inc. 115
Figure 170: 14th St and Constitution Ave, NW
Type of Collision 2002 2003 2004 Total
Rear End 11 12 11 34 Side Swiped 9 7 8 24 Right Angle 4 6 7 17 Right Turn Hit Veh. 1 5 3 9 Left Turn Hit Veh. 2 0 4 6 Other 0 3 1 4 Straight Hit Ped. 2 1 0 3 Head On 2 0 0 2 Backing Hit Stopped Vehicle 1 1 0 2 Backing Hit Parked Veh. 0 0 2 2 Non-Collision Accident 0 0 1 1
34
24
17
9
64 3 2 Rear End
Side Sw iped
Right Angle
Right Turn Hit Veh.
Left Turn Hit Veh.
Other
Straight Hit Ped.
Head On
Figure 171: 12th St and Constitution Ave, NW
Type of Collision 2002 2003 2004 Total
Rear End 7 8 7 22 Right Angle 10 2 3 15 Side Swiped 5 3 2 10 Left Turn Hit Veh. 1 1 3 5 Other 0 1 2 3 Straight Hit Ped. 0 0 2 2 Parked Vehicle 1 0 0 1 Backing Hit Stopped Vehicle 0 1 0 1 Right Turn Hit Veh. 0 1 0 1 Backing Hit Moving Veh. 0 0 1 1 Backing Hit Ped. 0 0 1 1
22
15
10
5
3 2 1 Rear End
Right Angle
Side Swiped
Left Turn Hit Veh.
Other
Straight Hit Ped.
Parked Vehicle
Figure 172: 9th St and Constitution Ave, NW
Type of Collision 2002 2003 2004 Total
Right Angle 1 6 7 14 Rear End 3 2 7 12 Side Swiped 5 2 4 11 Left Turn Hit Veh. 0 0 2 2 Parked Vehicle 0 0 2 2 Head On 1 0 0 1 Other 0 1 0 1 Straight Hit Ped. 0 1 0 1
Backing Hit Parked Veh. 0 0 1 1
14
12
11
22 1
Right Angle
Rear End
Side Swiped
Left Turn Hit Veh.
Parked Vehicle
Head On

D.C. Traffic Safety Report Statistics 2002-2004 Michael Baker Jr., Inc. 116
Figure 173: 15th St and Constitution Ave, NW
Type of
Collision 2002 2003 2004 Total Rear End 7 3 4 14 Side Swiped 5 3 5 13 Right Angle 1 3 2 6 Left Turn Hit Veh. 3 0 1 4 Parked Vehicle 2 0 0 2 Head On 0 1 0 1 Other 1 0 0 1
Straight Hit Ped. 0 0 1 1
14
13
6
4
2 1 1Rear End
Side Sw iped
Right Angle
Left Turn Hit Veh.
Parked Vehicle
Head On
Other

D.C. Traffic Safety Report Statistics 2002-2004 Michael Baker Jr., Inc. 117
Appendix Section A: General Overview of Crash Trends
Table A-1: Month of Year
2002 2003 2004 Fatality Crashes Fatality Crashes Fatality Crashes January 6 1,449 4 1,396 5 1,375 February 6 1,374 3 1,416 2 1,358
March 3 1,667 2 1,378 6 1,652 April 6 1,722 4 1,252 8 1,674 May 4 1,615 9 1,397 4 1,718 June 7 1,671 7 1,535 1 1,606 July 2 1,426 8 1,357 5 1,631
August 4 1,516 7 1,518 4 1,503 September 3 1,424 9 1,604 2 1,433
October 4 1,341 3 1,717 3 1,627 November 3 1,446 5 1,489 2 1,353 December 2 1,117 7 1,650 2 1,332
Total 50 17,768 68 17,709 44 18,262
Table A- 2: Month of Year (Percentages)
2002 2003 2004 Fatality Crashes Fatality Crashes Fatality Crashes January 12.0% 8.2% 5.9% 7.9% 11.4% 7.5% February 12.0% 7.7% 4.4% 8.0% 4.5% 7.4%
March 6.0% 9.4% 2.9% 7.8% 13.6% 9.0% April 12.0% 9.7% 5.9% 7.1% 18.2% 9.2% May 8.0% 9.1% 13.2% 7.9% 9.1% 9.4% June 14.0% 9.4% 10.3% 8.7% 2.3% 8.8% July 4.0% 8.0% 11.8% 7.7% 11.4% 8.9%
August 8.0% 8.5% 10.3% 8.6% 9.1% 8.2% September 6.0% 8.0% 13.2% 9.1% 4.5% 7.8%
October 8.0% 7.5% 4.4% 9.7% 6.8% 8.9% November 6.0% 8.1% 7.4% 8.4% 4.5% 7.4% December 4.0% 6.3% 10.3% 9.3% 4.5% 7.3%
Total 100% 100% 100% 100% 100% 100%

D.C. Traffic Safety Report Statistics 2002-2004 Michael Baker Jr., Inc. 118
Table A- 3 Day of the Week
2002 2003 2004 Fatality Crashes Fatality Crashes Fatality Crashes Sunday 9 2,133 7 2,079 3 2,095 Monday 6 2,432 10 2,482 1 2,373 Tuesday 9 2,701 7 2,597 5 2,688
Wednesday 7 2,451 11 2,585 2 2,610 Thursday 6 2,566 9 2,572 10 2,685
Friday 4 2,839 9 2,916 9 3,054 Saturday 6 2,553 15 2,449 15 2,757
Total 47 17,675 68 17,680 45 18,262
Table A- 4 Day of the Week (Percentages)
2002 2003 2004 Fatality Crashes Fatality Crashes Fatality Crashes Sunday 19.1% 12.1% 10.3% 11.8% 6.7% 11.5% Monday 12.8% 13.8% 14.7% 14.0% 2.2% 13.0% Tuesday 19.1% 15.3% 10.3% 14.7% 11.1% 14.7%
Wednesday 14.9% 13.9% 16.2% 14.6% 4.4% 14.3% Thursday 12.8% 14.5% 13.2% 14.5% 22.2% 14.7%
Friday 8.5% 16.1% 13.2% 16.5% 20.0% 16.7% Saturday 12.8% 14.4% 22.1% 13.9% 33.3% 15.1%
Total 100% 100% 100% 100% 100% 100%
Table A- 5 Rush Hour Crashes
2002 2003 2004
Fatality Crashes Fatality Crashes Fatality Crashes 7-9 AM 4 1,583 6 1,570 1 1,711 4-7 PM 5 3,433 7 3,441 9 3,558 Total at
Rush Hour 9 5,016 13 5,011 10 5,269
Table A- 6 Rush Hour Crashes (Percentages of Total) 2002 2003 2004 Peak Hour
Fatality Crashes Fatality Crashes Fatality Crashes 7-9 AM 8.0% 8.9% 8.8% 8.9% 2.2% 9.4% 4-7 PM 10.0% 19.3% 10.3% 19.4% 20.0% 19.5%

D.C. Traffic Safety Report Statistics 2002-2004 Michael Baker Jr., Inc. 119
Table A- 7 Time of the Day
2002 2003 2004 Time Fatality Crashes Fatality Crashes Fatality Crashes 12 AM 0 452 2 426 2 482
1 4 429 7 409 6 438 2 5 425 5 450 1 430 3 5 452 6 457 3 453 4 0 284 1 247 1 269 5 4 241 2 267 3 230 6 0 322 0 364 0 381 7 3 636 4 651 0 659 8 1 947 2 919 1 1,052 9 1 848 1 839 1 932
10 1 768 0 806 1 817 11 1 797 0 783 0 788
12 PM 2 943 2 886 3 913 1 1 831 3 925 1 963 2 1 964 1 975 1 1,035 3 1 1,250 1 1,155 3 1,240 4 2 1,258 2 1,192 1 1,230 5 1 1,127 4 1,172 4 1,227 6 2 1,048 1 1,077 4 1,101 7 2 837 3 834 1 845 8 1 672 4 672 2 660 9 4 658 9 687 2 660
10 4 699 6 625 2 682 11 1 653 2 662 2 682
N/A 3 227 0 230 0 93 Total 50 17,768 68 17,710 45 18,262

D.C. Traffic Safety Report Statistics 2002-2004 Michael Baker Jr., Inc. 120
Table A- 8 Time of the Day (Percentage)
2002 2003 2004 Time Fatality Crashes Fatality Crashes Fatality Crashes
12 AM 0.0% 2.5% 2.9% 2.4% 4.4% 2.6% 1 8.0% 2.4% 10.3% 2.3% 13.3% 2.4% 2 10.0% 2.4% 7.4% 2.5% 2.2% 2.4% 3 10.0% 2.5% 8.8% 2.6% 6.7% 2.5% 4 0.0% 1.6% 1.5% 1.4% 2.2% 1.5% 5 8.0% 1.4% 2.9% 1.5% 6.7% 1.3% 6 0.0% 1.8% 0.0% 2.1% 0.0% 2.1% 7 6.0% 3.6% 5.9% 3.7% 0.0% 3.6% 8 2.0% 5.3% 2.9% 5.2% 2.2% 5.8% 9 2.0% 4.8% 1.5% 4.7% 2.2% 5.1%
10 2.0% 4.3% 0.0% 4.6% 2.2% 4.5% 11 2.0% 4.5% 0.0% 4.4% 0.0% 4.3%
12 PM 4.0% 5.3% 2.9% 5.0% 6.7% 5.0% 1 2.0% 4.7% 4.4% 5.2% 2.2% 5.3% 2 2.0% 5.4% 1.5% 5.5% 2.2% 5.7% 3 2.0% 7.0% 1.5% 6.5% 6.7% 6.8% 4 4.0% 7.1% 2.9% 6.7% 2.2% 6.7% 5 2.0% 6.3% 5.9% 6.6% 8.9% 6.7% 6 4.0% 5.9% 1.5% 6.1% 8.9% 6.0% 7 4.0% 4.7% 4.4% 4.7% 2.2% 4.6% 8 2.0% 3.8% 5.9% 3.8% 4.4% 3.6% 9 8.0% 3.7% 13.2% 3.9% 4.4% 3.6%
10 8.0% 3.9% 8.8% 3.5% 4.4% 3.7% 11 2.0% 3.7% 2.9% 3.7% 4.4% 3.7%
N/A 6.0% 1.3% 0.0% 1.3% 0.0% 0.5% Total 100% 100% 100% 100% 100% 100%

D.C. Traffic Safety Report Statistics 2002-2004 Michael Baker Jr., Inc. 121
Crash Location Trends
Table A- 9 City Quadrants
2002 2003 2004 Fatality Crashes Fatality Crashes Fatality Crashes
NW 10 8,515 26 8,494 15 9,055 NE 14 4,166 21 4,327 19 4,669 SE 22 3,341 16 3,328 9 3,627 SW 0 639 1 763 1 872 Other 4 1,107 4 798 1 39 Total 50 17,768 68 17,710 45 18,262
Table A- 10 City Quadrants (Percentage)
2002 2003 2004 Fatality Crashes Fatality Crashes Fatality Crashes
NW 20.0% 47.9% 38.2% 48.0% 33.3% 49.6% NE 28.0% 23.4% 30.9% 24.4% 42.2% 25.6% SE 44.0% 18.8% 23.5% 18.8% 20.0% 19.9% SW 0.0% 3.6% 1.5% 4.3% 2.2% 4.8% Other 8.0% 6.2% 5.9% 4.5% 2.2% 0.2% Total 100% 100% 100% 100% 100% 100%
NW always has the most crashes and SW has the lowest number of crashes and fatalities
Table A- 11 Police District
2002 2003 2004 District Fatality Crashes Fatality Crashes Fatality Crashes
1 5 3,137 9 2,832 6 3,960 2 4 2,184 7 1,910 6 2,218 3 1 2,369 4 2,044 3 2,982 4 7 2,650 12 2,233 6 2,414 5 4 2,469 13 2,193 9 2,631 6 9 2,110 17 1,944 11 2,416 7 17 1,535 6 1,343 2 1,536 Unknown 3 1,314 0 3,211 2 105 Total 50 17,768 68 17,710 45 18,262

D.C. Traffic Safety Report Statistics 2002-2004 Michael Baker Jr., Inc. 122
Table A- 12 Police District (Percentage)
2002 2003 2004 Fatality Crashes Fatality Crashes Fatality Crashes 1 10.0% 17.7% 13.2% 16.0% 13.3% 21.7% 2 8.0% 12.3% 10.3% 10.8% 13.3% 12.1% 3 2.0% 13.3% 5.9% 11.5% 6.7% 16.3% 4 14.0% 14.9% 17.6% 12.6% 13.3% 13.2% 5 8.0% 13.9% 19.1% 12.4% 20.0% 14.4% 6 18.0% 11.9% 25.0% 11.0% 24.4% 13.2% 7 34.0% 8.6% 8.8% 7.6% 4.4% 8.4% Unknown 6.0% 7.4% 0.0% 18.1% 4.4% 0.6% Total 100% 100% 100% 100% 100% 100%
Table A- 13 Crashes by Bridges, Circles, Interstates, Ramps, Underpass 2002 2003 2004 Bridges 77 98 90 Circles 149 186 244 Interstate 295 361 96 150 Interstate 395 NA 35 107 Ramps 113 106 116 Underpass 16 29 11
Table A- 14 2004 Crashes at Underpass
Intersection Name Number of Crashes Unknown 4 MINNESOTA AVE AND NANNIE HELEN BURROUGHS AVE 1 INTERSTATE 395 AND TWELFTH ST 1 FLORIDA AVE AND NEW YORK AVE 1 FIRTH STERLING AVE AND SUITLAND PKWY 1 3RD ST AND NEW YORK AVE 1 3RD ST AND FLORIDA AVE 1 25TH ST AND K ST 1

D.C. Traffic Safety Report Statistics 2002-2004 Michael Baker Jr., Inc. 123
Table A- 15 2004 Crashes at Circles
Intersection Name City Quadrant
Number of Crashes
DUPONT CIR AND MASSACHUSETTS AVE NW 15 NEBRASKA AVE AND WARD CIR NW 15 23RD ST AND WASHINGTON CIR NW 14 14TH ST AND THOMAS CIR NW 13 PENNSYLVANIA AVE AND WASHINGTON CIR NW 12 CONNECTICUT AVE AND DUPONT CIR NW 12 BARNEY CIR AND PENNSYLVANIA AVE SE 12 MASSACHUSETTS AVE AND SCOTT CIR NW 12 DUPONT CIR AND NEW HAMPSHIRE AVE NW 10 MINNESOTA AVE AND RANDLE CIR SE 10 CHEVY CHASE CIR AND WESTERN AVE NW 9 DUPONT CIR AND P ST NW 9 13TH ST AND LOGAN CIR NW 8 CHEVY CHASE CIR AND CONNECTICUT AVE NW 8 NEW HAMPSHIRE AVE AND WASHINGTON CIR NW 8 MASSACHUSETTS AVE AND OBSERVATORY CIR NW 7 LOGAN CIR AND RHODE ISLAND AVE NW 7 LOGAN CIR AND P ST NW 6 THOMAS CIR AND VERMONT AVE NW 6 MASSACHUSETTS AVE AND WARD CIR NW 6 K ST AND WASHINGTON CIR NW 4 5TH ST AND GRANT CIR NW 4 MASSACHUSETTS AVE AND SHERIDAN CIR NW 3 CRITTENDEN ST AND SHERMAN CIR NW 3 GRANT CIR AND NEW HAMPSHIRE AVE NW 3 BRANCH AVE AND RANDLE CIR SE 2 16TH ST AND SCOTT CIR NW 2 ILLINOIS AVE AND SHERMAN CIR NW 2 WESTMORELAND CIR AND WESTERN AVE NW 2 TENLEY CIR AND WISCONSIN AVE NW 2 GRANT CIR AND ILLINOIS AVE NW 2 MINNESOTA AVE AND RANDLE CIR SW 1 TENLEY CIR AND YUMA ST NW 1 16TH ST AND SCOTT CIR NE 1 17TH ST AND BARNEY CIR SE 1 1ST ST AND GARFIELD CIR SW 1 23RD ST AND SHERIDAN CIR NW 1 R ST AND SHERIDAN CIR NW 1 GRANT CIR AND VARNUM ST NW 1 5TH ST AND GRANT CIR NW 1 BASS CIR AND BASS PL SE 1

D.C. Traffic Safety Report Statistics 2002-2004 Michael Baker Jr., Inc. 124
MASSACHUSETTS AVE AND WESTMORELAND CIR NW 1 MASSACHUSETTS AVE AND WESLEY CIR NW 1 MASSACHUSETTS AVE AND THOMAS CIR NW 1 M ST AND THOMAS CIR NW 1 LOGAN CIR AND P ST 1 NEBRASKA AVE AND TENLEY CIR NW 1
Table A- 16 2004 Crashes at Bridges
Intersection Name Number of Crashes Unknown 30 INTERSTATE 395 AND FOURTEENTH ST 29 14TH ST AND D ST 4 BENNING RD AND MINNESOTA AVE 4 INTERSTATE 395 AND TWELFTH ST 3 S CAPITOL ST AND M ST 2 S CAPITOL ST AND HOWARD RD 2 11TH ST AND INTERSTATE 295 1 14TH ST AND F ST 1 14TH ST AND POTOMAC AVE 1 26TH ST AND M ST 1 7TH ST AND FRANKLIN ST 1 ANACOSTIA AVE AND BENNING RD 1 COLUMBIA RD AND MICHIGAN AVE 1 INTERSTATE 395 AND SEVENTH ST 1 SOUSA BRIDGE 1 INTERSTATE 395 AND SIXTH ST 1 JOHN MCCORMACK RD AND MICHIGAN AVE 1 M ST AND FRANCIS SCOTT KEY BRIDGE 1 NEW HAMPSHIRE AVE AND OGLETHORPE ST 1 S CAPITOL ST AND N ST 1 S CAPITOL ST AND P ST 1 FAIRLAWN AVE AND PENNSYLVANIA AVE 1

D.C. Traffic Safety Report Statistics 2002-2004 Michael Baker Jr., Inc. 125
Table A- 17 2004 Crashes at Ramps
Intersection Name Number of Crashes Unknown 67 INTERSTATE 395 AND PENNSYLVANIA AVE 5 HOWARD RD AND INTERSTATE 295 4 INTERSTATE 395 AND THIRD ST 3 CHESAPEAKE ST AND INTERSTATE 295 2 3RD ST AND D ST 2 INTERSTATE 295 AND S CAPITOL ST 2 S CAPITOL ST AND I ST 2 INTERSTATE 395 AND D ST 2 EASTERN AVE AND KENILWORTH AVE 1 11TH ST AND TWELFTH ST 1 EAST CAPITOL ST AND DIVISION AVE 1 BENNING RD AND KENILWORTH AVE 1 3RD ST AND H ST 1 ALABAMA AVE AND SUITLAND PKWY 1 12TH ST AND M ST 1 12TH ST AND INDEPENDENCE AVE 1 27TH ST AND K ST 1 16TH ST AND MILITARY RD 1 16TH ST AND MASSACHUSETTS AVE 1 BARNEY CIR AND PENNSYLVANIA AVE 1 FIRTH STERLING AVE AND SUITLAND PKWY 1 INTERSTATE 295 AND OVERLOOK AVE 1 SUITLAND PKWY AND INTERSTATE 295 1 INTERSTATE 295 AND SOUTH CAPITOL ST 1 INTERSTATE 395 AND MAINE AV 1 INTERSTATE 395 AND MASSACHUSETTS AVE 1 JAY ST AND KENILWORTH AVE 1 JOHN MCCORMACK RD AND TAYLOR ST 1 KENILWORTH AVE 1 KENILWORTH AVE AND NANNIE HELEN BURROUGHS AVE 1 KENNEDY ST AND SOUTH DAKOTA AVE 1 NORTH CAPITOL ST AND S ST 1 RIGGS RD AND SOUTH DAKOTA AVE 1 S CAPITOL ST AND O ST 1 HAYES ST AND KENILWORTH AVE 1

D.C. Traffic Safety Report Statistics 2002-2004 Michael Baker Jr., Inc. 126
Table A- 18 2004 Crashes along Interstate 395 Intersection Name Number of Crashes
INTERSTATE 395 AND THIRD ST 20 INTERSTATE 395 AND FOURTEENTH ST 20 INTERSTATE 395 AND MAINE AV 17 INTERSTATE 395 AND TWELFTH ST 12 INTERSTATE 395 AND PENNSYLVANIA AVE 9 INTERSTATE 395 AND D ST 7 INTERSTATE 395 AND SIXTH ST 6 INTERSTATE 395 AND NINTH ST 5 INTERSTATE 395 AND MASSACHUSETTS AVE 4 INTERSTATE 395 AND C ST 4 INTERSTATE 395 AND SEVENTH ST 2 INTERSTATE 395 AND NEW YORK AVE 1
Table A- 19 2004 Crashes along Interstate 295
Intersection Name Number of Crashes EASTERN AVE AND KENILWORTH AVE 28 HOWARD RD AND INTERSTATE 295 23 SUITLAND PKWY AND INTERSTATE 295 13 KENILWORTH AVE AND NANNIE HELEN BURROUGHS AVE 12 INTERSTATE 295 AND S CAPITOL ST 9 KENILWORTH AVE AND QUARLES ST 8 KENILWORTH AVE AND POLK ST 7 FIRTH STERLING AVE AND INTERSTATE 295 7 HAYES ST AND KENILWORTH AVE 7 BENNING RD AND KENILWORTH AVE 6 CHESAPEAKE ST AND INTERSTATE 295 3 11TH ST AND INTERSTATE 295 3 INTERSTATE 295 3 KENILWORTH AVE AND ORD ST 3 INTERSTATE 295 AND OVERLOOK AVE 2 HAYES ST AND KENILWORTH TERR 2 KENILWORTH AVE AND LANE PL 2 BAKER ST AND KENILWORTH AVE 2 INTERSTATE 295 AND LABORATORY RD 1 INTERSTATE 295 AND SOUTH CAPITOL ST 1 JAY ST AND KENILWORTH AVE 1 FOOTE ST AND KENILWORTH AVE 1 KENILWORTH AVE 1 EAST CAPITOL ST AND KENILWORTH AVE 1 DOUGLAS ST AND KENILWORTH AVE 1 KENILWORTH AVE AND MEADE ST 1 42ND ST AND KENILWORTH AVE 1 INTERSTATE 295 AND BENNING RD 1

D.C. Traffic Safety Report Statistics 2002-2004 Michael Baker Jr., Inc. 127
Table A- 20 Type of Collision the Crashes at Bridges
2002 2003 2004
Rear End 49 51 62
Side Swiped 13 18 17
Fixed Object 6 14 4
Head On 1 2 2
Right Angle 1 0 1
Ran Off Roadway 0 0 1 Non-Collision
Accident 1 3 1
Left Turn Hit Veh. 3 0 1 Backing Hit Parked
Veh. 0 1 1
Other 1 7 0
Right Turn Hit Veh. 0 1 0
Parked Vehicle 0 1 0
Straight Hit Ped. 2 0 0
Total 77 98 90

D.C. Traffic Safety Report Statistics 2002-2004 Michael Baker Jr., Inc. 128
Table A- 21 Type of Collision the Crashes at Circles
2002 2003 2004
Side Swiped 52 53 92
Rear End 38 47 55
Right Angle 22 15 31
Right Turn Hit Veh. 5 9 15
Fixed Object 10 8 10
Parked Vehicle 7 3 9
Ran Off Roadway 1 2 6
Left Turn Hit Veh. 2 6 4
Head On 3 7 4
Straight Hit Ped. 3 0 4 Backing Hit
Stopped Vehicle 0 2 3
Other 1 25 3 Backing Hit Parked
Veh. 2 0 2
Right Angle 0 0 1
Unknown 0 1 1
Right Turn Hit Ped. 0 1 1 Backing Hit Moving
Veh. 2 2 1 Non-Collision
Accident 1 1 1
Backing Hit Ped. 0 0 1
Left Turn Hit Ped. 0 3 0 Backing Hit Parked
Veh. 0 1 0
Total 149 186 244

D.C. Traffic Safety Report Statistics 2002-2004 Michael Baker Jr., Inc. 129
Table A- 22 Type of Collision the Crashes at Ramps
2002 2003 2004
Rear End 62 59 58
Side Swiped 16 14 21
Fixed Object 20 16 17
Right Turn Hit Veh. 0 1 4
Ran Off Roadway 5 1 3
Left Turn Hit Veh. 0 2 3
Unknown 0 0 2
Straight Hit Ped. 0 0 2
Other 1 2 2
Right Angle 2 1 1 Non-Collision
Accident 0 4 1
Head On 1 3 1 Backing Hit Parked
Veh. 1 0 1
Parked Vehicle 3 2 0
Backing Hit Ped. 0 1 0 Backing Hit
Stopped Vehicle 1 0 0 Backing Hit Moving
Veh. 1 0 0
Total 113 106 116

D.C. Traffic Safety Report Statistics 2002-2004 Michael Baker Jr., Inc. 130
Table A- 23 Crash by Intersections
2002 2003 2004
Fatality Crashes Fatality Crashes Fatality Crashes Not at
Intersection 12 4,021 22 4,337 16 4,650
At Intersection 26 7,210 26 6,438 20 6,542 Within 100' of Intersection 8 5,972 15 6,376 6 6,449
N/A 4 565 5 559 3 621
Total 50 17,768 68 17,710 45 18,262
Table A- 24 Crash by Intersections (Percentages)
2002 2003 2004
Fatality Crashes Fatality Crashes Fatality Crashes Not at
Intersection 24.0% 22.6% 32.4% 24.5% 35.6% 25.5%
At Intersection 52.0% 40.6% 38.2% 36.4% 44.4% 35.8% Within 100' of Intersection 16.0% 33.6% 22.1% 36.0% 13.3% 35.3%
N/A 8.0% 3.2% 7.4% 3.2% 6.7% 3.4%
Total 100% 100% 100% 100% 100% 100% Most accidents happen at intersections, if combined with within 100’ of intersection, more than 60% happen close to intersections

D.C. Traffic Safety Report Statistics 2002-2004 Michael Baker Jr., Inc. 131
Table A- 25 Intersection Controller Type
2002 2003 2004
Fatality Crashes Fatality Crashes Fatality Crashes Signalized Controlled 16 3,892 18 3,733 13 4,082
Stop Sign 5 1,412 4 1,278 4 1,322
Yield 0 67 0 71 0 66
None 4 1,509 4 1,006 2 850
Other 1 330 0 350 1 222 Total at
Intersections 26 7,210 26 6,438 20 6,542
Table A- 26 Intersection Controller Type (Percentages)
2002 2003 2004
Fatality Crashes Fatality Crashes Fatality Crashes Signalized Controlled 61.5% 54.0% 69.2% 58.0% 65.0% 62.4%
Stop Sign 19.2% 19.6% 15.4% 19.9% 20.0% 20.2%
Yield 0.0% 0.9% 0.0% 1.1% 0.0% 1.0%
None 15.4% 20.9% 15.4% 15.6% 10.0% 13.0%
Other 3.8% 4.6% 0.0% 5.4% 5.0% 3.4% Total at
Intersections 100% 100% 100% 100% 100% 100%

D.C. Traffic Safety Report Statistics 2002-2004 Michael Baker Jr., Inc. 132
Crash Types
Table A- 27 Type of Collision
2002 2003 2004
Fatality Crashes Fatality Crashes Fatality Crashes
Right Angle 17 2,866 11 2,325 12 2,329
Left Turn hit Veh. 0 1,170 3 1,176 3 1,869
Right Turn Hit Veh. 0 90 0 511 1 571
Rear End 0 3,793 2 4,092 4 4,089
Side Swiped 0 3,602 5 4,052 1 3,300
Head on 4 487 9 611 2 445
Parked Vehicle 0 2,948 4 785 0 2,417
Fixed Object 10 899 8 726 9 950
Ran off Roadway 5 112 4 149 1 94
Left Turn Hit PED. 1 141 1 152 1 233 Right Turn Hit
PED. 0 64 1 77 1 100
Straight Hit PED. 6 519 16 447 8 549 Backing Hit Moving
Veh. 0 173 0 144 0 165
Backing Hit Stopped Vehicle 0 186 0 189 0 206
Backing Hit Parked Veh. 0 485 0 371 0 458
Backing Hit PED. 0 46 0 63 0 55
Non-collision/Other 7 187 4 1,840 2 432
Total 50 17,768 68 17,710 45 18,262

D.C. Traffic Safety Report Statistics 2002-2004 Michael Baker Jr., Inc. 133
Table A- 28 Type of Collision (Percentages)
2002 2003 2004
Fatality Crashes Fatality Crashes Fatality Crashes
Right Angle 34.0% 16.1% 16.2% 13.1% 26.7% 12.8%
Left Turn Hit Veh. 0.0% 6.6% 4.4% 6.6% 6.7% 10.2%
Right Turn Hit Veh. 0.0% 0.5% 0.0% 2.9% 2.2% 3.1%
Rear End 0.0% 21.3% 2.9% 23.1% 8.9% 22.4%
Side Swiped 0.0% 20.3% 7.4% 22.9% 2.2% 18.1%
Head on 8.0% 2.7% 13.2% 3.5% 4.4% 2.4%
Parked Vehicle 0.0% 16.6% 5.9% 4.4% 0.0% 13.2%
Fixed Object 20.0% 5.1% 11.8% 4.1% 20.0% 5.2%
Ran off Roadway 10.0% 0.6% 5.9% 0.8% 2.2% 0.5%
Left Turn Hit PED. 2.0% 0.8% 1.5% 0.9% 2.2% 1.3% Right Turn Hit PED. 0.0% 0.4% 1.5% 0.4% 2.2% 0.5%
Straight Hit PED. 12.0% 2.9% 23.5% 2.5% 17.8% 3.0% Backing Hit Moving Veh. 0.0% 1.0% 0.0% 0.8% 0.0% 0.9%
Backing Hit Stopped Vehicle 0.0% 1.0% 0.0% 1.1% 0.0% 1.1%
Backing Hit Parked Veh. 0.0% 2.7% 0.0% 2.1% 0.0% 2.5%
Backing Hit PED. 0.0% 0.3% 0.0% 0.4% 0.0% 0.3%
Non-collision/Other 14.0% 1.1% 5.9% 10.4% 4.4% 2.4%
Total 100% 100% 100% 100% 100% 100%

D.C. Traffic Safety Report Statistics 2002-2004 Michael Baker Jr., Inc. 134
Table A- 29 Vehicle Type
2002 2003 2004
Fatality Crashes Fatality Crashes Fatality Crashes
Passenger Auto 55 28,168 81 27,439 49 28,685
Taxi Cab 0 1,622 1 1,567 0 1,696
Bus 2 990 2 998 1 1,168
Motorcycle 8 160 8 223 11 252
Truck/Trailer 5 2,478 7 2,261 13 2,332
Police Vehicle 0 450 1 417 1 477
Other/Unknown 6 2,717 6 3,404 4 1,906 Total vehicles
involved 76 36,585 106 36,309 79 36,516
Table A- 30 Vehicle Type (Percentages) 2002 2003 2004
Fatality Crashes Fatality Crashes Fatality Crashes
Passenger Auto 72.4% 77.0% 76.4% 75.6% 62.0% 78.6%
Taxi Cab 0.0% 4.4% 0.9% 4.3% 0.0% 4.6%
Bus 2.6% 2.7% 1.9% 2.7% 1.3% 3.2%
Motorcycle 10.5% 0.4% 7.5% 0.6% 13.9% 0.7%
Truck/Trailer 6.6% 6.8% 6.6% 6.2% 16.5% 6.4%
Police 0.0% 1.2% 0.9% 1.1% 1.3% 1.3%
Other/Unknown 7.9% 7.4% 5.7% 9.4% 5.1% 5.2% Total vehicles
involved 100% 100% 100% 100% 100% 100%

D.C. Traffic Safety Report Statistics 2002-2004 Michael Baker Jr., Inc. 135
Table A- 31 Major Cause-Contributing Factors
2002 2003 2004
Fatality Crashes Fatality Crashes Fatality Crashes
Speed 28 1,191 32 1,328 26 1,335
Alcohol Influence 1 245 1 244 2 256
Defective Brakes 96 96 91 Following to
Close 1,349 1,356 1,428
Auto Right of Way 2 1,871 1 1,803 1,980
PED. Right of Way 168 6 202 2 217
Improper Turn 754 636 718
Yield Sign 18 14 19
Stop/Go Light 1 560 3 570 587
Flashing Light 3 6 7
Directional Light 45 30 18
Stop Sign 288 274 1 292
Improper Passing 356 300 310 Wrong Way -One
Way Street 55 72 54
Wrong Side of the Street 157 4 159 2 191
Improper Starting 22 24 25
Other Defects 121 127 117 Pedestrian Violation 3 246 9 264 2 242
Driver Inattention 2,712 1 2,661 2,713
Changing Lanes W/O Caution 989 859 1,087
Fail to Set Parking Brake 19 18 30
Open Door To Traffic 105 113 108
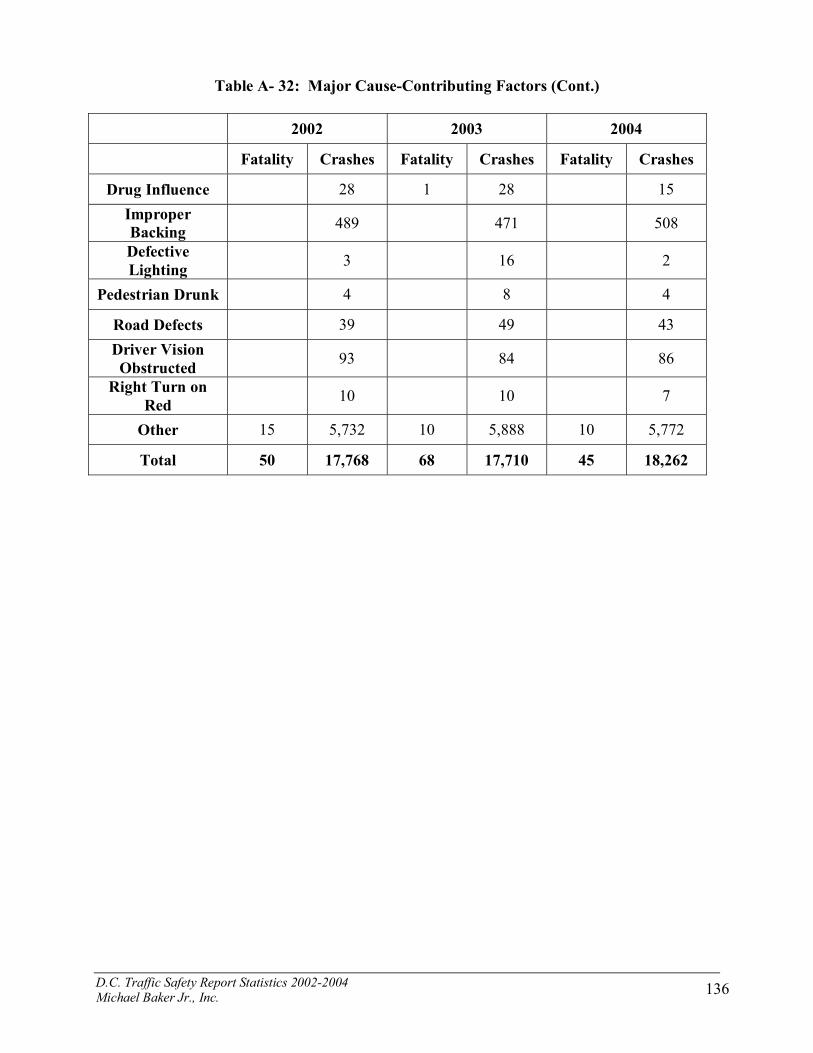
D.C. Traffic Safety Report Statistics 2002-2004 Michael Baker Jr., Inc. 136
Table A- 32: Major Cause-Contributing Factors (Cont.)
2002 2003 2004
Fatality Crashes Fatality Crashes Fatality Crashes
Drug Influence 28 1 28 15 Improper Backing 489 471 508
Defective Lighting 3 16 2
Pedestrian Drunk 4 8 4
Road Defects 39 49 43 Driver Vision Obstructed 93 84 86
Right Turn on Red 10 10 7
Other 15 5,732 10 5,888 10 5,772
Total 50 17,768 68 17,710 45 18,262

D.C. Traffic Safety Report Statistics 2002-2004 Michael Baker Jr., Inc. 137
Table A- 33 Major Cause-Contributing Factors (Percentages) 2002 2003 2004
Fatality Crashes Fatality Crashes Fatality Crashes
Speed 56.0% 6.7% 47.1% 7.5% 57.8% 7.3%
Alcohol Influence 2.0% 1.4% 1.5% 1.4% 4.4% 1.4%
Defective Brakes 0.5% 0.5% 0.5% Following to
Close 7.6% 7.7% 7.8%
Auto Right of Way 4.0% 10.5% 1.5% 10.2% 10.8%
PED. Right of Way 0.9% 8.8% 1.1% 4.4% 1.2%
Improper Turn 4.2% 3.6% 3.9%
Yield Sign 0.1% 0.1% 0.1%
Stop/Go Light 2.0% 3.2% 4.4% 3.2% 3.2%
Flashing Light 0.0% 0.0% 0.0%
Directional Light 0.3% 0.2% 0.1%
Stop Sign 1.6% 1.5% 2.2% 1.6%
Improper Passing 2.0% 1.7% 1.7% Wrong Way -One
Way Street 0.3% 0.4% 0.3%
Wrong Side of the Street 0.9% 5.9% 0.9% 4.4% 1.0%
Improper Starting 0.1% 0.1% 0.1%
Other Defects 0.7% 0.7% 0.6% Pedestrian Violation 6.0% 1.4% 13.2% 1.5% 4.4% 1.3%
Driver Inattention 15.3% 1.5% 15.0% 14.9%
Changing Lanes W/O Caution 5.6% 4.9% 6.0%
Fail to Set Parking Brake 0.1% 0.1% 0.2%
Open Door To Traffic 0.6% 0.6% 0.6%

D.C. Traffic Safety Report Statistics 2002-2004 Michael Baker Jr., Inc. 138
Table A- 34 Major Cause-Contributing Factors (Cont.)
2002 2003 2004
Fatality Crashes Fatality Crashes Fatality Crashes
Drug Influence 0.2% 1.5% 0.2% 0.1% Improper Backing 2.8% 2.7% 2.8%
Defective Lighting 0.0% 0.1% 0.0%
Pedestrian Drunk 0.0% 0.0% 0.0%
Road Defects 0.2% 0.3% 0.2% Driver Vision Obstructed 0.5% 0.5% 0.5%
Right Turn on Red 0.1% 0.1% 0.0%
Other 30.0% 32.3% 14.7% 33.2% 22.2% 31.6%
Total 100% 100% 100% 100% 100% 100%
Environment Factors
Table A- 35 Illumination Condition
2002 2003 2004
Fatality Crashes Fatality Crashes Fatality Crashes
Daylight 17 10,711 17 10,361 15 11,165
Night/Dark 25 5,618 42 5,697 26 5,787
Dawn/Dusk 4 820 3 875 2 809
Unknown 4 619 6 777 2 501
Total 50 17,768 68 17,710 45 18,262

D.C. Traffic Safety Report Statistics 2002-2004 Michael Baker Jr., Inc. 139
Table A- 36 Weather 2002 2003 2004
Fatality Crashes Fatality Crashes Fatality Crashes
Fog/Mist 1 259 4 293 0 267
Clear 44 14,237 49 13,046 33 14,589
Snow 0 123 0 569 0 196
Rain 1 2,103 10 2,503 7 2,250
Unknown 4 1,046 5 1,299 5 960
Total 50 17,768 68 17,710 45 18,262 Fatality
Table A- 37 Fatality by Type (Percentages)
2002 2003 2004
Number Percentage Number Percentage Number Percentage
Driver 25 50.0% 34 50.0% 16 35.6%
Passenger 9 18.0% 8 11.8% 5 11.1%
Pedestrian 8 16.0% 19 27.9% 10 22.2%
Motorcycle 7 14.0% 7 10.3% 10 22.2%
Bicycle 1 2.0% 0 0.0% 4 8.9%
Total 50 100% 68 100% 45 100%

D.C. Traffic Safety Report Statistics 2002-2004 Michael Baker Jr., Inc. 140
Table A- 38 Fatality by Gender (Percentages)
2002 2003 2004
Number Percentage Number Percentage Number Percentage
Male 33 66.0% 50 73.5% 39 86.7%
Female 14 28.0% 13 19.1% 6 13.3%
N/A 3 6.0% 5 7.4% 0 0.0%
Total 50 100% 68 100% 45 100%
Table A- 39 Fatality By Ward
Ward 2002 2003 2004
1 2 3 1 2 4 5 2 3 2 2 4 4 3 10 7 5 7 15 12 6 3 7 5 7 11 16 11 8 18 8 3
N/A 0 2 0 Total 50 68 45
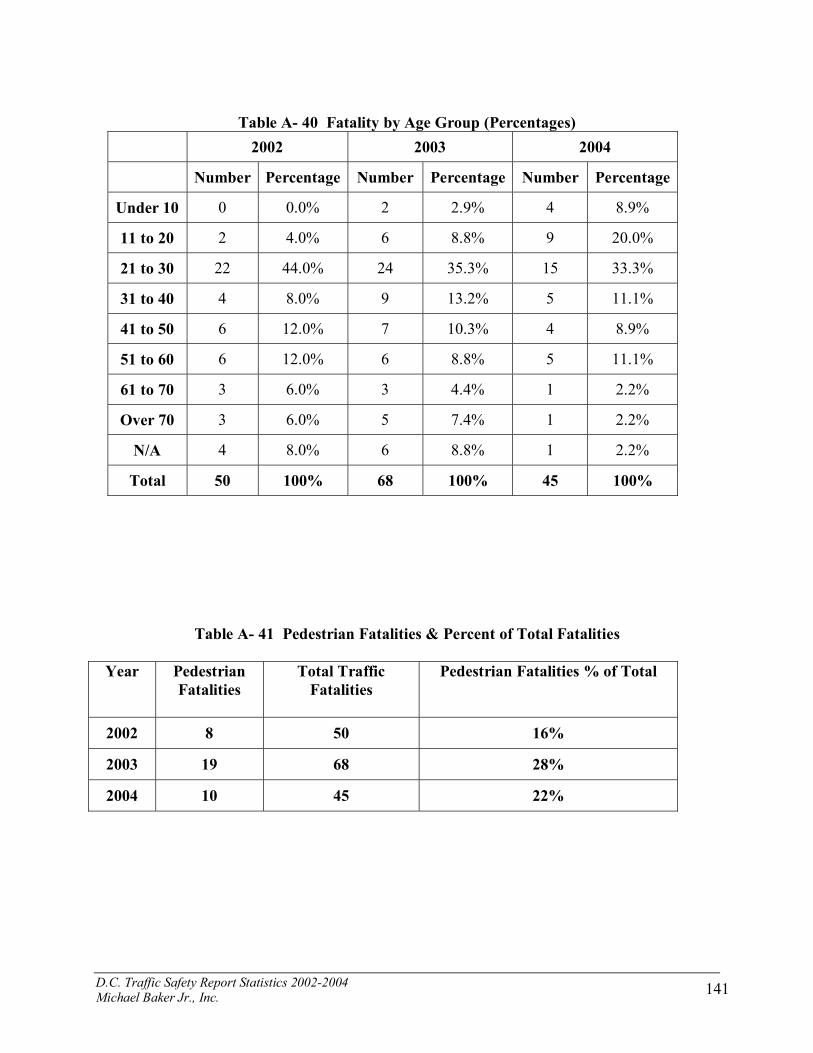
D.C. Traffic Safety Report Statistics 2002-2004 Michael Baker Jr., Inc. 141
Table A- 40 Fatality by Age Group (Percentages) 2002 2003 2004
Number Percentage Number Percentage Number Percentage
Under 10 0 0.0% 2 2.9% 4 8.9%
11 to 20 2 4.0% 6 8.8% 9 20.0%
21 to 30 22 44.0% 24 35.3% 15 33.3%
31 to 40 4 8.0% 9 13.2% 5 11.1%
41 to 50 6 12.0% 7 10.3% 4 8.9%
51 to 60 6 12.0% 6 8.8% 5 11.1%
61 to 70 3 6.0% 3 4.4% 1 2.2%
Over 70 3 6.0% 5 7.4% 1 2.2%
N/A 4 8.0% 6 8.8% 1 2.2%
Total 50 100% 68 100% 45 100%
Table A- 41 Pedestrian Fatalities & Percent of Total Fatalities
Year Pedestrian Fatalities
Total Traffic Fatalities
Pedestrian Fatalities % of Total
2002 8 50 16%
2003 19 68 28%
2004 10 45 22%

D.C. Traffic Safety Report Statistics 2002-2004 Michael Baker Jr., Inc. 142
Table A- 42 Hit & Run Accidents
2002 2003 2004
Number Percentage Number Percentage Number Percentage
Fatality 3 0.1% 8 0.1% 7 0.1%
Injury 785 13.2% 387 6.5% 665 11.0% Property Damage
Only 5,079 85.1% 451 7.5% 5,384 88.9%
N/A 99 1.7% 5,146 85.9% 0 0.0%
Total 5,966 100% 5,992 100% 6,056 100%
Table A- 43 Work zone
Year Work zone Property Damage Crashes
Work zone Injury Crashes
Work zone Fatal Crashes
2002 179 68 3
2003 119 64 1
2004 290 107 1

D.C. Traffic Safety Report Statistics 2002-2004 Michael Baker Jr., Inc. 143
Table A- 44 Holiday Crashes & Fatalities
Holiday Year Fatality Crashes Period 2002 1 29 1/1/2002 2003 43 1/1/2003 New Year 2004 36 1/1/2004 2002 54 1/2/2002 2003 47 1/2/2003 Post New Year 2004 40 1/2/2004 2002 46 5/26/2002 2003 60 5/25/2003 Pre Memorial Day 2004 36 05/30/2004 2002 36 5/27/2002 2003 1 53 5/26/2003 Memorial Day 2004 50 05/31/2004 2002 57 5/28/2002 2003 63 5/27/2003 Post Memorial 2004 57 6/1/2004 2002 43 7/3/2002 2003 48 7/3/2003 Pre Fourth of July 2004 58 7/3/2004 2002 38 7/4/2002 2003 35 7/4/2003 Fourth of July 2004 58 7/4/2004 2002 42 9/1/2002 2003 33 8/31/2003 Pre Labor day 2004 40 9/5/2004 2002 1 20 9/2/2002 2003 1 40 9/1/2003 Labor Day 2004 14 9/6/2004 2002 48 9/3/2002 2003 73 9/2/2003 Post Labor Day 2004 39 9/7/2004
Pre thanksgiving 2002 46 11/27/2002

D.C. Traffic Safety Report Statistics 2002-2004 Michael Baker Jr., Inc. 144
2003 55 11/26/2003 2004 49 11/24/2004 2002 39 11/28/2002 2003 2 11/27/2003 Thanksgiving 2004 31 11/25/2004 2002 39 11/29/2002 2003 47 11/28/2003 Post Thanksgiving 2004 35 11/26/2004 2002 53 12/24/2002 2003 1 45 12/24/2003 Pre Christmas 2004 35 12/24/2004 2002 28 12/25/2002 2003 34 12/25/2003 Christmas 2004 30 12/25/2004 2002 16 12/26/2002 2003 29 12/26/2003 Post Christmas 2004 20 12/26/2004 2002 1 18 12/31/2002 2003 45 12/31/2003 New Years Eve 2004 47 12/31/2004