telework trends us
TRANSCRIPT
8/3/2019 Telework Trends US
http://slidepdf.com/reader/full/telework-trends-us 1/27
1234 Main Street
Anytown, State 54321
T 123.456.7890
F 123.456.7891
www.apple.com/iwork
Telework Research Network S p o n s o r e d b y C i t r i x O n l i n e & N e w Wa y s o f Wo r k i n g
The State of Telework in the U.S.How Individuals, Business, and Government Benefit
June 2011Kate Lister & Tom Harnish
8/3/2019 Telework Trends US
http://slidepdf.com/reader/full/telework-trends-us 2/27
2 - State of Telework in the U.S. Telework Research Network
T ABLE OF C ONTENTS
Table of Contents ....................................................................... 2
Introduction ................................................................................ 3
Key Findings .............................................................................. 4
Methodology .............................................................................. 5
Public Sector Data ............................................................. 5
Private Sector Data ........................................................... 7
WAH Trends .............................................................................. 8
WAH by Class of Worker ................................................... 9
WAH as a Commuter Alternative ..................................... 11
Who Works at Home? .............................................................. 13
Age ................................................................................. 14
Income ............................................................................ 14
Education ........................................................................ 15
The Self-Employed .......................................................... 15
Who Offers WAH Jobs? ........................................................... 16
BLS Summary of Who Offers WAH .............. ............. ....... 16
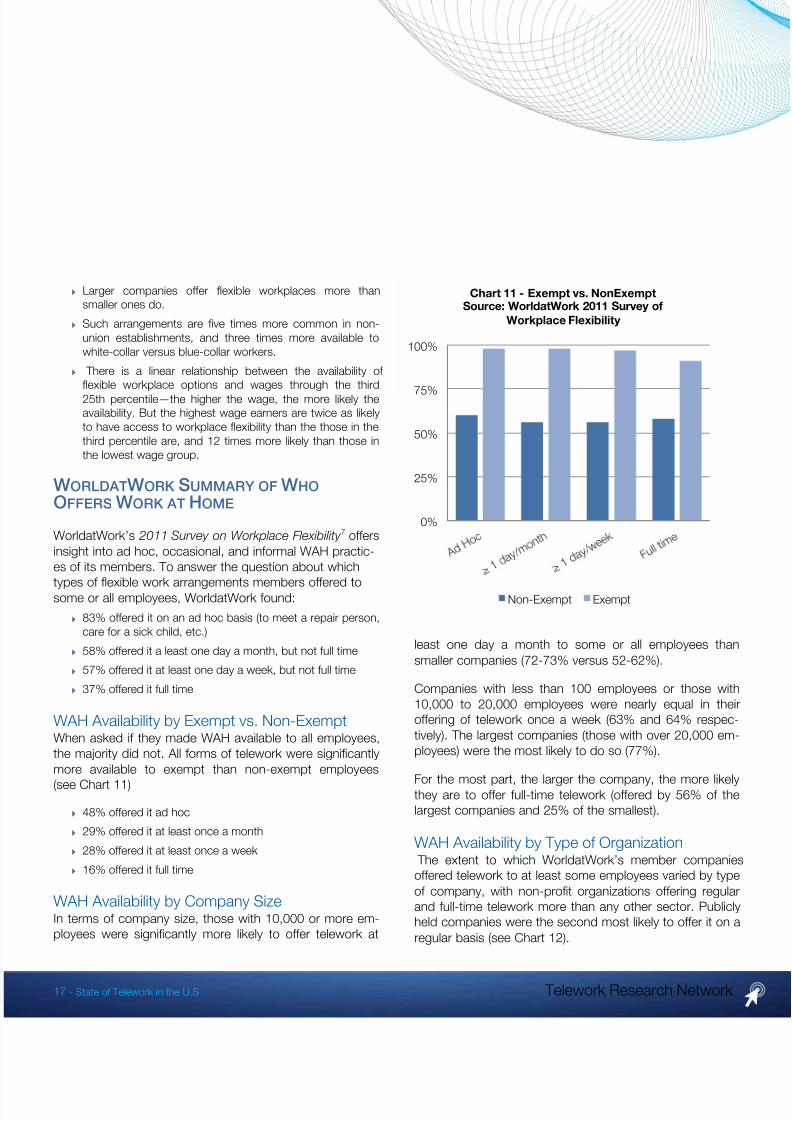
WorldatWork Summary of Who Offers Work at Home ..... 17
How Often Do They Work at Home? ........................................ 18
Where Do They Work? ............................................................. 19
Who Wants to Work at Home? ................................................ 20
Who Could Work at Home? ..................................................... 20
Projected Growth of Telework? ................................................ 21
Conclusions ............................................................................. 22
Businesses Would: .......................................................... 23
Individuals Would: ........................................................... 23
The Nation Would: .......................................................... 23
The Federal Government Should: .................................... 23
Discussion ............................................................................... 24
About ...................................................................................... 26
Telework Research Network ........................................... 26
Citrix Online ..................................................................... 26
New Ways of Working ..................................................... 26
Endnotes ................................................................................. 27
© 2011 Telework Research Network. All rights reserved.
8/3/2019 Telework Trends US
http://slidepdf.com/reader/full/telework-trends-us 3/27
3 - State of Telework in the U.S Telework Research Network
INTRODUCTION The purpose of this paper is to shed light on when andwhere work is done in the U.S., how that’s changed inrecent years, and where the trend might be headed.
But there’s a problem. “The task of trying to make sense of the various government sources of work at home data is astatistical Vietnam,” said Bruce Phillips while he was seniorfellow at the National Federation of Independent BusinessResearch Foundation. “ The data goes in, but you can’t get
it out.”
Part of the problem is a matter of terminology. So to makesure there’s no confusion, the focus of this report is onthose who work at home (or in some cases elsewhere) andare not self-employed—neither as a sole proprietor or in anincorporated business)—in other words, employees whotelecommute, or ‘workshift’ as some say. To avoid con-
stant repetition throughout this paper, unless otherwisenoted, the words ‘work-at-home’ (WAH) and the term‘workshift’ refer to employees who fit the above conditions.
No one would disagree that the U.S. workforce is increas-ingly mobile. But, beyond that broad statement, we knowlittle about the rate of increase in mobility—how often peo-ple are out of the office, where they are, and what they’redoing. For that matter, there’s no agreed-upon method of defining who they are.
Do you include an employee who takes work home onweekends as someone who works from home? Whatabout a plumber who has an office at home, but earns hisliving only when he’s on the road? Does it matter whethera person who works at home is employed by a privatecompany, employed by the government, or is self-employed? What about an unpaid family worker, do weinclude him or her? How do you categorize a mobile work-er who works at client locations, in their car, or at a coffeeshop? Does someone who works remotely one day aweek belong in the same statistical bucket as someonewho works at home all the time?
If we could answer these questions and collect consistentdata about how and where people work, it would helpbusiness leaders:
Better understand their facilities’ needs, increaseworkspace efficiency, and reduce real estate overhead
Evaluate their IT readiness and the communications,collaboration, and technology needs of their workforce
Effectively integrate employee mobility into hiring, training,and management paradigms
Develop and market products and services that supportremote work
Better address the special needs of the disabled, of militaryfamilies, and of caregivers
For city, state, and federal leaders, a better understandingof workforce mobility could help them:
Evaluate the extent to which home-based work can reducetraffic congestion and greenhouse gases in theircommunities
Solve regional issues such as outbound workforcemigrations, talent shortages, and labor force mismatches
8/3/2019 Telework Trends US
http://slidepdf.com/reader/full/telework-trends-us 4/27
4 - State of Telework in the U.S Telework Research Network
Understand the ROI of broadband investments
Reduce the offshoring of jobs
Encourage populations to work and shop where they live
Help establish laws to encourage home-based work andabolish those that discourage it
Help understand the role that work-at-home programscould play in transportation demand management, energyconservation, and greenhouse gas emissions
Reduce un- and under-employment
Increase productivity Save money
Until now, some of the most informative data about whenand where people work have been buried in nearly impen-etrable jungle of databases. We’ve hacked our waythrough them, and made some surprising discoveries.
We hope you’ll find The State of Telework in the U.S . bothinteresting and informative. What’s more, we hope it willleave at least some of you wanting more because there isstill much we don’t know about the growing population of anytime, anywhere workers.
K EY F INDINGS
Unless otherwise noted, all telecommuter statistics refer tonon-self-employed people who principally work fromhome.
Forty-five percent of the US workforce holds a job that iscompatible with at least part-time telework.
Fifty million U.S. employees who want to work from homehold jobs that are telework compatible though only 2.9million consider home their primary place of work (2.3% of the workforce).
The existing 2.9 million US telecommuters save 390 milliongallons of gas and prevent the release of 3.6 million tons of greenhouse gases yearly.
If those with compatible jobs worked at home 2.4 days aweek (the national average of those who do), the reductionin greenhouse gases (51 million tons) would be equivalentof taking the entire New York workforce off the roads.
The national savings would total over $900 billion a year;enough to reduce our Persian Gulf oil imports by 46%. The energy saved annually from telecommuting could exceed
the output of all renewable energy sources combined.
Regular telecommuting grew by 61% between 2005 and2009. During the same period, home-based self-employment grew by 1.7%.
Based on current trends, with no growth acceleration,regular telecommuters will total 4.9 million by 2016, a 69%increase from the current level but well below otherforecasts.
Seventy-six percent of telecommuters work for privatesector companies, down from 81% in 2005—the differenceis largely attributable to increased WAH among state andfederal workers.
Using home as a ‘reasonable accommodation’ per the Americans with Disabilities Act, 316,000 people regularlywork from home.
The typical telecommuter is a 49-year-old, college-educated, salaried, non-union employee in a managementor professional role, earning $58,000 a year at a companywith more than 100 employees.
8/3/2019 Telework Trends US
http://slidepdf.com/reader/full/telework-trends-us 5/27
5 - State of Telework in the U.S Telework Research Network
Relative to the total population, a disproportionate share of management, professional, sales and office workerstelecommute.
Non-exempt employees are far less likely to work at homeon a regular or ad hoc basis than salaried employees.
Over 75% of employees who work from home earn over$65,000 per year, putting them in the upper 80 percentilerelative to all employees.
Larger companies are more likely to allow telecommutingthan smaller ones.
Non-union organizations are more likely to offertelecommuting than those with unions.
In a quarter of the nation’s 20 largest metro areas, morepeople now telecommute than use public transportation astheir “principal means of transportation to work."
There is no positive correlation between cities with theworst congestion or longest round-trip commutes and theextent of telework. For example, among the largest 15metro areas, New York had the third lowest percent of
regular telecommuters (2.1%). Among the 15 largest U.S. metro areas, San Diego-
Carlsbad-San Marcos (CA) has the highest concentration of people who consider home their primary place of work (4.2%) and Detroit-Warren-Livonia (MI) has the lowest(1.8%).
The region with the fastest percentage growth in regularemployee telecommuting was Riverside-San Bernardino-Ontario (CA)—posting a 77% increase since 2005 (basedon growth relative to the local total population and amongpopulations with over 1 million workers).
Among the 124 metropolitan areas evaluated, 34% showedgreater five-year growth in regular telecommuters than the
national growth. The jury is still out on what impact the recession had on
telecommuting. It appears that occasional telework decreased, and regular telework (at least weekly) increased,but we won’t know until the 2010 Census data is available.Whatever the conclusion, the five year telework growth ratehas been significant
The biggest barrier to telecommuting, by a wide margin, ismanagement fear and mistrust.
METHODOLOGY Various federal agencies collect information about wherepeople. The Census Bureau collects data on how peopletravel to work, with one option not traveling at all. The Bu-reau of Labor Statistics (BLS) captures information on
where and when people work. BLS also polls companiesabout whether they offer flexible workplace options. TheIRS and the SBA gather information about home-basedbusinesses. And the Office of Personnel Management(OPM) tracks telework practices in the federal workforce.
In the private sector, a number of organizations track vari-ous forms of mobile work, including WorldatWork.
With all that tracking and gathering, you’d think it would beeasy to create a picture of where and when people work.Unfortunately, it’s not. The following is a summary of thevarious sources of data used in compiling this paper, along
with an explanation of the limitations of each.P UBLIC S ECTOR D ATA
Census / American Community Survey (ACS)
ACS is a nationwide survey conducted annually by theU.S. Census Bureau. It produces one-year estimates forgeographic areas with a population of 65,000 or more: thenation, all states, the District of Columbia, all congressionaldistricts, approximately 800 counties, and 500 metropoli-
8/3/2019 Telework Trends US
http://slidepdf.com/reader/full/telework-trends-us 6/27
6 - State of Telework in the U.S Telework Research Network
tan and micropolitan statistical areas. About three millionhousing unit addresses and 307 million people are repre-sented in the weighted sample.
ACS asks survey respondents: “What was your primarymeans of transportation to work during the survey week?”
Car, truck, or van - driving alone Car, truck, or van - carpooled
Public transportation
Walked
Taxi, motorcycle, or bike
Worked at home
ACS — LimitationsWhile the question offers some insight into the WAH work-force, it falls short of providing useful answers in a numberof ways:
1) While the respondent is also asked whether they work for a private or public sector organization, if they’re self-employed, or if they’re an unpaid family worker, that ‘classof worker’ data is only tied to the ‘means of transportationto work’ category in a handful of Census Bureau reports.
For example, American Fact Finder, the primary searchtool for Census data, does not allow users to determinethe number of non-self-employed people in the construc-tion industry who work from home in Millville, New Jersey.It could be used to determine in general how many wereself-employed, were unpaid family workers, or were stategovernment workers. It could also determine how manypeople in Millville just worked from home, but it would notallow you to break out the self-employed.
2) ACS only captures information about people who pri-marily work at home, not those who do so on an occa-sional basis—a group far larger than those who do somost of the time.
3) ACS does not capture information about people whowork remotely from client offices, shared office centers,coffee shops, their cars, or other ‘third places’.
The Census Bureau occasionally conducts research thataddresses some of these limitations, but they have notdone so since 2004.
Use of ACS Data in This Paper Because of the limitation of available ACS standard tablesand online query interface, most of the data in this reportwas compiled from our own special tabulations of theCensus Public Use Microdata Samples (PUMS)—a statisti-cally accurate representation of the population based on a5% micro-sample.
Five-year trend data is based on PUMS one-year esti-
mates from 2005 through 2009, the most recent yearavailable.
Certain metropolitan areas that were redefined during thefive-year period are excluded from the trend analysis.
Among those with workforces larger than one million peo-ple; the Denver and Miami metropolitan areas were omit-ted for this reason.
The statistical validity of changes in the WAH populationobviously diminishes with a decrease in population size. In
8/3/2019 Telework Trends US
http://slidepdf.com/reader/full/telework-trends-us 7/27
7 - State of Telework in the U.S Telework Research Network
general, the data regarding the total regional WAH popula-tion is statistically valid, but the data for areas within popu-lations smaller than a million may not be. For this reason,we primarily focus on larger metro regions.
Bureau of Labor Statistics (BLS)
Two Bureau of Labor Statistics (BLS) surveys—the Ameri-can Time Use Survey (ATUS), and the National Compensa-tion Survey (NCS)—offered some useful material for thispaper. However, the annual BLS survey does not allowstandard searches or produce reports that distinguish theself-employed from the non-self employed at the industry,occupation, or other granular levels. The most recent sur-veys that do separate the self-employed from the rest of the WAH population cover only 2003 through 2007.
Further, BLS respondents are asked to answer questionsbased on where they worked on a particular survey day ,which may or may not be indicative of their regular workplace.
BLS American Time Use Survey (ATUS) ATUS is conducted annually. It includes, among otherthings, information about where and when people work—at their workplace, at home, or at another location. Thedata is collected through telephone interviews.
ATUS — Limitations ATUS defines the term ’working’ as time employed peoplespend doing tasks required for a job. A person who readswork-related e-mail messages for 10 minutes on a Satur-
day is counted as working on that day, as is someone whoworked a 12-hour shift.
ATUS does not distinguish between people who are paidto work from home and those who simply take work home.
BLS National Compensation Survey (NCS)
The National Compensation Survey is conducted annually.It collects information from companies about the compen-sation and benefits they offer.
One benefit choice is ‘flexible workplace’. BLS defines thisas: “Permits workers to work an agreed-upon portion of their work schedule at home or at some other approvedlocation, such as a regional work center.” They note,“…such arrangements are especially compatible with work requiring the use of computers linking the home or work center to the central office.”
NCS — Limitations NCS data only indicates who offers a benefit, not who us-es it, how, or how often.
Their count does not include companies that offer work-
place flexibility on an ad hoc or occasional basis.
Other Federal Data
Data about participation in telework programs within thefederal workforce comes from the annual Status of Tele-work in the Federal Government—Report to Congress .
P RIVATE S ECTOR D ATA
WorldatWork
WorldatWork is a non-profit organization with 30,000+members in 75 countries. Nearly all Fortune 1000 compa-nies are WorldatWork members. Results from two of theirreports are included in this paper: Telework 2011—AWorldatWork Special Report and the 2011 Survey onWorkplace Flexibility .
Telework 2011—A WorldatWork Special Report Together with The Dieringer Research Group, Worldat-Work has conducted periodic surveys about ad hoc, oc-
8/3/2019 Telework Trends US
http://slidepdf.com/reader/full/telework-trends-us 8/27
8 - State of Telework in the U.S Telework Research Network
casional, and regular telework among its members since2003.
Their Telework 2011—A WorldatWork Special Report (based on 2010 data) was released on June 23, 2010. 1
Approximately 1,000 randomly selected U.S. adults weresurveyed for the 2011 report. The data was weighted tomatch the current population.
Telework 2011— LimitationsBecause respondents self-reported their business type,some self-employed respondents may be counted amongemployee telecommuters. This may be significant becauseaccording to ACS data, the self-employed population suf-fered significant declines during the recession, while theemployee telecommuter population grew.
Due to the small sample size, the teleworker segment of
their sample has a margin of error of ±10 percent.
Survey on Workplace Flexibility
The WorldatWork 2011 Survey on Workplace Flexibility 2 asked its 5,191 global members what types of flexiblework arrangements they offered to some or all employees.Of this group, 537 responses were included in the results.
Survey on Workplace Flexibility — LimitationsBecause WorldatWork’s membership is comprised of a dis-proportionate share of large employers, (91 percent havemore than 100 employees), their data under-represents smallemployers.
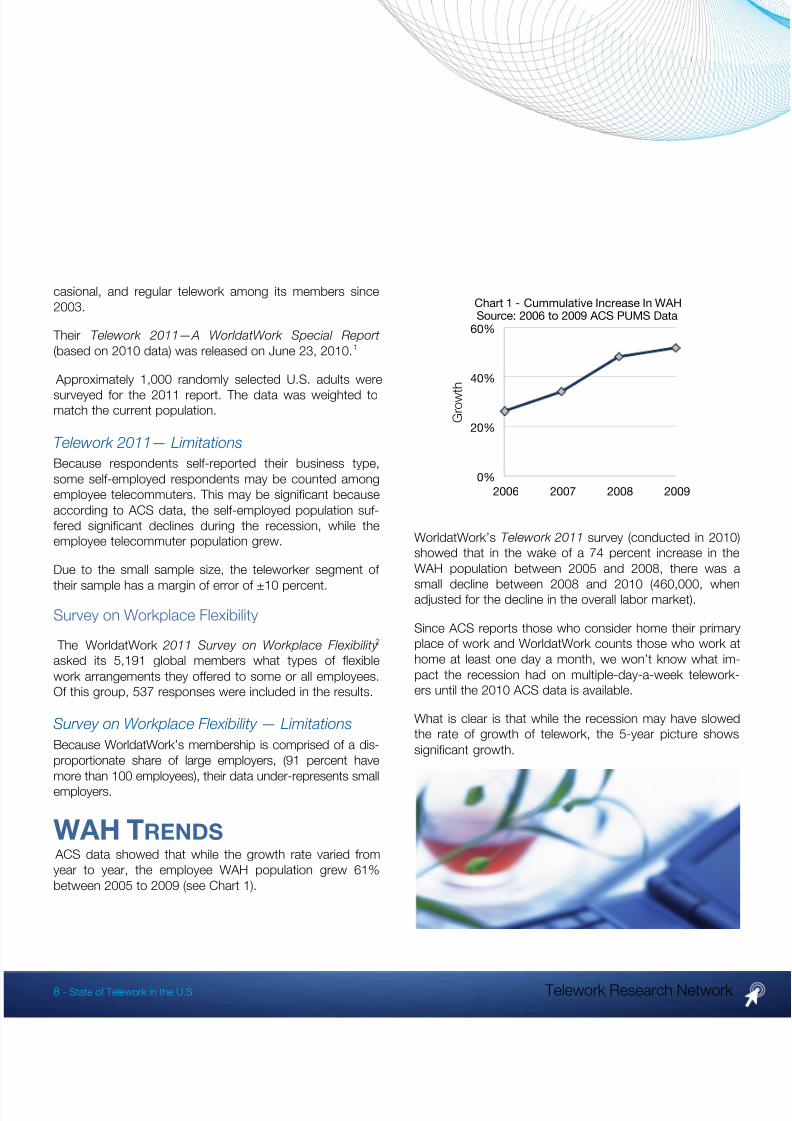
WAH TRENDS ACS data showed that while the growth rate varied fromyear to year, the employee WAH population grew 61%between 2005 to 2009 (see Chart 1).
WorldatWork’s Telework 2011 survey (conducted in 2010)showed that in the wake of a 74 percent increase in theWAH population between 2005 and 2008, there was a
small decline between 2008 and 2010 (460,000, whenadjusted for the decline in the overall labor market).
Since ACS reports those who consider home their primaryplace of work and WorldatWork counts those who work athome at least one day a month, we won’t know what im-pact the recession had on multiple-day-a-week telework-ers until the 2010 ACS data is available.
What is clear is that while the recession may have slowedthe rate of growth of telework, the 5-year picture showssignificant growth.
0%
20%
40%
60%
2006 2007 2008 2009
G r o w
t h
Chart 1 - Cummulative Increase In WAHSource: 2006 to 2009 ACS PUMS Data
8/3/2019 Telework Trends US
http://slidepdf.com/reader/full/telework-trends-us 9/27
9 - State of Telework in the U.S Telework Research Network
WAH BY C LASS OF W ORKER
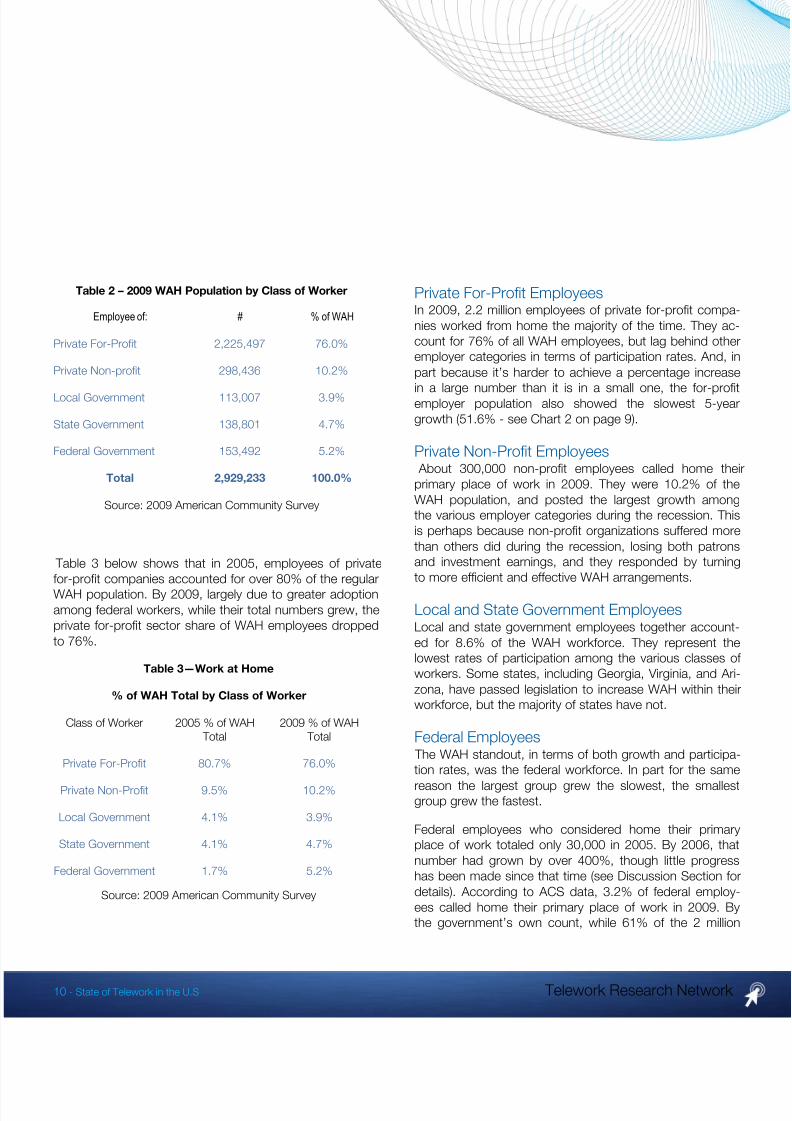
Across all types of workers, the WAH population grew dis-proportionately faster than the total workforce (Chart 2).
In 2005, WAH employees totaled 1.5% of the non-self-employed population. By 2009, an additional 1.1 millionWAH employees boosted that to 2.3% (Table 1, opposite).
Table 1—2005 and 2009 WAH by Class of Worker as aPercent of Total Workforce by Class of Worker
Class of Worker 2005 2009
Private For-Profit 1.6% 2.4%
Private Non-Profit 1.8% 2.7%
Local Government 0.7% 1.1%
State Government 1.4% 2.2%
Federal Government 0.7% 3.2%
Total 1.5% 2.3%
Source: 2005 and 2009 American Community Survey
The federal government has the highest percentage of WAH employees within their own population (see Table 1)though they only account for 5.2% of all WAH employees(see Table 2, next page).
0%
100%
200%
300%
400%
500%
Chart 2 - Workforce & WAH Growth2005-2009
Source: ACS PUMS Data
Total Workforce Growth WAH Growth
8/3/2019 Telework Trends US
http://slidepdf.com/reader/full/telework-trends-us 10/27
10 - State of Telework in the U.S Telework Research Network
Table 2 – 2009 WAH Population by Class of Worker
Employee of: # % of WAH
Private For-Profit 2,225,497 76.0%
Private Non-profit 298,436 10.2%
Local Government 113,007 3.9%
State Government 138,801 4.7%
Federal Government 153,492 5.2%
Total 2,929,233 100.0%
Source: 2009 American Community Survey
Table 3 below shows that in 2005, employees of privatefor-profit companies accounted for over 80% of the regularWAH population. By 2009, largely due to greater adoptionamong federal workers, while their total numbers grew, theprivate for-profit sector share of WAH employees droppedto 76%.
Table 3—Work at Home
% of WAH Total by Class of Worker
Class of Worker 2005 % of WAH Total
2009 % of WAH Total
Private For-Profit 80.7% 76.0%
Private Non-Profit 9.5% 10.2%
Local Government 4.1% 3.9%
State Government 4.1% 4.7%
Federal Government 1.7% 5.2%
Source: 2009 American Community Survey
Private For-Profit EmployeesIn 2009, 2.2 million employees of private for-profit compa-nies worked from home the majority of the time. They ac-count for 76% of all WAH employees, but lag behind otheremployer categories in terms of participation rates. And, inpart because it’s harder to achieve a percentage increase
in a large number than it is in a small one, the for-profitemployer population also showed the slowest 5-yeargrowth (51.6% - see Chart 2 on page 9).
Private Non-Profit Employees About 300,000 non-profit employees called home theirprimary place of work in 2009. They were 10.2% of theWAH population, and posted the largest growth amongthe various employer categories during the recession. Thisis perhaps because non-profit organizations suffered morethan others did during the recession, losing both patronsand investment earnings, and they responded by turningto more efficient and effective WAH arrangements.
Local and State Government EmployeesLocal and state government employees together account-ed for 8.6% of the WAH workforce. They represent thelowest rates of participation among the various classes of workers. Some states, including Georgia, Virginia, and Ari-zona, have passed legislation to increase WAH within theirworkforce, but the majority of states have not.
Federal Employees The WAH standout, in terms of both growth and participa-tion rates, was the federal workforce. In part for the same
reason the largest group grew the slowest, the smallestgroup grew the fastest.
Federal employees who considered home their primaryplace of work totaled only 30,000 in 2005. By 2006, thatnumber had grown by over 400%, though little progresshas been made since that time (see Discussion Section fordetails). According to ACS data, 3.2% of federal employ-ees called home their primary place of work in 2009. Bythe government’s own count, while 61% of the 2 million
8/3/2019 Telework Trends US
http://slidepdf.com/reader/full/telework-trends-us 11/27
11 - State of Telework in the U.S Telework Research Network
federal workers were considered eligible for telework, onlyabout 100,000, or 5.2% of them did.
Though the federal workforce participation rate is higherthan the rate of all other classes of workers, it’s surprisinglylow considering that since 2000 a federal mandate hasrequired that every U.S. government employee work fromhome to the maximum extent possible.
The original driving force for WAH among federal workerswas the threat of a bird flu pandemic. Since then, Hurri-cane Katrina, ‘Snowmageddon’, Swine Flu, and other cri-ses have bolstered the government’s resolve to make tel-ework a continuity of operations (COOP) necessity.
In the current administration, the push for more federaltelework has moved beyond COOP. Referring to himself as the Teleworker in Chief in his early days in office, Presi-dent Obama has lobbied for telework.
In December of 2010, the Telework Enhancement Actpassed through both houses of Congress with bipartisansupport. While no funding was provided in the bill, agen-cies have been charged to:
• Designate a senior manager to coordinate theagencies’ telework program
• Determine eligibility of employees, notify them of their eligibility status, and enter into written agree-ments with them for those who wish to telework
• Develop and implement telework training pro-grams for managers and employees
The Office of Personnel Management’s Director, John Ber-ry, couldn’t have been clearer about his and the currentadministration’s support for telework in the agency’s an-nual report on the status of telework to Congress: 3
“ . . . I believe telework must be implemented with a focuson accountability. As the President said at his White HouseForum on Workplace Flexibility last March, ‘It's about at-tracting and retaining top talent in the federal workforce
and empowering them to do their jobs, and judging their success by the results that they get—not by how many
meetings they attend, or how much face-time they log...’Presenteeism, the practice of sitting at one's desk without working, can be just as problematic as absenteeism. I am
an adamant supporter of telework because workers in aneffective telework program can only be judged by their re-sults. Those who can't perform and can't improve can't
hide behind their desks. It is up to management to give our employees clear direction and support, and then trust them to deliver.” —Message from the Director, 2010 Sta-tus of Telework in the Federal Government .
While progress has been slow, federal telework is begin-ning to take hold. In 2010, the Patent and Trademark Of-fice reported that 55% of its workforce teleworks on a reg-ular basis. At the National Mediation Board, 43% do so. 4
While the Telework Enhancement Act has no real teeth interms of sanctions for non-compliance, taken togetherwith other Presidential directives that call for increasedsustainability, better continuity of operations, transition totelework-compatible technologies, and reductions in realestate footprints, we expect to see some real strides infederal telework in the years ahead.
WAH AS A C OMMUTER A LTERNATIVE
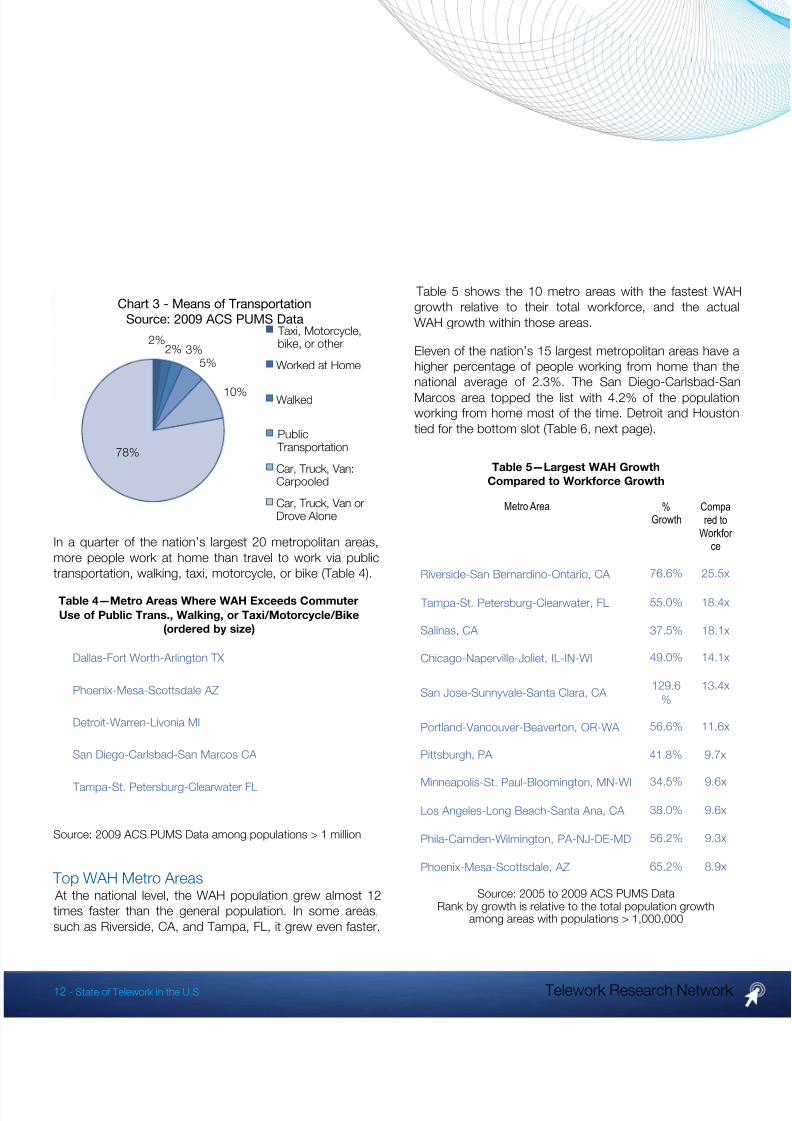
As a primary means of transportation, not traveling at allnow accounts for 2.3% of the non-self-employed employ-ee workforce (see Chart 3), and is growing at a far greaterrate than all other modes.
8/3/2019 Telework Trends US
http://slidepdf.com/reader/full/telework-trends-us 12/27
12 - State of Telework in the U.S Telework Research Network
In a quarter of the nation’s largest 20 metropolitan areas,more people work at home than travel to work via publictransportation, walking, taxi, motorcycle, or bike (Table 4).
Top WAH Metro Areas At the national level, the WAH population grew almost 12times faster than the general population. In some areas,such as Riverside, CA, and Tampa, FL, it grew even faster.
Table 5 shows the 10 metro areas with the fastest WAHgrowth relative to their total workforce, and the actualWAH growth within those areas.
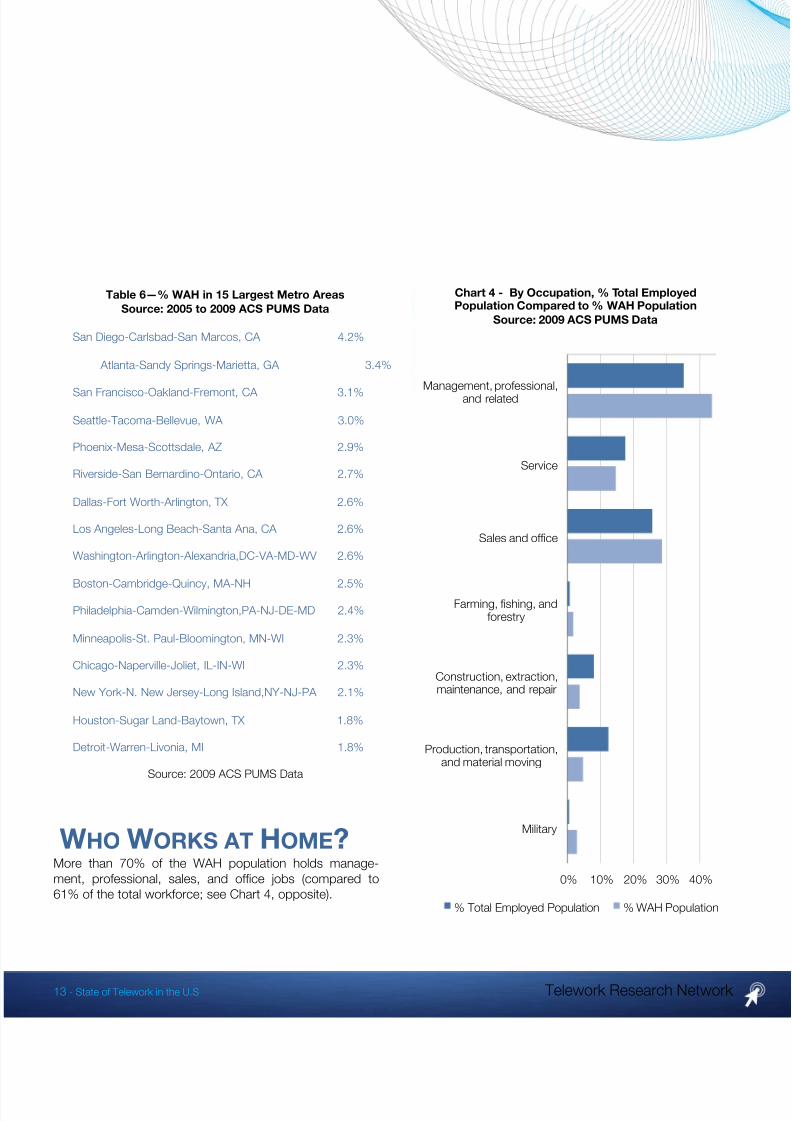
Eleven of the nation’s 15 largest metropolitan areas have ahigher percentage of people working from home than thenational average of 2.3%. The San Diego-Carlsbad-SanMarcos area topped the list with 4.2% of the populationworking from home most of the time. Detroit and Houstontied for the bottom slot (Table 6, next page).
2%2% 3%
5%
10%
78%
Chart 3 - Means of TransportationSource: 2009 ACS PUMS Data
Taxi, Motorcycle,bike, or other
Worked at Home
Walked
Public Transportation
Car, Truck, Van:Carpooled
Car, Truck, Van orDrove Alone
Table 4—Metro Areas Where WAH Exceeds CommuterUse of Public Trans., Walking, or Taxi/Motorcycle/Bike
(ordered by size)
Dallas-Fort Worth-Arlington TX
Phoenix-Mesa-Scottsdale AZ
Detroit-Warren-Livonia MI
San Diego-Carlsbad-San Marcos CA
Tampa-St. Petersburg-Clearwater FL
Source: 2009 ACS PUMS Data among populations > 1 million
Table 5—Largest WAH GrowthCompared to Workforce Growth
Metro Area %Growth
Compared to
Workfor ce
Riverside-San Bernardino-Ontario, CA 76.6% 25.5x
Tampa-St. Petersburg-Clearwater, FL 55.0% 18.4x
Salinas, CA 37.5% 18.1x
Chicago-Naperville-Joliet, IL-IN-WI 49.0% 14.1x
San Jose-Sunnyvale-Santa Clara, CA 129.6%
13.4x
Portland-Vancouver-Beaverton, OR-WA 56.6% 11.6x
Pittsburgh, PA 41.8% 9.7x
Minneapolis-St. Paul-Bloomington, MN-WI 34.5% 9.6x
Los Angeles-Long Beach-Santa Ana, CA 38.0% 9.6x
Phila-Camden-Wilmington, PA-NJ-DE-MD 56.2% 9.3x
Phoenix-Mesa-Scottsdale, AZ 65.2% 8.9x
Source: 2005 to 2009 ACS PUMS DataRank by growth is relative to the total population growth
among areas with populations > 1,000,000
8/3/2019 Telework Trends US
http://slidepdf.com/reader/full/telework-trends-us 13/27
13 - State of Telework in the U.S Telework Research Network
WHO WORKS AT HOME ?More than 70% of the WAH population holds manage-ment, professional, sales, and office jobs (compared to61% of the total workforce; see Chart 4, opposite).
0% 10% 20% 30% 40%
Management, professional,and related
Service
Sales and ofce
Farming, shing, andforestry
Construction, extraction,maintenance, and repair
Production, transportation,and material moving
Military
Chart 4 - By Occupation, % Total EmployedPopulation Compared to % WAH Population
Source: 2009 ACS PUMS Data
% Total Employed Population % WAH Population
Table 6—% WAH in 15 Largest Metro AreasSource: 2005 to 2009 ACS PUMS Data
San Diego-Carlsbad-San Marcos, CA 4.2%
Atlanta-Sandy Springs-Marietta, GA 3.4%
San Francisco-Oakland-Fremont, CA 3.1%
Seattle-Tacoma-Bellevue, WA 3.0%
Phoenix-Mesa-Scottsdale, AZ 2.9%
Riverside-San Bernardino-Ontario, CA 2.7%
Dallas-Fort Worth-Arlington, TX 2.6%
Los Angeles-Long Beach-Santa Ana, CA 2.6%
Washington-Arlington-Alexandria,DC-VA-MD-WV 2.6%
Boston-Cambridge-Quincy, MA-NH 2.5%Philadelphia-Camden-Wilmington,PA-NJ-DE-MD 2.4%
Minneapolis-St. Paul-Bloomington, MN-WI 2.3%
Chicago-Naperville-Joliet, IL-IN-WI 2.3%
New York-N. New Jersey-Long Island,NY-NJ-PA 2.1%
Houston-Sugar Land-Baytown, TX 1.8%
Detroit-Warren-Livonia, MI 1.8%
Source: 2009 ACS PUMS Data
8/3/2019 Telework Trends US
http://slidepdf.com/reader/full/telework-trends-us 14/27
14 - State of Telework in the U.S Telework Research Network
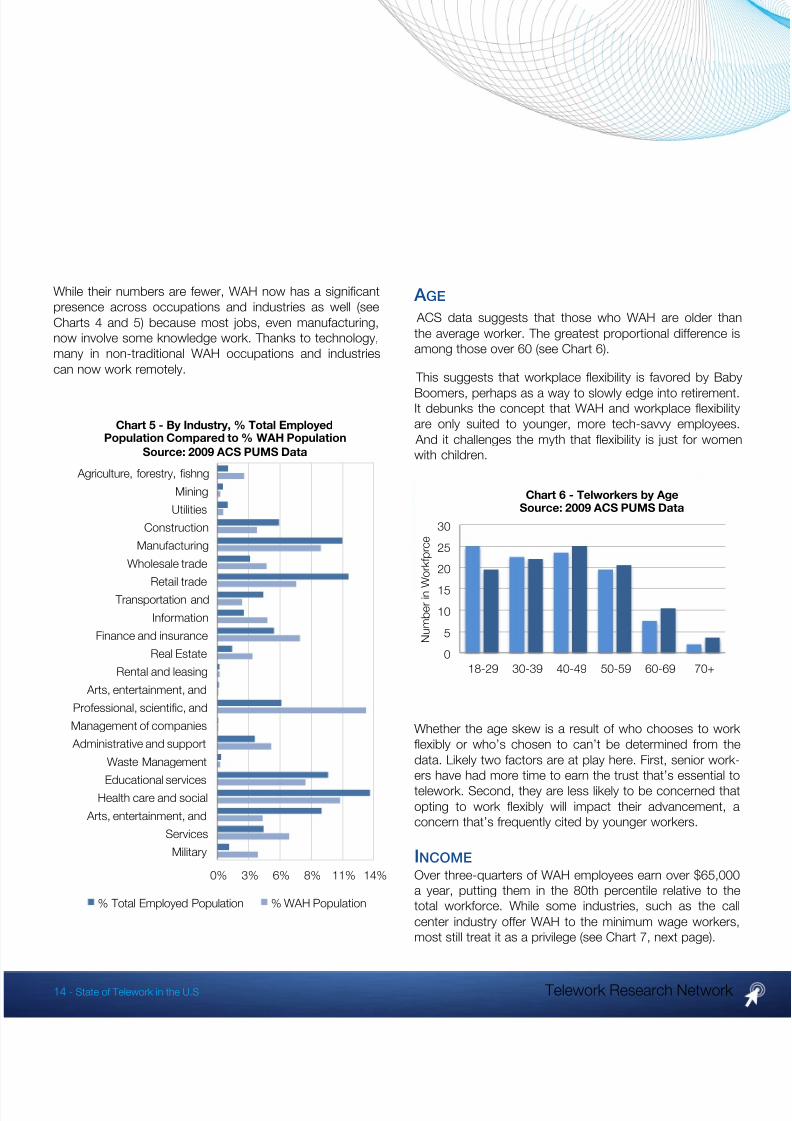
While their numbers are fewer, WAH now has a significantpresence across occupations and industries as well (seeCharts 4 and 5) because most jobs, even manufacturing,now involve some knowledge work. Thanks to technology,many in non-traditional WAH occupations and industriescan now work remotely.
A GE
ACS data suggests that those who WAH are older thanthe average worker. The greatest proportional difference isamong those over 60 (see Chart 6).
This suggests that workplace flexibility is favored by Baby
Boomers, perhaps as a way to slowly edge into retirement.It debunks the concept that WAH and workplace flexibilityare only suited to younger, more tech-savvy employees.
And it challenges the myth that flexibility is just for womenwith children.
Whether the age skew is a result of who chooses to work flexibly or who’s chosen to can’t be determined from thedata. Likely two factors are at play here. First, senior work-ers have had more time to earn the trust that’s essential totelework. Second, they are less likely to be concerned thatopting to work flexibly will impact their advancement, aconcern that’s frequently cited by younger workers.
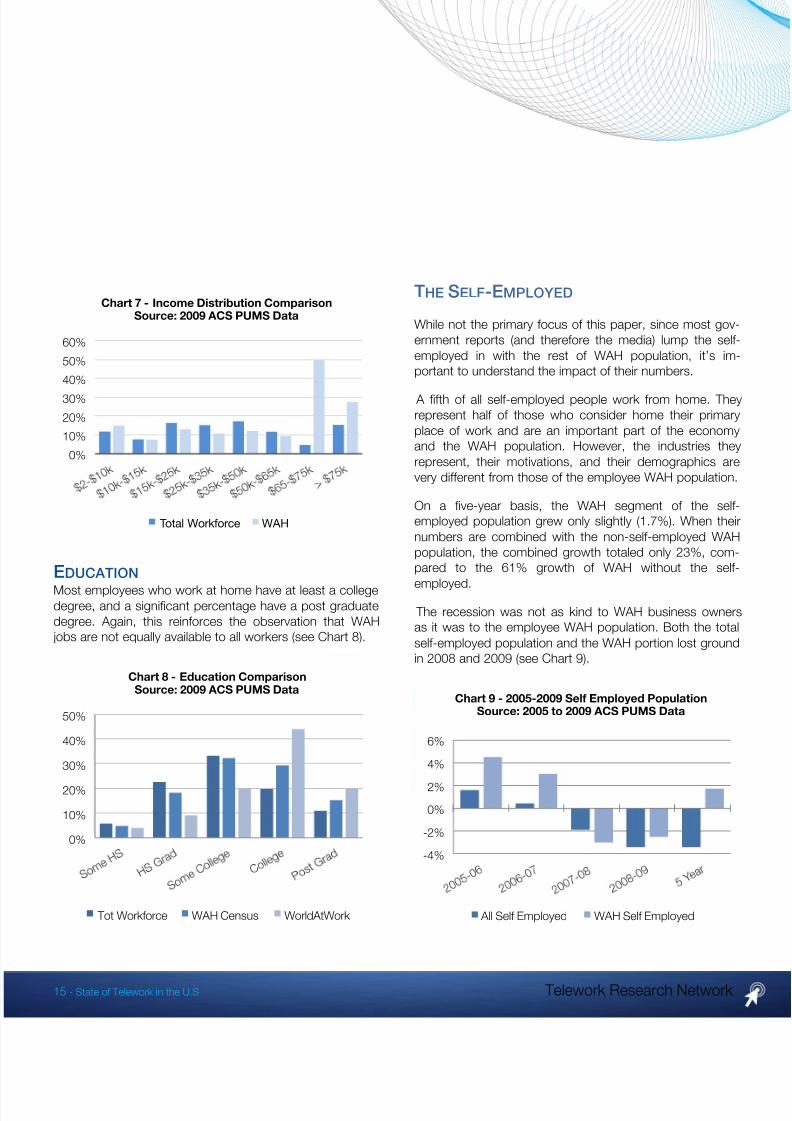
INCOME Over three-quarters of WAH employees earn over $65,000a year, putting them in the 80th percentile relative to thetotal workforce. While some industries, such as the callcenter industry offer WAH to the minimum wage workers,most still treat it as a privilege (see Chart 7, next page).
0% 3% 6% 8% 11% 14%
Agriculture, forestry, shngMining
UtilitiesConstruction
ManufacturingWholesale trade
Retail trade Transportation and
InformationFinance and insurance
Real EstateRental and leasing
Arts, entertainment, andProfessional, scientic, andManagement of companies Administrative and support
Waste Management
Educational servicesHealth care and social Arts, entertainment, and
ServicesMilitary
Chart 5 - By Industry, % Total EmployedPopulation Compared to % WAH Population
Source: 2009 ACS PUMS Data
% Total Employed Population % WAH Population
0
5
1015
20
25
30
18-29 30-39 40-49 50-59 60-69 70+
N u m
b e r i n W o r k f p r c e
Chart 6 - Telworkers by AgeSource: 2009 ACS PUMS Data
8/3/2019 Telework Trends US
http://slidepdf.com/reader/full/telework-trends-us 15/27
15 - State of Telework in the U.S Telework Research Network
E DUCATION
Most employees who work at home have at least a collegedegree, and a significant percentage have a post graduatedegree. Again, this reinforces the observation that WAH
jobs are not equally available to all workers (see Chart 8).
T HE S ELF -E MPLOYED
While not the primary focus of this paper, since most gov-ernment reports (and therefore the media) lump the self-employed in with the rest of WAH population, it’s im-portant to understand the impact of their numbers.
A fifth of all self-employed people work from home. Theyrepresent half of those who consider home their primaryplace of work and are an important part of the economyand the WAH population. However, the industries theyrepresent, their motivations, and their demographics arevery different from those of the employee WAH population.
On a five-year basis, the WAH segment of the self-employed population grew only slightly (1.7%). When theirnumbers are combined with the non-self-employed WAHpopulation, the combined growth totaled only 23%, com-pared to the 61% growth of WAH without the self-
employed. The recession was not as kind to WAH business ownersas it was to the employee WAH population. Both the totalself-employed population and the WAH portion lost groundin 2008 and 2009 (see Chart 9).
0%10%20%30%40%50%60%
Chart 7 - Income Distribution ComparisonSource: 2009 ACS PUMS Data
Total Workforce WAH
0%
10%
20%
30%
40%
50%
Chart 8 - Education ComparisonSource: 2009 ACS PUMS Data
Tot Workforce WAH Census WorldAtWork
-4%
-2%
0%2%
4%
6%
Chart 9 - 2005-2009 Self Employed PopulationSource: 2005 to 2009 ACS PUMS Data
All Self Employed WAH Self Employed
8/3/2019 Telework Trends US
http://slidepdf.com/reader/full/telework-trends-us 16/27
16 - State of Telework in the U.S Telework Research Network
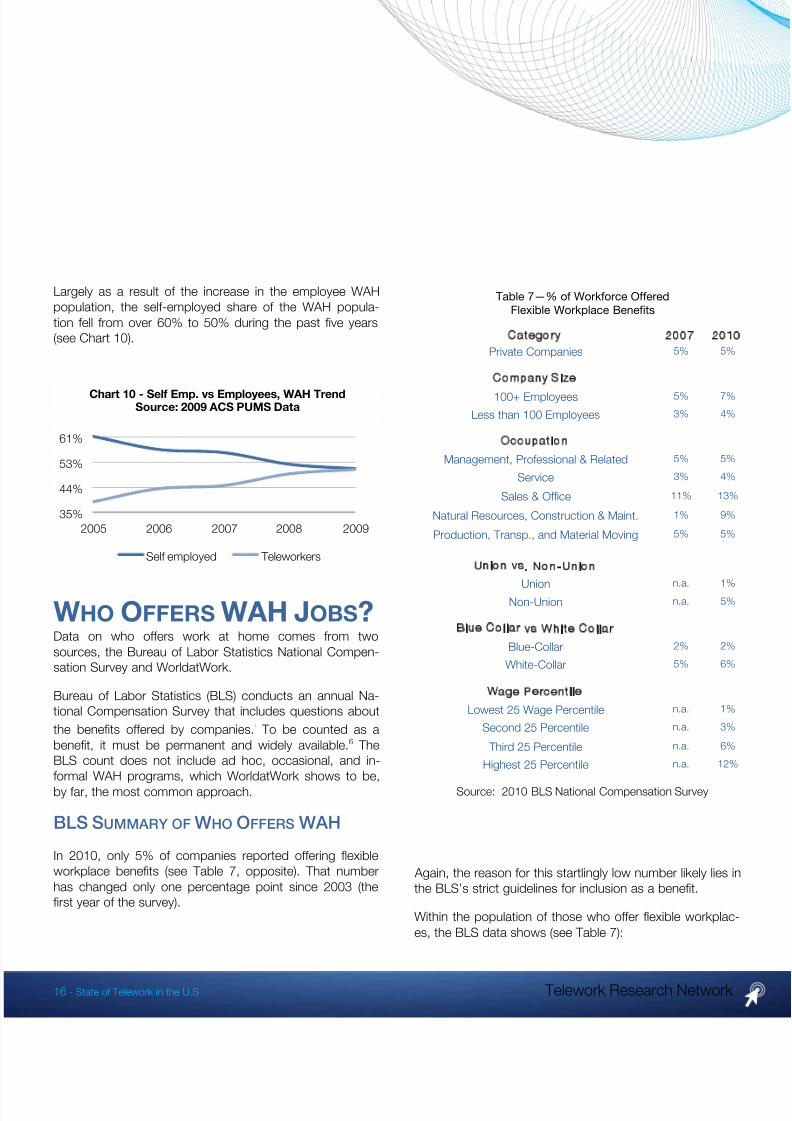
Largely as a result of the increase in the employee WAHpopulation, the self-employed share of the WAH popula-tion fell from over 60% to 50% during the past five years(see Chart 10).
WHO O FFERS WAH J OBS ?Data on who offers work at home comes from twosources, the Bureau of Labor Statistics National Compen-sation Survey and WorldatWork.
Bureau of Labor Statistics (BLS) conducts an annual Na-tional Compensation Survey that includes questions aboutthe benefits offered by companies. 5 To be counted as abenefit, it must be permanent and widely available. 6 TheBLS count does not include ad hoc, occasional, and in-formal WAH programs, which WorldatWork shows to be,by far, the most common approach.
BLS S UMMARY OF W HO O FFERS WAH
In 2010, only 5% of companies reported offering flexibleworkplace benefits (see Table 7, opposite). That numberhas changed only one percentage point since 2003 (thefirst year of the survey).
Again, the reason for this startlingly low number likely lies inthe BLS’s strict guidelines for inclusion as a benefit.
Within the population of those who offer flexible workplac-es, the BLS data shows (see Table 7):
Table 7—% of Workforce OfferedFlexible Workplace Benefits
Category 2007 2010Private Companies 5% 5%
Company Size
100+ Employees 5% 7% Less than 100 Employees 3% 4%
Occupation
Management, Professional & Related 5% 5% Service 3% 4%
Sales & Office 11% 13% Natural Resources, Construction & Maint. 1% 9% Production, Transp., and Material Moving 5% 5%
Union vs. Non-Union
Union n.a. 1%
Non-Union n.a. 5%
Blue Collar vs White Collar
Blue-Collar 2% 2% White-Collar 5% 6%
Wage Percenti le
Lowest 25 Wage Percentile n.a. 1% Second 25 Percentile n.a. 3% Third 25 Percentile n.a. 6%
Highest 25 Percentile n.a. 12%
Source: 2010 BLS National Compensation Survey
35%
44%
53%
61%
2005 2006 2007 2008 2009
Chart 10 - Self Emp. vs Employees, WAH TrendSource: 2009 ACS PUMS Data
Self employed Teleworkers
8/3/2019 Telework Trends US
http://slidepdf.com/reader/full/telework-trends-us 17/27
8/3/2019 Telework Trends US
http://slidepdf.com/reader/full/telework-trends-us 18/27
18 - State of Telework in the U.S Telework Research Network
WAH Availability by Industry
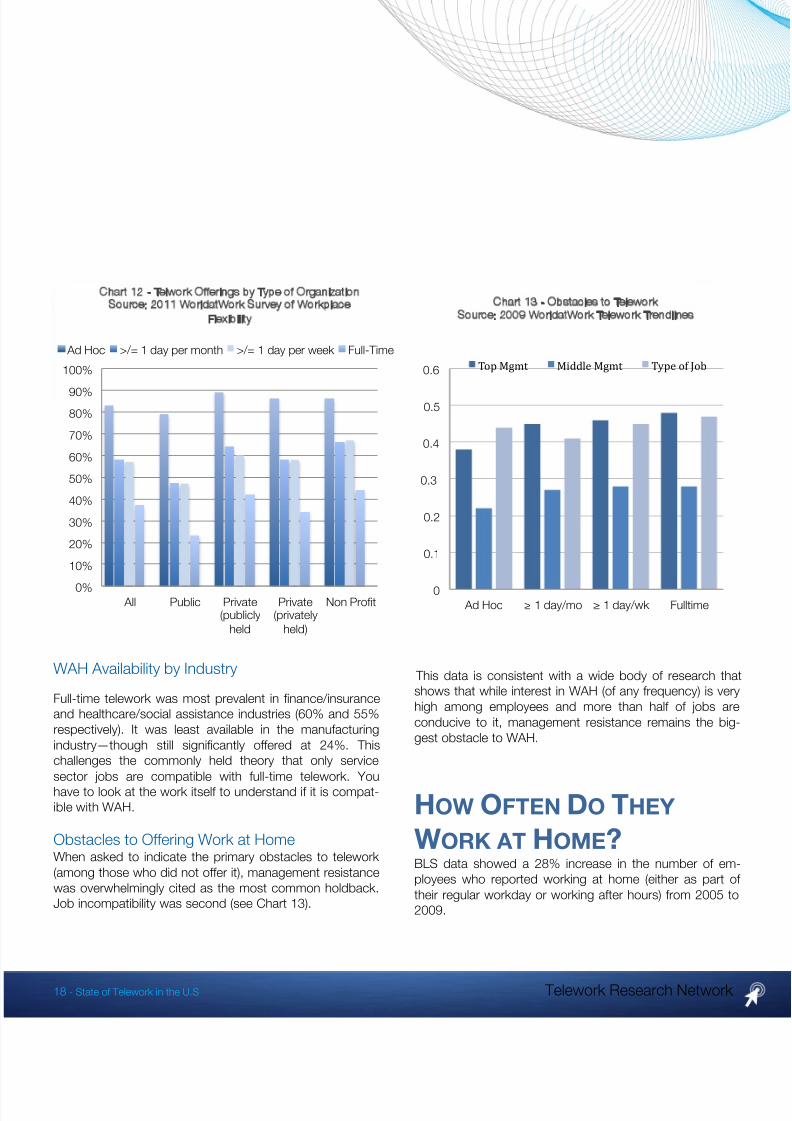
Full-time telework was most prevalent in finance/insuranceand healthcare/social assistance industries (60% and 55%respectively). It was least available in the manufacturingindustry—though still significantly offered at 24%. Thischallenges the commonly held theory that only servicesector jobs are compatible with full-time telework. Youhave to look at the work itself to understand if it is compat-ible with WAH.
Obstacles to Offering Work at HomeWhen asked to indicate the primary obstacles to telework (among those who did not offer it), management resistancewas overwhelmingly cited as the most common holdback.Job incompatibility was second (see Chart 13).
This data is consistent with a wide body of research thatshows that while interest in WAH (of any frequency) is veryhigh among employees and more than half of jobs areconducive to it, management resistance remains the big-gest obstacle to WAH.
HOW O FTEN DO THEY
WORK AT HOME ?BLS data showed a 28% increase in the number of em-ployees who reported working at home (either as part of their regular workday or working after hours) from 2005 to2009.
0%
10%
20%
30%
40%
50%
60%
70%
80%90%
100%
All Public Private(publicly
held
Private(privately
held)
Non Prot
Chart 12 - Telwork Offerings by Type of OrganizationSource: 2011 WorldatWork Survey of Workplace
Flexibility
Ad Hoc >/= 1 day per month >/= 1 day per week Full-Time
0
0.1
0.2
0.3
0.4
0.5
0.6
Ad Hoc ≥ 1 day/mo ≥ 1 day/wk Fulltime
Chart 13 - Obstacles to TeleworkSource: 2009 WorldatWork Telework Trendlines
Top Mgmt Middle Mgmt Type of Job
8/3/2019 Telework Trends US
http://slidepdf.com/reader/full/telework-trends-us 19/27
19 - State of Telework in the U.S Telework Research Network
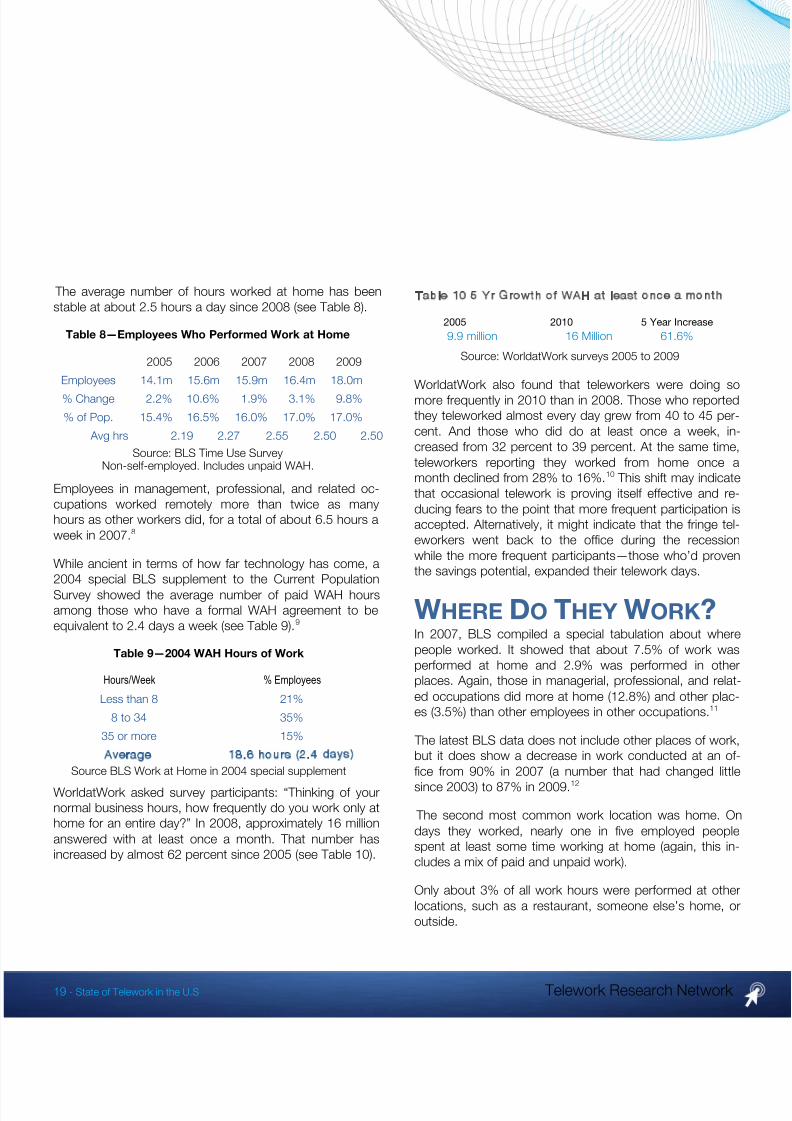
The average number of hours worked at home has beenstable at about 2.5 hours a day since 2008 (see Table 8).
Table 8—Employees Who Performed Work at Home
2005 2006 2007 2008 2009Employees 14.1m 15.6m 15.9m 16.4m 18.0m% Change 2.2% 10.6% 1.9% 3.1% 9.8%% of Pop. 15.4% 16.5% 16.0% 17.0% 17.0% Avg hrs 2.19 2.27 2.55 2.50 2.50
Source: BLS Time Use SurveyNon-self-employed. Includes unpaid WAH.
Employees in management, professional, and related oc-cupations worked remotely more than twice as manyhours as other workers did, for a total of about 6.5 hours aweek in 2007. 8
While ancient in terms of how far technology has come, a2004 special BLS supplement to the Current PopulationSurvey showed the average number of paid WAH hoursamong those who have a formal WAH agreement to beequivalent to 2.4 days a week (see Table 9). 9
Table 9—2004 WAH Hours of Work
Hours/Week % Employees
Less than 8 21%8 to 34 35%
35 or more 15%
Average 18.6 hours (2.4 days)Source BLS Work at Home in 2004 special supplement
WorldatWork asked survey participants: “Thinking of yournormal business hours, how frequently do you work only athome for an entire day?” In 2008, approximately 16 millionanswered with at least once a month. That number hasincreased by almost 62 percent since 2005 (see Table 10).
WorldatWork also found that teleworkers were doing somore frequently in 2010 than in 2008. Those who reportedthey teleworked almost every day grew from 40 to 45 per-cent. And those who did do at least once a week, in-creased from 32 percent to 39 percent. At the same time,teleworkers reporting they worked from home once amonth declined from 28% to 16%. 10 This shift may indicatethat occasional telework is proving itself effective and re-ducing fears to the point that more frequent participation isaccepted. Alternatively, it might indicate that the fringe tel-eworkers went back to the office during the recessionwhile the more frequent participants—those who’d proventhe savings potential, expanded their telework days.
WHERE DO THEY WORK ?In 2007, BLS compiled a special tabulation about wherepeople worked. It showed that about 7.5% of work wasperformed at home and 2.9% was performed in otherplaces. Again, those in managerial, professional, and relat-ed occupations did more at home (12.8%) and other plac-es (3.5%) than other employees in other occupations. 11
The latest BLS data does not include other places of work,but it does show a decrease in work conducted at an of-fice from 90% in 2007 (a number that had changed littlesince 2003) to 87% in 2009. 12
The second most common work location was home. Ondays they worked, nearly one in five employed peoplespent at least some time working at home (again, this in-cludes a mix of paid and unpaid work).
Only about 3% of all work hours were performed at otherlocations, such as a restaurant, someone else’s home, oroutside.
Table 10 5 Yr Growth of WAH at least once a month
2005 2010 5 Year Increase 9.9 million 16 Million 61.6%
Source: WorldatWork surveys 2005 to 2009
8/3/2019 Telework Trends US
http://slidepdf.com/reader/full/telework-trends-us 20/27
20 - State of Telework in the U.S Telework Research Network
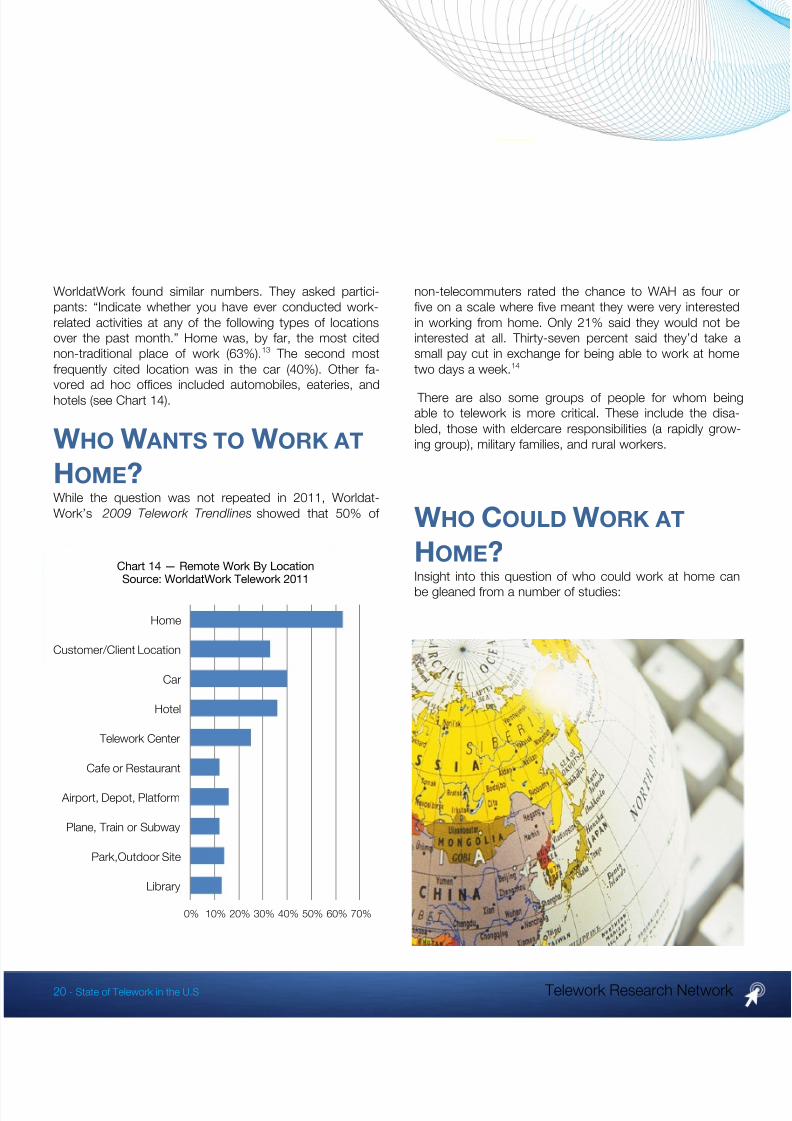
WorldatWork found similar numbers. They asked partici-pants: “Indicate whether you have ever conducted work-related activities at any of the following types of locationsover the past month.” Home was, by far, the most citednon-traditional place of work (63%). 13 The second mostfrequently cited location was in the car (40%). Other fa-vored ad hoc offices included automobiles, eateries, andhotels (see Chart 14).
WHO W ANTS TO WORK AT
HOME ?While the question was not repeated in 2011, Worldat-Work’s 2009 Telework Trendlines showed that 50% of
non-telecommuters rated the chance to WAH as four orfive on a scale where five meant they were very interestedin working from home. Only 21% said they would not beinterested at all. Thirty-seven percent said they’d take asmall pay cut in exchange for being able to work at hometwo days a week. 14
There are also some groups of people for whom beingable to telework is more critical. These include the disa-bled, those with eldercare responsibilities (a rapidly grow-ing group), military families, and rural workers.
WHO C OULD WORK AT
HOME ?Insight into this question of who could work at home canbe gleaned from a number of studies:
0% 10% 20% 30% 40% 50% 60% 70%
Home
Customer/Client Location
Car
Hotel
Telework Center
Cafe or Restaurant
Airport, Depot, Platform
Plane, Train or Subway
Park,Outdoor Site
Library
Chart 14 — Remote Work By LocationSource: WorldatWork Telework 2011
8/3/2019 Telework Trends US
http://slidepdf.com/reader/full/telework-trends-us 21/27
21 - State of Telework in the U.S Telework Research Network
1) The WorldatWork 2011 Survey on Workplace Flexibility suggested that employers felt that between 41% and 47%of jobs were compatible with WAH. 15
2) WorldatWork’s 2009 Telework Trendlines shows thatthe 38% of those who did not telecommute felt they had
job-related tasks that could be done at home. Respond-ents most commonly answered that they felt they could doup to 40% of their job at home, though almost a quarterfelt they could do 80% or more remotely. 16
3) In 2005, researchers Matthews and Williams (M&W) es-timated the potential WAH population at 40% of the work-force (based on 2002 BLS totals). 17 They did so by deter-mining which U.S. jobs were telework compatible, whichthey defined as:
Having an information component
Being individual vs. group work
Having clear parameters for evaluation Not requiring personal contact with customers
Not requiring physical work that could only be done on site
On this basis, they included professional specialty, tech-nical support, administrative support, and half of sales jobs(assuming that half were non-retail). They excluded man-agement positions altogether, assuming (incorrectly) that“managers would not be teleworking in the near future.”
We repeated Matthews and Williams approach using 2010Labor Force numbers with the following modifications:
We included a small portion of the populations where therewere already people working at home in occupationalcategories that were not included in M&W’s estimate. Forservice and production/transportation occupations, weassumed 5% compatibility. For construction andmaintenance, we assumed 10%.
For the government workforce, we assumed 61% of jobswere compatible based on the Department of Labor’s 2009
Report to Congress .18
For management jobs, we assumed 50% compatibility.
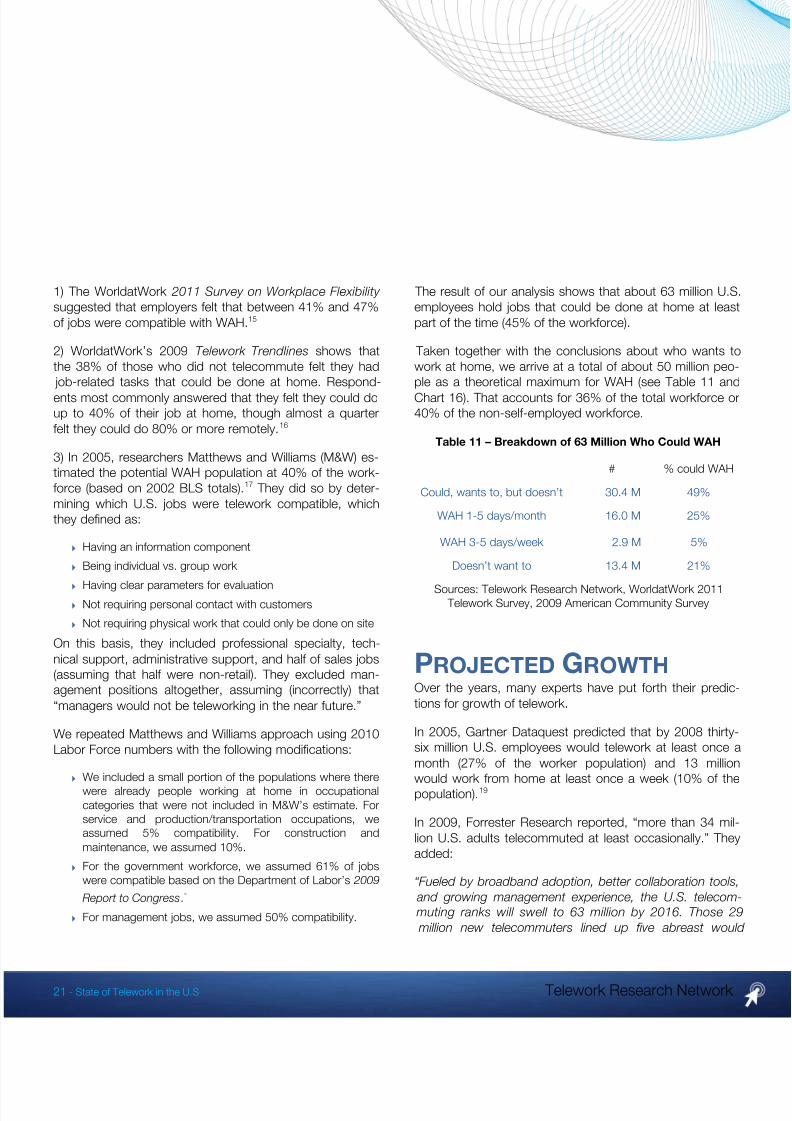
The result of our analysis shows that about 63 million U.S.employees hold jobs that could be done at home at leastpart of the time (45% of the workforce).
Taken together with the conclusions about who wants towork at home, we arrive at a total of about 50 million peo-ple as a theoretical maximum for WAH (see Table 11 andChart 16). That accounts for 36% of the total workforce or40% of the non-self-employed workforce.
Table 11 – Breakdown of 63 Million Who Could WAH
# % could WAH
Could, wants to, but doesn’t 30.4 M 49%
WAH 1-5 days/month 16.0 M 25%
WAH 3-5 days/week 2.9 M 5%
Doesn’t want to 13.4 M 21%
Sources: Telework Research Network, WorldatWork 2011 Telework Survey, 2009 American Community Survey
P ROJECTED GROWTH Over the years, many experts have put forth their predic-tions for growth of telework.
In 2005, Gartner Dataquest predicted that by 2008 thirty-six million U.S. employees would telework at least once amonth (27% of the worker population) and 13 millionwould work from home at least once a week (10% of thepopulation). 19
In 2009, Forrester Research reported, “more than 34 mil-lion U.S. adults telecommuted at least occasionally.” Theyadded:
“Fueled by broadband adoption, better collaboration tools, and growing management experience, the U.S. telecom- muting ranks will swell to 63 million by 2016. Those 29 million new telecommuters lined up five abreast would
8/3/2019 Telework Trends US
http://slidepdf.com/reader/full/telework-trends-us 22/27
22 - State of Telework in the U.S Telework Research Network
stretch from New York to LA! Leading the surge are occa-sional telecommuters and regular telecommuters whowork from home between one and four days a week. The
impact of this expanding remote workforce is far-reaching:It will force firms to expand their digital footprints, harness
new social software, crisply define their culture, and exam- ine their real estate and energy policies.” 20
In February of 2011, Fortune Magazine reported that 82%of companies that made its annual “100 Best Companiesto Work For” list allow employees to telecommute or work at home at least 20% of the time. 21
There is no doubt that remote work will continue to grow. And there’s no doubt that it will soon begin to grow morequickly as a result of a number of factors, including:
Ever improving communications and collaborationtechnologies
Increased high-speed broadband penetration The proliferation of web-based applications A return of labor and talent shortages that were of keyconcern prior to the recession
The needs and wants of an increasingly tech-savvy laborforce
The desire for flexible work among retiring Baby Boomers Record-low levels of employee engagement Workforce burnout—a factor that was already a problembefore the recession, but even more so now as a result of it
The increasing pressure on working adults to care for agingparents
Increasing sophistication about how to manage and work with distributed workers and groups of workers.
The declining numbers of Baby Boom managers who arenot comfortable with WAH workers as they head off intoretirement.
Continued pressures on companies for indirect costs of office space including real estate, design, management,and operations.
Escalating fuel prices and continued unrest in the MiddleEast
Increasing pressure on companies to reduce their carbonfootprint, including the likelihood of financial sanctions
Continued emphasis on cost containment and bottom lineperformance
The growing recognition of flexibility as a corporatestrategy, not just an HR tactic
Continual reminders of WAH as a continuity of operationsstrategy Growing concerns about our underfunded and under-maintained transportation infrastructure
Federal budget pressures and government mandates forthe federal workforce including the Telework Act and otherson sustainability, continuity of operations, technologyreplacement cycles, real estate management, cloudcomputing and others.
The question remains: how quickly will remote work grow?
Clearly, ad hoc and occasional WAH will lead the way.More than 16 million people already work remotely at leastonce a month. Based on the historical growth rate report-ed by WorldatWork (roughly 12% per year), without anyacceleration, that number will reach the theoretical maxi-mum of 50 million people by 2018.
If we similarly project the regular WAH population growth,account for projected changes in the labor force, and as-sume it continues to grow at its historical growth rate, theregular WAH population would total 4.9 million by 2016, a69% increase over its current level—but still a very smallportion of the workforce and well below the forecasts of others.
C ONCLUSIONS While we acknowledge the barriers to widespread tele-work, it’s an interesting exercise to project what it wouldmean if the 50 million potential telecommuters in the U.S.worked from home on a regular basis (half time). Based onour Telework Savings Calculator™, the collective compa-ny, community, and individual savings would total over
8/3/2019 Telework Trends US
http://slidepdf.com/reader/full/telework-trends-us 23/27
23 - State of Telework in the U.S Telework Research Network
$900 billion a year. The financial and non-financial benefitswould include:
B USINESSES W OULD :22
Save over $13,000 per person
Increase productivity by over $466 billion—6 million man-years
Save $170 billion in real estate and related costs (assuminga 20% reduction)
Save $28 billion in absenteeism (25% reduction) andturnover (10% reduction)
Improve continuity of operations
Avoid environmental sanctions, city access fees, etc.
Reduce their energy costs and carbon footprint
Improve work-life balance and better address the needs of families, parents, and senior caregivers
Avoid the ‘brain drain’ effect of retiring Boomers by allowingthem to work flexibly
Be able to recruit and retain the best people
INDIVIDUALS W OULD :23
Achieve a better work-life balance
Recoup almost a week of free time per year—time they’dhave otherwise spent commuting
Save $2,000-$6,700/year, not including daycare andeldercare costs or reduced car insurance premiums
Suffer fewer illnesses
T HE N ATION W OULD :24
Save 281 million barrels of oil a year ($28 billion/year at$100/barrel)—the equivalent of 46% of our Persian Gulf imports
Reduce greenhouse gases by 51 million tons/year—theequivalent of the entire New York state workforce off theroads
Reduce road travel by 91 billion miles/year therebyreducing the strain on our crumbling transportationinfrastructure
Reduce road congestion and increase the productivity fornon-telecommuters
Save 77,000 people from traffic-related injury or death
Improve emergency responsiveness Reduce pollution from road work and new office
construction
Reduce the offshoring of jobs and homeshore some thathave already been lost
Provide fuller employment opportunities for specialpopulations include rural workers, the disabled, and militaryfamilies
Reduce the economic and political vulnerability that stemsfrom our dependence on foreign oil
Reduce terrorism targets of opportunity
More than a dozen state and federal legislative initiativesaimed at encouraging telework have been introduced inthe past three years. Many have been enacted. Federaltransportation monies already fund a handful of state andlocal advocacy programs. While this is encouraging, unlessa coordinated approach to telework is taken, well-intendedinitiatives risk duplication of effort and cost. Moreover,without a good understanding of who is already telework-ing, it will be impossible to measure the success or returnon investment of new programs.
T HE F EDERAL G OVERNMENT S HOULD :
Develop cross-agency initiatives to foster state and localtelework advocacy programs. DOE, EPA, DOT, DOL, SBA,
VA, CDC, the Council on Disability, NSA, DOI, DOD, andeven SSA all have something to gain from telework.
Specifically include telework as a valid transportationdemand management and pollution reduction strategy inthe nation’s transportation and energy policies.
Collect data from those state and local advocacy programsthat have already proven successful. TeleworkVA, forexample, has a program that offers cash incentives to
8/3/2019 Telework Trends US
http://slidepdf.com/reader/full/telework-trends-us 24/27
24 - State of Telework in the U.S Telework Research Network
companies that allow their people to work from home.Other successful models are offered by the federalgovernment’s own telework programs, The Telework Exchange, TelecommuteConnecticut, Commuter Challengein Seattle, 36 Commuting Solutions in Denver, M-ATAC inWashington DC, TelCoa, WORKShiftCalgary, the SloanWork and Family Network, and dozens of private
practitioners. Sharing information about what has alreadybeen tried and what has worked can save substantialexpense.
Agree on a universally accepted method of verifying andmeasuring telework participation. This is particularlyimportant as public monies are used to fund programs andas city access fees, commuter taxes, carbon reporting, andenvironmental sanctions become realities.
Provide funding for the implementation of the Telework Enhancement Act of 2010. Passed with bipartisan support,this legislation is intended to increase telework participationwithin federal agencies, but as no funding was associatedwith the bill, many agencies are finding it impossible tocomply.
Establish a public-private partnership within SBA to helpsmall private sector companies evaluate and implementtelework.
Encourage states and local governments to supporttelework for their own employees and to encourage privatesector adoption. Progress toward telework goals should beincluded in agency head and managers performanceevaluations. Best practices and vendor assessmentsshould be openly shared between government agencies toavoid duplication of effort and ensure that poor performingvendors are not hired elsewhere (think Yelp forgovernment). Essential telework fundamentals such as IT and organizational readiness assessments and telework training (for agency leaders, managers, employees). shouldbe required for all programs using federal funds to ensurethat programs are not set up for failure. Pre- and post-telework metrics should be captured to accurately evaluateprogram success.
Include questions in future American Community Surveysthat allow researchers to easily distinguish home-basedemployees, home-businesses, volunteers, and unpaidfamily workers across all variables. In addition, questionsshould be added to account for mobile employees and to
determine where and how often each class of worker isworking remotely.
Make ubiquitous high-speed broadband access a priority.Without uniform access, telework will not be available tothose who need it the most.
Require that state and local taxing authorities abolishpolicies that double-tax home-based workers. New York’s‘telecommuter tax’ may explain why the NY metro region’stelework participation rate is so low.
Offer partial home office tax credits for people who work from home part time and allow WAH employees to deducttheir home office equipment costs.
Offer Small Business Innovation Grants (SBIR) to inspiretechnology that supports telework.
Encourage the relaxation of local zoning laws that prohibithome-based work.
Evaluate OSHA, Fair Labor Standards, ERISA, and otheremployer regulations that impact remote work.
DISCUSSION W HY DO SOME METRO AREAS HAVE HIGHER
CONCENTRATIONS OF TELEWORKERS THAN
OTHERS ?
We expected to find a positive correlation between areaswith the worst congestion or those with the highest levels of 'extreme commutes' and high levels of telework, but didn'tfind such a relationship. We expected to find a correlation inplaces where there are telework incentives, but we didn't.
What we see most in the data are places with large popu-lations of information workers—Detroit is at the bottom of the list for example. But there are many factors that mightencourage or discourage telework. For example, a longperiod of highway maintenance in San Diego, coupled witha relatively limited public transportation system may haveled to its work at home growth. And while New York isinfamous for its traffic jams, its “telecommuter tax” (essen-
8/3/2019 Telework Trends US
http://slidepdf.com/reader/full/telework-trends-us 25/27
25 - State of Telework in the U.S Telework Research Network
tially double taxation of telecommuters) most likely dis-courages participation.
The fastest growth areas may be a result of slow starters,an example of the "brilliant recovery from a piss poor start"effect. It's easier to achieve a large percentage increase ina small space than it is a large one.
W HAT CAUSED THE SURGE IN F EDERAL
WORKERS TELECOMMUTING ? IT ’S
OBVIOUSLY TOO EARLY FOR IT TO BE THE
T ELEWORK E NHANCEMENT A CT .
The huge growth (+400%) all came between 2005 and2006. Until recently, continuity of operations was the pri-mary driver of Federal telework. In 2005 both the Oklaho-ma City bombing and Hurricane Katrina were wake-upcalls. In addition, in part because of Katrina—but also as aresult of increased demand, fuel prices had been steadilyrising. They crossed the $3/gallon barrier in late 2005, andsome people said, “Enough!” Oddly, the $4/gallon barrierdoes not seem to have the same impact.
Here’s the federal government’s own take on the 2006growth in telework among federal workers: 25
“In the wake of the devastation caused by Hurricane Katri-na, we have seen the importance of telework in respond-ing flexibly to emergency situations— in this case, byproviding a tool to help alleviate the issues caused bysteeply rising fuel prices nationwide. Additionally, Con-gress showed its continuing interest in telework in theFederal Government through the enactment of Public Law108-447 in December of 2004, encouraging increasedtelework participation in certain agencies.”
W HY IS YOUR FORECAST FOR THE GROWTH
OF TELEWORK SO MUCH MORE
CONSERVATIVE THAN THOSE OF OTHERS
Having worked with a number of companies and govern-ment agencies in the early stages of their telework pro-
grams, it’s clear that the majority is not ready to make theorganizational culture shift that’s required to manage aremote workforce. The issue of mistrust—‘how do I knowthey’re working’, is huge and not easily overcome. Man-agement attitudes that were born in the days of sweat-shops and typing pools still dominate. And even in thoserare organizations where senior management unambigu-ously supports the concept, lack of middle managementbuy-in is the stumbling block.
Oddly, the fact that the majority of information industryemployees are not at their desk most of the time, is some-thing most companies don’t want to acknowledge. Thetools, training, and technologies that are needed to sup-port telework, are really just a catch-up on how employeesare working already.
While looming labor shortages, increased pressure fromvalue chain partners and others to engage in sustainablepractices, rising fuel prices, budget pressures and a varietyof other factors will continue to make telework attractive,the cultural barriers will not be quickly overcome.
8/3/2019 Telework Trends US
http://slidepdf.com/reader/full/telework-trends-us 26/27
8/3/2019 Telework Trends US
http://slidepdf.com/reader/full/telework-trends-us 27/27
Endnotes
1 Telework 2011—A WorldatWork Special Report, based on data from The Dieringer Research Group, Inc telephone survey of 1,002 randomlyselected U.S. adults conducted between Oct. 20, 2010, and Nov. 2,20102 Survey on Workplace Flexibility, WorldatWork, February 2011. 5,191members surveyed with 537 valid responses.3 2010 Status of Telework in the Federal Government, U.S. Office of Personnel Management.4 2010 Status of Telework in the Federal Government, U.S. Office of Personnel Management. 5 Bureau of Labor Statistics, 2007 and 2010 Annual Benefits Survey.2010 included a sample of approximately 18,000 firms with 10,000 re-sponding.6 A 3-8-11 email from Natalie Kramer, Economist in the Office of Com-pensation and Working Conditions, National Compensation Survey Bu-reau of Labor Statistics offers this explanation of whether the flexibleworkplace benefit should be counted:
“This benefit is also known as flexiplace or telecom- muting. It allows employees who t raditionally work at the estab- lishment to regularly work an agreed-upon portion of their work schedule at home or other approved location. Excludes tempo-
rary arrangements.1) An employee with a chronic back problem for
years expects no improvement. Arrangements are made for him to work at home 2 days a week indefinitely. If this ar- rangement is personalized for a specific individual, and other employees would not expect the same t reatment under similar circumstances, the plan would be out of scope.
2) An employee's work involves review of docu- ments on the computer and email with clients to resolve is-sues. Work can be done away from the office as long as theemployee has computer access. The employee has productionquotas to meet each day. The company allows the employeeto work from home one day per week as long as the quotas
are maintained. This is an in-scope arrangement because other than failing to maintain a quota, there is no indication that the
arrangement is temporary.3) Another employee breaks a leg and cannot drive
for 3 months. His company allows him to telecommute from home during the recuperation, with the understanding that thetelecommunicating would end after 3 months. This is an out-of-scope flexible workplace arrangement because of the speci-fied three month limitation.
Note: Arrangements that are expected to continue indefinitely are usually in scope; those set up for a special pro- ject are out of scope.”
7 Survey on Workplace Flexibility, WorldatWork, February 2011. 8 Where People Worked, 2003 to 2007, US DOL BLS, Issues in LaborStatistics, June 2009. Based on a special tabulation of American Time
9 Work at Home Summary, BLS Economic News Release USDL 05-1768, 2005.10 Telework 2011—A WorldatWork Special Report11 Where People Worked, 2003 to 2007, US DOL BLS, Issues in LaborStatistics, June 2009. Based on a special tabulation of American TimeUse Survey data.12 BLS 2010 ATUS Economic News Release, Table 7.13 WorldatWork Telework Trendlines 2009, data from The Dieringer Re-search Group, Inc. Note: Because this data is for those who self reportedas telecommuters only rather than all U.S. adults, the margin of error fortelecommuter data is +/- 8.6 percent.14 WorldatWork Telework Trendlines 200915 WorldatWork, 2011 Survey on Workplace Flexibility16 WorldatWork Telework Trendlines 200917 Telework Adoption and Energy Use in Building and Transport Sectorsin the United States and Japan, Matthews and Williams, Journal of Infra-structure Systems ASCE, 2005.18 Status of Telework in the Federal Government—Report to Congress,US Department of Labor, 2009.19 Teleworking: The Quiet Revolution, Gartner Dataquest, 2005.20 US Telecommuting Forecast, 2009 to 2016, Forrester Research,March 11, 2009.21 100 Best Companies to Work For, Fortune, 2011.22 Calculated by the Telework Research Network’s proprietary Telework Savings Calculator™ and assuming: 25% reduction in real estate costs at$43/sf, 1.5 day a year reduction in absenteeism, 10% reduction in turno-ver, and 25% increase in productivity (at an average salary of $41,605,
the weighted average of the jobs included in the projection - based on2009 ACS)23 Calculated by the Telework Research Network’s proprietary Telework Savings Calculator and assuming IRS standard mileage reimbursementfor auto costs (not including gas), $3.80/gallon for gas, and food andclothing costs based on BLS data (net of extra home costs for food andnet of extra home electricity for home office use).24 Calculated by the Telework Research Network’s proprietary Telework Savings Calculator and assuming 75% reduction in telecommuter drivingon telework days for those 82% of employees who formerly drove towork solo, oil at $100/barrel, 20.3 average mpg, US DOT accident met-rics, and EPA pollution metrics.25 2006 Status of Telework in the Federal Government - Report to Con-gress (reporting on 2005)
© 2011 Telework Research Network . All rights reserved.