telstra corporation limited and controlled entities
TRANSCRIPT

1
Telstra Corporation Limited and controlled entities
Directors’ Report
For the year ended 30 June 2006

2
In accordance with a resolution of the Board, the directors present their report on the consolidated entity (Telstra Group) consisting of Telstra Corporation Limited and the entities it controlled at the end of or during the year ended 30 June 2006. This is our first full year financial report prepared in accordance with Australian equivalents to International Financial Reporting Standards (A-IFRS). When preparing this directors’ report, we have amended certain accounting and valuation methods applied under the previous Australian Generally Accepted Accounting Principles (AGAAP) to comply with A-IFRS. With the exception of financial instruments, the comparative figures have been restated to reflect these adjustments. This year has seen the commencement of a 3 to 5 year transformation of the company to improve long term shareholder value. The financial performance of the Company in fiscal 2006 was impacted by the investment in this transformation and provision for future restructuring. Principal activity
Telstra's principal activity during the financial year was to provide telecommunications and information services for domestic and international customers. There has been no significant change in the nature of this activity during the year. Results of operations
Telstra’s profit for the year was $3,181 million (2005: $4,309 million). This result was after deducting:
• net finance costs of $936 million (2005: $880 million); and • income tax expense of $1,380 million (2005: $1,746 million).
Earnings before interest and income tax expense was $5,497 million, representing a decrease of $1,438 million or 20.7% on the prior year’s result of $6,935 million. This decrease was due to higher labour costs, in particular redundancy costs, higher goods and services purchased and increases in other expenses supporting revenue growth. Expenses were also impacted by the recognition of transformation related expenses, including a provision at year end for redundancy and restructuring costs of $427 million to be incurred as part of our business transformation. Review of operations
Financial performance Our total income (excluding finance income) increased by $658 million or 2.9% to $23,100 million, reflecting a rise in total revenue (excluding finance income) of $591 million or 2.7% and other income by $67 million or 25.7%. Total income (excluding finance income) growth was mainly attributable to: • mobile goods and services - $284 million or 6.1%; • internet and IP solutions revenue - $530 million or 38.5%; • advertising and directories revenue - $126 million or 7.9%; and • pay TV bundling - $57 million or 21.7%. Mobile goods and services revenue increased largely due to increases in mobile data, international roaming and mobile interconnection revenues. Our interconnection revenues increased primarily due to Hutchison 3G roaming services, which commenced in April 2005. In addition, we continued to experience growth in the number of mobiles in operation of 261,000 to reach a total of 8.5 million, as well as increased revenue from mobile handset sales. 3G services were launched and take up has been very promising. Data usage is particularly strong by 3G users.

3
The increase in internet and IP solutions revenue was due to the significant growth in the number of subscribers to our Bigpond broadband product. During fiscal 2006 we increased the number of broadband subscribers by 1.2 million to 2.9 million, reflecting wholesale subscribers of 1.4 million and retail subscribers of 1.5 million. Our advertising and directories revenue increased compared with the prior year due to the continued strong performance of our Yellow pages® and White pages® print directories and strong growth in online products. This growth has also been driven by innovative marketing and product development strategies. Pay TV bundling revenue increased due to new subscribers and current subscribers migrating to the FOXTEL digital premium product as a result of promotions during the year, offering minimal price installation and discounted packages. Partially offsetting the revenue growth was a decline in PSTN product revenues of $540 million or 6.7% as the market continues to move towards new products and services. There has been a general reduction in PSTN volumes during the year with a decline in retail basic access lines and volume reductions across local calls, national long distance calls, international direct calls and fixed interconnection. Yields have also declined due to competitive pricing pressure and continuing customer migration to other products. The rate of decline in the second half of the year has reduced. Total operating expenses (before depreciation and amortisation, finance costs and income tax expense) increased by $1,637 million or 13.8% compared with the prior year. This growth was mainly attributable to: • labour - $506 million or 13.1%; • goods and services purchased - $519 million or 12.3%; and • other expenses - $612 million or 16.0%. Excluding the effects of our transformation costs, our total operating expenses (before depreciation and amortisation, finance costs and income tax expense) increased by $933 million or 7.9%. Further details of the increase in expenses is discussed below. Labour costs grew in fiscal 2006 mainly due to the following: • an increase in redundancy expense due to transformation initiatives; • annual salary increases due to enterprise agreements and annual salary reviews; and • an increase in labour expense of controlled entities as a result of entities acquired during
fiscal 2005 being included for the full year in fiscal 2006. Goods and services purchased increased due to the following: • an increase in network payments as a result of a rise in the number of terminations on
other networks and additional network access charges incurred as a result of our 3G partnership activities;
• higher handset subsidies from an increase in the take up of subsidised plans; • a rise in purchases of pay TV services to enable us to provide bundled products to meet
market demand; and • increased costs associated with our restructuring provision.

4
Other expenses grew due to the following: • recognition of a restructuring provision associated with our property rationalisation,
cancellation of server leases and decommissioning of certain information technology platforms;
• increased maintenance costs of the existing 3G network and the operational expenditure relating to the construction of the new 3G 850 network; and
• increased costs associated with our transformation initiatives, including higher consultancy costs for transformation activities and additional market research as part of our market based management approach.
Depreciation and amortisation costs grew to $4,087 million or by 15.8% in fiscal 2006 primarily due to the reassessment of service lives of our assets as part of the transformation strategy. As a result, we have accelerated depreciation and amortisation on our CDMA network, switching systems, certain business and operational support systems and related software totalling $422 million for the year. Partially offsetting the growth in other expenses was a reduction in our bad and doubtful debt expense resulting from improved credit management performance that led to lower debtor provision requirements and write offs, as well as reduced payments to external debt collection agents. Net finance costs increased by $56 million or 6.4% in fiscal 2006, primarily due to higher levels of debts driven by the cash requirements to fund the payment of our dividends and capital expenditure associated with the improvement of our core infrastructure. Our borrowings have also been affected by a higher effective interest rate as a result of refinancing elements of our maturing debt. The net debt gearing level remains within the financial parameters set by the Board. Income tax expense decreased by $366 million or 20.9% to $1,380 million in fiscal 2006 mainly as a result of the lower profit. The effective tax rate in the current year was 30.3% compared with the prior year rate of 28.8%. The effective tax rate is consistent with the Commonwealth statutory marginal income tax corporate rate of 30.0%. The effective tax rate has increased from the prior year mainly due to reduced differences for partnership losses and an increase in the under provision for tax from prior periods. Financial condition We continued to maintain a strong financial position, as demonstrated by us generating free cash flow of $4,550 million. During fiscal 2006 we continued to develop our core infrastructure network and re-energise our Company through ongoing operational transformation. In addition, we acquired a number of strategic investments and paid a total of $4,970 million to shareholders as dividends in fiscal 2006. As part of our ongoing operational transformation, we have introduced the one factory methology to consolidate and simplify the way we operate at all levels of the business. Previously, we had invested in multiple platforms in our exisiting networks. We intend on using economies of scale to ensure rationalisation of the number of operational platforms. We are currently implementing new business support systems and operational support systems to deliver simplificiation of our current processes and new capababilities cost effectively.
During fiscal 2006, we merged our 100% owned Hong Kong mobile operations (Telstra CSL Group) with the Hong Kong mobile operations of New World PCS Holdings Limited and its controlled entities (New World Mobility Group) to form the CSL New World Mobility Group. Under the merger agreement, Telstra CSL Limited (Telstra CSL) issued new shares to New World Mobility Holdings Limited in return for 100% of the issued capital of the New World Mobility Group and $42 million in net proceeds. The share issue diluted Telstra’s ownership in the merged group to 76.4%.

5
This merger was undertaken as the two entities undertake complementary services in providing mobile telecommunication products and services in Hong Kong. We believe the CSL New World Mobility Group will be able to leverage their strong brand recognition and common network. The merged entity will also create the largest wireless service provider in the Hong Kong market.
During fiscal 2006, our credit rating outlook was adjusted by Standard and Poors, and Moodys. The change was initiated as a result of the uncertain environment in which we are operating, reflected by the regulatory uncertainty and the speculation surrounding the further sale of shares in our Company. As a result, our current credit ratings are as follows:
Long term Short term Outlook Standard & Poors A A1 negative Moodys A2 P1 negative Fitch A+ F1 negative
Our financial condition has enabled us to execute partially our announced capital management program. During fiscal 2006, we returned $4,970 million to shareholders as ordinary and special dividend payments. In fiscal 2006, we paid two special dividends of 6 cents per share ($1,492 million) with our final dividend and interim dividend. We announced during the year that the third year of the capital management policy would not occur. Refer to the strategy section below for further details. We reported a strong free cash flow position, which enabled the company to pay increased dividends and fund the acquisition of a number of new entities. We continue to source cash through ongoing operating activities and through careful capital and cash management.
Our cash flow before financing activities (free cash flow) position remains strong despite declining to $4,550 million in the year from $5,194 million in the prior year. This decline was driven by higher levels of cash used in investing activities as we undertake our network and information technology platform transformation and a decline in operating performance.
Cash used in investing activities was $4,012 million, representing an increase of $246 million over the prior year. The increase is mainly attributable to capital expenditure to upgrade our telecommunications networks, eliminate components that are no longer useful and improve the systems used to operate our networks. Our investing expenditure also includes $312 million of deferred payments in relation to our purchase of the 3G radio access network assets from Hutchison Australia Pty Ltd in fiscal 2005.
Our cash used in financing activities was $5,399 million, resulting from the funding of dividend payments and the refinancing of our maturing debt, offset by net proceeds from borrowings received from a number of our private placements.
Investor return and other key ratios Our basic earnings per share decreased to 25.7 cents per share in fiscal 2006 from 34.7 cents per share in the prior year. The decrease was due to lower profit in fiscal 2006. We have declared a final fully franked dividend of 14 cents per ordinary share ($1,739 million), bringing declared dividends per share for fiscal 2006 to 34 cents per share. The prior year declared dividends amounted to 40 cents per share. The dividends paid in fiscal 2006 were 40 cents per share compared with dividends paid in fiscal 2005 of 33 cents per share. In addition to our dividends in fiscal 2005, we returned $750 million to shareholders through an off market share buy-back during fiscal 2005.

6
Other relevant measures of return include the following: • Return on average assets - 2006: 15.8% (2005: 20.6%) • Return on average equity - 2006: 24.2% (2005: 30.6%) The return on both average assets and average equity is lower in fiscal 2006 primarily due to lower profit as previously discussed. Strategy We are Australia’s largest telecommunications and information services company. We offer a full range of telecommunication products and services throughout Australia and various telecommunication services in certain overseas countries. During fiscal 2006, we announced our new strategic and operational focus to continually move forward as an Australian market leader in the telecommunications industry. This review was a blueprint for improving our long term performance by providing a solid platform to drive future growth and create operational efficiencies. Our vision is to streamline our processes to provide solutions that are simple and valued by our customers, which we believe will ultimately lead to the creation of long term value for our shareholders. Our strategy involves: • providing customers with integrated telecommunication services; • investing in systems and processes to remove complexity and cost from the business; • continually improving our operating performance in mobiles and broadband, as well as
accelerating opportunities in Sensis; • investing in new services and applications to differentiate us from our competitors; and • targeted investing in areas where we can create value for our shareholders. We intend to deliver our new strategy through the implementation of a one factory approach and market based management. The one factory approach involves bringing together the operations and management of our internal IT systems, removing duplication and complexity in our systems and implementing simpler and efficient processes and systems, which we believe will improve our operational efficiency and cost structure. Market based management involves us obtaining a better understanding of each of our respective customers’ unique segment needs, priorities and expectations. It is based on extensive market research, which we will utilise to ensure our processes and procedures meet our various customer requirements to ultimately provide them with better services. In addition, we currently face a series of business operating issues that we expect will impact our future results. These issues range from regulatory issues, including unconditioned local loop access pricing and operational separation, to the potential full sale of the Company. We are currently in the process of rebuilding, redirecting and transforming the Company. The next three to five years will see us concentrate on rebuilding the network, redirecting resources into next generation services, reshaping the business and segmentation of customers according to their needs. By streamlining our operations, while better satisfying the needs of our customers, we believe we can deliver the financial performance improvements expected by our shareholders. Although the transformation of our Company is at an early stage, current progress is encouraging. Our transformation has already resulted in our national 3GSM 850 network build being more than 60% complete. Savings have been achieved by consolidating office space, vacating existing leases and sourcing mobile devices through global supply-chain specialist, Brightstar. In addition, we have slowed the PSTN revenue decline in the second half of the year and increased the number of customers using three or more Telstra products. At the same time, we have significantly reduced our customers’ unsatisfied demand for ADSL broadband.

7
Our Fibre to the Node (FTTN) project is on hold, however we have devoted substantial time and resources in discussions with the ACCC to achieve regulation reform, including safeguards for shareholder investments. Until our actual costs are recognised and the ACCC’s regulatory practices change, we will not invest in a FTTN broadband network. We believe that the successful transformation of our Company will achieve the following: • simplified and integrated experience for our customers; • Telstra Bigpond to be Australia’s leading ISP and services entity; • Sensis to be Australia’s leading information resource; • our Company to have the leading wireless network with faster speeds and best in-building
coverage, as well as Australia’s largest IP network, providing customers with integrated telecommunications services; and
• operational and cost efficiencies. During fiscal 2006, we revised our capital management policy to not make the last payment of a special dividend. No decision with respect to the payment or funding of future ordinary dividends has been made. The Board will make these decisions in the normal cycle having regard to, among other factors, the Company’s earnings and cash flow, as well as regulatory decisions. Industry dynamics The Australian telecommunications industry is continually changing. We have seen the number of mobile handsets in the Australian market continue to grow, as well as the use of mobile services. Most households continue to maintain a basic access line, however PSTN products are increasingly being substituted by wireless products. Advances in technology continue to transform the telecommunications industry. In recent years, we have seen various new product offerings released to the market, including the provision of high-speed wireless services, 3G mobile services. Voice services over IP (VoIP) is another area of change for which the industry is preparing. We have successfully commissioned and commenced testing our next generation VoIP platform which we believe will offer value added broadband services to our customers in the future. We expect take up of this product to increase in future reporting periods, as the market becomes more aware of its performance capabilities. We aim to be at the forefront of providing leading edge telecommunication services to meet the demands of our customers. During fiscal 2006, we proposed the roll out of the new 3G 850 network. In addition to current services already experienced on existing networks, we believe future 3G 850 customers will enjoy many enhanced features, such as improved video calling services and faster broadband access speeds, in addition to better in-building coverage. The broadband sector is in a significant growth phase as the demand for high speed internet access accelerates. We have recently seen large increases in broadband subscribers and a steady fall in prices as providers compete for market share. We expect the broadband sector to continue its expansion through the provision of new innovative products. As telecommunications, computing and media technologies continue to converge, we are focused on enhancing our capabilities to provide new and innovative application and content services and to expand further into these converging markets. The challenge for telecommunications companies moving forward will be to continue maximising revenues from higher margin traditional products such as PSTN products, while managing the shift in customer demand to lower margin emerging products such as broadband. Overall operating margins are under constant pressure from the product mix change to lower margin products. However, as we build a software based cost efficient infrastructure, new products, applications and content can be delivered at low incremental costs to again provide good margins.

8
We continue to be at the forefront of these, and other technology advancements as we continue to devote substantial capital to upgrading and simplifying our telecommunications networks to meet customer demand, particularly for the new product and growth areas. We believe we are well positioned to focus on these areas of new customer demand by providing a broad range of innovative products with creative and competitive pricing structures. Sale of the Commonwealth’s remaining interest in Telstra The Commonwealth Government has passed legislation to enable the sale of its remaining interest in Telstra. The Government has stated that it is yet to decide about proceeding with a sale. This decision will include an assessment of whether the level of demand for the shares would allow a partial or full sale of the Commonwealth's remaining interest. Until this decision is made by the Government and announced, it is unclear how this may affect our capital structure, operations and corporate compliance obligations. Any sale by the Commonwealth of its remaining interest will require our management’s time and resources. Dividends
The directors have declared a fully franked final dividend of 14 cents per share ($1,739 million). The dividends will be franked at a tax rate of 30%. The record date for the final dividend will be 25 August 2006 with payment being made on 22 September 2006. Shares will trade excluding entitlement to the dividend on 21 August 2006. During fiscal 2006, the following dividends were paid:
Dividend Date declared Date paid Dividend per share Total dividend
Final dividend for the year ended 30 June 2005
11 August 2005 31 October 2005 14 cents franked to 100% $1,739 million
Special dividend for the year ended 30 June 2005
11 August 2005 31 October 2005 6 cents franked to 100% $746 million
Interim dividend for the year ended 30 June 2006
8 February 2006 24 March 2006 14 cents franked to 100% $1,739 million
Special dividend for the year ended 30 June 2006
8 February 2006 24 March 2006 6 cents franked to 100% $746 million
At present, it is expected that we will be able to fully frank declared dividends out of fiscal 2007 earnings. However, the directors can give no assurance as to the future level of dividends, or of the franking of these dividends. This is because our ability to frank dividends depends upon, among other factors, our earnings, Government legislation and our tax position.

9
Significant changes in the state of affairs
There have been no significant changes in the state of affairs of our Company during the financial year ended 30 June 2006, except for:
• we announced our new strategic and operational focus to continually move forward as an Australian market leader in the telecommunications industry. As part of this strategic review, we unveiled a blueprint for improving our long term performance; and
• we are involved in continuing discussions over the future regulatory environment impacting the Australian telecommunications industry in general and us in particular. The regulatory environment we operate in has a significant impact on our future performance. There are several key regulatory decisions, whether recently made or pending, which will shape the future of our Company. We are currently in discussions with the regulators, which we hope will advance the best interests of our shareholders, customers and the nation.
Likely developments and prospects
The directors believe, on reasonable grounds, that Telstra would be likely to be unreasonably prejudiced if the directors were to provide more information than there is in this report or the financial report about:
• the likely developments and future prospects of Telstra’s operations; or • the expected results of those operations in the future.
Events occurring after the end of the financial year
The directors are not aware of any matter or circumstance that has arisen since the end of the financial year that, in their opinion, has significantly affected or may significantly affect in future years Telstra’s operations, the results of those operations or the state of Telstra’s affairs; other than:
• on 31 July 2006, our 50% owned pay television joint venture FOXTEL entered into a new $600 million syndicated secured term loan facility to fund the refinancing of previous loan facilities (including the $550 million syndicated facility), and to enable it to meet future cash flow and expenditure requirements. The equity contribution deed (ECD) entered into by us and FOXTEL's other ultimate shareholders, News Corporation Limited and Publishing and Broadcasting Limited has been terminated. Under this arrangement, recourse to our controlled entity Telstra Media Pty Ltd, as a FOXTEL partner, is limited to the assets of the FOXTEL Partnerships.
Details about directors and executives
Changes to the directors of Telstra Corporation Limited during the financial year and up to the date of this report were:
• John E Fletcher resigned as director on 30 June 2006; • Peter J Willcox was appointed as director on 17 May 2006; • John D Zeglis was appointed director on 17 May 2006; • John T Ralph retired as director on 11 August 2005; • Anthony J Clark retired as director on 11 August 2005; • Solomon D Trujillo was appointed CEO and executive director on 1 July 2005; and • Zygmunt E Switkowski resigned as CEO and executive director on 1 July 2005.

10
Information about directors and senior executives is provided as follows and forms part of this report:
• names of directors and details of their qualifications, experience, special responsibilities and directorships of other listed companies are given on pages 14 to 19;
• number of Board and Committee meetings and attendance by directors at these meetings is provided on page 20;
• details of director and senior executive shareholdings in Telstra are shown on page 20; and
• details of director and senior executive remuneration is detailed in the remuneration report on pages 22 to 48.
Company secretary The qualifications, experience and responsibilities of our company secretary are provided on page 19 and forms part of this report. Directors’ and officers’ indemnity
Constitution
Our constitution provides for us to indemnify each officer to the maximum extent permitted by law for any liability incurred as an officer provided that:
• the liability is not owed to us or a related body corporate; • the liability is not for a pecuniary penalty or compensation order made by a Court
under the Corporations Act 2001; and • the liability does not arise out of conduct involving a lack of good faith.
Our constitution also provides for us to indemnify each officer, to the maximum extent permitted by law, for legal costs and expenses incurred in defending civil or criminal proceedings. If one of our officers or employees is asked by us to be a director or alternate director of a company which is not related to us, our constitution provides for us to indemnify the officer or employee out of our property for any liability he or she incurs. This indemnity only applies if the liability was incurred in the officer’s or employee’s capacity as a director of that other company. It is also subject to any corporate policy made by our CEO. Our constitution also allows us to indemnify employees and outside officers in some circumstances. The terms "officer", "employee" and "outside officer" are defined in our constitution. Deeds of indemnity in favour of directors, officers and employees
Telstra has also executed deeds of indemnity in favour of: • directors of the Telstra Entity (including past directors); • secretaries and executive officers of the Telstra Entity (other than Telstra Entity
directors) and directors, secretaries and executive officers of our wholly owned subsidiaries;
• directors, secretaries and executive officers of a related body corporate of the Telstra Entity (other than a wholly owned subsidiary) while the director, secretary or executive officer was also an employee of the Telstra Entity or a director or employee of a wholly owned subsidiary of the Telstra Entity (other than Telstra Entity directors); and
• employees of Telstra appointed to the boards of other companies as our nominees. Each of these deeds provides an indemnity on substantially the same terms as the indemnity provided in the constitution in favour of officers. The indemnity in favour of directors also gives directors a right of access to Board papers and requires Telstra to maintain insurance cover for the directors.

11
Additionally, Telstra has executed an indemnity in favour of employees (including executive officers other than directors) in respect of liabilities incurred in the formulation, entering into or carrying out, of a Telstra Sale Scheme (as defined in the Telstra Corporation Act 1991 (Cwth)). This indemnity would cover liabilities incurred by an employee in connection with the proposed sale by the Commonwealth of its remaining shareholding in Telstra. The indemnity is subject to an exclusion for liabilities arising out of conduct involving a lack of good faith. In April 2006, the Commonwealth Government executed a Deed of Indemnity in favour of the directors of Telstra to cover liabilities incurred by those directors in connection with a Telstra Sale Scheme (as defined in the Telstra Corporation Act 1991 (Cwth)). This indemnity is subject to certain limited exclusions described in the Deed. The Commonwealth also executed a similar indemnity in favour of “Telstra Executives” (as defined in the Deed). The class of “Telstra Executives” includes persons who are likely to be involved in enabling Telstra to assist the Commonwealth in relation to a Telstra Sale Scheme. Directors’ and officers’ insurance
Telstra maintains a directors' and officers' insurance policy that, subject to some exceptions, provides worldwide insurance cover to past, present or future directors, secretaries or executive officers of the Telstra Entity and its subsidiaries. Telstra has paid the premium for the policy. The directors' and officers' insurance policy prohibits disclosure of the premium payable under the policy and the nature of the liabilities insured. Environmental regulation and performance
Telstra’s operations are subject to some significant environmental regulation under Commonwealth, State and Territory law, particularly with regard to:
• the impact of the rollout of telecommunications infrastructure; • site contamination; and • waste management.
Telstra has established procedures to monitor and manage compliance with existing environmental regulations and new regulations as they come into force.
The directors are not aware of any significant breaches of environmental regulation during the financial year. Audit and non-audit services
The Auditor-General and Ernst & Young are authorised to perform all audit services, including an examination or review of the financial statements of the Company in accordance with the laws and rules of each jurisdiction in which filings are made for the purpose of expressing an opinion on such statements. The Audit Committee approves the provision of recurring audit services as part of the annual approval of the audit plan. Additional audit and non-audit services are pre-approved by the Audit Committee provided they fall within a defined list of services specified by the Audit Committee. Those additional audit and non-audit services that are not listed have to be specifically approved by the Audit Committee prior to the commencement of any engagement. In addition, all non-audit services with a value over $100,000 must be separately approved by the Audit Committee, even if the service is listed as a pre-approved service.

12
The Auditor-General does not provide non-audit services. Ernst & Young does provide non-audit services, but are specifically prohibited from performing any of the following services:
• bookkeeping services and other services related to preparing Telstra’s accounting records of financial statements;
• financial information system design and implementation services; • appraisal or valuation services, fairness opinions, or contribution in kind reports; • actuarial services; • internal audit services; • management function or human resources; • broker or dealer, investment adviser, or investment banking services; • taxation advice of a strategic or tax planning nature; and • legal services or expert services unrelated to the audit.
In addition, Ernst & Young may only provide non-audit services if the performance of the non-audit service will not cause the total annual revenue to Ernst & Young from non-audit work to exceed the aggregate annual amount of Ernst & Young’s audit fees. The Audit Committee will not approve the provision of a non-audit service by Ernst & Young if the provision of the service would compromise Ernst & Young’s independence. The provision of non-audit services by Ernst & Young is monitored by the Audit Committee via bi-annual reports to the Audit Committee. In addition, where engagements involve services from the defined list of services, these are reported to the Audit Committee at the following meeting. The Audit Committee expects the Auditor-General and requires Ernst & Young to submit annually to the Audit Committee a formal written report delineating all relationships between the Auditor-General, Ernst & Young and the Telstra Group. This includes:
• a listing of all audit and non-audit fees billed by the Auditor-General and Ernst & Young in the most recent fiscal year;
• a statement on whether the Auditor-General and Ernst & Young are satisfied that the provision of the audit and any non-audit services is compatible with auditor independence; and
• a statement regarding the Auditor General’s and Ernst & Young’s internal quality control procedures.
A copy of the independence of the auditor declaration is set out on page 21 and forms part of this report. The Audit Committee submits annually to the Board a formal written report detailing the nature and amount of any non-audit services rendered by Ernst & Young during the most recent fiscal year and an explanation of why the provision of these non-audit services is compatible with auditor independence. If applicable, the Audit Committee recommends that the Board take appropriate action in response to the Audit Committee’s report to satisfy itself of Ernst & Young’s independence. Details of amounts paid or payable to the auditor for non-audit services provided during the year are located in note 8 to our financial statements. For the reason set out above, the directors are satisfied that the provision of non-audit services by the external auditor during the year ended 30 June 2006 is compatible with the general standard of independence for auditors imposed by the Corporations Act 2001.

13
Rounding of amounts
The Telstra Entity is a company of the kind referred to in the Australian Securities and Investments Commission class order 98/100, dated 10 July 1998 and issued pursuant to section 341(1) of the Corporations Act 2001. As a result, amounts in this report and the accompanying financial report have been rounded to the nearest million dollars, except where otherwise indicated. This report is made in accordance with a resolution of the directors.
Donald McGauchie Chairman 10 August 2006
Solomon D Trujillo Chief Executive Officer and Executive Director 10 August 2006

14
Directors’ profiles As at 10 August 2006, our directors were as follows:
Name Age Position Year of initial appointment
Year last re-elected (1)
Donald G McGauchie ..... 56 Chairman 1998 2005 Solomon D Trujillo (2) .....
54 CEO and executive director 2005 -
Belinda J Hutchinson..... 53 Director 2001 2004 Catherine B Livingstone. 50 Director 2000 2005 Charles Macek................ 59 Director 2001 2004 John W Stocker .............. 61 Director 1996 2003 Peter J Willcox (3) ............ 60 Director 2006 - John D Zeglis (3) .............. 59 Director 2006 - (1) Other than the CEO, one third of directors are subject to re-election by rotation each year. (2) Solomon D Trujillo was appointed CEO and executive director on 1 July 2005. (3) In accordance with our constitution, Peter Willcox and John Zeglis have been appointed to fill interim positions and
will stand for election at the 2006 annual general meeting.
A brief biography for each of the directors as at 10 August 2006 is presented below: Donald G McGauchie AO Age 56 Chairman Mr McGauchie joined Telstra as a non-executive director in September 1998 and was appointed as chairman in July 2004. He is chairman of the Nomination Committee and is a member of the Remuneration Committee. Experience: Mr McGauchie has wide commercial experience within the food processing, commodity trading, finance and telecommunication sectors. He also has extensive public policy experience, having previously held several high-level advisory positions to the government including the Prime Minister’s Supermarket to Asia Council, the Foreign Affairs Council and the Trade Policy Advisory Council. Directorships of other listed companies - current: Director, James Hardie Industries NV (2003- ) and Nufarm Limited (2003- ). Directorships of listed companies - past three years: Deputy Chairman, Ridley Corporation Limited (1998-2004); Director, National Foods Limited (2000-2005) and Graincorp Limited (1999-2003). Other: Current: Director, Reserve Bank of Australia; Partner, C&E McGauchie - Terrick West Estate. Former: President of the National Farmers Federation (1994-1998); Chairman, Rural Finance Corporation (2003-2004). Awarded the Centenary Medal for service to Australian society through agriculture and business in 2003. Appointed an officer in the general division of the Order of Australia in 2004.
15
Solomon D Trujillo – BSc, BBus, MBA, Hon Doctor of Law Degrees (University of Wyoming, University of Colorado) Age 54 Mr Trujillo joined Telstra as CEO on 1 July 2005. Experience: Mr Trujillo has spent his career in the communications sector where he managed fixed line, wireless, broadband and directory businesses and served as a leader in the shift to market-based management. He most recently served as CEO of Orange SA, one of Europe’s leading wireless companies. Mr Trujillo was chairman and CEO of US West until he retired in July 2000 after the company’s merger with Qwest Communications. Directorships of other listed companies - current: Target Corporation (1994- ). Directorships of listed companies - past three years: Director, Electronic Data Systems Corporation (EDS) (2005-2005), PepsiCo Inc. (2000-2005), Orange SA (2001-2005) and Gannett Co Inc (2002-2006). Other: Current: Member, World Economic Forum (2005- ) and UCLA’s School of Public Affairs (2000- ); Trustee, Boston College; Director, Tomas Rivera Policy Institute (1991- ). Recipient, the Ronald H. Brown Corporate Bridge Builder Award in 1999 from President Clinton for his lifetime commitment as an advocate of workplace diversity. Belinda J Hutchinson – BEc, FCA Age 53 Ms Hutchinson joined Telstra as a non-executive director in November 2001. She has been a member of the Audit Committee since February 2005. Experience: Ms Hutchinson has had a long association with the banking industry and has been associated with Macquarie Bank since 1992 where she was an executive director. She was previously a vice president of Citibank Ltd. Directorships of other listed companies - current: Director, QBE Insurance Group Limited (1997- ) and Coles-Myer Ltd (2005- ). Directorships of listed companies - past three years: Director, TAB Limited (1997-2004) and Crane Group Limited (1997-2004). Other: Current: Director, St Vincent's and Mater Health Sydney Limited (2001- ); President, Library Council of New South Wales (2005- ) (member since 1997); and Consultant, Macquarie Bank Limited (1997- ). Former: Director of Energy Australia Limited (1997- 2005).

16
Catherine B Livingstone – BA (Hons), FCA, FTSE Age 50 Ms Livingstone joined Telstra as non-executive director in November 2000. She is a member of the Audit Committee and the Technology Committee. Experience: Ms Livingstone has a degree in accounting and has held several finance and general management roles predominantly in the medical devices sector. Ms Livingstone was the chief executive of Cochlear Limited (1994-2000). Directorships of other listed companies - current: Director, Macquarie Bank Limited (2003- ). Directorships of listed companies - past three years: Director, Goodman Fielder Ltd (2000-2003) and Rural Press Limited (2000-2003). Other: Current: Chairman, CSIRO (2001- ); Member, Business/Industry/Higher Education Collaboration Committee (BIHECC). Former: Chairman and Director Australian Business Foundation (2000-2005); Director, Sydney Institute (1998-2005); Former Member, Department of Accounting and Finance Advisory Board Macquarie University. Charles Macek - BEc, MAdmin, FAICD, FCPA, FAIM, SF Fin, FCA Age 59 Mr Macek joined Telstra as a non-executive director in November 2001. He is a member of the Audit Committee and Nomination Committee and is chairman of the Remuneration Committee. Experience: Mr Macek has a strong background in economics and has had a long association with the finance and investment industry. His former roles include 16 years as founding managing director and chief investment officer and subsequently chairman of County Investment Management Ltd. Directorships of other listed companies - current: Director, Wesfarmers Ltd (2001- ) and Living Cell Technologies Limited (2006- ). Directorships of listed companies - past three years: Chairman and Director, IOOF Holdings Ltd (2002-2003). Other: Current: Chairman, Sustainable Investment Research Institute Pty Ltd (2002- ) and Financial Reporting Council (FRC) (2003- ); Director, Williamson Community Leadership Program Limited (2004- ); Victorian Councillor, Australian Institute of Company Directors; Member, New Zealand Accounting Standards Review Board and Investment Committee of Unisuper Ltd. Former: Chairman, Centre for Eye Research Australia Ltd (1996-2003); Director of Famoice Technology Pty Ltd (2001-2004) and Vertex Capital Pty Ltd (2004-2006).
17
John W Stocker - AO, MB, BSc, BMedSc, PhD, FRACP, FTSE Age 61 Dr Stocker joined Telstra as a non-executive director in October 1996. He is chairman of the Audit Committee and Technology Committee. Experience: Dr Stocker has had a distinguished career in pharmaceutical research and extensive experience in management of research and development, and its commercialisation including in his role as chief scientist for the Commonwealth of Australia (1996-1999). Directorships of other listed companies - current: Chairman, Sigma Pharmaceuticals Ltd (2005- ); Director, Circadian Technologies Ltd (1996- ) and Nufarm Limited (1998- ). Directorships of listed companies - past three years: Chairman, Sigma Company Ltd (1998-2005); Director, Cambridge Antibody Technology Group plc (1995-2006). Other: Current: Principal, Foursight Associates Pty Ltd. Former: Chairman, Grape and Wine Research and Development Corporation (1997-2004). Peter J Willcox MA Age 60 Mr Willcox joined Telstra as a non-executive director on 17 May 2006. Mr Willcox holds a masters degree in physics from Cambridge University and following a 28 year career in the international petroleum industry was appointed as CEO of BHP Petroleum Limited, from 1986 to 1994. He has wide and diverse experience as a director and chairman of Australian and American listed companies. He is a fellow of the Australian Institute of Company Directors and sits on the advisory board of CVC Asia Pacific (Australia) Limited. Directorships of other listed companies - current: Chairman, Mayne Pharma (2005- ). Directorships of listed companies – past three years: Chairman, AMP Limited (2002- 2005) and Mayne Group Ltd (2002-2005). Other: Current: Director, CSIRO (2006- ). Former: Deputy Chairman, Energy Developments Ltd (1994-2002), Lend Lease Corporation (1994-2000); Director: J.H. Faulding & Co Ltd (1994-2001), James Hardie Industries Ltd (1994-2001), North Ltd (1994-2000), Schroders (Australia) Ltd (1994-1999), BHP Ltd (1988-1994), Woodside Petroleum (1986-1993), Tejas Gas Corporation (1987-1994) and Hamilton Oil Corporation (1987-1991).

18
John D Zeglis BSc Finance, JD Law Age 59 Mr Zeglis joined Telstra as a non-executive director on 17 May 2006. Mr Zeglis has a legal background, and became partner with the law firm Sidley & Austin in 1978. His qualifications include a BSc in finance from the University of Illinois, and a JD in law from Harvard. Mr Zeglis has had a long and distinguished career in the US telecommunications sector. He joined AT&T in 1984, and was elected as president of AT&T in 1998 and chairman and CEO of the AT&T Wireless Group in 1999. He continued as CEO of AT&T Wireless until retiring in November 2004 following the company’s sale to Cingular Wireless. Directorships of other listed companies - current: Director, Helmerich & Payne Corporation (1989- ). Directorships of listed companies – past three years: Director, Georgia Pacific Corporation (2001-2005). Other: Current: Director, AMX Corporation; (2005- ) and State Farm Automobile Insurance (2004- ). Former: Director, Sara Lee Corporation (1998-2000) and Illinois Power Company (1992-1996). During the year and through to the date of the report, the following directors resigned or retired: • John E Fletcher resigned as a director on 30 June 2006; • John T Ralph retired as a director on 11 August 2005; • Anthony J Clark retired as a director on 11 August 2005; and • Zygmunt E Switkowski resigned as a director on 1 July 2005.
A brief biography for each of the former directors is presented below: John E Fletcher - FCPA Mr Fletcher joined Telstra as a non-executive director in November 2000. He was a member of the Nomination Committee and the Remuneration Committee. John E Fletcher resigned as director on 30 June 2006. Mr Fletcher has had extensive experience in management in the transport industry and was formerly chief executive of Brambles Industries Ltd. Mr Fletcher was employed by Brambles for 27 years, initially in an accounting role and then in a series of operating and senior management positions before being appointed as chief executive in 1993. John T Ralph - AC, FCPA, FTSE, FAICD, FAIM, FAusIMM, Hon LLD (Melbourne & Queensland), DUniv (ACU) Mr Ralph joined Telstra as non-executive director and deputy chairman in October 1996. He was a member of the Audit Committee, Nomination Committee and Remuneration Committee. John Ralph retired as director on 11 August 2005. Mr Ralph has had over 50 years of experience in the mining and finance industries. Mr Ralph was formerly chief executive and managing director of CRA Limited. He has previously served on the boards of several of Australia’s largest companies including the Commonwealth Bank of Australia Limited, BHP Billiton Limited and Fosters Group Limited.

19
Anthony J Clark - AM, FCA, FAICD Mr Clark joined Telstra as a non-executive director in October 1996. He served on the Audit Committee until February 2005. Anthony Clark retired as director on 11 August 2005. Mr Clark has had extensive experience in the accounting field, specialising in audit and advisory services and is a fellow of the Institute of Chartered Accountants and a fellow of the Australian Institute of Company Directors. Mr Clark was formerly a managing partner KPMG NSW. Zygmunt E Switkowski - BSc (Hons), PhD, FAICD Mr Switkowski was appointed CEO and executive director from March 1999. Zygmunt Switkowski resigned as CEO and executive director on 1 July 2005. Formerly CEO of Optus Communications Ltd and chairman and managing director of Kodak (Australasia) Pty Ltd and the Business Council of Australia. Qualifications and experience of our company secretary Douglas C Gration - FCIS, BSc, LLB (Hons), GDip AppFin Age 40 Mr Gration was appointed company secretary of Telstra Corporation Limited in August 2001. Before joining Telstra, Mr Gration was a partner in a leading national law firm. He specialised in corporate finance and securities law, mergers and acquisitions and joint ventures and other commercial contracts, and played a key role in the T1 and T2 privatisations. Mr Gration also advised on telecommunication regulatory matters. Other roles previously held in Telstra include deputy group general counsel and Infrastructure Services and Wholesale general counsel.

20
Directors’ meetings
Each director attended the following Board and committee meetings during the year as a member of the Board or relevant committee:
Board Committees (5)
Audit Nominations Remuneration Technology a b a b a b a b a b D G McGauchie........... 13 13 - - 4 4 4 4 - - J T Ralph (1) ................. 1 1 1 1 2 2 2 2 - - A J Clark (1) .................. 1 1 - - - - - - - - S D Trujillo (2) .............. 13 13 - - - - - - - - J E Fletcher (3) ............. 13 13 - - 4 4 4 4 - - B J Hutchinson .......... 13 13 6 6 - - - - - - C B Livingstone ......... 13 13 6 6 - - - - 2 2 C Macek .................... 13 13 6 6 4 4 4 4 - - J W Stocker ................ 13 13 6 6 - - - - 2 2 P J Willcox (4) .............. 2 2 - - - - - - - - J D Zeglis (4) ............. 2 2 - - - - - - - -
Column a: number of meetings held while a member. Column b: number of meetings attended. (1) Retired from the Board on 11 August 2005. (2) Appointed CEO and executive director on 1 July 2005. (3) Resigned from the Board on 30 June 2006. (4) Appointed to the Board on 17 May 2006. (5) Committee meetings are open to all directors to attend in an ex officio capacity.
Director and senior executive shareholdings in Telstra
As at 10 August 2006:
Directors
Number of shares held
Direct interest
Indirect interest (1)
Total
Donald G McGauchie 1,866 55,775 57,641 Solomon D Trujillo - - - Belinda J Hutchinson 38,912 35,866 74,778 Catherine B Livingstone 11,637 23,051 34,688 Charles Macek - 48,576 48,576 John W Stocker 2,953 94,288 97,241 Peter J Willcox - 10,000 10,000 John D Zeglis - - -
(1) Shares in which the director does not have a relevant interest, including shares held by the director related entities, are excluded from indirect interest.
Senior executives
Number of shares held
Direct interest
Indirect interest (1)
Total
Bruce Akhurst 4,880 17,000 21,880 Deena Shiff 5,680 - 5,680 David Moffatt 147,900 - 147,900 Kate McKenzie - - - John Stanhope 57,221 - 57,221 David Thodey 63,462 800 64,262 Gregory Winn - - - (1) Shares in which the senior executive does not have a relevant interest, including shares held by related entities of the executive,
are excluded from indirect interest.

21
Auditor’s Independence Declaration to the directors of Telstra Corporation Limited In relation to my audit of the financial report of Telstra Group (comprising Telstra Corporation Limited and the entities it controlled during the year) for the financial year ended 30 June 2006, to the best of my knowledge and belief, there have been no contraventions of the auditor independence requirements of the Corporations Act 2001 or any applicable code of professional conduct.
Ian McPhee Auditor-General 10 August 2006 Canberra, Australia

Remuneration report
22
The Remuneration Report forms part of the Directors’ Report and is set out under the following headings:
CONTENTS REMUNERATION AT TELSTRA
The Remuneration Committee Remuneration policy Changes to the remuneration strategy
CEO AND SENIOR EXECUTIVES Remuneration strategy Remuneration structure Linking the remuneration structure to the business strategy Remuneration mix Fixed remuneration Short term incentive (STI) Long term incentive (LTI)
RELATIONSHIP BETWEEN REMUNERATION AND TELSTRA’S PERFORMANCE Defining “company performance”
DETAILS OF SENIOR EXECUTIVES’ REMUNERATION Contract arrangements Relocation costs associated with overseas senior executives
NON-EXECUTIVE DIRECTORS Remuneration policy and strategy Remuneration structure Retirement benefits Other benefits Details of non-executive directors’ remuneration
This report for the year ended 30 June 2006 was prepared by the directors in accordance with the Corporations Act 2001. Under AASB 124 “Related Party Disclosures” (AASB 124), we are required to disclose remuneration details for our “key management personnel” (KMP). In addition to the directors, our KMP also includes the Chief Operating Officer and the Group Managing Directors listed in Figure 17. For the remainder of this report the KMP (other than the directors) will collectively be referred to as senior executives.
REMUNERATION AT TELSTRA Telstra proactively manages executive and director remuneration arrangements to ensure that their remuneration is a key element supporting our business strategy by aligning reward to the achievement of strategic objectives. We also ensure that it is competitive in the markets we draw our talent from and that the needs of all stakeholders are taken into consideration when remuneration decisions are made.

Remuneration report
23
The Remuneration Committee
The policy, strategy and structure for the Board, CEO and senior executive remuneration is overseen and regularly reviewed by the Board’s Remuneration Committee.
The Telstra Board Remuneration Committee (Committee) is responsible for reviewing and recommending to the Board the remuneration policy, strategy and structure for Telstra’s Board, the CEO and senior executives. The Committee’s roles and responsibilities, composition and membership is detailed on our website. The Committee also has a responsibility to ensure that our remuneration strategy considers corporate governance principles and expectations of stakeholder bodies. Any decision made by the Committee concerning an individual executive’s remuneration is made without that executive being present.
Remuneration policy
The remuneration policy consists of principles that guide the Committee in its deliberations, and which should be taken into consideration when formulating the strategy and structure of remuneration.
The Committee is guided by the following principles when formulating remuneration strategy and structure. Senior executive remuneration should: Non-executive director remuneration should:
• reflect the size and scope of the role and be market competitive in order to attract and retain talent
• be competitive in domestic and global markets
• motivate executives to deliver short and long term business objectives
• be aligned with shareholder value creation
• be differentiated based on individual performance
• be distinguished from executive remuneration
• be fee based, not performance based
• be partly remunerated in the form of equity in order to align with the returns to shareholders
Changes to the remuneration strategy
In line with major changes to Telstra’s business strategy this fiscal year, we have reviewed and updated our remuneration structure.
During fiscal 2006 the Board approved a new business strategy for Telstra. The new strategy will transform the company over several years in order to meet the challenges of a competitive global market. With the new business strategy significantly changing the company’s commercial and operational focus, it was important to update the metrics used to determine incentive outcomes to give appropriate weight to Telstra’s new priorities. In parallel with the development of the business strategy, the Committee commissioned an extensive review of the remuneration strategy.

Remuneration report
24
The focus of the remuneration review was to advise on contemporary market practice, the relationship between fixed and variable remuneration and the measures which would drive remuneration outcomes in the context of a significant strategic realignment of the business. The aim was to reward the CEO and senior executives on the delivery of transformational and operational outcomes in line with the key elements of the new business strategy. An additional objective of the review was to link the successful delivery of the transformation to future shareholder wealth creation. Management, with input from an external remuneration consultant, formally presented the results of the review to the Committee in December 2005. The review concluded that the CEO and senior executive remuneration strategy would need to have increased flexibility in order to:
• focus on achieving long term transformation of the company while delivering on short term performance;
• reinforce and reward performance measures that will evolve with the company’s changing objectives;
• attract and retain world-class executive talent; and
• support a variety of employment arrangements and durations. Introduction of new performance measures
The three elements of Telstra’s remuneration structure – fixed remuneration, short term incentives (STI) and long term incentives (LTI) – complement each other and will support the execution of business strategy in both the short and long term. These elements are consistent with previous years’ incentive plans. However, new performance measures (which are discussed in detail later in this report) have been introduced to encourage executives to focus on key business outcomes and to ensure that reward payouts occur when the company and the individual achieve the transformational and operational goals set by the Board. Figure 1 illustrates how the remuneration strategy and structure are aligned to, and support, the business strategy through the use of performance measures.
Figure 1: Alignment of the business and remuneration strategies
3G – 850 Network
Broadband Marketshare
STI
Individual accountabilities
Cost Reduction
EBITDA
3G – 850 Wireless Network Broadband Marketshare
STI
Individual accountabilities
Cost Reduction
EBITDA
ROI
IT Transformation
Network Transformation
LTI
TSR Growth
Opex
Revenue CAGR
Return On Investment
IT Transformation
Network Transformation
LTI
Total Shareholder Return
Operating Expense
Revenue
KEY THEMES OF THE BUSINESS STRATEGY STRATEGIC OBJECTIVES MEASURED FISCAL 2006 REMUNERATION
•Transformation and integrationof the company
•Reduction of operating costs and improving profitability
•The need for new revenuestreams
•Transition of the network to thenext generation
•Deployment of systems thatsupport the future needs of the company
Incentives based on achievement ofstrategic objectives

Remuneration report
25
CEO AND SENIOR EXECUTIVES
Remuneration strategy
Our remuneration strategy for the CEO and senior executives includes performance measures that are aligned to the key elements of Telstra’s new business strategy.
The senior executive remuneration strategy has been repositioned to drive the delivery of the transformation milestones that have been outlined in Telstra’s business strategy. Over the next 3 – 5 years, the remuneration strategy will be based on performance measures that are strongly aligned to those transformation outcomes as well as on other traditional business measures. The weighting of performance measures is expected to evolve over time from initial weighting on transformation measures to:
• operational measures for the STI; and
• growth and return measures for the LTI.
Figure 2 shows the proportion of the STI and LTI that depends on transformation measures for fiscal 2006. It is also indicative of how the emphasis on the transformation measures will diminish progressively as our transformation milestones are achieved. (However, it is not intended to represent future weightings of remuneration elements.)
Figure 2: Remuneration structure that supports Telstra’s transformational goals
July2006
July2007
July2008
July2009
July2010
• Regular cash flow commensurate withmarket worth of role
• Position of individual within role based on
experience, capabilities and performanceFixed
Transformation GoalsTransformation Goals
LTI
• Includes transformational milestonesand operational measures
• Rewards annual corporate performance andindividual achievements
• Individual element based on achievement of individual performance objectives
• Rewards shareholder value creation andkey drivers of value over the long term
• Focus on transformational milestonesover the next 3 – 5 years
• Motivates collegiate behaviour
STI
LTI
Fixed
STI
Transformation Measures

Remuneration report
26
Remuneration structure
The remuneration structure ensures that rewards are linked to strategic outcomes.
When reviewing the structure and mix of the remuneration packages of the CEO and senior executives, the Committee takes into account:
• remuneration practices in other major corporations in Australia (in terms of both salary levels and the ratio between fixed and “at risk” components);
• remuneration practices of global corporations within our comparative peer group; and
• a range of macro-economic indicators used to determine likely movements in broad salary rates.
For fiscal 2006, the remuneration structure for the CEO and senior executives consisted of:
• fixed remuneration;
• short term incentive (“at risk”); and
• long term incentive (“at risk”).
Linking the remuneration structure to the business strategy
The main benefits of linking senior executives’ rewards to specific performance measures are to increase focus and understanding by senior executives of the key strategic objectives of the business and provide motivation by rewarding employees on strategy execution.
Figure 3 shows in detail how the remuneration structure is designed to satisfy the requirements of the new business strategy, by setting and monitoring specific performance measures for the various elements of remuneration. Ordinarily, the Committee considers, and recommends to the Board, the measures and targets for the incentive plans during the annual budget setting process. However, for fiscal 2006, the Committee considered the remuneration strategy in parallel with the strategic review of the company. The Committee recommended that the incentive measures should focus on the transformation through to fiscal 2010. The fiscal 2010 strategic targets outlined to shareholders in November 2005 were used as a starting point to determine the fiscal 2006 STI and LTI performance measures. To link the remuneration structure to business strategy, the Committee prioritised the business’ strategic objectives by considering:
• what could be measured;
• what objectives would have the greatest impact; and
• what aggregate of measures would best support the key themes of the strategy.

Remuneration report
27
At the end of each financial year, the Committee reviews the company’s audited financial results and the results of the other performance measures, and assesses performance against each measure to determine the percentage of STI and LTI that is payable. Measures are tracked by an internal project office and, where appropriate, the achievement against targets will be independently audited. Figure 3: Performance measures selected to ensure a focus on key business strategies
In the case of Bruce Akhurst the STI is measured against specific financial metrics for Sensis in lieu of the Telstra financial and transformational measures detailed above. Sensis EBIT contribution and Cashflow make up 80% of his STI and the remaining 20% is based on individual accountabilities.
To ensure the continued alignment of transformation objectives, the creation of value and executive reward, the Committee initiated a review of the linkage between the remuneration strategy and business strategy. Any changes to the remuneration strategy as a result of this review will be reported to shareholders.
Remuneration element
Performance measures
How is it measured? Link to business strategy
Company Financial EBITDA - Earnings before interest, tax,
depreciation, amortisation. To achieve earnings objective.
Cost Reduction Amount of accelerated cost savings. To identify and deliver near term operating cost saving benefits that enable investment in transformation initiatives.
3G – 850 Network The number of sites that are 3G equipped and receiving transmission.
To deliver on the wireless strategy that enables mobile revenue growth, reduces cost and optimises the mobile business.
Broadband marketshare
The increase in Telstra’s share of retail broadband customers.
To achieve an increase in Telstra’s retail broadband marketshare.
STI (Cash)
Individual accountabilities
The achievement of personal goals which include business unit specific targets.
To align the individual’s personal goals with the business’ goals.
Revenue Growth The year over year revenue growth rate over the periods – 3 and 5 years.
To drive the development of new revenue and overall growth.
Operating Expense The total operating expense growth rate over the periods – 3 and 5 years.
To drive cost control and restructure the cost base of the company.
IT Transformation milestones
The time taken to achieve a targeted reduction of Business Support Systems (BSS) and Operational Support Systems (OSS).
To reduce complexity, reduce cost and provide an enhanced customer experience by reducing the number of systems.
Network Transformation milestones
The time taken to achieve network simplification and build a new platform.
To simplify the network to reduce complexity and cost, while providing a new platform for revenue growth.
Return on Investment (ROI) over 3 years
EBIT over Average Investment (Average of Net Debt plus Shareholder Funds).
To measure the return gained from the financial investment in the transformational goals.
LTI (Performance
Rights)
Total Shareholder Return (TSR) Growth over 5 years
Absolute growth in share price and accumulated dividends from 19 August 2005.
To measure the value derived from execution of the business strategy.

Remuneration report
28
Remuneration mix
Executive remuneration is composed of both “fixed” and “at risk” elements.
The remuneration mix describes the ratio of the different components of an executive’s pay. To strengthen the link to company performance, the Board has determined that a significant proportion of the total remuneration for the CEO and senior executives should be “at risk” representing components that are awarded based on performance. This means senior executives can only earn significant rewards if pre-determined company measures and targets are achieved. The “at risk” components of a senior executive’s remuneration package are calculated by reference to that individual’s fixed remuneration. Figure 4 shows the remuneration mix based on the maximum level of reward for the CEO and senior executives. Figure 4: Telstra’s remuneration mix
0%
20%
40%
60%
80%
100%
CEO SeniorExecutives
CFO
Fixed Remuneration Maximum STI Maximum LTI
If the minimum performance level is not achieved, no STI or LTI will be awarded and the executive receives 100% of fixed remuneration and 0% of their “at risk” remuneration. The percentage of “at risk” pay increases with the increase in accountability.
Fixed remuneration
Fixed remuneration is in line with similar roles in the applicable market.
Fixed remuneration is made up of:
• base salary including salary sacrifice benefits and applicable fringe benefits tax; and
• superannuation.
The value of LTI granted. Performance targets must be met before any of this value vests to the executive over 3 and 5 years.
The maximum amount that could be payable should all STI targets be met.
20-24% 40%
37%
41%
33-38%
38-47%
30%
30%
22%

Remuneration report
29
Fixed remuneration is influenced by the scope of the role and the knowledge, skills and experience required of the position holder. To ensure remuneration is market competitive, the Committee takes into account local, home country and global market rates. In determining what market rates to use for comparison purposes the Committee assesses a range of factors including company size (based on market capitalisation), industry in which the comparative company operates and global footprint. For superannuation, in addition to mandatory contributions, the CEO and senior executives may contribute additional amounts, subject to legislative requirements. Fixed remuneration is reviewed annually as part of the company’s overall remuneration review process and is assessed against the company’s and the individual’s performance. For fiscal 2006, the CEO was responsible for reviewing and determining the remuneration of the company secretary. However, the remuneration policy described in this report in relation to the senior executives and the discussion of the relationship between that policy and our performance applies to the company secretary. The company secretary participates in the STI plan and the LTI plan on the terms set out in this report.
Short term incentive (STI)
The STI component delivers reward on achievement of annual performance targets.
The STI is an annual “at risk” component of remuneration for the CEO and senior executives. During fiscal 2006, the Committee ceased the Short Term Incentive Equity (STIE) Plan. As such the annual STI payment for fiscal 2006 is delivered in cash, compared with fiscal 2005 when the STI was delivered half in cash and half in equity instruments. The objective of the STI plan is to encourage executives to meet annual business objectives and their own individual performance targets.
How STI is calculated
The CEO and senior executives’ STI payment is based on their fixed remuneration, individual STI opportunity (explained below) and achievements against performance measures. This is illustrated in Figure 5. Figure 5: Calculating the STI payment
STI opportunity and performance levels required
Depending on the role they perform, each senior executive has an STI opportunity ranging from 100% - 140% of fixed remuneration where maximum performance is met. The maximum STI opportunity varies according to the role. As illustrated in Figure 6, each of the performance measures has three different levels of performance.
F ixed R emuneration
S T I opportunity %
P erformance agains t
meas ures
S T Ipaymentx =x

Remuneration report
30
Figure 6: STI opportunity for differing levels of performance
CEO Senior
Executives Level of performance (% of STI opportunity) Description (% of fixed remuneration)
Gateway (25%) The “gateway” level must be reached before any value can be attributed to each measure.
25% 25% - 35%
Target (50%) The “target” level represents challenging but achievable levels of performance.
50% 50% - 70%
Maximum (100%) Achievement of the “maximum” level requires significant performance above and beyond normal
expectations and will result in significant improvement in key operational areas.
100% 100% - 140%
The level of performance determines the level of payment against each weighted measure. Achieving the target level of performance on each measure therefore equates to 50% of an individual’s maximum STI payment.
The STI performance measures
Performance against specific measures is assessed before any individual’s STI payment can be determined. The individual accountabilities for the CEO are determined by the Board and that of the senior executives are determined by the CEO. All individual measures are strongly aligned to the individual’s contribution towards corporate and business unit objectives.
STI payment for the CEO
The CEO’s contract provides for an STI payment for fiscal 2006 of up to a maximum of $3 million, of which $1.5 million was paid on commencement of employment. The initial $1.5 million was paid subject to the successful delivery of the new business strategy and transformation plan for the company. This payment was disclosed in the 2005 Remuneration Report. The remaining maximum potential payment of $1.5 million will be paid subject to the CEO satisfying the performance measures described in Figure 3.
Long term incentive (LTI)
The LTI is the second “at risk” component of remuneration and it is delivered in the form of performance rights for fiscal 2006. Performance rights are the right to acquire a Telstra share at minimal cost to the employee ($1 exercise price per parcel of shares exercised on any single day) when specified performance measures are achieved. The performance rights are administered through the Telstra Growthshare Trust. In prior years the equity instruments allocated as part of the LTI plans included restricted shares, options, deferred shares and performance rights. The LTI plan supports the business strategy by aligning executive compensation with key performance measures and targets that support the transformation. The LTI is limited to the 220 most senior employees, as this group is responsible for leading the transformation and will drive the success of the business

Remuneration report
31
How performance rights are allocated
The CEO and senior executives receive an allocation of performance rights that is calculated as a percentage of their fixed remuneration. Figure 7: Calculating the allocation of performance rights
*The full market value of a Telstra share is used when we allocate performance rights (5 day volume weighted average share price). This differs from the accounting value under the executive remuneration table in Figure17, which reflects the amortised accounting valuation of these rights and any other LTI equity granted in previous years.
Vesting
The performance rights that the CEO and senior executives receive will vest depending upon the company’s achievement of the relevant performance measures. Performance rights that have vested means that the executive has a full interest in the right and is free to exercise the right at any time until the expiry date. The allocation, test and expiry dates are illustrated in Figure 8. Figure 8: Performance right timeline
The value of the LTI at vesting
The actual value to the executive of the LTI at vesting can be calculated using the formula in Figure 9. Figure 9: Determining the market value of performance rights at vesting dates
*This value is likely to be different from the values at allocation and the accounting values disclosed in the remuneration table in Figure 17.
The LTI performance measures
Similar to the STI plan, the LTI performance measures are also linked to the business strategy and transformation of the company. This approach ensures that any rewards derived from the LTI plan by the senior executives are consistent with the successful execution of the initiatives over a number of years. Successful execution of the initiatives should, in turn, drive sustainable increases in shareholder wealth. The measures will be assessed based on a scale of performance at 30 June 2008 and 30 June 2010. The vesting arrangements are explained in Figure 10.
Fixed remuneration
Maximum LTI (as a % of Fixed
Rem.)Share Price*
Number of rights
allocatedx ÷ =
0 1 2 3 4 5 6 7
Allocation
Performance period
Year 3 Test
Year 5 Test Expiry
Exercise period
Performance measure achieved
(%)
Number of rights
allocated
Number of rights that
vest
Market Value of shares at
vesting date*x = Value of LTI at vesting datex =

Remuneration report
32
Figure 10: LTI vesting arrangements for fiscal 2006
Year 3 Year 5
Target not achieved
• 25% of performance rights for Year 3 tranche lapses.
• The remaining 75% of performance rights will be added to the Year 5 tranche and may vest based on performance against the Year 5 performance scale.
• All unvested performance rights will lapse.
Target achieved but below Maximum
• The number of performance rights vest on a scale between Target and Maximum.
• Any performance rights that do not vest will be discounted by 25% and the balance added to the Year 5 tranche and may vest on the Year 5 performance scale for each measure.
• For the Year 5 tranche the number of performance rights vest on a scale between Target and Maximum.
• The carried forward Year 3 balance will be added to the Year 5 tranche and assessed against the Year 5 performance targets.
• Any performance rights that do not vest as a result of not reaching the Maximum of the Year 5 hurdle will lapse.
Maximum achieved
• All performance rights for the Year 3 tranche (up to 60% of the 2005 allocation) will vest if all maximum targets are achieved.
• All performance rights for the Year 5 tranche (up to 40% of the 2005 allocation), and any remaining Year 3 tranche, will vest if all maximum targets are achieved.
Exercising performance rights
A performance right can only be exercised (that is, a share can only be acquired by the executive) if the performance right vests. Once vested, the performance right can be exercised by the executive at any time up to 7 years from the grant date. Once the performance rights have been exercised the participant becomes the beneficial owner and is entitled to any dividend, bonus issue, return of capital or other distribution in respect of those shares. Restrictions on hedging The CEO and senior executives are restricted from entering into arrangements which effectively operate to limit the economic risk of their security holdings in shares allocated under the LTI plan during the period the shares are held in trust.
Lapsed performance rights
Where a performance right does not vest by year 5, because the performance measures have not been achieved, the right will lapse and no benefit will accrue to the executive. If the CEO or a senior executive:
• resigns and their performance rights are not yet exercisable, those rights will lapse;
• retires or ceases employment due to death or total permanent incapacity, and their performance rights are not yet exercisable, those rights will be exercisable if the relevant performance measure is met in accordance with the prescribed schedule;
• is made redundant, and their performance rights are not yet exercisable, the number of unvested rights is adjusted to reflect the executive’s service period and will be exercisable if the relevant performance measure is met in accordance with the prescribed schedule; or
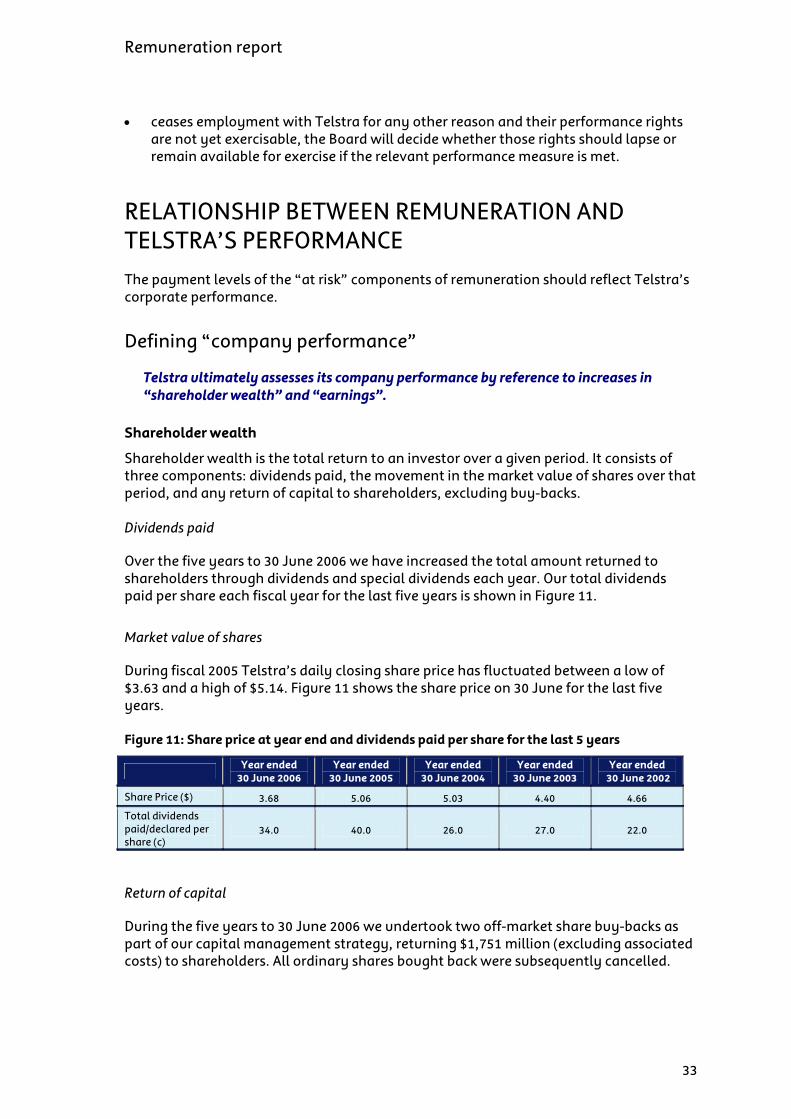
Remuneration report
33
• ceases employment with Telstra for any other reason and their performance rights are not yet exercisable, the Board will decide whether those rights should lapse or remain available for exercise if the relevant performance measure is met.
RELATIONSHIP BETWEEN REMUNERATION AND TELSTRA’S PERFORMANCE The payment levels of the “at risk” components of remuneration should reflect Telstra’s corporate performance.
Defining “company performance”
Telstra ultimately assesses its company performance by reference to increases in “shareholder wealth” and “earnings”.
Shareholder wealth
Shareholder wealth is the total return to an investor over a given period. It consists of three components: dividends paid, the movement in the market value of shares over that period, and any return of capital to shareholders, excluding buy-backs. Dividends paid
Over the five years to 30 June 2006 we have increased the total amount returned to shareholders through dividends and special dividends each year. Our total dividends paid per share each fiscal year for the last five years is shown in Figure 11.
Market value of shares
During fiscal 2005 Telstra’s daily closing share price has fluctuated between a low of $3.63 and a high of $5.14. Figure 11 shows the share price on 30 June for the last five years. Figure 11: Share price at year end and dividends paid per share for the last 5 years
Year ended
30 June 2006 Year ended
30 June 2005 Year ended
30 June 2004 Year ended
30 June 2003 Year ended
30 June 2002
Share Price ($) 3.68 5.06 5.03 4.40 4.66
Total dividends paid/declared per share (c)
34.0 40.0 26.0 27.0 22.0
Return of capital
During the five years to 30 June 2006 we undertook two off-market share buy-backs as part of our capital management strategy, returning $1,751 million (excluding associated costs) to shareholders. All ordinary shares bought back were subsequently cancelled.
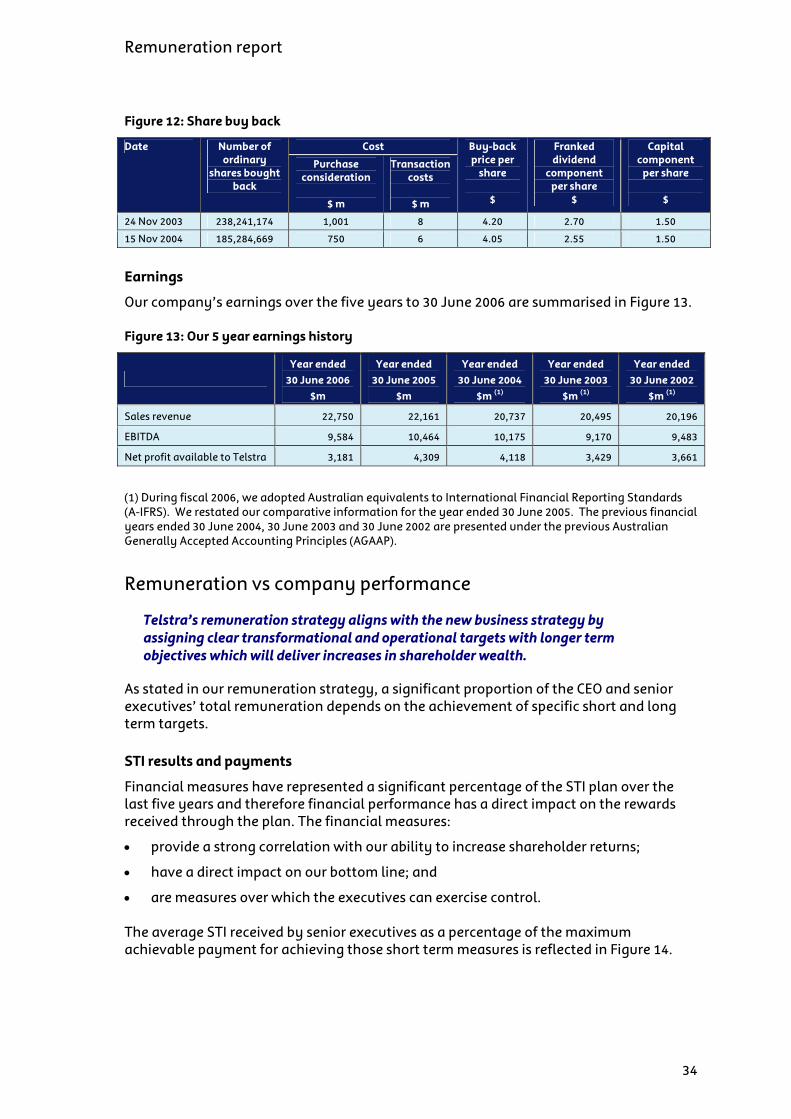
Remuneration report
34
Figure 12: Share buy back
Cost Date Number of ordinary
shares bought back
Purchase consideration
$ m
Transaction costs
$ m
Buy-back price per
share
$
Franked dividend
component per share
$
Capital component
per share
$
24 Nov 2003 238,241,174 1,001 8 4.20 2.70 1.50
15 Nov 2004 185,284,669 750 6 4.05 2.55 1.50
Earnings
Our company’s earnings over the five years to 30 June 2006 are summarised in Figure 13. Figure 13: Our 5 year earnings history
Year ended
30 June 2006 $m
Year ended 30 June 2005
$m
Year ended 30 June 2004
$m (1)
Year ended 30 June 2003
$m (1)
Year ended 30 June 2002
$m (1)
Sales revenue 22,750 22,161 20,737 20,495 20,196
EBITDA 9,584 10,464 10,175 9,170 9,483
Net profit available to Telstra 3,181 4,309 4,118 3,429 3,661
(1) During fiscal 2006, we adopted Australian equivalents to International Financial Reporting Standards (A-IFRS). We restated our comparative information for the year ended 30 June 2005. The previous financial years ended 30 June 2004, 30 June 2003 and 30 June 2002 are presented under the previous Australian Generally Accepted Accounting Principles (AGAAP).
Remuneration vs company performance
Telstra’s remuneration strategy aligns with the new business strategy by assigning clear transformational and operational targets with longer term objectives which will deliver increases in shareholder wealth.
As stated in our remuneration strategy, a significant proportion of the CEO and senior executives’ total remuneration depends on the achievement of specific short and long term targets.
STI results and payments
Financial measures have represented a significant percentage of the STI plan over the last five years and therefore financial performance has a direct impact on the rewards received through the plan. The financial measures:
• provide a strong correlation with our ability to increase shareholder returns;
• have a direct impact on our bottom line; and
• are measures over which the executives can exercise control. The average STI received by senior executives as a percentage of the maximum achievable payment for achieving those short term measures is reflected in Figure 14.

Remuneration report
35
Figure 14: Average STI payment as a % of maximum payment
Fiscal 2006
Fiscal 2005
Fiscal 2004
Fiscal 2003
Fiscal 2002
STI received 73.8% 54.6% (1) 31.4% 41.1% 57.6%
(1). This includes both the cash and equity components for fiscal 2005. While the total equity component is included in determining the above percentage, the value of the rights to Telstra shares granted in fiscal 2005 will be reflected in remuneration over the following 3 years as the shares vest over their performance period.
The above calculation is made by aggregating the actual STI payments to the CEO and senior executives for the financial year and dividing that by the aggregate maximum achievable payments for those same executives. The result is then expressed as a percentage of the maximum achievable STI payment. Relationship between company performance and STI payments
Figure 15 demonstrates the relationship between the company’s performance in the form of EBITDA and the percentage of STI payments that were made in each fiscal year. Figure 15: Relationship between company performance (EBITDA) and STI payments
$0
$2,000
$4,000
$6,000
$8,000
$10,000
$12,000
2002 2003 2004 2005 2006
EBITDA ($m) STI Payment (%)
100%
60%
20%
LTI results and payments
Any LTI awarded to an executive is required to be reported in accordance with International Financial Reporting Standards (IFRS). This requires a value to be attributed to the LTI equity granted before vesting has occurred. That value is then amortised over the vesting period (ie the five-year performance period for fiscal 2006 allocations). However, as vesting of any equity allocated under the LTI plans is subject to a range of internal and external performance measures, senior executives may or may not ultimately derive any value from these equity instruments.
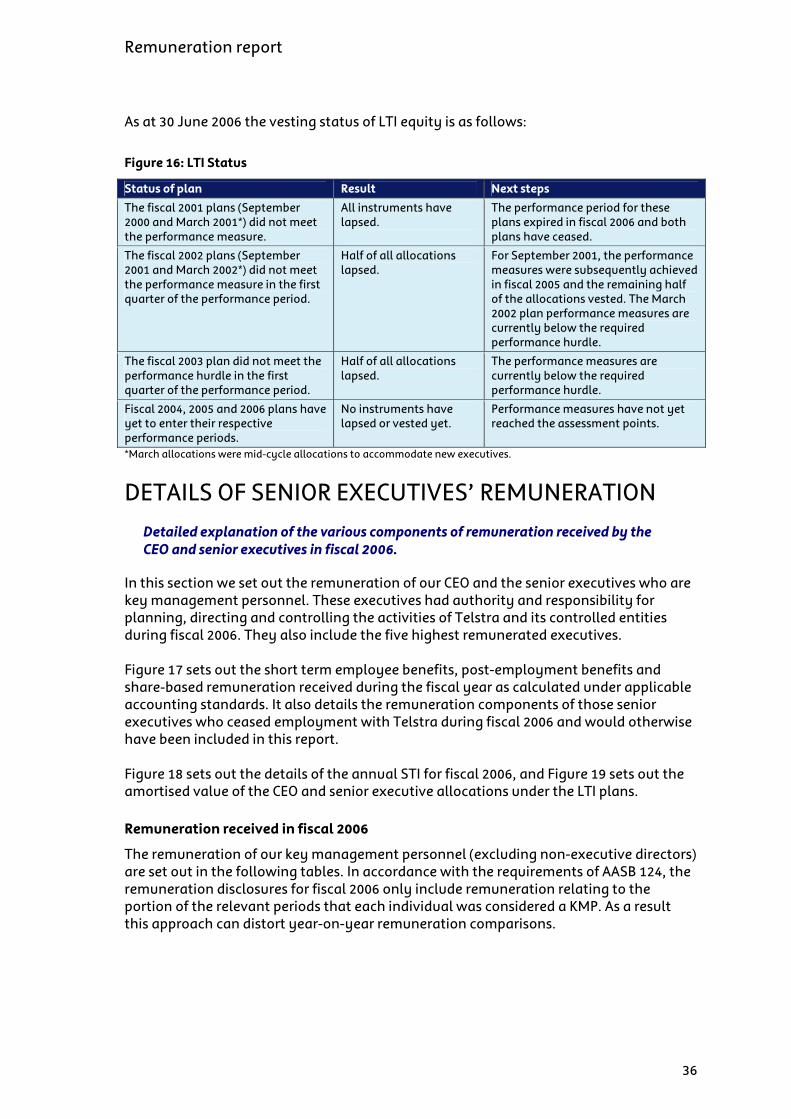
Remuneration report
36
As at 30 June 2006 the vesting status of LTI equity is as follows:
Figure 16: LTI Status
Status of plan Result Next steps
The fiscal 2001 plans (September 2000 and March 2001*) did not meet the performance measure.
All instruments have lapsed.
The performance period for these plans expired in fiscal 2006 and both plans have ceased.
The fiscal 2002 plans (September 2001 and March 2002*) did not meet the performance measure in the first quarter of the performance period.
Half of all allocations lapsed.
For September 2001, the performance measures were subsequently achieved in fiscal 2005 and the remaining half of the allocations vested. The March 2002 plan performance measures are currently below the required performance hurdle.
The fiscal 2003 plan did not meet the performance hurdle in the first quarter of the performance period.
Half of all allocations lapsed.
The performance measures are currently below the required performance hurdle.
Fiscal 2004, 2005 and 2006 plans have yet to enter their respective performance periods.
No instruments have lapsed or vested yet.
Performance measures have not yet reached the assessment points.
*March allocations were mid-cycle allocations to accommodate new executives.
DETAILS OF SENIOR EXECUTIVES’ REMUNERATION
Detailed explanation of the various components of remuneration received by the CEO and senior executives in fiscal 2006.
In this section we set out the remuneration of our CEO and the senior executives who are key management personnel. These executives had authority and responsibility for planning, directing and controlling the activities of Telstra and its controlled entities during fiscal 2006. They also include the five highest remunerated executives. Figure 17 sets out the short term employee benefits, post-employment benefits and share-based remuneration received during the fiscal year as calculated under applicable accounting standards. It also details the remuneration components of those senior executives who ceased employment with Telstra during fiscal 2006 and would otherwise have been included in this report. Figure 18 sets out the details of the annual STI for fiscal 2006, and Figure 19 sets out the amortised value of the CEO and senior executive allocations under the LTI plans.
Remuneration received in fiscal 2006
The remuneration of our key management personnel (excluding non-executive directors) are set out in the following tables. In accordance with the requirements of AASB 124, the remuneration disclosures for fiscal 2006 only include remuneration relating to the portion of the relevant periods that each individual was considered a KMP. As a result this approach can distort year-on-year remuneration comparisons.

Remuneration report
37
Termination payments to Dr Switkowski in fiscal 2006
As specified in the remuneration report for fiscal 2005 Dr Switkowski ceased employment with the company on 1 July 2005 and was entitled to receive termination payments in accordance with his employment contract including:
a termination payment of 12 months fixed remuneration - $2,092,000; and accrued annual and long service leave - $1,059,526.42.
These payments have been aggregated and appear in Figure 17 under “Termination benefits” in accordance with the prescribed accounting standards. Dr Switkowski also received a payment of $1,961,000 under the 2004/05 STI plan. This payment is not included in Figure 17 as it has previously been disclosed in the remuneration report for fiscal 2005. In addition, and consistent with last years remuneration report, Figure 21 shows Dr Switkowski’s retained allocations of equity under the Deferred Remuneration and LTI plans.

Remuneration report
38
Figure 17: Senior executives’ remuneration
Short term employee benefits Post-employment benefits
Termination benefits
Other long term benefits
Equity settled share-based payments
Name Salary and Fees
(1)
Short term
Incentives (2)
Non-monetary benefits (3)
Other (4) Superannuation (5)
Termination benefits
Accrued long
service leave
Short term incentive shares (6)
Deferred shares (7)
Other equity (8)
Total
($)
Solomon Trujillo – Chief Executive Officer
Commenced 1 July 2005
2,987,861 2,581,200 - 1,745,011 1,012,139 - 75,000 - - 309,305 8,710,516
Bruce Akhurst -
Chief Executive Officer, Sensis Ongoing 984,974 1,519,035 11,740 - 188,026 - 29,325 276,443 115,592 650,036 3,775,171
Kate McKenzie - Group Managing Director, Telstra Wholesale
Appointed GMD 16 Jan
2006
223,280 180,950 - - 20,787 - 6,026 22,067 - 30,871 483,981
David Moffatt - Group Managing Director, Telstra Consumer & Marketing
Ongoing 876,970 1,019,991 18,138 - 316,030 - 29,825 131,095 129,101 779,461 3,300,611
Deena Shiff - Group Managing Director, Telstra Business
Ongoing 645,857 768,951 6,062 - 116,643 - 20,000 155,829 37,438 214,391 1,965,171
John Stanhope - CFO and Group Managing Director, Finance & Administration
Ongoing 919,499 655,412 9,668 - 101,001 - 25,825 126,792 76,968 335,804 2,250,969
David Thodey - Group Managing Director, Telstra Business & Government
Ongoing 1,031,086 926,798 8,248 - 52,914 - 27,100 108,869 105,198 560,789 2,821,002
Gregory Winn – Chief Operating Officer
Commenced 11 Aug 2005
1,280,944 1,408,918 1,685 1,101,907 10,814 - 32,178 - - - 3,836,446
SUB-TOTAL
8,950,471 9,061,255 55,541 2,846,918 1,818,354 - 245,279 821,095 464,297 2,880,657 27,143,867
Salary and Fees: Includes salary, salary sacrificed benefits (other than superannuation), leave provisions and fringe benefits tax
Short Term Incentives: Includes annual bonuses payable in relation to fiscal 2006
Non-monetary benefits: Such as the value of goods and services provided as well as expatriate benefits including medical insurance, housing, private air travel
Other equity: Performance rights, restricted shares & options granted under Telstra’s LTI plans. This includes amounts accrued for current and prior year LTI grants

Remuneration report
39
Short term employee benefits Post-
employment
benefits
Termination benefits
Other long term benefits
Equity settled share-based payments
Name Salary and Fees
(1)
Short term
Incentives (2)
Non-monetary benefits (3)
Other (4) Superannuation (5)
Termination benefits
Accrued long
service leave
Short term incentive shares (6)
Deferred shares (7)
Other equity (8)
Total
($)
Past Employees
Zygmunt Switkowski Ceased 1 July 2005
5,451 - 35 - 281 3,151,526 (9) - - 491,049 (10)
4,516 (11)
3,652,858
SUB-TOTAL
5,451 - 35 - 281 3,151,526 - - 491,049 4,516
3,652,858
TOTAL
8,955,922 9,061,255 55,576 2,846,918 1,818,635 3,151,526 245,279 821,095 955,346 2,885,173 30,796,725
(1) Includes salary, salary sacrifice benefits (excluding salary sacrifice superannuation which is included under Superannuation) and fringe benefits tax. (2) Short term incentive relates to performance in fiscal 2006 and is based on actual performance for Telstra and the individual. (3) Includes the benefit of interest-free loans under TESOP97 and TESOP99, the value of personal home security services provided by Telstra and the value of the personal use of products and services related to Telstra employment. (4) Includes payments made to executives on commencement of employment with Telstra and relocation payments made in accordance with their relocation agreement and which are classified as remuneration under the accounting
standards. (5) Represents company contributions to superannuation as well as any additional superannuation contribution made through salary sacrifice by executives. (6) This represents the value of Short Term Incentive Shares allocated under the 2004/05 STI Equity plan whereby 50% of the STI payment was provided as shares to be distributed over 3 years at 12 month intervals. The values shown
represent the annualised value for fiscal 2006 in accordance with the relevant accounting standards. (7) The value included in deferred shares relates to the current year amortised value of vested and unvested shares issued in fiscal 2003 and fiscal 2004 under the Deferred Remuneration Plan. The values shown represent the annualised
value for fiscal 2006 in accordance with the relevant accounting standards (8) The value represents the annualised value of restricted shares, performance rights and options as detailed in figure 21. The executive only receives value if the performance hurdles are met. (9) Includes payments made on cessation of employment with Telstra in accordance with his employment contract. The payments include unused annual and long service leave and an eligible termination payment equal to 12 months
fixed remuneration. (10) The value represents the remaining amortised value of deferred shares which has been brought forward due to the early vesting of Deferred Shares following separation from Telstra. (11) The value represents the pro-rated amortised value of restricted shares, options and performance rights following Dr Switkowski’s separation from Telstra on 1 July 2005.

Remuneration report
40
Figure 18: STI for fiscal 2006
Name Maximum potential STI
($)
Actual STI
($)
% of the maximum potential
Solomon Trujillo 3,000,000* 2,581,200 86.0%
Bruce Akhurst 1,642,200 1,519,035 92.5%
Kate McKenzie 241,041 180,950 75.1%
David Moffatt 1,670,200 1,019,991 61.1%
Deena Shiff 1,120,000 768,951 68.7%
John Stanhope 1,055,294 655,412 62.1%
David Thodey 1,517,600 926,798 61.1%
Gregory Winn 2,030,000 1,408,918 69.4%
* $1,500,000 for strategic plan & $1,500,000 based on fiscal 2006 performance measures.
Tax Equalisation of foreign earned income
As prefaced in their employment contracts, Mr Trujillo and Mr Winn received re-imbursement for the additional personal income tax payable due to a double taxing in Australia and the United States as a result of the international taxation rules covering foreign earned income. This only applies for fiscal 2006 as changes to the international taxation provisions come into effect on 1 July 2006 and no further payments will be required.
Equity valuations
Figure 19 provides the amortised accounting value of all LTI equity instruments, including allocations of equity made from fiscal 2001 – 2006. The senior executives have not received any monetary value from any of these equity grants apart from the September 2001 Performance Rights plan and the September 2002 Deferred Share plan (see Figure 20), either because the LTI performance measures were not satisfied during the performance period or the performance period is continuing. The value attributed to the unvested instruments allocated on 8 September 2000 and 16 March 2001 only reflects the notional value until 8 September 2005 and 16 March 2006, respectively, when they lapsed. Where allocations have been made to the CEO and senior executives for fiscal 2002, 2003, 2004, 2005 and 2006 and have not yet vested, the CEO and senior executives may or may not derive any value from these allocations as they are still subject to performance measures and the performance period has not yet expired.
The minimum value of the STI may be $0 where the performance measures fail to meet the specified threshold levels.
Where the actual STI payment is less than the maximum potential, (eg achieved performance was less than maximum performance level) the difference is forfeited and does not become payable in subsequent years.

Remuneration report
41
Figure 19: Amortised accounting value of all LTI equity for fiscal 2006
Amortised value of LTI equity allocations (1) (2)
Total
Options
($)
Performance rights (3)
($)
Restricted shares
($)
($) Solomon Trujillo - 309,305 - 309,305 Bruce Akhurst 290,185 354,513 5,338 650,036 Kate McKenzie - 30,871 - 30,871 David Moffatt 367,050 391,010 21,401 779,461 Deena Shiff 82,016 131,691 684 214,391 John Stanhope 113,080 220,808 1,916 335,804 David Thodey 241,368 319,421 - 560,789 Gregory Winn - - - - Zygmunt Switkowski (4) 1,743 2,737 36 4,516
(1) The value of each instrument is calculated by applying option valuation methodologies as described in note 31 to the financial statements and is then amortised over the relevant vesting period. The values included in the table relate to the current year amortised value of all LTI instruments detailed as other equity in the remuneration table. The valuations used in current year disclosures are based on the same underlying assumptions as the previous year. Please refer to note 31 for details on our employee share plans.
(2) Where a vesting scale is used, the table reflects the maximum achievable allocation. (3) The September 2002 plan failed to satisfy the performance measure in the first quarter of the performance period. In accordance with
the terms of the plan half the maximum potential allocation of performance rights lapsed on 6 December 2005. Although an accounting value is recorded above, the executives received no value from this plan.
(4) This represents the pro-rated amortised value of LTI instruments up to date of separation in accordance with accounting standards. These equity instruments are still subject to meeting performance hurdles and Dr Switkowski may or may not derive any value from these instruments.
Outstanding equity-based instruments
The accounting value and actual number of the CEO and senior executives’ performance rights, restricted shares and options that were granted, exercised and lapsed in fiscal 2006 are set out in Figure 20 and Figure 21. As the values shown in Figure 20 represent the accounting value, the executive may not have actually received these amounts. The value of lapsed instruments in Figure 20 is based on the accounting value. This value is included to address our reporting obligations only. Where these instruments lapse, there is no benefit at all to the executive, and therefore no transfer of any equity or equity-related instrument. All instruments that have lapsed were subjected to the external performance measure of Total Shareholder Return (TSR).
Figure 20: Value of equity instruments granted, exercised and lapsed in fiscal 2006
Granted during period (1) Exercised
($)
Lapsed
($)
Aggregate of rights granted, exercised
and lapsed ($)
($)
% of Total Remuneration
(2)
Solomon Trujillo 2,482,011 28.5% - - 2,482,011
Bruce Akhurst 436,714 11.6% - - 436,714
Kate McKenzie 164,838 34.1% - - 164,838
David Moffatt 444,159 13.5% - - 444,159
Deena Shiff 297,846 15.2% - - 297,846
John Stanhope 384,589 17.1% - - 384,589
David Thodey 403,578 14.3% - - 403,578
Gregory Winn - - - - -
Zygmunt Switkowski - - - - -
(1) This represents the accounting value at grant date of performance rights granted in fiscal 2006.
(2) Total Remuneration is the sum of short term benefits, post employment benefits and share based payments detailed in Figure 19.

Remuneration report
42
The actual number of LTI instruments that were granted, exercised and lapsed in fiscal 2006 is set out in Figure 21. Of the performance rights allocated in fiscal 2006, 100% of the allocations were granted and none were forfeited, lapsed or vested during fiscal 2006. However, all unvested equity instruments may lapse in future years if the performance measures are not satisfied. Figure 21: Number of equity-based instruments – granted, vested, exercised and lapsed Instrument Balance at 1
July 2005 Granted during period (1)
Exercised during period
Lapsed during period (2)
Balance at 30 June 2006 (3)
Vested but not exercised during period (4)
Solomon Trujillo Performance Rights - 836,821 - - 836,821 - Performance Rights 473,600 147,240 59,000 66,900 494,940 - Restricted shares 39,000 - - 39,000 - - Options 805,000 - - 188,000 617,000 - Deferred shares 135,300 - 66,900 - 68,400 -
Bruce Akhurst
Incentive shares - 120,967 - - 120,967 -
Performance Rights 36,000 55,576 - - 91,576 - Restricted shares - - - - - - Options - - - - - - Deferred shares - - - - - -
Kate McKenzie
Incentive shares - 18,905 - - 18,905 -
Performance Rights 521,600 149,750 71,000 76,300 524,050 - Restricted shares 40,000 - - 40,000 - - Options 890,000 - - 150,000 740,000 - Deferred shares 152,400 - 76,300 - 76,100 -
David Moffatt
Incentive shares - 57,365 - - 57,365 -
Performance Rights 151,600 100,420 17,000 19,800 215,220 Restricted shares 5,000 - - 5,000 - - Options 202,200 - - 24,200 178,000 - Deferred shares 42,300 - 19,800 - 22,500 -
Deena Shiff
Incentive shares - 68,188 - - 68,188 -
Performance Rights 290,000 129,666 23,000 23,800 372,866 - Restricted shares 14,000 - - 14,000 - - Options 310,000 - - 69,000 241,000 - Deferred shares 73,200 - 23,800 - 49,400 -
John Stanhope
Incentive shares - 55,482 - - 55,482 -
Performance Rights 427,200 136,068 51,000 59,000 453,268 - Restricted shares - - - - - - Options 534,000 - - - 534,000 - Deferred shares 121,600 - - - 121,600 59,000
David Thodey
Incentive shares - 47,639 - - 47,639 - Greg Winn - - - - - - -
Performance Rights 1,643,600 - - - 1,643,600 - Restricted shares 96,000 - - - 96,000 - Options 1,810,000 - - - 1,810,000 -
Zygmunt Switkowski
Deferred shares 500,700 - - - 500,700 -
(1) Instruments granted during fiscal 2006 relate to the annual LTI plan for fiscal 2006 and the STI plan for fiscal 2005.
(2) No equity instruments granted during fiscal 2006 lapsed in fiscal 2006.
(3) This represents the number of vested and unvested equity instruments which have not been exercised or lapsed as at 30 June 2006, or in the case of Dr Switkowski, the date of cessation with Telstra.
(4) The number of instruments that vested during fiscal 2006 relate to the September 2002 Deferred Shares and had not been exercised at 30 June 2006.
Contract arrangements
The key terms and conditions for the CEO and senior executive service contracts are set out in Figure 22. A contract typically outlines the components of remuneration paid to the executive but does not prescribe how remuneration levels are to be modified from year to year.

Remuneration report
43
Generally, contracts can be terminated by either the company or senior executive providing 6 months notice. Upon notice being given Telstra can require the executive to remain employed by Telstra for the notice period or terminate employment immediately by providing payment in lieu of notice. Figure 22: Summary of contract arrangements for CEO and senior executives
Name Term of agreement
Fixed remuneration
at 30 June 2006
Additional conditions
Notice Period (1)
Termination payment (2)
Solomon Trujillo Ongoing $3,000,000 nil 30 days 12 months (3)
Bruce Akhurst Ongoing $1,173,000 nil 6 months 12 months
Kate McKenzie Ongoing $530,000 nil 6 months 12 months
David Moffatt Ongoing $1,193,000 nil 6 months 12 months
Deena Shiff Ongoing $800,000 nil 6 months 12 months
John Stanhope Ongoing $1,033,000 nil 6 months 12 months
David Thodey Ongoing $1,084,000 nil 6 months 12 months
Gregory Winn 11 August 2005 to 10 August
2007(3)
$1,450,000 $500,000 sign on bonus paid 12
Sept 2005. Contract
completion payments (4)
3 months 6 months + pro-rata at target STI + pro-
rata contract completion payment
(where pro-rata performance met)
Zygmunt Switkowski
1 September 2003 to 31
December 2007
$2,092,000 nil 6 months 12 months
(1) Upon notice being given Telstra can require the executive to work through the notice period or terminate employment immediately by providing payment in lieu of notice.
(2) Payment is calculated on fixed remuneration as at date of termination. There will be no payment if termination is a result of serious misconduct or redundancy (in which case Telstra’s redundancy policy applies).
(3) A 24 month termination payment applied where Mr Trujillo’s employment was terminated in the first 12 months. As this period has now expired the standard 12 month termination payment will apply.
(4) Where both parties mutually agree, the contract can be extended by 12 months until 8 August 2008. Where extended, and termination occurs between 2-3 years of employment, Mr. Winn is paid the lesser of: remaining fixed remuneration to completion or 6 months fixed remuneration and pro-rata 3rd year contract completion payment (where pro-rata performance is met).
(5) Contract completion payments are in lieu of LTI participation (due to fixed term contract). Payment of up to $1.8m subject to performance against pre-determined measures. Where contract is extended an additional contract completion payment of $500,000 is available.
Relocation costs associated with overseas senior executives
During the year the Board implemented significant changes to the executive management team. In addition to Solomon Trujillo joining Telstra as the Chief Executive Officer, a number of key executives were recruited to drive the major transformational changes required under the new business strategy. Where executives have been recruited from overseas, appropriate reward to secure their employment was negotiated. This can include overseas relocation benefits in accordance with our relocation policies or the executives’ contract of employment.

Remuneration report
44
The range of benefits and services provided to these senior executives under those arrangements may include:
• travel to Australia for themselves and their immediate family on commencement;
• a defined number of round-trip air tickets to their place of origin for themselves and their family;
• furniture storage and removal costs;
• rental assistance while in Australia for an initial period of time;
• a relocation allowance to cover incidental and miscellaneous expenses;
• health insurance;
• tax advice; and
• tax equalisation of foreign earned income.
NON-EXECUTIVE DIRECTORS
Remuneration policy and strategy
In order to maintain their independence and impartiality, non-executive directors are remunerated with fees which are not linked to company performance. The total fee pool is approved by shareholders.
Our non-executive directors are remunerated in accordance with our constitution, which provides for the following:
• an aggregate limit of fees is set and varied only by approval of a resolution of shareholders at the annual general meeting; and
• the Board determines how those fees are allocated among the directors within the fee pool.
In recognition of the increased time and responsibility of non-executive directors, on 25 October 2005, shareholders approved an increase to the directors’ fee pool to $2,000,000 per annum (previously $1,320,000 per annum). As a result of this increase:
• fees paid to Board members, including additional fees paid for service on Board committees were increased; and
• existing retirement benefits to non-executive directors, employed before 1 July 2002, were integrated into the overall fee pool.
In determining the required level for the fee pool and individual director fee levels, the Committee makes recommendations to the Board, and in the case of the fee pool, the Board makes a recommendation to shareholders, taking into account:
• the company’s existing remuneration policies;
• independent professional advice;
• the fee pools of other comparable companies (based on company size using market capitalisation);
• fees paid to individual directors by comparable companies;

Remuneration report
45
• the general time commitment and responsibilities involved;
• the risks associated with discharging the duties attaching to the role of director; and
• the level of fees necessary to attract and retain directors of a suitable calibre. In order to maintain their independence and impartiality, the remuneration of the non-executive directors is not linked to the performance of the company, except through their participation in the Directshare plan, which is explained below.
Remuneration structure
Non-executive directors receive a total remuneration package based on their role on the Board and their committee memberships. Non-executive directors must sacrifice at least 20% of their fees into Telstra shares to align their interests with those of our shareholders.
All Board and committee fees, including superannuation, paid to non-executive directors in fiscal 2006 remain within the new fee pool. Board and Committee fees were increased in fiscal 2006 to take into account the changes to retirement benefits made following the 2005 Annual General Meeting and prevailing market rates for directors’ fees. Following these increases the Board and Committee fees payable to directors in fiscal 2006 are set out below.
Board fees
Chairman Director Board $450,000 $130,000
Committee fees
Board members, excluding the Chairman, are paid the following additional fees for service on Board committees:
Committee Chairman Member Audit Committee $70,000 $35,000 Remuneration Committee $14,000 $7,000 Nomination Committee - $7,000 Technology Committee $7,000 $7,000
The Board considered these fees appropriate given the additional time requirements of committee members, the complex matters before the committees and, in the case of the Audit Committee, an increased number of committee meetings and governance requirements.
Components of the total remuneration package (TRP)
The Board has determined that a non-executive director’s total remuneration will consist of three components: cash, shares (through the Directshare plan) and superannuation. Each year directors are asked to specify the allocation of their total remuneration between these three components, subject to the following conditions:
• at least 30% must be taken as cash;
• at least 20% must be taken as Directshares; and

Remuneration report
46
• the minimum superannuation guarantee contribution must be made, where applicable.
The Board will continue to periodically review its approach to the non-executive directors’ remuneration structure to ensure it compares with general industry practice and best practice principles of corporate governance.
Equity compensation – Directshare
Directshare aims to encourage a longer-term perspective and to align the directors’ interests with those of our shareholders. Through our Directshare plan, non-executive directors are required to sacrifice a minimum of 20% of their TRP towards the acquisition of restricted Telstra shares. The shares are purchased on-market and allocated to the participating non-executive director at market price. The shares are held in trust and are unable to be dealt with for 5 years unless the participating director ceases to be a director of Telstra. If a non-executive director chooses to increase their participation in the Directshare plan, they take a greater percentage of TRP in Telstra shares, and their cash component is reduced. As the allocation of Directshares is simply a percentage of the non-executive director’s TRP, it is not subject to the satisfaction of a performance measure. Directors are restricted from entering into arrangements which effectively operate to limit the economic risk of their shareholdings allocated under the Directshare plan during the period the shares are held in trust.
Superannuation
Mandatory superannuation contributions are included as part of each director’s total remuneration. Directors may choose to increase the proportion of their remuneration taken as superannuation, subject to legislative requirements.
Retirement benefits
In accordance with good corporate governance practice, we do not provide retirement benefits for directors appointed after 30 June 2002. However, non-executive directors appointed before that date were eligible to receive retirement benefits on retiring as a director. At the annual general meeting on 25 October 2005, we explained that as a result of the increase in the directors’ fee pool, retirement benefits would cease to accrue. This means that directors who were appointed before 30 June 2002 will receive cash equal to the benefits accrued to 25 October 2005. These benefits will be indexed by reference to changes in Telstra’s share price between that date and the date the director’s retirement takes effect. This approach:
• aligns directors’ interests with those of stakeholders and with the long term success of the company;
• subjects the value of the retirement benefit to movement in Telstra’s share price and dividend payments; and

Remuneration report
47
• maintains the principle that this payment be made when the director retires, rather than provide an early cash payout of the retirement benefits at the time these arrangements were approved.
Figure 23 shows the increase in retirement benefits payable to non-executive directors appointed before 30 June 2002 and the value of the payment to the director if he or she had retired on 30 June 2006. Figure 23: Non-executive directors – increases in retirement benefits
Name Balance as at 2005
(a) ($)
Increase in value to
25 October 05
(b) ($)
Total value to 25 October 05
(a) + (b) ($)
Indexed increase in
value to 30 June 06
(c) - (a) ($)
Payment to director if he/she had retired on 30
June 2006 (1)
(c) ($)
Donald G McGauchie
340,673 76,169 416,842 60,094 400,767
John E Fletcher 126,138 13,829 139,967 8,437 134,575 (2) Belinda J Hutchinson
103,794 16,584 120,378 11,943 115,737
Catherine B Livingstone
143,074 18,059 161,133 11,849 154,923
Charles Macek 117,949 17,315 135,264 12,099 130,048 John W Stocker 342,176 27,273 369,449 13,026 355,202 (1) The value is calculated by multiplying the number of notional shares plus additional notional sharesallocated for re-invested dividends
by $3.68 being the volume weighted average price of Telstra shares traded on 30 June 2006. (2) John Fletcher resigned as a director on 30 June 2006 and was paid this amount in accordance with the retirmenet benefit policy. This
amount is also included as a termination payment in Figure24.
Other benefits
Directors also receive reimbursement for reasonable travelling, accommodation and other expenses incurred in travelling to or from meetings of the Board or committees, or when otherwise engaged on company business. We also provide directors with telecommunications and other services and equipment to assist them in performing their duties. From time to time, we may also make products and services available to directors without charge to allow them to familiarise themselves with our products and services and with recent technological developments. To the extent any of these items are considered a personal benefit to a director, the value of the benefit is included in the “non-monetary benefits” column in Figure 24.
Details of non-executive directors’ remuneration
Figure 24 provides the details of all remuneration paid to our non-executive directors in fiscal 2006.

Remuneration report
48
Figure 24: Non-executive directors – details of remuneration
Short term employee benefits Post-employment benefits Termination benefits
Equity settled share-based
payments
Name Salary and Fees (1)
Non-monetary benefits (2)
Other Superannuation
Retirement benefits
Termination benefits (3)
Direct share Total
Donald G McGauchie
Chairman Ongoing 312,236 3,078 - 12,158 60,094 - 81,099 468,665
John T Ralph (4)
Deputy Chairman Retired COB 11 Aug 2005
17,474 380 - (5) - 462,548 - 480,402
Anthony J Clark (4) Director
Retired COB 11 Aug 2005
9,015 458 - 970 - 278,846 - 289,289
John E Fletcher (6) Director
Resigned COB 30 June
2006
94,209 2,775 - 8,056 - 134,575 26,422 266,037
Belinda J Hutchinson Director
Ongoing 100,611 2,288 - 18,551 11,943 - 29,740 163,133
Catherine Livingstone Director
Ongoing 113,063 2,288 - 10,998 11,849 - 31,015 169,213
Charles Macek Director
Ongoing 123,032 2,748 - 11,227 12,099 - 33,565 182,671
John W Stocker Director
Ongoing 110,817 2,288 - 39,006 13,026 - 37,390 202,527
Peter Willcox (7) Director
Commenced 17 May 2006
11,872 - - 1,069 - - 3,235 16,176
John Zeglis (7) Director
Commenced 17 May 2006
12,941 - - - - 3,235 16,176
Total 905,270 16,303 - 102,035 109,011 875,969 245,701 2,254,289
(1) Includes fees for membership on Board committees. (2) Includes the value of the personal use of products and services. (3) These payments relate to eligible retirement benefits payable on cessation as Directors of Telstra. (4) Mr Ralph and Mr Clark retired as Directors of Telstra effective 11 August 2005. (5) Under current superannuation legislation Mr Ralph did not receive superannuation benefits as he had passed his 70th birthday. (6) Mr Fletcher resigned as a Director of Telstra on 30 June 2006. (7) Mr Willcox and Mr Zeglis were appointed as Directors on 17 May 2006. Mr Zeglis is based in the United States. (8) There are no individual contracts for service with our non-executive directors other than as described above in relation to post-employment benefits.