test experience for harbor craft and ocean going vessels
TRANSCRIPT
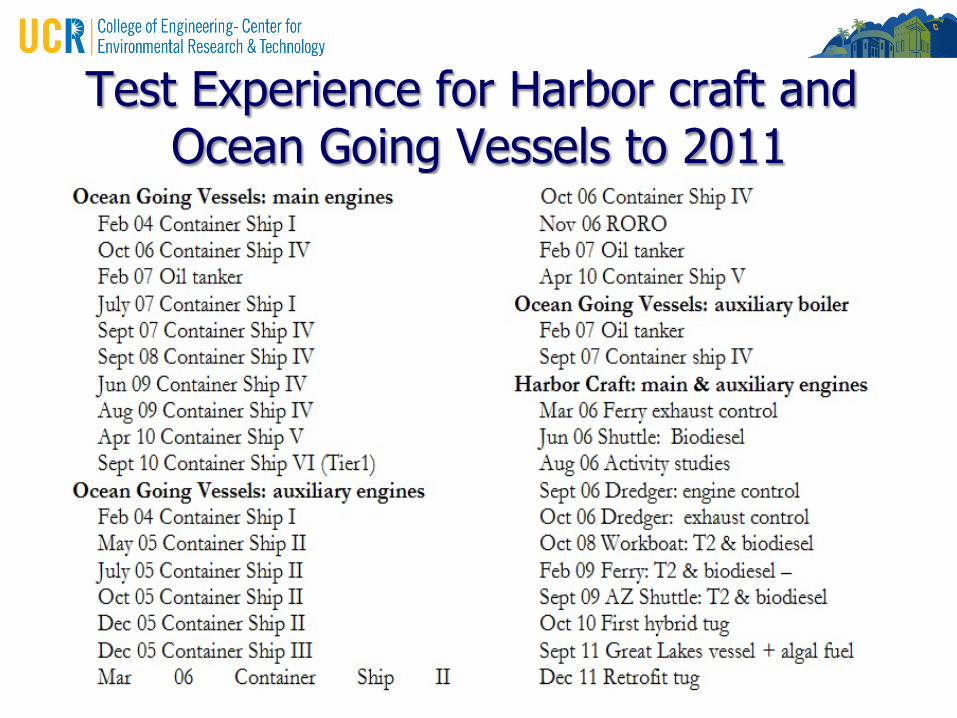
Test Experience for Harbor craft and Ocean Going Vessels to 2011
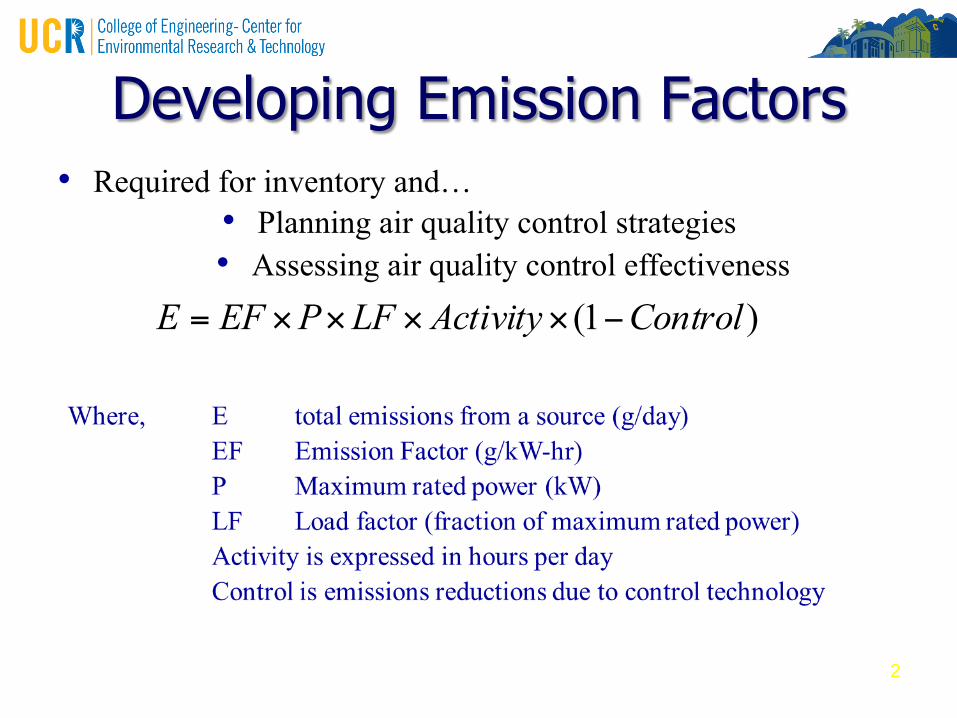
Developing Emission Factors
2
)1( ControlActivityLFPEFE −××××=
• Required for inventory and… • Planning air quality control strategies • Assessing air quality control effectiveness
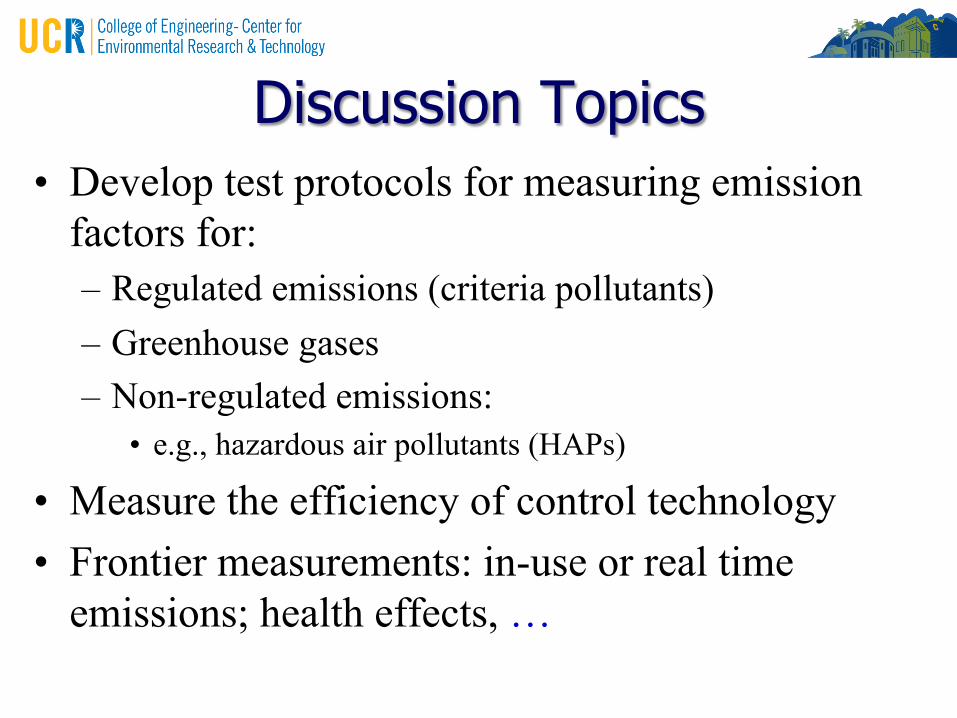
Discussion Topics • Develop test protocols for measuring emission
factors for: – Regulated emissions (criteria pollutants) – Greenhouse gases – Non-regulated emissions:
• e.g., hazardous air pollutants (HAPs)
• Measure the efficiency of control technology • Frontier measurements: in-use or real time
emissions; health effects, …
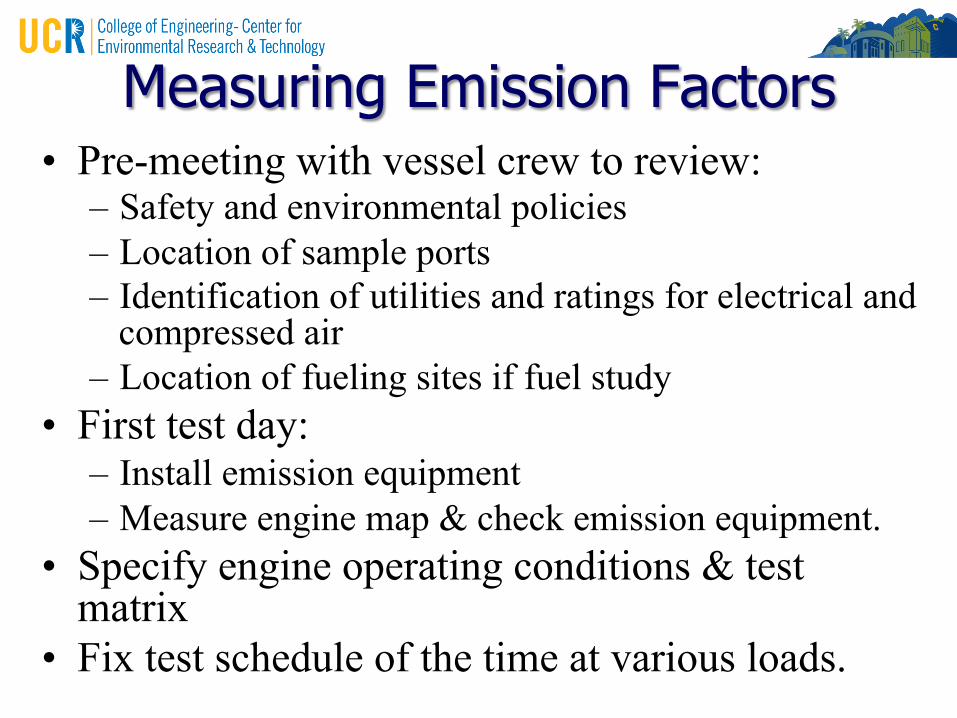
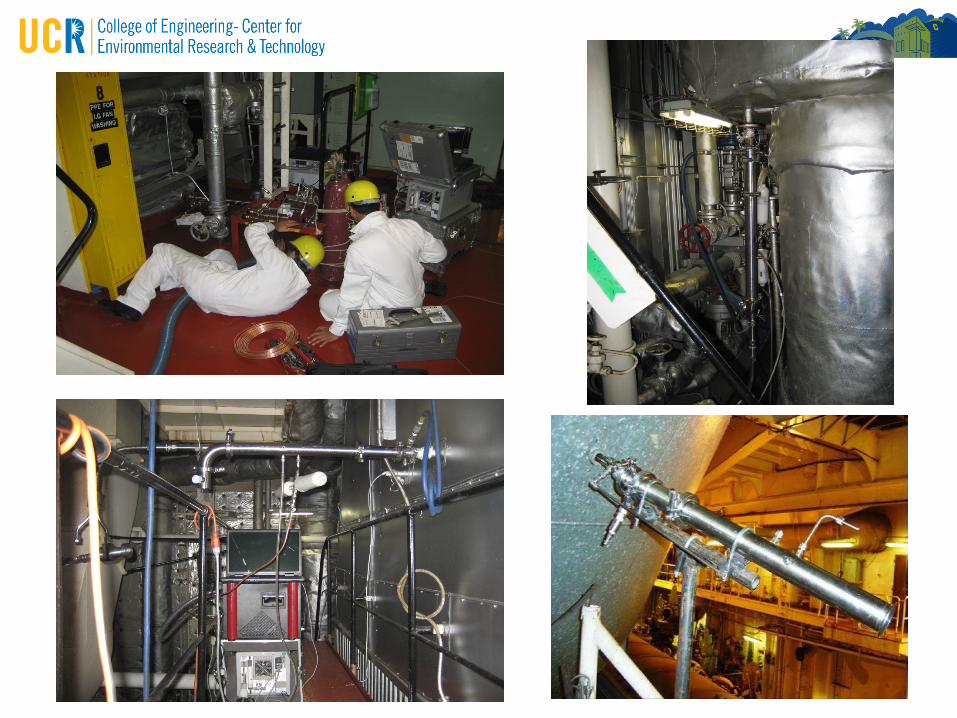
Measuring Emission Factors • Pre-meeting with vessel crew to review:
– Safety and environmental policies – Location of sample ports – Identification of utilities and ratings for electrical and
compressed air – Location of fueling sites if fuel study
• First test day: – Install emission equipment – Measure engine map & check emission equipment.
• Specify engine operating conditions & test matrix
• Fix test schedule of the time at various loads.
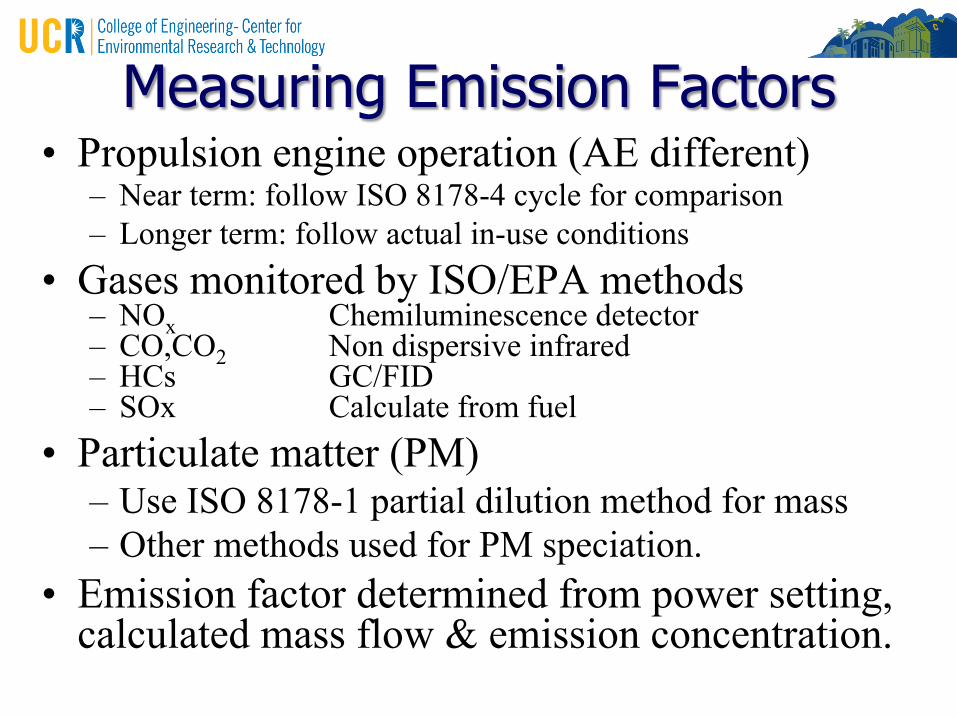
Measuring Emission Factors • Propulsion engine operation (AE different)
– Near term: follow ISO 8178-4 cycle for comparison – Longer term: follow actual in-use conditions
• Gases monitored by ISO/EPA methods – NOx Chemiluminescence detector – CO,CO2 Non dispersive infrared – HCs GC/FID – SOx Calculate from fuel
• Particulate matter (PM) – Use ISO 8178-1 partial dilution method for mass – Other methods used for PM speciation.
• Emission factor determined from power setting, calculated mass flow & emission concentration.
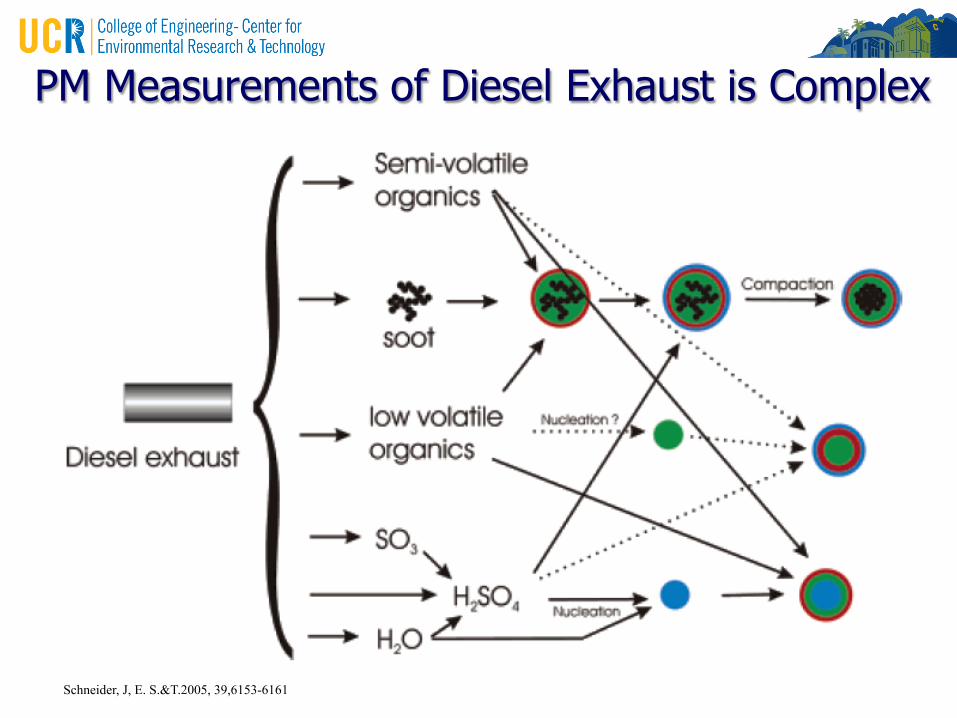
PM Measurements of Diesel Exhaust is Complex
Schneider, J, E. S.&T.2005, 39,6153-6161
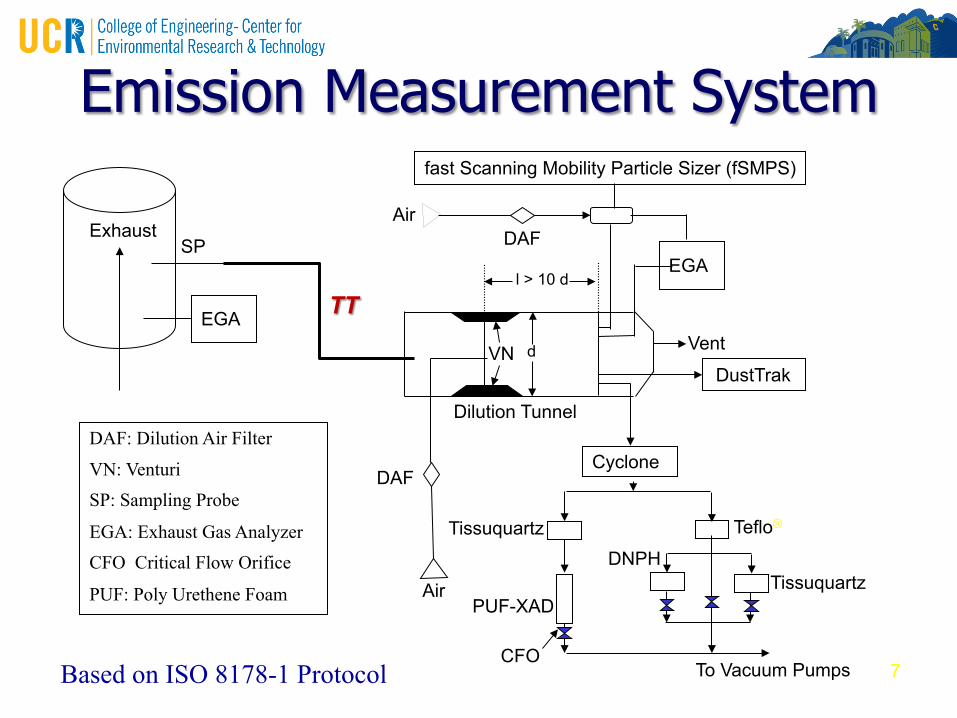
Emission Measurement System
7
Cyclone
EGA
d
fast Scanning Mobility Particle Sizer (fSMPS)
Air
DAF
Dilution Tunnel
l > 10 d EGA
VN Vent
Exhaust DAF Air
DustTrak
Tissuquartz Teflo®
DNPH Tissuquartz
To Vacuum Pumps CFO
PUF-XAD
SP
TT
DAF: Dilution Air Filter
VN: Venturi
SP: Sampling Probe
EGA: Exhaust Gas Analyzer
CFO Critical Flow Orifice
PUF: Poly Urethene Foam
Based on ISO 8178-1 Protocol
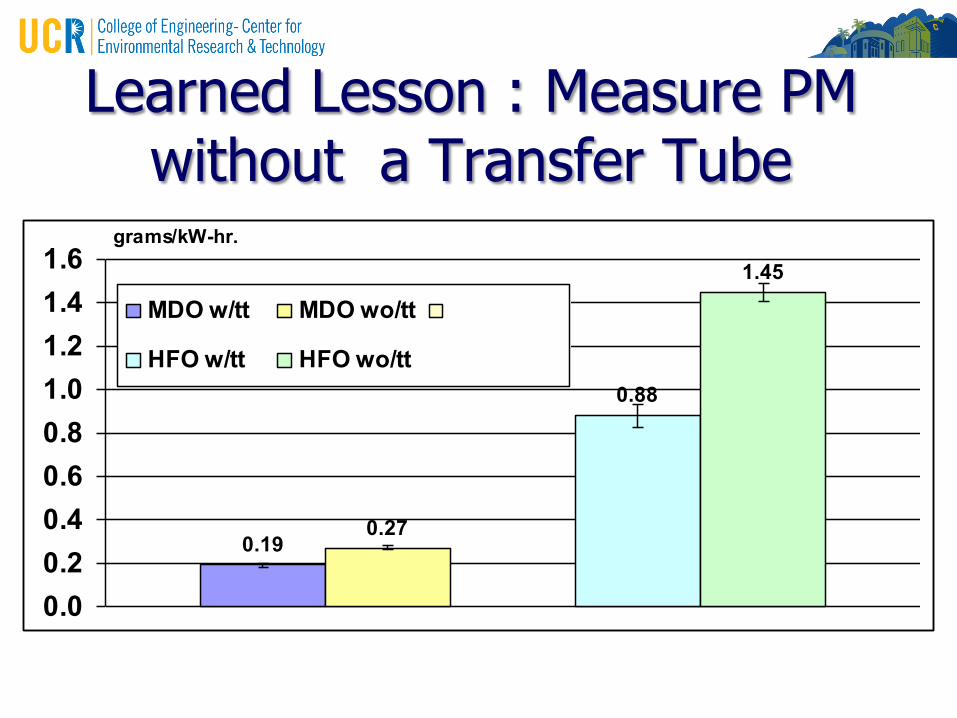
Learned Lesson : Measure PM without a Transfer Tube
0.190.27
0.88
1.45
0.00.20.40.60.81.01.21.41.6
grams/kW-hr.
MDO w/tt MDO wo/tt
HFO w/tt HFO wo/tt
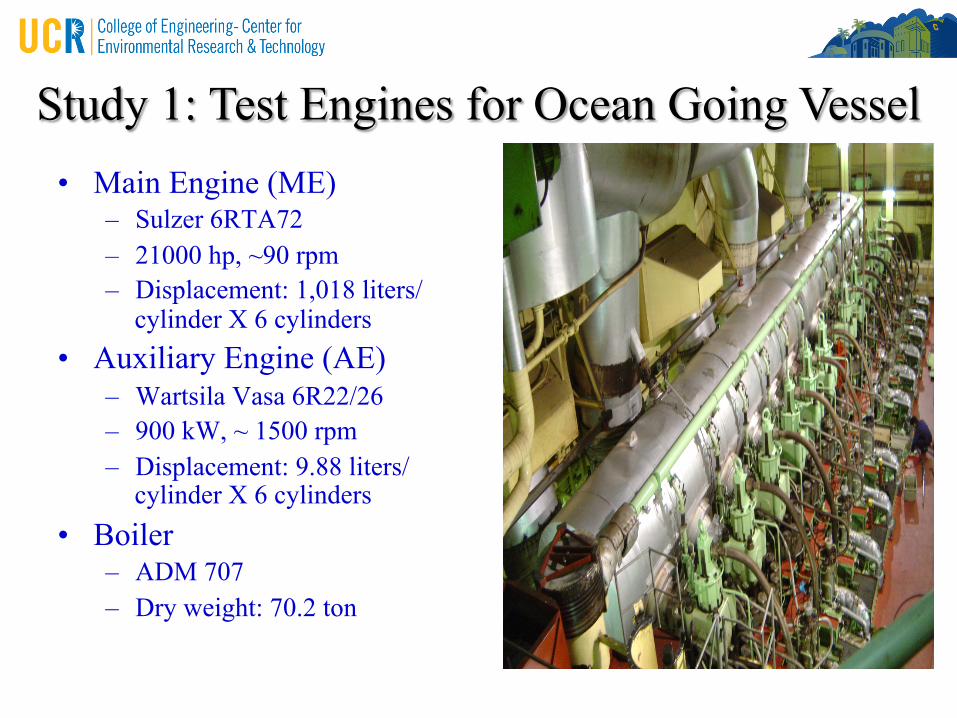
Study 1: Test Engines for Ocean Going Vessel • Main Engine (ME)
– Sulzer 6RTA72 – 21000 hp, ~90 rpm – Displacement: 1,018 liters/
cylinder X 6 cylinders • Auxiliary Engine (AE)
– Wartsila Vasa 6R22/26 – 900 kW, ~ 1500 rpm – Displacement: 9.88 liters/
cylinder X 6 cylinders • Boiler
– ADM 707 – Dry weight: 70.2 ton
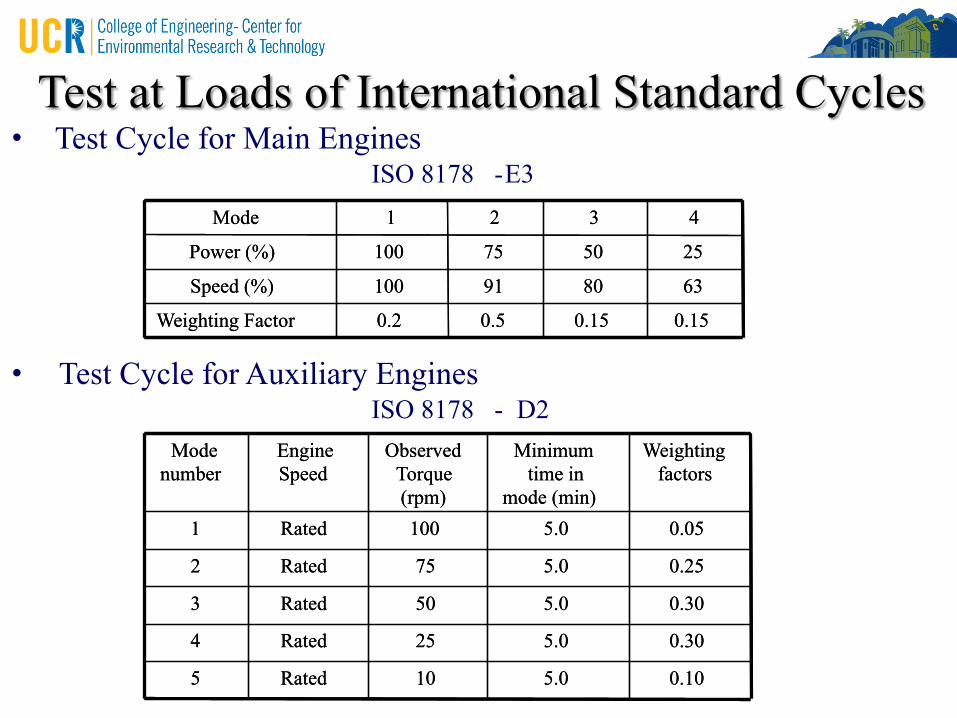
• Test Cycle for Main Engines ISO 8178 - E3
• Test Cycle for Auxiliary Engines ISO 8178 - D2
Test at Loads of International Standard Cycles
0.15 0.15 0.5 0.2 Weighting Factor 63 80 91 100 Speed (%) 25 50 75 100 Power (%) 4 3 2 1 Mode
0.15 0.15 0.5 0.2 Weighting Factor 63 80 91 100 Speed (%) 25 50 75 100 Power (%) 4 3 2 1 Mode
0.30 5.0 25 Rated 4
0.10 5.0 10 Rated 5
0.30 5.0 50 Rated 3
0.25 5.0 75 Rated 2
0.05 5.0 100 Rated 1
Weighting factors
Minimum time in
mode (min)
Observed Torque (rpm)
Engine Speed
Mode number
0.30 5.0 25 Rated 4
0.10 5.0 10 Rated 5
0.30 5.0 50 Rated 3
0.25 5.0 75 Rated 2
0.05 5.0 100 Rated 1
Weighting factors
Minimum time in
mode (min)
Observed Torque (rpm)
Engine Speed
Mode number
12
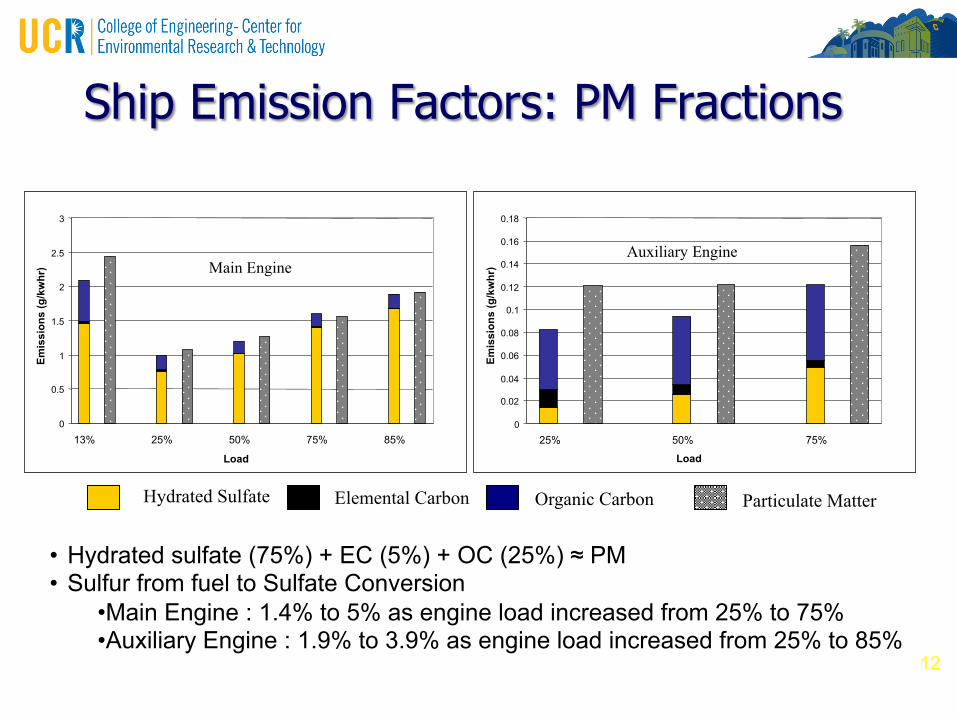
Ship Emission Factors: PM Fractions
0 0.5
1 1.5
2 2.5
3
13% 25% 50% 75% 85% Load
Emis
sion
s (g
/kw
hr)
0 0.02 0.04 0.06 0.08
0.1 0.12 0.14 0.16 0.18
25% 50% 75% Load
Emis
sion
s (g
/kw
hr) Main Engine
Auxiliary Engine
Hydrated Sulfate Elemental Carbon Organic Carbon Particulate Matter
• Hydrated sulfate (75%) + EC (5%) + OC (25%) ≈ PM • Sulfur from fuel to Sulfate Conversion
• Main Engine : 1.4% to 5% as engine load increased from 25% to 75% • Auxiliary Engine : 1.9% to 3.9% as engine load increased from 25% to 85%
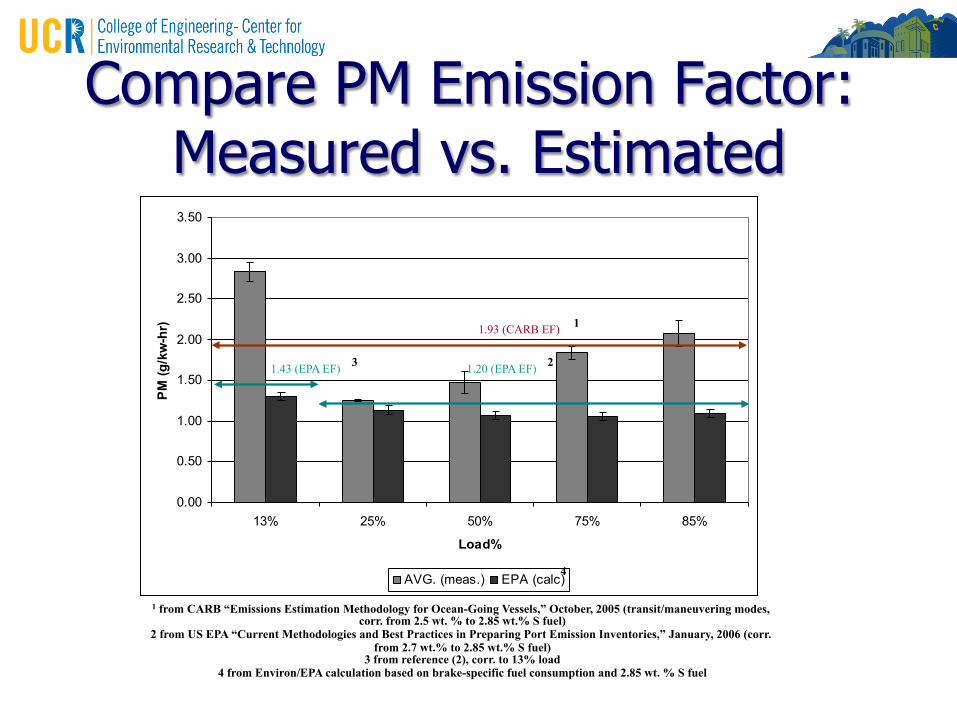
0.00
0.50
1.00
1.50
2.00
2.50
3.00
3.50
13% 25% 50% 75% 85%
Load%
PM (g
/kw
-hr)
AVG. (meas.) EPA (calc)
1.93 (CARB EF)
1.20 (EPA EF) 1.43 (EPA EF)
1 from CARB “Emissions Estimation Methodology for Ocean-Going Vessels,” October, 2005 (transit/maneuvering modes, corr. from 2.5 wt. % to 2.85 wt.% S fuel)
2 from US EPA “Current Methodologies and Best Practices in Preparing Port Emission Inventories,” January, 2006 (corr. from 2.7 wt.% to 2.85 wt.% S fuel)
3 from reference (2), corr. to 13% load 4 from Environ/EPA calculation based on brake-specific fuel consumption and 2.85 wt. % S fuel
2
1
3
4
Compare PM Emission Factor: Measured vs. Estimated
14
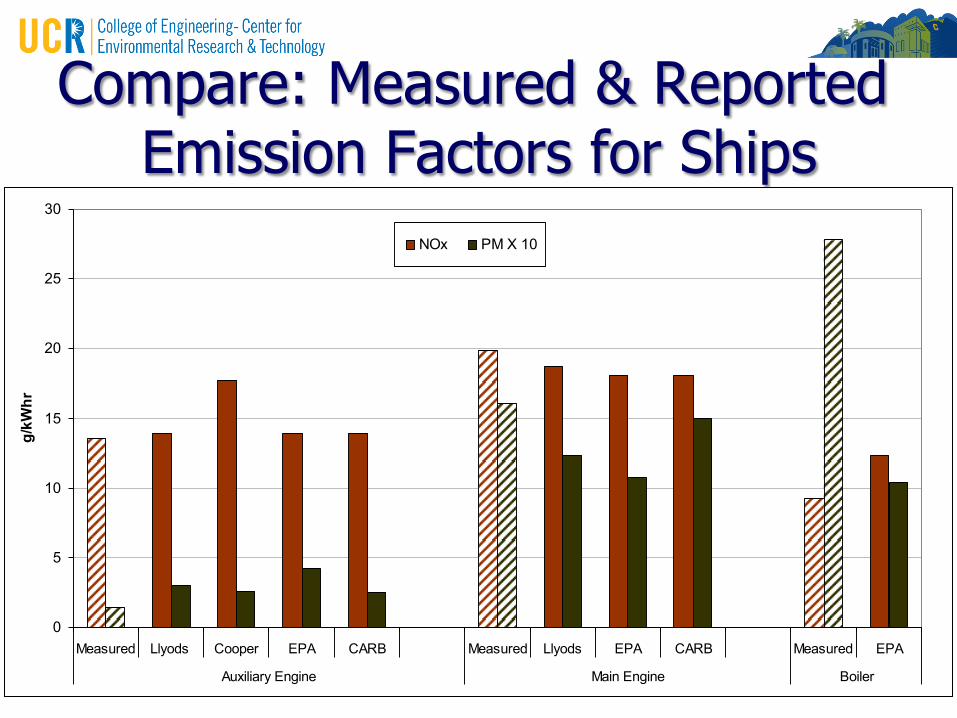
Compare: Measured & Reported Emission Factors for Ships
0
5
10
15
20
25
30
Measured Llyods Cooper EPA CARB Measured Llyods EPA CARB Measured EPA
Auxiliary Engine Main Engine Boiler
g/kWhr
NOx PM X 10
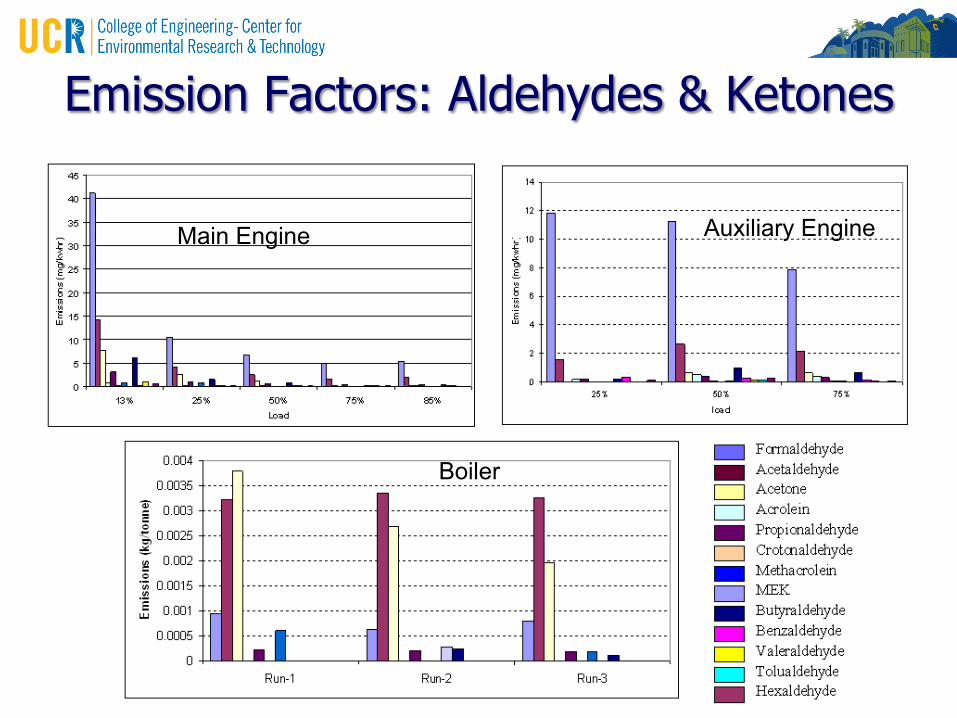
Emission Factors: Aldehydes & Ketones
Main Engine Auxiliary Engine
Boiler
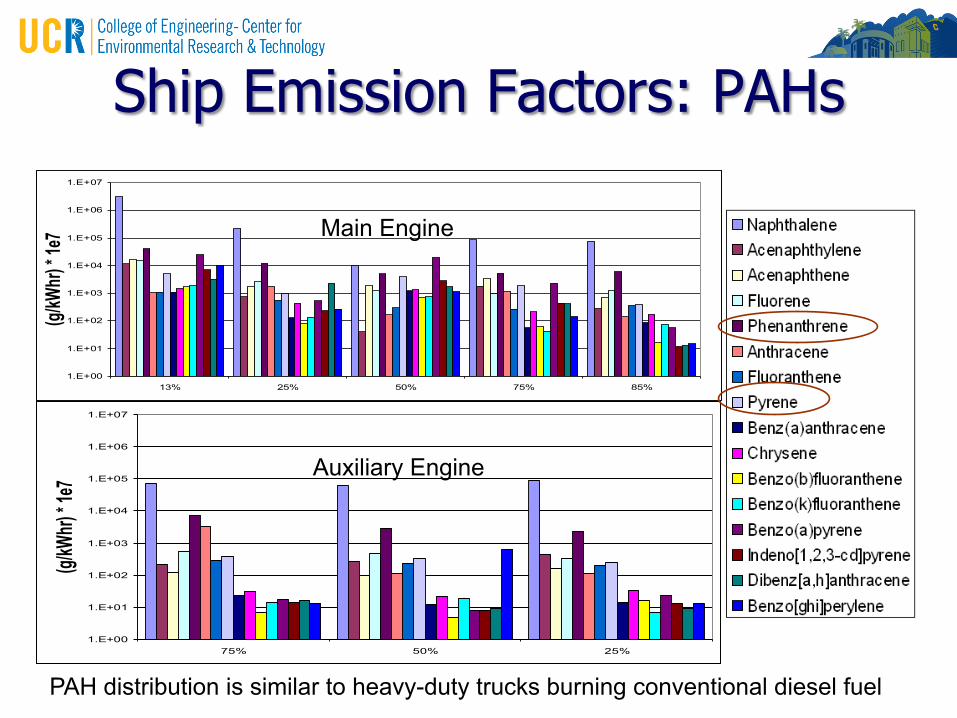
Ship Emission Factors: PAHs
1.E+00
1.E+01
1.E+02
1.E+03
1.E+04
1.E+05
1.E+06
1.E+07
13% 25% 50% 75% 85%
(g/kW
hr) * 1
e7
1.E+00
1.E+01
1.E+02
1.E+03
1.E+04
1.E+05
1.E+06
1.E+07
75% 50% 25%
(g/kW
hr) * 1
e7
Main Engine
Auxiliary Engine
PAH distribution is similar to heavy-duty trucks burning conventional diesel fuel
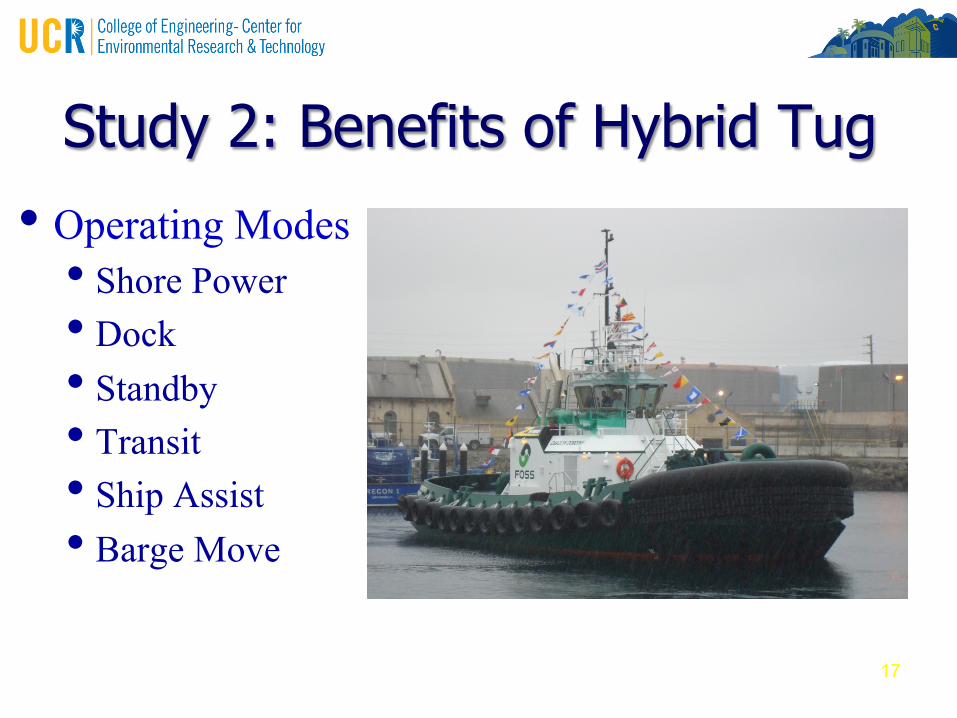
Study 2: Benefits of Hybrid Tug
• Operating Modes • Shore Power • Dock • Standby • Transit • Ship Assist • Barge Move
17
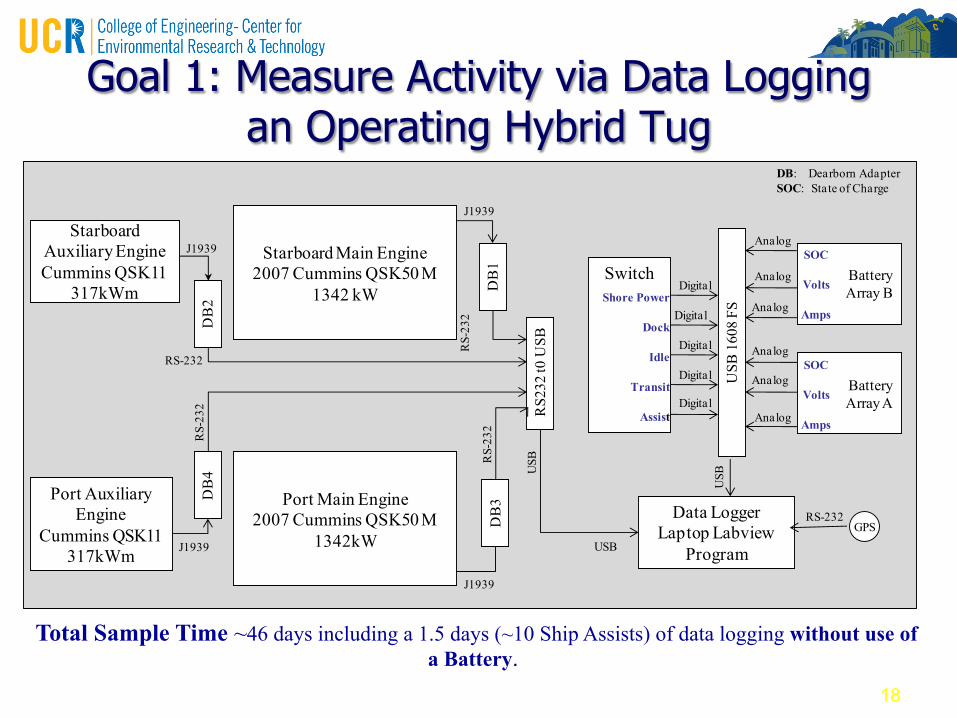
Goal 1: Measure Activity via Data Logging an Operating Hybrid Tug
Total Sample Time ~46 days including a 1.5 days (~10 Ship Assists) of data logging without use of a Battery.
18
Port Main Engine2007 Cummins QSK50 M
1342kW
Starboard Main Engine2007 Cummins QSK50 M
1342 kW
Battery Array A
Data LoggerLaptop Labview
Program
DB
2
DB
3D
B1
DB
4
Switch
RS2
32 t0
USB
GPS
USB
160
8 FS
J1939
J1939
J1939
J1939
RS-
232
RS-
232
RS-
232
RS-232
USBU
SBUSB
RS-232
Analog
Analog
Analog
SOC
Volts
Amps
Battery Array B
Analog
Analog
Analog
SOC
Volts
AmpsShore Power
Dock
Idle
Transit
AssistDigital
Digital
Digital
Digital
Digital
DB: Dearborn AdapterSOC: State of Charge
Starboard Auxiliary EngineCummins QSK11
317kWm
Port Auxiliary Engine
Cummins QSK11 317kWm
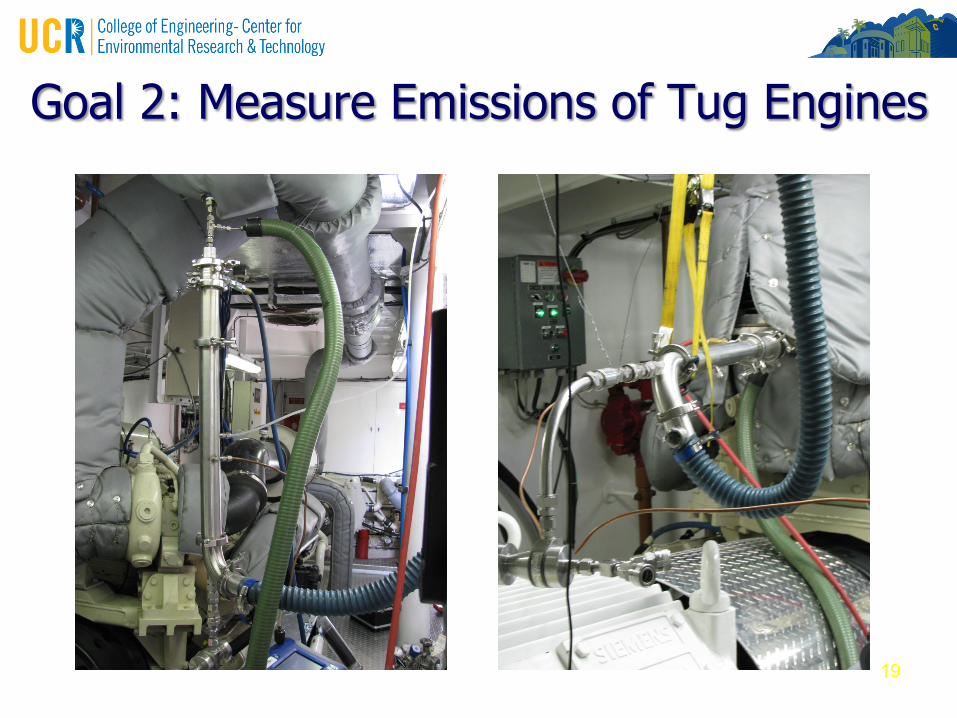
Goal 2: Measure Emissions of Tug Engines
19
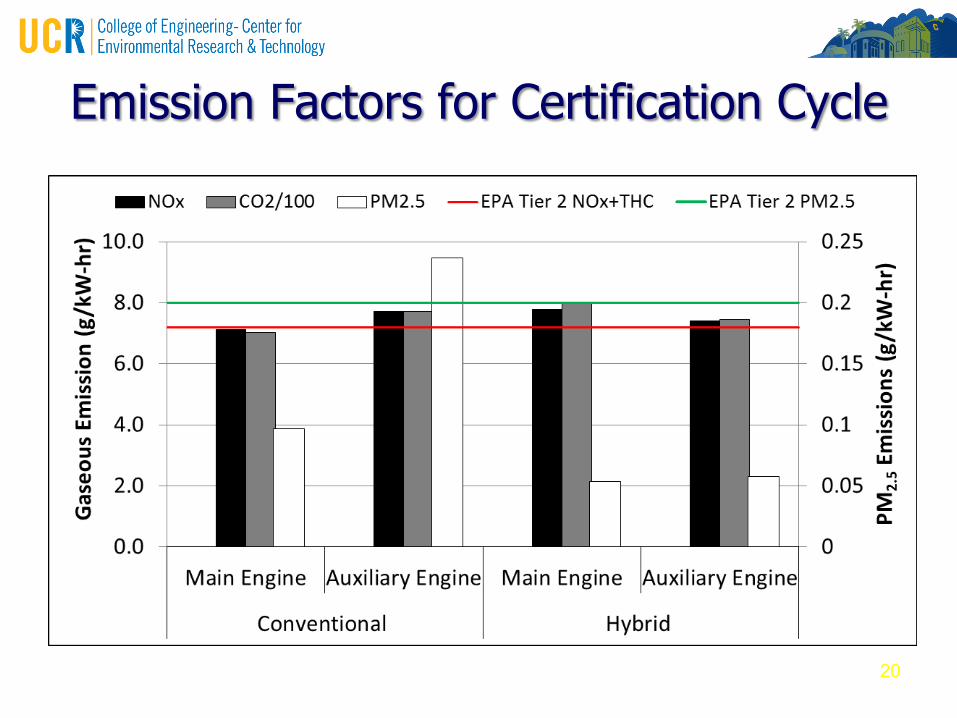
Emission Factors for Certification Cycle
20
In-use or Real-world Testing
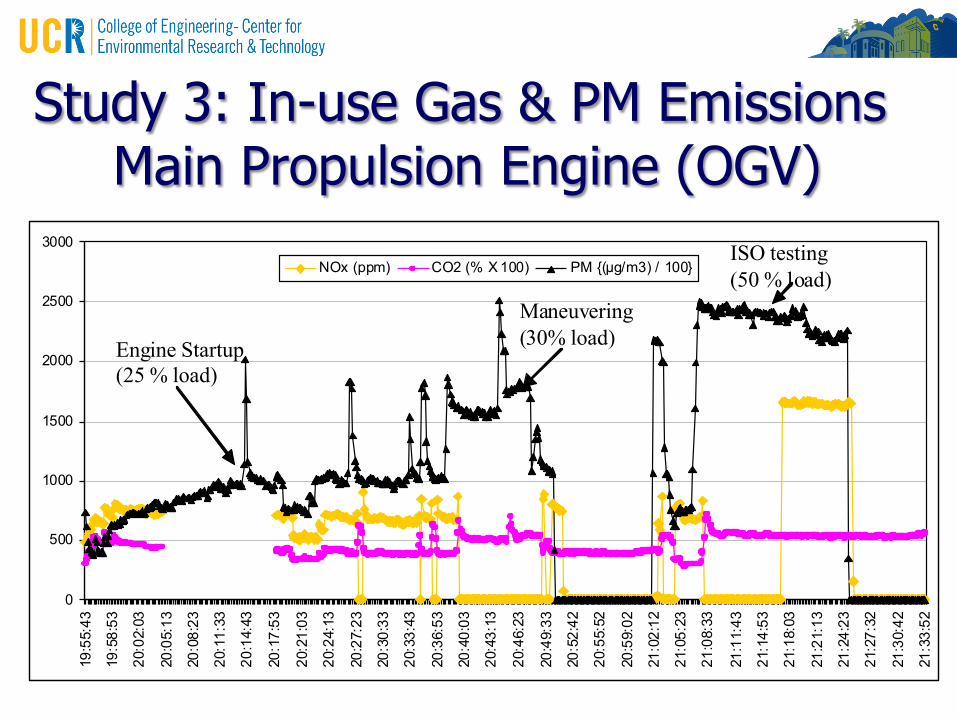
Study 3: In-use Gas & PM Emissions Main Propulsion Engine (OGV)
0
500
1000
1500
2000
2500
3000
19:5
5:43
19:5
8:53
20:0
2:03
20:0
5:13
20:0
8:23
20:1
1:33
20:1
4:43
20:1
7:53
20:2
1:03
20:2
4:13
20:2
7:23
20:3
0:33
20:3
3:43
20:3
6:53
20:4
0:03
20:4
3:13
20:4
6:23
20:4
9:33
20:5
2:42
20:5
5:52
20:5
9:02
21:0
2:12
21:0
5:23
21:0
8:33
21:1
1:43
21:1
4:53
21:1
8:03
21:2
1:13
21:2
4:23
21:2
7:32
21:3
0:42
21:3
3:52
NOx (ppm) CO2 (% X 100) PM {(µg/m3) / 100}
Engine Startup (25 % load)
Maneuvering (30% load)
ISO testing (50 % load)
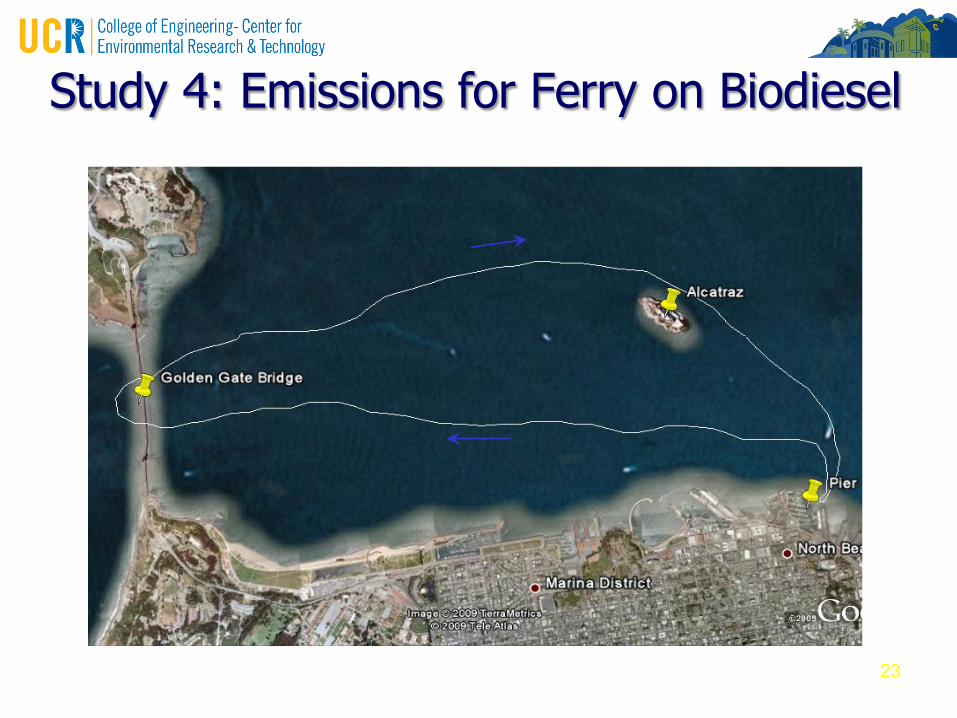
Study 4: Emissions for Ferry on Biodiesel
23
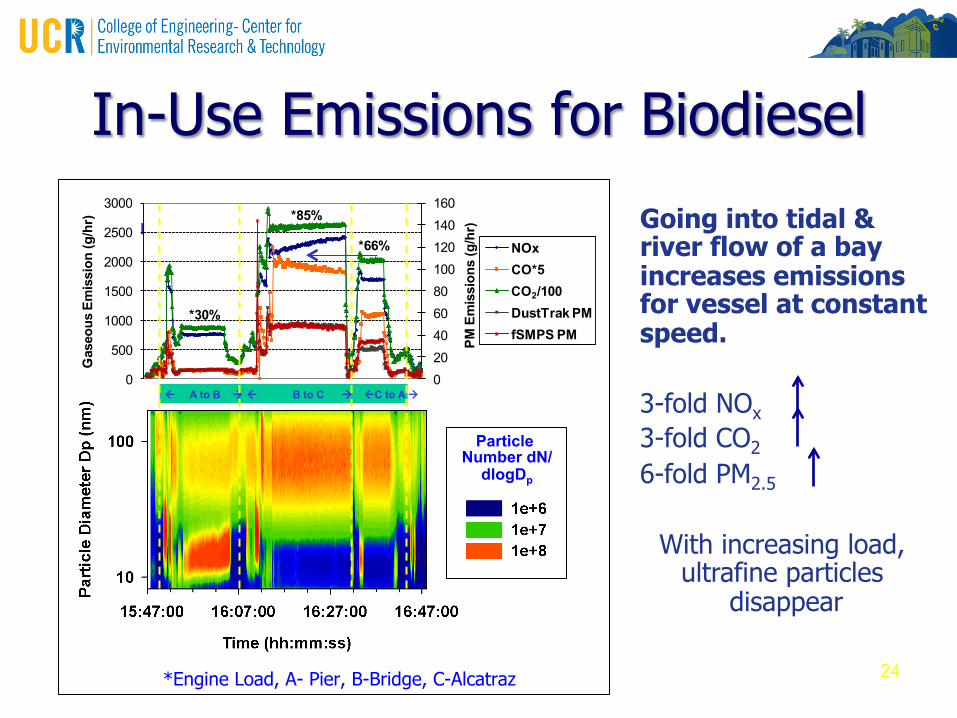
In-Use Emissions for Biodiesel
24
B
A
020406080100120140160
0
500
1000
1500
2000
2500
3000
PM E
mis
sion
s (g
/hr)
Gas
eous
Em
issi
on (g
/hr)
NOxCO*5CO2/100DustTrak PMfSMPS PM
*30%
*85%
*66%
CO2/100
Particle Number dN/
dlogDp
ß A to B à ß B to C à ßC to A à
Going into tidal & river flow of a bay increases emissions for vessel at constant speed. 3-fold NOx
3-fold CO2
6-fold PM2.5
With increasing load,
ultrafine particles disappear
*Engine Load, A- Pier, B-Bridge, C-Alcatraz
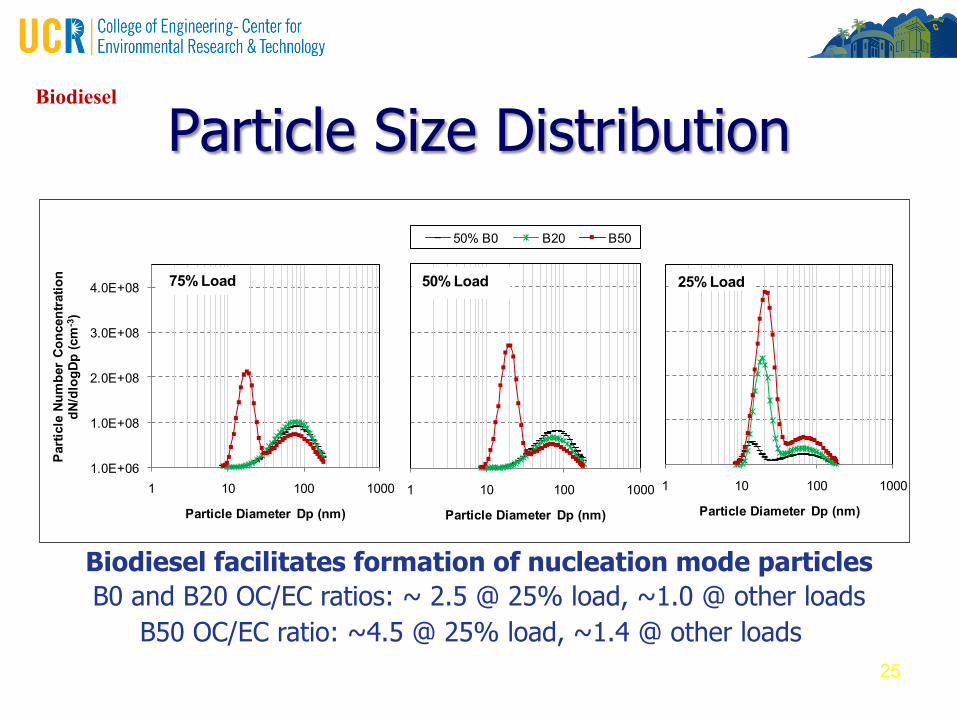
Particle Size Distribution
Biodiesel facilitates formation of nucleation mode particles B0 and B20 OC/EC ratios: ~ 2.5 @ 25% load, ~1.0 @ other loads
B50 OC/EC ratio: ~4.5 @ 25% load, ~1.4 @ other loads 25
Biodiesel
1.0E+06
1.0E+08
2.0E+08
3.0E+08
4.0E+08
1 10 100 1000
Parti
cle
Num
ber
Conc
entra
tion
dN/d
logD
p (c
m-3
)
Particle Diameter Dp (nm)
75% Load
1 10 100 1000
Particle Diameter Dp (nm)
25% Load
1 10 100 1000
Particle Diameter Dp (nm)
50% B0 B20 B50
50% Load
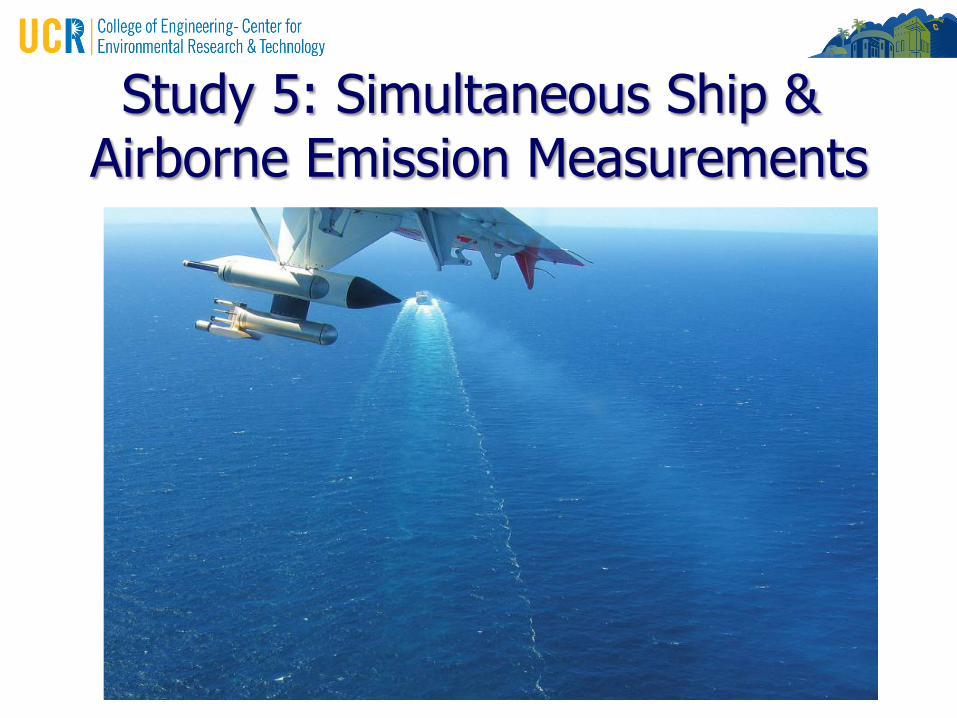
Study 5: Simultaneous Ship & Airborne Emission Measurements

Size Segregated Speciated PM
0
100
200
300
400
500
600
700
800
900
1000
>18.0 10.0 -18.0
5.6 -10.0
3.2 - 5.6 1.8 - 3.2 1.0 - 1.8 0.56 -1.0
0.32 -0.56
0.18 -0.32
0.1 -0.18
0.056 -0.1
<0.056
size (µm)
mg/
kWhr
TC (mg/kWhr)7 Hydrated Sulfate (mg/kWhr)PM (mg/kWhr)
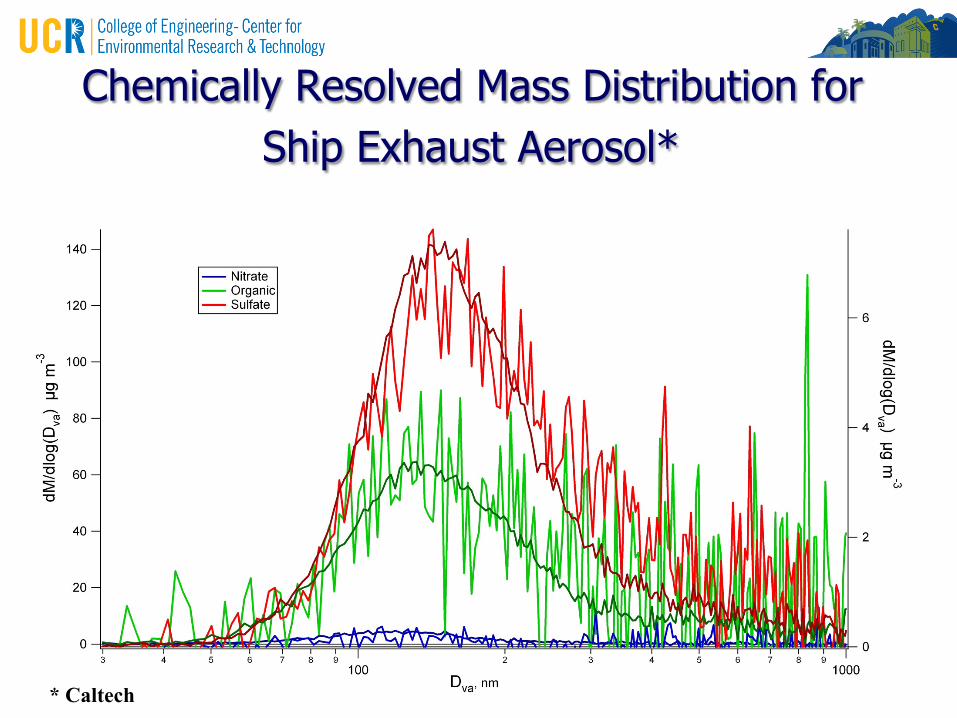
Chemically Resolved Mass Distribution for Ship Exhaust Aerosol*
* Caltech
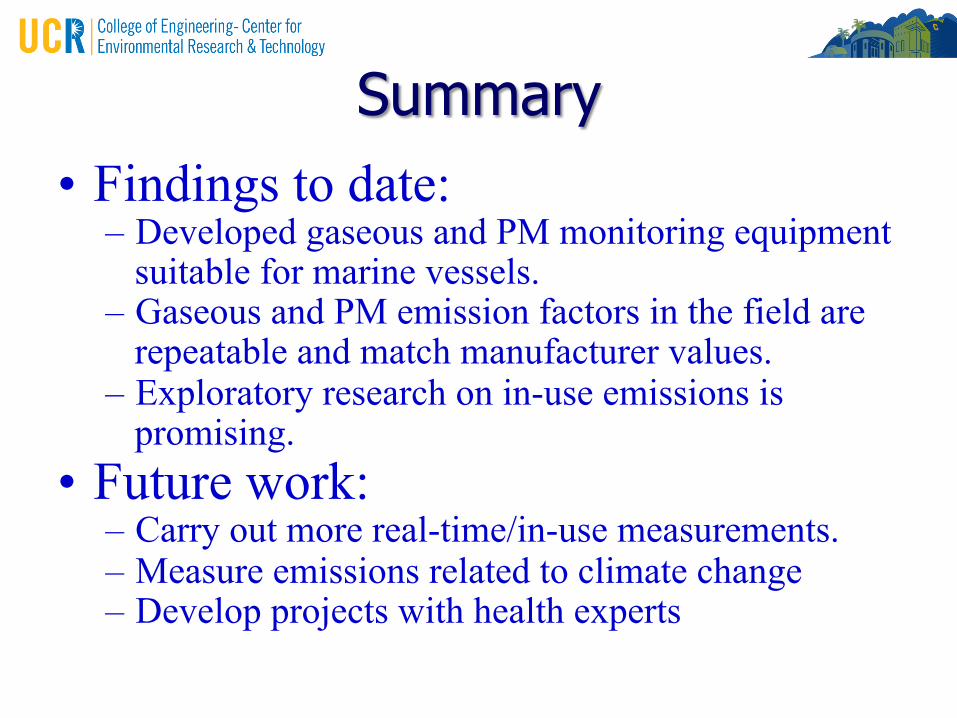
Summary • Findings to date:
– Developed gaseous and PM monitoring equipment suitable for marine vessels.
– Gaseous and PM emission factors in the field are repeatable and match manufacturer values.
– Exploratory research on in-use emissions is promising.
• Future work: – Carry out more real-time/in-use measurements. – Measure emissions related to climate change – Develop projects with health experts
Take Home Ideas • Pre-test inspection and meeting is essential
– Discuss proposed test matrix with operating crew – Identify sampling ports and utilities
• Anticipate difficulty – Operational and safety concerns may limit testing – Have back up plans for critical equipment
• Maximize sampling opportunities – Rare opportunity with important source – Minor incremental cost of extra sample media and
instruments • Look to new trends
– New fuels, black/brown carbon, aftertreament

Thank You; Any Questions?