test scores 2013
DESCRIPTION
ÂTRANSCRIPT

Lake Washington School District - Test Scores 2013
Each student will graduate prepared to lead a rewarding, responsible life as a contributing member of our community and greater society.

Lake Washington School District Test Score Booklet 2013 | Page 2
Test Scores – Part of an overall assessment of student learning
In the Lake Washington School District, evidence of learning is gathered in many ways.
Information about student performance and the performance of the school district is gathered
from a variety of sources, including district and state assessments, and from the classroom
teacher. Each piece provides a “snapshot” of how well a child is doing. The more “snapshots”
that are gathered, the clearer the picture of performance becomes.
A district-wide assessment program is in place, which is used to:
• diagnose student learning on a day–to–day basis
• evaluate programs
• improve instructional decisions
• determine placement and certification
• respond to public accountability
Classroom Assessments Assessment is a natural part of instruction. Teachers gather information on a daily basis both in formal and informal ways to guide instruction and make
decisions about learning.
Early Literacy Assessment • DIBELS (Dynamic Indicators of Basic Early Literacy Skills) assess reading proficiency in kindergarten through 2
nd grade.
MSP, HSPE measures academic achievement against state standard
Measurements of Student Progress (MSP) tests measure how well students are able to apply knowledge and skills in reading, writing, mathematics and science and are administered in grades 3, 4, 5, 6, 7 and 8. The MSP is one of two tests that replaces the Washington Assessment of Student Learning (WASL), which was the state assessment given from 1997 to 2009.
The High School Proficiency Exam (HSPE) replaces the WASL in determining if high school student are proficient. Passing the HSPE tests for reading and writing are a state graduation requirement.
Subjects tested, MSP:
Third grade: Math and Reading
Fourth grade: Math, Reading and Writing
Fifth grade: Math, Reading and Science
Sixth grade: Math and Reading
Seventh grade: Math, Reading and Writing
Eighth grade: Math, Reading and Science
Subjects tested, HSPE:
Reading, and Writing are administered in 10th grade. Students may retake the test in 11th and 12th grade as needed to meet the state assessment graduation requirement.
End-of-Course (EOC) Exams
In spring 2011 students in grades 7-12 began taking end-
of-course math exams. In spring 2012 students in 10th
grade began taking end-of-course biology exams. The
state is moving to end-of-course exams so students can
be tested on the knowledge and skills they’ve gained from
a specific course rather than on a comprehensive test like
the HSPE that assesses overall knowledge.
Lake Washington School District Test Score Booklet 2013 | Page 3
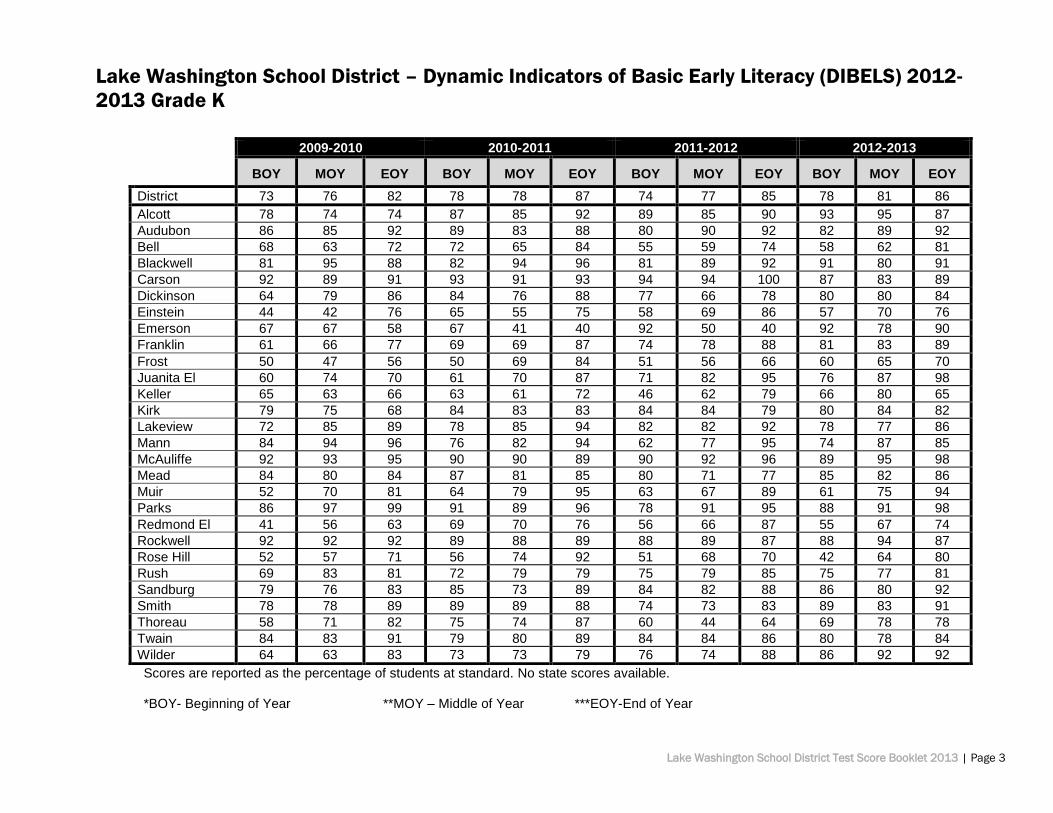
Lake Washington School District – Dynamic Indicators of Basic Early Literacy (DIBELS) 2012-
2013 Grade K
Scores are reported as the percentage of students at standard. No state scores available. *BOY- Beginning of Year **MOY – Middle of Year ***EOY-End of Year
2009-2010 2010-2011 2011-2012 2012-2013
BOY MOY EOY BOY MOY EOY BOY MOY EOY BOY MOY EOY
District 73 76 82 78 78 87 74 77 85 78 81 86
Alcott 78 74 74 87 85 92 89 85 90 93 95 87
Audubon 86 85 92 89 83 88 80 90 92 82 89 92
Bell 68 63 72 72 65 84 55 59 74 58 62 81
Blackwell 81 95 88 82 94 96 81 89 92 91 80 91
Carson 92 89 91 93 91 93 94 94 100 87 83 89
Dickinson 64 79 86 84 76 88 77 66 78 80 80 84
Einstein 44 42 76 65 55 75 58 69 86 57 70 76
Emerson 67 67 58 67 41 40 92 50 40 92 78 90
Franklin 61 66 77 69 69 87 74 78 88 81 83 89
Frost 50 47 56 50 69 84 51 56 66 60 65 70
Juanita El 60 74 70 61 70 87 71 82 95 76 87 98
Keller 65 63 66 63 61 72 46 62 79 66 80 65
Kirk 79 75 68 84 83 83 84 84 79 80 84 82
Lakeview 72 85 89 78 85 94 82 82 92 78 77 86
Mann 84 94 96 76 82 94 62 77 95 74 87 85
McAuliffe 92 93 95 90 90 89 90 92 96 89 95 98
Mead 84 80 84 87 81 85 80 71 77 85 82 86
Muir 52 70 81 64 79 95 63 67 89 61 75 94
Parks 86 97 99 91 89 96 78 91 95 88 91 98
Redmond El 41 56 63 69 70 76 56 66 87 55 67 74
Rockwell 92 92 92 89 88 89 88 89 87 88 94 87
Rose Hill 52 57 71 56 74 92 51 68 70 42 64 80
Rush 69 83 81 72 79 79 75 79 85 75 77 81
Sandburg 79 76 83 85 73 89 84 82 88 86 80 92
Smith 78 78 89 89 89 88 74 73 83 89 83 91
Thoreau 58 71 82 75 74 87 60 44 64 69 78 78
Twain 84 83 91 79 80 89 84 84 86 80 78 84
Wilder 64 63 83 73 73 79 76 74 88 86 92 92

Lake Washington School District Test Score Booklet 2013 | Page 4
Lake Washington School District – Dynamic Indicators of Basic Early Literacy (DIBELS) 2012-
2013 Grade 1
Scores are reported as the percentage of students at standard. No state scores available. *BOY- Beginning of Year **MOY – Middle of Year ***EOY-End of Year
2009-2010 2010-2011 2011-2012 2012-2013
BOY MOY EOY BOY MOY EOY BOY MOY EOY BOY MOY EOY
District 83 83 86 85 84 86 87 85 89 87 85 88
Alcott 85 93 89 80 86 89 95 89 93 85 85 88
Audubon 86 87 79 92 93 93 91 91 87 89 86 91
Bell 84 79 80 80 80 88 78 77 85 80 77 86
Blackwell 89 96 94 91 90 90 94 94 93 97 95 98
Carson 97 96 96 96 95 92 83 89 96 98 93 96
Community 87 62 62 92 85 89 100 100 100 100 86 86
Dickinson 81 86 84 83 86 87 89 78 81 83 84 85
Discovery
Einstein 68 64 72 73 54 58 74 64 74 79 78 82
Explorer
Emerson 83 57 70 64 68 71 54 40 33 100 100 71
Franklin 92 90 94 83 88 92 91 92 90 92 89 89
Frost 55 72 76 47 64 78 67 77 86 75 77 84
Juanita El 64 63 75 80 77 78 85 80 84 82 78 81
Keller 70 81 80 76 80 86 72 78 77 87 92 89
Kirk 69 89 89 80 83 89 88 80 83 72 83 89
Lakeview 82 86 92 86 92 93 82 89 97 84 88 95
Mann 91 90 91 98 98 98 94 91 93 93 86 87
McAuliffe 91 97 96 96 95 94 94 94 91 96 94 94
Mead 85 81 88 93 89 93 90 85 91 88 86 90
Muir 68 62 70 77 77 79 83 78 88 78 68 71
Parks 99 95 98 97 95 96 99 94 96 94 92 95
Redmond El 79 79 82 79 74 84 73 82 87 74 76 82
Rockwell 89 86 86 94 90 89 96 90 90 91 89 90
Rose Hill 75 78 77 66 59 70 78 77 80 72 64 78
Rush 75 81 82 76 75 82 81 84 85 79 79 84
Sandburg 90 87 85 84 86 84 86 84 86 93 84 93
Smith 92 95 98 98 91 91 90 92 93 88 87 91
Thoreau 84 64 73 86 62 74 89 86 94 87 72 82
Twain 87 86 92 90 89 94 73 77 81 87 88 88
Wilder 79 80 87 90 92 92 94 86 86 93 80 82

Lake Washington School District Test Score Booklet 2013 | Page 5
Lake Washington School District – Dynamic Indicators of Basic Early Literacy (DIBELS) 2012-
2013 Grade 2
Scores are reported as the percentage of students at standard. No state scores available. *BOY- Beginning of Year **MOY – Middle of Year ***EOY-End of Year
2009-2010 2010-2011 2011-2012 2012-2013
BOY MOY EOY BOY MOY EOY BOY MOY EOY BOY MOY EOY
District 84 88 85 85 88 85 86 89 85 87 88 86
Alcott 75 84 81 84 89 89 87 93 92 88 93 90
Audubon 84 89 80 89 90 86 93 89 85 86 85 80
Bell 89 87 89 80 83 78 82 89 77 87 89 82
Blackwell 94 99 98 94 95 90 84 90 87 92 98 98
Carson 93 94 89 95 99 97 94 91 93 93 95 92
Community 80 80 80 70 76 68 82 88 87 100 100 100
Dickinson 80 92 90 80 84 79 88 90 85 80 84 83
Discovery
Einstein 73 79 70 70 82 74 55 61 66 67 68 67
Explorer
Emerson 80 49 64 67 68 67 73 80 0 78 62 45
Franklin 84 89 87 93 95 95 94 98 92 86 87 82
Frost 70 84 76 70 76 74 70 76 70 79 81 71
Juanita El 57 65 67 73 78 76 80 85 80 81 81 86
Keller 66 68 71 75 79 68 82 85 83 70 86 83
Kirk 79 84 85 87 86 82 83 88 87 80 84 84
Lakeview 81 88 84 77 92 86 92 96 95 87 89 94
Mann 88 89 86 91 95 89 96 98 100 94 94 91
McAuliffe 97 99 97 93 98 96 97 99 99 90 93 93
Mead 89 91 89 92 89 89 88 89 86 91 91 92
Muir 78 84 83 62 71 72 71 72 69 83 88 83
Parks 94 98 94 94 94 96 97 98 95 97 98 96
Redmond El 80 84 85 79 81 82 67 78 74 80 88 84
Rockwell 87 91 83 82 90 82 88 91 89 92 93 91
Rose Hill 65 71 63 84 84 78 76 70 66 80 84 82
Rush 93 94 91 93 93 92 84 87 84 89 90 85
Sandburg 87 87 87 86 85 87 85 85 82 86 90 86
Smith 92 93 92 97 96 94 84 98 91 95 96 92
Thoreau 78 85 82 74 78 78 79 85 80 92 84 92
Twain 84 87 87 88 90 85 90 93 90 81 82 81
Wilder 91 91 91 84 88 86 86 97 92 89 88 79

Lake Washington School District Test Score Booklet 2013 | Page 6
Lake Washington School District – Washington Assessment of Student Learning (WASL) /
Measurements of Student Progress (MSP) Grade 3: 2013
Scores represent the percent of students who met or exceeded the standards. N/A indicates10 or fewer students took part in the assessment.
READING MATH
WASL MSP WASL MSP
2009 2010 2011 2012 2013 2009 2010 2011 2012 2013
District 86.1 88.3 87.9 86.2 88.3 81.9 73.3 76.8 81.6 82.6
State 71.3 72.1 73.1 68.7 73.1 66.3 61.8 61.6 65.3 65.3
Alcott 89.2 91.4 93.5 89.1 85.8 90.3 87.2 91.7 91.2 81.5
Audubon 90.7 98.6 95.7 91.5 88.2 88.0 94.6 94.5 90.4 92.6
Bell 71.0 85.7 85.0 72.9 84.9 69.8 76.5 57.4 75.5 75.9
Blackwell 92.8 93.6 92.5 89.6 96.9 92.8 69.2 83.6 85.7 85.9
Carson 95.3 94.4 91.5 92.1 94.1 94.1 84.5 85.9 91.0 85.9
Community N/A N/A N/A N/A N/A N/A N/A N/A N/A N/A
Dickinson 75.7 92.4 88.6 83.1 78.9 75.7 77.3 84.3 78.5 83.3
Discovery 81.8 100 91.7 84.6 92.3 63.6 69.2 83.3 76.9 84.6
Einstein 83.6 65.3 71.4 73.7 78.7 67.3 36.7 60.3 72.4 81.3
Emerson 31.0 73.0 56.3 N/A 62.5 25.0 9.1 37.5 N/A 56.3
Explorer 100 100 91.7 91.7 100 100 66.7 75.0 100 100
Franklin 91.7 92.3 93.8 90.3 87.0 88.9 82.4 89.2 87.5 87.0
Frost 82.5 76.9 86.0 74.1 77.8 81.0 56.1 58.0 58.6 72.2
Juanita El 84.0 81.1 87.5 86.8 91.5 72.0 71.7 75.9 88.7 84.7
Keller 78.0 83.7 88.0 84.3 92.6 74.0 67.3 56.0 78.4 64.8
Kirk 95.2 95.6 86.7 87.5 94.5 81.9 76.5 80.7 87.6 80.6
Lakeview 94.3 89.6 83.3 91.4 91.8 90.6 76.6 74.2 80.0 83.5
Mann 91.9 89.5 96.1 92.3 92.9 95.2 80.3 88.2 86.5 90.6
McAuliffe 91.6 93.1 96.1 88.7 94.8 86.7 75.0 83.1 90.1 87.2
Mead 92.0 91.9 91.5 92.7 96.7 89.7 86.9 83.1 84.4 92.3
Muir 80.4 65.1 68.9 60.0 75.4 66.7 33.3 50.8 50.9 73.7
Redmond El 91.8 78.9 80.4 75.6 91.8 80.3 59.6 53.6 75.6 89.4
Rockwell 86.4 92.9 96.6 95.5 95.9 87.5 89.3 83.1 92.7 95.8
Rosa Parks 89.1 92.8 92.0 95.4 93.9 90.9 78.4 87.4 93.1 89.4
Rose Hill 72.7 76.1 82.0 68.4 81.0 65.5 56.3 69.4 59.6 79.3
Rush 81.6 91.8 88.9 86.6 87.1 81.6 75.4 63.6 82.1 73.2
Sandburg 80.0 92.5 81.0 85.7 92.3 78.7 83.6 71.9 74.0 79.5
Smith 95.0 93.6 98.9 95.9 94.8 92.5 87.2 96.8 93.9 87.9
Thoreau 74.6 91.2 80.4 82.8 89.5 66.7 63.2 74.5 67.2 78.9
Twain 86.5 82.0 83.1 86.8 77.3 75.0 55.1 76.9 75.5 68.0
Wilder 92.1 94.3 94.2 96.8 86.4 87.3 76.1 75.6 85.5 80.3

Lake Washington School District Test Score Booklet 2013 | Page 7
Lake Washington School District – Washington Assessment of Student Learning (WASL)/
Measurements of Student Progress (MSP) Grade 4: 2013
READING WRITING MATH
WASL MSP WASL MSP WASL MSP
2009 2010 2011 2012 2013 2009 2010 2011 2012 2013 2009 2010 2011 2012 2013
District 87.4 83.9 84.9 85.2 85.9 80.4 80.2 81.9 80.1 79.5 73.8 72.4 77.1 80.2 80.9
State 73.5 67.2 67.3 71.4 72.5 60.3 61.1 61.4 61.3 62.2 52.3 53.7 59.3 59.3 62.5
Alcott 96.8 91.2 88.5 92.0 87.7 78.5 85.7 87.5 83.9 84.2 89.4 87.9 87.6 90.2 88.6
Audubon 73.3 86.1 90.9 92.1 85.9 76.7 83.3 88.3 80.3 88.5 68.3 75.7 84.6 89.5 88.5
Bell 67.8 83.9 85.2 73.6 81.8 74.6 71.0 73.1 71.7 75.0 59.3 57.1 72.2 62.3 70.5
Blackwell 97.5 90.0 90.8 88.9 88.0 92.6 94.0 90.8 95.2 90.7 82.7 82.0 84.2 84.1 81.3
Carson 92.9 91.9 88.2 89.7 92.5 91.8 86.0 92.6 91.0 87.1 87.1 77.9 89.7 88.5 79.6
Community N/A N/A N/A N/A N/A N/A N/A N/A N/A N/A N/A N/A N/A N/A N/A
Dickinson 87.7 81.7 82.6 83.3 84.6 90.4 80.3 81.2 64.1 78.5 79.5 73.2 76.8 75.6 84.6
Discovery 100 63.6 100 100 100 100.0 81.8 84.6 61.5 92.9 90.0 63.6 69.2 76.9 92.9
Einstein 70.4 72.9 59.6 74.6 64.0 68.5 75.0 72.5 83.1 56.0 49.1 62.5 50.9 66.2 49.3
Emerson 47.4 52.6 63.6 42.9 50.0 36.8 15.8 36.4 28.6 21.4 21.1 26.3 27.3 35.7 50.0
Explorer 100.0 91.7 91.7 83.3 100 100.0 100.0 91.7 91.7 100 100 75.0 75.0 100 100
Franklin 88.7 87.5 87.6 92.9 89.3 77.5 83.3 80.9 82.9 81.3 76.1 73.6 76.4 85.7 82.7
Frost 83.3 80.3 71.7 72.0 74.6 79.6 77.0 75.0 74.0 61.0 57.4 60.7 67.2 74.0 63.8
Juanita El 93.8 83.3 86.5 82.4 87.3 85.1 87.5 86.5 84.3 90.9 87.5 75.0 84.9 80.0 92.7
Keller 83.3 71.7 80.4 78.3 86.3 83.3 76.1 73.9 75.6 76.5 64.8 66.7 63.0 56.5 72.5
Kirk 90.1 97.3 85.9 80.6 90.2 78.9 90.5 76.1 55.4 86.8 84.5 78.4 77.5 69.9 85.4
Lakeview 89.2 95.3 84.7 81.4 91.3 73.4 87.3 81.2 78.3 87.0 73.4 57.8 71.8 70.0 75.4
Mann 94.9 95.5 85.4 93.8 92.6 91.4 95.5 79.3 90.1 90.7 84.7 82.1 86.6 91.4 90.7
McAuliffe 95.9 91.7 92.0 91.1 91.8 90.4 88.9 90.7 94.9 97.3 93.2 81.9 81.3 88.6 94.5
Mead 93.9 87.2 87.5 88.3 83.2 88.8 88.1 86.5 84.4 80.4 79.6 82.4 74.0 89.6 83.0
Muir 71.4 79.6 72.3 75.8 89.5 71.9 65.3 70.3 77.0 78.9 57.8 65.3 53.8 51.6 71.9
Redmond El 74.1 64.5 76.7 69.1 75.9 68.5 50.0 70.0 60.0 74.1 49.1 54.8 53.3 71.4 74.1
Rockwell 88.9 86.1 90.0 90.0 90.4 87.1 73.6 91.3 86.5 78.8 82.8 80.0 95.1 91.3 92.1
Rosa Parks 94.9 84.7 93.7 90.0 94.1 92.3 81.4 81.1 90.0 83.0 85.9 75.0 87.4 87.8 87.4
Rose Hill 78.0 55.2 68.1 68.2 73.2 55.9 69.0 56.9 64.4 41.1 47.5 43.1 43.1 65.9 60.7
Rush 96.2 78.6 88.6 90.6 91.4 83.3 71.4 84.3 75.0 72.9 73.6 76.2 81.7 78.1 82.9
Sandburg 96.1 76.0 86.4 84.5 79.0 88.2 73.3 84.4 73.2 75.3 63.2 64.0 77.3 80.3 70.4
Smith 96.2 96.7 95.7 97.9 93.2 79.7 90.2 87.2 92.6 88.3 82.3 93.5 93.6 97.9 96.1
Thoreau 76.3 76.2 75.4 77.6 78.0 47.5 77.8 82.5 73.5 72.0 57.6 57.1 61.4 71.4 64.0
Twain 88.6 79.8 86.5 93.7 90.2 81.4 78.8 86.5 89.1 78.4 74.3 73.7 87.6 93.8 88.3
Wilder 95.1 94.1 93.4 94.4 91.9 90.2 82.4 93.4 94.4 91.8 85.2 82.4 94.5 87.6 87.1
Scores represent the percent of students who met or exceeded the standards. N/A indicates 10 or fewer students took part in the assessment.
Lake Washington School District Test Score Booklet 2013 | Page 8
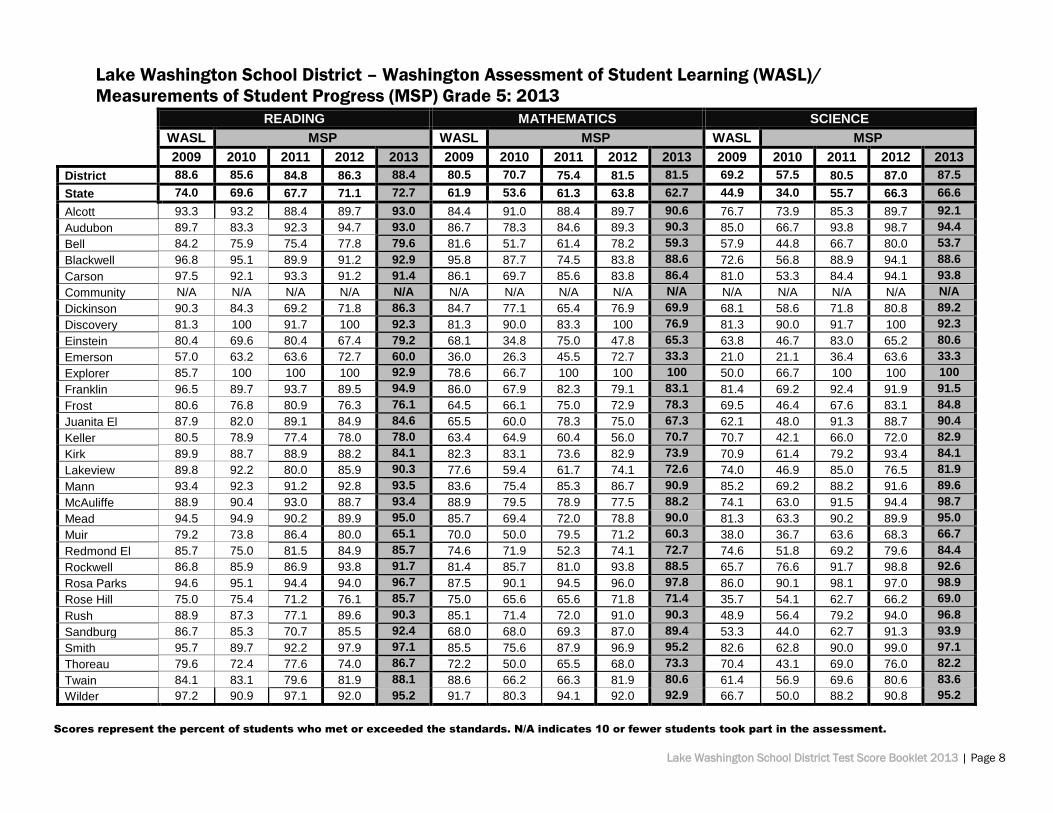
Lake Washington School District – Washington Assessment of Student Learning (WASL)/
Measurements of Student Progress (MSP) Grade 5: 2013
READING MATHEMATICS SCIENCE
WASL MSP WASL MSP WASL MSP
2009 2010 2011 2012 2013 2009 2010 2011 2012 2013 2009 2010 2011 2012 2013
District 88.6 85.6 84.8 86.3 88.4 80.5 70.7 75.4 81.5 81.5 69.2 57.5 80.5 87.0 87.5
State 74.0 69.6 67.7 71.1 72.7 61.9 53.6 61.3 63.8 62.7 44.9 34.0 55.7 66.3 66.6
Alcott 93.3 93.2 88.4 89.7 93.0 84.4 91.0 88.4 89.7 90.6 76.7 73.9 85.3 89.7 92.1
Audubon 89.7 83.3 92.3 94.7 93.0 86.7 78.3 84.6 89.3 90.3 85.0 66.7 93.8 98.7 94.4
Bell 84.2 75.9 75.4 77.8 79.6 81.6 51.7 61.4 78.2 59.3 57.9 44.8 66.7 80.0 53.7
Blackwell 96.8 95.1 89.9 91.2 92.9 95.8 87.7 74.5 83.8 88.6 72.6 56.8 88.9 94.1 88.6
Carson 97.5 92.1 93.3 91.2 91.4 86.1 69.7 85.6 83.8 86.4 81.0 53.3 84.4 94.1 93.8
Community N/A N/A N/A N/A N/A N/A N/A N/A N/A N/A N/A N/A N/A N/A N/A
Dickinson 90.3 84.3 69.2 71.8 86.3 84.7 77.1 65.4 76.9 69.9 68.1 58.6 71.8 80.8 89.2
Discovery 81.3 100 91.7 100 92.3 81.3 90.0 83.3 100 76.9 81.3 90.0 91.7 100 92.3
Einstein 80.4 69.6 80.4 67.4 79.2 68.1 34.8 75.0 47.8 65.3 63.8 46.7 83.0 65.2 80.6
Emerson 57.0 63.2 63.6 72.7 60.0 36.0 26.3 45.5 72.7 33.3 21.0 21.1 36.4 63.6 33.3
Explorer 85.7 100 100 100 92.9 78.6 66.7 100 100 100 50.0 66.7 100 100 100
Franklin 96.5 89.7 93.7 89.5 94.9 86.0 67.9 82.3 79.1 83.1 81.4 69.2 92.4 91.9 91.5
Frost 80.6 76.8 80.9 76.3 76.1 64.5 66.1 75.0 72.9 78.3 69.5 46.4 67.6 83.1 84.8
Juanita El 87.9 82.0 89.1 84.9 84.6 65.5 60.0 78.3 75.0 67.3 62.1 48.0 91.3 88.7 90.4
Keller 80.5 78.9 77.4 78.0 78.0 63.4 64.9 60.4 56.0 70.7 70.7 42.1 66.0 72.0 82.9
Kirk 89.9 88.7 88.9 88.2 84.1 82.3 83.1 73.6 82.9 73.9 70.9 61.4 79.2 93.4 84.1
Lakeview 89.8 92.2 80.0 85.9 90.3 77.6 59.4 61.7 74.1 72.6 74.0 46.9 85.0 76.5 81.9
Mann 93.4 92.3 91.2 92.8 93.5 83.6 75.4 85.3 86.7 90.9 85.2 69.2 88.2 91.6 89.6
McAuliffe 88.9 90.4 93.0 88.7 93.4 88.9 79.5 78.9 77.5 88.2 74.1 63.0 91.5 94.4 98.7
Mead 94.5 94.9 90.2 89.9 95.0 85.7 69.4 72.0 78.8 90.0 81.3 63.3 90.2 89.9 95.0
Muir 79.2 73.8 86.4 80.0 65.1 70.0 50.0 79.5 71.2 60.3 38.0 36.7 63.6 68.3 66.7
Redmond El 85.7 75.0 81.5 84.9 85.7 74.6 71.9 52.3 74.1 72.7 74.6 51.8 69.2 79.6 84.4
Rockwell 86.8 85.9 86.9 93.8 91.7 81.4 85.7 81.0 93.8 88.5 65.7 76.6 91.7 98.8 92.6
Rosa Parks 94.6 95.1 94.4 94.0 96.7 87.5 90.1 94.5 96.0 97.8 86.0 90.1 98.1 97.0 98.9
Rose Hill 75.0 75.4 71.2 76.1 85.7 75.0 65.6 65.6 71.8 71.4 35.7 54.1 62.7 66.2 69.0
Rush 88.9 87.3 77.1 89.6 90.3 85.1 71.4 72.0 91.0 90.3 48.9 56.4 79.2 94.0 96.8
Sandburg 86.7 85.3 70.7 85.5 92.4 68.0 68.0 69.3 87.0 89.4 53.3 44.0 62.7 91.3 93.9
Smith 95.7 89.7 92.2 97.9 97.1 85.5 75.6 87.9 96.9 95.2 82.6 62.8 90.0 99.0 97.1
Thoreau 79.6 72.4 77.6 74.0 86.7 72.2 50.0 65.5 68.0 73.3 70.4 43.1 69.0 76.0 82.2
Twain 84.1 83.1 79.6 81.9 88.1 88.6 66.2 66.3 81.9 80.6 61.4 56.9 69.6 80.6 83.6
Wilder 97.2 90.9 97.1 92.0 95.2 91.7 80.3 94.1 92.0 92.9 66.7 50.0 88.2 90.8 95.2
Scores represent the percent of students who met or exceeded the standards. N/A indicates 10 or fewer students took part in the assessment.

Lake Washington School District Test Score Booklet 2013 | Page 9
Lake Washington School District – Washington Assessment of Student Learning (WASL)/Measurements of Student Progress (MSP)
Grade 6: (In the 2012-2013 school year, as part of a district-wide configuration change, 6th grade became part of middle schools. See next page for 2013 scores.)
Reading Mathematics WASL MSP WASL MSP
2009 2010 2011 2012 2009 2010 2011 2012
District 85.9 79.8 86.7 86.4 75.8 71.2 79.0 82.8
State 72.0 64.5 70.6 70.6 50.9 51.8 58.8 61.4
Alcott 88.4 82.8 92.8 90.4 84.7 84.9 91.7 89.4
Audubon 91.8 87.3 85.5 88.7 73.5 81.0 79.7 85.2
Bell 86.4 71.4 71.7 71.7 63.6 66.7 67.9 66.0
Blackwell 88.1 90.0 98.6 89.8 79.1 90.0 91.9 87.5
Carson 95.7 80.8 93.1 95.7 97.9 75.6 87.4 89.2
Community N/A N/A N/A N/A N/A N/A N/A N/A
Dickinson 91.2 77.6 85.1 80.3 68.4 73.1 83.6 69.0
Discovery 90.0 93.3 100 100 80.0 93.3 100 90.0
Einstein 63.8 77.1 71.4 89.6 46.8 51.0 64.0 85.4
Environmental 94.7 89.5 94.1 94.9 86.8 71.1 85.3 92.3
Explorer 100 66.7 100 100 100 61.5 72.7 100
Emerson 25.0 76.9 60.0 75.0 31.0 69.2 20.0 50.0
Franklin 91.1 90.4 87.8 96.2 86.1 78.3 78.0 86.1
Frost 75.0 81.2 78.0 85.2 64.6 62.3 72.5 77.0
Juanita El 87.5 81.5 83.3 88.9 81.3 55.6 89.3 88.6
Keller 68.2 60.6 89.3 77.4 52.3 64.7 77.2 66.0
Kirk 79.4 83.8 92.2 93.0 77.9 83.8 89.1 87.1
Lakeview 85.7 82.7 90.2 78.8 67.3 65.4 77.0 80.3
Mann 96.3 92.6 87.3 93.9 85.4 70.4 84.1 93.9
McAuliffe 94.8 83.6 87.0 89.7 85.7 70.9 78.3 86.8
Mead 88.3 89.4 94.7 92.4 83.1 81.2 76.8 91.1
Muir 76.8 47.7 71.7 93.3 57.1 36.4 47.5 84.4
Redmond El 86.0 79.4 73.3 80.0 63.2 60.9 75.0 76.7
Rockwell 96.8 82.8 93.5 79.5 82.5 68.8 82.3 80.2
Rosa Parks 77.6 81.1 95.8 91.2 85.7 83.0 91.7 87.7
Rose Hill 81.5 57.8 74.6 80.7 70.4 45.3 62.7 73.7
Rush 79.2 71.1 87.5 80.0 62.5 50.0 79.6 80.5
Sandburg 94.8 69.6 79.7 83.8 86.2 58.0 66.2 82.4
Smith 91.6 85.5 97.5 92.0 86.3 84.1 95.1 88.5
Stella Schola 93.3 90.3 90.0 96.7 86.7 83.9 86.7 90.0
Thoreau 79.1 76.5 81.0 73.1 69.8 74.5 69.0 71.2
Twain 89.4 59.0 84.8 73.6 69.7 66.7 72.7 76.9
Wilder 91.2 89.1 93.2 93.0 87.7 82.8 94.9 94.7
Scores represent the percent of students who met or exceeded the standards. N/A indicates 10 or fewer students took part in the assessment.

Lake Washington School District Test Score Booklet 2013 | Page 10
Lake Washington School District – Measurements of Student Progress (MSP) Grade 6: 2013 (In the 2012-2013 school year, as part of a district-wide configuration change, 6th grade became part of middle schools. See 2013 scores below.)
Reading Mathematics
MSP
2013 2013
District 84.5 79.1
State 71.5 59.4
Emerson K-12 76.5 47.1
EAS 92.3 82.7
Evergreen 89.6 87.2
Finn Hill 77.7 68.0
Inglewood 92.1 88.3
Kamiakin 75.4 73.3
Kirkland 81.3 78.3
Northstar 96.7 93.3
Redmond 83.2 78.0
Renaissance 93.8 84.4
Rose Hill 79.6 70.8
Stella Schola 96.7 93.3
Scores represent the percent of students who met or exceeded the standards. N/A indicates 10 or fewer students took part in the assessment.

Lake Washington School District Test Score Booklet 2013 | Page 11
Lake Washington School District – Washington Assessment of Student Learning (WASL) /
Measurements of Student Progress (MSP) Grade 7: 2013
READING WRITING MATHEMATICS
WASL MSP WASL MSP WASL MSP
2009 2010 2011 2012 2013 2009 2010 2011 2012 2013 2009 2010 2011 2012 2013
District 74.7 81.1 74.6 87.3 83.4 81.6 86.0 87 88.8 86.6 73.5 77.7 74.1 80.7 83.6
State 59.3 63.3 56.5 71.2 68.8 69.7 70.2 71.0 71.0 71.1 51.8 55.2 57.0 59.2 63.8
Environmental 88.9 91.7 79.5 100 92.2 94.4 97.2 94.9 100 96.1 91.7 86.1 79.5 84.2 88.2
Evergreen 74.2 84.7 79.1 89.2 84.4 73.7 88.7 88.1 92.4 86.2 75.8 82.3 81.4 87.2 87.9
Emerson K-12 50.0 46.7 90.0 66.7 63.2 28.6 53.3 88.9 70.8 68.4 42.9 40.0 60.0 45.8 31.6
Finn Hill 66.9 75.7 58.4 79.9 75.9 68.7 81.7 77.2 86.8 81.2 73.6 72.2 57.0 77.4 74.7
Inglewood 74.8 83.4 81.0 92.4 88.9 92.7 93.1 95.2 94.8 91.2 78.6 83.4 81.9 84.8 89.9
International 93.2 87.7 93.8 98.7 96.3 94.9 92.3 98.4 98.7 96.3 94.8 89.2 96.9 96.2 96.3
Kamiakin 66.7 69.2 63.5 74.1 79.1 76.3 66.9 72.4 73.5 84.7 56.9 57.6 55.9 63.3 76.9
Kirkland 77.0 71.7 73.6 88.8 81.1 83.1 89.2 87.9 86.3 88.3 71.4 75.3 69.8 82.7 85.7
Northstar 83.9 93.1 80.6 100 96.7 83.9 89.7 96.8 100 96.7 77.4 100 87.1 96.7 96.7
Redmond 79.6 87.9 82.2 88.1 82.8 78.0 89.5 91.3 89.5 85.6 75.1 79.3 81.8 84.7 82.4
Renaissance 90.0 87.5 81.3 93.5 89.7 93.3 81.3 93.8 87.5 72.4 90.0 84.4 78.1 90.0 86.2
Rose Hill 63.2 75.9 56.0 80.8 76.4 83.8 75.7 74.7 82.9 82.2 59.6 72.7 56.3 65.5 76.4
Stella Schola 96.7 100 86.7 96.7 96.7 96.7 96.8 100 90.0 86.7 93.3 90.3 96.7 86.7 90.0
Scores represent the number of students who met or exceeded the standards. N/A indicates 10 or fewer students took part in the assessment.

Lake Washington School District Test Score Booklet 2013 | Page 12
Lake Washington School District – Washington Assessment of Student Learning (WASL)/
Measurements of Student Progress (MSP) Grade 8: 2013
READING MATHEMATICS SCIENCE
WASL MSP WASL MSP WASL MSP
2009 2010 2011 2012 2013 2009 2010 2011 2012 2013 2009 2010 2011 2012 2013
District 82.7 82.2 86.9 83.5 81.3 73.3 62.3 69.7 73.1 73.2 75.5 77.8 85.2 84.9 81.0
State 67.5 69.2 68.7 67.2 66.4 50.8 51.5 50.4 55.4 53.3 51.1 54.4 61.6 66.3 64.9
Environmental 100 91.4 100 94.7 91.7 91.2 85.7 91.7 71.1 86.1 100 91.4 97.2 97.4 88.9
Evergreen 88.1 85.7 89.5 86.5 85.6 79.8 68.6 69.4 81.8 79.5 80.8 77.2 89.6 90.1 85.9
Emerson K-12 78.0 80.0 77.8 56.3 70.4 44.0 20.0 27.8 18.8 44.4 44.0 50.0 55.6 37.5 59.3
Finn Hill 76.4 79.4 79.5 76.4 78.3 62.6 60.6 63.2 64.6 76.5 56.9 73.1 77.8 75.7 79.5
Inglewood 88.9 84.1 91.4 86.3 87.6 81.8 58.4 74.1 74.7 69.9 85.0 83.8 90.8 92.8 80.7
International 94.7 94.9 95.2 100 92.0 92.1 91.5 88.7 91.9 90.7 93.2 96.6 96.8 93.5 98.7
Kamiakin 71.3 71.3 78.7 74.3 65.7 59.4 48.2 56.5 57.9 58.0 64.0 64.8 65.9 77.2 65.3
Kirkland 77.4 84.5 75.5 86.7 86.1 65.9 58.3 62.2 78.5 83.0 66.1 76.0 84.0 86.7 88.6
Northstar 97.3 82.8 93.3 93.3 100 83.8 86.2 76.7 86.7 96.7 86.5 89.7 93.3 93.3 96.7
Redmond 79.4 80.9 87.4 85.3 82.0 71.5 59.6 73.9 78.6 78.7 78.4 80.9 89.0 88.4 83.4
Renaissance 66.7 87.1 96.9 86.2 93.3 59.3 83.9 90.6 75.9 73.3 66.7 80.6 100 89.7 96.7
Rose Hill 76.9 76.3 90.1 76.0 62.8 64.0 50.0 61.3 63.0 52.6 62.2 67.2 76.6 70.5 66.8
Stella Schola 96.6 100 96.7 100 96.7 96.6 90.0 93.3 100 86.7 93.1 93.3 93.3 96.4 93.3
Scores represent the percent of students who met or exceeded the standards. N/A indicates 10 or fewer students took part in the assessment.
Lake Washington School District Test Score Booklet 2013 | Page 13
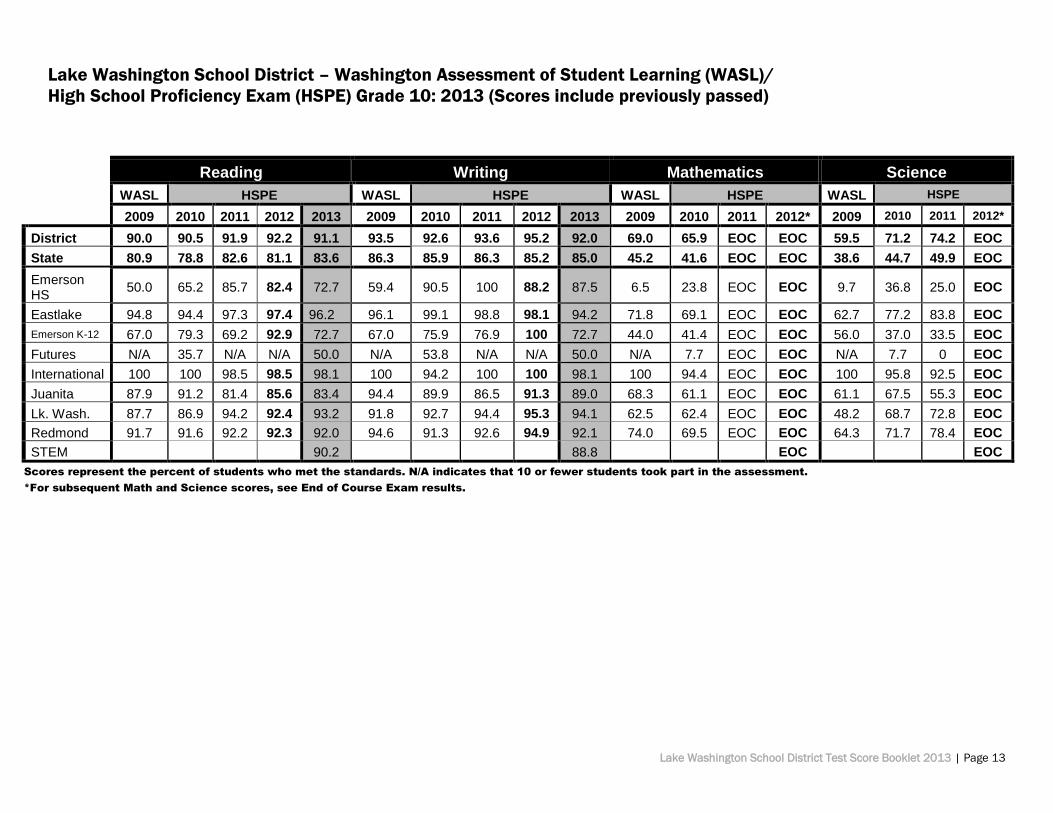
Lake Washington School District – Washington Assessment of Student Learning (WASL)/
High School Proficiency Exam (HSPE) Grade 10: 2013 (Scores include previously passed)
Reading Writing Mathematics Science
WASL HSPE WASL HSPE WASL HSPE WASL HSPE
2009 2010 2011 2012 2013 2009 2010 2011 2012 2013 2009 2010 2011 2012* 2009 2010 2011 2012*
District 90.0 90.5 91.9 92.2 91.1 93.5 92.6 93.6 95.2 92.0 69.0 65.9 EOC EOC 59.5 71.2 74.2 EOC
State 80.9 78.8 82.6 81.1 83.6 86.3 85.9 86.3 85.2 85.0 45.2 41.6 EOC EOC 38.6 44.7 49.9 EOC
Emerson HS
50.0 65.2 85.7 82.4 72.7 59.4 90.5 100 88.2 87.5 6.5 23.8 EOC EOC 9.7 36.8 25.0 EOC
Eastlake 94.8 94.4 97.3 97.4 96.2 96.1 99.1 98.8 98.1 94.2 71.8 69.1 EOC EOC 62.7 77.2 83.8 EOC
Emerson K-12 67.0 79.3 69.2 92.9 72.7 67.0 75.9 76.9 100 72.7 44.0 41.4 EOC EOC 56.0 37.0 33.5 EOC
Futures N/A 35.7 N/A N/A 50.0 N/A 53.8 N/A N/A 50.0 N/A 7.7 EOC EOC N/A 7.7 0 EOC
International 100 100 98.5 98.5 98.1 100 94.2 100 100 98.1 100 94.4 EOC EOC 100 95.8 92.5 EOC
Juanita 87.9 91.2 81.4 85.6 83.4 94.4 89.9 86.5 91.3 89.0 68.3 61.1 EOC EOC 61.1 67.5 55.3 EOC
Lk. Wash. 87.7 86.9 94.2 92.4 93.2 91.8 92.7 94.4 95.3 94.1 62.5 62.4 EOC EOC 48.2 68.7 72.8 EOC
Redmond 91.7 91.6 92.2 92.3 92.0 94.6 91.3 92.6 94.9 92.1 74.0 69.5 EOC EOC 64.3 71.7 78.4 EOC
STEM 90.2 88.8 EOC EOC
Scores represent the percent of students who met the standards. N/A indicates that 10 or fewer students took part in the assessment.
*For subsequent Math and Science scores, see End of Course Exam results.

Lake Washington School District Test Score Booklet 2013 | Page 14
Lake Washington School District – Washington End-Of-Course Exams
Grade 7: 2013
Mathematics BIO EOC
YEAR 1
Algebra
EOC
YEAR 1
Algebra
EOC
YEAR 1
Algebra
EOC
BIOLOGY
2011 2012 2013
District 98.4 99.1 98.4 95.1
State 94.3 96.5 93.4 95.3
Environmental 90.9 N/A 86.4 N/A
Evergreen 100 97.3 98.5 100
Emerson K-12 N/A N/A 50.0 N/A
Finn Hill 100 100 100 N/A
Inglewood 96.6 100 100 N/A
International N/A 100 100 94.9
Kamiakin 100 100 98.3 N/A
Kirkland 96.6 100 100 N/A
Northstar 100 100 94.1 N/A
Redmond 99.2 99.0 99.2 100
Renaissance N/A N/A N/A N/A
Rose Hill 100 100 98.3 N/A
Stella Schola N/A 86.7 N/A N/A
Scores represent the percent of students who met the standards.
N/A indicates that 10 or fewer students took part in the assessment.

Lake Washington School District Test Score Booklet 2013 | Page 15
Lake Washington School District – Washington End-Of-Course Exams Grade 8: 2013
Mathematics BIO EOC
YEAR 1
Algebra
EOC
YEAR 2
Geometry
EOC
YEAR 1
Algebra
EOC
YEAR 2
Geometry
EOC
YEAR 1
Algebra
EOC
YEAR 2
Geometry
EOC
BIOLOGY
2011 2012 2013
District 75.6 99.4 75.8 99.3 67.5 99.5 100
State 83.8 98.3 85.6 98.7 82.6 98.8 96.8
Environmental 97.1 N/A 81.5 N/A 69.2 100 N/A
Evergreen 89.1 100 90.5 100 76.7 100 N/A
Emerson K-12 N/A N/A N/A N/A 50.0 85.7 100
Finn Hill 56.8 100 83.5 96.3 80.0 100 N/A
Inglewood 79.9 96.9 67.7 99.1 49.8 98.8 N/A
International 100 N/A 92.7 N/A 96.8 100 100
Kamiakin 52.5 100 45.1 100 36.4 100 N/A
Kirkland 67.3 100 81.4 100 87.0 100 N/A
Northstar 78.9 N/A 76.9 100 81.8 100 N/A
Redmond 81.6 100 69.8 100 75.8 100 N/A
Renaissance 85.2 N/A 71.4 N/A 79.3 N/A N/A
Rose Hill 59.0 100 77.0 100 61.1 100 N/A
Stella Schola 86.7 N/A 100 N/A N/A N/A N/A
Scores represent the percent of students who met the standards.
N/A indicates that 10 or fewer students took part in the assessment.
Lake Washington School District Test Score Booklet 2013 | Page 16
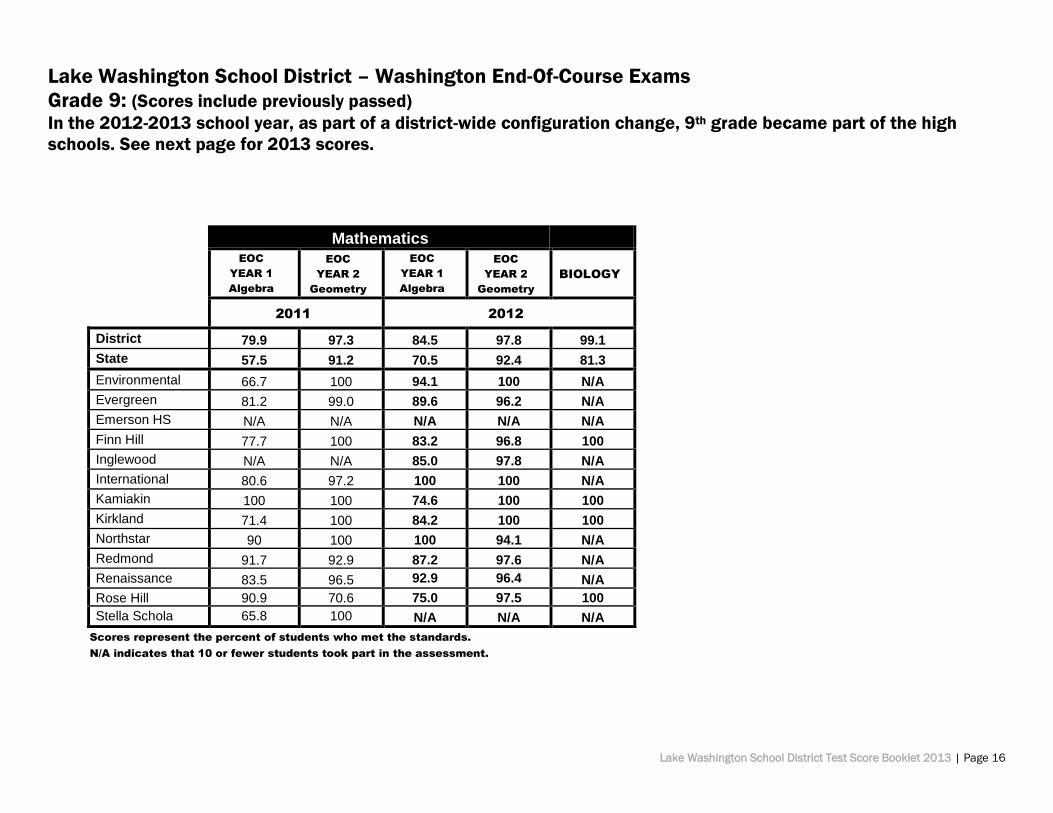
Lake Washington School District – Washington End-Of-Course Exams
Grade 9: (Scores include previously passed)
In the 2012-2013 school year, as part of a district-wide configuration change, 9th grade became part of the high
schools. See next page for 2013 scores.
Mathematics EOC
YEAR 1
Algebra
EOC
YEAR 2
Geometry
EOC
YEAR 1
Algebra
EOC
YEAR 2
Geometry
BIOLOGY
2011 2012
District 79.9 97.3 84.5 97.8 99.1
State 57.5 91.2 70.5 92.4 81.3
Environmental 66.7 100 94.1 100 N/A
Evergreen 81.2 99.0 89.6 96.2 N/A
Emerson HS N/A N/A N/A N/A N/A
Finn Hill 77.7 100 83.2 96.8 100
Inglewood N/A N/A 85.0 97.8 N/A
International 80.6 97.2 100 100 N/A
Kamiakin 100 100 74.6 100 100
Kirkland 71.4 100 84.2 100 100
Northstar 90 100 100 94.1 N/A
Redmond 91.7 92.9 87.2 97.6 N/A
Renaissance 83.5 96.5 92.9 96.4 N/A
Rose Hill 90.9 70.6 75.0 97.5 100
Stella Schola 65.8 100 N/A N/A N/A
Scores represent the percent of students who met the standards.
N/A indicates that 10 or fewer students took part in the assessment.

Lake Washington School District Test Score Booklet 2013 | Page 17
Lake Washington School District – Washington End-Of-Course Exams Grade 9: 2013 (Scores include previously passed)
MATHEMATICS BIO EOC
YEAR 1
Algebra
EOC
YEAR 2
Geometry
BIOLOGY
2013
District 87.1 97.1 95.6
State 53.5 93.6 82.0
EASTLAKE 88 97.2 N/A
EMERSON 50.0 0.0 50.0
EMERSON K-12 100 100 80.0
INTERNATIONAL 100 96.2 94.4
JUANITA 79.8 93.4 96.0
LAKE WASHINGTON 81.4 98.6 98.8
REDMOND 91.3 98.5 75.0
STEM 96.8 98.7 N/A
Scores represent the percent of students who met the standards.
N/A indicates that 10 or fewer students took part in the assessment.
Lake Washington School District Test Score Booklet 2013 | Page 18
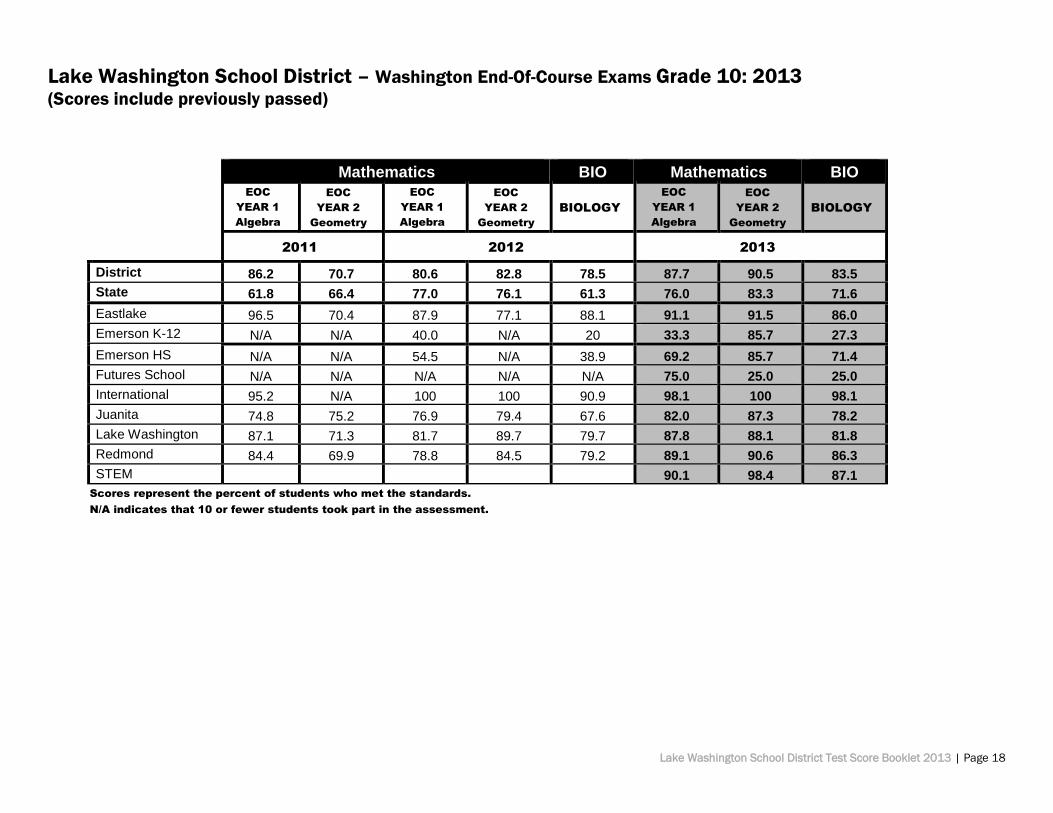
Lake Washington School District – Washington End-Of-Course Exams Grade 10: 2013 (Scores include previously passed)
Mathematics BIO Mathematics BIO EOC
YEAR 1
Algebra
EOC
YEAR 2
Geometry
EOC
YEAR 1
Algebra
EOC
YEAR 2
Geometry
BIOLOGY
EOC
YEAR 1
Algebra
EOC
YEAR 2
Geometry
BIOLOGY
2011 2012 2013
District 86.2 70.7 80.6 82.8 78.5 87.7 90.5 83.5
State 61.8 66.4 77.0 76.1 61.3 76.0 83.3 71.6
Eastlake 96.5 70.4 87.9 77.1 88.1 91.1 91.5 86.0
Emerson K-12 N/A N/A 40.0 N/A 20 33.3 85.7 27.3
Emerson HS N/A N/A 54.5 N/A 38.9 69.2 85.7 71.4
Futures School N/A N/A N/A N/A N/A 75.0 25.0 25.0
International 95.2 N/A 100 100 90.9 98.1 100 98.1
Juanita 74.8 75.2 76.9 79.4 67.6 82.0 87.3 78.2
Lake Washington 87.1 71.3 81.7 89.7 79.7 87.8 88.1 81.8
Redmond 84.4 69.9 78.8 84.5 79.2 89.1 90.6 86.3
STEM 90.1 98.4 87.1
Scores represent the percent of students who met the standards.
N/A indicates that 10 or fewer students took part in the assessment.

Lake Washington School District Test Score Booklet 2013 | Page 19
Lake Washington School District – Student Achievement Test (SAT) 2010-2013
2010 2011 2012 2013
Reading Math Writing Reading Math Writing Reading Math Writing Reading Math Writing
District 560 573 555 562 572 557 560 581 554 565 576 560
State 524 531 507 523 529 508 519 530 503 515 523 499
Total Group 500 515 491 497 514 489 496 514 488 496 514 488
Eastlake 549 559 547 552 562 550 547 568 544 552 565 555
International 662 663 682 664 660 677 641 661 672 663 686 675
Juanita 548 569 532 549 570 532 549 576 538 538 555 521
Lake Wash 549 556 543 559 556 549 546 556 533 549 549 541
Redmond 568 586 564 569 583 567 572 595 563 584 594 576
N/A indicates that 10 or fewer students took part in the assessment
Percentage of Students Taking SAT 2010-2013
2010 2011 2012 2013
District 60% 78% 77% 74%
Eastlake 74 86 82 87
International 96 96 103* 102*
Juanita 61 76 69 64
Lake Wash 62 70 69 66
Redmond 66 73 80 73
*Students may test more than one time.
N/A indicates that 10 or fewer students took part in the assessment

Lake Washington School District Test Score Booklet 2013 | Page 20
Lake Washington School District – American College Test (ACT) 2010 - 2013
2010 2011 2012 2013
District 25.3 25.6 25.5 25.5
State 23.0 22.8 22.9 22.8
National 21.0 21.1 21.1 20.9
Eastlake 25.5 25.1 25.4 25.5
International 29.6 29.5 28.8 30.1
Juanita 24.9 24.4 24.8 24.4
Lake Washington 23.4 24.9 23.9 24.3
Redmond 25.7 26.2 26.0 25.9
N/A indicates that 10 or fewer students took part in the assessment
Percentage of Students Taking ACT 2010 - 2013
N/A indicates that 10 or fewer students took part in the assessment
2010 2011 2012 2013
District 24% 27% 31% 32%
Eastlake 31 33 39 42
Juanita 26 15 21 22
International 40 42 51 47
Lake Wash 22 21 29 22
Redmond 23 32 27 27

Lake Washington School District Test Score Booklet 2013 | Page 21
Lake Washington School District
Test Scores 2013
Board of Directors
Nancy Bernard
Siri Bliesner
Christopher Carlson
Jackie Pendergrass
Mark Stuart
Administration
Dr. Traci Pierce – Superintendent
Janene Fogard – Deputy Superintendent
Matt Manobianco – Associate Superintendent
Heather Sinclair – Associate Superintendent
Sally Askman – Director of Technology
Linda Stevens – Director of Curriculum and Assessment
Kathryn Reith – Director of Communications
www.lwsd.org
Equal Opportunity Employer
The Lake Washington School District does not discriminate on the basis of race, color, national origin, sex, disability, age, gender, marital status, creed, religion, honorably discharged veteran, military status, sexual orientation including gender expression or identity, the presence of any sensory, mental or physical disability, or the use of a trained guide dog or service animal by a person with a disability, in its programs and activities and provides equal access to the Boy Scouts and other designated youth groups. The following person has been designated to handle inquiries regarding the nondiscrimination policies: Director of Human Resources, 16250 NE 74th Street, Redmond Washington, 98052, (425) 936-1266
Section 504/ADA questions may be directed to Paul Vine, Special Education Director, P.O. Box 97039, Redmond, WA 98073 (425) 936-1302.
January 2013