texas dual language program cost analysis
TRANSCRIPT
Texas Dual Language Program Cost Analysis
A Report
developed for the
Texas Education Agency and
The Texas Senate Education Committee
Dr. Rafael Lara-Alecio [email protected] Dr. Martha Galloway [email protected]
Dr. Lakshmi Mahadevan [email protected]
Ben Mason [email protected]
Department of Educational Psychology College of Education and Human Development
Texas A&M University College Station, Texas
Dr. Beverly J. Irby [email protected]
Dr. Genevieve Brown [email protected]
Department of Educational Leadership and Counseling College of Education
Sam Houston State University Huntsville, Texas
Dr. Leo Gómez
[email protected] Department of Curriculum and Instruction
College of Education The University of Texas Pan-American
Edinburg, Texas
January 2005

Texas Dual Language Program Cost Analysis
2
For Inquiries Contact
979-845-2599
Texas A&M University
Bilingual Education Programs
To view the Texas Directory of Dual Language Programs
See
http://texastwoway.org
(This is the only state DL directory in the U.S.)

Texas Dual Language Program Cost Analysis
3
Table of Contents
Executive Summary.......................................................................................................... 4
Texas Dual Language Program Cost Analysis............................................................... 8
Literature Review ............................................................................................................. 8
English as a Second Language................................................................................... 9
English Immersion.................................................................................................... 10
Transitional Bilingual............................................................................................... 11
Dual Language Education........................................................................................ 12
The Focus of the Study: Dual Language Costs ............................................................ 23
Methodology .................................................................................................................... 26
Results .............................................................................................................................. 28
Recommendations ........................................................................................................... 46
Final Remarks ................................................................................................................. 49
Selected References......................................................................................................... 50
Appendices....................................................................................................................... 53

Texas Dual Language Program Cost Analysis
4
Executive Summary
U.S. public school systems have felt increasing pressure to produce a workforce
with high levels of literacy while at the same time encountering large numbers of
immigrant families whose native language is not English and who often have had limited
educational opportunities. Providing a quality education for English language learners
(ELLs) has become critical as nearly 4.5 million children come to school from families
where the home language is other than English (U.S. Census, 2000). In fact, in 2002,
ELLs comprised 9.64% of the national enrollment in public elementary and secondary
schools and 79% of those ELLs were Spanish speakers (National Center for Education
Statistics, 2002). More specifically, Texas had an 84% growth in the ELL population
during the twelve-year period from1989 to 2001; this percentage growth continues to rise
with a current estimation of 630,000 ELLs (14% of the total public school population) for
the 2003-2004 school year.
There are a myriad of educational implications related to this growing population.
The U.S. Census Bureau (Therrien & Ramirez, 2000) reported that Hispanics graduate
from high school at a rate of 57% compared to non-Hispanic Whites who graduate at the
rate of 88.4%. Additionally, 27.3% of Hispanics have less than a ninth grade education
compared to only 4.2% of non-Hispanic Whites. Two of the most cited reasons for these
achievement differences are language differences and socio-economic status (SES). The
large influx of Hispanic students in U.S. and Texas schools and expected population
trends have resulted in a critical need to improve academic achievement for Hispanic
youth.

Texas Dual Language Program Cost Analysis
5
Due to purported academic effectiveness and cultural and linguistic inclusivity,
dual language (DL) programs (sometimes referred to as two-way immersion) have seen a
rapid increase in Texas and the nation, however, an extensive review of literature
indicated that no national or state-wide studies have addressed the issue of cost analysis
of dual language programs. Information on funding of effective educational programs for
ELLs is vital for all stakeholders, including policy makers and current and future DL
program administrators.
In Fall 2004, Senator Florence Shapiro (Chair, Texas Senate Committee on
Education) and the Texas Education Agency requested Texas A&M University, Sam
Houston State University, and University of Texas Pan American to conduct a cost
analysis study of dual language programs in Texas. As a result, an online survey was
developed, piloted and distributed to all known Dual Language (DL) programs and to all
Texas school districts. The survey, requesting information on DL costs, consisted of 91
items. From a total of 166 known DL programs in Texas, 83 DL campus surveys were
included in the analysis, representing 48 school districts and resulting in a 50% response
rate. For the purpose of the study a small DL program was comprised of 10-120 students,
a medium DL program included 121-240 students, and a large program was designated as
consisting of 240+ students.
The study was guided by the following research question: How much does a DL
program cost per pupil above and beyond the typical transitional bilingual program?
Another question concerning costs also guided this study: Assuming the dual language
class is not appreciably smaller than the typical bilingual classroom, what would be the
additional management costs, staff costs, instructional costs, curriculum costs, equipment

Texas Dual Language Program Cost Analysis
6
costs, material costs, assessment costs, staff development costs, and parent involvement
costs?
The results showed that beyond the state Title III allotment, DL programs’ annual
costs on average were $290 per pupil in large programs; $406 per pupil in medium
programs; and $879 per pupil in small programs. Notably, an insignificant difference
was found between the two most common program models, 50:50 or 90:10. Additionally,
a two-teacher mixed model was found to be the least expensive model. The largest
categorical costs for all three DL program sizes were associated with managerial costs.
These costs were significantly diminished as program size increased.
The complete report details percentages of total budgetary costs in 12 categories:
managerial, staff, instruction, staff development, Spanish curriculum, English curriculum,
assessment, equipment, recruitment, public relations, parental involvement, and other
materials. Further analyses were reported based on start-up costs, annual costs, and
additional funding requests.
Our data indicated that smaller DL programs are more costly to implement and
maintain. As program size increases, per pupil costs diminish. We also found a positive
relationship between federal funding and program size (i.e. as program size increased so
did funding). Twenty-two of the 25 reporting large DL programs (88%) received federal
funds. The two-teacher mixed model was the most cost effective and the most frequently
employed teacher model. Approximately half of the students in the DL programs (the
native English speakers) were not supported by any state or federal ELL entitlements.
Instructional materials, assessment instruments, and parental involvement programs for
this population of DL students and their parents significantly impacted program costs and

Texas Dual Language Program Cost Analysis
7
feasibility. In addition the data revealed a common concern across programs related to
costs associated with native English speakers and the discontinuation of federal Title III
grants that funded start-up and five years of implementation for a significant number
(n=53 or 64% ) of reporting DL programs.
This report will not address the relationship between costs and program
effectiveness. We must caution that the most cost effective DL program may not be the
most educationally effective DL program. Successful schools’ research points to several
components such as: increased staff development, parental involvement programs,
extended hours, strong educational leadership, quality curriculum, and early and
sustained interventions as elements of strong, research-based programs. All of these
components may incur costs above any basic program implementation.
Dual language programs provide opportunities for language minority and
language majority students to reach high levels of bilingualism and biliteracy needed to
prepare them for the 21st century workplace. We concur with Senate Resolution No. 50
that recognizes the worth of dual language education.
“Resolved that the State of Texas work towards the worthy goal of ensuring that
someday every Texan will master English plus another language” (Texas Senate
Resolution No. 50, 2001).

Texas Dual Language Program Cost Analysis
8
Texas Dual Language Program Cost Analysis
The English Language Learner (ELL) population in Texas has experienced an
84% growth since 1989 (National Clearinghouse for English Language Acquisition,
2002) and was at 630,000 in 2003 (Texas Education Agency, 2003). This dramatic
increase places Texas second only to California in the number of school-age ELLs
(National Clearinghouse for English Language Acquisition, 2003) and along with this
demographic change comes a focused attention on effective educational programs for
ELLs. Dual language (sometimes referred to as two-way immersion) bilingual programs
have seen an increase nationally and a significant increase in Texas due to research that
shows positive academic, linguistic, and affective results for ELLs and their English-
speaking peers. However, there is a paucity of information available about the costs
associated with implementation and maintenance of dual language programs. Conducted
in Fall 2004 by Texas A&M University, Sam Houston University, and University of
Texas Pan American, this report is the first detailed cost analysis of Texas dual language
bilingual programs and is the only known report of its kind nationally for dual language
programs.
Literature Review
Texas mandates that every student who has a home language other than English
and that is identified as Limited English Proficient (LEP) is provided an opportunity to
participate in bilingual or English as a second language programs (TEC Chapter 29,
subchapter B). The state offers four bilingual education program models at the
elementary level: (1) English as a second language; (2) English immersion; (3)
transitional bilingual, and, (4) two-way / dual language bilingual education. As indicated

Texas Dual Language Program Cost Analysis
9
in Table 1, the four program types carry with them specific goals, student types, teacher
certifications, language of instruction, and program lengths.
Table 1 Program Models Serving ELLs in Texas Program Goals Students Teacher
Certifications Role of L1/L2
Length of Program
ESL English language and academics
ELLs ESL Generalist L2 used as language of instruction
1-2 years emphasis on early exit
Sheltered English Immersion
English language and academics
ELLs ESL Generalist
L2 used as language of instruction
1-2 years emphasis on early exit
Transitional Bilingual
English language and academics; ELLs native language phased out
ELLs Bilingual Generalist
L1 & L2 used as language of instruction
2-4 years; usually early exit; few late exit
Dual Language
Bilingualism Biliteracy Biculturalism High Academic Achievement in L1 and L2
ELLs and Native English speakers
Bilingual Generalist and ESL Generalist MS & HS Foreign language certified w/ native fluency; Content-area certification with high foreign language fluency
L1 & L2 used as language of instruction
Typically K-7 with goal of HS language maintenance
Texas law mandates that all school districts with at least 20 ELL students1 within
the same language classification in the same grade level district-wide must offer
Bilingual Education (BE), otherwise, English as a Second Language (ESL), or an
alternative language program must be implemented (Texas Education Code Chapter 29,
Subchapter B).
English as a Second Language
According to Lara-Alecio, Galloway, Irby, Rodriguez, and Gomez (2004),
English as a second language (ESL) programs are considered “pull out” models in which
1 The Texas Education Code (2002) lists ELL students as limited English proficient.

Texas Dual Language Program Cost Analysis
10
ELL students may be “pulled out” from classes in order to receive some sort of English
as a second language instruction. Students often lose valuable access to the full
curriculum and have no access to native language support in the content areas. The main
focus is on reading, grammar, vocabulary, and spoken and written communication in
English. Ironically, the ESL model, perceived as a deficit model or remedial approach to
instruction in which students must overcome their native language "problems," is the
least effective, most costly, and one of the most implemented models (Thomas & Collier,
1997). In 2000, Alanís indicated that 38% of eligible Texas students are served in ESL
programs and are the most expensive to operate since ESL teachers must be hired to
attend to pull-out students. A recent trend is to certify regular classroom teachers in ESL
education so that a “pull-out” ESL teacher is not required; instead, the student receives
ESL education in the mainstream classroom.
English Immersion
Often referred to as structured English immersion (SEI) for minority students, this
model is less successful for ELLs’ long-term academic achievement than those with
native language support (Ramirez, et al., 1991; Thomas & Collier, 1996). Students with
different native languages (or low-incidence language groups) where first language
instruction is not feasible often make up English immersion classes. In the SEI model,
content for all subjects and all instruction in a self-contained classroom is carried out in
English. However, in a departmentalized situation, SEI occurs in each course and is
implemented by the various teachers (Ovando, Collier & Combs, 2002).

Texas Dual Language Program Cost Analysis
11
As a result of having to learn the second language along with the content, ELLs
may fall behind academically. Subtractive bilingualism is the typical outcome of SEI as
the native language is not supported (Baker, 1996). The SEI model is also perceived as a
deficit language model (Mora, 2001) in that students are viewed as having to overcome
English language deficiencies.
Transitional Bilingual
The transitional bilingual program model serves language minority students who
are not yet proficient in English and is generally considered as a segregated model.
Instruction for the content areas is carried out in the native language. Thus the native
language acts as a temporary bridge to the acquisition of the second language (Baca &
Cervantes, 1989; Birman & Ginsburg, 1983; Bruce, Lara-Alecio, Parker, Hasbrouck,
Weaver, & Irby, 1997). Instruction is also delivered in English as a second language.
Gradually students are transitioned to all-English classes and are exited out of bilingual
programs at the end of three years and in some cases in one or two years (early-exit
transitional). Within this program type the focus is on learning English, thus there is a
need to “transition” to an English classroom (Brisk, 1998). Early exit transition programs
represent a deficit model in that students are exited before they have fully developed
cognitive academic language proficiency (Collier, 1992). Students in early exit
transitional programs have been more academically successful than those in ESL pull out
models but not as academically successful as those in late-exit transitional, dual language,
or two-way programs (Ramirez, Yuan & Ramey, 1991; Thomas & Collier, 1997; Thomas
& Collier, 2002.) Four years ago, Alanís (2000) indicated that 49% of the eligible Texas
students were served in transitional bilingual programs.

Texas Dual Language Program Cost Analysis
12
Dual Language Education
Dual language (DL) programs strive to develop bilingualism and biliteracy skills
in all students, language minority and language majority alike (Christian & Whichter,
1995; Valdes, 1997) in addition to fostering language equity (Torres-Guzman, 2002). DL
programs are also sometimes referred to as two-way developmental or dual language
immersion and are considered as an inclusive bilingual model. DL programs include the
following components: (a) instruction through two languages, (b) use of one language
during periods of instruction, and (c) integrated participation of both ELLs and native
English speakers in most content instruction (Lindholm, 1987).
Theoretical Foundations of Dual Language Programs. Strategies implemented
within DL programs are based on critical linguistic, pedagogical and theoretical
principles. The major theoretical principles are: (a) cognitive academic language learning
requires five to seven years (Collier, 1992; Cummins, 1991); (b) students can transfer
knowledge and skills from one language to another (Cummins, 1981b, 1991); and (c)
continuous development in two languages enhances learners’ educational and cognitive
development (Collier, 1992; Cummins, 1992).
Christian (1994) stressed that the goal of DL programs is to balance the
development of language, academic, and social development and not to choose or
sacrifice one over the other. According to Thomas and Collier (1997) there are six critical
factors that contribute to the success of DL programs: (1) students participate for at least
six years, (2) there is a balanced ratio of speakers of each language, (3) there is a
separation of languages, (4) emphasis is on the minority language in the early grades, (5)
core academics are emphasized as well as instructional excellence, and (6) parents have a

Texas Dual Language Program Cost Analysis
13
positive relationship with the program. Lindholm-Leary (2001) added the following three
to the list of critical success factors: (1) effective leadership and support by
administrators and instructors, (2) a positive school environment composed of an additive
bilingual environment, and (3) high quality instructional personnel and staff training.
DL Research Support. Research studies in the fields of bilingual and DL
education indicate that academic achievement is very high for both language minority
and language majority students participating in the program when compared to students
receiving English instruction only (Cummins & Swain, 1986; Lindholm & Aclan, 1991;
Thomas & Collier, 1996, 2001). DL programs allow native English speakers to develop
advanced second language proficiency without sacrificing L1 development of academic
proficiency (Genesee, 1987; Swain & Lapkin, 1982). In their recent national study,
Thomas and Collier (2001) found that, enrichment 90:10 and 50:50 one-way and two-
way developmental bilingual education (DBE) (or dual language, bilingual immersion)
are the only programs to date that assist bilingual students to reach the 50th percentile in
both L1 and L2 in all subjects. In addition, these programs enable students to maintain
that level of high achievement, or reach even higher levels through the end of schooling.
Notably, the fewest number of dropouts are reported by these programs. (Refer to the full
report at http://www.crede.ucsc.edu/research/llaa/1.1es.html).
Optimal DL programs show promising results for both ELLs and native English
speakers in terms of both Spanish and English linguistic and academic development,
inter-group relationships, and parental-school partnerships.

Texas Dual Language Program Cost Analysis
14
Dual Language Program Types. DL programs vary in the amount of instructional
time spent in the L1 and L2 and the length of the programs. The most common models
are known as 50:50 or 90:10 models (Christian, 1996).
90:10. In 90:10 models, for about 90% of the instructional day, Spanish (or other
minority language) is the medium of instruction and English is gradually increased until
it reaches approximately 50% in the upper grades in elementary school (fifth or sixth
grade) (Refer to Figure 1-a). Beginning literacy instruction is most often taught in the
target language, i.e. Spanish or other minority language.
Figure 1-a. Language of Instruction in a 90:10 DL Model
The earliest known implementation of the 90:10 model was in San Diego,
California in the year 1975. English speakers and Spanish speakers began their schooling
in Spanish for most of the day, from kindergarten through third grade. By the fifth grade,
English and Spanish were each used approximately 50% of the school day
50:50. In 50:50 models the instructional day is equally divided between English
and Spanish from Kindergarten throughout the duration of the program (Refer to Figure

Texas Dual Language Program Cost Analysis
15
1-b). Language arts or literacy instruction varies from L1 literacy to L2 literacy or
simultaneous teaching of both literacies.
Figure 1-b. Language of Instruction in a 50:50 DL Model
Coral Way Elementary School, Florida, is a well-known example of a DL
program implemented in the 1960s (Torres-Guzmán, 2002). The original design of Coral
Way was to accommodate the increasing number of Cuban children whose parents
wanted to maintain their children’s Spanish academic language. Coral Way DL students
scored equal to or higher than district, state and national averages on standardized tests.
In a report by National Clearinghouse for Language Acquisition (NCELA), Pellerano,
Fradd and Rovira (1998) reported it as a “model for bilingual education nationally and
internationally.” A unique feature of a 1971 program implemented in Oyster Elementary
School, Washington, D. C., was the simultaneous instruction of both English and Spanish
literacy. This format of teaching has found support in Slavin and Cheung’s (2003) and
Galloway’s (2003) recent research.
Other Program Characteristics. DL programs also vary in the length of the
design (some continue to 12th grade while others phase out in elementary or middle

Texas Dual Language Program Cost Analysis
16
school). Further, programs vary in the percentages of “majority” and “minority” speakers
and languages of instruction; however, nearly all of the DL programs in Texas are
Spanish/English. Within DL programs, the English speakers experience an emphasis on
the minority language (Spanish) first, and the Spanish speakers experience a maintenance
model in which their native language literacy is developed.
According to Alanís (2000), the majority of Texas students are served in
transitional bilingual programs (49%) or ESL programs (38%). Transitional bilingual and
ESL programs are often viewed as “subtractive” and/or “deficit” models of teaching
ELLs (Gomez, 2000; Hernandez-Chavez, 1984; Lambert, 1987; Ovando, Collier, &
Combs, 2002). In such models, students experience “subtractive” native language and
“subjugate” their native language to the majority language. Student proficiency in
English and rapid mainstreaming into grade-level classes are the goals of transitional
programs; therefore, these programs may be viewed, as “remediation” models where
students are perceived as lacking in English skills and therefore in need of quick English
remediation.
Conversely, DL programs are often described as “language additive or language
maintenance” programs in which students acquire a second language (L2) while
maintaining their first language (L1) (Cloud, et al, 2000). Table 2 summarizes research
outcome trends for the 90:10 and 50:50 DL models.

Texas Dual Language Program Cost Analysis
17
Table 2 Students’ Outcome in DL Programs and Comparison between 90:10 and 50:50 Models
Areas Evaluated Results Comparison between 90:10 and 50:50
Language Proficiency L1 proficiency L2 proficiency
Both DL models promoted language proficiency in students’ L1 and L2;
Students in 90:10 developed higher bilingual and Spanish proficiency than students in 50:50.
Reading and Academic Achievement L1 L2
Students make significant progress in reading; English speakers who received reading instruction in English by grade three reached at least grade appropriate level. 50th percentile in both L1 and L2 in all subjects
No differences found.
Drop Out Rate Lowest rate of all Bilingual or ESL models for ELLs
No differences found.
Content Area achievement mathematics (science and social studies) achievement in L1 mathematics (science and social studies) achievement in L2
Both groups of students performed on par with their peers in California state norm-referenced standardized tests in mathematics; close to grade-level in social studies (90:10); average or above average in science and social studies.
No differences found.
Number and Types of DL Programs in U.S. and Texas
U.S. According to the Center for Applied Linguistics’ Directory of Two-Way
Immersion Programs in the U.S. there were 248 two-way programs in 23 states and the
District of Columbia in 2000. This directory also reported an expansion within existing
programs adding new grade levels each year, and 40 programs extended into the middle
or secondary grades. The 2000 CAL Directory indicated that the majority of the programs
are Spanish/English programs (234 out of the 248). Additionally, data collected
uncovered tremendous variability in program implementation (Christian, 1994).

Texas Dual Language Program Cost Analysis
18
Texas. The Texas Education Agency (TEA) collects basic school descriptive data
about Texas districts and ELL programs through a software program called PEIMS
(Public Education Information Management System). According to the TEA, “in
compliance with the Texas Education Code, PEIMS contains only the data necessary for
the legislature and the TEA to perform legally authorized functions in overseeing public
education. It does not contain any information relating to instructional method, except as
required by federal law” (Refer to http://www.tea.state.tx.us/peims/about.html).
Therefore, the State does not collect specific information about bilingual program type.
However, nationally, the Center for Applied Linguistics (CAL) has been collecting data
and monitoring the growth of two-way programs in the U.S. since 1991.
In Texas, the CAL Directory of Two-Way Immersion Programs in the U.S.,
(http://www.cal.org/twi/directory) identified 39 schools located in 17 districts. At that
time, there was no known directory created exclusively for the purpose of identifying DL
schools in Texas. To this end, in December 1999, a Texas-wide group of bilingual and
dual language educators formed the Texas Two-Way/Dual Language Consortium (TTC)
to address three fundamental needs: (1) Create a Texas directory of DL schools, (2)
consolidate Texas-wide research on the effectiveness of these programs, and (3)
positively impact state and local policy. The TTC commissioned an expansive statewide
project supported by Texas A&M University's Bilingual Education Program. The
purposes of the project were to create a website (to identify DL programs across the state)
and serve as a network resource. By the end of 2001, the TTC was able to identify 63 DL
programs located in 32 school districts. By the end of 2003, 166 programs were
identified. Fifty-three percent used a 50:50 model, while 47% employed a 90:10

Texas Dual Language Program Cost Analysis
19
model. According to CAL, nationally, the 50:50 model is the most frequently reported
type of DL program ((Lara-Alecio, Galloway, Irby, Rodriguez, & Gomez, 2004).
DL Programs by Grade Level and Classes. According to Lara-Alecio, et al.
(2004), the majority of DL programs in Texas are situated at the early elementary levels
(Refer to Figure 2). They further noted that nationally, DL programs are frequently
implemented at grade levels PK-3. CAL’s 2000 directory showed 39% of DL programs
are situated at the early elementary grades while 40% continue on to the upper
elementary grades. The Texas data from the Lara-Alecio, et al. (2004) report indicated
that 58% of the classes are in grades PK-2 which are higher than the national percentages,
however, this percentage also implies that many of the Texas programs are "recent"
programs that are adding grade "levels" each year versus mature programs with campus-
wide implementation.
Figure 2. Texas Grade Levels and Classes
104
251
183
107 10963 76
24 21
938
0
100
200
300
400
500
600
700
800
900
1000
Pre-K K Ist 2nd 3rd 4th 5th 6th 7th Total

Texas Dual Language Program Cost Analysis
20
DL Programs by Language of Instruction. In the 2004 Lara-Alecio et al. report
all programs in Texas reported that their DL programs used Spanish and English as the
languages of instruction. Two programs reported using a third foreign language for
enrichment (French or American Sign Language). According to the CAL national data,
Spanish and English are the predominant languages of instruction in DL programs in the
U.S. (Center for Applied Linguistics, 2002).
DL Distribution of Native Spanish and Native English Speakers. Further
reporting on DL programs, Lara-Alecio et al. (2004) found that 47% had a language ratio
of 75% native Spanish (NS) speakers to 25% native English (NE) speakers. The optimal
instructional environment in DL programs is an equal division of native English and
Spanish speakers. Nearly half of the programs reported being near balanced between
native Spanish and English speakers (27% were 50/50 and 20% were 60/40). Only 6% of
the programs were weighted in favor of native English speakers. Figure 3 depicts the DL
programs by language distribution (Lara-Alecio et al., 2004).

Texas Dual Language Program Cost Analysis
21
Figure 3. Distribution of Native Spanish (NS) Speakers to Native English (NE) Speakers.
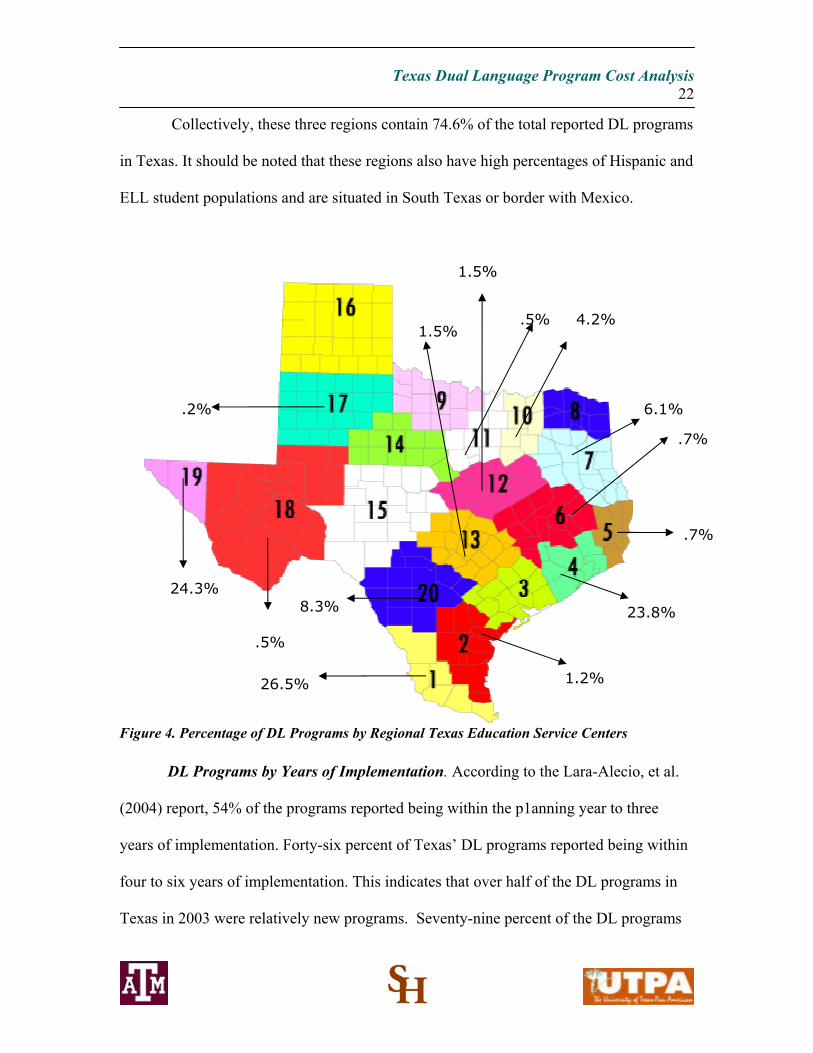
Dual Language Programs by Regional Education Service Center. The state of
Texas is divided into 20 Regional Education Service Centers (ESCs) that function as
assistance centers for the Texas Education Agency and local public school districts.
Figure 4 depicts a map of Texas by ESC with the number and percent of the dual
language programs (Lara-Alecio, et al., 2004). Data indicated that DL programs are
implemented in 14 of the 20 ESCs. Region 1 reported the most DL programs with 26.5%
of the programs. Region 1 is situated in the Lower Rio Grande Valley and has a large
percentage of Spanish-speaking students due to its proximity to the U.S.- Mexico border.
Notably, two other areas, Region 4 (Houston area) and Region 19 (El Paso area) also had
a large percentage of the total DL programs with 23.8% and 24.3% respectively.
75%-25%
60%-40%
50%-50%
40%-60%
25%-75%
Texas Dual Language Program Cost Analysis
22
Collectively, these three regions contain 74.6% of the total reported DL programs
in Texas. It should be noted that these regions also have high percentages of Hispanic and
ELL student populations and are situated in South Texas or border with Mexico.
Figure 4. Percentage of DL Programs by Regional Texas Education Service Centers
DL Programs by Years of Implementation. According to the Lara-Alecio, et al.
(2004) report, 54% of the programs reported being within the p1anning year to three
years of implementation. Forty-six percent of Texas’ DL programs reported being within
four to six years of implementation. This indicates that over half of the DL programs in
Texas in 2003 were relatively new programs. Seventy-nine percent of the DL programs
26.5% 1.2%
23.8%
.7%
.7%
6.1%
4.2% .5%
1.5%
1.5%
.2%
.5%
24.3% 8.3%

Texas Dual Language Program Cost Analysis
23
that were in the planning year in 2001-2002 reported forecasting a 50:50 model while
30.6% reported planning that they were planning to implement a 90:10 model. Thirty-
eight percent of DL programs in Year 1 of implementation reported having 90:10 models,
and 61.8% reported implementing a 50:50 model.
The Focus of the Study: Dual Language Costs
Both the Center for Applied Linguistics’ 2000 national study and Lara-Alecio et.
al.’s 2004 study indicated a growing number of DL programs. Additionally, national and
state professional conferences and research journals on bilingual and ESL education
demonstrate an increasing interest in the research and implementation of DL programs.
However, one significant feature that is absent from the literature on DL programs are
costs associated with implementation and maintenance of DL programs. Information on
funding of effective educational programs for ELLs is vital for all stakeholders, including
policy makers and current and future DL program administrators.
While there has been some research into the costs of bilingual programs
(Cardenas, Bernal, & Kean, 1976; Chambers & Parrish, 1992), the research team was
unable to find studies concerning the costs associated with dual language programs above
and beyond the costs of transitional bilingual programs. The previous research on
bilingual costs provide insight into DL costs; however, DL costs may differ from costs
associated with traditional, transitional bilingual programs due to some significant
programmatic differences (i.e. inclusion of English speaking students and parents,
additional curriculum and assessment materials for English speakers, additional staff
development training costs, additional costs for staffing, teaching and management.)
Texas Dual Language Program Cost Analysis
24
Our study examined many of the same cost structures as the Cardenas study;
however, we included certain funding costs that Cardenas et al. (1976) intentionally
excluded due to the differing and specific nature of DL programs. For example, while
the previous study chose not to include in-service training (staff development) because it
is a general state requirement for all teachers, we, on the other hand considered DL
program teachers to be in need of differentiated staff development in order to provide
quality program support. After discussions with DL coordinators, it was confirmed that
DL staff development was an additional funding need beyond the traditional, transitional
bilingual staff development. In fact one administrator responded, “In this time of
shrinking support for schools from tax based state funds, additional funds are needed
from Title allocations to ensure the continued strength of DL programs. The subtle
differences between DL and more traditional bilingual programs necessitate steady staff
development and monitoring to ensure that the DL protocols are implemented in
alignment with research-based designs.”
We also decided to include textbooks as a regular DL operating cost because of
the need for DL programs to supply Spanish textbooks for the native English speakers
enrolled in each campus program. We specified that these reported costs should only
include costs over and above the traditional, transitional bilingual program costs. We
chose not to include library costs for similar reasons; bilingual library resources, while
still not adequate in many cases, have improved dramatically since 1976. It was also
difficult to claim that DL library issues were any different from traditional, transitional
bilingual library issues.

Texas Dual Language Program Cost Analysis
25
Since our study design was focused on DL campus costs, we did not include state
agency administrative costs. However, we did include school administrative costs if the
inclusion of a dual language program led to greater administrative costs than the
transitional bilingual program. This differed from the prior studies as well, and it was
impossible to ignore the expenses of a dual language program administrator, secretary, or
parent involvement personnel and still offer a realistic cost analysis.
Central to conducting this survey were the key questions:
1. How much more does a DL program cost to operate than a traditional,
transitional bilingual program?
2. Assuming the dual language class is not appreciably smaller than the
typical bilingual classroom, what would be the additional management
costs, staff costs, instructional costs, curriculum costs, equipment costs,
material costs, assessment costs, staff development costs, and parent
involvement costs?
These are complex questions on a number of levels. It was very important that we
determine what, if any, differences in cost were related to program and teacher model.
Finally, we wanted to determine how much of these additional costs were related to
teaching model, program model, and program size.
Program size is an important variable due to the large disparity of pupil
participation in the DL program from campus to campus. Obviously, a program with 20
students and one classroom will not require the managerial or support staff that a program
consisting of over 600 students will require. A second issue is that of program
composition and its effect on program cost. While a prototypical or ideal DL program

Texas Dual Language Program Cost Analysis
26
consists of relatively equal numbers of native English and native Spanish-speaking
students, many programs have very different ratios. Some DL programs have as much as
a 99% Spanish speaking to a 1% English speaking population.
The relatively large number of Spanish-speaking children in many dual language
programs also has a confounding effect on the results of the cost analysis. As the
previous Lara-Alecio, et al. (2004) study indicated, a large number of DL programs were
found in South Texas which has on average a larger percentage of ELLs than native
English speakers. These border districts are likely to be majority Hispanic, receive Title
III funds for a large portion of their student body, and tend to be property-poor.
Methodology
Our study was developed as a descriptive study to provide an in-depth
understanding of costs related to DL programs. Additionally, we included qualitative
comments by the bilingual directors or campus administrators. These provided additional
data for understanding the needs and reasons for costs as they currently exist in DL
programs.
Definition of DL Program
For the purpose of this study, we defined a DL program as an instructional
bilingual education model integrating both native English speakers and native Spanish
speakers in content classes taught in both languages and with a goal of bilingualism and
biliteracy for both language minority and language majority students. We required at
least 10% English-speaking students for inclusion in the DL program. The state average
is approximately 40% English-speaking students in DL programs (Lara-Alecio, et al.,
2004).
Texas Dual Language Program Cost Analysis
27
Participants
Participants for our study were purposefully selected. They included 304
identified bilingual directors and the 166 DL coordinators identified in the Lara-Alecio,
et al. (2004) study. E-mail information was collected from the Texas A&M University’s
Language Diversity Network (http://ldn.tamu.edu), Texas Two-way Consortium Website
(http://texastwoway.org), the Texas Center for Bilingual/ESL Education
(http://www.tcbee.org), from school district websites, and from a superintendent mailing
list provided by the Texas Education Agency. Specifically 1042 superintendents received
an e-mail as a notification of the survey. The e-mail requested that they direct the
message to the bilingual director or the principal of the school should they be
implementing a DL program. This was sent as a deliberate effort to determine any
previously unidentified DL programs in the state.
Instrument
After conducting a comprehensive review of the literature related to bilingual and
dual language program components, the research team with the aid of school finance
personnel developed a DL 91- item campus survey. It was reviewed by an economist for
accuracy and was pilot tested with bilingual administrators and DL teachers in both
written and online format (Refer to Appendix A). A second, shorter survey of fourteen
items was also developed for the district level (Refer to Appendix B). This survey was
designed to briefly gather district information and was not used in the final cost-analysis.
The surveys, in both formats, were deemed to have a high internal consistency (α=.90)
and face validity.

Texas Dual Language Program Cost Analysis
28
Procedures
After completing our study of the number and features of DL programs in Texas
(Lara-Alecio, et al., 2004), we were provided with a contact list of administrators of DL
programs in Texas. We utilized this list to send an e-mail invitation to participate in our
survey. To ensure that we also reached those districts with DL programs initiated after
our last survey, we utilized a comprehensive list of Texas district superintendents and on
the first of October 2004 we sent an e-mail letter inviting participation. After two weeks a
second e-mail invitation and phone calls were placed to the known 166 DL programs.
During October 2004, 93 online responses were received representing a 56% response
rate. Eighty-three of the surveys were determined to be useable (representing
approximately 50% of the known total DL programs in Texas).
Results Demographics
Ninety-three online DL cost surveys were completed in Fall 2004. After review
by the research team, ten surveys were omitted due to missing data or after it was
determined that the programs were not DL programs as defined for the purpose of this
study. Table 3 reveals that 48 schools districts with DL programs completed the survey
which included 83 DL programs consisting of 27 small-size programs, 31 medium-size
programs, and 25 large-size programs. For the purpose of the study small DL programs
were comprised of 10-120 students; medium DL programs included 121-240 students;
and large programs were designated as 240+ students. The researchers made these
category distinctions based on the average number of students in DL programs that had
one DL class per grade level (small program), two-classes per grade level (medium

Texas Dual Language Program Cost Analysis
29
program), and three or more classes per grade level (large program). Over 67% of the
responses utilized the 50:50 model. The 50:50 DL program model may be
overrepresented in the cost analysis since the Lara-Alecio, et al. (2004) study found that
53% of the state’s DL programs were 50:50 models. However we hypothesize that it may
also reflect the noted trend in the growth of 50:50 programs in contrast to 90:10 models.
Table 3 DL Survey Response Demographics Districts Programs Students
50:50 90:10 Small
ProgramsMedium
Programs Large
ProgramsTotal 48 83 16,231 56 27 27 31 25
Note: 50:50 = 50:50 DL Program Model; 90:10=90:10 Program Model; Small Programs = 0-120 Students; Medium Programs = 121-240 Students; Large Programs = 240+ Students
Program Age. Another distinctive feature of the reporting DL programs was the
mean age of the programs by program size. Small programs reported a mean age of three
years. Medium size programs were on average six years old, and large programs were on
average almost five years into implementation.
Geographic Region. In an attempt to ascertain that our responses were
geographically representative of the known DL programs, we divided the state into four
regions (Northeast, Southwest, East and South). We tabulated responses by regional
education service center area (1-20). Table 4 reports that the majority of responses
(45.12%) were in the Eastern Region which included the Houston and Dallas
Metroplexes and the Southern Region (35.37%) which included the Rio Grande Valley.
The third largest reporting region was the Southwest (15.85%) which included the El
Paso area, another area of high concentration of known DL programs. The Northwest

Texas Dual Language Program Cost Analysis
30
Region reported few programs (3.6%). These data reflect the regional distribution of DL
programs found in the previous Lara-Alecio, et al. (2004) study.
Table 4 Responding DL programs by Texas Region Region Northwest Southwest Eastern Southern DL Programs 3
13 37 29
Note: Northwest= Regions 9, 14, 16, and 17; Southwest= Regions 15, 18, and 19; Eastern=Regions 4, 5, 6, 7, 8, 10, 11, and 12; Southern= Regions 1, 2, 3, 13, and 20.
Grade Levels. Figure 5 illustrates the grade levels of the reporting dual language
programs. This figure is comparable to the grade level data from the Lara-Alecio, et al.
(2004) study. It is evident that the majority of the programs in the current study are
concentrated at the early elementary grades. The number of programs in Grades 6-12
drops significantly. Please note that only one high school program is included in the
current study.
0
20
40
60
80
PK K 1 2 3 4 5 6 7 8 9 10 11 12
Figure 5. Grade Levels of Reporting DL Programs.

Texas Dual Language Program Cost Analysis
31
Per-pupil Costs
Per-pupil costs were calculated by small, medium and large DL program models
for start-up years, annually, and additional funds that the DL program administrators
reported as needed to adequately support their current DL programs. The research team
determined, after discussions with administrators of current programs, that there may be
differences in start-up year costs and ongoing annual costs by size of programs. Also,
administrators frequently reported that they do not have sufficient funds to maintain
current program levels; therefore, another category, “additional needed funds,” requested
from them these amounts.
Table 5 reveals that the average per pupil start-up costs and the average per pupil
annual costs for DL programs are approximately $500.00. Programs requested an
additional $263.00 per pupil. This table also calculates costs across program type,
program size, and instructional model.
Table 5
Mean Per-Pupil Costs for All Reporting Programs Over and Above Transitional Bilingual Program Start-up Costs Annual Costs Additional funds Reporting DL Programs (n=83)
$512.00 $525.00 $263.00
Table 6 reveals that smaller programs (0-120 students) were more costly per pupil
to operate in all three categories: start-up, annual, and additional funds requested.
Conversely, large programs were the most cost effective in all three categories. Large
programs spent approximately 1/3 of the amount per pupil compared to small programs.
We speculate that the reduced costs for large programs is due to minimized teacher and

Texas Dual Language Program Cost Analysis
32
student recruitment for the program, shared resources, materials and administrative costs,
reduced staff development and certification costs, larger percent of bilingual students in
the district with associated Title III allotments, and a history of bilingual education
programs and funding therefore having opportunities to have previously purchased
bilingual materials. Likewise, medium programs spent less than 1/2 the amount per pupil
than small programs in all three categories.
Table 6 Mean Per-Pupil Costs for Start-Up, Annual and Additional Funds Needed by Program Size
Program Size Start-Up Annual Additional Small Program (n=27) $825.00 $ 879.00 $568.00 Med. Program (n=31) $399.00 $406.00 $209.00 Large Program (n=25) $312.00 $290.00 $197.00 Note: Small Programs = 0-120 Students; Medium Programs = 121-240 Students; Large Programs = 240+ Students; Start-Up = Costs required to initiate program; Annual = yearly program costs; Additional = additional funds requested to maintain adequate program. 50:50 v. 90:10 Cost Differences
Since the Lara-Alecio, et al. (2004) study found approximately equal proportions
of 50:50 and 90:10 DL programs, the research team was interested to discern whether
there were cost differences associated with the two most common DL program models.
Table 7 reveals these data. Notably, Table 7 indicates approximately equal per pupil costs
annually and requested additional funds for 90:10 and 50:50. There appears to be an
insignificant difference in mean per pupil annual costs or requested additional funding
associated with the two most common DL program models in Texas.
Though costs associated with 90:10 and 50:50 models appear to be similar, it
should be noted that the goals of these two program models are somewhat different.
There also seems to be an additional outcome in that both language groups (native

Texas Dual Language Program Cost Analysis
33
English and native Spanish) develop higher bilingual and Spanish skills than in the 50:50
model (Thomas & Collier, 2002).
Table 7 Mean Per-Pupil Annual and Additional Costs as Reported by 50/50 and 90/10 Instructional Models DL Model Annual Additional 90:10 Model (27) $389.00 $246.00 50:50 Model (56) $388.00 $238.00 Note: 50:50 = 50:50 DL Program Model; 90:10=90:10 Program Model; Annual = yearly program costs; Additional = additional funds requested to maintain adequate program.
Teacher Models
After reviewing the literature and discussions with DL administrators, three
typical teacher arrangements or administrative models were revealed. The three distinct
teacher arrangements are: (a) two-teacher mixed, (b) one-teacher mixed, and (c) two-
teacher separated. Two-teacher mixed was the most common arrangement (n=39) and
two-teacher separated was the least common (n=13) (Refer to Table 8).
The two-teacher mixed model is one in which students are being served by two
different teachers, one in Spanish, the other in English, for differing periods of the day or
week. Native English and native Spanish speakers are mixed within the same class group.
This model typically represents (minimally) two classes of students (approximately 40
students) which rotate between English and Spanish instruction in a “team-teaching” type
situation in which planning, curriculum materials, and paraprofessionals are usually
shared. The two-teacher mixed model is the least expensive model.
The one-teacher mixed, the second most common model, is one in which native
English and native Spanish DL students are being served by a single bilingual teacher

Texas Dual Language Program Cost Analysis
34
instructing in both Spanish and English for different periods of the school day or week.
Usually, this model requires hiring an additional teacher who is bilingual certified to
serve as the DL teacher which may contribute to the expense of this design. This model
was the most costly model reported.
The two-teacher separated model is one in which students are being served by
different teachers, one in Spanish, the other in English, for differing periods of the day or
week. Native English and native Spanish speakers are separated into different class
groups, which are then switched for shifts in language of instruction and are occasionally
integrated. This model is not the prototypical DL model since the integration of the two
language groups is minimal.
The two-teacher separated model (n=13) was the least reported and the second
most expensive per pupil. Often such models require additional instructional support,
such as an instructional aide, since students in this grouping are not mixed by language
regularly and therefore are not able to provide one another with language clarifications,
i.e., clarifying the English instruction with Spanish or the Spanish instruction with
English (Lara-Alecio & Parker, 1994). Additionally, this model does not foster
collaborative planning and sharing of resources. These factors may contribute the
significant difference in cost between the two-teacher mixed model and this model.

Texas Dual Language Program Cost Analysis
35
Table 8 Mean Per-Pupil Annual and Additional Costs as Reported by Three Administrative Program Models
Note: Two-Teacher Mixed= One Spanish speaking teacher and one English speaking teacher “team teaching” two mixed groups of native English and Spanish DL students. One-Teacher Mixed= One bilingual teacher serving one class of DL students (mixed group of native English and Spanish speakers). Two-Teacher Sep= Two-teacher separated serving native English and Spanish speakers in separate classrooms. The two language groups are separated.
Cost Categories
The survey requested information on 12 categories associated with dual language
programs. Respondents were asked to determine mean start-up2, annual3, and additional
requested costs across 12 cost categories above and beyond their expenditures for
traditional transitional bilingual programs. The categories were: managerial, staff,
instruction, staff development, Spanish curriculum, English curriculum, assessment,
equipment, recruitment, public relations, parental involvement, and other materials.
Following is a brief explanation of each category.
Managerial costs include costs associated with professional staff needed to operate the
DL program such as a Dual language coordinator. This managerial staffs were solely
dedicated to the dual program.
Staff costs were associated with staff needed to operate the DL program such as a
clerk/typist, secretary, parent liaison or/and assessors.
2 Start-up costs include, but are not limited to, initial costs associated with planning, training, purchasing, and recruiting prior to program implementation. 3 Annual costs are those costs associated with normal operations of the program in one academic year.
Teacher Model Annual Additional Two-Teacher Mixed (n=39) $297.00 $231.00 One-Teacher Mixed (n=31) $522.00 $241.00 Two-Teacher Sep. (n=13) $448.00 $277.00

Texas Dual Language Program Cost Analysis
36
Instructional costs include costs associated with instructional staff dedicated to the dual
program that otherwise would not be on campus such as teachers, paraprofessionals,
tutors, etc.
Staff Development/Training costs were for both staff and teachers focused on dual
language programs such as site visits, conferences, travel, registration, on-site
presentations, etc. over and above the required five state days.
Curriculum material costs were for Spanish speakers learning English (i.e. leveled
readers, texts, videos, audio books, computer software, etc.) over and above those needed
for the traditional bilingual classroom.
Curricular material costs were for English speakers learning Spanish (i.e. leveled
readers, texts, videos, audio books, computer software, etc.) over and above those needed
for the traditional bilingual classroom.
Assessment material costs were for English and Spanish speakers over and above those
needed for the traditional bilingual or mainstream classroom.
Equipment costs were necessary to the proper functioning of the program (for example:
card readers, listening stations).
Recruitment costs were included for both students and teachers (newspaper, radio,
television, meetings, and flyers). These costs were over and above the typical school-
home communications.
Public relations costs included items such as videos, brochures, and meetings. These
costs were over and above the typical school-home communications.

Texas Dual Language Program Cost Analysis
37
Parental involvement costs included parental instructional or orientation programs during
or after school. These include L2 language programs and academic support for families.
Other material costs included unanticipated costs reported by programs.
Start-up Costs. Table 10 details the mean start-up costs across the 12 categories
for small, medium and large programs.
Table 10 Mean Start-up Costs by Program Size above Typical Transitional Bilingual Program Costs Costs Category Small Medium Large Managerial $14,333.00 $19,616.00 $27,800.00 Staff $3,148.00 $7,823.00 $9,409.00 Instruction $1,548.00 $9,633.00 $9,400.00 Staff Development $6,986.00 $6,557.00 $18,113.00 Spanish Curriculum $3,480.00 $6,513.00 $20,499.00 English Curriculum $3,572.00 $6,352.00 $12,297.00 Assessment $1,522.00 $1,447.00 $5,060.00 Equipment $1,389.00 $1,961.00 $6,339.00 Recruitment $178.00 $911.00 $790.00 Public Relations $946.00 $484.00 $1,104.00 Parental Involvement $744.00 $2,695.00 $5,193.00 Other Materials $667.00 $758.00 $2,542.00 TOTAL $38,513.00 $64,750.00 $118,546.00 Note: Category Costs: 12 major cost categories; small=small DL program; medium= medium DL program; large=large DL program.
The largest costs for all three DL groups were associated with managerial costs.
While many may believe managerial costs to be overstated, one principal indicated,
“While the program can be sustained at an adequate level, the loss of managerial and
support personnel will impact the program’s effectiveness. Once the additional funding
ends, the bilingual department which already has a huge case load will have to consider
ways to maintain positions.” The least costs across the three groups were associated with
recruitment for both students and teachers. All three groups reported start-up costs
associated with instruction and staff development. Instruction costs were similar for

Texas Dual Language Program Cost Analysis
38
medium and large programs, and staff development costs were similar for small and
medium programs. Large programs needed over $18,000 for start-up training and staff
development.
Two areas of concern for funding in DL programs are costs associated with
serving the native English speakers in the DL program. State or federal Title III
allotments cannot be used to purchase materials or fund instruction for non-ELL students.
One principal stated, “The district received Title VII funds and those funds were used to
assist with start-up costs. State funds are needed to pay for additional Spanish textbooks
for each of the non-ELL students in all content areas. This is one of our school’s biggest
financial concerns. If native English speaking students are served in DL programs, the
state should support the purchase of textbooks for the non-ELLs.” The survey indicated
that DL Programs incurred start-up Spanish curriculum costs for the native English
speakers on average of $3480 for small programs, $6352 for medium programs and
$12,297 for large programs. Additionally, DL programs may need additional assessment
materials for the native English speakers. Small programs reported assessment start-up
costs of $1522; medium programs reported assessment start-up costs of $1447, and large
programs reported assessment start-up costs of $5060.
Table 11 and Figure 6 show that costs per pupil increased as the percentage of
native English speakers increased. In programs with 10-30% native English speakers, the
costs per pupil were $326, compared to programs with 30-49% native English speakers
with costs per pupil were at $445 or a difference of $119 per student. This figure
represents a 36.5% increase of costs associated with service to increased numbers of
native English speakers.

Texas Dual Language Program Cost Analysis
39
Table 11 Average cost per pupil based on % of Native English Speakers % of English Speakers 10-29% 30-49% 50% and above Average annual costs $90,574.36 $76,750.69 $62,715.64 Average cost per pupil $326.37 $445.36 $413.81
Figure 6 offers a visual representation of the cost increases per pupil as the
percentage of native English speakers increases. This increasing cost per pupil was
predicted since the cost data calculations were based on expenditures over and above the
traditional transitional bilingual program (native English speakers are not included in the
transitional bilingual classrooms). Since State ELL funds cannot be used for purchases
for this population of students, any additional resources needed for the English speakers
in the DL program must come from local funds.
0
50
100
150
200
250
300
350
400
450
500
Percentage of Native English speaking students
Ave
rage
cost
per
pupil
10-29%
30-49%
50% +
Figure 6. Mean Costs per Pupil as Related to Percentage of Native English Speakers
Texas Dual Language Program Cost Analysis
40
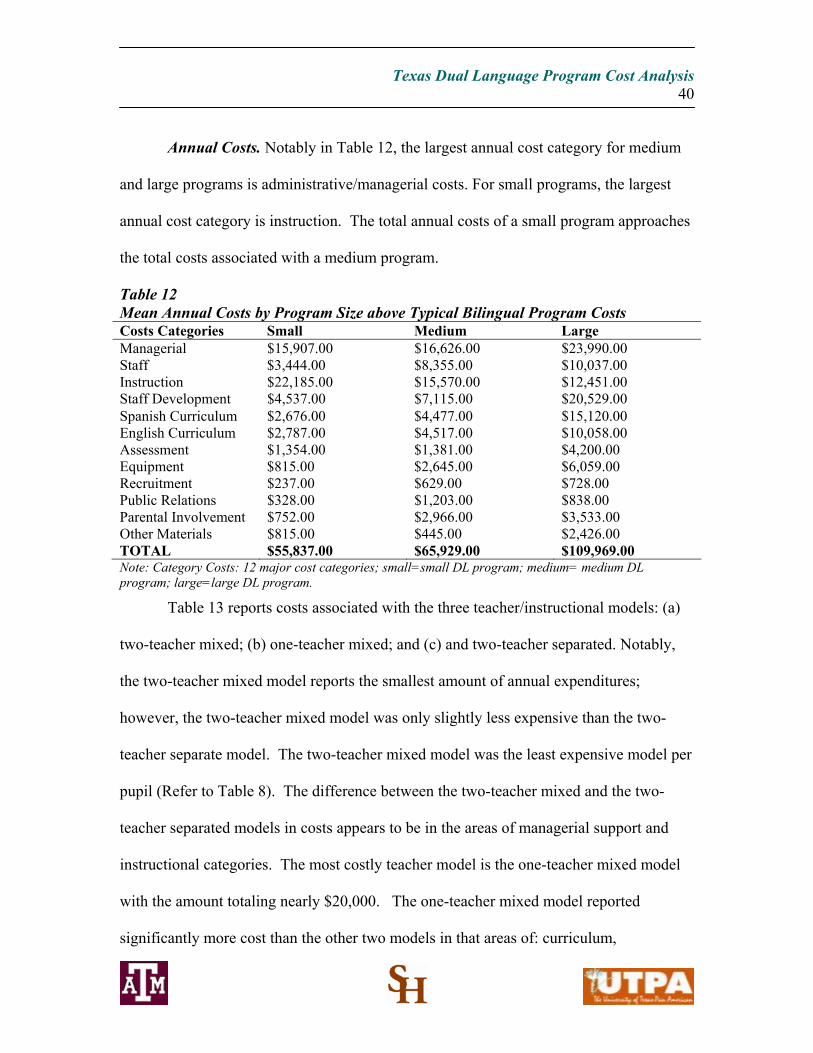
Annual Costs. Notably in Table 12, the largest annual cost category for medium
and large programs is administrative/managerial costs. For small programs, the largest
annual cost category is instruction. The total annual costs of a small program approaches
the total costs associated with a medium program.
Table 12 Mean Annual Costs by Program Size above Typical Bilingual Program Costs Costs Categories Small Medium Large Managerial $15,907.00 $16,626.00 $23,990.00 Staff $3,444.00 $8,355.00 $10,037.00 Instruction $22,185.00 $15,570.00 $12,451.00 Staff Development $4,537.00 $7,115.00 $20,529.00 Spanish Curriculum $2,676.00 $4,477.00 $15,120.00 English Curriculum $2,787.00 $4,517.00 $10,058.00 Assessment $1,354.00 $1,381.00 $4,200.00 Equipment $815.00 $2,645.00 $6,059.00 Recruitment $237.00 $629.00 $728.00 Public Relations $328.00 $1,203.00 $838.00 Parental Involvement $752.00 $2,966.00 $3,533.00 Other Materials $815.00 $445.00 $2,426.00 TOTAL $55,837.00 $65,929.00 $109,969.00 Note: Category Costs: 12 major cost categories; small=small DL program; medium= medium DL program; large=large DL program.
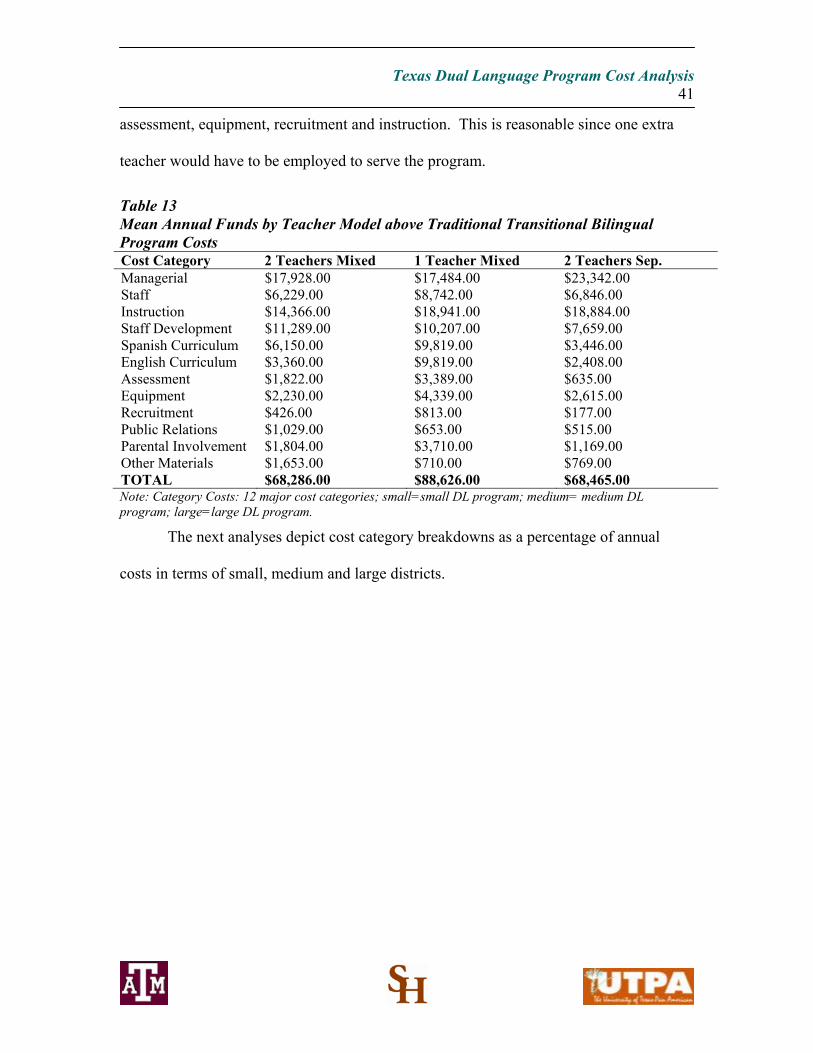
Table 13 reports costs associated with the three teacher/instructional models: (a)
two-teacher mixed; (b) one-teacher mixed; and (c) and two-teacher separated. Notably,
the two-teacher mixed model reports the smallest amount of annual expenditures;
however, the two-teacher mixed model was only slightly less expensive than the two-
teacher separate model. The two-teacher mixed model was the least expensive model per
pupil (Refer to Table 8). The difference between the two-teacher mixed and the two-
teacher separated models in costs appears to be in the areas of managerial support and
instructional categories. The most costly teacher model is the one-teacher mixed model
with the amount totaling nearly $20,000. The one-teacher mixed model reported
significantly more cost than the other two models in that areas of: curriculum,
Texas Dual Language Program Cost Analysis
41
assessment, equipment, recruitment and instruction. This is reasonable since one extra
teacher would have to be employed to serve the program.
Table 13 Mean Annual Funds by Teacher Model above Traditional Transitional Bilingual Program Costs Cost Category 2 Teachers Mixed 1 Teacher Mixed 2 Teachers Sep. Managerial $17,928.00 $17,484.00 $23,342.00 Staff $6,229.00 $8,742.00 $6,846.00 Instruction $14,366.00 $18,941.00 $18,884.00 Staff Development $11,289.00 $10,207.00 $7,659.00 Spanish Curriculum $6,150.00 $9,819.00 $3,446.00 English Curriculum $3,360.00 $9,819.00 $2,408.00 Assessment $1,822.00 $3,389.00 $635.00 Equipment $2,230.00 $4,339.00 $2,615.00 Recruitment $426.00 $813.00 $177.00 Public Relations $1,029.00 $653.00 $515.00 Parental Involvement $1,804.00 $3,710.00 $1,169.00 Other Materials $1,653.00 $710.00 $769.00 TOTAL $68,286.00 $88,626.00 $68,465.00 Note: Category Costs: 12 major cost categories; small=small DL program; medium= medium DL program; large=large DL program.
The next analyses depict cost category breakdowns as a percentage of annual
costs in terms of small, medium and large districts.
Texas Dual Language Program Cost Analysis
42
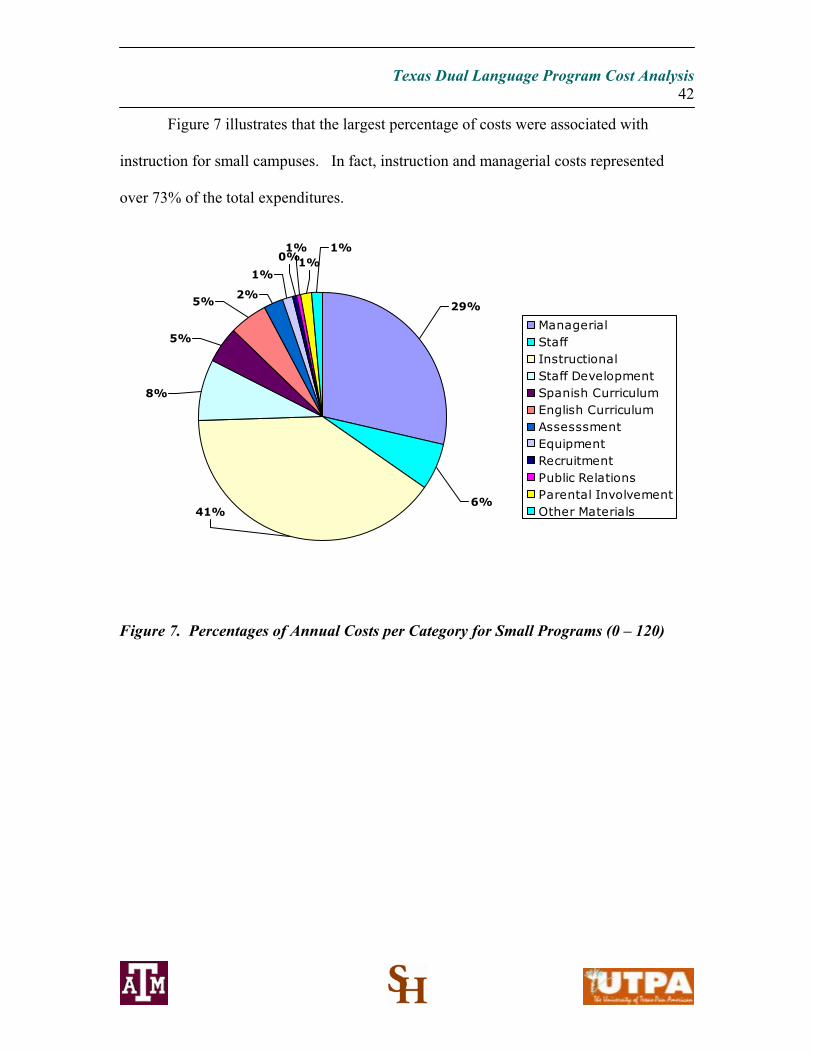
Figure 7 illustrates that the largest percentage of costs were associated with
instruction for small campuses. In fact, instruction and managerial costs represented
over 73% of the total expenditures.
2%
1%
29%
6%41%
5%
5%
1%1%
0%1%
8%
ManagerialStaffInstructionalStaff Development Spanish Curriculum English CurriculumAssesssmentEquipment RecruitmentPublic RelationsParental InvolvementOther Materials
Figure 7. Percentages of Annual Costs per Category for Small Programs (0 – 120)

Texas Dual Language Program Cost Analysis
43
Figure 8 charts instruction, staff and managerial costs as 71% of the total
expenditures for DL programs of medium size. Staff development costs were 11% of the
total budget.
2%
4%
24%
13%
24%
7%
7%
4%1%
1%2%
11%
Managerial
Staff
Instruction
Staff Development
Spanish Curriculum
English Curriculum
Assesssment
Equipment
Recruitment
Public Relations
Parental Involvement
Other Material
Figure 8. Percentages of Annual Costs per Category for Medium Programs (120 -239)

Texas Dual Language Program Cost Analysis
44
Figure 9 reveals that nearly one quarter of annual costs were associated with
Spanish and English curriculum materials for large DL programs. Managerial and
instructional costs are lower than that of medium and small programs. Staff development
costs were higher than those of medium and small programs.
4%
6%
21%
9%
11%
14%
9%
3%2%
1%1%
19%
Managerial
Staff
Instruction
Staff Development
Spanish Curriculum
English Curriculum
Assesssment
Equipment
Recruitment
Public Relations
Parental Involvement
Other Material
Figure 9. Percentages of Annual Costs per Category for Large Programs (240 and above).
Middle and High School Programs. There are few known middle or high school
DL programs in the nation or Texas. We have only been able to identify 11 such
programs in Texas. Only one high school program responded to the DL cost survey. We
will be seeking additional data from these programs to provide better insight into the
costs associated with secondary DL programs. The one high school that completed the

Texas Dual Language Program Cost Analysis
45
survey reported a per pupil cost of $358 per pupil. More complete secondary data will be
sought in a follow-up study.
Federal Funding
With the inception of the No Child Left Behind Act (2001), bilingual education
was mandated. Prior to 2001, there were capacity-building policies (McDonnell, 1994)
that provided for additional funding to enhance local district efforts, rather than mandated
policies for bilingual education. Many school districts applied directly to the U.S.
Department of Education for supplemental funds such as those that supported start-up
and continued implementation for dual language programs. Under this funding formula,
funds could be used for native English speakers not eligible under the current federal
flow-through funds under the Title III allotment. Lara-Alecio et al. (2004) determined
that DL programs in Texas were positively impacted by these USDOE capacity-building
funds.
Due to their typical three to five-year funding cycles, many of the current DL
programs are either out of federal monies or soon will be. Our current study indicated
that 88% of large programs and over half of small (51.8%) and medium (54.8%)
programs have received federal funds. Overall, 53 of the campus’ DL programs (63%)
received federal funding with an average award of $498, 874 over a three to five year
period. This number includes 22 large DL programs which may skew the data upward.
Only three of the large programs did not report receiving federal funds. The significant
federal support for DL programs contributed to the growth of DL models in Texas and
calls into question the sustainability of these programs should an alternate funding source
not be found. One dual language coordinator remarked, “Although we could maintain

Texas Dual Language Program Cost Analysis
46
the program due to an already established school culture and commitment, we could not
maintain the high expectations we have set without funding for personnel. The federal
funds we received paid for a school coordinator, bilingual aides, a parent liaison,
consultants, and tutors. These positions supported stronger recruitment efforts,
instructional and parental support. The aides were able to support classroom teachers
during the school day, and tutors provided small group instruction. The quality of our
program overall increased greatly with these components.”
Recommendations Based on the current review of literature of effective practices, we believe that DL
programs are viable bilingual models that promote bilingualism and biliteracy for both
language majority and language minority students. The current study makes no link
between dual language program costs and program effectiveness. Our recommendations
follow.
1. One of our recommendations is to conduct an analysis of effectiveness of DL
programs related to costs. Since there is a known sample of dual language
programs, state achievement data could be drawn on that sample and compared to
the associated costs.
2. Another recommendation is to perform a follow-up study of programs that
received federal funding to determine the level of sustainability. We found the
lowest costs per pupil were associated with the following: (a) Larger DL
Programs and (b) Two-Teacher Mixed Model Programs. No real cost difference
was detected between 50:50 and 90:10 DL program designs.

Texas Dual Language Program Cost Analysis
47
3. Our findings are based on actual expenditures above and beyond the traditional
transitional bilingual education program. The data indicated that the average per
pupil costs across programs sizes was $525, so for a 24-student classroom, the
estimated additional funds would be $12,600. For a 24-student classroom under
the two-teacher mixed model the costs for funding a DL program above and
beyond the traditional, transitional bilingual program is $7128. The reduced costs
of the two-teacher mixed model plus the additional benefits of “team-teaching,”
curriculum planning and sharing, and peer language clarifications lead us to
recommend the two-teacher mixed model, whether it is in a 50:50 or a 90:10
arrangement.
4. A recurring theme within the data was the lack of funding for native English
speakers who represent nearly 40% of the students served in DL programs in
Texas. The need for additional curriculum and assessment materials in Spanish
for these students is a financial challenge for these districts, many of which are
low SES, Title I campuses. As reported, as the percentage of native English
speakers increases in a DL program so does the costs per pupil. In fact, a 36.5%
local expenditure increase was detected for programs with larger percentages of
native English speakers. We recommend that the State determine alternative
funding avenues for supporting these additional student costs related to serving
the English speaker in a bilingual program.
5. Additionally, the State should reflect on the volume of programs that were
fostered under capacity-building federal funding initiatives and that now are
facing a critical stage as this additional program funding has been depleted. The

Texas Dual Language Program Cost Analysis
48
data revealed immediate concerns from campus and district administrators about
sustaining adequate funding levels that would maintain program integrity. The
State might consider a competitive grant process to pilot new programs and to
sustain existing ones including middle school and high school programs, so that
the intended goal of K-12 DL programs can be better realized. We recommend
that new programs funded under such a competitive grant process begin at
Kindergarten adding one grade level per year. We also recommend that programs
should be maintained at least through middle school.
6. Although not studied in our current research, we have a related recommendation
to the two-teacher mixed model, and that is to develop a dual language teacher
certification process allowing for testing in a teacher’s native language thereby
strengthening both language components and potentially increasing the number of
certified dual language teachers. Bilingual and ESL teachers are in critical
shortage in Texas and the question of how to attract and retain certified bilingual
teachers is paramount (Lara, Galloway, Irby & Brown, 2003). The state might
consider assisting local districts with the increasing costs associated (a) with
bilingual and ESL teacher stipends in dual language programs4, (b) with offering
additional loan forgiveness programs or (c) state bonuses/stipends for individuals
willing to serve in districts with extreme shortages5. Increasing the numbers of
students that graduate from Texas’ schools fully biliterate and bilingual may have
the potential over time to significantly address the bilingual teacher shortage as
well as other employment areas where bilingual skills are required. 4 This may be in the form of district reimbursement for such individuals. 5 This may be in the form of district reimbursement for such individuals.

Texas Dual Language Program Cost Analysis
49
7. The DL program can serve the English speakers or Spanish language learners
(SLL) and the Spanish speakers well by allowing them to obtain their academic
proficiency in Spanish by the time they reach junior high. At such time, they can
begin advanced placement Spanish credit. Dual language and foreign language
programs can work collaboratively to ensure the foreign language TEKS are
included in the curriculum between grades PK-5.
Our study provided insight into the actual start-up and annual costs by program
size over and above transitional bilingual program costs; we recommend for new, small
programs that the average start-up cost allocations should minimally approximate
$39,000 and annual cost allocations should minimally approximate $56,000 (or $879 per
pupil).
Final Remarks
The study results are strong and timely related to the costs of educating the nearly
16,500 students represented in this sample. Dual language programs can assist students in
becoming fully biliterate citizens of Texas who can serve as a unique linguistic, cultural,
and economic resource, who are much needed for the constructive future of our State and
Nation.

Texas Dual Language Program Cost Analysis
50
Selected References
Alanís, I. (2000). A Texas two-way bilingual program: Its effects on linguistic and academic achievement, Bilingual Research Journal, 24.
Baker, C. 1996). Foundations of bilingual education and bilingualism. 2nd Edition. Clevedon: Multilingual Matters.
Brisk, M. E. (1999). Quality bilingual education: Defining success. LAB Working Paper No 1. Providence, RI: Northeast and Islands Regional Educational Lab. at Brown Univ. (ERIC Document Reproduction Service No. ED 445549).
Cardenas, J., Bernal, J. & Kean, W. (1976). Bilingual education cost analysis. San
Anontio, TX: Intercultural Development Research Association.
Center for Applied Linguistics. (2002). Directory of two-way bilingual immersion programs in the U.S. Retrieved November 19, 2002 from http://www.cal.org/twi/directory]
Chambers, J. & Parrish, T. (1992). Meeting the challenge of language diversity: An evaluation of programs for pupils with limited proficiency in English. Berkeley, CA: BW Associates
Christian, D., & Whitcher, A. (1995). Directory of two-way bilingual programs in the U.S.. Santa Cruz, CA/Washington, DC.: National Center for Research on Cultural Diversity and Second Language Learning.
Christian, D. (1994). Two-way bilingual education: Students learning through two
languages. Education Practice Report, 12. Center for Applied Linguistics.
Christian, D. (1996). Two-way immersion education: Students learning through two languages. The Modern Language Journal, 80 (1), 66-76.
Cloud, N., Genesee, F., & Hamayan, E. (2000). Dual language instruction: A handbook for enriched education. Boston, MA: Heinle & Heinle.
Collier, V. P. (1992). A synthesis of studies examining long-term language minority
student data on academic achievement. Bilingual Research Journal, 16, 187-222. Cummins, J., & Swain, M. (1986). Bilingualism in education. New York: Longman.
Cummins, J. (1981b). The role of primary language development in promoting educational success for language minority students: A theoretical framework. Los

Texas Dual Language Program Cost Analysis
51
Angeles: California State University: Evaluation, Dissemination and Assessment Center, 3-29.
Cummins, J. (1991). Interdependence of first- and second-language proficiency in bilingual children. In E. Bialystok (Ed.) Language processing in bilingual children. (pp. 70-89). Cambridge: Cambridge University Press.
Cummins, J. (1992). Empowerment through biliteracy. In J. V. Tinajero & A. F. Ada, (Eds.) The power of two languages: Literacy and biliteracy for Spanish-speaking students (pp9-25). New York, NY: Macmillan/ McGraw-Hill.
Galloway, M. (2003). The impact of a minimal English reading intervention on young
Hispanic bilinguals. An unpublished dissertation. Texas A&M Univetsity.
Genessee, F. (1987). Learning through two languages: Students of immersion and bilingual education. Cambridge, Mass.: Newbury House.
Gómez, L. (2000). Two-way bilingual education: Promoting educational and social change. The Journal of the Texas Association for Bilingual Education, 5 (1), 43-54.
Hernandez-Chavez, E. (1984). The inadequacy of English immersion education as an
educational approach for language minority students in the U.S.. In Studies on immersion education. (pp. 144-180). CA: Bilingual bicultural education, California State Department of Education.
Lara-Alecio, R., & Parker, R. (1994). A pedagogical model for transitional English
bilingual classrooms. Bilingual Research Journal, 18 (3&4), 119-133. Lara-Alecio, R., Galloway, M., Irby, B., & Brown, G. (2003) Superintendents’ Study of
Bilingual Teacher Recruitment and Retention. A report prepared for the Texas A&M Regent’s Initiative.
Lara-Alecio, R., Galloway, M., Irby, B., Rodriguez, L. & Gomez, L. (2004). Two-Way immersion bilingual programs in Texas, Bilingual Research Journal, 28(1).
Lindholm, K. J., & Aclan, Z. (1991). Bilingual proficiency as a bridge to academic achievement: Results from bilingual/immersion programs. Journal of Education, 173, 99-113.
Lindholm, K. J. (1987). Directory of bilingual immersion programs. Educational Report No. 8 of the Center for Language Education and Research, UCLA.

Texas Dual Language Program Cost Analysis
52
National Clearinghouse for English Language Acquisition (2002). Rate in LEP growth. Accessed at http://www.ncbe.gwu.edu/ncbepubs/reports/state-data/2000/
Ovando, C.J., Collier, V.P., & Combs, M. C. (2002) Bilingual and ESL classrooms:
Teaching in multicultural contexts (3rd edition). McGraw Hill.
PEIMS, (2002). Public Education Information Management System. Online at http://www.tea.state.tx.us/peims/.
Ramirez, J., Pasta, D., Ramey, D., & Yuen, S. (1991). Final report: Longitudinal study of structured English immersion strategy, early-exit and late-exit bilingual education programs for language minority children. Vol. 1. Prepared for U.S. Department of Education (Contract No. 300-87-0156). San Mateo, CA: Aguirre International.
Slavin, R. & Cheung, A. (2003). Effective reading programs for English language learniers: A best synthesis. http://www.csos.jhu.edu/crespar/techReports/Report66.pdf
Swain, M., & Lapkin, S. (1982). Evaluating bilingual education. Clevedon, England: Multilingual Matters.
Texas Education Agency. (2003). Pocket edition, p. 3
(http://www.tea.state.tx.us/perfreport/pocked/2002/pocked0102.pdf) Texas Education Code (2001). TEC, Chapter 39, Subchapter B. Available online at
http://www.tea.state.tx.us/rules/tac.
Thomas, W. P., & Collier, V. (1997). School effectiveness for language minority students. Washington, DC: NCBE. Available online: http://www.ncbe.gwu.edu/ncbepubs/resource/effectiveness/index.htm.
Thomas, W. P. & Collier, V. (2001). A national study of school effectiveness for
language minority students’ long term academic achievement. Center for Research on Education, Diversity and Excellence. Available online at http://www.crede.ucsc.edu/research/llaa/1.1es.html
Torres-Guzman, M. (2002). Dual language programs: Key features and results.
Washington, D.C: National Clearinghouse for Bilingual Education.
Valdes, G. (1997). Dual-Language immersion programs: A cautionary note concerning
the education of language-minority students. Harvard Educational Review, 67(3), 391-429.

Texas Dual Language Program Cost Analysis
53
Appendix A

file:///C:/HEMA_STUFF/costbenefitanalysis/Campus Survey.htm
Two Way Dual Language (DL) Operational Cost Survey at Campus Level 1. Your Name
2. Your Title/Position
3. School/Campus Name
4. District
5. Region No. 6. Email Address
7. Phone Fax
8. Total District Enrollment
9. Number of total students (both Native Spanish and English Speakers) enrolled in the dual language program on this campus: 10. What grade levels are being served in your campus dual language program?
Pre-K K 1 2
3 4 5 6
7 8 9 10
11 12
11. Percentage Native English Speakers in Dual Language Program
12. Percentage Native Spanish Speakers in Dual Language Program
13. Number of Dual Language Teachers
14. Number of Dual Language teachers instructing in Spanish
15. Number of Dual Language teachers instructing in English
Program Model (Please note: We are targeting Spanish/English Dual Language Programs.)
16. While all dual language programs include both native English and native Spanish speakers, the administrative models vary. Please choose the administrative model which most closely mirrors your own.
Students being served by different teachers, one in Spanish, the other in English, for differing periods of the day/week. Native English and native Spanish speakers are mixed within the same class group.
Students being served by a single bilingual teacher instructing in both Spanish and English for different periods of the school day/week.
Students being served by different teachers, one in Spanish, the other in English, for differing periods of the day/week. Native English and native Spanish speakers are separated into different class groups which are then switched for shifts in language of instruction.
17a. This DL program is (check one):
This campus has dual language as its only bilingual optionThe entire campus is Dual LanguageThe campus consists of both a dual language and a transitional
bilingual program
17b. Our Dual Language program is best described as: 90/1050/50
Page 1
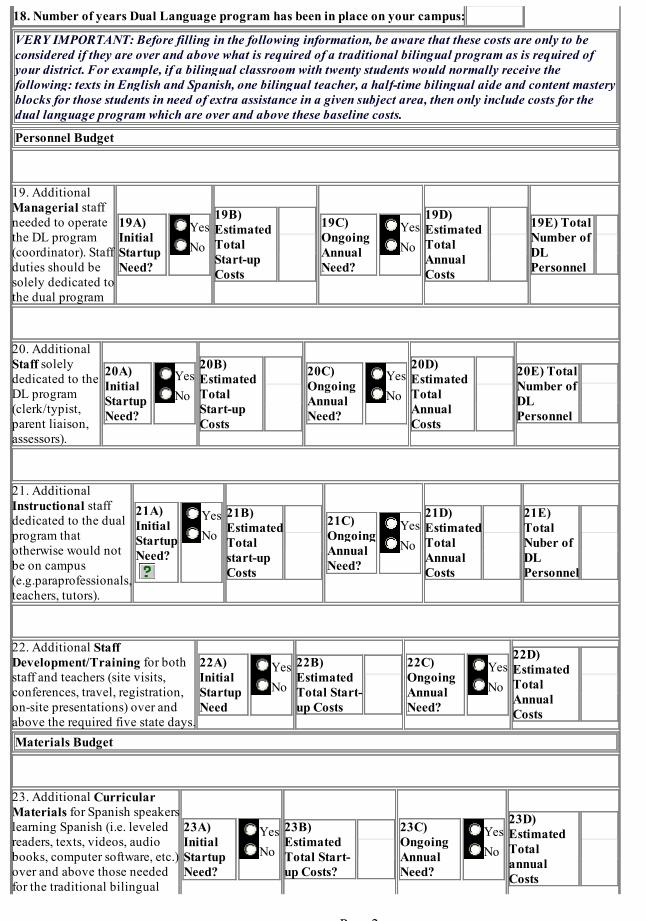
file:///C:/HEMA_STUFF/costbenefitanalysis/Campus Survey.htm
18. Number of years Dual Language program has been in place on your campus:
VERY IMPORTANT: Before filling in the following information, be aware that these costs are only to be considered if they are over and above what is required of a traditional bilingual program as is required of your district. For example, if a bilingual classroom with twenty students would normally receive the following: texts in English and Spanish, one bilingual teacher, a half-time bilingual aide and content mastery blocks for those students in need of extra assistance in a given subject area, then only include costs for the dual language program which are over and above these baseline costs.
Personnel Budget
19. Additional Managerial staff needed to operate the DL program (coordinator). Staff duties should be solely dedicated to the dual program
19A) Initial Startup Need?
YesNo
19B) Estimated Total Start-up Costs
19C) Ongoing Annual Need?
YesNo
19D) Estimated Total Annual Costs
19E) Total Number of DL Personnel
20. Additional Staff solely dedicated to the DL program (clerk/typist, parent liaison, assessors).
20A)Initial Startup Need?
YesNo
20B) Estimated Total Start-up Costs
20C) Ongoing Annual Need?
YesNo
20D) Estimated Total Annual Costs
20E) Total Number of DL Personnel
21. Additional Instructional staff dedicated to the dual program that otherwise would not be on campus (e.g.paraprofessionals, teachers, tutors).
21A) Initial Startup Need?
YesNo
21B) EstimatedTotal start-up Costs
21C) Ongoing Annual Need?
YesNo
21D) Estimated Total Annual Costs
21E) Total Nuber of DL Personnel
22. Additional Staff Development/Training for both staff and teachers (site visits, conferences, travel, registration, on-site presentations) over and above the required five state days.
22A) Initial Startup Need
YesNo
22B) Estimated Total Start-up Costs
22C) Ongoing Annual Need?
YesNo
22D) Estimated Total Annual Costs
Materials Budget
23. Additional Curricular Materials for Spanish speakers learning Spanish (i.e. leveled readers, texts, videos, audio books, computer software, etc.) over and above those needed for the traditional bilingual
23A) Initial Startup Need?
YesNo
23B) Estimated Total Start-up Costs?
23C) Ongoing Annual Need?
YesNo
23D) Estimated Total annual Costs
Page 2

file:///C:/HEMA_STUFF/costbenefitanalysis/Campus Survey.htm
classroom.
24. Additional Curricular Materials for English speakers learning Spanish (i.e. leveled readers, texts, videos, audio books, computer software, etc.) over and above those needed for the traditional bilingual classroom.
24A) Initial Startup Need?
YesNo
24B) Estimated Total Start-up Costs
24C) Ongoing Annual Need?
YesNo
24D) Estimated total Annual Costs
25. Additional Assessment Materials (additional kits, forms) needed to assess students in both English and Spanish. (e.g. materials needed to assess native English Speakers otherwise not needed)
25A) Initial Startup Need?
YesNo
25B) Estimated Total Start-up Costs
25C) Ongoing Annual Need?
YesNo
25D) Estimated Total Annual costs
26. Additional Equipment necessary to the proper functioning of the program (for example: card readers, listening stations).
26A) Initial Startup Need?
YesNo
26B) Estimated Total Start-up Costs
26C) Ongoing Annual Need?
YesNo
26D) Estimated total Annual Costs
27. Additional Recruitment costs for both students and teachers (newspaper, radio, television, meetings, flyers) Factor these costs only if they are in addition to typical school-home communications.
27A) Initial Startup Need?
YesNo
27B) Estimated Total Start-up Costs
27C) Ongoing Annual Need?
YesNo
27D) Estimated Total Annual Costs
28. Additional Public Relations costs. (videos, brochures, meetings) Factor these costs only if they are in addition to typical school-home communications.
28A) Initial Startup Costs
YesNo
28B) Estimated Total Start-up Costs
28C) Ongoing Annual Need
YesNo
28D) Estimated Annual Costs
29. Additional Parent Involvement costs (meetings, incentives, training, take home reading materials, take home instructional materials).
29A) Initial Startup Need?
YesNo
29B) Estimated Total Start-up Costs
29C) Ongoing Annual Need?
YesNo
29D) Estimated Total Annual Costs
Page 3

file:///C:/HEMA_STUFF/costbenefitanalysis/Campus Survey.htm
30. Other additional materials costs not otherwise specified in previous questions.
30A) Initial Startup Need?
YesNo
30B) Estimated Total Startup Costs
30C) Ongoing Annual Need?
YesNo
Estimated Total Annual costs
31. Briefly describe any additional materials costs referenced in question 30. A)
Funding Sources
32. Federal Funds or Grants--Federal Title III/VII(Not from TEA).
32A) Did the DL program receive these funds?
YesNo
32B) For what years?
32C) Estimated Total Funding
32D) Would the DL program have been possible without this specific support?
YesNo
33. Local Businesses and Organizations
33A) Did the DL program receive these funds?
YesNo
33B) Forwhat years?
33C) Estimated Total Funding
33D) Would the DL program have been possible without this specific support?
YesNo
34. Private Foundations/Grants
34A) Did the DL program receive these funds?
YesNo
34B) For what years?
34C) Estimated Total Funding
34D) Would the DL program have been possible without this specific support?
YesNo
35. Other funds not listed under previous categories.
35A) Did the DL program receive these funds?
YesNo
35B) For what years?
35C) Estimated Total Funding
35D) Would the DL program have been possible without this specific support?
YesNo
36. Briefly describe any additional funding sources referenced in question 35.
37. Will you be able to sustain the dual language program without federal assistance?
YesNo
38. If not, why?
39. How much additional annual funding will you need to sustain the program at an adequate level?
Page 4

file:///C:/HEMA_STUFF/costbenefitanalysis/Campus Survey.htm
Submit
40. This space is provided for additional comments. Any additional information that you can provide is appreciated:
Page 5

file:///C:/HEMA_STUFF/costbenefitanalysis/Campus Survey.htm
Page 6

Texas Dual Language Program Cost Analysis
54
Appendix B

Bilingual Director Survey
1. Your Name
2. Your Title/Position
3. District
4. Region No.
5. Total District Enrollment
6. Number of schools that house dual language programs in the district 7.Grade levels of dual language programs: PK K 1 2 3 4 5 6 7 8 9 10 11 12you must check at least one item 8. Number of total students (both Native Spanish and English Speakers) enrolled in this district’s dual language program:9. Number of students served in this district's transitional bilingual program outside of the two-way dual language program10. Number of students served in ESL
11. Total state allocation for English-language learners
12. Total annual grant funds for English language learners
13. Total additional local funds for English language learners
14. What is the first year the dual language program was in place?
Submit
Page 1 of 1
12/16/2004file://C:\HEMA_STUFF\costbenefitanalysis\District Survey.htm