texas ports 2015-2016 capital program: executive summary
TRANSCRIPT

TEXAS PORTS2015 – 2016 CAPITAL PROGRAME X E C U T I V E S U M M A R Y

ContentsLetter From the Chairman ............................................... 1
The Port Authority Advisory Committee (PAAC) ............... 2
Capital Program Introduction .......................................... 4
Texas Ports 2015-2016 Capital Program Projects ............ 9
Port of Beaumont ......................................................... 10
Port of Brownsville ........................................................ 12
Port of Corpus Christi ................................................... 14
Port of Galveston .......................................................... 16
Port of Houston Authority ............................................. 18
Port Mansfield .............................................................. 20
Port of Port Arthur ........................................................ 22
Port of Palacios ............................................................ 24
Port of Victoria .............................................................. 26
Closing Statement ........................................................ 29
The 2015 – 2016 Texas Ports Capital Program Executive Summary contains ideas and recommendations of the Port Authority Advisory
Committee and does not contain proposals by the Texas Department of Transportation.

TEXAS PORTS 2015 – 2016 CAPITAL PROGRAM Page 1
Port Authority Advisory Committee
LETTER FROM THE CHAIRMANAs chair of the Port Authority Advisory Committee (PAAC), I am pleased
to represent the Texas Ports 2015-2016 Capital Program. Texas ports are posturing themselves to take advantage of all the exciting developments happening globally, such as the completion of the Panama Canal expansion and the shipping industry’s decision to move larger vessels with deeper drafts into our waters. In Texas, our ports have experienced extraordinary growth and diversification due to the shale plays in the US and Canada. As a result, many of our ports play a key role in the supply chain for the oil and gas industry.
The recent passing of the Water Resources Reform and Development Act of 2014 (WRRDA) provides promising opportunities for the growth of Texas ports. The PAAC is committed to work with our federal legislators and the US Army Corps of Engineers to maximize these opportunities in 2016. More information about how WRRDA benefits Texas ports is included in the Capital Program Introduction of this Executive Summary.
This year’s Capital Program focuses on high-priority projects that Texas ports need to implement now in order to capture markets, tenants, and to build revenues and jobs for our communities. The projects in our program vary in size, scope, and emphasis, but each serves as a catalyst for economic growth, improves port access, and enhances intermodal transportation opportunities.
The Texas Ports 2015-2016 Capital Program was developed through a much more rigorous approach than in prior years. Every port has significant backlog in capital improvement projects, and we want to make sure the best projects are highlighted. Our selection criteria for projects is discussed in the Capital Program Introduction inside this Executive Summary.
The impact that Texas ports have on our state-wide economy is immeasurable. Each of the projects discussed within these pages uniquely benefits its local region, and contributes to the well-being of our state and nation as a whole.
We ask for your support for our Texas ports to help bring them to the forefront of the competitive global trade market in which they must thrive so that we, as citizens of Texas, may also thrive.
John LaRueChairman,
Port Authority Advisory Committee
Gul
f of
Mexico
TexasPort of Houston
Port of Galveston
Port of Beaumont
Port of Orange
Port ofTexas City
Port ofFreeport
Calhoun Port Authority
Port of West Calhoun
Bay City
Port ofHarlingen Port of
Port Isabel
Port of Port Arthur
Port of PalaciosPort of Victoria
Port of Corpus Christi
Port of Brownsville
Port Mansfield

TEXAS PORTS 2015 – 2016 CAPITAL PROGRAM Page 3
Port Authority Advisory CommitteePort Authority Advisory Committee
Page 2 TEXAS PORTS 2015 – 2016 CAPITAL PROGRAM
THE PORT AUTHORITY ADVISORY COMMITTEE (PAAC)
The Port Authority Advisory Committee Members
The PAAC develops the Port Capital Program annual report that details various port projects and funding needs submitted by Texas public ports. Under Chapter 55 of the Transportation Code, the Texas Transportation Commission appoints the seven members of the PAAC.
John LaRueChairmanExecutive Director
Port of Corpus Christi
Lower Coast Representative
Eduardo A. CampiranoPort Director
Port of Brownsville
Lower Coast Representative
Glenn CarlsonPort Director
Port of FreeportUpper Coast
Representative
John R. RobyDirector of
Corporate AffairsPort of Beaumont
Upper Coast Representative
Roger GuentherExecutive Director
Port of HoustonPermanent
Member
Jennifer StastnyDirector of Operations
Port of VictoriaLower Coast
Representative
Larry KelleyDeputy Port
DirectorPort of Port
ArthurUpper Coast
Representative
Mission
THE
PO
RT
AU
THO
RIT
Y A
DV
ISO
RY
CO
MM
ITTE
E “Elevate port issues as a vital component of the Texas transportation system and advise the Texas Transportation Commission and Department on matters relating to maritime transportation.”
Goals/Objectives• Identify high-priority and strategic port projects and make recommendations
to the department for investment• Incorporate maritime interests in TxDOT planning activities and documents• Promote Texas ports for economic development opportunities• Identify Federal, State or other funding opportunities for maritime investment
Strategies• Work with the Legislature to:
» Secure a funding stream for the general revenue Port Access Account Fund (PAAF)
» Improve the effectiveness of the PAAC in implementing Chapter 55 of the Transportation Code
• Use the PAAC in conjunction with the Texas Ports Association to communicate Texas maritime transportation issues and concerns to TxDOT
Tasks1. Establish guidelines for determining eligibility of port projects to be
funded by statewide sources, specifically funding under Ch. 55 of the Transportation Code
» Focus on projects that link multiple modes and have statewide impact 2. Develop economic impact analysis and return on investment for state-funded
port projects3. Document statewide economic impact of ports to Texas and the nation4. Prepare the Port Capital Program every two years, with a list of projects that
have been recommended by the committee 5. Assist TxDOT in prioritizing investments by identifying high priority and
strategic port projects to be included in agency planning documents6. Develop strategies for promoting Texas ports for economic development
opportunities » Develop partnership with the Governor’s Economic Development and Tourism Office (recommendation of the Panama Canal Stakeholder Working group)
7. Establish a peer review process to learn best practices from other State DOTs

TEXAS PORTS 2015 – 2016 CAPITAL PROGRAM Page 5
Port Authority Advisory CommitteePort Authority Advisory Committee
Page 4 TEXAS PORTS 2015 – 2016 CAPITAL PROGRAM
CAPITAL PROGRAM INTRODUCTION
Texas is blessed with over 367 miles of coastline that provide the residents of the state with a multitude of
economic opportunities via the movement of waterborne commerce and trade. The movement of commerce through the Texas navigation system generates significant national, state, public, and private economic opportunities leading to the generation of revenue and well-paying jobs throughout the state, region, and nation. These economic opportunities are found in oil and gas exploration and production, agriculture, manufacturing, wind energy, chemical processing, recreational cruising, warehousing, and distribution industries. In 2012, Texas was the number two state in the nation for waterborne commerce defined by tonnage, moving over 485 million tons of cargo, and the number two state for cruise passengers, exceeding 1.2 million travelers per year. Texas ports generate over $5 billion in local and state tax revenue, and over $9 billion in federal import tax revenue each year.
LouisianaPort ofOrange
Port ofPort
Arthur
Port ofBeaumont
Port ofGalveston
Port ofTexasCity
Port ofFreeport
Port ofPort
IsabelPort of
Brownsville
Port ofCorpusChristi
Port ofHouston
CalhounPort
Authority
Port ofVictoria
Port ofPalacios
Port ofPort
Mansfield
Port ofHarlingen
Port ofWest
Calhoun
CedarBayou
Texas Department of TransportationTransportation Planning and Programming Division
Data Analysis, Mapping and Reporting BranchApril 25, 2013
Copyright 2013Texas Department of Transportation
NoticeThis map was produced for internal use
within the Texas Department of Transportation.Accuracy is limited to the validity of available
data as of December 31, 2012.° 0 5025Miles
Texas Ports
Texas
Mexico
Gulf of
Mexico
Bay City
ChocolateBayou
Seadrift
Port O'Connor
PointComfort
Port Lavaca
Barbours Cut
BayportTerminal
Port ofTexasCity
Port of Galveston
Port of GalvestonPort of Galveston
Port of Houston
CedarBayou
2013
INSET 1
INSET 1
INSET 2
INSET 2
Deep Draft PortShallow Draft Port
Deep Draft ChannelsShallow Draft Channels
Other Port Locations
Texas PortsMost of the state’s ports are subdivisions of the State and have typically been self-sustaining, receiving very little, if any, direct funding. Port revenue is typically generated through fees ports charge for handling cargo and berthing ships at their facilities. Many ports have the ability to levy a tax within their designated special district as well as to solicit revenue through bond initiatives. These revenue streams used to be sufficient for ports to plan and execute capital improvement projects. Today, the demand for new infrastructure to support the state’s economic boom has outpaced the ports’ abilities to finance and construct projects in a timely manner.
The current economic upswing in the Texas economy is being driven largely by the development of the state’s shale oil in the Eagle Ford, Barnett, and Permian Basin regions. Other energy developments, such as North Dakota’s Bakken region and Canada’s tar sands, are also factors. More of
these products are being moved to Texas refineries via train and pipeline to take advantage of the state’s robust refining industry and readily available ports. Nearly all of the petrochemical and LNG industries located along the coast are undergoing major expansion, investing billions of private dollars into their facilities.
The opening of the new and enhanced third set of locks on the Panama Canal is driving other opportunities to export natural gas to Asia and increase the number of containers arriving and departing from Texas ports. This increased activity has resulted in Texas ports advancing their own capital improvement projects — over $300 million since 2010 — to satisfy existing customers’ current and future needs, as well as to meet the needs of new tenants. Competition among ports for new tenants and enhanced business opportunities is very intense.
n|
n|
n|
n|n|
n|n|n|n|
n|
n|
n|
n|
Port Mansfield
Orange
Houston
Beaumont
Freeport
GalvestonTexas City
Port Sabine
Port Isabel
Port Arthur
Brownsville
Corpus Christi
Calhoun Port Authority
§̈¦35 §̈¦45
§̈¦30
§̈¦20
§̈¦20
§̈¦27
§̈¦40
§̈¦35
§̈¦37
0 100 200 Miles50
LegendInterstate Hwy Railroad n| Deepwater Seaport
§̈¦10
Texas Transportation Network

TEXAS PORTS 2015 – 2016 CAPITAL PROGRAM Page 7
Port Authority Advisory CommitteePort Authority Advisory Committee
Page 6 TEXAS PORTS 2015 – 2016 CAPITAL PROGRAM
Competition is both regional and international. Internationally, Texas competes with ports in Mexico, the Caribbean, and Central America. Regionally, the competition is mainly centered on the Gulf Coast ports for bulk and liquid bulk commodities and with East and West coast ports for container traffic. Many of the ports competing with Texas receive state government-funded subsidies to attract new tenants and have access to grants or low interest loans for their capital improvement projects. These programs, established by each state’s legislature, make revenue available through various programs such as the economic development funds, general revenue, tax incentives, or transportation programs. This revenue has been used to subsidize channel deepening and widening projects, dock side infrastructure, warehouses, cruise terminals, security enhancements, and intermodal transportation projects to reduce congestion. These subsidized port enhancements make non-Texas ports more attractive to shippers and potential tenants, luring business away from Texas. Table 1 lists the types of funding programs made available by each state for port infrastructure.
In 2001, the Texas Legislature amended the Transportation Code to create Chapter 55-Funding of Port Security, Projects and Studies. This chapter addresses three main subjects: the Port Authority Advisory Committee (PAAC), the Port Access Account Fund (PAAF), and the Capital Program. The Texas Transportation Commission appoints seven members to the PAAC. The committee develops the Capital Program biennial report that details various projects and funding needs submitted by Texas public ports. The Port Access Account Fund (PAAF) is intended to provide the means for the state to help fund expansion and upgrading of Texas public port facilities. It has never been funded. This lack of funding has limited many ports’ expansion opportunities because they do not generate the revenue to pay for capital improvement projects fast enough and do not have bonding capacity. Without these capital improvements, existing clients and potential new clients move to other ports.
Table 1: Port Funding Programs by State
State GrantsLow Interest
Loans
Motor Vehicle Registration
Fees Tax IncentivesTransportation
Program
Economic Development
ProgramGeneral Revenue
Texas *
Alabama **** X
Florida X X X X X
Louisiana X X X
Mississippi X X X X X X
Georgia X X
South Carolina X X
North Carolina X X
Virginia X
Rhode Island X X
Oregon X X
California X
Indiana X
Ohio X X
Com
pile
d fro
m “T
exas
Dep
artm
ent o
f Tra
nspo
rtat
ion
Gulf
Intra
coas
tal W
ater
way
Leg
isla
tive
Repo
rt,”
83rd
Leg
isla
ture
, 201
2
Measurement = 195’ x 35’Capacity = 1,750 short tons1 Barge
1 Tank BargeMeasurement = 300’ x 54’Capacity = 27,500 bbl
15 RailcarsWhen Dredged toAuthorized Depth
70 TrucksWhen Dredged toAuthorized Depth
12 Railcars 58 Trucks
46 RailcarsWhen Dredged toAuthorized Depth
144 TrucksWhen Dredged toAuthorized Depth
39 Railcars
Moves11
120 Trucks
Gallonof Fuel
Ton ofCargo
Comparison of Modes of Freight Transportation 616 Miles by Water
478 Miles by Rail
150 Miles by Truck
**** Alabama provided a one-time grant from their general revenue fund for $10M; they do not have a formal program.*Texas authorized the Port Access Account fund as a general revenue fund in 2001. It has never been funded.

TEXAS PORTS 2015 – 2016 CAPITAL PROGRAM Page 9
Port Authority Advisory CommitteePort Authority Advisory Committee
Page 8 TEXAS PORTS 2015 – 2016 CAPITAL PROGRAM
Water Resources Reform and Development Act of 2014 (WRRDA)The federal government’s recent passing of the Water Resources Reform and Development Act of 2014 (WRRDA) is critical to the strategic future of Texas ports and their growth. The law authorized new channel deepening projects for the Port of Freeport and the Sabine-Neches Waterway, and reauthorized the deepening project for the Corpus Christi Ship Channel. These projects come at a critical time and set the stage for Texas ports to fully take advantage of the expansion the Panama Canal, our booming oil and gas industry, and the shipping industry’s decision to move to larger vessels with deeper drafts.
Getting authorization for these projects is the first step to receiving federal funding for design and construction. Past history has shown that federal funding can be slow and unpredictable, and these channel deepening projects can take years to complete.
These channel improvement projects are not included in this year’s Port Capital Plan. It is the federal government’s responsibility to fund and oversee their construction. The PAAC will continue to work closely with our federal legislators and the U.S. Army Corps of Engineers to expedite this funding.
Port of Houston: Bayport Rail Spur
Page 18
Port of Galveston: Cruise Terminal 2 Expansion
Page 16
Port of Beaumont: New Access Roadway and Overpass
Page 10
T E X A S
Texas Ports 2015-2016 Capital Program Projects
Port of Port Arthur: 4,000-Linear-Foot Rail Extension and 6 Acres of Backland ImprovementsPage 22
Port of Palacios: Bulkhead Improvements – 12th Street Shrimp DocksPage 24
Port of Victoria: Barge Dock with Eight Berths for Oil Loading and General Cargo Capabilities
Page 26
Port of Corpus Christi: 15-Acre Cargo Storage Yard Expansion, La Quinta Gateway TerminalPage 14
Port of Brownsville: Oil Dock 6Page 12
Port Mansfield: Dredging of the Port Mansfield ChannelPage 20
Selection CriteriaThe PAAC established the following guidance for the development of the 2015-2016 Port Capital Program:• The project must abide by the guidance in Texas
Transportation Code, Title 4, Chapter 55, Funding of Port Security, Projects and Studies.
• Each port may submit one high-priority project in the $10 million range.
• Each project must undergo an economic, environmental, and engineer review.
• Large ports ( more than 1 million tons of cargo/year) share the cost of the project 50-50 with the State.
• Smaller ports (less than 1 million tons of cargo/year) share the cost of the project 75-25 with the State.

TEXAS PORTS 2015 – 2016 CAPITAL PROGRAM Page 11
Port Authority Advisory CommitteePort Authority Advisory Committee
Page 10 TEXAS PORTS 2015 – 2016 CAPITAL PROGRAM
?
The Proposed Project: Construction of an access roadway between the southern and northern sides of the port
About the Port of Beaumont… The Port offers 600,000 square feet of covered storage, bulk cargo terminals, and 80 acres of open storage. Three major rail carriers, five major roadways, the Gulf Intracoastal Waterway, and global steamship lines serve the Port of Beaumont.
The Port of Beaumont has requested PAAF funding assistance for a roadway and overpass to improve access within the port. Access roads between the southern and northern sides of the port are currently constrained by frequent disruptions caused by long trains on departure rail tracks dividing the port. Blockages impair access for tenant operations. The proposed project will eliminate at-grade rail crossings, provide direct access to the main port area, improve safety, and reduce idle time for vehicles. The Port is also developing 82 acres south of the proposed project. This will greatly facilitate expansion of new operations. Benefits of the overpass include improved access and cargo handling efficiency, improved use and marketability of the landside portion of the Port, and expected overall growth in cargo tonnage as well as jobs.
Need for PAAF Funding The Port of Beaumont can provide the requested matching funds for the project. However, the Port cannot afford the entire capital cost. Its current operating revenues are simply insufficient to cover the cost of an expensive overpass. If tenant fees are increased to pay for these improvements, the Port risks losing tenants to less expensive ports outside of Texas. If the Port does not receive funding, it could be at a competitive disadvantage compared to other ports in Mississippi, Florida, Alabama, and Louisiana.
Did you know?The U.S. military
recognizes the Port of Beaumont as the busiest military port in the world. Military
cargo generates revenue through wharfage, commodity charges
and office leases. The Port’s total military cargo-related revenue was ~$ 1.85 million during the most recent 12-month period.
Point-of-contact: David C. Fisher, Port Director and CEO
409-835-5367
Project Benefits: The project is expected to generate the following benefits:• The proposed project would result in a larger port that
could operate with greater landside access efficiency and generate greater revenues and jobs for the community.
• The $10 million construction impact creates approximately 82,000 person-hours of economic benefit. Approximately 80,577 induced person-hours are created as a result of local purchases made by individuals whose presence is directly generated by construction activity. An additional 139,642 indirect person-hours are supported by $6.6 million of purchases in the local and regional economy.
• Tenant Kinder Morgan’s aggregate operations would be improved with new access.
• It is anticipated that the project would attract new customers to the 82 acres of south side properties that are currently under construction.
• Cargo revenue growth is anticipated with greater bulk cargo movement and military cargo operations. The new access roadway and overpass would encourage creation of new wind energy cargo business.
Economic Impacts Generated by Construction ActivityTOTAL CONSTRUCTION VALUE $10,000,000
JOBS
Direct (person-hours) 82,000
Induced 80,577
Indirect 139,642
PERSONAL INCOME
Direct $1,492,400
Re-spending/Local Consumption $4,298,261
Indirect $3,369,663
TOTAL $9,160,324
LOCAL PURCHASES $6,560,180
STATE AND LOCAL TAXES $723,666
TOTAL ECONOMIC BENEFIT $16,444,170
Port ReadinessThis project has been on the Port’s Master Plan for a number of years and is a viable candidate for PAAF funding. The Port has completed an estimate of probable construction cost based on a conceptual engineering report, and it is anticipated that this project could be completed in 18 to 24 months.
For more detailed information about the proposed project, please reference Appendix A.
PORT OF BEAUMONTNew Access Roadway and Overpass
Project Cost: $10,000,000 Port Match: $5,000,000 PAAF Request: $5,000,000

TEXAS PORTS 2015 – 2016 CAPITAL PROGRAM Page 13
Port Authority Advisory CommitteePort Authority Advisory Committee
Page 12 TEXAS PORTS 2015 – 2016 CAPITAL PROGRAM
The Proposed Project: Construct a new oil dock — Oil Dock 6 — on the north side of the Brownsville Ship Channel near existing and future tank farms
The Port of Brownsville proposes to construct a new oil dock, Oil Dock 6, to improve and expand marine delivery and shipment of refined petroleum products, including asphalt, gasoline, and low-sulfur diesel fuel. Four of the oil docks currently in use at the Port of Brownsville are beyond their design life and in poor condition. Without this new dock, oil cargoes at the Port will be limited to only 1.9 millions tons of liquid bulk cargo, while a 30 percent growth in petroleum product tonnage is anticipated in the next five years. Privately-owned tank farm expansion plans hinge on the Port’s investment in a new, high-capacity oil dock.
Proposed Oil Dock 6 includes dredging the berth area, construction of a bulkhead at the shoreline, placement of pile-supported mooring and breasting structures, a pile-supported concrete loading platform, upland pavement, pipe bridges, and a dock house.
Need for PAAF Funding The Port of Brownsville must upgrade their capital infrastructure now to meet the rapidly growing oil and gas-related cargo needs of the region. Though the Port’s revenues are increasing, it has not been able to generate enough funds to pay for costly capital improvements. Alternative funding mechanisms, such as revenue bonds, rate increases, and public private/partnerships, are not currently viable options. PAAF funding will allow the Port to develop an additional dock sooner and would support expanded cargo growth in the region.
Point-of-contact: Eduardo Campirano
Port Director and CEO
956-831-4592
Port ReadinessThis project is a viable candidate for PAAF funding and is considered “shovel ready.” The Port has received the necessary environmental clearances and permits to move forward, and has complete plans and specifications for construction of the dock. It is anticipated that this project could be completed in 12 to 18 months.
Project Benefits: The project is expected to generate the following benefits:• The $22 million Oil Dock 6 construction impact creates
approximately 201,890 person-hours of economic benefit. Approximately 198,386 induced person-hours are created as a result of the local purchases of the individuals directly generated by the construction activity. An additional 109,253 indirect person-hours are supported by $4.9 million of purchases in the local and regional economy.
• Oil Dock 6 would generate 310 direct, induced, and indirect jobs within one year of operation. Over 600 direct, induced, and indirect jobs are projected in the fifth year.
• Oil Dock 6 would generate $1.8 million of annual state and local taxes and nearly $42.3 million of annual revenue, excluding the value of cargo shipped through the facility after its first year of operation.
• The proposed project would meet the Port’s needs to fulfill tenant requests, provide wharf space for larger sized ships, and increase petroleum cargo volumes.
Economic Impacts Generated by Construction ActivityTOTAL CONSTRUCTION VALUE $22,000,000
JOBS
Direct (person-hours) 201,890
Induced 198,386
Indirect 109,253
PERSONAL INCOME
Direct $3,674,403
Re-spending/Local Consumption $10,582,649
Indirect $2,649,639
TOTAL $16,906,691
LOCAL PURCHASES $4,915,661
STATE AND LOCAL TAXES $1,335,629
TOTAL ECONOMIC BENEFIT $23,157,981
For more detailed information about the proposed project, please reference Appendix A.
PORT OF BROWNSVILLEOil Dock 6
Project Cost: $22,000,000 Port Match: $11,000,000 PAAF Request: $11,000,000

TEXAS PORTS 2015 – 2016 CAPITAL PROGRAM Page 15
Port Authority Advisory CommitteePort Authority Advisory Committee
Page 14 TEXAS PORTS 2015 – 2016 CAPITAL PROGRAM
The Proposed Project: Develop and construct an additional 15 acres of cargo laydown area in the La Quinta uplands for general cargo throughput at the Port of Corpus Christi
What is the La Quinta Trade Gateway Terminal Project?The La Quinta Trade Gateway Terminal Project is a major component of the Port of Corpus Christi Authority’s long term development plan. Located on a 1,100-acre greenfield site on the north side of Corpus Christi Bay, this fully permitted project will provide a state-of-the-art multi-purpose dock and container facility when completed. Projected features include:
• Federal extension of the 45-foot deep La Quinta Ship Channel
• Construction of a 3,800-foot-long, three-berth ship dock with nine ship-to-shore cranes,
• 180 acres of container/cargo storage yard*• An intermodal rail yard• Over 400 acres for on-site distribution and
warehouse centers
*The project proposed for PAAF funding contributes to this 180 acres.
The proposed 15-acre cargo laydown area compliments and expands the La Quinta Trade Gateway Terminal Project, a major component of the Port of Corpus Christi Authority’s long term development plan.
The proposed cargo laydown area will provide additional wharf capacity to support the oil and gas industry (steel pipe and frac sand) and break-bulk, military, and project cargo.
The project includes a concrete pavement yard and access road with a stormwater system, water and sanitary lines, electrical services and security lighting system.
Need for PAAF Funding To meet rapidly growing oil and gas-related cargo needs in the region, the Port of Corpus Christi must concurrently finance multiple capital projects worth several million dollars. The Port is currently relying on internal revenue to fund the $68 million La Quinta Gateway Terminal Project. Because of this, the port is spending more money than its annual net income on developing this capital infrastructure.
Port tenants are currently unwilling to contribute funding to develop much-needed port facilities. PAAF funding would allow the port to deliver the proposed 15-acre cargo laydown area, thereby advancing additional priority projects within the long-term strategic plan and to meet growing cargo demands.
Point-of-contact: John LaRue, Executive Director
361-882-5633
Project Benefits: The project is expected to generate the following benefits:• The $10 million construction impact creates approximately
82,000 person-hours of economic benefit. Approximately 80,577 induced person-hours are created as a result of the local purchases of the individuals directly generated by the construction activity. An additional 93,097 indirect person-hours are supported by $4.2 million of purchases in the local and regional economy.
• TPCO and Voestalpine Texas LLC have stated their respective intentions to use the La Quinta terminal and cargo laydown areas.
• It is anticipated that the proposed project would attract new customers in the wind energy, oil and gas drilling, and containerized cargo industries.
• Long-term environmental benefits resulting from required mitigation include the creation of over 25 acres of seagrass, marsh, and shallow water habitat. 2986
893
202
35
SHERWINALUMINACOMPANY
ALCOA
GREGORYPOWER
Union Pacific Gregory Rail Yard
Martin MariettaMaterials
PORTLAND
GREGORY
Gulf CompressCotton Storage
OxyChemProperty
San PatricioTurning
Basin
La QuintaTurning
Basin
TPCO America Pipe Mill
Cheniere LNGExport Terminal
Site
AEPSubstation
Site
Leased byvoestalpinefor Future
Development
La Quinta Terminal Road
(Existing)
La Quinta Channel -45’ MLT
InitialPhase
RailProject
Initial Phase1000’ General
Cargo DockUnder Design
voestalpineDock
Under Construction
voestalpineTexas
HBI PlantUnder Construction
ProposedUS 181Grade
Separation
15-Acre Cargo Storage Yard Expansion,
Utilities & SecurityImprovements
Access RoadExtension
InitialPhaseCargoYard
ProposedExpansion
Shallow Water HabitatCorpus Christi Bay
SCALE IN FEET
0 1000 2000 3000 4000
Bene�cial Use Site No. 6
Gulfof
Mexico
Corpus Christi Bay
Nueces Bay Red�shBay
286
TEXAS
361
TEXAS
35
181
181
CORPUSCHRISTI
ROCKPORT
PORTARANSAS
INGLESIDE
PORTLAND
SINTON
Corpus Christi Ship Channel
La QuintaShip Channel
Depth: -45’
ARANSASPASS
GREGORY
TAFT
SCALE IN MILES
0 21 3 4
Corpus ChristiInner Harbor
ProjectSite
La QuintaGatewayTerminal
Port of Corpus Christi Authority
LA QUINTA GATEWAY TERMINAL
July 14, 2014Don Rodman - TRC
Sheet 1
GENERAL CARGO YARD EXPANSION, ACCESS ROAD, UTILITIES & SECURITY IMPROVEMENTS
Economic Impacts Generated by Construction ActivityTOTAL CONSTRUCTION VALUE $10,000,000
JOBS
Direct (person-hours) 82,000
Induced 80,577
Indirect 93,097
PERSONAL INCOME
Direct $1,492,400
Re-spending/Local Consumption $4,298,261
Indirect $2,248,510
TOTAL $8,039,171
LOCAL PURCHASES $4,243,632
STATE AND LOCAL TAXES $635,095
TOTAL ECONOMIC BENEFIT $12,917,898
Port ReadinessThis project is a viable candidate for PAAF funding. The Port has received all necessary environmental clearances and has completed a cost-benefit analysis and preliminary engineering report. It is anticipated that this project could be completed in 12 to 14 months.
For more detailed information about the proposed project, please reference Appendix A.
PORT OF CORPUS CHRISTI15-acre Cargo Storage Yard Expansion, La Quinta Gateway Terminal
Project Cost: $10,000,000 Port Match: $5,000,000 PAAF Request: $5,000,000

TEXAS PORTS 2015 – 2016 CAPITAL PROGRAM Page 17
Port Authority Advisory CommitteePort Authority Advisory Committee
Page 16 TEXAS PORTS 2015 – 2016 CAPITAL PROGRAM
The Proposed Project: Expansion of Cruise Terminal 2 by 60,000 square feet
What does the growth of the Galveston cruise business deliver for the region and Texas?According to industry data, the Port of Galveston is the busiest cruise terminal in the State of Texas and the fifth-ranked in the U.S., with slightly over one million “revenue passengers” annually. In 2013, the Port of Galveston reported over $12.3 million dollars in cruise revenue. PAAF funding would enable the Port to remain one of the top tourist destinations in Texas.
Project features include:• Accommodation of ships with over
3,600 passengers, yielding substantial growth.• Larger passenger check-in and waiting areas• Escalators and elevators• Improved circulation for passenger flow• Increased square footage for baggage lay down and
security screening areas
The Port of Galveston proposes to expand Cruise Terminal 2 by 60,000 square feet to accommodate larger home port cruise ships. The proposed project supports a capacity expansion requested by Port customers: Carnival, Royal Caribbean, and Disney. This expansion is a necessary step in maintaining a competitive advantage in the national cruise industry.
This expansion project is a two-story, 60,000-square-foot addition to Cruise Terminal 2. The new addition will be used primarily for passenger embarkation and will include a screening area, a check-in area, and a seating area. The existing terminal facilities will be renovated to increase accommodations for passenger disembarkation services, including baggage lay-down and Customs/Border Patrol. It will also increase the size of the baggage screening area. Cruise Terminal 2 is currently 90,000 square feet and the addition will bring the total area to approximately 150,000 square feet.
Need for PAAF Funding The Port has strong letters of commitment from its three cruise line customers for increased cruise business. It must fund this capital expansion to meet those requirements. Without PAAF funding, the Port will have to secure loans and bonds. New loans and bonds may overextend the Port’s bonding capacity, and it may exceed the state permitted debt-to-revenue ratio. PAAF funding would enable the expansion and increase long-term obligations by only $6.5 million, instead of $13 million without state assistance.
Point-of-contact: Peter Simons, Deputy Director
409-766-6122
Project Benefits: The project is expected to generate the following benefits:• Expanding Cruise Terminal 2 to satisfy Carnival, Royal
Caribbean, and Disney future needs would bring an additional 280,000 passengers annually through the Port of Galveston.
• The $13 million construction impact would create approximately 107,010 person-hours of economic benefit. Approximately 105,153 induced person-hours would be created as a result of local purchases made by individuals whose presence is directly generated by the construction activity. An additional 135,794 indirect person-hours would be supported by $5.9 million of purchases in the local and regional economy.
• The Port estimates that the expansion of Cruise Terminal 2 would create a total of 960 long-term seaport and airport jobs. Additionally, the project would create 205 visitor industry jobs. Businesses providing services at the cruise terminal could receive nearly $184.5 million of annual revenue.
• The expansion of Cruise Terminal 2 is a high-profile project for the State of Texas because Galveston is the fifth busiest cruise homeport in the USA and brings substantial revenue to the area.
• The Royal Caribbean Freedom Class ship, “Liberty”, is a modern, luxury seven-day cruise ship that would attract passengers to Galveston from throughout North America and internationally.
Economic Impacts Generated by Construction ActivityTOTAL CONSTRUCTION VALUE $13,050,000
JOBS
Direct (person-hours) 107,010
Induced 105,153
Indirect 135,794
PERSONAL INCOME
Direct $1,947,582
Re-spending/Local Consumption $5,609,231
Indirect $3,137,318
TOTAL $10,694,131
LOCAL PURCHASES $5,941,583
STATE AND LOCAL TAXES $844,836
TOTAL ECONOMIC BENEFIT $17,480,550
Port ReadinessThis project is a viable candidate for PAAF funding as the Port has a conceptual design, short-listed Design/Build teams, and has appointed AECOM as an independent reviewer to oversee both the design-build process and the procurement phase (to be completed by Oct. 1, 2014). Permits are readily available. It is projected by the Port that the project will be completed in approximately 12 months.
For more detailed information about the proposed project, please reference Appendix A.
PORT OF GALVESTONCruise Terminal 2 Expansion
Project Cost: $13,050,000 Port Match: $6,525,000 PAAF Request: $6,525,000

TEXAS PORTS 2015 – 2016 CAPITAL PROGRAM Page 19
Port Authority Advisory CommitteePort Authority Advisory Committee
Page 18 TEXAS PORTS 2015 – 2016 CAPITAL PROGRAM
The Proposed Project: Construction of 9,600 linear feet of new rail track to provide access to the proposed Bayport Terminal Intermodal Yard
Why is rail access needed at the Bayport Container Terminal Complex? The Bayport Terminal Complex is the Port of Houston’s most modern container gateway. The terminal was master-planned to allow growth in rail cargo along with growth in international trade, including from the expanded Panama Canal. Development of the rail yard reduces truck traffic. As cargo volumes increase to a level that can support a regular mainline service, the Port intends to fully develop rail at the facility. General cargo and warehouse users along the proposed rail spur would be the initial rail customers. International shipping containers would follow as volumes grow.
The proposed rail facility initiates development of rail-dependent facilities near the Bayport Container Terminal. The Port is currently in discussions with potential tenants with urgent, rail-dependent business opportunities. One of these tenants expects to generate new container volumes for the Bayport Terminal.
The proposed project includes 1,200 linear feet of sound wall and three at-grade signalized crossings to ensure public safety. The route extends from the Union Pacific Rail Road track at Red Bluff Road to the south end of the planned Bayport Intermodal Yard.
Need for PAAF Funding PAAF funding would assist the Port of Houston in financing multiple capital projects simultaneously. Currently, the Port has a large backlog of capital projects, worth billions of dollars, waiting for financing and execution. According to the Port, there is no other source of funding currently allocated for this proposed project. PAAF funding would enable the Port to accelerate completion of the Bayport rail spur project, attract new tenants, and promote container cargo growth in Houston.
Without outside funding, the Port would develop the project at a much later date, postponing or impairing the Port’s opportunities to bring new business to the area.
Point-of-contact: Charlie Jenkins, Vice President
of Strategic Planning,
Project Benefits: The project is expected to generate the following benefits:• The $12.95 million construction impact would create
approximately 106,190 person-hours of economic benefit. Approximately 135,801 induced person-hours would be created as a result of local purchases made by individuals whose presence is directly generated by the construction activity. An additional 96,728 indirect person-hours would be supported by $4.4 million of purchases in the local and regional economy.
• The project-related operating benefit is projected to result in $9.7 million in annual direct business revenue, and 164 direct, indirect, and induced jobs.
• The project will help secure up to three new confidential tenant opportunities and approximately 20,000 new TEU of cargo for Bayport Terminal.
• The project will enable the Port to market properties to tenants in the area requiring rail.
• The project will reduce truck traffic on the local roadway network as cargo is shifted to rail.
• The project would accelerate the warehouse development portion of the Bayport Terminal.
Economic Impacts Generated by Construction ActivityTOTAL CONSTRUCTION VALUE $12,950,000
JOBS
Direct (person-hours) 106,190
Induced 135,801
Indirect 96,728
PERSONAL INCOME
Direct $2,776,019
Re-spending/Local Consumption $8,172,045
Indirect $1,954,905
TOTAL $12,902,969
LOCAL PURCHASES $4,412,546
STATE AND LOCAL TAXES $1,019,335
TOTAL ECONOMIC BENEFIT $18,334,850
Port ReadinessThis project is a viable candidate for PAAF funding. The Port has full environmental clearances and has completed preliminary design documents with an associated cost estimate. It is anticipated that this project could be completed in 12 to 18 months. A service agreement with a mainline railroad is in place, and the Port is in discussions with tenants to use the facility. The adjacent City of Seabrook supports the development of rail in the proposed location.
For more detailed information about the proposed project, please reference
Appendix A.
PORT OF HOUSTON AUTHORITYBayport Rail Spur
Project Cost: $12,950,000 Port Match: $6,475,000 PAAF Request: $6,475,000

TEXAS PORTS 2015 – 2016 CAPITAL PROGRAM Page 21
Port Authority Advisory CommitteePort Authority Advisory Committee
Page 20 TEXAS PORTS 2015 – 2016 CAPITAL PROGRAM
The Proposed Project: Dredge the existing channel from the Gulf of Mexico to the inner harbor basin to a minimum depth of 12 feet
What are necessary depths for recreational and commercial vessels?While Port Mansfield is authorized to a depth of 16 feet, only a 12-foot depth is proposed at this time. A 12-foot depth allows for lightly loaded barges, similar to those that use the Gulf Intracoastal Waterway (GIWW). A 16-foot depth would accomodate heavier barges, but at a prohibitive dredging cost. Ships require substantially greater depths than barges.
Port Mansfield is in dire need of outside funding to revive its operations. Due to the lack of maintenance dredging and concurrent heavy siltation, a 9.9-mile portion of the existing navigation channel has shoaled to less than 5 feet of depth and requires maintenance dredging to maintain operability. The minimum proposed depth is 12 feet to enable commercial sport fishing and sailboat access.
In 2011, the U.S. Army Corps of Engineers discontinued maintenance of this channel because Port Mansfield was designated as a recreational, rather than a commercial port. As one of the top ten fishing ports in the U.S., commercial sport fishing is the major economic driver for Port Mansfield and Willacy County.
At its current shallow depth, Port Mansfield is losing clients and tax revenue due to its inaccessibility. From 2009 to 2014, Port Mansfield reported a 65 percent loss in annual revenue. This loss is especially damaging because this Port is one of the few contributors to Willacy County’s local economy.
SmallRecreationalVessel Only
CurrentDepth
4 ft
12 ft
16 ft20 ft
Proposed Depth(and GIWW Depth)
Initial DepthRequest
Full RecreationalVessel Access
Light LoadedBarge Access
Fully LoadedBarge Access
Point-of-contact: Ronald Mills, Port Director
956-689-3332
Need for PAAF Funding As one of the top fishing locations in the United States, Port Mansfield has the potential to contribute to the Willacy County economy through tourism and recreational fishing. However, without PAAF funding to maintain its navigational channel, shoaling will continue and the channel may become unusable. It is important to note that competitive ports obtain federal funding for dredging, and Port Mansfield is disadvantaged without PAAF funding for its dredging.
Project Benefits: The project is expected to generate the following benefits:• The proposed dredging project would prevent this channel
from completely shoaling in, resulting in corresponding positive impacts to the residents in this county and the state overall.
• The $8 million construction impact creates approximately 173,112 person-hours of economic benefit. Approximately 170,108 induced person-hours are created as a result of the local purchases of the individuals directly generated by the dredging activity. An additional 93,680 indirect person-hours are supported by $4.2 million of purchases in the local and regional economy.
Economic Impacts Generated by Construction ActivityTOTAL CONSTRUCTION VALUE $8,000,000
JOBS
Direct (person-hours) 173,112
Induced 170,108
Indirect 93,680
PERSONAL INCOME
Direct $3,150,646
Re-spending/Local Consumption $9,074,176
Indirect $2,271,954
TOTAL $14,496,776
LOCAL PURCHASES $4,214,972
STATE AND LOCAL TAXES $1,145,245
TOTAL ECONOMIC BENEFIT $19,856,993
Port ReadinessThe U.S. Army Corps of Engineers prepared draft dredging plans and technical specifications to assist Port Mansfield in pursuit of a private contract to restore the channel linking port facilities to the Gulf Intracoastal Waterway. Once funds are secured, it is projected that this project could be implemented in 12 to 18 months.
?For more detailed information about the proposed project, please reference Appendix A.
PORT MANSFIELDDredging of the Port Mansfield Channel
Project Cost: $8,000,000 Port Match: $2,000,000 PAAF Request: $6,000,000
Did you know?Willacy County represents one of the lowest income
counties in the nation, according the 2010
U.S. Census.
TEXAS PORTS 2015 – 2016 CAPITAL PROGRAM Page 23
Port Authority Advisory CommitteePort Authority Advisory Committee
Page 22 TEXAS PORTS 2015 – 2016 CAPITAL PROGRAM
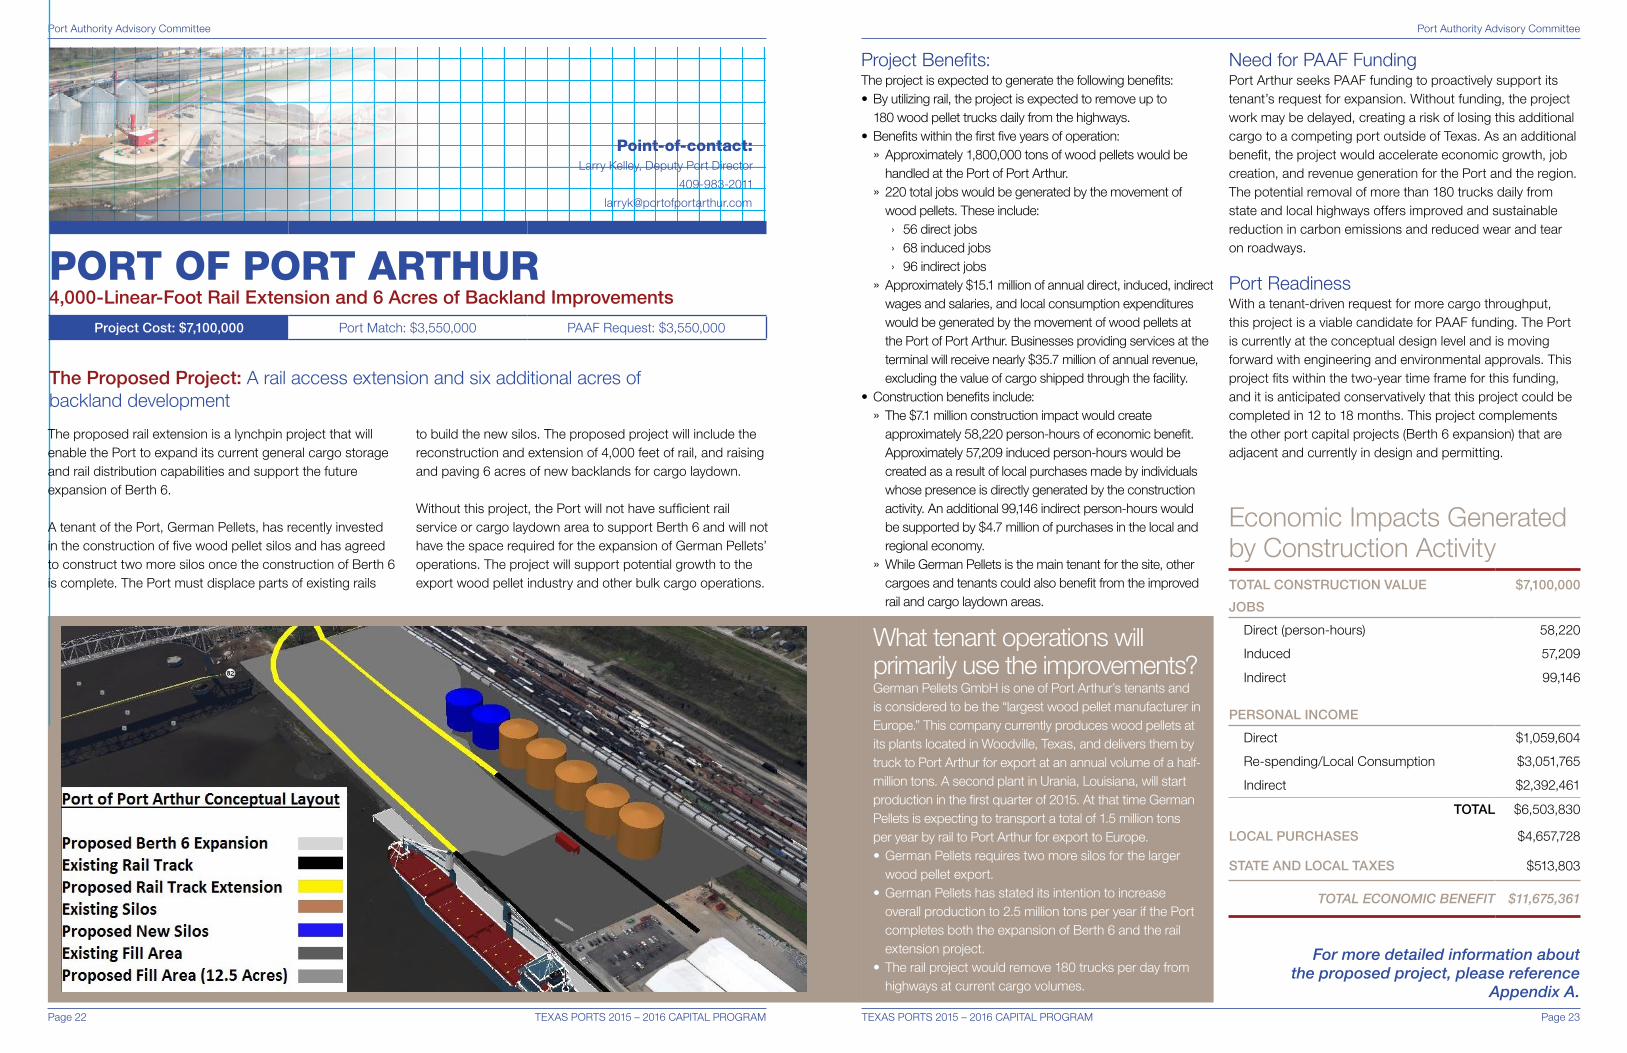
The Proposed Project: A rail access extension and six additional acres of backland development
The proposed rail extension is a lynchpin project that will enable the Port to expand its current general cargo storage and rail distribution capabilities and support the future expansion of Berth 6.
A tenant of the Port, German Pellets, has recently invested in the construction of five wood pellet silos and has agreed to construct two more silos once the construction of Berth 6 is complete. The Port must displace parts of existing rails
to build the new silos. The proposed project will include the reconstruction and extension of 4,000 feet of rail, and raising and paving 6 acres of new backlands for cargo laydown.
Without this project, the Port will not have sufficient rail service or cargo laydown area to support Berth 6 and will not have the space required for the expansion of German Pellets’ operations. The project will support potential growth to the export wood pellet industry and other bulk cargo operations.
Point-of-contact: Larry Kelley, Deputy Port Director
409-983-2011
What tenant operations will primarily use the improvements?German Pellets GmbH is one of Port Arthur’s tenants and is considered to be the “largest wood pellet manufacturer in Europe.” This company currently produces wood pellets at its plants located in Woodville, Texas, and delivers them by truck to Port Arthur for export at an annual volume of a half-million tons. A second plant in Urania, Louisiana, will start production in the first quarter of 2015. At that time German Pellets is expecting to transport a total of 1.5 million tons per year by rail to Port Arthur for export to Europe. • German Pellets requires two more silos for the larger
wood pellet export. • German Pellets has stated its intention to increase
overall production to 2.5 million tons per year if the Port completes both the expansion of Berth 6 and the rail extension project.
• The rail project would remove 180 trucks per day from highways at current cargo volumes.
Need for PAAF Funding Port Arthur seeks PAAF funding to proactively support its tenant’s request for expansion. Without funding, the project work may be delayed, creating a risk of losing this additional cargo to a competing port outside of Texas. As an additional benefit, the project would accelerate economic growth, job creation, and revenue generation for the Port and the region. The potential removal of more than 180 trucks daily from state and local highways offers improved and sustainable reduction in carbon emissions and reduced wear and tear on roadways.
Project Benefits: The project is expected to generate the following benefits:• By utilizing rail, the project is expected to remove up to
180 wood pellet trucks daily from the highways.• Benefits within the first five years of operation:
» Approximately 1,800,000 tons of wood pellets would be handled at the Port of Port Arthur.
» 220 total jobs would be generated by the movement of wood pellets. These include:
› 56 direct jobs › 68 induced jobs › 96 indirect jobs
» Approximately $15.1 million of annual direct, induced, indirect wages and salaries, and local consumption expenditures would be generated by the movement of wood pellets at the Port of Port Arthur. Businesses providing services at the terminal will receive nearly $35.7 million of annual revenue, excluding the value of cargo shipped through the facility.
• Construction benefits include: » The $7.1 million construction impact would create approximately 58,220 person-hours of economic benefit. Approximately 57,209 induced person-hours would be created as a result of local purchases made by individuals whose presence is directly generated by the construction activity. An additional 99,146 indirect person-hours would be supported by $4.7 million of purchases in the local and regional economy.
» While German Pellets is the main tenant for the site, other cargoes and tenants could also benefit from the improved rail and cargo laydown areas.
Economic Impacts Generated by Construction ActivityTOTAL CONSTRUCTION VALUE $7,100,000
JOBS
Direct (person-hours) 58,220
Induced 57,209
Indirect 99,146
PERSONAL INCOME
Direct $1,059,604
Re-spending/Local Consumption $3,051,765
Indirect $2,392,461
TOTAL $6,503,830
LOCAL PURCHASES $4,657,728
STATE AND LOCAL TAXES $513,803
TOTAL ECONOMIC BENEFIT $11,675,361
Port ReadinessWith a tenant-driven request for more cargo throughput, this project is a viable candidate for PAAF funding. The Port is currently at the conceptual design level and is moving forward with engineering and environmental approvals. This project fits within the two-year time frame for this funding, and it is anticipated conservatively that this project could be completed in 12 to 18 months. This project complements the other port capital projects (Berth 6 expansion) that are adjacent and currently in design and permitting.
For more detailed information about the proposed project, please reference
Appendix A.
PORT OF PORT ARTHUR4,000-Linear-Foot Rail Extension and 6 Acres of Backland Improvements
Project Cost: $7,100,000 Port Match: $3,550,000 PAAF Request: $3,550,000

TEXAS PORTS 2015 – 2016 CAPITAL PROGRAM Page 25
Port Authority Advisory CommitteePort Authority Advisory Committee
Page 24 TEXAS PORTS 2015 – 2016 CAPITAL PROGRAM
The Proposed Project: A 620 linear-foot bulkhead replacement and improvements project at the 12th Street Dock for docking and operations of the shrimp fleet
What is the business of Port of Palacios? The Port of Palacios is located in Matagorda County (population 36,592) and in the town of Palacios (population 4,700). The Port hosts major job generators for the area including:
• It is the “shrimp capital of Texas” due to its production of shrimp.
• It is homeport for 125 shrimp boats that provide approximately 300-350 jobs.
• It is the home of Palacios Marine, which manufactures cargo barge hulls like those used in the transport of crude oil on shallow draft canals and the GIWW and provides about 70-80 jobs.
• It has the Lagasse Marine ship yard with two haul-out railways for working on small craft such as shrimp boats and TxDOT ferries.
• It also operates a marina for recreational small craft and derives a percentage of its revenues from those slip rentals.
The Port of Palacios proposes to replace and improve a bulkhead that is currently in a state of disrepair and failing. The preferred design will square off the bulkhead to create more linear feet of berth and will increase backlands capacity to support additional vessel operations.
These improvements are important to support the local shrimp industry, which is vital to this small community. According to the Port Director, larger “gulf boats” of about 100 feet length overall are replacing the smaller “bay boats” in the region. Improvements to the dock would allow the Port to expand its shrimping business and accommodate larger boats. Analyses show that the proposed project would help the Port to grow both its existing businesses and maintain its status as one of the main economic drivers in the community.
Need for PAAF Funding Without PAAF funding, it is unlikely that the project will be implemented in the near-term. The Port relies on tax revenues to fund its operations, and, through good stewardship of these funds, the Port can provide matching funds. The Port requests a 75 percent PAAF to 25 percent Port matching formula due to its “small port” designation.
Point-of-contact: Debbie Morris, Port Director
361-972-5556
Project Benefits: The project is expected to generate the following benefits:• The Port will risk losing 620 linear feet of docks if the
bulkheads are not replaced. The loss could decrease the Port’s annual shrimp production by approximately 780,000 pounds.
• The $2.6 million construction impact would create approximately 21,320 person-hours of economic benefit. Approximately 20,950 induced person-hours would be created as a result of local purchases made by individuals whose presence is directly generated by the construction activity. An additional 21,236 indirect person-hours would be supported by $0.7 million of purchases in the local and regional economy.
• Two additional large shrimp boats could utilize the improved bulkhead.
• Eight total jobs would be generated by the additional shrimp boats at the Port of Palacios.
• Approximately $322,000 of direct wages and salaries would be generated by the direct jobs from shrimp boats at the Port of Palacios. Businesses providing services would receive nearly $3.7 million in annual revenue, excluding the value of the landings.
Economic Impacts Generated by Construction ActivityTOTAL CONSTRUCTION VALUE $2,600,000
JOBS
Direct (person-hours) 21,320
Induced 20,950
Indirect 21,236
PERSONAL INCOME
Direct $388,024
Re-spending/Local Consumption $1,117,548
Indirect $489,409
TOTAL $1,994,981
LOCAL PURCHASES $742,366
STATE AND LOCAL TAXES $157,604
TOTAL ECONOMIC BENEFIT $2,894,951
Port ReadinessThe Port has procured engineering services and has extensive experience constructing similar bulkhead replacement projects. Careful planning and utilization of the most expeditious permitting scenario will enable this project to meet the funding timelines associated with the Texas Ports 2015-2016 Capital Program. Once properly resourced, this project could be completed in 12 to 14 months.
For more detailed information about the proposed project, please reference Appendix A.
PORT OF PALACIOSBulkhead Improvements – 12th Street Shrimp Docks
Project Cost: $2,600,000 Port Match: $650,000 PAAF Request: $1,950,000

TEXAS PORTS 2015 – 2016 CAPITAL PROGRAM Page 27
Port Authority Advisory CommitteePort Authority Advisory Committee
Page 26 TEXAS PORTS 2015 – 2016 CAPITAL PROGRAM
The Proposed Project: Barge dock with eight berths for oil loading and general cargo capabilities
Fast facts • Eagle Ford Shale oil production is expected to
be over 2 million barrels per day in 2020, then decreasing over time to 1 million barrels per day in 2040.
• The Port of Victoria is the closest port to the Eagle Ford shale production area – 30 miles away.
• The first Eagle Ford Shale oil moved through the Port of Victoria in August 2010.
• The Port is currently moving 2.5 million barrels of oil per month on its docks and anticipates this volume will increase to 3.66 million barrels by the end of 2014.
• The barge transport is working 24/7 to maintain throughput and the canal has a 12-foot depth.
• There is public and private development at Victoria, including a P3 barge fleeting area that opened in late July 2014.
• One current Victoria customer says that it has an additional 300,000 barrels per day to move.
• Other chemical products (C-12) are also manufactured and shipped out of the Port.
The Port of Victoria requests funding for a new multi-purpose barge dock to be used primarily for growing crude oil cargo exports. Export growth stems from the Eagle Ford Shale development and from general import cargoes, including frac sand and construction materials.
The eight-berth barge dock will be used to meet demand for Eagle Ford Shale oil transportation, which has had a documented 300 percent growth rate at the Port of Victoria since 2011. Crude oil is transported from the Eagle Ford area to the Port by truck, rail, and pipeline. It is stored and then loaded onto barges. Barges move south down the Victoria Canal and then east and west on the Gulf Intracoastal Waterway (GIWW) to refineries in the Houston and Corpus Christi areas. The Port has expanded its capacity, but the growing cargo volume has challenged facilities and staff. While petroleum prices fluctuate regularly, our crude oil boom is expected to continue to be strong until 2040. The estimated project construction cost is $7.5 million.
Need for PAAF Funding Without PAAF funding, it is unlikely that this project will be implemented in the near-term. The Port relies on tax revenues to help fund its operations and, through good stewardship of these funds, the Port can provide matching funds. The Port requests a 75 percent PAAF to 25 percent Port matching formula due to its “small port” designation.
Point-of-contact: Jennifer Stastny, Director of Operations
361-570-8855
Project Benefits: The project is expected to generate the following benefits:• Approximately 317 total jobs are anticipated to be
generated by the movement of additional crude oil and frac sand at the Port of Victoria. These include: » 113 direct jobs » 129 induced jobs » 75 indirect jobs
• The additional movement of frac sand and crude oil at the Port of Victoria would generate $23.2 million of annual direct, induced, indirect wages and salaries, and local consumption expenditures. Businesses providing services at the barge facility would receive nearly $99.3 million of annual revenue, excluding the value of cargo shipped through it.
• The $7.5 million construction impact could create approximately 61,500 person-hours of economic benefit. Approximately 60,433 induced person-hours could be created as a result of the local purchases made by individuals whose presence is directly generated by the dredging activity. An additional 40,733 indirect person-hours would be supported by $1.7 million in purchases in the local and regional economy.
• Several oil production and transport firms have stated their respective intentions to use the new barge docks and facilities.
• It is anticipated that the proposed project would attract new volumes of oil and dry bulk cargoes.
• The project could meet the increasing customer demand for crude oil, one of the biggest energy businesses in the country.
Economic Impacts Generated by Construction ActivityTOTAL CONSTRUCTION VALUE $7,500,000
JOBS
Direct (person-hours) 61,500
Induced 60,433
Indirect 40,733
PERSONAL INCOME
Direct $1,119,300
Re-spending/Local Consumption $3,223,696
Indirect $973,276
TOTAL $5,316,272
LOCAL PURCHASES $1,660,084
STATE AND LOCAL TAXES $419,986
TOTAL ECONOMIC BENEFIT $7,396,342
Port ReadinessWith dramatic customer demand, this project is a viable candidate for PAAF funding. The port has hired an engineer and is currently working on the required permits. Planning and preliminary engineering drawings have been completed. It is anticipated that this project could be completed in 18 to 24 months.
For more detailed information about the proposed project, please reference Appendix A.
PORT OF VICTORIAEight-Berth Barge Dock
Project Cost: $7,500,000 Port Match: $1,875,000 PAAF Request: $5,625,000

TEXAS PORTS 2015 – 2016 CAPITAL PROGRAM Page 29
Port Authority Advisory CommitteePort Authority Advisory Committee
Page 28 TEXAS PORTS 2015 – 2016 CAPITAL PROGRAM
Summary of Port Projects Port Project Description
Estimated Project Cost Port Match
PAAF Request
Engineering Status
Environmental Permit Status
Beaumont Construct an overpass to by-pass rail lines and improve access to the port
$10.0 million $5.0 million $5.0 million Preliminary Complete
Brownsville Construct a new liquid bulk terminal – Oil Dock 6
$22.0 million $11.0 million $11.0 million Complete Complete
Corpus Christi Construct a 15-acre expansion of the La Quinta Terminal general cargo yard
$12.0 million $6.0 million $6.0 million Preliminary Complete
Galveston Construct a 60,000-square-foot building expansion for Cruise Terminal 2
$13.1 million $6.55 million $6.55 million Preliminary Complete
Houston Construct a new rail spur with a sound barrier for the Bayport Terminal
$13.0 million $6.5 million $6.5 million In design Complete
Port Mansfield Maintenance dredging to 12 feet for an existing channel to enable vessel access
$8.0 million $2.0 million $6.0 million Preliminary Preliminary
Port Arthur Construct a new rail spur and cargo laydown yard
$7.1 million $3.55 million $3.55 million Preliminary Complete
Palacios Modernize 650 feet of wharf in Turning Basin No. 1
$2.7 million $0.67 million $2.02 million Preliminary Preliminary
Victoria Construct a new liquid bulk barge terminal
$7.5 million $1.87 million $5.62 million Preliminary Preliminary
TOTAL $95.3 million $43.14 million $52.24 million
CLOSING STATEMENTOn behalf of the PAAC, I would like to sincerely thank you for your
consideration of the 2015-2016 Capital Program.
Together, we are making history. Four factors, including state-wide shale plays, neighboring Mexico’s economic growth, opportunity brought with the Panama Canal Expansion, and the advancement of shipping lanes contribute to an urgent need to consider – as a state – our entire mobility system, and especially our ports.
The proposed projects included in the 2015-2016 Capital Program are viable state assets that would fuel our state’s economy, improve port access, and enhance intermodal transportation opportunities.
Thank you for your interest, leadership, and advocacy for our state’s ports. Texas ports are the gateways to our collective future.
John LaRueChairman,
Port AuthorityAdvisory Committee


For More Information:Dan Harmon
Director – Maritime Division
Texas Department of Transportation
512-486-5134

TEXAS PORTS 2015 – 2016 CAPITAL PROGRAM
APPENDIX A:TECHNICAL APPENDIX

TEXAS PORTS 2015 – 2016 CAPITAL PROGRAM TECHNICAL APPENDIX
PAGE i
Table of Contents
Methodology ................................................................................ 1
Methodology for Economics Review .................................................................................................... 1 Standard Argument Names and Definitions ......................................................................................... 2 Economic Impacts of Each Project ....................................................................................................... 2
Methodology for Environmental Review .............................................................................................. 3 Methodology for Engineer Review ........................................................................................................ 3
Summary of Proposed Projects ................................................. 4
Individual Project Evaluations ................................................... 9
Port of Beaumont .................................................................................................................................... 9 Economics Review ................................................................................................................................ 9 Environmental Review ........................................................................................................................ 13 Engineer Review ................................................................................................................................. 14
Port of Brownsville................................................................................................................................ 19 Economics Review .............................................................................................................................. 19 Environmental Review ........................................................................................................................ 26 Engineer Review ................................................................................................................................. 27
Port of Corpus Christi ........................................................................................................................... 30 Economics Review .............................................................................................................................. 30 Environmental Review ........................................................................................................................ 35 Engineer Review ................................................................................................................................. 36
Port of Galveston .................................................................................................................................. 41 Economics Review .............................................................................................................................. 41 Environmental Review ........................................................................................................................ 50 Engineer Review ................................................................................................................................. 51
Port of Houston ..................................................................................................................................... 53 Economics Review .............................................................................................................................. 53 Environmental Review ........................................................................................................................ 59 Engineer Review ................................................................................................................................. 60
Port Mansfield ........................................................................................................................................ 63 Economics Review .............................................................................................................................. 63 Environmental Review ........................................................................................................................ 68 Engineer Review ................................................................................................................................. 69
Port of Palacios ..................................................................................................................................... 74 Economics Review .............................................................................................................................. 74 Environmental Review ........................................................................................................................ 81 Engineer Review ................................................................................................................................. 82
Port of Port Arthur................................................................................................................................. 85 Economics Review .............................................................................................................................. 85 Environmental Review ........................................................................................................................ 91 Engineer Review ................................................................................................................................. 92
Port of Victoria ....................................................................................................................................... 94 Economics Review .............................................................................................................................. 94

TEXAS PORTS 2015 – 2016 CAPITAL PROGRAM TECHNICAL APPENDIX
PAGE ii
Environmental Review ...................................................................................................................... 105 Engineer Review ............................................................................................................................... 106
References ............................................................................... 111
List of Tables Table 1: Summary of Port Projects ............................................................................................................... 4 Table 2: Economic Impacts Generated by Construction Activity ................................................................ 12 Table 3: Specifications of Current Oil Docks at the Port of Brownsville ..................................................... 21 Table 4: Summary of the Economic Impacts Generated by Port of Brownsville - Oil Dock 6 .................... 23 Table 5: Economic Impacts Generated by Construction Activity ................................................................ 25 Table 6: Project Cost Estimate ................................................................................................................... 29 Table 7: Economic Impacts Generated by Construction Activity ................................................................ 34 Table 8: Direct Long-Term Job Impact at the Port of Galveston ................................................................ 44 Table 9: Government Tax Revenue Increases as Visitor Spending in Galveston Grows .......................... 45 Table 10: Summary of the Economic Impacts Generated by Port of Galveston ........................................ 48 Table 11: Economic Impacts Generated by Construction Activity .............................................................. 49 Table 12: Summary of Port-provided Cost Estimate .................................................................................. 52 Table 13: Cost of Representative Cruise Terminal Building Projects ......................................................... 52 Table 14: Summary of the Economic Impacts Generated by Port of Houston ........................................... 57 Table 15: Economic Impacts Generated by Construction Activity .............................................................. 58 Table 16: Probable Cost ............................................................................................................................. 62 Table 17: Estimated Revenue Lost Due to Shoaling at the Port Mansfield ................................................ 65 Table 18: Economic Impacts Generated by Construction Activity .............................................................. 68 Table 19: Current Water Depths Along Port Mansfield Channel (excerpt from NOAA Navigation Chart 11306) ......................................................................................................................................................... 71 Table 20: Estimated Dredge Quantities, Costs, and Schedules for Alternative-1 (dredging Port Mansfield to the GIWW) .............................................................................................................................................. 73 Table 21: Estimated Dredge Quantities, Costs, and Schedules for Alternative-2 (dredging Port Mansfield to the Gulf Coast) ........................................................................................................................................ 73 Table 22: Summary of the Economic Impacts Generated by Port of Palacios. .......................................... 79 Table 23: Economic Impacts Generated by Construction Activity .............................................................. 80 Table 24: Construction Cost Estimate ........................................................................................................ 84 Table 25: Port of Palacios Conceptual Opinion of Probable Cost .............................................................. 84 Table 26: Summary of the Economic Impacts Generated by Port of Port Arthur ....................................... 89 Table 27: Economic Impacts Generated by Construction Activity .............................................................. 90 Table 28: Summary of the Economic Impacts Generated by Port of Victoria .......................................... 103 Table 29: Economic Impacts Generated by Construction Activity ............................................................ 104
List of Figures Figure 1: Contract Value of Construction Projects ........................................................................................ 5 Figure 2: Summary of Expected Construction-related Job Impacts by Port ................................................. 6 Figure 3: Summary of Construction-related State and Local Tax Impacts by Port ....................................... 7 Figure 4: Jobs Created Post-Construction through Operation of Facilities .................................................. 8

TEXAS PORTS 2015 – 2016 CAPITAL PROGRAM TECHNICAL APPENDIX
PAGE iii
Figure 5: Conceptual View of Proposed Bridge, Looking towards the Main Port Area .............................. 10 Figure 6: Port of Beaumont Access Map .................................................................................................... 10 Figure 7: View of At-grade Crossing when Blocked by a Grain Train......................................................... 11 Figure 9: Enlarged Plan View, Proposed Oil Dock ..................................................................................... 19 Figure 8: Project Location ........................................................................................................................... 19 Figure 10: Average Overall Increasing Length of Tanker Vessels at the Port of Brownsville .................... 21 Figure 11: Cargo Projection with and without Dock 6 (2009 Tiger Grant Application) ............................... 22 Figure 12: Typical Cross Section for the Loading Platform ........................................................................ 28 Figure 13: Exact Backland Project Location Highlighted in Yellow............................................................. 30 Figure 14: Excerpt from La Quinta Tiger Grant, Long term Outcomes Section .......................................... 31 Figure 15: Excerpt from La Quinta Tiger Grant Identifying Expected Project Benefits .............................. 32 Figure 16: Capital Expenditure of the Port of Corpus Christi Is Projected to Exceed Its Annual Net Income .................................................................................................................................................................... 32 Figure 17: Project Location ......................................................................................................................... 41 Figure 18: Overhead View of the Proposed Cruise Terminal 2 Expansion, Shown in Blue ....................... 42 Figure 19: Annual Cruise Growth in Galveston is Double Annual National Cruise Growth1 ...................... 43 Figure 20: Port of Galveston Is Ranked Fifth Nationally for Passenger Volume ........................................ 43 Figure 21: Visitor Spending in Galveston Grows with Cruise Traffic .......................................................... 44 Figure 22: PAAF Grant Will Impact the Long Term Obligations for the Port of Galveston ......................... 45 Figure 23: The Total Annual Revenue of the Port of Galveston Could Cover the Maintenance & Operations Expense .................................................................................................................................... 46 Figure 24: Artist Rendering of Cruise Terminal Expansion ......................................................................... 47 Figure 25: Conceptual Drawing of Expanded and Modified Cruise Terminal 2 Building ............................ 51 Figure 26: Project Location ......................................................................................................................... 54 Figure 27: Enlarged Plan View of Proposed Bayport Rail Spur Extension ................................................. 54 Figure 28: The Port of Houston Cannot Fund All Capital Projects Scheduled For 2013-2018 .................. 55 Figure 29: Permitted Plans.......................................................................................................................... 61 Figure 30: Aerial View of Port Mansfield ..................................................................................................... 63 Figure 31: Overview of Dredge Depth’s Effect on Vessel Use ................................................................... 64 Figure 32: Port Mansfield’s Channel to the Gulf is a 9.9 Mile Dredge ........................................................ 65 Figure 33: Known Fishing Spots Around Port Mansfield ............................................................................ 66 Figure 34: General Location Plan ............................................................................................................... 70 Figure 35: Overall Layout of Proposed Dredging Project (-12 feet, after USACE) ..................................... 71 Figure 36: Detailed Layout of Proposed Dredging Project (-12 feet, after USACE) ................................... 72 Figure 37: 12th St. Dock Project Location ................................................................................................... 74 Figure 38: Conceptual Plan Rendering for the Port of Palacios by Cargo Velocity .................................... 75 Figure 39: NOAA Estimates that US Seafood Demand Will Keep Increasing In the Future ...................... 76 Figure 40: Shrimp Is the Most Consumed Seafood Per Capita in the USA ............................................... 76 Figure 41: The Port of Palacios Regularly Produces Above 10 Million Pounds of Shrimp Annually.......... 77 Figure 42: More than 100 Shrimp Boats Are Home-Ported at the Port of Palacios ................................... 77 Figure 43: Annual Revenue of the Port of Palacios Could Not Cover Capital Investment Cost ................. 78 Figure 44: Concept Plan and Cross-Section (after Port of Palacios) ......................................................... 82 Figure 45: Bulkhead Concept Repair Cross-Section .................................................................................. 83 Figure 46: Conceptual Layout Rendering of the Port of Port Arthur by Cargo Velocity ............................. 85 Figure 47: Existing Wood Pellet Silos and Loading Equipment at Port Arthur ........................................... 86 Figure 48: Port Arthur TIGER Grant Excerpt .............................................................................................. 88 Figure 49: Project Location ......................................................................................................................... 94 Figure 50: Conceptual Layout of the Proposed New Dock 4 Area at the Port of Victoria .......................... 95 Figure 51: Estimated Eagle Ford Shale Petroleum Production .................................................................. 96

TEXAS PORTS 2015 – 2016 CAPITAL PROGRAM TECHNICAL APPENDIX
PAGE iv
Figure 52: Location of the Port of Victoria Relative to Eagle Ford Shale ................................................... 96 Figure 53: Increasing Crude Oil & Frac Sand Tonnage at the Port of Victoria in Recent Years ................ 97 Figure 54: Upward Trend in the Total Oil and Gas Movement at the Port of Victoria ................................ 97 Figure 55: Current Oil Dock Operation at the Port of Victoria ..................................................................... 99 Figure 56: Barges at the Port of Victoria's Fleeting Area .......................................................................... 100 Figure 57: Increased Service Charges Contribute to Rising Revenue at the Port of Victoria .................. 101 Figure 58: The Port of Victoria Needs External Funding for a Capital Infrastructure Project ................... 101
Appendix B: Texas Port Profiles
Appendix C: Texas WRRDA Highlights
Appendix D: Texas Transportation Code

TEXAS PORTS 2015 – 2016 CAPITAL PROGRAM TECHNICAL APPENDIX
PAGE 1
The contents of Appendix A consist of a detailed technical analysis of the projects listed in the Texas Ports 2015-2016 Capital Program Executive Summary.
Methodology At the Port Authority Advisory Committee meeting in March 2014, the PAAC discussed guidelines for the Port Capital Program and the developed the following criteria for consideration of projects they wanted to highlight for funding under the Port Access Account Fund:
• Use the PAAC as an approval vehicle for TxDOT.
• Consider cost-match requirements.
• Consider return on investment/economic impacts.
• Consider regulatory mandates.
• Prioritize multi-modal projects.
• Set a maximum limit for a grant (so all ports can participate).
• Consider a standard rotation among port authorities for funding allocation.
• Consider quality of life, including that of clients, customers, and local communities.
• Consider the beneficiary’s commitment towards maintaining long-term sustainability of a project.
• Consider viability of a project.
• Prioritize projects that are closer to implementation.
• Consider a set-aside for smaller ports.
In June 2014 meeting, the PAAC decided that each port should submit one high priority port development project for an extended evaluation which will be highlighted in the 2015-2016 Port Capital Plan. The scope of the project had to abide by the guidance established in the Texas Transportation Code, Title 4, Chapter 55, Funding of Port Security, Projects and Studies. The PAAC requested that projects remain within the $10M range with an understanding that the port would pay 50% and the remaining 50% would be funded by the Port Access Account Fund when approved by the legislature.
Each proposed project would be reviewed to verify the Economic benefits, the Port’s “Needs Statement”
and ability to finance their cost share, Environmental compliance, project readiness and the Engineers project opinion of cost, design completeness and schedule.
Methodology for Economics Review The economic evaluation team reviewed documentation provided by each port, and interviewed port staff to understand proposed projects. The team prepared standard questions for each port, and sought to gather similar information from each port. Much of the team’s focus was on what new or incremental business would be developed with the capital improvements. Where data was lacking, available data sources were searched to fill in gaps. Once the team understood each port’s project, the team clarified defining characteristics by describing project plans in these categories.
TEXAS PORTS 2015 – 2016 CAPITAL PROGRAM TECHNICAL APPENDIX
PAGE 2
Standard Argument Names and Definitions The team prepared a summary of the main arguments in the following categories for each port, and elaborated on supporting evidence for the arguments. The reason was to provide a uniform summary of the reasons each port is seeking to complete the projects, and gain related funding. Some arguments are not applicable to every port.
Funding Argument: The port's reason for seeking outside funding.
Business Argument: The port's argument for why the project is important to the financial health & business of the port. For example, with Port Access Account Fund (PAAF) funding, the port will be able to retain existing customers and revenue that the port may lose to another location otherwise.
Self- sustaining Argument: The benefits achieved by the initial PAAF funding will result in a more stable financial situation. If so noted, the resulting facilities can be expected to earn revenue to cover expenses related to the new facility.
Catalyst Argument: The PAAF funding will pay for a key part of a larger project, or generate interest in further development at the port. The funding is a catalyst/accelerator.
Access Argument: With PAAF funding, the port will be able to build improved rail, road, or waterside access to the port, to allow the port to meet existing and future tenant needs.
Growth Argument: PAAF funding would positively affect port throughput growth.
Port Readiness: The port demonstrates readiness to develop the project in question, including the status of preparatory activity such as planning, design, permitting, financial evaluation, and availability.
In some cases, the team supported the presentation of the supporting arguments from a port perspective. This work may have included:
Documentation and calculation of expected project benefits
Clarification of project description and explanation of the purpose and need of the projects
Conceptual 3-D sketches and presentations of the proposed projects
Economic Impacts of Each Project The team collected available data on the projected change in cargo tonnage (or passenger revenue) and the capital costs of each project. The team then developed the related economic impacts. These include the direct, indirect, and induced impacts from information supplied by the port including:
Expected business revenue produced
Expected job creation
Expected labor income
Expected tax revenues
In summary, the team first defines each project, demonstrates expected benefits, prepares supporting analysis, and calculates economic benefits expressed in person hours.

TEXAS PORTS 2015 – 2016 CAPITAL PROGRAM TECHNICAL APPENDIX
PAGE 3
Methodology for Environmental Review Environmental Review was performed for each project, using fair and equitable criteria and methods. Ports were interviewed, either via teleconference or in person, and asked to provide a description of their proposed project along with existing relevant environmental documents, if any. Examples of relevant documents are environmental assessments, NEPA documents, and permits. Some projects are unlikely to affect regulated resources and therefore those ports did not have or produce any environmental documentation. Others have existing NEPA documents and 404/401 permits. Documents were reviewed, and permits were examined to determine whether they allow the activity proposed and if they are in force and effect. Expiration dates of permits were noted. A template was prepared for each port/project as a “review checklist” which included the status of environmental study, effected resources,
required mitigation, NEPA compliance, and overall agency coordination, among other considerations. Questions that were not relevant to the project under review were answered with N/A. In some cases, the information required to respond to a question was not provided. Those are answered with “Unknown”.
Methodology for Engineer Review The Engineer Team reviewed the proposed projects’ design documents, cost estimates, and schedule, where available, to ensure the project opinion of cost and construction timeframe were accurately reflected for the project. Ports were interviewed via teleconference and were followed up with one on one interviews at the proposed project site so the team could fully understand the intent and need for each individual project. Design and cost data and project construction schedules provided by the ports were reviewed to ensure the proposed projects could be constructed within the timeframe of the 2015-2016 Port Capital Plan for their proposed budgets. For projects presented that were still in the conceptual phase and were found lacking detailed cost documentation, the engineering team executed a limited design effort for the sole purpose of developing a project opinion of cost and preliminary schedule. Engineering review was performed as a high-level review and was not intended to be design verification or detailed peer review for the proposed projects.

TEXAS PORTS 2015 – 2016 CAPITAL PROGRAM TECHNICAL APPENDIX
PAGE 4
Summary of Proposed Projects The PAAC and TXDOT received applications from nine Texas ports for high-priority capital improvement projects. The review team provided an economic, environmental, and engineering review of the projects to validate each project’s overall state of readiness and determine potential economic benefits. Table 2 provides a summary of the project description, capital cost, design and permitting status.
Table 1: Summary of Port Projects
Port Project Description Estimated Project Cost (millions)
Port Match (millions)
PAAF Request (millions)
Engineering Status Environmental Permit Status
Beaumont Construct an overpass to by-pass rail lines and improve access to the port
$10.0 $5.0 $5.0 Preliminary Complete
Brownsville Construct a new liquid bulk terminal – Oil Dock No.6
$22.0 $11.0 $11.0 Complete Complete
Corpus Christi
Construct a 15 acre expansion of the La Quinta Terminal general cargo yard
$12.0 $6.0 $6.0 Preliminary Complete
Galveston Construct a 60,000 sq. ft. building expansion for Cruise Terminal No.2
$13.1 $6.55 $6.55 Preliminary Complete
Houston Construct a new rail spur with a sound barrier for the Bayport Terminal
$13.0 $6.5 $6.5 In design Complete
Port Mansfield
Maintenance dredging to 12 ft. for an existing channel to enable vessel access
$8.0 $2.0 $6.0 Preliminary Preliminary
Port Arthur Construct a new rail spur and cargo laydown yard
$7.1 $3.55 $3.55 Preliminary Complete
Palacios Modernize 650 ft. of wharf in Turning Basin No. 1
$2.7 $0.67 $2.02 Preliminary Preliminary
Victoria Construct a new liquid bulk barge terminal
$7.5 $1.87 $5.62 Preliminary Preliminary
TOTALS $95.3 $43.14 $52.24
Each project’s estimated costs in this table reflect the project opinion of cost validated by the review team.
Since the majority of the projects were in the preliminary phase of design, the costs should be viewed as a conservative estimate. The project cost will become more defined once the project moves from preliminary design to final design.

TEXAS PORTS 2015 – 2016 CAPITAL PROGRAM TECHNICAL APPENDIX
PAGE 5
Environmental permitting in a coastal environment is very complex and the process can take 12-18 months for final approval. This can easily disrupt schedules and drive up the overall cost of a project if mitigation of regulated resources is required. Environmental permitting is complete for a majority of the projects that were reviewed. This will enable those projects to move into construction as soon as resources are procured and the designs are complete. The projects that are in the preliminary phase of acquiring permits should be complete in time to meet the construction requirements in the 2015-2016 Port Capital Plan.
Tables 3-30 reflect the economic benefits for each of the projects during the construction phase. These benefits are calculated for each port based on the contract value of the construction project, the number of person-hours created during construction, and the local and state tax revenue generated from the construction activity. It is important to note that these numbers are preliminary.
Figure 1 represents the contract value of the construction projects at each of the nine ports.
Figure 1: Contract Value of Construction Projects

TEXAS PORTS 2015 – 2016 CAPITAL PROGRAM TECHNICAL APPENDIX
PAGE 6
The employment impact consists of the direct jobs (jobs directly generated by construction activity), induced jobs (jobs created by the spending of the directly employed individuals) and indirect jobs (jobs created by the purchases of the firms providing the construction services). These employment impacts are generated during the construction period only and are expressed in person-hours.
Figure 2: Summary of Expected Construction-related Job Impacts by Port

TEXAS PORTS 2015 – 2016 CAPITAL PROGRAM TECHNICAL APPENDIX
PAGE 7
The tax impact represents the tax payments to the state and local governments by the firms and individuals whose jobs are directly dependent upon and supported (induced and indirect jobs) by the Ports’ construction activity.
Figure 3: Summary of Construction-related State and Local Tax Impacts by Port

TEXAS PORTS 2015 – 2016 CAPITAL PROGRAM TECHNICAL APPENDIX
PAGE 8
Figure 4 identifies the enduring jobs that are created from each project once construction is complete.
Figure 4: Jobs Created Post-Construction through Operation of Facilities
Figure 3 summarizes general revenue generated for each project where data was available.
The direct, induced and indirect job impacts presented in Figure 2 are a measure of the post-construction job impacts supported by the specific construction programs. These jobs are annual and are in addition to the one-time construction job impacts. The relatively low ratio of induced and indirect jobs to direct jobs for the Port of Galveston reflects the fact that the construction project at Galveston will increase cruise capacity, and the average salary for direct jobs generated by cruise operations is significantly less than for cargo operations. As a result, the resulting multiplier impact is lower for cruise than for cargo activity. Also, cargo activity tends to generate higher indirect jobs, due to the fact that most indirect jobs are supported by visitor industry firms supporting the passengers pre- and post-cruise.

TEXAS PORTS 2015 – 2016 CAPITAL PROGRAM TECHNICAL APPENDIX
PAGE 9
Individual Project Evaluations Port of Beaumont Project Description: The project is the construction of a new access roadway and bridge at the south entrance of the Port of Beaumont. The new roadway will provide a direct link from the port main terminal area and waterfront facilities to port properties located on the south side of Buford Street. The existing entrance roadway is located at grade and crosses the main railroad tracks by which the port receives all rail traffic from three Class 1 railroads (UP, BNSF and KCS.) The project will include a grade separation overpass structure over the main railroad tracks and allow uninterrupted access to the south property. The proposed new access road will eliminate at-grade rail crossings, improve safety and reduce idle time for vehicles.
Estimated Project Cost: $10,000,000
Economics Review Summary The Port of Beaumont has requested funding assistance for a roadway and bridge to improve access within the port. Access is currently constrained by frequent blockage by trains on departure rail tracks that divide the Port. Long trains block access roads between the southern and northern sides of the Port. The benefits of the bridge include improved cargo handling efficiency, improved use and marketability of the landside portion of the Port, and expected overall growth in cargo tonnage that might result. The Port argues that outside funding is needed because cargo revenues are insufficient for this capital project. The project-related construction activity of $10 million at the Port of Beaumont will generate 302,219 person-hours of direct, induced and indirect jobs, as well as $10 million of direct business revenue to the firms providing services during the duration of the construction period. The projected cargo throughput resulting from the project is currently not known and thus the resulting jobs and revenue impact of the operation of the project is difficult to identify at this time.
Overview of the Port’s Request The Port of Beaumont requests funding for a new bridge. The bridge will provide a direct link from the lands south of the rail tracks to the waterfront facilities. The figures on the following pages illustrate the blockage problem and the Port’s proposed solution. A sketch of the bridge is shown in Figure 5. The light grey road shows the proposed elevated road crossing. The red lines indicate where grain trains are staged, and divide the Port.

TEXAS PORTS 2015 – 2016 CAPITAL PROGRAM TECHNICAL APPENDIX
PAGE 10
Figure 5: Conceptual View of Proposed Bridge, Looking towards the Main Port Area
Purpose & Need Summary The Port considers the grade separation a high-priority project because it impacts their tenants on a frequent basis. It is also an obstacle to further development of the Port lands.
Figure 6 shows an overhead view of how the bridge provides access from the orange areas to the waterfront when there is a train departure blockage (red line). The orange areas consist of 82 acres of existing and planned port backlands south of the rail yards. The planned development areas are identified in the Port’s recent master plan, prepared for the Port by Lanier & Associates. The proposed access
solution is shown in green (access road) and yellow (proposed bridge).
Figure 6: Port of Beaumont Access Map

TEXAS PORTS 2015 – 2016 CAPITAL PROGRAM TECHNICAL APPENDIX
PAGE 11
Figure 7: View of At-grade Crossing when Blocked by a Grain Train
Tenants that are restricted by the parked trains include the Kinder Morgan dry bulk terminal and military project and rolling stock cargoes. The departing trains are prepared by another port tenant, Louis Dreyfus Commodities (grain elevator and silos). The trains are held within the port tracks to enable direct departure to the mainlines of one of the three Class I railroads that serve the Port, Union Pacific, Kansas City Southern, and Burlington Northern/Santa Fe. A full “unit train” of up to 8,500 feet in length will be held in the departure tracks for up to 30 minutes prior to departure to enable preparation of the train, including charging the brake system and inspecting the cars.
The Port’s main entrance is kept clear during departure, but all other at-grade crossings are blocked. It is not possible to run around to the east of the tracks, because there is frequent switching between Louis Dreyfus and the Carol St. holding yard.
The benefits of the bridge project include elimination of at-grade rail crossings, improving safety, minimizing traffic congestion. In addition, the Port has been aggressively buying and marketing 80 acres of land on the south side of the tracks, and the bridge access route will make them more valuable.
Summary of Need for Outside Funding: The Port of Beaumont can pay for the requested matching funds for the project. The Port cannot raise the overall funds because revenues from their cargo sector (bulk cargoes) are insufficient to cover the cost of an expensive bridge. If the costs were added to tenant fees, the Port risks losing tenants to lower cost ports out of state. If the Port does not receive funding, it could be at competitive disadvantage compared to other direct competing Ports in Mississippi, Florida, Alabama and Louisiana.
The Port of Beaumont does not currently receive state funding. The Port is the number one strategic military port in the U.S. but besides user fees it does not receive federal funding.
Overall Analysis of Port Arguments In this section, the Port’s arguments are organized into standard categories, and the strength of the arguments of purpose and need are evaluated. Most important is for the Port to show the extent of the blockage problem, and that the grade separation is the needed solution.
1) Funding Argument: Self-funding would put the Port at a disadvantage compared to neighboring ports (Louisiana and Mississippi) that receive state funding.
2) Business Argument: The project will facilitate greater bulk cargo movement and possibly allow creation of new business (wind energy). It will also improve the possibility to lease properties on the south side of the tracks, and serve existing tenants while giving them the opportunity to grow their business.
3) Self-sustaining Argument: Leasing new land on the south side of the tracks will generate enough revenue to allow funding of periodic bridge maintenance.

TEXAS PORTS 2015 – 2016 CAPITAL PROGRAM TECHNICAL APPENDIX
PAGE 12
4) Catalyst Argument: The Port expects the bridge to enable new cargo leases, including possible automobile business, wind energy, and expansion of military land use. The project will enable the Port to market properties to tenants on the landside of the bridge that require continuous access to the ship berths. Therefore, the project is a catalyst for development of other projects in the area.
5) Access Argument:
a) The project will enable continuous access between north side and south side of the Port eliminating the delay of waiting for trains to pass (~30-minute blockage on every train arrival).
b) The project will better accommodate military cargo trains.
6) Growth Argument:
a) The project will allow the development of properties south of the rail tracks.
7) Port Readiness: The project is part of a master plan. At this time, the preliminary engineering has yet to be completed.
Economic Impacts Analysis Summary The economic impact analysis focuses on the impacts created by the new access roadway at the south entrance of the Port of Beaumont to minimize congestion of the trucks and cargo movements which are caused by being blocked by stopped railcars. The project does not identify new or additional tonnage at the current time. The project will maintain their existing tenant activity as well as giving them an opportunity to expand their business and possibly attract new cargo activity. The project does create one-time impacts of the construction activity associated with the project. Impacts are estimated in terms of jobs, personal earnings, business revenue, and state and local taxes. The baseline impacts of the Port of Beaumont were developed in 2012 as part of the economic impact analysis of the State of Texas Port and Maritime Transportation System for the Texas Ports Association.
The construction of a roadway overpass to span the rail lines at the Port of Beaumont is projected to cost $10 million. These economic impacts are identified in Table 2.
Table 2: Economic Impacts Generated by Construction Activity
Note: Totals may not add due to rounding
BEAUMONT Construction
Total Construction Value $10,000,000
JOBS (Person hours)
Direct 82,000
Induced 80,577
Indirect 139,642
PERSONAL INCOME
Direct $1,492,400
Re-spending/Local Consumption $4,298,261
Indirect $3,369,663
TOTAL $9,160,324
LOCAL PURCHASES $6,560,180
STATE AND LOCAL TAXES $723,666

TEXAS PORTS 2015 – 2016 CAPITAL PROGRAM TECHNICAL APPENDIX
PAGE 13
The $10 million construction impact creates approximately 82,000 person-hours. Approximately 80,600 induced person-hours are created as a result of the local purchases of the individuals directly generated by the construction activity. An additional 140,000 indirect person-hours were supported by $6.6 million of purchases in the local and regional economy by the firms providing direct construction activity services.
The income impact is estimated by multiplying the average annual earnings (excluding benefits) by the corresponding number of direct jobs. The individual annual earnings multiplied by the corresponding job impact resulted in $1.5 million in personal wage and salary earnings. The impact of the re-spending of this direct income for local purchases is estimated using a personal earnings multiplier. The personal earnings multiplier is based on data supplied by the Bureau of Economic Analysis (BEA), Regional Input-Output Modeling System (RIMS II). The personal earnings multiplier was used to estimate the total income and consumption impact of $4.3 million, inclusive of the re-spending and local consumption impact. This additional re-spending of the direct income generates the 80,577 induced person-hours impact. The indirect person-hours earned $3.4 million in indirect wages and salaries. Combining the direct, induced and indirect personal income impacts, the total income impact is $9.2 million.
Construction activity of the roadway overpass will generate $0.7 million of state and local taxes.
Environmental Review The proposed access roadway at the south entrance of the Port of Beaumont will improve the Port’s
mobility and safety and provide a reduction in traffic congestion and air emissions. This roadway is proposed to be constructed on existing port property with no impacts to wetlands or waters of the U.S., and a Department of Army (DA) permit would not be required. The proposed project site is historically industrial, and the presence of contaminants is unknown. It is anticipated that this proposed project would be implemented within the FY15-16 Texas Port Capital Program timeline. During construction, The Port of Beaumont would comply with the existing Texas Commission on Environmental Quality (TCEQ’s)
municipal storm water permit, and additional permitting through local entities (city, county) may be required.
TxDOT Maritime Environmental Review Checklist 1) Have environmental resource studies been conducted to
determine the presence/absence of regulated resources?
Yes
2) If resources have been identified as being present on the proposed project site, have the resources been located and quantified?
No
3) Will the proposed project affect any regulated environmental resources? Describe impact.
No
4) Does the proposed project require an environmental permit to impact the regulated resources?
No
5) If no permit is required, why not? There is no impact to regulated resources on industrial site.
6) If yes, what type and from what agency? 7) Has the applicant coordinated with resource agencies? If
so, please list. Yes, TCEQ
8) Is mitigation required to offset impacts? N/A 9) If yes, has a mitigation plan been developed? What does
the plan include?
10) Does NEPA apply to this proposed project? No 11) If yes, what is the current status of the NEPA document? 12) Are there any known contamination-related issues on Unknown

TEXAS PORTS 2015 – 2016 CAPITAL PROGRAM TECHNICAL APPENDIX
PAGE 14
TxDOT Maritime Environmental Review Checklist the proposed project site?
13) If contamination is known to exist on the proposed project site, what steps are being taken to remediate any known soil/groundwater conditions and to protect site workers during construction?
14) What, if any, are the environmental considerations during construction?
Comply with all regulations and permits relating to storm water quality.
15) Describe the project’s environmental benefits. Traffic congestion relief, reduction in air emissions
16) What is the anticipated project delivery schedule? Environmental clearance/permitting for this project fall within the FY15-16 Texas Ports Capital Program delivery schedule.
17) What recommendations do you have for the applicant to efficiently proceed with the proposed project?
Comply with all regulations and permits relating to storm water quality. Coordinate with local entities (city, county) relating to building permits.
Engineer Review The proposed project is the construction of a grade separation overpass structure spanning over the main railroad tracks and Buford Street. The Port provided two overall plan views of the proposed grade separation and a preliminary opinion of probable cost. The project is in a preliminary development phase so detailed engineering, drawings, and specifications were not available.
The assumption is that the proposed grade separation will consist of a typical concrete bridge structure with Mechanically Stabilized Earth (MSE) walls for the bridge approaches. Allowances are estimated for storm water drainage and utility relocations. The assumption also is that the bypass roads will be typical roadways constructed with asphaltic concrete pavement.
It is possible that the current proposed bridge layout and alignment could be adjusted to more efficiently cross the railroad tracks and Buford Street and still provide the Port’s desired results.
Cost Estimate The Port of Beaumont’s cost estimate was based on a preliminary layout prepared by Lanier and Associates Consulting Engineers for the Port of Beaumont.

TEXAS PORTS 2015 – 2016 CAPITAL PROGRAM TECHNICAL APPENDIX
PAGE 15

TEXAS PORTS 2015 – 2016 CAPITAL PROGRAM TECHNICAL APPENDIX
PAGE 16
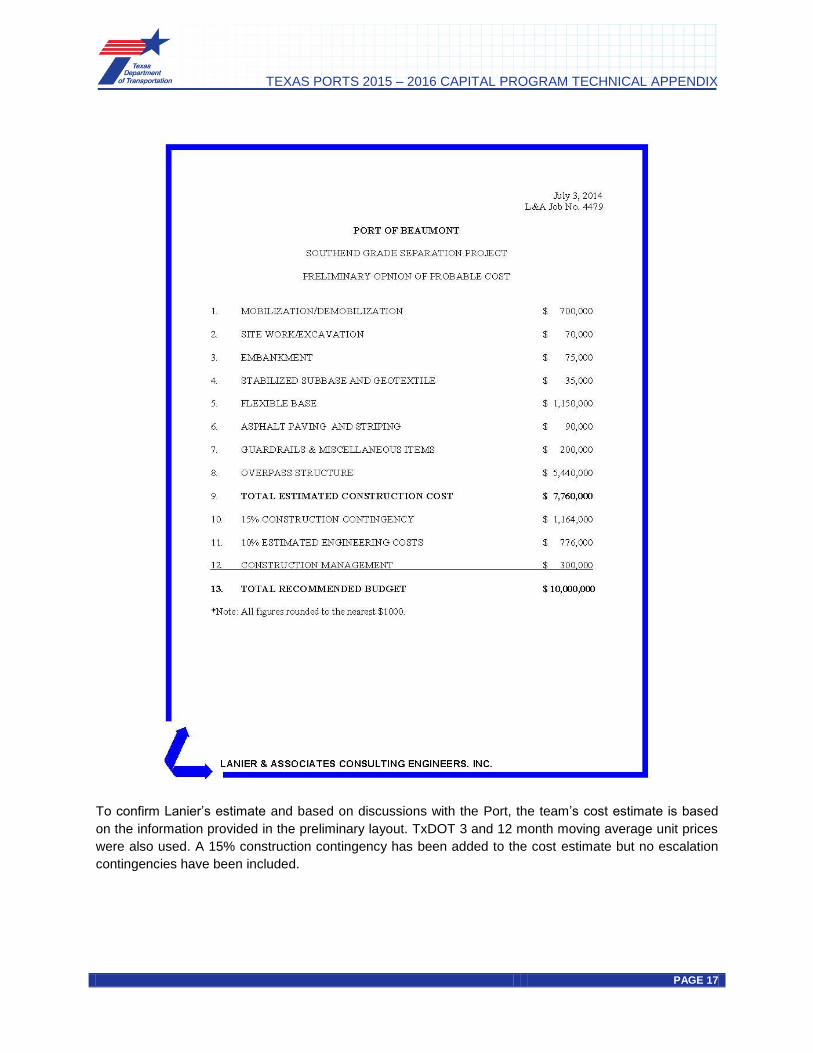
TEXAS PORTS 2015 – 2016 CAPITAL PROGRAM TECHNICAL APPENDIX
PAGE 17
To confirm Lanier’s estimate and based on discussions with the Port, the team’s cost estimate is based on the information provided in the preliminary layout. TxDOT 3 and 12 month moving average unit prices were also used. A 15% construction contingency has been added to the cost estimate but no escalation contingencies have been included.

TEXAS PORTS 2015 – 2016 CAPITAL PROGRAM TECHNICAL APPENDIX
PAGE 18
The cost estimate was developed without any specialty design service information. These services include geotechnical reports, drainage impacts, utility investigations, environmental impacts, and survey information. No input from the various railroad operators is included in the cost estimate. It is closer to $8 million versus the $10 million initially proposed. Construction costs are regionally dependent and can fluctuate significantly. A $10 million budget would be sufficient for the scope of this project.

TEXAS PORTS 2015 – 2016 CAPITAL PROGRAM TECHNICAL APPENDIX
PAGE 19
Schedule Based on a review of the documents provided by the Port of Beaumont, the engineering phase appears to be in the preliminary phase. Once the project is fully resourced, the project could be complete in 18-24 months.
Port of Brownsville Project Description: The Port of Brownsville proposes to construct a new oil dock (Oil Dock 6) which will be located on the north side of the Brownsville Ship Channel where the existing and proposed tank farms are located. The purpose of Oil Dock 6 is to improve and expand marine delivery and shipment of refined petroleum products, including asphalt, gasoline, and low-sulfur diesel fuel. When constructed, the dock will be capable of serving 900-foot plus vessels with a 42-foot draft. No other petroleum docks at the Port are capable of docking these deep draft vessels.
Estimated Project Cost: $12,000,000
Economics Review Summary The Port of Brownsville has submitted a request for a new, modern oil dock. The Port’s argument for
purpose and need includes the following reasons: increased ship size, tenant requests, and the potential for increased petroleum cargo volumes. The Port requests funding support because cargo revenues are insufficient to pay for the new dock. This document provides a summary of the Port’s arguments as well
as an evaluation of the Port’s request and supporting documentation.
Overview of the Port’s Request The proposed “Oil Dock” 6 will be located on the
north side of the Brownsville Ship Channel where tank farms are located. Dock 6 will improve and expand marine delivery and shipment of refined petroleum products, including asphalt, gasoline, and low-sulfur diesel fuel. The dock has been designed for 900-foot long ships with and a 42-foot project design depth. Reference: Port’s PCP Request
Figure 9: Enlarged Plan View, Proposed Oil Dock
Figure 8: Project Location

TEXAS PORTS 2015 – 2016 CAPITAL PROGRAM TECHNICAL APPENDIX
PAGE 20
Purpose & Need Summary
Summary of Purpose of the Project: Following is an excerpt from the Port’s 2009 Tiger Grant Application. It summarizes the reasons for
needing the new facility. Since the time of that application, the Port has reduced the planned design draft to 40 feet.
Oil Dock 6 will supplement Oil Dock 5 for serving vessels with up to a 40-foot draft. The Port argues in the Tiger Grant application that without the new dock, oil cargoes will be constrained from growth beyond 1.9 million tons of liquid bulk cargo. The project is estimated to cost US$ 22 million. The Port is currently authorized at a 42-foot-draft and is in the process of completing a study with the US Army Corps of Engineers which recommends a future draft of 52 feet. The future projects may take many years to actualize.
Summary of Need for Outside Funding: The Port of Brownsville is requesting state funding because it argues that the Port cannot finance the project from its annual revenue. Even though the Port’s revenues are growing, it has not been able to
retain enough funds to pay for costly capital improvements. According to the Port, multiple funding avenues have been considered and rejected, such as use of revenue bonds, raising rates to users, and potential PPP concept (Public Private Partnership). At least one existing tenant has offered to participate in costs to go to a 50-foot draft oil dock, but this support is insufficient to move this option forward. The PAAF grant will enable the Port to develop a second dock sooner, and support expanded cargo growth at the Port.

TEXAS PORTS 2015 – 2016 CAPITAL PROGRAM TECHNICAL APPENDIX
PAGE 21
Purpose of and Need for the Project – Support Documentation: In this section, the Port of Brownsville provides supporting evidence for its arguments about the purpose of and need for the project. The following sections contain supporting arguments and analysis on behalf of the Port. Data was applied from the Port and from public sources. At this time, the Port has not yet had
the opportunity to review these arguments.
1) The Port of Brownsville needs to improve its current infrastructure to accommodate larger oil vessels.
The Port has noted that Dock 5 is the only dock able to berth larger vessels which are now more frequent. Table 3 shows the specifications of the current oil docks at the Port of Brownsville.
Table 3: Specifications of Current Oil Docks at the Port of Brownsville
Dock Name Berth Length (Feet)
Berth Width (Feet)
Depth Alongside (Feet)
Oil Dock No. 1 420 120 33
Oil Dock No. 2 420 120 31
Oil Dock No. 3 420 120 30
Oil Dock No. 5 1100 220 42
Recent port call statistics have shown that tenants are using larger vessels with deeper drafts to move their petroleum products in and out of the Port, as illustrated in Figure 10 below.
Figure 10: Average Overall Increasing Length of Tanker Vessels at the Port of Brownsville
The average length of vessels at the Port’s oil dock has increased from 523 feet in the first quarter of
2012 to 677 feet in the fourth quarter of 2013. The Port indicates that 75% of cargo tonnage is being loaded and unloaded through Oil Dock 5. Some of the vessels that dock at Oil Dock No. 1, No. 2, and No. 3 have to be light-loaded to allow movement in and out of the berths.
2) The Port of Brownsville estimates that Oil Dock 6 will enable 6% annual growth of petroleum tonnage.

TEXAS PORTS 2015 – 2016 CAPITAL PROGRAM TECHNICAL APPENDIX
PAGE 22
The Port of Brownsville Harbormaster projects 6% growth in the next five years. Without Dock 6, it is possible that some or all of this growth may not be accommodated. In the 2009 Tiger Grant application, the Port submitted the projections shown in Figure 11: Cargo Projection with and without Dock 6 (2009 Tiger Grant Application) below. The argument at that time was that the Port anticipated cargo tonnage to be limited to 1.9 million tons without Oil Dock 6. Also, cargo growth was expected to build at about 2.6% per year. A recent update to the near-term cargo projection estimates five years of 6% growth.
Figure 11: Cargo Projection with and without Dock 6 (2009 Tiger Grant Application)
Need for Outside Funding – Support Documentation: In this section, the Port of Brownsville provides supporting evidence to reinforce its need for external project funding.
Overall Analysis of Port Arguments In this section, the Port’s arguments are summarized into standard categories and evaluated.
1) Funding Argument: The Port of Brownsville will be able to complete the Dock 6 project sooner if partial external finding is obtained.
2) Business Argument: Older docks currently cannot be removed from service because they are needed for cargo growth as a part of the overall regional and international oil and gas booms. No new customers are expected. Main customers are TransMontaigne and Pemex.
3) Self-sustaining Argument: After project completion, Brownsville will operate the facility and collect fees for usage from multiple users. The Port may also be able to lease the dock to a new user.
4) Catalyst Argument: The project will enable the Port to develop a tank farm property to the rear of the dock. Therefore, the project is a catalyst for development of other projects in the area.
5) Access Argument: Not applicable.
6) Growth Argument: A new dock would allow phased development of older docks that have exceeded lifespan (3/4 of oil docks are old wooden docks) by satisfying the needs of existing throughput.
7) Port Readiness: The project is ready to go − already designed and permitted to a 42-foot design depth.

TEXAS PORTS 2015 – 2016 CAPITAL PROGRAM TECHNICAL APPENDIX
PAGE 23
Economic Impacts Analysis Summary The economic impact analysis focuses on the impacts created by the operation of Oil Dock 6, as well as the one-time impact of the construction activity associated with building the new oil dock. Impacts are estimated in terms of jobs, personal earnings, business revenue, and state and local taxes. The baseline impacts of the Port of Brownsville were developed in 2012 as part of the economic impact analysis of the State of Texas Port and Maritime Transportation System for the Texas Ports Association.
Based on data provided by the Port of Brownsville, the petroleum products tonnage is expected to grow about 30% after five years. The Harbormaster identified that currently 75% of the Port’s liquid bulk
products are handled at Oil Dock 5. With Oil Dock 6 in operation, it is expected that 30% of all liquid bulk tonnage will be handled at the new dock in the first two years and increase to about 45-50% in Years 3 - 5.
The Port of Brownsville currently handles 3.1 million tons of petroleum products across its Oil Docks 1, 2, 3 and 5. Forecasting a 6% increase in the first year of Oil Dock 6 operation, total petroleum products grows to 3.3 million tons and in Year 5 (30% growth), tonnage will be 4.1 million tons. Based on the expectations that Oil Dock 6 will handle 30% of the liquid bulk tonnage in the first two years and 45-50% in Years 3 - 5, the dock will handle 990,886 tons and 1,924,127 tons, respectively. The economic impacts generated by Oil Dock 6 are summarized in Table 4.
Table 4: Summary of the Economic Impacts Generated by Port of Brownsville - Oil Dock 6
Note: Totals may not add due to rounding
As Table 4 indicates, the Port of Brownsville’s Oil Dock 6 will generate the following economic impacts for
the local and regional economy in the first and fifth year. It is to be emphasized that both years’ impacts
are incremental changes to the baseline model and not additive.
BROWNSVILLE Year 1 Year 5
Tonnage (Share at Oil Dock #6) - Metric Tons 990,886 1,924,127
JOBS
Direct 115 223
Induced 133 258
Indirect 62 121
TOTAL 310 601
PERSONAL INCOME ($ Thousands)
Direct $5,217 $10,131
Re-spending/Local Consumption $15,026 $29,178
Indirect $3,012 $5,848
TOTAL $23,255 $45,156
Direct Business Revenue ($ Thousands) $42,308 $82,155
Local Purchases ($ Thousands) $5,587 $10,849
STATE AND LOCAL TAXES ($ Thousands) $1,837 $3,567

TEXAS PORTS 2015 – 2016 CAPITAL PROGRAM TECHNICAL APPENDIX
PAGE 24
In Year 1:
Approximately 990,900 tons of liquid bulk will be handled at Oil Dock 6.
310 total jobs are generated by activities of Oil Dock 6 at the Port of Brownsville. These include:
o 115 direct jobs
o 133 induced jobs
o 62 indirect jobs
$23.3 million of direct, induced, indirect wages and salaries and local consumption expenditures are generated by Oil Dock 6 activity.
Businesses providing services at the terminal receive nearly $42.3 million of revenue, excluding the value of cargo shipped through the facility.
$1.8 million of state and local taxes were generated by activity at Oil Dock 6.
In Year 5:
Approximately 1.9 million tons of liquid bulk will be handled at Oil Dock 6.
601 total jobs are generated by activities of Oil Dock 6 at the Port of Brownsville. These include:
o 223 direct jobs
o 258 induced jobs
o 121 indirect jobs
$45.2 million of direct, induced, indirect wages and salaries and local consumption expenditures are generated by Oil Dock 6 activity.
Businesses providing services at the terminal receive nearly $82.2 million of revenue, excluding the value of cargo shipped through the facility.
$3.6 million of state and local taxes were generated by activity at Oil Dock 6.
In addition, the construction of Oil Dock #6 will create one-time economic impacts while the dock is being built. The anticipated project cost to build the new dock is $22 million. Construction impacts are estimated in terms of jobs, personal earnings, business revenue, and state and local taxes. These economic impacts are identified in Table 5.

TEXAS PORTS 2015 – 2016 CAPITAL PROGRAM TECHNICAL APPENDIX
PAGE 25
Table 5: Economic Impacts Generated by Construction Activity
Note: Totals may not add due to rounding
The $22 million construction impact creates approximately 202,000 person-hours. Approximately 198,400 induced person-hours are created as a result of the local purchases of the individuals directly generated by the construction activity of Oil Dock #6. An additional 109,253 indirect person-hours were supported by $4.9 million of purchases in the local and regional economy by the firms providing direct construction activity services.
The income impact is estimated by multiplying the average annual earnings (excluding benefits) by the corresponding number of direct jobs. The individual annual earnings multiplied by the corresponding job impact resulted in $3.7 million in personal wage and salary earnings. The impact of the re-spending of this direct income for local purchases is estimated using a personal earnings multiplier. The personal earnings multiplier is based on data supplied by the Bureau of Economic Analysis (BEA), Regional Input-Output Modeling System (RIMS II). The personal earnings multiplier was used to estimate the total income and consumption impact of $10.6 million, inclusive of the re-spending and local consumption impact. This additional re-spending of the direct income generates the 198,386 induced person-hours impact. The indirect job holders earned $2.7 million in indirect wages and salaries. Combining the direct, induced and indirect personal income impacts, the total income impact is $16.9 million.
Construction activity of the Oil Dock #6 generates $1.3 million of state and local taxes.
BROWNSVILLE Construction
Total Construction Value $22,000,000
JOBS (Person hours)
Direct 201,890
Induced 198,386
Indirect 109,253
PERSONAL INCOME ($ Thousands)
Direct $3,674
Re-spending/Local Consumption $10,583
Indirect $2,650
TOTAL $16,907
Local Purchases ($ Thousands) $4,916
STATE AND LOCAL TAXES ($ Thousands) $1,336
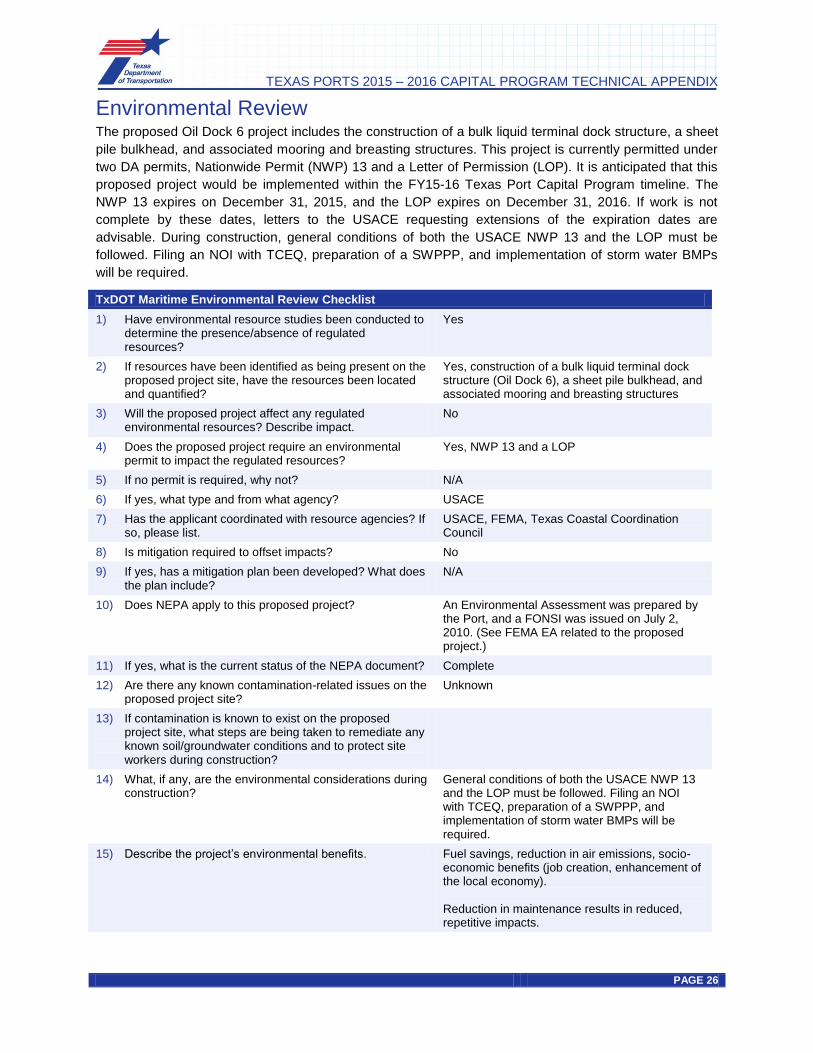
TEXAS PORTS 2015 – 2016 CAPITAL PROGRAM TECHNICAL APPENDIX
PAGE 26
Environmental Review The proposed Oil Dock 6 project includes the construction of a bulk liquid terminal dock structure, a sheet pile bulkhead, and associated mooring and breasting structures. This project is currently permitted under two DA permits, Nationwide Permit (NWP) 13 and a Letter of Permission (LOP). It is anticipated that this proposed project would be implemented within the FY15-16 Texas Port Capital Program timeline. The NWP 13 expires on December 31, 2015, and the LOP expires on December 31, 2016. If work is not complete by these dates, letters to the USACE requesting extensions of the expiration dates are advisable. During construction, general conditions of both the USACE NWP 13 and the LOP must be followed. Filing an NOI with TCEQ, preparation of a SWPPP, and implementation of storm water BMPs will be required.
TxDOT Maritime Environmental Review Checklist 1) Have environmental resource studies been conducted to
determine the presence/absence of regulated resources?
Yes
2) If resources have been identified as being present on the proposed project site, have the resources been located and quantified?
Yes, construction of a bulk liquid terminal dock structure (Oil Dock 6), a sheet pile bulkhead, and associated mooring and breasting structures
3) Will the proposed project affect any regulated environmental resources? Describe impact.
No
4) Does the proposed project require an environmental permit to impact the regulated resources?
Yes, NWP 13 and a LOP
5) If no permit is required, why not? N/A 6) If yes, what type and from what agency? USACE 7) Has the applicant coordinated with resource agencies? If
so, please list. USACE, FEMA, Texas Coastal Coordination Council
8) Is mitigation required to offset impacts? No 9) If yes, has a mitigation plan been developed? What does
the plan include? N/A
10) Does NEPA apply to this proposed project? An Environmental Assessment was prepared by the Port, and a FONSI was issued on July 2, 2010. (See FEMA EA related to the proposed project.)
11) If yes, what is the current status of the NEPA document? Complete 12) Are there any known contamination-related issues on the
proposed project site? Unknown
13) If contamination is known to exist on the proposed project site, what steps are being taken to remediate any known soil/groundwater conditions and to protect site workers during construction?
14) What, if any, are the environmental considerations during construction?
General conditions of both the USACE NWP 13 and the LOP must be followed. Filing an NOI with TCEQ, preparation of a SWPPP, and implementation of storm water BMPs will be required.
15) Describe the project’s environmental benefits. Fuel savings, reduction in air emissions, socio-economic benefits (job creation, enhancement of the local economy). Reduction in maintenance results in reduced, repetitive impacts.

TEXAS PORTS 2015 – 2016 CAPITAL PROGRAM TECHNICAL APPENDIX
PAGE 27
TxDOT Maritime Environmental Review Checklist 16) What is the anticipated project delivery schedule? Environmental clearance/permitting for this
project fall within the FY15-16 Texas Ports Capital Program delivery schedule.
17) What recommendations do you have for the applicant to efficiently proceed with the proposed project?
The NWP 13 expires on December 31, 2015. The LOP expires on December 31, 2016. If work is not completed by these dates, letters to the USACE requesting extensions of the expiration dates are advisable.
Engineer Review This review was conducted as a high-level technical review of the proposed design for general compliance with the current best design practices applicable for similar structures based on operational purposes. The review was not intended to verify project design, constructability, and cost and should not be considered as formal peer review of the overall project.
The proposed Oil Dock 6 is a pile-supported concrete structure. The major components of the project consist of: dredging of the berth area, construction of a bulkhead at the shoreline to facilitate dredging of the berth, pile-supported mooring and breasting dolphin structures, a pile-supported concrete loading platform, upland pavement, pipe bridges, and a dock house to be located on the loading platform. The Port will provide the proposed dock as bare structure, and the Port's tenants who operate the dock will provide process and piping components for their operations.
Proposed Design and Technical Review Scope The Port of Brownsville has substantially completed the design plans and technical specifications for construction of the proposed Oil Dock 6 (OD6). The design for OD6 is based on a design basis document, which was circulated to existing clients and potential end users of the proposed dock to obtain their input on the marine facilities. The design basis document provides evidence that site characterization studies have been undertaken in the form of topographic and bathymetric surveys, and a geotechnical exploration program. Design drawings and technical specifications were found to provide sufficient detail for construction of the proposed dock.
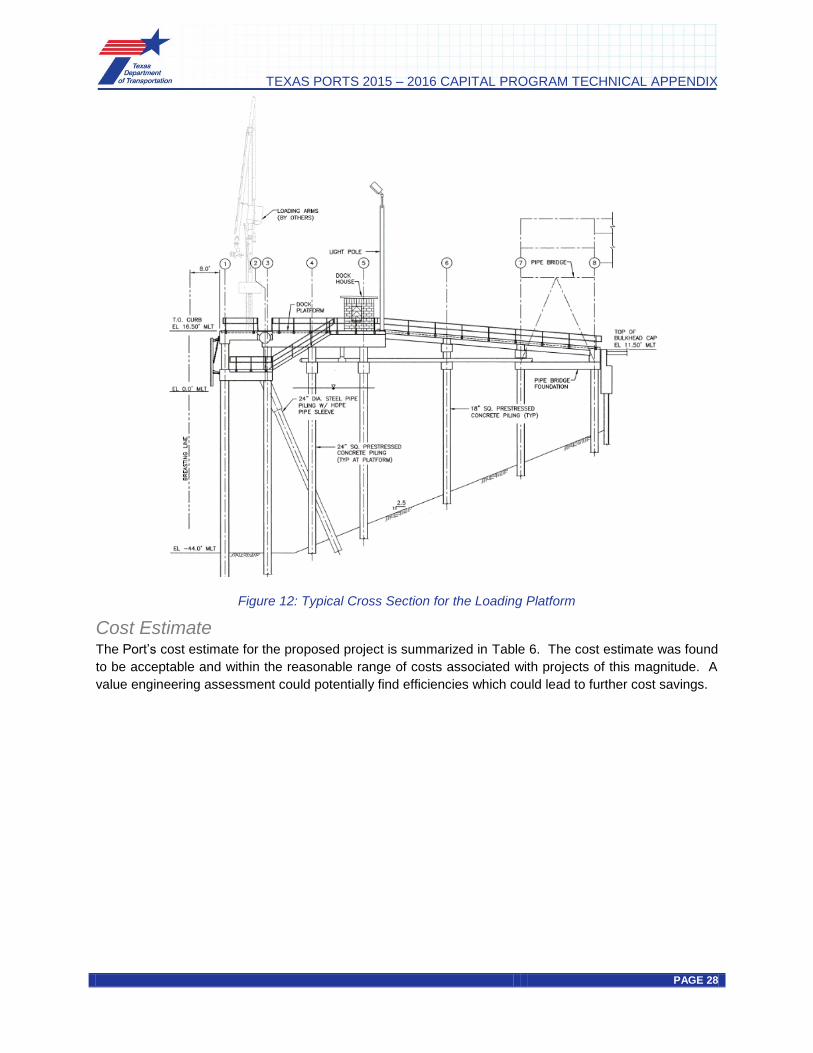
TEXAS PORTS 2015 – 2016 CAPITAL PROGRAM TECHNICAL APPENDIX
PAGE 28
Figure 12: Typical Cross Section for the Loading Platform
Cost Estimate The Port’s cost estimate for the proposed project is summarized in Table 6. The cost estimate was found to be acceptable and within the reasonable range of costs associated with projects of this magnitude. A value engineering assessment could potentially find efficiencies which could lead to further cost savings.

TEXAS PORTS 2015 – 2016 CAPITAL PROGRAM TECHNICAL APPENDIX
PAGE 29
Table 6: Project Cost Estimate
Schedule Based on a review of the documents provided by the Port of Brownsville, the engineering phase of the project appears to be substantially completed and the drawings and technical specifications prepared for the proposed project appear to be "shovel ready". While a formal construction schedule was not provided, the Port anticipates that construction duration will be 12 to 18 months, depending on how the construction contract is ultimately structured. This is reasonable construction duration for the scope of work proposed for the Oil Dock 6 project.
Item Description Total Cost ($)
1 Jetty Platform 1,449,485$
2 Dock Platform Fenders/Hardware 400,188$
3 Dock House 50,000$
4 Breasting Structures (4) 1,880,800$
5 Mooring Structures (6) 803,300$
6 Approachway Structure 121,723$
7 Pipe Supports 74,441$
8 Landside Pipe Bridge Foundation 29,800$
9 Catwalk Structures 302,360$
10 Pipe Bridge Foundations 421,426$
11 Combustion Unit Foundation 47,003$
12 Bulkhead 7,674,327$
13 Dredging/Shoreline Protection 3,460,000$
14 Mob/Demob 750,000$
15 Demolition 250,000$
16 Site Paving and Drainage 532,590$
17 Site Utilities 103,690$
18 Electrical 192,952$
SUBTOTAL (A) 18,544,084$
INSURANCE/BONDS (2%) 370,882$
MATERIALS TESTING (1.5%) 278,162$
CONSTRUCTION SUPPORT/ADMIN (5%) 927,205$
CONTINGENCY (15%) 2,781,613$
OVERHEAD AND MISC. COST (b) 4,357,862$
TOTAL (A+B) 22,901,946$

TEXAS PORTS 2015 – 2016 CAPITAL PROGRAM TECHNICAL APPENDIX
PAGE 30
Port of Corpus Christi Project Description: The Port of Corpus Christi proposes to construct 15 acres of general cargo storage yard, an access road extension, and utility and security improvements to compliment and expand the capability of the $68 million initial phase of project which consisting of 1,000-foot multipurpose deep draft ship dock, railroad track, and storage yard facility built on the La Quinta federal channel extension.
Estimated Project Cost: $10,000,000
Economics Review Summary The Port of Corpus Christi has submitted a funding request for a 15-acre backland portion of its planned La Quinta Development. Funds are supplementary to those budgeted by the Port in the larger project, the La Quinta Wharf and Rail project. Port tenants, TPCO and Voestalpine, have stated their intention to use the new terminal. The Port is seeking additional users for the facility, which will be operated by the Port. The project-related construction activity will result in the equivalent of 255,674 person-hours of direct, indirect, and induced jobs over the construction period. The project-related operating benefit will result in an unknown number of jobs, and about $16 million in direct business revenue.
Overview of the Port’s Request La Quinta is a major new terminal development for the Port which continues to be developed over time. The Port proposes to extend the planned approximately 45-acre La Quinta development for an additional 15 acres as shown in Figure 13. The facility will be used as a general cargo storage yard. The project complements and expands the capability of the $68 million, ~45-acre planned initial phase of the project.
Figure 13: Exact Backland Project Location Highlighted in Yellow
Purpose & Need Summary This summary is based upon the Port’s statements but at the date of this draft, the Port did not validate these statements. References are provided to sources of claims made in the footnotes. In some cases, the Port is assisted by support for its arguments.

TEXAS PORTS 2015 – 2016 CAPITAL PROGRAM TECHNICAL APPENDIX
PAGE 31
Summary of Purpose of & Need for the Project: The proposed cargo laydown area will be used for break-bulk cargo, military cargo, project cargo, and construction materials. Existing clients at the Port of Corpus Christi (TPCO and Voestalpine) have stated their intention to use the new terminal1. The Port believes that the development will also bring new business into the Port, especially from the upcoming TPCO project and wind turbine interest in the Corpus Christi area. Figure 14 is an excerpt taken from the Port’s 2014 TIGER grant application that further explains the use of the facility.
Figure 14: Excerpt from La Quinta Tiger Grant, Long term Outcomes Section
Summary of Need for Outside Funding: The Port of Corpus Christi is requesting external funding because it argues that the grant would help to finance multiple capital projects at once. The Port believes that it could capitalize on more general cargo opportunities with the 15-acre expansion of the existing La Quinta general cargo yard. The Port indicates that alternative funding avenues have also been considered. The Port tenants are currently unwilling to contribute funding to the project. A PAAF grant will help the Port to develop the La Quinta terminal sooner, and support general cargo growth at the Port.
Purpose of and Need for the Project – Support Documentation: The Port has forwarded the Tiger Grant purpose and need section for the teams use. The Port sees the proposed 15-acre project as an extension of the Tiger Grant project, with similar purpose and need.
Figure 15 is a second excerpt from the Tiger Grant application and identifies the expected project benefits associated with the overall La Quinta Project.
1 La Quinta Wharf and Rail Project - 2014 USDOT TIGER Discretionary Grant Program. Rep. N.p.: n.p., n.d. Web. 25 Apr. 2014.

TEXAS PORTS 2015 – 2016 CAPITAL PROGRAM TECHNICAL APPENDIX
PAGE 32
Figure 15: Excerpt from La Quinta Tiger Grant Identifying Expected Project Benefits
Need for Outside Funding: The following sections describe the supporting arguments and analysis on the Port’s behalf. Data from the Port and from public sources was applied. At this time, the Port has not had the opportunity to review the arguments.
1) At this time, the Port of Corpus Christi needs to finance multiple capital projects worth several million dollars.
As illustrated in Figure 16, projected capital project cost for the next three years at the Port of Corpus Christi is expected to be approximately $201 million. The Port is spending much more money than its annual net income on developing its capital infrastructure. The Port believes that a PAAF grant will accelerate its development to capitalize on future business opportunities as stated in the Port’s 2014
TIGER grant application.
Figure 16: Capital Expenditure of the Port of Corpus Christi Is Projected to Exceed Its Annual Net Income

TEXAS PORTS 2015 – 2016 CAPITAL PROGRAM TECHNICAL APPENDIX
PAGE 33
Overall Analysis of Port Arguments In this section, the Port’s arguments are summarized into standard categories and evaluated.
Standard Arguments:
1) Funding Argument: The Port seeks funding to accelerate development of the project. Without funding, the particular development area will take longer to develop and may constrain cargo growth.
2) Business Argument: The overall project represents a strong economic addition to port facilities. Strong growth in the oil and gas industry is expected to generate related general cargo handling needs. There is also long-term potential for other cargo uses at the facility. Since the Port expects to operate the facility, it must lead the funding effort.
3) Self-sustaining Argument: As long as the facility is utilized, the ongoing maintenance costs will be supported by cargo revenue.
4) Catalyst Argument: Not applicable.
5) Access Argument: Not applicable. The funded project is not an access project. The funded project has good access.
6) Growth Argument: The existing general cargo dock has very limited backland space, and this limits the potential tenants that could use it. This facility will be supplanted by the construction of the new Harbor bridge in the same area. La Quinta will become the only public general cargo facility in the Port. This facility has expansion area to enable future growth.
7) Port Readiness: The Port is prepared to proceed because it has obtained a NEPA permit, a benefit cost analysis, and a preliminary engineering report. The remainder of the wharf and backland project is approved. There is excellent access to the site. The Port has adequate staff to manage the project.
Economic Impacts Analysis Summary The economic impact analysis focuses on the impacts of developing and constructing an additional 15 acres of cargo laydown area in the La Quinta uplands for general cargo throughput at the Port of Corpus Christi. The project does not identify new or additional tonnage at the current time for these 15 acres. The Port intends to meet the needs of its future plans, and the demands and constraints of the industry. The onset of construction of the new harbor bridge is a sample constraint.
The project creates one-time impacts of the construction activity associated with the project. Impacts are estimated in terms of jobs, personal earnings, business revenue, and state and local taxes. The baseline impacts of the Port of Corpus Christi were developed in 2012 as part of the economic impact analysis of the State of Texas Port and Maritime Transportation System for the Texas Ports Association.
The construction of 15 acres of general cargo storage yard, access road extension, and utility and security improvements at the La Quinta Gateway Terminal of the Port of Corpus Christi is projected to cost $10 million. These economic impacts are identified in

TEXAS PORTS 2015 – 2016 CAPITAL PROGRAM TECHNICAL APPENDIX
PAGE 34
Table 7

TEXAS PORTS 2015 – 2016 CAPITAL PROGRAM TECHNICAL APPENDIX
PAGE 35
Table 7: Economic Impacts Generated by Construction Activity
Note: Totals may not add due to rounding
The $10 million construction impact creates approximately 82,000 person-hours of potential employment. Approximately 80,577 induced person-hours are created as a result of local purchases by the individuals who are directly related to the construction activity. An additional 93,097 indirect person-hours were supported by $4.2 million of purchases in the local and regional economy by the firms providing direct construction activity services.
The income impact is estimated by multiplying the average annual earnings (excluding benefits) by the corresponding number of direct jobs. The individual annual earnings multiplied by the corresponding job impact resulted in $1.5 million in personal wage and salary earnings. The impact of the re-spending of this direct income for local purchases is estimated using a personal earnings multiplier. The personal earnings multiplier is based on data supplied by the Bureau of Economic Analysis (BEA), Regional Input-Output Modeling System (RIMS II). The personal earnings multiplier was used to estimate the total income and consumption impact of $4.3 million, inclusive of the re-spending and local consumption impact. This additional re-spending of the direct income generates the 80,577 induced person-hours impact. The 93,097 indirect person-hours earned $2.2 million in indirect wages and salaries. Combining the direct, induced, and indirect personal income impacts, the total income impact is $8.0 million.
Construction activity of the 15 acres at the La Quinta Gateway Terminal will generate $0.6 million of state and local taxes.
CORPUS CHRISTI Construction
Total Construction Value $10,000,000
JOBS (Person hours)
Direct 82,000
Induced 80,577
Indirect 93,097
PERSONAL INCOME
Direct $1,492,400
Re-spending/Local Consumption $4,298,261
Indirect $2,248,510
TOTAL $8,039,171
LOCAL PURCHASES $4,243,632
STATE AND LOCAL TAXES $635,095
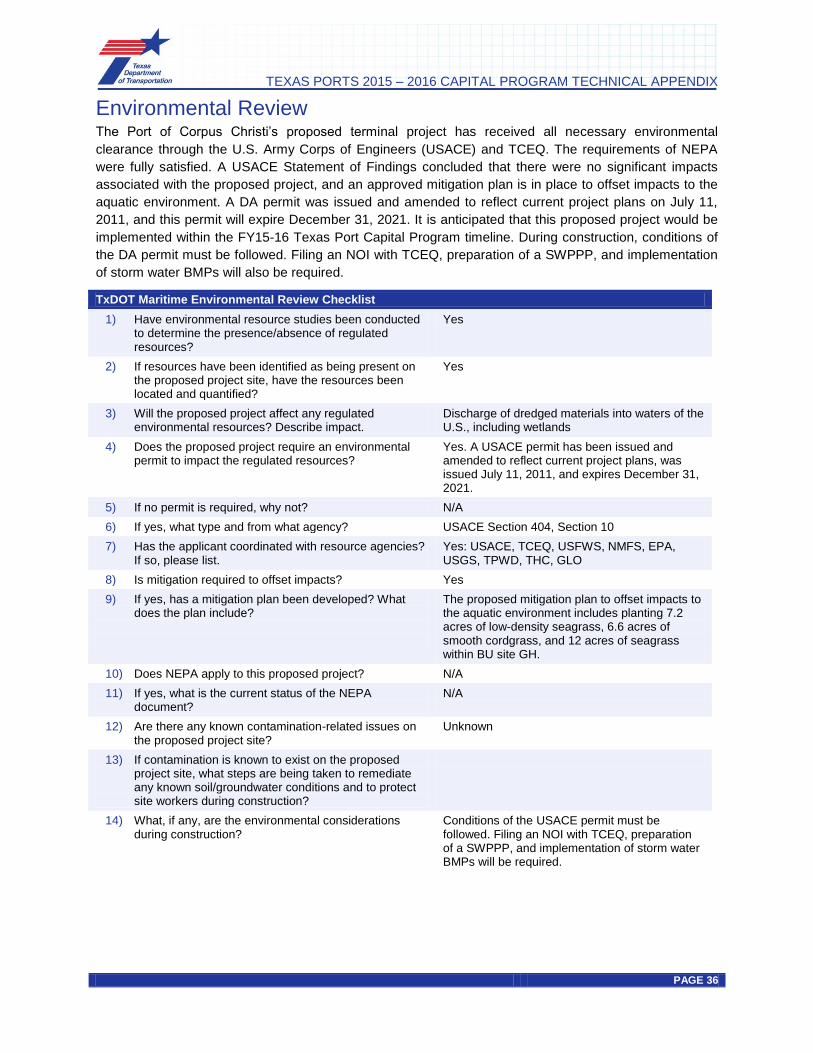
TEXAS PORTS 2015 – 2016 CAPITAL PROGRAM TECHNICAL APPENDIX
PAGE 36
Environmental Review The Port of Corpus Christi’s proposed terminal project has received all necessary environmental clearance through the U.S. Army Corps of Engineers (USACE) and TCEQ. The requirements of NEPA were fully satisfied. A USACE Statement of Findings concluded that there were no significant impacts associated with the proposed project, and an approved mitigation plan is in place to offset impacts to the aquatic environment. A DA permit was issued and amended to reflect current project plans on July 11, 2011, and this permit will expire December 31, 2021. It is anticipated that this proposed project would be implemented within the FY15-16 Texas Port Capital Program timeline. During construction, conditions of the DA permit must be followed. Filing an NOI with TCEQ, preparation of a SWPPP, and implementation of storm water BMPs will also be required.
TxDOT Maritime Environmental Review Checklist 1) Have environmental resource studies been conducted
to determine the presence/absence of regulated resources?
Yes
2) If resources have been identified as being present on the proposed project site, have the resources been located and quantified?
Yes
3) Will the proposed project affect any regulated environmental resources? Describe impact.
Discharge of dredged materials into waters of the U.S., including wetlands
4) Does the proposed project require an environmental permit to impact the regulated resources?
Yes. A USACE permit has been issued and amended to reflect current project plans, was issued July 11, 2011, and expires December 31, 2021.
5) If no permit is required, why not? N/A 6) If yes, what type and from what agency? USACE Section 404, Section 10 7) Has the applicant coordinated with resource agencies?
If so, please list. Yes: USACE, TCEQ, USFWS, NMFS, EPA, USGS, TPWD, THC, GLO
8) Is mitigation required to offset impacts? Yes 9) If yes, has a mitigation plan been developed? What
does the plan include?
The proposed mitigation plan to offset impacts to the aquatic environment includes planting 7.2 acres of low-density seagrass, 6.6 acres of smooth cordgrass, and 12 acres of seagrass within BU site GH.
10) Does NEPA apply to this proposed project? N/A 11) If yes, what is the current status of the NEPA
document? N/A
12) Are there any known contamination-related issues on the proposed project site?
Unknown
13) If contamination is known to exist on the proposed project site, what steps are being taken to remediate any known soil/groundwater conditions and to protect site workers during construction?
14) What, if any, are the environmental considerations during construction?
Conditions of the USACE permit must be followed. Filing an NOI with TCEQ, preparation of a SWPPP, and implementation of storm water BMPs will be required.

TEXAS PORTS 2015 – 2016 CAPITAL PROGRAM TECHNICAL APPENDIX
PAGE 37
TxDOT Maritime Environmental Review Checklist 15) Describe the project’s environmental benefits. Long-term positive impacts are expected to
occur from the BU efforts of the Corpus Christi Ship Channel, including the creation of seagrass, marsh and shallow water habitat, which will increase the nursery habitat for finfish, shrimp, and benthic organisms.
16) What is the anticipated project delivery schedule? Environmental clearance/permitting for this project fall within the FY15-16 Texas Ports Capital Program delivery schedule.
17) What recommendations do you have for the applicant to efficiently proceed with the proposed project?
Local building permits (city, county) may be required.
Engineer Review The Port provided nine drawings consisting of general plan views of the overall project that includes the general storage cargo yard expansion. Detailed engineering, drawings, specifications, and construction costs were not available.
It was assumed that the yard and access road would be constructed with concrete pavement. The yard would include a storm water system, water and sanitary lines, lighting system, and electrical services.

TEXAS PORTS 2015 – 2016 CAPITAL PROGRAM TECHNICAL APPENDIX
PAGE 38

TEXAS PORTS 2015 – 2016 CAPITAL PROGRAM TECHNICAL APPENDIX
PAGE 39

TEXAS PORTS 2015 – 2016 CAPITAL PROGRAM TECHNICAL APPENDIX
PAGE 40

TEXAS PORTS 2015 – 2016 CAPITAL PROGRAM TECHNICAL APPENDIX
PAGE 41
Cost Estimate A cost estimate was prepared based on preliminary layouts provided by the Port of Corpus Christi. TxDOT 3 and 12 month moving average unit prices along with previous project type experience was used in developing the cost estimate. A 15% construction contingency has been added but no escalation contingencies have been included.
The cost estimate was developed without any specialty design service information. These services include geotechnical reports, drainage impacts, utility investigations, environmental impacts and survey information. An increase in the cost of the overall project is indicated but based on regional construction rates and associated contingencies; it is within the range of the Port's original $10M estimate.
Schedule Based on a review of the documents provided by the Port of Corpus Christi, the engineering phase appears to be in the preliminary phase. The drawings and technical specifications required for the proposed project would require approximately 2 to 4 months. A two-month bidding phase and construction duration of four to six months is anticipated for a project of this scope. Conservatively, this project could be completed in 12-14 months.

TEXAS PORTS 2015 – 2016 CAPITAL PROGRAM TECHNICAL APPENDIX
PAGE 42
Port of Galveston Project Description: The Port of Galveston proposes a construction project to expand Cruise Terminal 2. This expansion project includes a two-story, sixty thousand square-foot (60,000 SF) addition that will be added to Cruise Terminal 2. This will increase capacity for current customers and accommodate larger cruise ships that will sail out of Galveston. The new addition will be used primarily for passenger embarkation and will include a screening area, a check-in area, and a seating area. Also, as part of this project, the existing terminal facilities will be renovated and remodeled to increase accommodations for passenger disembarkation services including baggage lay down and an increased size of the baggage screening area. Cruise Terminal 2 is currently approximately ninety - thousand square feet (90,000SF). The additional new area will bring the total area to approximately one hundred - fifty thousand square feet (150,000 SF).
Estimated Project Cost: $13,050,000
Economics Review Summary The Port of Galveston has submitted a request for funding support for an expansion of the Cruise Terminal 2. Galveston is currently the fifth largest cruise homeport in the U.S. and to keep pace with the cruise lines’ demands for more terminals and the industry growth, this expansion is needed. If funding is provided for this project, the Port will be able to accommodate a larger cruise ship (currently scheduled to be deployed to Galveston) and a fourth cruise ship to be home ported year round in Galveston. The Port requests funding support because current Port revenues are insufficient to pay for the expansion. This document provides a summary of the Port’s arguments as well as an evaluation of the Port’s request and
supporting documentation.
Overview of the Port’s Request Due to larger than expected ships, the Port of Galveston must expand the existing Cruise Terminal 2 building to accommodate more passengers. The work includes the construction of a two-story addition to the building of approximately 60,000 sq. ft., including passenger queuing, screening, check-in, and seating. The proposed facilities include:
Larger passenger check-in and waiting areas
Escalators and elevators
Improved circulation for passenger flow
Increased square footage for baggage lay down and security screening areas
Figure 17: Project Location

TEXAS PORTS 2015 – 2016 CAPITAL PROGRAM TECHNICAL APPENDIX
PAGE 43
Purpose & Need Summary
Figure 18: Overhead View of the Proposed Cruise Terminal 2 Expansion, Shown in Blue
The blue area of the rendering shows the massing of the proposed Cruise Terminal 2 expansion on the site.
The Port of Galveston must expand the Cruise Terminal 2 to fulfill the growing needs of existing cruise lines customers. These cruise lines have stated their intention and signed agreements for ship call increases. The cruise lines will offer additional cruises and homeport an additional ship, offer new itineraries (eastern Caribbean and Panama Canal), as well as bring larger vessels to the Port. The infrastructure must accommodate their expanding business. The expansion project will bring benefits to the Port, the local community, the federal government, and the State of Texas by generating more revenue, taxes, and jobs.
Summary of Need for Outside Funding: The Port of Galveston is seeking outside funding to accelerate needed expansion to Cruise Terminal 2. The PORT has no taxing authority through which it can raise funds for this project. The Port is considering multiple avenues to fund the required infrastructure projects. The Port cannot secure more loans or bonds without exceeding the state permitted revenue-debt ratio. The Port Access Account Fund is attractive because it enables the Port to fund the proposed project without exceeding the permitted ratio. A delay in funding will delay project developments, related job impacts, and other benefits to the State. Supporting arguments and analysis on behalf of the Port are presented in the following sections. Data was applied from the Port and from public sources.
Purpose and Need for the Project – Support Documentation In this section, the Port of Galveston provides supporting evidence to reinforce its arguments for the purpose of and need for the project. Each of the arguments in bold was developed to demonstrate relevant evidence that the proposed project is important and rational. There is strong national and regional cruise growth, and cruise lines continue to experience strong demand for cruises from Galveston.

TEXAS PORTS 2015 – 2016 CAPITAL PROGRAM TECHNICAL APPENDIX
PAGE 44
Figure 19: Annual Cruise Growth in Galveston is Double Annual National Cruise Growth1
Figure 19 illustrates that the Port of Galveston grew at 15.2% annually during 2008-2012 compared to a national growth of 7.7%. In 2012, the Port’s passenger traffic accounted for 7% of the total passengers in North America in 2012. Existing Galveston-based cruise lines, i.e. Royal Caribbean Cruise Lines and Carnival Cruise Lines, have expressed their intention to bring respectively a larger cruise vessel and an additional ship into the Port. Disney Cruise Lines has also said that it will return for more sailings if space is available. Fulfilling these needs will promote the Port’s growth to accommodate an additional 280,000
passengers annually.
1) The expansion of Cruise Terminal 2 is a high-profile project for the State of Texas because the Port of Galveston is the fifth busiest cruise homeport in the USA and brings substantial revenue to Galveston.
Figure 20: Port of Galveston Is Ranked Fifth Nationally for Passenger Volume
According to industry data as reflected in Figure 20, the Port of Galveston is the busiest cruise terminal in the State of Texas and the fifth-ranked in the U.S. The PAAF grant would enable the Port to keep one of the top tourist destinations in Texas competitive on the national level.

TEXAS PORTS 2015 – 2016 CAPITAL PROGRAM TECHNICAL APPENDIX
PAGE 45
2) The expansion of Cruise Terminal 2 will generate more jobs for the local community.
Table 8: Direct Long-Term Job Impact at the Port of Galveston
The Port estimates that the expansion of Cruise Terminal 2 will create a total of 147 long-term jobs, between larger Carnival and Royal Caribbean ships.
3) The expansion of Cruise Terminal 2 will promote the local economy and bring in additional tax revenue for the State of Texas.
Figure 21: Visitor Spending in Galveston Grows with Cruise Traffic
Based on the current passenger drive/fly-in ratio, the Port will be able to attract respectively 3,551 and 7,458 additional fly-in passengers in 2015 and 2016. As illustrated in Figure 21, additional visitors will bring positive impacts to other economic sectors in Galveston. Specifically, the new Royal Caribbean Freedom Class ship “Liberty” is a modern luxury seven-day cruise ship that will draw passengers from throughout North America and internationally; not just Texans. As economic activities increase, the federal, state, and local governments also benefit from increased tax revenue. Table 9 shows US$ 9.1 million or 7.2% increase in tax revenue in 2013 when compared to 2012.

TEXAS PORTS 2015 – 2016 CAPITAL PROGRAM TECHNICAL APPENDIX
PAGE 46
Table 9: Government Tax Revenue Increases as Visitor Spending in Galveston Grows
Need for Outside Funding Support Documentation In this section, the Port of Galveston provides supporting evidence to reinforce its arguments about the need for external funding for the project:
1) The Port could not secure bonds/loans without exceeding the state permitted revenue-debt ratio.
Figure 22: PAAF Grant Will Impact the Long Term Obligations for the Port of Galveston
The Port believes that the PAAF grant will allow the Port to expand Cruise Terminal 2 by increasing long-term obligations by only $6.5 million instead of $13 million without the grant. The grant will allow the Port to develop without overextending its bonding capacity.
2012 2013
Personal Income 17.0 18.6
Corporate 23.7 24.4
Indirect Bus iness 4.3 4.5
Socia l Securi ty 22.0 24.9
Sales 18.0 18.8
Lodging 7.8 8.5
Socia l Securi ty 0.9 1.0
Sales 5.8 6.0
Lodging 11.7 12.7
Excise and Fees 1.7 1.7
Property 13.9 14.8
126.9 136.0
Local
Total
Source: Tourism Economics , Galveston Park Board of Trustees
Tourism-Generated Tax Revenues (US$ Mi l l ions)
Year
Government Level Tax Type
Federal
State

TEXAS PORTS 2015 – 2016 CAPITAL PROGRAM TECHNICAL APPENDIX
PAGE 47
2) Despite the lack of capital project funds, the Port will generate enough revenue to maintain the existing infrastructure.
Figure 23: The Total Annual Revenue of the Port of Galveston Could Cover the Maintenance & Operations Expense
Figure 23 illustrates that although a significant cost, the maintenance of existing infrastructure has historically been within the Port’s capability given its total annual revenue. In 2013 for example, the
maintenance & operations expense was 28.5% of the total annual revenue of the Port. So, it is expected that the Port will be able to cover the incurred maintenance & operations expense after the expansion of Cruise Terminal 2.
Overall Analysis of Port Arguments In this section, the Port’s arguments are summarized into standard categories and evaluated.
Standard Arguments:
1) Funding Argument: Without PAAF funding, the Port will have to secure more loans and bonds. This funding mechanism may overextend the Port’s bonding capacity, and may exceed the state permitted revenue-to-debt ratio.
2) Business Argument: The project will help heighten Galveston’s profile as a tourist destination in
Texas, accommodate 280,000 additional passengers annually, bring parking revenues, and create ILA and other shore side jobs. The Port of Galveston also brings a unique perspective in the port industry that directly impacts tourism and benefits the State of Texas ($41.2 million in tourism results from cruise business).
3) Self-sustaining Argument: The cruise revenue of the Port is enough to maintain the infrastructure but will not permit infrastructure expansion. Cruise companies have committed to use the cruise terminal through 2022 once it is expanded.
4) Catalyst Argument: With PAAF funding, the Port could fund other cruise-related projects to improve terminal operation.
5) Access Argument: The project will enable the cruise lines currently calling at Galveston to deploy larger passenger capacity ships and additional ships to make more calls each year. The Port has started traffic studies to improve its roadway access, especially during peak periods and especially on Sundays.

TEXAS PORTS 2015 – 2016 CAPITAL PROGRAM TECHNICAL APPENDIX
PAGE 48
6) Growth Argument: The project will help secure more cruises and larger ships from the cruise lines as shown by their submission of written letters of agreement and intent.
7) Port Readiness: The Port has appointed AECOM as an independent reviewer to oversee the design-build process with the procurement phase to be completed within a few weeks of this report; and permits are readily available.
Figure 24: Artist Rendering of Cruise Terminal Expansion
Economic Impacts Analysis Summary The analysis focuses on the impacts created by the expansion and modernization of Cruise Terminal 2 at the Port of Galveston to support the bigger cruise ships and more frequent cruise sailings by two cruise lines – Royal Caribbean and Carnival Cruise Lines. The commitments by both cruise lines, as well as sailings by Disney Cruise Lines, are contingent on the Port’s ability to complete the expansion. In addition, one-time impacts of the construction activity associated with the expansion of Cruise Terminal 2 are also generated. Impacts are estimated in terms of jobs, personal earnings, business revenue, and state and local taxes; and include impacts of the visitor industry. The baseline impacts of the Port of Galveston were developed in 2012 as part of the economic impact analysis of the State of Texas Port and Maritime Transportation System for the Texas Ports Association.
Based on data provided by the Port of Galveston, in 2016, 78 sailings will be a direct impact of the
expansion of Cruise Terminal 2, representing approximately 280,000 passengers. The economic impacts
generated by the expansion of the cruise terminal to support the bigger cruise ships and the more
frequent sails are summarized in Table 10.

TEXAS PORTS 2015 – 2016 CAPITAL PROGRAM TECHNICAL APPENDIX
PAGE 49
Table 10: Summary of the Economic Impacts Generated by Port of Galveston
Note: Totals may not add due to rounding
As Table 10 indicates, Port of Galveston will generate the following economic impacts for the local and regional economy, including the visitors industry, after the project has been completed.
Approximately 280,000 additional passengers will be a result of commitments by two cruise lines to offer bigger cruise ships and more frequent sailings with the completion of the expansion of Cruise Terminal 2.
1,165 total jobs are generated by the additional passengers at the Port of Galveston. These include:
o 960 seaport and airport jobs
483 direct jobs
232 induced jobs
245 indirect jobs
o 205 visitor industry jobs
99 direct jobs
46 induced jobs
60 indirect jobs
$52.1 million of direct, induced, indirect wages and salaries, and local consumption expenditures are generated by the additional passengers at the Port of Galveston.
Businesses providing services at the cruise terminal received nearly $184.5 million of revenue.
$3.9 million of state and local taxes were generated by this activity.
GALVESTON Impact Visitors Total
Additional Sailings at CT2 in 2016 78
JOBS
Direct 483 99 582
Induced 232 46 278
Indirect 245 60 305
TOTAL 960 205 1,165
PERSONAL INCOME ($ Thousands)
Direct $10,002 $2,120 $12,123
Re-spending/Local Consumption $24,492 $5,520 $30,013
Indirect $7,993 $1,992 $9,985
TOTAL $42,488 $9,633 $52,121
Direct Business Revenue ($ Thousands) $170,731 $13,811 $184,542
Local Purchases ($ Thousands) $13,278 $2,558 $15,836
STATE AND LOCAL TAXES ($ Thousands) $3,175 $749 $3,923

TEXAS PORTS 2015 – 2016 CAPITAL PROGRAM TECHNICAL APPENDIX
PAGE 50
In addition, the expansion of Cruise Terminal 2 will create one-time economic impacts during the construction phase. The anticipated project cost is $13.05 million. Construction impacts are estimated in terms of jobs, personal earnings, business revenue, and state and local taxes. These economic impacts are identified in Table 11.
Table 11: Economic Impacts Generated by Construction Activity
Note: Totals may not add due to rounding
The $13.05 million construction impact creates approximately 107,000 person-hours. Approximately 105,153 induced person-hours are created as a result of the local purchases of the individuals directly generated by the construction activity. An additional 135,800 indirect person-hours were supported by $5.9 million of purchases in the local and regional economy by the firms providing direct construction activity services.
The income impact is estimated by multiplying the average annual earnings (excluding benefits) by the corresponding number of direct jobs. The individual annual earnings multiplied by the corresponding job impact resulted in $1.9 million in personal wage and salary earnings. The impact of the re-spending of this direct income for local purchases is estimated using a personal earnings multiplier. The personal earnings multiplier is based on data supplied by the Bureau of Economic Analysis (BEA), Regional Input-Output Modeling System (RIMS II). The personal earnings multiplier was used to estimate the total income and consumption impact of $5.6 million, inclusive of the re-spending and local consumption impact. This additional re-spending of the direct income generates the 105,153 induced person-hours impact. The 135,794 indirect person-hours earned $3.1 million in indirect wages and salaries. Combining the direct, induced, and indirect personal income impacts, the total income impact is $10.7 million.
Construction activity of the expansion of Cruise Terminal 2 generates $0.8 million of state and local taxes.
GALVESTON Construction
Total Construction Value $13,050,000
JOBS (Person hours)
Direct 107,010
Induced 105,153
Indirect 135,794
PERSONAL INCOME
Direct $1,947,582
Re-spending/Local Consumption $5,609,231
Indirect $3,137,318
TOTAL $10,694,131
LOCAL PURCHASES $5,941,583
STATE AND LOCAL TAXES $844,836

TEXAS PORTS 2015 – 2016 CAPITAL PROGRAM TECHNICAL APPENDIX
PAGE 51
Environmental Review The proposed cruise terminal expansion at the Port of Galveston involves expansion and remodel of an existing facility within an industrial footprint, and there will be no impacts to regulated resources. During construction, the Port must comply with all regulations and permits relating to storm water quality. Benefits for this project are socio-economic in nature, stimulating the local economy through revenue generation and job creation.
TxDOT Maritime Environmental Review Checklist 1) Have environmental resource studies been conducted
to determine the presence/absence of regulated resources?
Yes
2) If resources have been identified as being present on the proposed project site, have the resources been located and quantified?
No
3) Will the proposed project affect any regulated environmental resources? Describe impact.
No
4) Does the proposed project require an environmental permit to impact the regulated resources?
No
5) If no permit is required, why not? The project involves expansion of an existing facility within an industrial footprint. There will be no impacts to regulated resources.
6) If yes, what type and from what agency? 7) Has the applicant coordinated with resource agencies?
If so, please list. No
8) Is mitigation required to offset impacts? No 9) If yes, has a mitigation plan been developed? What
does the plan include?
10) Does NEPA apply to this proposed project? No 11) If yes, what is the current status of the NEPA
document?
12) Are there any known contamination-related issues on the proposed project site?
13) If contamination is known to exist on the proposed project site, what steps are being taken to remediate any known soil/groundwater conditions and to protect site workers during construction?
Unknown
14) What, if any, are the environmental considerations during construction?
Comply with all regulations and permits relating to storm water quality.
15) Describe the project’s environmental benefits. Socio-economic benefits (job creation, revenue generation for local economy)
16) What is the anticipated project delivery schedule? Environmental clearance/permitting for this project fall within the FY15-16 Texas Ports Capital Program delivery schedule.
17) What recommendations do you have for the applicant to efficiently proceed with the proposed project?
Comply with all regulations and permits relating to storm water quality. Coordinate with local entities (city, county) relating to building permits.

TEXAS PORTS 2015 – 2016 CAPITAL PROGRAM TECHNICAL APPENDIX
PAGE 52
Engineer Review The Port has elected to use a design-build acquisition strategy for this project. Under this strategy, it is typical for the project owner to provide general requirements for the project and then the design-build team develops the technical details simultaneously with construction. Therefore, detailed design and cost estimation documents were not available to review at the time of this report.
Proposed Design and Technical Review Scope
Since typical construction drawings and technical specifications were not available, the early stage concept drawing for the terminal was evaluated. The drawing also describes the passenger and baggage flow within the terminal (see Figure 25). These drawings enabled the development of some assumptions about the overall project which aided in the project cost analysis.
Figure 25: Conceptual Drawing of Expanded and Modified Cruise Terminal 2 Building
Cost Estimate The Port's consultant AECOM provided a preliminary cost estimate for the CT2 expansion project which was approximately $9,130,000 in 2013 dollars. This estimate corresponds to approximately $152 per square feet of the cruise terminal. Table 12 provides a summary of the cost for major work items provided by the Port. After factoring in design costs, material testing, construction management and contingencies
the Port estimated the overall cost at 13,050,000. .
Due to the absence of detailed project information, a comparative cost estimate was conducted by collecting published cost data on several recent cruise terminal expansion projects around the world. Table 12 below summarizes these projects' total costs and cost per square feet of the building. Average cost of the cruise terminal project is around $423 per square foot, whereas the cost of the proposed project is approximately $217per square foot, once design costs, material testing, etc. are factored in.

TEXAS PORTS 2015 – 2016 CAPITAL PROGRAM TECHNICAL APPENDIX
PAGE 53
The Port’s original construction estimates and scope of work were confirmed and reviewed through comparative analysis methodology. The Port was familiar with the reviewed projects and explained that the Port of New York, New Jersey, San Diego, and San Francisco terminals were designed as luxury facilities that provided additional shopping and event venues to enhance their respective waterfront areas. The Galveston concept is very basic and focuses the attention of the cruise passenger on the ship and cruise experience and not on the port. Many of these projects also included costly wharf improvements that are not required in the Galveston scope of work.
A local architecture firm verified regional costs associated with this type construction. The AE estimated a cost between $225 and $250 per square foot for this type of project in this region. Once regional construction costs were considered, this range was close to the two recent cruise terminals expansion projects at Port Canaveral.
The team concurs, based on this review, that the $13,050,000 planning estimate requested by the Port in the original application is acceptable.
Table 12: Summary of Port-provided Cost Estimate
Table 13: Cost of Representative Cruise Terminal Building Projects
Cruise Terminal Location Year Built
Square Footage
Reported Cost (USD)
Unit Cost (2014 USD/SF)
Galveston Cruise Terminal
Galveston, Texas, US
2014* 60,000 $9,130,000 $152
Toronto Intl. Marine Terminal
Toronto, Ontario, Canada
2005 38,000 $8,000,000 $281
San Diego Cruise Terminal
San Diego, California, US
2010 52,000 $17,400,000 $379
Port Canaveral Cruise Terminal 6
Canaveral, Florida, US
2012 90,000 $26,600,000 $301
Kai Tak Cruise Terminal
Kai Tak, Hong Kong, China
2013 1,546,000 $618,000,000 $429
Bayonne Cruise Terminal
Bayonne, New Jersey, US
2014 96,000 $55,000,000 $573
Port Canaveral Cruise Terminal 1
Canaveral, Florida, US
2014 180,000 $50,000,000 $278
Item Description Total Cost ($)*
1 Demolition 254,000$
2 Structural Concrete 1,430,107$
3 Structural Steel Building 2,120,300$
4 Interior Finishes 3,810,495$
5 Plumbing 200,000$
6 Electrical 645,000$
7 HVAC 550,000$
8 Fire Supression 120,000$
TOTAL 9,129,902$
*) 2013 dollars.

TEXAS PORTS 2015 – 2016 CAPITAL PROGRAM TECHNICAL APPENDIX
PAGE 54
Cruise Terminal Location Year Built
Square Footage
Reported Cost (USD)
Unit Cost (2014 USD/SF)
San Francisco Cruise Terminal
San Francisco, California, US
2014 88,000 $63,500,000 $722
*Proposed Construction Year
Average Unit Cost $423 (excluding Galveston)
Schedule The Port has not developed a schedule for the completion of the proposed project. Using a design build acquisition strategy, 18-24 months is reasonable for construction of the cruise terminal expansion project.
Port of Houston Project Description: The proposed project is the construction of approximately 9,600 linear feet of new single track rail line from near the intersection of the existing Union Pacific Railroad Road right of way at Red Bluff Rd. to the proposed Bayport Terminal Intermodal Yard. The project will include three at-grade crossings with signalization at SH 146 and Old SH 146, plus modification to switches and turnouts for tying into the existing mainline, and for future expansion. The project also includes approximately 1,200 linear feet of sound wall.
Estimated Project Cost: $12,950,000
Economics Review Summary The Port of Houston has submitted a request for a rail spur extension to the Bayport Terminal. The Port’s
argument for purpose and need includes the potential growth of container cargo and development of new warehouse business. The Port requests funding support to accelerate terminal development. This document provides a summary of the Port’s arguments as well as an evaluation of the Port’s request and
supporting documentation. The project-related construction activity of $12.95 million at the Port of Houston will generate 338,719 person-hours of direct, induced and indirect jobs, as well as $13 million of direct business revenue to the firms providing services during the duration of the construction period. Approximately 20,000 TEUs of new business is forecasted to be generated by the construction project, resulting in operating impacts of 164 direct, induced and indirect jobs and $9.7 million in direct business revenue.
Overview of the Port’s Request The proposed 9,600 linear-foot Bayport rail spur extension will span from near the intersection of the existing UPRR ROW at Red Bluff Road to the proposed Bayport Terminal Intermodal Yard. The project will also include three at-grade crossings at SH146 and Old SH146, modification to switches, and 1,200 linear feet of sound wall. The project will bring new tenants into the terminal and expand shipment of container cargo in Houston.
Reference: Port’s PCP Request

TEXAS PORTS 2015 – 2016 CAPITAL PROGRAM TECHNICAL APPENDIX
PAGE 55
Figure 26: Project Location
Figure 27: Enlarged Plan View of Proposed Bayport Rail Spur Extension
Purpose & Need Summary This summary is based upon the Port’s statements but as of the date of this draft, the Port has not validated these statements. References are provided to sources of claims made in the footnotes. In some cases, the Port is assisted in support for its argument.
Summary of Purpose of the Project The Bayport rail spur extension project will accelerate the warehouse development portion of the Bayport Container Terminal master plan. The rail spur will incentivize the growth of container cargo, possible new tenants, and potential new warehouse business in the Port of Houston. The project will also facilitate container cargo movement via intermodal access to warehouses at the Port before the cargo is trucked to the terminal for export. The project is estimated to cost $12.95 million.
Summary of Need for Outside Funding: The Port of Houston is requesting outside funding that would help it finance multiple capital projects simultaneously, as it currently has many capital projects worth billions of dollars queuing up to be financed and executed. According to the Port, there are many proposed capital investments ahead of the Bayport rail spur extension project. A PAAF grant will enable the Port to accelerate completion of the Bayport rail spur project, attract a new tenant, and promote container cargo growth in Houston.

TEXAS PORTS 2015 – 2016 CAPITAL PROGRAM TECHNICAL APPENDIX
PAGE 56
Purpose of and Need for the Project – Support Documentation: In this section, the Port of Houston provides supporting evidence to reinforce its arguments for the purpose of and need for the project:
1) The Port of Houston needs to improve its current infrastructure to attract new warehouse business and to attract an extra 20,000 TEUs of container cargo for export at the Bayport Terminal.
The project will allow container cargo to move by rail to the proposed warehouses. Containers will then be trucked to the Bayport Terminal for export. The Port claims that it has three potential new tenants interested in utilizing the Bayport rail spur extension to move approximately 20,000 TEUs of containers for export annually at the Bayport Container Terminal. Due to confidentiality concerns, the Port will not release details about these new tenants until procurement issues are settled.
Need for Outside Funding – Support Documentation: Supporting arguments and analysis on behalf of the Port are presented in the following sections. Data was applied from the Port and from public sources. At this time, the Port has not yet had the opportunity
to review these arguments prepared by the team.
1) The Port of Houston needs to finance multiple capital projects worth several billion dollars.
Figure 28: The Port of Houston Cannot Fund All Capital Projects Scheduled For 2013-2018
As illustrated in Figure 28, the Port of Houston has noted that it currently has a lot of proposed capital investments ahead of the Bayport rail spur extension project. Tenant interest advanced and motivated this development but the Port could not quickly allocate funding to the project at the time. A PAAF grant will allow the Port to accelerate the Bayport intermodal development and encourage growth of container cargo in Houston in the near-term.

TEXAS PORTS 2015 – 2016 CAPITAL PROGRAM TECHNICAL APPENDIX
PAGE 57
Overall Analysis of Port Arguments In this section, the Port’s arguments are summarized into standard categories and evaluated.
Standard Arguments:
1) Funding Argument: The Port has many capital projects and they compete for its funds. The Port seeks funding for this project to accelerate development. Without outside funding, the Port would still develop the project but at a later date. No other funding sources have been found for this project.
2) Business Argument: The project will help secure up to three new tenant opportunities (confidential for now). A service agreement with a mainline railroad has been achieved.
3) Self-sustaining Argument: It is expected that the Port will be able to maintain the proposed improvements through revenues from tenants that will rely on the rail.
4) Catalyst Argument: The project will accelerate the completion of the Bayport master plan at will enable the Port to market properties to tenants in the area that require rail. Therefore, the project is a catalyst for development of other projects in the area.
5) Access Argument:
a) The project will free up roadway network and inter-city traffic by reducing truck traffic.
b) The project will accelerate access to the intermodal yard for container export.
6) Growth Argument: The project will hasten warehouse development; adding 20,000 TEUs. An important cargo tenant prospect (import/export business) will bring cargo to the Port.
7) Port Readiness: The Port has completed a cost estimation, full environmental clearance, and preliminary design work (in RFQ). Permitting depends on USACE evaluation.
8) Other: The City of Seabrook supports the development of rail in the location and has an agreement with the Port.
Economic Impacts Analysis Summary The economic impact analysis focuses on the impacts created by the construction of 9,600 linear feet of new single track rail line to the proposed Bayport Terminal Intermodal Yard at the Port of Houston to support a new demand of 20,000 TEUs and potential for additional opportunities. Additionally, one-time impacts of construction activity associated with the project are also generated. Impacts are estimated in terms of jobs, personal earnings, business revenue, and state and local taxes. The baseline impacts of the Port of Houston were developed in 2012 as part of the economic impact analysis of the State of Texas Port and Maritime Transportation System for the Texas Ports Association.
Based on data provided by the Port of Houston, there is significant demand for approximately 20,000 new TEUs annually. The new tenant will bring in the container volume via rail to a warehouse at the terminal and will then truck it to the terminal for export. The economic impacts generated by the single rail line project are summarized in Table 14.

TEXAS PORTS 2015 – 2016 CAPITAL PROGRAM TECHNICAL APPENDIX
PAGE 58
Table 14: Summary of the Economic Impacts Generated by Port of Houston
Note: Totals may not add due to rounding
As Table 14 indicates, the Port of Houston will generate the following economic impacts for the local and regional economy as a result of the 20,000 additional TEUs that will be handled after the rail line project is completed.
164 total jobs are generated by the movement of the additional 20,000 TEUs at the Port of Houston. These include:
o 58 direct jobs
o 70 induced jobs
o 36 indirect jobs
$12.5 million of direct, induced, indirect wages and salaries, and local consumption expenditures are generated by the additional 20,000 TEUs at the Port of Houston.
Businesses providing services at the terminal received nearly $9.7 million of revenue, excluding the value of cargo shipped through the terminal.
Nearly $1.0 million of state and local taxes were generated by this activity.
Additionally, the construction of the single track rail line will create one-time economic impacts during construction. The anticipated project cost is $12.95 million. Construction impacts are estimated in terms of jobs, personal earnings, business revenue, and state and local taxes. These economic impacts are identified in Table 15.
HOUSTON Impact
Container TEUs 20,000
JOBS
Direct 58
Induced 70
Indirect 36
TOTAL 164
PERSONAL INCOME ($ Thousands)
Direct $2,797
Re-spending/Local Consumption $8,233
Indirect $1,464
TOTAL $12,494
Direct Business Revenue ($ Thousands) $9,701
Local Purchases ($ Thousands) $3,305
STATE AND LOCAL TAXES ($ Thousands) $987

TEXAS PORTS 2015 – 2016 CAPITAL PROGRAM TECHNICAL APPENDIX
PAGE 59
Table 15: Economic Impacts Generated by Construction Activity
Note: Totals may not add due to rounding
The $12.95 million construction impact creates approximately 106,200 person-hours. Approximately 135,800 induced person-hours are created as a result of local purchases by individuals directly related to and generated by the construction activity. An additional 96,728 indirect person-hours were supported by $4.4 million of purchases in the local and regional economy by the firms providing direct construction activity services.
The income impact is estimated by multiplying the average annual earnings (excluding benefits) by the corresponding number of direct jobs. The individual annual earnings multiplied by the corresponding job impact resulted in $2.8 million in personal wage and salary earnings. The impact of the re-spending of this direct income for local purchases is estimated using a personal earnings multiplier. The personal earnings multiplier is based on data supplied by the Bureau of Economic Analysis (BEA), Regional Input-Output Modeling System (RIMS II). The personal earnings multiplier was used to estimate the total income and consumption impact of $8.2 million, inclusive of the re-spending and local consumption impact. This additional re-spending of the direct income generates the 135,801 induced person-hours impact. The 96,728 indirect person-hours earned $2.0 million in indirect wages and salaries. Combining the direct, induced, and indirect personal income impacts, the total income impact is $12.9 million.
Construction activity of the rail line generates $1.0 million of state and local taxes.
HOUSTON Construction
Total Construction Value $12,950,000
JOBS (Person hours)
Direct 106,190
Induced 135,801
Indirect 96,728
PERSONAL INCOME
Direct $2,776,019
Re-spending/Local Consumption $8,172,045
Indirect $1,954,905
TOTAL $12,902,969
LOCAL PURCHASES $4,412,546
STATE AND LOCAL TAXES $1,019,335

TEXAS PORTS 2015 – 2016 CAPITAL PROGRAM TECHNICAL APPENDIX
PAGE 60
Environmental Review The Port of Houston Authority has received necessary environmental clearance from the USACE and TCEQ to move forward with this proposed rail line. The proposed rail spur is one of many plan components permitted under DA Permit No. 21520 for the Bayport Terminal Complex Phase I Master Plan. The DA permit includes an approved mitigation plan for impacts that are not directly associated with the proposed rail spur. Impacts for the overall master plan include dredging approximately 127 acres of open water, placement of 12 million cubic yards of dredge material into approved placement areas, fill of approximately 19 acres of jurisdictional wetlands and 2 acres of open water and mud flats. An Environmental Impact Statement (EIS) was conducted for this master plan, and a Record of Decision (ROD) was issued in 2010.
Direct project benefits for the proposed rail spur project include fuel savings, reduction in air emissions, and socio-economic benefits (job creation, enhancement of the local economy). It is anticipated that this proposed project would be implemented within the FY15-16 Texas Port Capital Program timeline. Prior to construction, filing an NOI with TCEQ, preparation of a storm water pollution prevention plan (SWPPP), and implementation of storm water best management practices (BMPs) will be required.
TxDOT Maritime Environmental Review Checklist 1) Have environmental resource studies been conducted
to determine the presence/absence of regulated resources?
Yes
2) If resources have been identified as being present on the proposed project site, have the resources been located and quantified?
Yes
3) Will the proposed project affect any regulated environmental resources? Describe impact.
Impacts were identified with DA Permit No. 21520 for the Bayport Terminal Complex Phase I Master Plan permitting. Impacts for this overall master plan include dredging approximately 127 acres of open water, placement of 12 million cubic yards of dredge material into approved placement areas, fill of approximately 19 acres of jurisdictional wetlands and 2 acres of open water and mud flats.
4) Does the proposed project require an environmental permit to impact the regulated resources?
Yes
5) If no permit is required, why not? 6) If yes, what type and from what agency? USACE Section 404 and Section 10, TCEQ
Section 401 7) Has the applicant coordinated with resource agencies?
If so, please list. USACE, Texas Coastal Coordination Council, TCEQ, USFWS, NMFS, EPA, USCG, TPWD, THC, GLO, National Ocean Survey, Galveston Bay Foundation, American Waterways Operators
8) Is mitigation required to offset impacts? Yes 9) If yes, has a mitigation plan been developed? What
does the plan include? Yes, the mitigation plan is outlined in DA Permit No. 21520
10) Does NEPA apply to this proposed project? Yes 11) If yes, what is the current status of the NEPA
document? Complete. A Record of Decision (ROD) was issued in 2010.
12) Are there any known contamination-related issues on the proposed project site?
Exceedances of copper in water and elutriates were reported in the EIS; however, no dredging is proposed under the rail extension project. Therefore, this contamination is not applicable to this proposed project.

TEXAS PORTS 2015 – 2016 CAPITAL PROGRAM TECHNICAL APPENDIX
PAGE 61
TxDOT Maritime Environmental Review Checklist 13) If contamination is known to exist on the proposed
project site, what steps are being taken to remediate any known soil/groundwater conditions and to protect site workers during construction?
14) What, if any, are the environmental considerations during construction?
Filing an NOI with TCEQ, preparation of a SWPPP, and implementation of storm water BMPs will be required.
15) Describe the project’s environmental benefits. In addition to the natural benefits associated with implementation of mitigation which includes beneficial use sites, project benefits include fuel savings, reduction in air emissions, and socio-economic benefits (job creation, enhancement of the local economy).
16) What is the anticipated project delivery schedule? Environmental clearance/permitting for this project fall within the FY15-16 Texas Ports Capital Program delivery schedule.
17) What recommendations do you have for the applicant to efficiently proceed with the proposed project?
Comply with all of the DA permit requirements and complete the proposed project prior to the stated expiration date on the permit.
Engineer Review The proposed project is construction of a new rail spur (single track) providing future access to the proposed Bayport Intermodal Yard. The Port provided one overall plan view and background text. Detailed engineering, drawings, and specifications were not available.
It is assumed that the proposed new rail spur will consist of a typical rail spur section with turnouts, at-grade crossings, signalization, timber ties, and ballast. Allowances have been made for storm water drainage and utility relocation.

TEXAS PORTS 2015 – 2016 CAPITAL PROGRAM TECHNICAL APPENDIX
PAGE 62
Figure 29: Permitted Plans
Cost Estimate The cost estimate for the project is based on a preliminary layout provided by the Port of Houston Authority. TxDOT 3 and 12-month moving average unit prices along with input from local railroad track contractors was used to estimate cost. A 15% construction contingency was added to the estimate but no escalation contingencies have been included.
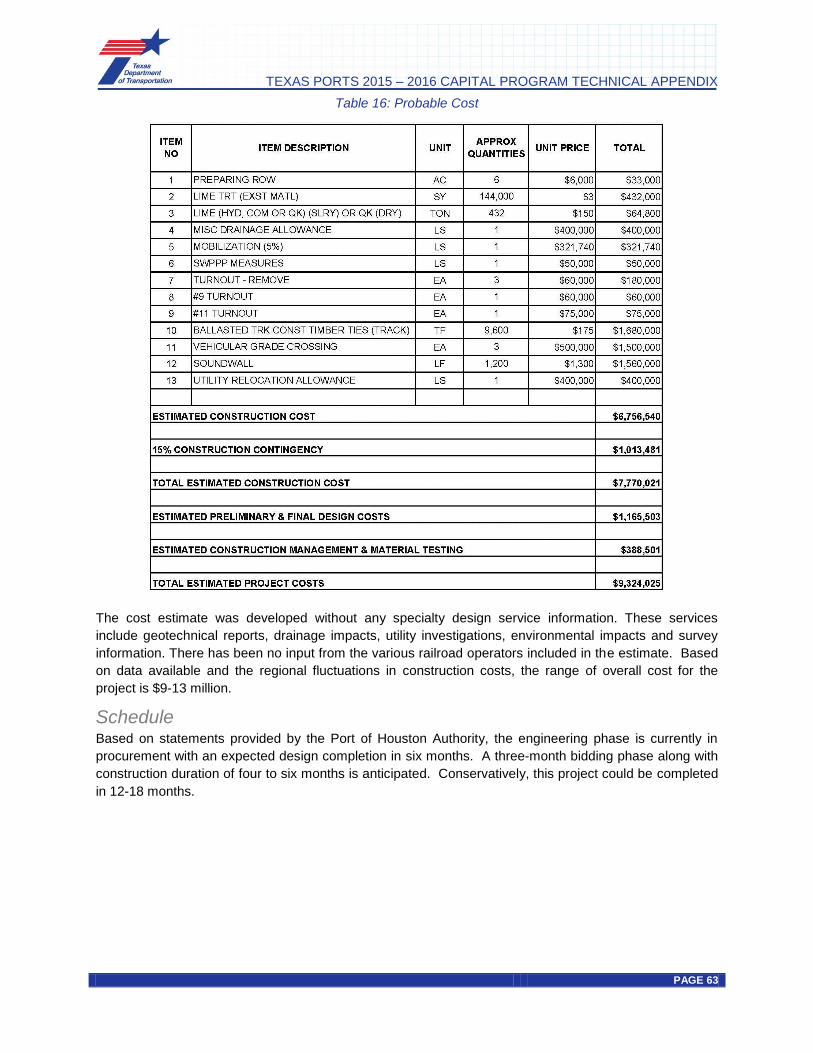
TEXAS PORTS 2015 – 2016 CAPITAL PROGRAM TECHNICAL APPENDIX
PAGE 63
Table 16: Probable Cost
The cost estimate was developed without any specialty design service information. These services include geotechnical reports, drainage impacts, utility investigations, environmental impacts and survey information. There has been no input from the various railroad operators included in the estimate. Based on data available and the regional fluctuations in construction costs, the range of overall cost for the project is $9-13 million.
Schedule Based on statements provided by the Port of Houston Authority, the engineering phase is currently in procurement with an expected design completion in six months. A three-month bidding phase along with construction duration of four to six months is anticipated. Conservatively, this project could be completed in 12-18 months.

TEXAS PORTS 2015 – 2016 CAPITAL PROGRAM TECHNICAL APPENDIX
PAGE 64
Port Mansfield Project Description: Port Mansfield has proposed dredging the Port Mansfield Channel to a depth of 12 feet from the inner harbor basin to the Gulf of Mexico. Due to lack of maintenance dredging and heavy siltation, a significant portion of the existing navigation channel has shoaled to less than 5 feet deep.
Estimated Project Cost: $8,000,000
Economics Review Project Description: Port Mansfield proposes to dredge their existing channel form the Gulf of Mexico to the inner harbor basin to the federally authorized depth of 16 feet. Currently, the channel is silted and shoaled in to a depth of 4 feet and the port is losing commercial and private recreation boat clients. At a minimum, the port would like a 12 foot channel for the inner harbor basin to the intersection with the Gulf Intracoastal Waterway. This depth matches the GIWW, and would make the port a possible trade stop for GIWW waterway cargo.
Summary Port Mansfield has requested PAAF funding to pay for dredging the channel to the Port. The Army Corps of Engineers will no longer pay for maintenance dredging, so the costs must be borne by the Port. The Port would at least like to maintain a 12-foot dredge depth to enable current commercial sport fishing and sailboat access. This depth would also allow provide the port and opportunity to market their facilities to potential barge operators traversing the GIWW. Currently, the main benefit of a 12-foot depth is to retain existing recreational revenue. This revenue may disappear if the channel silts in. There would be a corresponding negative impact to the residents in the region, so the loss of the channel would be dire for the region and state overall. The project-related construction activity of $8 million at Port Mansfield will generate 436,900 person-hours of direct, induced and indirect jobs, as well as $8 million of direct business revenue to the firms providing services during the duration of the construction period. The projected cargo throughput and recreational impacts resulting from the project is currently not known and thus the resulting jobs and revenue impact of the operation of the project is difficult to identify at this time.
Figure 30: Aerial View of Port Mansfield

TEXAS PORTS 2015 – 2016 CAPITAL PROGRAM TECHNICAL APPENDIX
PAGE 65
Overview of the Port’s Request The project goal is to dredge the entrance channel into Port Mansfield to a 12-foot depth to allow continued recreational fishing and boating. The depth of the channel has shoaled to four feet and is authorized by the US Army Corps of Engineers at a depth of 16 feet. Recreational vessels are beginning to be unable to access the Port at this time.
Purpose & Need Summary This summary is based upon the Port’s statements but as of the date of this draft, the Port has not validated these statements. References are provided to sources for claims made in the footnotes. In some cases, the Port is assisted with support for its argument.
The problem that the Port seeks to solve began in 2011 when the Army Corps of Engineers discontinued dredging of the Port Mansfield channel “because the Port no longer serves as a commercial harbor."
2 Since then, the federally authorized 16-foot channel has shoaled to four feet at its entrance. For two years3 now, large fishing boats have not been able to enter the channel because of the shoaling problem. This affects the Port’s economy and tourism because fishing is its main source of revenue/attraction. Not only are there no commercial cargo tenants at the Port, but now recreational boats are starting to leave. The Port must seek alternative means of funding for dredging to reverse the downward economic trend. At a minimum, the Port would like to gain funding to maintain a depth of 12-feet to support recreational boats. The County has limited sources of revenue, and so maintaining a viable port is very important to the local economy.
Figure 31 shows graphically how various depths relate to vessel types that might be able to use those depths. Deeper water requires higher spending for dredging. As a concession to the high costs, Port Mansfield is seeking funding for a 12-foot depth.
Figure 31: Overview of Dredge Depth’s Effect on Vessel Use
2 Del Valle, Fernando. "Port Mansfield Mulls Million-dollar Dredging." Valley Morning Star. N.p., n.d. Web. 26 Aug. 2014. 3 Del Valle, Fernando. "Port Mansfield Mulls Million-dollar Dredging." Valley Morning Star. N.p., n.d. Web. 26 Aug. 2014

TEXAS PORTS 2015 – 2016 CAPITAL PROGRAM TECHNICAL APPENDIX
PAGE 66
Summary of Need for Outside Funding: The Port cannot fund the proposed project without help due to its limited revenue. With only one staff person, the Port has limited resources to support writing grant requests or to organize alternative funding sources. Without the opportunity for deeper water, the Port cannot seek to earn revenue. The Port intends to study the level of revenue from port fees and taxes that would be required to maintain a target depth. Note that competitor ports obtain federal funding for dredging, and so Port Mansfield stands to be at a disadvantage without outside funding for its dredging.
Purpose and Need for the Project - Support Documentation: The following sections have supporting arguments and analysis on the Port’s behalf. Data was applied from the Port and from public sources.
1) Port Mansfield has an excessive shoaling problem that is reducing channel depth.
Figure 32: Port Mansfield’s Channel to the Gulf is a 9.9 Mile Dredge
The NOAA chart in Figure 32 above confirms that the depth of areas surrounding the channel vary mostly between 4-6 feet. This indicates a problem for the Port because most recreational vessels need at least 6-8 feet of draft. If the current situation is not addressed, the Port might not be able to sustain its operation in the future because shallow water would prevent usage by recreational vessels.
2) Port Mansfield is losing recreational revenue due to the shoaling problem.
Table 17: Estimated Revenue Lost Due to Shoaling at Port Mansfield
Business Lost Annual Revenue ($) Head Boats4 55,000
Mud Boats3 1,104,000 Fishing Tournament Income5 35,000
Table 17 shows that Port Mansfield has been losing revenue as it becomes inaccessible to larger vessels. A Texas Department of Transportation report states that the operating revenue of Port Mansfield was $1.15 million in 2009. The current operating revenue is estimated at $400 thousand/year for mooring revenue, per the Port. The dredging project will allow the Port to pursue these opportunities and boost revenue.
4 Correspondence with Ron Mills, the Port Director at the Port of Mansfield 5 http://www.valleymorningstar.com/news/local_news/article_59834b50-95f8-11e3-a0e4-0017a43b2370.html

TEXAS PORTS 2015 – 2016 CAPITAL PROGRAM TECHNICAL APPENDIX
PAGE 67
3) Port Mansfield is one of the top fishing spots in the USA.
In 2014, Port Mansfield is nominated as one of the top 10 fishing spots in the USA by Sport Fishing Magazine. Geographically, Port Mansfield is located close to Laguna Madre, which has an abundance of marine wildlife, particularly reds, trout, flounder, and snook6. The Port has also benefitted from the reduction in the daily harvest of trout between 10 and 5 because that leads to an increase in the trout population. In an interview with Game and Fish Magazine in 2012, Capt. Bruce Schuler of Get-A-Way Adventures Lodge (one of the fishing guides in the Port) states “that ever since the limit was reduced, sport fishing activity has been rebounding greatly.”
7 The Port also has a geographical advantage over South Padre Island (another popular fishing spot) for deep-sea fishing business8. However, currently the Port is experiencing the shoaling problem that sometimes prohibits these vessels from accessing it.
Figure 33: Known Fishing Spots Around Port Mansfield
Need for Outside Funding – Support Documentation: In this section, Port Mansfield provides supporting evidence to reinforce its arguments for the need for external funding for the project:
1) Port Mansfield lacks the revenue to fund the project without PAAF funding.
The Port only receives about $400 thousand/year for mooring revenue, per the Port. This does not generate enough cash flow to pay for a multi-million dollar dredging project over a reasonable time period.
6 Olander, Doug. "10 Top Sport-Fishing Towns." Sport Fishing News, Photos & Sport Fishing Boat Reviews. N.p., n.d. Web. 27 Aug. 2014. 7 Sloan, Robert. "Best Bets for Texas Gulf Coast Fishing - Game & Fish/Sportsman." Game Fish Best Bets for Texas Gulf Coast Fishing Comments. N.p., 26 Apr. 2012. Web. 27 Aug. 2014. 8 Vindell, Tony. "Deep Sea Fishing Charter Boats Sail out of Port Mansfield | Www.raymondville-chronicle.com | Raymondville Chronicle News." Deep Sea Fishing Charter Boats Sail out of Port Mansfield | Www.raymondville-chronicle.com | Raymondville
Chronicle News. N.p., 01 Feb. 2012. Web. 27 Aug. 2014.

TEXAS PORTS 2015 – 2016 CAPITAL PROGRAM TECHNICAL APPENDIX
PAGE 68
Overall Analysis of Port Arguments In this section, the Port’s arguments are summarized into standard categories and evaluated.
1) Funding Arguments: The Port has no USACE support for dredging. It is unclear if the port will earn sufficient revenue to pay for subsequent maintenance dredging. The Port relies heavily on tax money and could not borrow money as it does not have a significant business currently. Annual dredging will be done by increasing property lease tax.
2) Business Argument: Dredging will allow port access for recreational and commercial vessels to generate more revenue. The Port can provide evidence of significant reduction in commercial fishing boats over the past years.
3) Self-sustaining Argument: The Port believes that they will be able to maintain the dredge depth, once the dredging is complete.
4) Catalyst Argument: The dredging is required for any business development at the port to occur. The project will enable the Port to lease berthing space to tenants that require deeper berths. Some tenants may want to develop a new business in the area. Therefore, the project is a catalyst for development of other projects in the area.
5) Access Argument: Without dredging, the Port is barely accessible by recreational boats. 6) Growth Argument: The Port might secure NASA drone research facility and possibly secondary
gas pipeline cargo business. 7) Port Readiness: Dredge disposal is ready to go. The port has dredging plans prepared by
USACE.
Economic Impacts Analysis Summary The economic impact analysis focuses on the impacts created by dredging the entrance channel into Port Mansfield to allow access to the commercial ships and to generate revenue. The Port is typically a recreational port but thinks that there is potential in the future for commercial activity if it is not hindered by a lack of usable water depth. The current depth of the channel is four feet. The Port does not identify new or additional tonnage at the current time as a result of the dredging but rather indicates the strong urgency for the project to allow for the potential opportunity of commercial activity. The project does create one-time impacts of the construction activity associated with the dredging project. Impacts are estimated in terms of jobs, personal earnings, business revenue, and state and local taxes.
The cost of dredging the entrance channel to Port Mansfield is estimated at $8 million. These economic impacts are identified in Table 18.

TEXAS PORTS 2015 – 2016 CAPITAL PROGRAM TECHNICAL APPENDIX
PAGE 69
Table 18: Economic Impacts Generated by Construction Activity
Note: Totals may not add due to rounding
The $8 million construction impact creates approximately 173,100 person-hours. Approximately 170,100 induced person-hours are created as a result of local purchases by individuals directly involved in the dredging activity. An additional 93,680 indirect person-hours were supported by $4.2 million of purchases in the local and regional economy by the firms providing direct construction activity services.
The income impact is estimated by multiplying the average annual earnings (excluding benefits) by the corresponding number of direct jobs. The individual annual earnings multiplied by the corresponding job impact resulted in $3.2 million in personal wage and salary earnings. The impact of the re-spending of this direct income for local purchases is estimated using a personal earnings multiplier. The personal earnings multiplier is based on data supplied by the Bureau of Economic Analysis (BEA), Regional Input-Output Modeling System (RIMS II). The personal earnings multiplier was used to estimate the total income and consumption impact of $9.1 million, inclusive of the re-spending and local consumption impact. This additional re-spending of the direct income generates the 170,108 induced person-hours impact. The 93,680 indirect person-hours earned $2.3 million in indirect wages and salaries. Combining the direct, induced, and indirect personal income impacts, the total income impact is $14.5 million.
Dredging activity of the entrance channel to Port Mansfield will generate $1.1 million of state and local taxes.
Environmental Review The proposed project includes dredging of the entrance channel into Port Mansfield to a chartered depth of 16 feet. Limited environmental documentation was available for TxDOT review, and it is advisable that the applicant meet with the USACE to explore amending any existing expired permits. Careful planning and utilization of the most expeditious permitting scenario are required for this project to meet the funding timelines associated with the 2015-2016 Texas Ports Capital Program.
PORT MANSFIELD Construction
Total Construction Value $8,000,000
JOBS
Direct (manhours) 173,112
Induced 170,108
Indirect 93,680
PERSONAL INCOME ($ Thousands)
Direct $3,151
Re-spending/Local Consumption $9,074
Indirect $2,272
TOTAL $14,497
Local Purchases ($ Thousands) $4,215
STATE AND LOCAL TAXES ($ Thousands) $1,145

TEXAS PORTS 2015 – 2016 CAPITAL PROGRAM TECHNICAL APPENDIX
PAGE 70
TxDOT Maritime Environmental Review Checklist 1) Have environmental resource studies been conducted
to determine the presence/absence of regulated resources?
Unknown based on the information provided.
2) If resources have been identified as being present on the proposed project site, have the resources been located and quantified?
Unknown based on the information provided.
3) Will the proposed project affect any regulated environmental resources? Describe impact.
Yes
4) Does the proposed project require an environmental permit to impact the regulated resources?
Yes
5) If no permit is required, why not? 6) If yes, what type and from what agency? USACE, TCEQ, General Land Office (GLO) 7) Has the applicant coordinated with resource agencies?
If so, please list. Unknown based on the information provided.
8) Is mitigation required to offset impacts? Unknown based on the information provided. 9) If yes, has a mitigation plan been developed? What
does the plan include?
10) Does NEPA apply to this proposed project? If federal dollars are utilized, a NEPA document will be required.
11) If yes, what is the current status of the NEPA document?
Not yet initiated
12) Are there any known contamination-related issues on the proposed project site?
Unknown based on the information provided.
13) If contamination is known to exist on the proposed project site, what steps are being taken to remediate any known soil/groundwater conditions and to protect site workers during construction?
14) What, if any, are the environmental considerations during construction?
To be determined following NEPA and permitting processes.
15) Describe the project’s environmental benefits. To be determined following NEPA and permitting processes.
16) What is the anticipated project delivery schedule? Implementation is possible within 18 to 24 months; however, permitting timelines are likely to exceed the two-year implementation requirements associated with the FY15-16 Texas Ports Capital Program.
17) What recommendations do you have for the applicant to efficiently proceed with the proposed project?
It is advisable that the applicant meet with the USACE to explore amending any existing expired permits. Careful planning and utilization of the most expeditious permitting scenario are required for this project to meet the funding timelines associated with the 2015-2016Texas Ports Capital Program.
Engineer Review To develop two dredging alternatives for Port Mansfield, plans provided by the Port that were developed by the US Army Corps of Engineers (USACE) were used. The first alternative was to dredge the channel from the inner harbor basin to the GIWW and the second alternative looked at dredging from the inner harbor basin to open waters of the Gulf of Mexico. Various dredge depths were evaluated to develop corresponding cost estimates for each depth using the unit dredge cost provided by the USACE.

TEXAS PORTS 2015 – 2016 CAPITAL PROGRAM TECHNICAL APPENDIX
PAGE 71
Proposed Design The US Army Corps of Engineers (USACE) prepared draft plans and technical specifications to help Port Mansfield to pursue a private contract to dredge the Port Mansfield Channel from the Inner harbor Basin to the GIWW. USACE provided the draft plans and technical specifications, a cost estimate and an expected dredging duration for this project.
USACE draft dredging plans (Figure 35 and Figure 36) cover the dredging of Port Mansfield Channel from Port Mansfield to the GIWW intersection.
Figure 34: General Location Plan
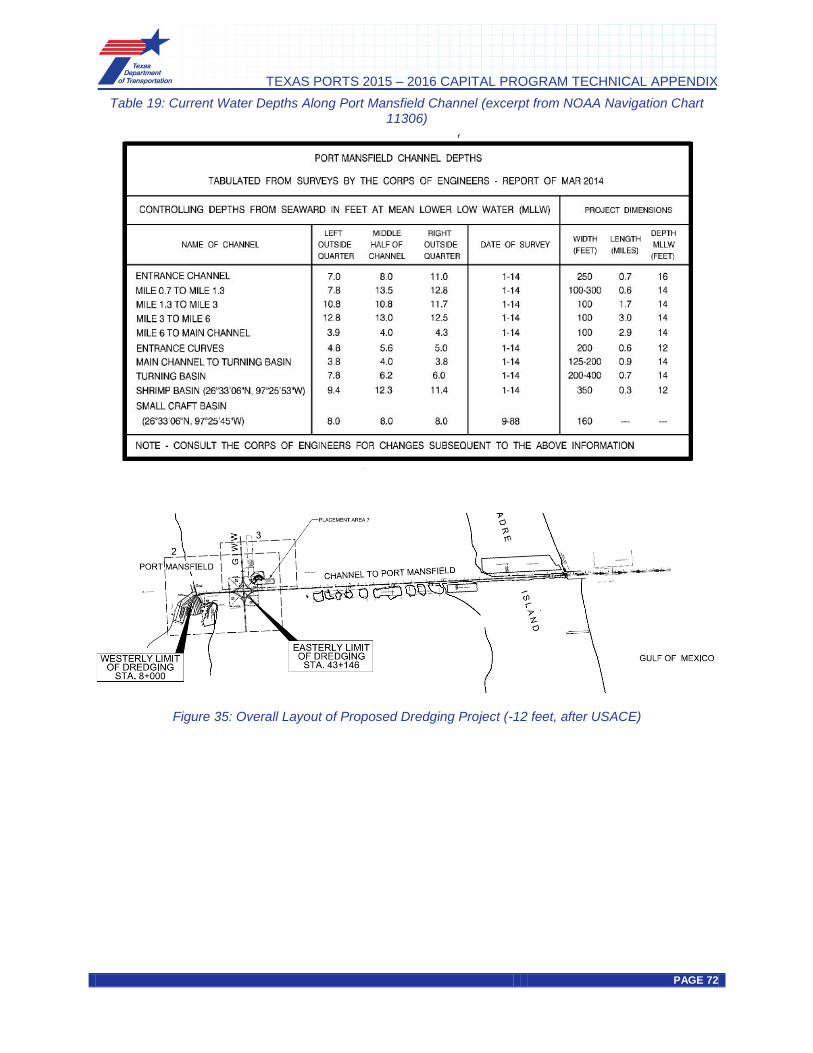
TEXAS PORTS 2015 – 2016 CAPITAL PROGRAM TECHNICAL APPENDIX
PAGE 72
Table 19: Current Water Depths Along Port Mansfield Channel (excerpt from NOAA Navigation Chart 11306)
Figure 35: Overall Layout of Proposed Dredging Project (-12 feet, after USACE)

TEXAS PORTS 2015 – 2016 CAPITAL PROGRAM TECHNICAL APPENDIX
PAGE 73
Figure 36: Detailed Layout of Proposed Dredging Project (-12 feet, after USACE)
Investigation for a range of depths and dredge areas is described below. The area between the Gulf and Port Mansfield is split into two areas and denoted as Alternative 1 and Alternative 2.
Alternative 1: Provides for dredging from the inner harbor basin to the GIWW
Alternative 2: Provides for dredging from the inner harbor basin to the Gulf of Mexico
A 12-foot baseline was used since this is the controlling draft for barge traffic on the GIWW and large recreational vessels. In addition to the 12-foot baseline project depth detailed by USACE, a dredge volume analysis was performed for alternative dredge depths of 8 feet, 10 feet, 12 feet, 14 feet, and 16 feet. The cost estimate reflects the volumes determined by this analysis.
The cost estimate for dredging of navigation channel from Port entrance to GIWW for a depth of 12 feet was provided by USACE. USACE estimated the cost to dredge will be approximately $2,500,000 to $3,100,000 for an estimated dredge volume of 600,000 cubic yards. USACE is routinely performing maintenance dredging in the region; therefore the unit cost of dredging ($4-6/cy) is believed to be acceptable.
Cost Estimate Using USACE’s base cost, a cost estimate was prepared for both alternatives at five (5) dredge depths.
The calculated dredge quantities and expected cost for Alternative 1 and Alternative 2 are given in Table 20 and Table 21. The cost of dredging in Table 20 includes slightly more mobilization/demobilization and pipelines cost, intended to account for longer distances for dredge disposal.

TEXAS PORTS 2015 – 2016 CAPITAL PROGRAM TECHNICAL APPENDIX
PAGE 74
Table 20: Estimated Dredge Quantities, Costs, and Schedules for Alternative-1 (dredging Port Mansfield to the GIWW)
Table 21: Estimated Dredge Quantities, Costs, and Schedules for Alternative-2 (dredging Port Mansfield to the Gulf Coast)
These costs are variable and are highly dependent upon dredge availability and demand in the region. The Alternative 2, dredging form the inner harbor basin to the Gulf of Mexico, provides the Port a fully functional channel for an estimated cost of $8M.
Schedule The estimated schedule is based on USACE’s guidance that a typical dredger can remove approximately 12,000 cubic yards of material per day. Completion of Alternative 1, dredging of the channel to 12 feet from the inner harbor basin to the GIWW, would take 49 days. Alternative 2, dredging 12 feet from the inner harbor basin to the Gulf of Mexico would take 111 days. Once resources are secured, both of these alternatives could be dredged in 12-18 months taking into consideration permitting, design, and acquisition requirements.
Dredge Depth
(ft)
Estimated
Volume (cy)Unit Cost ($)
Estimated Cost
($)*
Estimated Schedule
(days)
8 180,000 6.00$ 2,330,000$ 35
10 263,000 6.00$ 2,828,000$ 42
12 350,000 6.00$ 3,350,000$ 49
14 445,000 6.00$ 3,920,000$ 57
16 544,000 6.00$ 4,514,000$ 65
*) Includes $1,250,000 mob/demob and dredge pipe cost.
Dredge Depth
(ft)
Estimated
Volume (cy)Unit Cost ($)
Estimated Cost
($)*
Estimated Schedule
(days)
8 424,000 6.00$ 4,044,000$ 55
10 729,000 6.00$ 5,874,000$ 81
12 1,095,000 6.00$ 8,070,000$ 111
14 1,645,000 6.00$ 11,370,000$ 157
16 2,244,000 6.00$ 14,964,000$ 207
*) Includes $1,500,000 mob/demob and dredge pipe cost.

TEXAS PORTS 2015 – 2016 CAPITAL PROGRAM TECHNICAL APPENDIX
PAGE 75
Port of Palacios Project Description: The Port of Palacios is under the jurisdiction of Matagorda County Navigation District No. One. The proposed project is to replace 620 ft. of bulkhead along the 12th street dock. This is one of the most heavily used docks in the Port provides a launch way for manufactured barges and push boats. The launch way dock and adjacent bulkhead dock, both slated for expansion opportunities, are in need of extensive demolition and hardening with a steel bulkhead system.
Estimated Project Cost: $2,573,800
Economics Review Summary The Port of Palacios has submitted a request to fund a 620 linear foot bulkhead replacement project at the 12th Street dock. This document provides a summary of the Port’s arguments as well as an evaluation of the Port’s request and supporting documentation. The Port’s argument
for purpose and need focuses on the potential increase of shrimping fleet at the Port. The Port requests funding support because lease and shrimp revenues are insufficient to pay for a new dock. The Port and the local community will lose a projected US$25,980 and US$1.8 million annually in lease and shrimp revenue, respectively. The project-related construction activity of $2.6 million at the Port of Palacios will generate 63,506 person-hours of direct, induced and indirect jobs, as well as $4.2 million of direct business revenue to the firms providing services during the duration of the construction period. As a result of improving the bulkhead, the Port of Palacios will add 2 shrimp boats, creating 8 direct, induced and indirect jobs and $3.7 million in direct business revenue.
Overview of the Port’s Request The proposed bulkhead replacement project will be located on the corner of the 12th Street dock where shrimp fleets dock. The project is expected to help expand shrimping business at the Port.
Reference: Port’s PCP Request
Purpose & Need Summary from Port’s Point of View This summary is based upon the Port’s statements but as of the date of this draft, the Port has not validated these statements. References are provided to sources of claims made in the footnotes. In some cases, the Port is assisted by support of its arguments.
Figure 37: 12th St. Dock
Project Location

TEXAS PORTS 2015 – 2016 CAPITAL PROGRAM TECHNICAL APPENDIX
PAGE 76
Summary of Purpose and Need for the Project: The Port of Palacios believes that the bulkhead improvement to the shrimp docks would be important to support its expansion. Through use, the condition of the dock accessible from 12th Street has been deteriorating. According to the Port Director, larger “Gulf boats” of about 100 feet LOA are replacing the smaller so-called “Bay Boats” in the regional industry. Improvements to the dock would be beneficial to
the local economy as the Port would be able to expand its shrimping business and accommodate more of the larger boats. The Port will risk losing 620 linear feet of docks if the bulkheads are not replaced. The loss could decrease the Port’s shrimp production by approximately 780,000 pounds. And, by squaring off
the corner, the Port gains landside area that makes the berth rental more valuable. Analysis below will show that the proposed project would help the Port to grow both its existing businesses and maintain its status as one of the main economic drivers in the region.
Figure 38: Conceptual Plan Rendering for the Port of Palacios by Cargo Velocity
Summary of Need for Outside Funding: The Port of Palacios requires outside funding to accelerate the development of its existing shrimping business. The Port is reacting for a potential relocation of shrimping fleet from Galveston to the Palacios area, which would promote local economy and increase job creation. The Port needs outside funding in order to react quickly to these business opportunities. While the Port is able to provide its share of the 50/50 match, it is requesting a 75-25% match. A PAAF grant is attractive because the Port could accelerate improvements and facilitate local economic growth. Supporting arguments and analysis on behalf of the Port are presented in the following sections. The team applied data from the Port and from public sources. At this time, the Port has not yet had the opportunity to review these arguments.
Summary of Purpose and Need for the Project – Support Documentation: 1) The US seafood industry is projected to keep growing and shrimp is the most consumed seafood
per capita in the US.

TEXAS PORTS 2015 – 2016 CAPITAL PROGRAM TECHNICAL APPENDIX
PAGE 77
Figure 39: NOAA Estimates that US Seafood Demand Will Keep Increasing In the Future
Figure 40: Shrimp Is the Most Consumed Seafood Per Capita in the USA
Figure 39 illustrates that NOAA expects overall seafood consumption in the USA to increase steadily in the future. The expected consumption increase will raise the demand for shrimp. And, as illustrated in Figure 40, shrimp is the most consumed seafood in the USA in recent years.
2) The Port of Palacios is the “shrimp capital of Texas” due to its production of shrimp.

TEXAS PORTS 2015 – 2016 CAPITAL PROGRAM TECHNICAL APPENDIX
PAGE 78
Figure 41: The Port of Palacios Regularly Produces Above 10 Million Pounds of Shrimp Annually
Figure 42: More than 100 Shrimp Boats Are Home-Ported at the Port of Palacios
Figure 41 and Figure 42 illustrate the scale of the shrimping industry at the Port of Palacios. It is estimated that in 2012, the Port produced approximately 12.7 million pounds of shrimp worth US$ 29.2 million. It is estimated that the bulkhead deterioration will render 620 linear feet of docking space unusable, which translates to a decrease of approximately 780,000 pounds of shrimp catch. The Port and the local community will lose a projected US$25,980 and US$1.8 million annually in lease and shrimp revenue, respectively. Fulton Seafood in Galveston has also expressed an interest to home-port 10 “Gulf” boats at the Port of Palacios that would help to grow business.
Summary of Need for Outside Funding – Support Documentation: 1) Without a PAAF grant, the Port of Palacios could not fund the required capital investment to facilitate
growth.

TEXAS PORTS 2015 – 2016 CAPITAL PROGRAM TECHNICAL APPENDIX
PAGE 79
Figure 43: Annual Revenue of the Port of Palacios Could Not Cover Capital Investment Cost
The Port of Palacios estimates that the bulkhead replacement project will cost US$2.5 million. Figure 43 shows that the Port will not be able to fund this project itself because its annual revenue averages approximately US$ 1 million. The economic projection shows that if the bulkhead is not replaced, the Port and the local community could potentially lose $36.5 million in revenue over a 20-year period.
Overall Analysis of Port Arguments In this section, the Port’s arguments are summarized into standard categories and evaluated.
1) Funding Argument: The Port has minimal revenues and extensive infrastructure that needs repair or expansion. Without PAAF funding, the project would probably not move ahead, or would be greatly delayed. The Port can provide the matching funds from the forward cash balance even though revenues are small, but they request a 75(TxDOT)-25 (Port) % matching formula as a “small port”. Tax revenues help fund the Port.
2) Business Argument: The development of the project will help grow the shrimping business. The new bulkhead area can be expected to be used, and to generate revenues for the port immediately. The shrimp season lasts six months a year and the shrimp boats lease dock and upland work and storage space at between $3-$4 per linear foot. The shrimp industry is still growing. The existing dock was not built for the current purpose so this project aims to demolish it and rebuild it in a new configuration.
3) Self-sustaining Argument: The Port will probably generate enough revenue from the dock/bulkhead construction to pay for maintenance of the new dock. Tenants (shrimp boats) now using the dock will still use it after the project is funded and the dock is rebuilt.
4) Catalyst Argument: The new facility is not likely to generate other infrastructure demands, but it may help to grow indirect business related to the seafood industry.
5) Access Argument: The facility will provide berthing access, and landside access for servicing the boats. No new roads are needed.
6) Growth Argument: There are potential additional boats coming from Galveston. There is also an increasing interest from a company to build a shrimp processing plant – which will be discussed by the end of the year. Currently, the shrimp processing plants are located in Port Lavaca and Houston. The launch of a local processing plant could generate 125 to 200 direct jobs.
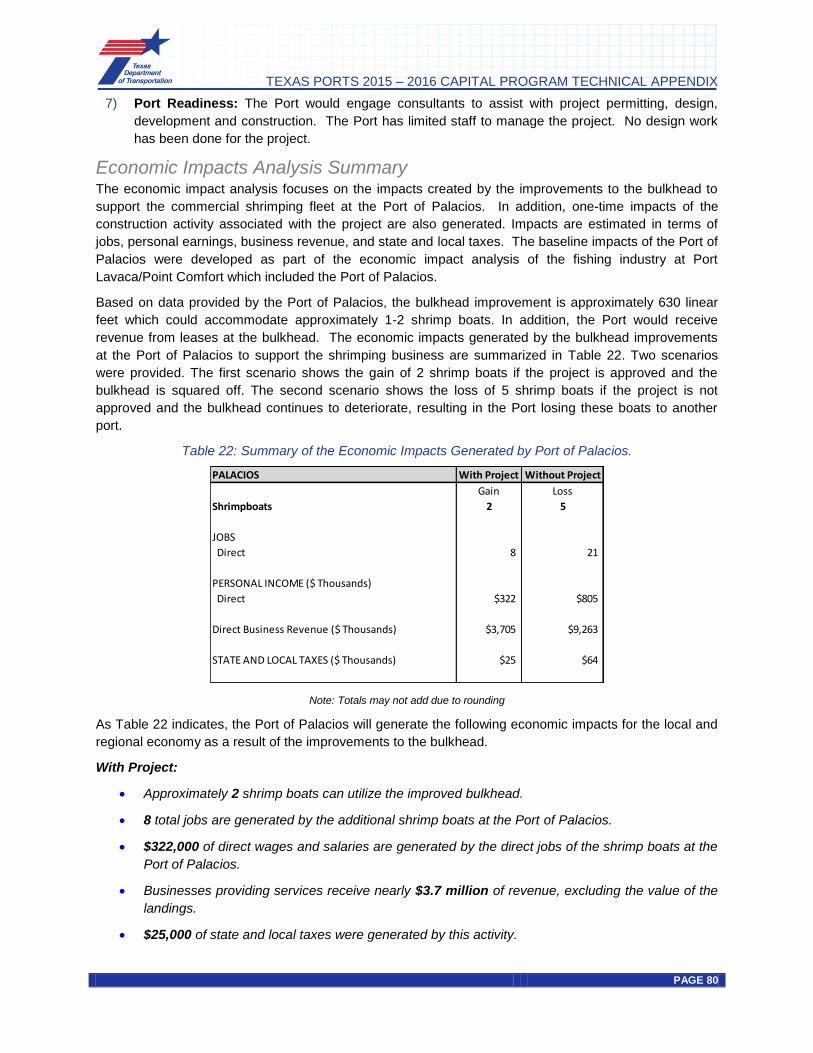
TEXAS PORTS 2015 – 2016 CAPITAL PROGRAM TECHNICAL APPENDIX
PAGE 80
7) Port Readiness: The Port would engage consultants to assist with project permitting, design, development and construction. The Port has limited staff to manage the project. No design work has been done for the project.
Economic Impacts Analysis Summary The economic impact analysis focuses on the impacts created by the improvements to the bulkhead to support the commercial shrimping fleet at the Port of Palacios. In addition, one-time impacts of the construction activity associated with the project are also generated. Impacts are estimated in terms of jobs, personal earnings, business revenue, and state and local taxes. The baseline impacts of the Port of Palacios were developed as part of the economic impact analysis of the fishing industry at Port Lavaca/Point Comfort which included the Port of Palacios.
Based on data provided by the Port of Palacios, the bulkhead improvement is approximately 630 linear feet which could accommodate approximately 1-2 shrimp boats. In addition, the Port would receive revenue from leases at the bulkhead. The economic impacts generated by the bulkhead improvements at the Port of Palacios to support the shrimping business are summarized in Table 22. Two scenarios were provided. The first scenario shows the gain of 2 shrimp boats if the project is approved and the bulkhead is squared off. The second scenario shows the loss of 5 shrimp boats if the project is not approved and the bulkhead continues to deteriorate, resulting in the Port losing these boats to another port.
Table 22: Summary of the Economic Impacts Generated by Port of Palacios.
Note: Totals may not add due to rounding
As Table 22 indicates, the Port of Palacios will generate the following economic impacts for the local and regional economy as a result of the improvements to the bulkhead.
With Project:
Approximately 2 shrimp boats can utilize the improved bulkhead.
8 total jobs are generated by the additional shrimp boats at the Port of Palacios.
$322,000 of direct wages and salaries are generated by the direct jobs of the shrimp boats at the
Port of Palacios.
Businesses providing services receive nearly $3.7 million of revenue, excluding the value of the
landings.
$25,000 of state and local taxes were generated by this activity.
PALACIOS With Project Without Project
Gain Loss
Shrimpboats 2 5
JOBS
Direct 8 21
PERSONAL INCOME ($ Thousands)
Direct $322 $805
Direct Business Revenue ($ Thousands) $3,705 $9,263
STATE AND LOCAL TAXES ($ Thousands) $25 $64

TEXAS PORTS 2015 – 2016 CAPITAL PROGRAM TECHNICAL APPENDIX
PAGE 81
Without the Project:
The Port would lose 5 shrimp boats if the bulkhead can no longer be utilized as a result of the project not being funded.
21 total jobs would be lost if the shrimp boats were displaced from the Port of Palacios.
$805,000 of direct wages and salaries are no longer generated by the direct jobs of the shrimp boats at the Port of Palacios.
Business revenue would decline by nearly $9.3 million, excluding the value of the landings.
Without the project, about $64,000 of state and local taxes would be lost.
In addition to the above impacts, the improvements to the bulkhead would create one-time economic impacts during construction. The anticipated project cost is $2.6 million. Construction impacts are estimated in terms of jobs, personal earnings, business revenue, and state and local taxes. These economic impacts are identified in Table 23.
Table 23: Economic Impacts Generated by Construction Activity
Note: Totals may not add due to rounding
The $2.6 million construction impact creates approximately 21,320 person-hours. Approximately 21,000 induced person-hours are created as a result of the local purchases of the individuals directly generated by the construction activity. An additional 21,236 indirect person-hours were supported by $0.7 million of purchases in the local and regional economy by the firms providing direct construction activity services.
PALACIOS Construction
Total Construction Value $2,600,000
JOBS (Person hours)
Direct 21,320
Induced 20,950
Indirect 21,236
PERSONAL INCOME
Direct $388,024
Re-spending/Local Consumption $1,117,548
Indirect $489,409
TOTAL $1,994,981
LOCAL PURCHASES $742,366
STATE AND LOCAL TAXES $157,604

TEXAS PORTS 2015 – 2016 CAPITAL PROGRAM TECHNICAL APPENDIX
PAGE 82
The income impact is estimated by multiplying the average annual earnings (excluding benefits) by the corresponding number of direct jobs. The individual annual earnings multiplied by the corresponding job impact resulted in $0.4 million in personal wage and salary earnings. The impact of the re-spending of this direct income for local purchases is estimated using a personal earnings multiplier. The personal earnings multiplier is based on data supplied by the Bureau of Economic Analysis (BEA), Regional Input-Output Modeling System (RIMS II). The personal earnings multiplier was used to estimate the total income and consumption impact of $1.1 million, inclusive of the re-spending and local consumption impact. This additional re-spending of the direct income generates the 20,950 induced person-hours impact. The 21,236 indirect person-hours earned $0.5 million in indirect wages and salaries. Combining the direct, induced and indirect personal income impacts, the total income impact is $2.0 million.
Construction activity associated with the bulkhead improvements at the Port of Palacios will generate $0.2 million of state and local taxes.
Environmental Review The Port of Palacios proposes to expand and rehabilitate a bulkhead system, and this includes fill of more than 0.10 acres of waters of the U.S. Limited environmental documentation was available for TxDOT review, and it is advisable that the applicant meet with the USACE to explore amending any existing expired permits. Careful planning and utilization of the most expeditious permitting scenario are required for this project to meet the funding timelines associated with the 2015-2016 Texas Ports Capital Program.
TxDOT Maritime Environmental Review Checklist 1) Have environmental resource studies been conducted
to determine the presence/absence of regulated resources?
Unknown based on the information provided.
2) If resources have been identified as being present on the proposed project site, have the resources been located and quantified?
Unknown based on the information provided.
3) Will the proposed project affect any regulated environmental resources? Describe impact.
Yes, fill into waters of U.S. (approximately 0.16 acres)
4) Does the proposed project require an environmental permit to impact the regulated resources?
Yes
5) If no permit is required, why not? 6) If yes, what type and from what agency? USACE, TCEQ, GLO 7) Has the applicant coordinated with resource agencies?
If so, please list. Unknown based on the information provided.
8) Is mitigation required to offset impacts? Unknown based on the information provided. 9) If yes, has a mitigation plan been developed? What
does the plan include?
10) Does NEPA apply to this proposed project? If federal dollars are utilized, a NEPA document will be required.
11) If yes, what is the current status of the NEPA document?
Not yet initiated.
12) Are there any known contamination-related issues on the proposed project site?
Unknown
13) If contamination is known to exist on the proposed project site, what steps are being taken to remediate any known soil/groundwater conditions and to protect site workers during construction?
14) What, if any, are the environmental considerations during construction?
To be determined following NEPA and permitting processes.

TEXAS PORTS 2015 – 2016 CAPITAL PROGRAM TECHNICAL APPENDIX
PAGE 83
TxDOT Maritime Environmental Review Checklist 15) Describe the project’s environmental benefits. To be determined following NEPA and permitting
processes. 16) What is the anticipated project delivery schedule? Implementation is possible within 18 to 24
months; however, permitting timelines are likely to exceed the two-year implementation requirements associated with the FY15-16 Texas Ports Capital Program.
17) What recommendations do you have for the applicant to efficiently proceed with the proposed project?
It is advisable that the applicant meet with the USACE to explore amending any existing expired permits. Careful planning and utilization of the most expeditious permitting scenario are required for this project to meet the funding timelines associated with the 2015-2016 Capital Program.
Engineer Review The Port of Palacios has proposed replacing 620 linear feet of an existing bulkhead with a new anchored steel sheet pile bulkhead. The existing bulkhead was originally built in the early 1970s. The proposed new alignment of the bulkhead will eliminate the skewed corner of the old structure and reclaim approximately 6,750 square feet of land.
Figure 44: Concept Plan and Cross-Section (after Port of Palacios)
Proposed Anchored Sheet Pile Bulkhead
The project is currently in the preliminary phase of develop and design documents were not available. However, the Port expressed a high level of confidence during the site visit that bulkhead design will be similar to a recent bulkhead replacement project.
In order to determine the basic arrangement of the bulkhead structure, deadman, and concrete cap (refer to Figure 45) a conceptual design was developed that is associated with the proposed over-sheeting.

TEXAS PORTS 2015 – 2016 CAPITAL PROGRAM TECHNICAL APPENDIX
PAGE 84
Figure 45: Bulkhead Concept Repair Cross-Section
Cost Estimate The Port estimated that the cost associated with proposed bulkhead replacement project will be $2,573,800 (refer to Table 24). The Port stated that this cost was determined by its consultant based on similar recent projects.

TEXAS PORTS 2015 – 2016 CAPITAL PROGRAM TECHNICAL APPENDIX
PAGE 85
Table 24: Construction Cost Estimate
The costs of these recent projects were normalized by reducing the bulkhead cost to a per linear foot unit cost and accounted for inflation of 2014 U.S. dollars. Inflation was calculated as per the U.S. Army Corps of Engineers EM 1110-2-1304 Civil Works Construction Cost Index. The cost analysis is summarized in Table 25.
The proposed project cost was verified and it is recommended that the Port request $2.7M for this project in order to cover unforeseen expenses.
Table 25 shows the summarized results of the probable cost analysis.
Table 25: Port of Palacios Conceptual Opinion of Probable Cost
Quantity Unit Cost (2014 U.S. Dollars)
Extended (2014 U.S. Dollars)
Anchored Steel Sheet Pile Bulkhead
620 linear ft. $4,100 per linear ft. $2,542,000
Structural Fill 4,489 cubic yards $29.75 per cubic yard $134,000 Total OPC $2,676,000.00
Schedule Based on the Port's recent experience with similar bulkhead replacement projects, this project could be complete in 9-12 months.

TEXAS PORTS 2015 – 2016 CAPITAL PROGRAM TECHNICAL APPENDIX
PAGE 86
Port of Port Arthur Project Description: The Port proposes is to construct three new rail spurs consisting approximately 4,000 ft. of rail line to providing improved access to the Port Facilities. The existing rail spurs will be removed and approximately six acres of land will be grade raised, stabilized, and surfaced.
Estimated Project Cost: $7,100,000
Economics Review Summary The Port of Port Arthur has submitted a request for funding to support a rail access and port backland development project. Figure 46 shows the proposed concept. Rail development is needed to extend existing tracks for expected new rail cargo, and to make way for new wood pellet silos. The associated six acres of backland is needed to support a new wharf extension, and is mainly for the benefit of an expanded wood pellet operation. The Port of Port Arthur requires state funding in order to accelerate the development of the facilities, and to remain competitive with other ports that would like this same cargo opportunity. The project-related construction activity of $7.1 million at the Port of Port Arthur will generate 214,575 person-hours of direct, induced and indirect jobs, as well as $7.1 million of direct business revenue to the firms providing services during the duration of the construction period. Approximately 1.8 million metric tons of wood pellets has been projected to be exported through the Port of Port Arthur as a result of constructing additional rail, creating operating impacts of 220 direct, induced and indirect jobs and $37.5 million in direct business revenue.
Figure 46: Conceptual Layout Rendering of the Port of Port Arthur by Cargo Velocity

TEXAS PORTS 2015 – 2016 CAPITAL PROGRAM TECHNICAL APPENDIX
PAGE 87
Overview of the Port’s Request The German Pellets company has recently invested at the Port of Port Arthur in wood pellet export facilities. Figure 47 shows the current operation, underway for one year. This tenant has expressed an interest in developing two new silos. The Port has to displace parts of existing rails to build new silos. The proposed project would not pay for the silos or the berth extension, but for associated developments, including reconstruction of extended rail tracks, and raising and paving backlands. The track project includes approximately 4,000 feet of rail, which includes tie-in to KCS and an added spur to the existing port track. The backland portion includes stabilizing six acres of laydown yard, which will be capped with roller-compacted concrete on a flexible base. Figure 46 shows these developments.
Figure 47: Existing Wood Pellet Silos and Loading Equipment at Port Arthur
Purpose & Need Summary This summary is mainly based upon the Port’s statements but at the date of this draft, the Port has not validated the report contents. References are provided to sources of claims made in the footnotes. In some cases, the Port is assisted by support for its argument.
Summary of Purpose of the Project: German Pellet GmbH is Port Arthur’s tenant and is considered to be the “largest wood pellet
manufacturer in Europe”9. They currently produce wood pellets at their plants located in Woodville
(Texas). A second plant in Urania (Louisiana) will start production in the first quarter of 201510. Current cargo tonnage from German Pellets GmbH totals approximately 0.5 million tons/year. German Pellets GmbH is expecting to ship a total of 1.5 million metric tons per year to Port Arthur for export to Europe. The German Pellets GmbH wants two more silos in addition to the 5 silos the Port is already leasing to them. German Pellets GmbH has also stated their intention to increase overall production to 2.5 million metric tons per year if the Port completes both the expansion of berth 6 and the rail extension project11.
The construction of the additional two silos will necessitate the demolition of existing rail tracks. The soon-to-be displaced rail tracks are currently used to transport essentially break-bulk and other cargoes such as forest products and military cargo.12 The Port of Port Arthur requested funding to construct an extended rail track and six acres of new backland. The project will support potential growth to the export wood pellet industry.
9 German Pellets GmbH. Port of Port Arthur - Berth 6 Expansion Project. N.p.: n.p., 31 May 2013. PDF
10 German Pellets GmbH. Port of Port Arthur - Berth 6 Expansion Project. N.p.: n.p., 31 May 2013. PDF
11 German Pellets GmbH. Port of Port Arthur - Berth 6 Expansion Project. N.p.: n.p., 31 May 2013. PDF
12 Port of Port Arthur. "Photo Album - Port of Port Arthur." Port of Port Arthur. N.p., n.d. Web. 25 Aug. 2014.
<http://portofportarthur.com/international-cargo-shipping-the-port-of-port-arthur/photo-album/>.

TEXAS PORTS 2015 – 2016 CAPITAL PROGRAM TECHNICAL APPENDIX
PAGE 88
The project is expected to remove from the road up to 180 trucks that now transport wood pellets and instead move this cargo via rail.
The Port will separately complete the following related projects which will not be covered by the proposed funding: filling and stabilizing a drainage ditch, construct 1500 feet of shoreline protection, and construct an extension to Dock 6.
Summary of Need for Outside Funding: Port Arthur seeks outside funding to pro-actively support its tenant’s request for development. Without
the funding, the project work may be delayed creating a risk to lose this cargo to a competing port. As a side benefit, the project will accelerate economic growth, job creation, and revenue generation for the Port and the region.
Purpose of and Need for the Project – Support Documentation: The following sections contain supporting arguments and analysis on behalf of the Port. Data was applied from the Port and from public sources. Some of these arguments are in part contingent upon the approval of the Port’s 2014 TIGER grant application.
1) The Port of Port Arthur needs to rebuild tracks that must be relocated to accommodate potential growth of wood pellet cargo.
If the Port of Port Arthur’s 2014 TIGER grant application for the Berth 6 expansion is approved, German
Pellets GmbH has stated their intention to ship up to 1.5 million metric tons of wood pellets through the Port in 201513. The cargo will originate from their plants in Woodville, TX (500 thousand tons) and Urania, Louisiana (1 million tons) 14
. The Port’s 2014 TIGER grant application states that at least 400
thousand tons of the cargo will be transported by rail into the Port. If both the berth 6 expansion and the track relocation project are completed, German Pellets GmbH states that they will increase annual production to 2.5 million metric tons15.
Overall Analysis of Port Arguments Standard Arguments:
1) Funding Argument: Port Arthur seeks state funding to proactively support its tenant’s request for
development. Without the funding, the project work may be delayed and create a risk to lose this cargo to a competing port. As a side benefit, the project will accelerate economic growth, job creation, and revenue generation for the Port and the region.
2) Business Argument: The project will support a potential doubling of the export wood pellet industry (main business) and will accelerate economic expansion as well as job creation. The project will increase tonnage and generate tangible revenue. There is a contract with a tenant for a 20-year lease.
3) Self-sustaining Argument: The Port will earn adequate revenues to sustain the maintenance of the facility.
4) Catalyst Argument: This project is an important component of a larger development plan. The project will enable the Port to make better use of a related dock project, and market port leases to companies that need longer rail tracks.
13 German Pellets GmbH. Port of Port Arthur - Berth 6 Expansion Project. N.p.: n.p., 31 May 2013. PDF 14 German Pellets GmbH. Port of Port Arthur - Berth 6 Expansion Project. N.p.: n.p., 31 May 2013. PDF 15 German Pellets GmbH. Port of Port Arthur - Berth 6 Expansion Project. N.p.: n.p., 31 May 2013. PDF

TEXAS PORTS 2015 – 2016 CAPITAL PROGRAM TECHNICAL APPENDIX
PAGE 89
5) Access Argument: The project will help remove trucks from the road in exchange for greater rail car usage.
6) Growth Argument:
a) A possible future liquid bulk tenant would also utilize the rail.
b) External funding would accelerate development of wood pellets cargo.
c) The potential cargo growth will only happen if the Port’s 2014 TIGER grant application is
approved, as shown in the excerpt in Figure 469 below.
7) Port Readiness: The Port is in the early stages of project planning.
Figure 48: Port Arthur TIGER Grant Excerpt
Economic Impacts Analysis Summary The economic impact analysis focuses on the impacts created by the rail extension project and six acres of new laydown area pavement at the Port of Port Arthur. These projects will support the expansion of a wood pellet plant in Woodville, TX as well as a new pellet plant being constructed in Urania, LA. Both plants will export wood pellets through the Port of Port Arthur. Additionally, one-time impacts of the construction activity associated with the project are also generated. Impacts are estimated in terms of jobs, personal earnings, business revenue, and state and local taxes. The baseline impacts of the Port of Port Arthur were developed in 2012 as part of the economic impact analysis of the State of Texas Port and Maritime Transportation System for the Texas Ports Association.
Based on data provided by the Port of Port Arthur, the wood pellet tonnage is expected to grow to about 1.8 million tons in about five years as a result of the largest wood pellet manufacturer constructing two wood pellet plants in the area and exporting the pellets through the Port. The economic impacts generated by the rail extension project and laydown area expansion to support the movement of wood pellets are summarized in Table 26.

TEXAS PORTS 2015 – 2016 CAPITAL PROGRAM TECHNICAL APPENDIX
PAGE 90
Table 26: Summary of the Economic Impacts Generated by Port of Port Arthur
Note: Totals may not add due to rounding
As Table 1 indicates, the Port of Port Arthur will generate the following economic impacts for the local and regional economy within the first five years of project completion.
Approximately 1,800,000 tons of wood pellets will be handled at the Port of Port Arthur.
220 total jobs are generated by the movement of wood pellets at the Port of Port Arthur. These include:
o 56 direct jobs
o 68 induced jobs
o 96 indirect jobs
$15.1 million of direct, induced, indirect wages and salaries, and local consumption expenditures are generated by the movement of wood pellets at the Port of Port Arthur.
Businesses providing services at the terminal will receive nearly $37.5 million of revenue, excluding the value of cargo shipped through the facility.
$1.2 million of state and local taxes were generated by this activity.
Additionally, the rail extension and expansion of the laydown area will create one-time economic impacts during construction. The anticipated project cost is $7.1 million. Construction impacts are estimated in terms of jobs, personal earnings, business revenue, and state and local taxes. These economic impacts are identified in Table 27.
PORT ARTHUR Impact
Wood Pellet Tonnage (Metric Tons) 1,800,000
JOBS
Direct 56
Induced 68
Indirect 96
TOTAL 220
PERSONAL INCOME ($ Thousands)
Direct $2,693
Re-spending/Local Consumption $7,755
Indirect $4,639
TOTAL $15,086
Direct Business Revenue ($ Thousands) $37,520
Local Purchases ($ Thousands) $9,031
STATE AND LOCAL TAXES ($ Thousands) $1,192

TEXAS PORTS 2015 – 2016 CAPITAL PROGRAM TECHNICAL APPENDIX
PAGE 91
Table 27: Economic Impacts Generated by Construction Activity
Note: Totals may not add due to rounding
The $7.1 million construction impact creates approximately 58,220 person-hours. Approximately 57,200 induced person-hours are created as a result of local purchases by individuals directly involved with construction activity. An additional 99,146 indirect person-hours were supported by $4.7 million of purchases in the local and regional economy by the firms providing direct construction activity services.
The income impact is estimated by multiplying the average annual earnings (excluding benefits) by the corresponding number of direct jobs. The individual annual earnings multiplied by the corresponding job impact resulted in $1.1 million in personal wage and salary earnings. The impact of the re-spending of this direct income for local purchases is estimated using a personal earnings multiplier. The personal earnings multiplier is based on data supplied by the Bureau of Economic Analysis (BEA), Regional Input-Output Modeling System (RIMS II). The personal earnings multiplier was used to estimate the total income and consumption impact of $3.1 million, inclusive of the re-spending and local consumption impact. This additional re-spending of the direct income generates the 57,209 induced person-hours impact. The 99,146 indirect person-hours earned $2.4 million in indirect wages and salaries. Combining the direct, induced, and indirect personal income impacts, the total income impact is $6.5 million.
Construction activity of the rail extension and expansion of laydown will generate $0.5 million of state and local taxes.
PORT ARTHUR Construction
Total Construction Value $7,100,000
JOBS (Person hours)
Direct 58,220
Induced 57,209
Indirect 99,146
PERSONAL INCOME
Direct $1,059,604
Re-spending/Local Consumption $3,051,765
Indirect $2,392,461
TOTAL $6,503,830
LOCAL PURCHASES $4,657,728
STATE AND LOCAL TAXES $513,803

TEXAS PORTS 2015 – 2016 CAPITAL PROGRAM TECHNICAL APPENDIX
PAGE 92
Environmental Review The proposed multimodal rail and marine cargo project at Port of Port Arthur includes discharge of fill material into 3.26 acres of open waters and 0.08 acre of wetlands to expand the upland port facilities and will convey drainage with new concrete box outfall culverts and pipes. To compensate for the anticipated loss of waters of the U.S., the Port of Port Arthur will plant smooth cordgrass behind approximately 6,239 linear feet (1.2 miles) of new rock breakwater that the TPWD’s J.D. Murphee Wildlife Management Area
will install along the WMA’s Compartment 9 shoreline along the GIWW. In addition to the natural benefits associated with implementation of mitigation, benefits include fuel savings, reduction in air emissions, socio-economic benefits (job creation, enhancement of the local economy).
Permitting timelines are likely to fit within two-year implementation requirements associated with the FY15-16 Texas Ports Capital Program. Once obtained, conditions of the DA permit must be followed. Filing an NOI with TCEQ, preparation of a SWPPP, and implementation of storm water BMPs will be required.
TxDOT Maritime Environmental Review Checklist 1) Have environmental resource studies been conducted
to determine the presence/absence of regulated resources?
Yes
2) If resources have been identified as being present on the proposed project site, have the resources been located and quantified?
Yes. The applicant proposes to discharge fill material into 3.26 acres of open waters and 0.08 acre of wetlands to expand the upland port facilities and will convey drainage with new concrete box outfall culverts and pipes.
3) Will the proposed project affect any regulated environmental resources? Describe impact.
Yes
4) Does the proposed project require an environmental permit to impact the regulated resources?
Yes
5) If no permit is required, why not? 6) If yes, what type and from what agency? Section 10, Section 404 7) Has the applicant coordinated with resource agencies?
If so, please list. USACE, Texas Coastal Coordination Council, TCEQ, USFWS, NMFS, EPA, USCG, TPWD, THC, GLO
8) Is mitigation required to offset impacts? Yes 9) If yes, has a mitigation plan been developed? What
does the plan include? Yes. To compensate for the anticipated loss of waters of the U.S. (3.26 acres of non-wetland waters and 0.08 acre of wetland), POPA will plant smooth cordgrass behind approximately 6,239 linear feet (1.2 miles) of new rock breakwater that the TPWD’s J.D. Murphee Wildlife Management Area will install along the WMA’s Compartment 9 shoreline along the GIWW. Smooth cordgrass will be planted within approximately 4.1 acres.
10) Does NEPA apply to this proposed project? No 11) If yes, what is the current status of the NEPA
document? No
12) Are there any known contamination-related issues on the proposed project site?
13) If contamination is known to exist on the proposed project site, what steps are being taken to remediate any known soil/groundwater conditions and to protect site workers during construction?
Unknown

TEXAS PORTS 2015 – 2016 CAPITAL PROGRAM TECHNICAL APPENDIX
PAGE 93
TxDOT Maritime Environmental Review Checklist 14) What, if any, are the environmental considerations
during construction?
15) Describe the project’s environmental benefits. In addition to the natural benefits associated with implementation of mitigation, benefits include fuel savings, reduction in air emissions, socio-economic benefits (job creation, enhancement of the local economy).
16) What is the anticipated project delivery schedule? Environmental clearance/permitting for this project is likely to fall within the FY15-16 Texas Ports Capital Program delivery schedule.
17) What recommendations do you have for the applicant to efficiently proceed with the proposed project?
Once obtained, conditions of the USACE permit must be followed. Filing an NOI with TCEQ, preparation of a SWPPP, and implementation of storm water BMPs will be required.
Engineer Review The Port provided several plan views and an estimated construction cost worksheet. Detailed engineering, drawings, and specifications were not available since the project is in a preliminary phase of development.
It was assumed that the proposed new rail spurs will consist of a typical rail spur section with turnouts, timber ties, and ballast. Typical existing rail and ballast removal is anticipated. Allowances have been made for storm water drainage. Additionally, it is assumed that six acres of land will be prepared and the embankment and a surface course placed following typical construction procedures.

TEXAS PORTS 2015 – 2016 CAPITAL PROGRAM TECHNICAL APPENDIX
PAGE 94
Cost Estimate The cost estimate is based on preliminary layouts provided by the Port. TxDOT 3 and 12-month moving average unit prices, along with previous project experience, was used in developing the cost estimate. A 15% construction contingency has been added but no escalation contingencies have been included.
The cost estimate was developed without any specialty design service information. These services include geotechnical reports, drainage impacts, utility investigations, environmental impacts and survey information. This cost estimate was higher than the Port’s which can be attributed to regional price fluctuations and contingency allowances. A prudent recommendation is that the Port request $7.1M for their project.
Schedule Based on a review of the documents provided by the Port of Port Arthur, the engineering phase appears to be in the preliminary phase. The drawings and technical specifications required for the proposed project would require approximately two to three months. A two- month bidding phase and a construction duration of six to nine months is anticipated for a project of this scope. Conservatively, this project could be constructed in 12-18 months.

TEXAS PORTS 2015 – 2016 CAPITAL PROGRAM TECHNICAL APPENDIX
PAGE 95
Port of Victoria Project Description: The proposed project is to construct a multipurpose dock with liquid loading, and general cargo capabilities in the western portion of Port of Victoria Basin to accommodate continued growing demand for oil, frac sand, and project cargo movements. This project will allow for direct barge to rail and rail to barge transfers and truck access to both modes.
Estimated Project Cost: $7,500,000
Economics Review Summary The Port of Victoria has submitted a request for a new multi-purpose barge dock to be used primarily for loading petroleum onto barges. The Port’s argument for purpose and need includes the following reasons: tenant requests and potential cargo growth due to the booming Eagle Ford Shale oil business. The Port requests funding support because cargo revenues are insufficient to pay for the new dock at this time. This document provides a summary of the Port’s arguments as well as an evaluation of the Port’s
request and supporting documentation.
Overview of the Port’s Request The Port of Victoria needs a new multi-purpose barge dock (POV Multi-Purpose Dock 4) to be built in the west portion of the Port of Victoria Basin. The dock will be used for a growing cargo volume of liquid bulk petroleum, primarily crude oil and general cargo. The cargo demand is for crude oil, frac sand, fertilizer, and project cargo movements. This project site is served by both rail and roadway, and the primary use will be for direct transfers of dry and liquid bulk cargo between trucks and rail cars into barges for outbound shipment. From Victoria, the crude oil moves by barge to the GIWW and then east and west to refineries in the Houston and Corpus Christi areas. The project is estimated to cost $7.5 million.
Figure 49: Project Location
Reference: Port’s PCP Request

TEXAS PORTS 2015 – 2016 CAPITAL PROGRAM TECHNICAL APPENDIX
PAGE 96
Purpose & Need Summary This summary is based upon the Port’s statements but at the date of this draft, the Port has not validated these statements. References are provided to sources of claims made in the footnotes. In some cases, the Port is assisted by support for its argument.
Figure 50: Conceptual Layout of the Proposed New Dock 4 Area at the Port of Victoria
(Graphic sketch by Cargo Velocity)
Summary of Purpose and Need for the Project: To facilitate further future growth, the Port believes that this dock project is a critical priority in its capital improvement plan. Recently, the rise of petroleum production from the Eagle Ford Shale area has caused a significant increase in liquid bulk cargo tonnage at the Port. The Port of Victoria is one of the closest ports to this new source of petroleum products, and has seen a tripling in petroleum cargo since 2010. This analysis shows that the existing docks have reached or surpassed their practical capacity and the Port and industry are working 24/7 to try to manage this demand. Therefore, the Port has identified Dock No. 4 as the solution to satisfying tenant demands for additional capacity.
Summary of Need for Outside Funding: The Port of Victoria is seeking outside funding to accelerate this needed development. The Port is considering multiple avenues to fund the required infrastructure projects. The PAAF grant is attractive due to the early expected award date. Alternative funding mechanisms will take more time. A delay in funding will delay project developments, related job impacts, and other benefits to the State. Supporting arguments and analysis on behalf of the Port are presented in the following sections. Data was applied from the Port and from public sources.

TEXAS PORTS 2015 – 2016 CAPITAL PROGRAM TECHNICAL APPENDIX
PAGE 97
Purpose and Need for the Project - Support Documentation: In this section, the Port of Victoria provides supporting evidence to reinforce its arguments for the purpose of and need for the project. Each of the arguments in bold demonstrates relevant evidence that the proposed project is important and rational.
1) Eagle Ford Shale oil production and distribution has risen recently, is a source of large cargo volumes, and will remain a source for many years.
Figure 51: Estimated Eagle Ford Shale Petroleum Production
Since 2010, the Eagle Ford Shale petroleum production has risen to become a major cargo source in the State of Texas. Figure 51 shows that the production of Eagle Ford Shale oil and gas products is estimated to reach over 2 million barrels per day in 2020 and will still be producing well over 1 million barrels per day in 2040. The Eagle Ford Shale product could be a major long-term business opportunity for the Port of Victoria. The proposed project will help the Port to capitalize on this opportunity by increasing the Port’s capacity to accommodate greater liquid bulk cargo movement.
2) Port of Victoria is close to source of petroleum exports
Figure 52: Location of the Port of Victoria Relative to Eagle Ford Shale
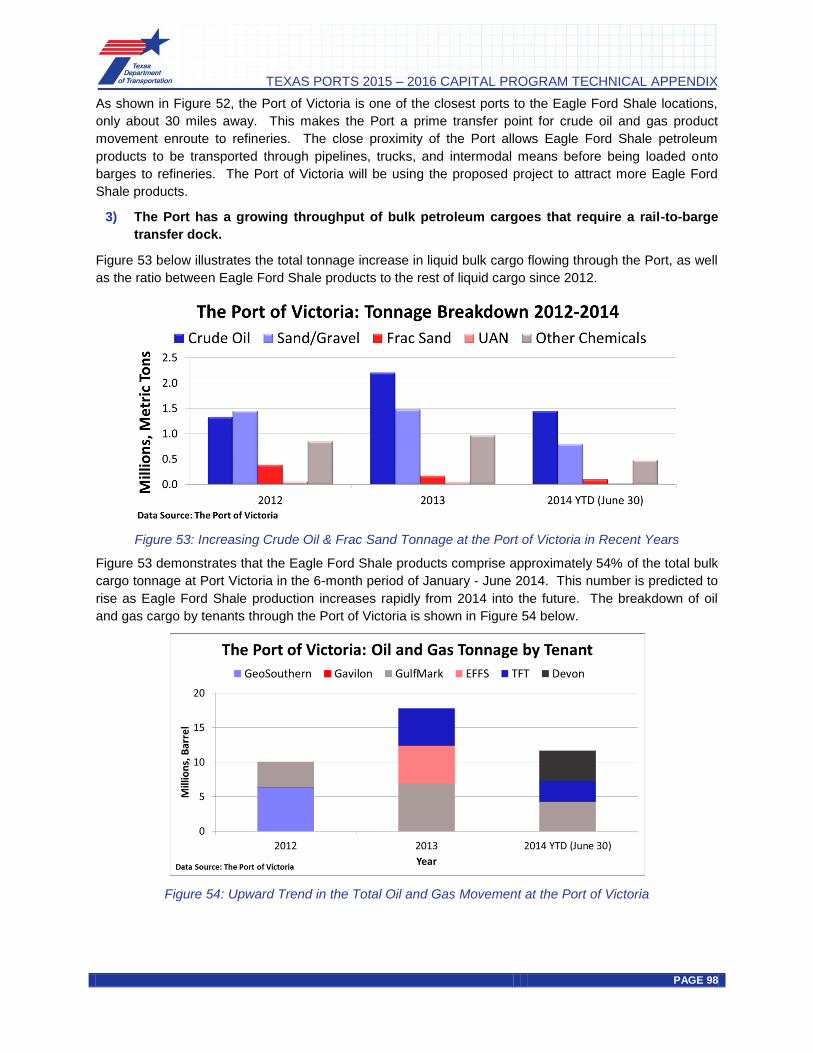
TEXAS PORTS 2015 – 2016 CAPITAL PROGRAM TECHNICAL APPENDIX
PAGE 98
As shown in Figure 52, the Port of Victoria is one of the closest ports to the Eagle Ford Shale locations, only about 30 miles away. This makes the Port a prime transfer point for crude oil and gas product movement enroute to refineries. The close proximity of the Port allows Eagle Ford Shale petroleum products to be transported through pipelines, trucks, and intermodal means before being loaded onto barges to refineries. The Port of Victoria will be using the proposed project to attract more Eagle Ford Shale products.
3) The Port has a growing throughput of bulk petroleum cargoes that require a rail-to-barge transfer dock.
Figure 53 below illustrates the total tonnage increase in liquid bulk cargo flowing through the Port, as well as the ratio between Eagle Ford Shale products to the rest of liquid cargo since 2012.
Figure 53: Increasing Crude Oil & Frac Sand Tonnage at the Port of Victoria in Recent Years
Figure 53 demonstrates that the Eagle Ford Shale products comprise approximately 54% of the total bulk cargo tonnage at Port Victoria in the 6-month period of January - June 2014. This number is predicted to rise as Eagle Ford Shale production increases rapidly from 2014 into the future. The breakdown of oil and gas cargo by tenants through the Port of Victoria is shown in Figure 54 below.
Figure 54: Upward Trend in the Total Oil and Gas Movement at the Port of Victoria

TEXAS PORTS 2015 – 2016 CAPITAL PROGRAM TECHNICAL APPENDIX
PAGE 99
Data shows that the Port’s tonnage in 2014 is expected to exceed its previous year’s tonnage due to the
increased crude oil cargo. The Port critically needs this new dock project in order to be able to adapt to growing demands and sustain the business activities that the Port has documented.
4) The Port's tenants are investing in the overall infrastructure.
In addition to growing cargo tonnage and high berth occupancy, the claim on future production increase is also supported by further major investments to the logistics system of Eagle Ford Shale petroleum products. Reuters reported in September 2013 that the Port of Victoria has a maximum daily capacity of 90,000 barrels per day16. In July 2014, Victoria Express Pipeline finished constructing a major pipeline from the Blackhawk central delivery point to the inlet of Devon Gas Services terminal at the Port. It is capable of delivering 100,000 barrels per day17. In order to cope with the increasing demand, the Port has constructed a new barge fleet terminal in February 2014 in cooperation with Victoria Fleet LLC (P3 agreement) to increase the existing daily maximum capacity to 150,000 barrels per day18. These major investments show the scale at which the Eagle Ford Shale petroleum products are increasing.
5) The Port's existing multi-use docks have reached their practical capacity.
The Port’s reports show that the existing oil dock is operating almost at capacity. Figure 55 illustrates the operation of the oil dock during the team visit on August 5, 2014.
16
http://www.reuters.com/article/2013/09/30/shipping-victoria-idUSL1N0HQ2D920130930
17http://eaglefordshale.com/pipeline-midstream-news/devon-subsidiary-constructing-new-eagle-ford-oil-pipeline/
18 http://www.reuters.com/article/2013/09/30/shipping-victoria-idUSL1N0HQ2D920130930

TEXAS PORTS 2015 – 2016 CAPITAL PROGRAM TECHNICAL APPENDIX
PAGE 100
Figure 55: Current Oil Dock Operation at the Port of Victoria
The newly constructed barge fleeting area as shown below in Figure 56 is located on the south property of the Port and is used to minimize a barge’s travel time through the 35-mile Victoria Barge Canal. By staging the barges close to the terminals, there is less time wasted waiting to move a barge to an empty dock. As shown in Figure 56, the fleeting area was occupied by barges that were waiting to dock during the site visit. This was the first week of operation for the barge fleeting area.

TEXAS PORTS 2015 – 2016 CAPITAL PROGRAM TECHNICAL APPENDIX
PAGE 101
Figure 56: Barges at the Port of Victoria's Fleeting Area
Need for Outstanding Funding – Support Documentation In this section, the Port of Victoria provides supporting evidence to reinforce its arguments for the need for external funding for the project.
1) PAAF grant will allow the Port of Victoria to quickly grow and meet increasing Eagle Ford Shale cargo movement demand.
Due to the rapid pace at which liquid bulk cargo tonnage grows, the Port of Victoria believes that immediate investment is needed to preserve the ability to accommodate demands in the short-term. The urgency of the funding need rules out the possibility of issuing revenue bonds due to the lengthy issuing process. The Port is convinced that a PAAF grant will be the ideal funding source for the Port to secure capital for the project.

TEXAS PORTS 2015 – 2016 CAPITAL PROGRAM TECHNICAL APPENDIX
PAGE 102
The PAAF funding will allow the Port to sustain growth and to capitalize on the Eagle Ford Shale oil opportunity.
Figure 57: Increased Service Charges Contribute to Rising Revenue at the Port of Victoria
Figure 57 shows that the Port’s revenue from service charges represented 54% of the Port’s total
revenue in 2013 compared to 27% in 2010. Capitalizing on the Eagle Ford Shale business will help the Port of Victoria sustain further growth. However, the Port of Victoria claims that short-term increases in revenue will not be adequate to fund the required capital projects, as shown in Figure 10.
Figure 58: The Port of Victoria Needs External Funding for a Capital Infrastructure Project
At this point, issuing revenue bonds will hurt the Port’s development due to long-term obligation burdens. If the PAAF grant is awarded, the Port aims to maximize cash savings from incoming business in order to be able to meet matching funds by the time construction starts in June 2015.
Overall Analysis of Port Arguments In this section, the Port’s arguments are summarized into standard categories and evaluated.
Standard Arguments: 1. Funding Argument: PAAF funding will accelerate the project development. Public bonds are an alternative to a PAAF grant but obtaining them is a much longer process.

TEXAS PORTS 2015 – 2016 CAPITAL PROGRAM TECHNICAL APPENDIX
PAGE 103
2. Business Argument: The Port has more demand that it can meet for customers and the proposed new facility will hold eight new barge docks. They will probably generate enough revenue to satisfy industry demand for the mid-term. The facility will be heavily used once built. Tonnage and revenue quadrupled in three years and, based on customer discussions, might double again. The new dock could also increase liquid petroleum cargo throughput and create higher cargo velocity.
3. Self-Sustaining Argument: The Port will earn sufficient revenue to sustain continued use of the facility once built, and pay for maintenance in part because the Port is an important port for Eagle Ford shale product distribution.
4. Catalyst Argument: The facility will support development of adjacent tank farms, access roads and pipelines, and other infrastructure that will support jobs development.
5. Access Arguments: Not applicable.
6. Growth Argument: The project will support port cargo growth. As the closest port to the Eagle Ford Shale crude oil business, the main dock is occupied “24-7” and liquid loading docks are at capacity.
7. Port Readiness: The Port staff is currently stretched thin by current demands for operations and potential new business. The new project work may need to be fully outsourced to a contractor engineering team to properly use the funds if they are provided. The Port staff is already addressing too many new tenant projects and requests (plus two more possible upcoming frac sand projects). Engineering plans are very preliminary.
Economic Impacts Analysis Summary The economic impact analysis focuses on the impacts created by the construction of a new multi-purpose barge loading facility on the west side of the turning basin at the Port of Victoria to support the continued growing demand for crude oil, frac sand, and project cargo movements. The Port of Victoria is the closest port to the Eagle Ford Shale oil production and as a result has more than quadrupled its tonnage and revenue in the last three years. Additionally, one-time impacts of construction activity associated with the project are also generated. Impacts are estimated in terms of jobs, personal earnings, business revenue, and state and local taxes. The baseline impacts of the Port of Victoria were developed in 2012 as part of the economic impact analysis of the State of Texas Port and Maritime Transportation System for the Texas Ports Association.
Based on data provided by the Port of Victoria, several letters of intent from existing tenants indicate that crude oil is expected to increase by 1.7 million tons and frac sand will increase by 450,000 tons. These increases are expected to happen immediately once the dock is completed. There is potential additional tonnage as the demand continues to rapidly grow and the Port can handle the throughput. The economic impacts generated by the new barge dock at the Port of Victoria are summarized in Table 28.

TEXAS PORTS 2015 – 2016 CAPITAL PROGRAM TECHNICAL APPENDIX
PAGE 104
Table 28: Summary of the Economic Impacts Generated by Port of Victoria
Note: Totals may not add due to rounding
As Table 28 indicates, the Port of Victoria will generate the following economic impacts for the local and regional economy immediately after project completion.
Additional 450,000 tons of frac sand and 1.7 million tons of crude oil will be handled at the Port of Victoria.
316 total jobs are generated by the movement of the additional frac sand and crude oil at the Port of Victoria. These include:
o 113 direct jobs
o 129 induced jobs
o 75 indirect jobs
$23.2 million of direct, induced, indirect wages and salaries, and local consumption expenditures are generated by the additional movement of frac sand and crude oil at the Port of Victoria.
Businesses providing services at the barge facility will receive nearly $99.3 million of revenue, excluding the value of cargo shipped through the facility.
$1.8 million of state and local taxes were generated by this activity.
Additionally, the construction of the new barge loading facility will create one-time economic impacts during construction. The anticipated project cost is $7.5 million. Construction impacts are estimated in terms of jobs, personal earnings, business revenue, and state and local taxes. These economic impacts are identified in Table 29.
VICTORIA Impact
Frac Sand 450,000
Crude Oil 1,666,667
JOBS
Direct 113
Induced 129
Indirect 75
TOTAL 316
PERSONAL INCOME ($ Thousands)
Direct $5,054
Re-spending/Local Consumption $14,556
Indirect $3,563
TOTAL $23,172
Direct Business Revenue ($ Thousands) $99,297
Local Purchases ($ Thousands) $6,077
STATE AND LOCAL TAXES ($ Thousands) $1,831

TEXAS PORTS 2015 – 2016 CAPITAL PROGRAM TECHNICAL APPENDIX
PAGE 105
Table 29: Economic Impacts Generated by Construction Activity
Note: Totals may not add due to rounding
The $7.5 million construction impact creates approximately 61,500 person-hours. Approximately 60,433 induced person-hours are created as a result of the local purchases of the individuals directly generated by the construction activity. An additional 40,733 indirect person-hours were supported by $1.7 million of purchases in the local and regional economy by the firms providing direct construction activity services.
The income impact is estimated by multiplying the average annual earnings (excluding benefits) by the corresponding number of direct jobs. The individual annual earnings multiplied by the corresponding job impact resulted in $1.1 million in personal wage and salary earnings. The impact of the re-spending of this direct income for local purchases is estimated using a personal earnings multiplier. The personal earnings multiplier is based on data supplied by the Bureau of Economic Analysis (BEA), Regional Input-Output Modeling System (RIMS II). The personal earnings multiplier was used to estimate the total income and consumption impact of $3.2 million, inclusive of the re-spending and local consumption impact. This additional re-spending of the direct income generates the 60,433 induced person-hours impact. The 40,733 indirect person-hours earned $1.0 million in indirect wages and salaries. Combining the direct, induced, and indirect personal income impacts, the total income impact is $5.3 million.
Construction activity of the new barge facility will generate $0.4 million of state and local taxes.
VICTORIA Construction
Total Construction Value $7,500,000
JOBS (Person hours)
Direct 61,500
Induced 60,433
Indirect 40,733
PERSONAL INCOME
Direct $1,119,300
Re-spending/Local Consumption $3,223,696
Indirect $973,276
TOTAL $5,316,272
LOCAL PURCHASES $1,660,084
STATE AND LOCAL TAXES $419,986

TEXAS PORTS 2015 – 2016 CAPITAL PROGRAM TECHNICAL APPENDIX
PAGE 106
Environmental Review The proposed multipurpose dock at Port of Victoria will include construction of a dock with steel piles and hydraulic dredging of the turning basin, both activities requiring coordination with the USACE and TCEQ. Limited environmental documentation was available for TxDOT review, and it is advisable that the applicant meet with the USACE to explore amending the expired permit (23261). Careful planning and utilization of the most expeditious permitting scenario is required for this project to meet the funding timelines associated with the 2015-2016 Texas Ports Capital Program. Once obtained, conditions of the USACE permit must be followed. Filing an NOI with TCEQ, preparation of a SWPPP, and implementation of storm water BMPs will be required.
TxDOT Maritime Environmental Review Checklist 1) Have environmental resource studies been conducted
to determine the presence/absence of regulated resources?
No. A previous permit was issued for a similar project; however, it has expired (2009).
2) If resources have been identified as being present on the proposed project site, have the resources been located and quantified?
A USACE Section 10 and Section 404 permit will be required to construct a dock with steel piles and hydraulically dredge the POV turning basin.
3) Will the proposed project affect any regulated environmental resources? Describe impact.
Yes, waters of the U.S. will be impacted. The presence of additional regulated resources on-site (wetlands) is currently unknown.
4) Does the proposed project require an environmental permit to impact the regulated resources?
Yes
5) If no permit is required, why not? 6) If yes, what type and from what agency? USACE Section 404 and Section 10, TCEQ
Section 401 7) Has the applicant coordinated with resource agencies?
If so, please list. No
8) Is mitigation required to offset impacts? Unknown 9) If yes, has a mitigation plan been developed? What
does the plan include? Unknown
10) Does NEPA apply to this proposed project? If federal dollars are utilized, a NEPA document will be required.
11) If yes, what is the current status of the NEPA document?
Not yet initiated
12) Are there any known contamination-related issues on the proposed project site?
Unknown
13) If contamination is known to exist on the proposed project site, what steps are being taken to remediate any known soil/groundwater conditions and to protect site workers during construction?
14) What, if any, are the environmental considerations during construction?
Once obtained, conditions of the USACE permit must be followed. Filing an NOI with TCEQ, preparation of a SWPPP, and implementation of storm water BMPs will be required.
15) Describe the project’s environmental benefits. Fuel savings, reduction in air emissions, socio-economic benefits (job creation, enhancement of the local economy).

TEXAS PORTS 2015 – 2016 CAPITAL PROGRAM TECHNICAL APPENDIX
PAGE 107
TxDOT Maritime Environmental Review Checklist 16) What is the anticipated project delivery schedule? Implementation is possible within 18 to 24
months; however, permitting timelines are likely to exceed the two-year implementation requirements associated with the FY15-16 Texas Ports Capital Program.
17) What recommendations do you have for the applicant to efficiently proceed with the proposed project?
It is advisable that the applicant meet with the USACE to explore amending the expired permit (23261). Careful planning and utilization of the most expeditious permitting scenario is required for this project to meet the funding timelines associated with the 2015-2016 Capital Program.
Engineer Review The proposed project is the construction of a new 750 feet long by 50 feet wide multipurpose dock with general cargo and liquid loading capabilities. Dredging in front of the proposed dock will be required. The Port provided an overall plan view and Corps of Engineers permit documents that included permit level drawings. Detailed engineering, drawings, and specifications were not available.

TEXAS PORTS 2015 – 2016 CAPITAL PROGRAM TECHNICAL APPENDIX
PAGE 108

TEXAS PORTS 2015 – 2016 CAPITAL PROGRAM TECHNICAL APPENDIX
PAGE 109

TEXAS PORTS 2015 – 2016 CAPITAL PROGRAM TECHNICAL APPENDIX
PAGE 110
It was assumed that the proposed new dock would be constructed using typical dock construction techniques and materials. No general cargo handling equipment and liquid loading equipment was included.
Cost Estimate The cost estimate for the project is based on the information provided in the preliminary layout. Average unit prices were obtained with input from local dredging contractors and previous experience in dock construction. A 15% construction contingency has been added to the estimated cost but no escalation contingencies have been included.

TEXAS PORTS 2015 – 2016 CAPITAL PROGRAM TECHNICAL APPENDIX
PAGE 111
The cost estimate was developed without any specialty design service information. These services include geotechnical reports, drainage impacts, utility investigations, environmental impacts and survey information.
Schedule Based on a review of the documents provided by the Port of Victoria, the engineering phase appears to be in the preliminary stage. The drawings and technical specifications required for the proposed project would require approximately four to six months. A two-month bidding phase and construction duration of 12 to 18 months is anticipated. Conservatively, the project could be constructed in 18-24 months.

TEXAS PORTS 2015 – 2016 CAPITAL PROGRAM TECHNICAL APPENDIX
PAGE 112
References PORTS # REFERENCES
Port Arthur 1 Hazardous Materials Initial Site Assessment (ISA) Report. Rep. N.p.: n.p., n.d. Web. Apr. 2014.
2 Federal Transit Administration. Nose Impact Assessment Spreadsheet. N.p.: n.p., 22 July 2014. XLSX.
3 Berg Oliver Associates. Nose Exhibit. N.p.: n.p., 22 July 2014. PDF.
4 German Pellets GmbH. Port of Port Arthur - Berth 6 Expansion Project. N.p.: n.p., 31 May 2013. PDF.
5 Department of the Army Permit. Permit No SWG-2011-00303. N.p.: n.p., 11 Aug. 2014. PDF.
6 Lockwood, Andrews & Newnam, Inc. Berth 6 Design. N.p.: n.p., 18 Aug. 2014. PDF.
7 German Pellets GmbH. Port of Port Arthur, Berth 6 Expansion and On-Dock Rail. N.p.: n.p., 17 Apr. 2014. PDF.
8 Port of Port Arthur, Multimodal Rail and Marine Cargo Project. N.p.: n.p., 22 July 2014. PDF.
9 Port of Port Arthur, Multimodal Rail and Marine Cargo Project - Estimated
Construction Cost Worksheet. N.p.: n.p., 22 July 2014. XLSX
10 Berg Oliver Associates, Inc. Project Coordination Request for Historical Studies
Project. N.p.: n.p., 22 July 2014. PDF.
11 Berg Oliver Associates, Inc. Archeological Information for TxDOT Env Coordination:
CMAQ Rail and Sidewald Project. N.p.: n.p., 22 July 2014. PDF.
12 Notice of Application, Regulatory Division, Evaluation Branch, North Unit, Standard
Permit. N.p.: n.p., 17 June 2014. PDF.
13 Lockwood, Andrews & Newnam, Inc. Project File Number SWG-2011-00303. N.p.: n.p., 16 May 2014. PDF.
14 Port of Port Arthur Navigation District. 2015-2016 Texas Ports Capital Program - Project Pre-Application Form. N.p.: n.p., n.d. PDF.

TEXAS PORTS 2015 – 2016 CAPITAL PROGRAM TECHNICAL APPENDIX
PAGE 113
PORTS # REFERENCES
Beaumont 1 Lanier and Associates Consulting Engineers Inc. Port of Beaumont - Southend Grade Separation Project - Preliminary Cost Estimate Description. N.p.: n.p., 3 July 2014. PDF
2 Lanier & Associates Consulting Engineers Inc. Port of Beaumont - South End Grade Separation Project Overpass - Plan and Elevation. Digital image. N.p., n.d. Web. 17 July 2014.
3 Port of Beaumont Navigation District. 2015-2016 Texas Ports Capital Program - Project Pre-Application Form. N.p.: n.p., n.d. PDF.

TEXAS PORTS 2015 – 2016 CAPITAL PROGRAM TECHNICAL APPENDIX
PAGE 114
PORTS # REFERENCES
Brownsville 1 Brownsville Navigation District. 2015-2016 Texas Ports Capital Program - Project Pre-Application Form. N.p.: n.p., n.d. PDF.
2 Tiger Grant Application for Brownsville Navigation District InterPort Expansion
Project. N.p.: n.p., 18 Aug. 2014. PDF.
3 Port of Brownsville Y-T-D 2012 2013 Cargo Statistics. N.p.: n.p., 18 Aug. 2014. PDF.
4 Oil Dock #5 Summary Report. N.p.: n.p., 18 Aug. 2014. PDF.
5 FEMA. Port of Brownsville - Dock Construction, Piling Installation, Boat Lift Project. Rep. no. # 2010-PU-T0-0118-IJ#2 (7058). N.p.: n.p., n.d. Web. Sept. 2012.
6 Welcome to the Port of Brownsville. Rep. N.p.: n.p., 18 Oct. 2009.
7 Presentation Port of Brownsville. Rep. N.p.: n.p. 27 Aug. 2013.
8 Permit Application - SWG-2009-00689. N.p.: n.p., 29 Dec. 2009. PDF.
9 HDR Engineering. Brownsville Navigation District - Oil Dock No. 6. N.p.: n.p., May 2010. PDF.
10 HDR Engineering. Brownsville Navigation District - Oil Dock No. 6 - Engineering
Design - Technical Specifications. N.p.: n.p., 6 June 2011. PDF.
11 Table of Physical Characteristics of the Port Facilities of the Port of Brownsville. N.p.: n.p., 14 August 2014. PDF.
12 HDR Engineering. Opinion of Probable Project Cost - Oil Dock No. 6. N.p.: n.p., 2 March 2011. PDF.

TEXAS PORTS 2015 – 2016 CAPITAL PROGRAM TECHNICAL APPENDIX
PAGE 115
PORTS # REFERENCES
Corpus Christi 1 Goldston Engineering. Final Submittal - Preliminary Engineering Report For La
Quinta Multi-Purpose Dock Facility Project. Rep. no. 07-036A. N.p.: n.p., n.d. Web. 08 June 2014.
2 Lockwood, Andrews & Newnam, Inc. Port of Corpus Christi - La Quinta
Infrastructure And Multi-Purpose Container Yard - Preliminary Engineering
Report. Rep. N.p.: n.p., n.d. Web. Jan. 2011.
3 La Quinta Wharf and Rail Project - 2014 USDOT TIGER Discretionary Grant
Program. Rep. N.p.: n.p., n.d. Web. 25 Apr. 2014.
4 Attachment A - PCCA LQ Gateway Terminal - Cargo Storage Yard Expansion - Justification of Grant Need. N.p.: n.p., 11 Aug. 2014. PDF.
5 Attachment B - La Quinta transportation Improvements Exhibit. N.p.: n.p., 11 Aug. 2014. PDF.
6 Attachment C - 2013-2014 Cargo Tonnage by Commodity Report. N.p.: n.p., 11 Aug. 2014. PDF.
7 TPCP Grant. N.p.: n.p., 11 Aug. 2014. PDF.
8 Goldston Engineering. La Quinta Multi-Purpose Dock Facility Project. N.p.: n.p., 1 June 2011. PDF.
9 Lockwood, Andrews & Newnam, Inc. Interim General Cargo Yard Layout. N.p.: n.p., Oct. 2010. PDF.
10 Port of Corpus Christi Authority. 2014-2015 Texas Ports Capital Program -
Project Pre-Application Form. N.p.: n.p., 7 July 2014. PDF.
11 USACE SWG-2001-02261 Amendment. N.p.: n.p., 14 Aug. 2014. PDF.
12 USACE SWG-2001-02261 Extension. N.p.: n.p., 14 Aug. 2014. PDF.

TEXAS PORTS 2015 – 2016 CAPITAL PROGRAM TECHNICAL APPENDIX
PAGE 116
PORTS # REFERENCES
Galveston 1 2015 Cruise Vsl Sched. N.p.: n.p., 11 Aug. 2014. PDF.
2 2016 Cruise Vsl Sched. N.p.: n.p., 11 Aug. 2014. PDF.
3 Requirements Document and Aerial Image of Project Site. N.p.: n.p., 17 July 2014. DOCX.
4 Port of Galveston. Conceptual Drawing of Expanded and Modified Cruise Terminal 2
Building. N.p.: n.p., June 2014. PDF.
5 Copy of CRUISE GALVESTON 14 PSS Edits. N.p.: n.p., 11 Aug. 2014. PDF.
6 Copy of CRUISE PORT Annual Recap 2013. N.p.: n.p., 11 Aug. 2014. PDF.
7 POG-T2 Expansion - 3d Cruise Stats for CT2 Expansion. N.p.: n.p., 11 Aug. 2014. XLSX.
8 Rough Estimate Terminal Two Extension. N.p.: n.p., 30 July 2013. PDF.
9 The Economic Impact of Tourism on Galveston Island, Texas. N.p.: n.p., 14 May 2014. PDF.
10 Galveston Terminal Map. N.p.: n.p., 25 July 2014. PDF.
11 POG-T2 Expansion - 3d Rendering. N.p.: n.p., 11 Aug. 2014. PDF.
12 STBD Freedom at Cruise Terminal 2. N.p.: n.p., 11 Aug. 2014. PDF.
13 Port of Galveston. 2015-2016 Texas Ports Capital Program - Project Pre-Application
Form. N.p.: n.p., 7 July 2014. PDF.

TEXAS PORTS 2015 – 2016 CAPITAL PROGRAM TECHNICAL APPENDIX
PAGE 117
PORTS # REFERENCES
Houston 1 Port of Houston Authority. Bayport Terminal Complex - Phase 1 - Program
Management. N.p.: n.p., 30 Dec. 2008. PDF.
2 Port of Houston Authority. Request For Qualifications To Perform Professional
Engineering Services for Design Rail Spur at Bayport Terminal. N.p.: n.p., 29 Aug. 2014. PDF.
3 Lockwood, Andrews & Newnam, Inc. Intermodal Yard Rail - Warehouse Segment. N.p.: n.p., 10 Apr. 2014. PDF.
4 Port of Houston Authority. RFQ Details. N.p.: n.p., 29 Aug. 2014. PDF.
5 Port of Houston Authority. Request For Qualifications To Perform Professional
Engineering Services for Design Rail Spur At Bayport Terminal. Rep. N.p.: n.p., n.d. Web. 02 June 2014.
6 Port of Houston Authority. Broadway Second Main Track (TIGER VI). N.p.: n.p., 28 Apr. 2014. XLSX.
7 Port of Houston Authority. Broadway Second Main Track Project: TIGER VI Grant,
Houston, Texas. N.p.: n.p., 28 Apr. 2014. PDF.
8 Environmental Assessment and Statement of Findings. N.p.: n.p., 28 Apr. 2014. PDF.
9 Port of Houston Authority. 2015-2016 Texas Ports Capital Program - Project Pre-
Application Form. N.p.: n.p., 7 July 2014. PDF.

TEXAS PORTS 2015 – 2016 CAPITAL PROGRAM TECHNICAL APPENDIX
PAGE 118
PORTS # REFERENCES
Port Mansfield
1 Consistency With the Texas Coastal Management Program. N.p.: n.p., 12 Aug. 2014. PDF.
2 Gulf Intercoastal Waterway. N.p.: n.p., 21 Aug. 2014. PDF.
3 USACE Galveston District. Gulf Intracoastal Waterway - Pipeline Dredging Channel
to Port Mansfield. N.p.: n.p., 19 Aug. 2014. PDF.
4 USACE Galveston District. CPM-SPECS-2014. N.p.: n.p., 19 Aug. 2014. PDF.
5 USACE Galveston District. Draft Plans & Specifications for Channel to Port
Mansfield Operations and Maintenance Dredging. N.p.: n.p., 31 July. 2014. PDF.
6 LJA Engineering. Port Mansfield Capital Expenditures Plan. Rep. no. 07-036A. N.p.: n.p., n.d. Web. 10 Dec. 2013.
7 Willacy County Navigation District. 2015-2016 Texas Ports Capital Program - Project
Pre-Application Form. N.p.: n.p., 7 July 2014. PDF.

TEXAS PORTS 2015 – 2016 CAPITAL PROGRAM TECHNICAL APPENDIX
PAGE 119
PORTS # REFERENCES
Palacios 1 Bid Tabulation - Matagorda County Navigation District No. 1 - Turning Basin No.1
Bulkhead Replacement. N.p.: n.p., 14 Apr. 2012. PDF.
2 Bid Tabulation - Matagorda County Navigation District No. 1 - Turning Basin No.1
West Dock Repairs - Phase 1. N.p.: n.p., 09 July 2010. PDF.
3 Urban Engineering. Dock Condition Survey. Rep. N.p.: n.p., n.d. Web. Nov. 2012.
4 Bid Tabulation - Turning Basin No.1 West Dock Repairs - Phase 2. N.p.: n.p., 23 July 2014. PDF.
5 Bid Tabulation - Matagorda County Navigation District No. 1 - Turning Basin No.4. N.p.: n.p., 2 April 2008. PDF.
6 Matagorda County Navigation District No. One. 2015-2016 Texas Ports Capital
Program - Project Pre-Application Form. N.p.: n.p., 7 July 2014. PDF.
PORTS # REFERENCES
Victoria 1 Victoria County Navigation District. 2015-2016 Texas Ports Capital Program - Project
Pre-Application Form. N.p.: n.p., 7 July 2014. PDF.
2 POV_USACE Permit 23261. N.p.: n.p., 17 June 2004. PDF.

TEXAS PORTS 2015 – 2016 CAPITAL PROGRAM
Appendix B Port Profiles

1. TxDOT Port Report, pg. 6 2. Texas Ports 2011 – 2012 Capital Program, pg. A-21 3. Calhoun Port Authority website, http://www.calhounport.com/about/impact.php UPDATED 8/2014
2323 FM 1593 South Point Comfort, Texas www.calhounport.com (361) 987-2813 Port Board Randy L. Boyd. Board Chairman H.C. “Tony” Wehmeyer, Jr. Board Secretary Shields A. “Tony” Holladay, Sr. Dell R. Weathersby J.C. Melcher, Jr. Aron Luna Port Director Charles R. Hausmann, CPA Governing Body The Port Authority is governed by a Port Board made up of six members elected from districts within Calhoun County. The Port Director and a full-time professional staff are responsible for port management and day-to-day operations. The Port Authority serves as the local non-federal sponsor of the Matagorda Ship Channel which extends 24 miles from the Point Comfort turning Basin to the Gulf of Mexico.¹
PORT AT-A-GLANCE Calhoun Port Authority • Point Comfort, Texas
Legal Name: Calhoun Port Authority Draft: Deep
2013 Cargo Tonnage: 4,572,765² (All commodity types)
Annual Economic Impact: $ 2 BILᶾ 5,300 Direct Jobs | 4,590 Induced Jobs
Top Commodity
Chemicals
Fertilizers
Petroleum Products
Bauxite

1. TxDOT Port Report, pg. 6 2. Texas Ports 2011 – 2012 Capital Program, pg. A-21 3. Calhoun Port Authority website, http://www.calhounport.com/about/impact.php UPDATED 8/2014
2323 FM 1593 South Point Comfort, Texas www.calhounport.com (361) 987-2813 Port Board Randy L. Boyd. Board Chairman H.C. “Tony” Wehmeyer, Jr. Board Secretary Shields A. “Tony” Holladay, Sr. Dell R. Weathersby J.C. Melcher, Jr. Aron Luna Port Director Charles R. Hausmann, CPA Governing Body The Port Authority is governed by a Port Board made up of six members elected from districts within Calhoun County. The Port Director and a full-time professional staff are responsible for port management and day-to-day operations. The Port Authority serves as the local non-federal sponsor of the Matagorda Ship Channel which extends 24 miles from the Point Comfort turning Basin to the Gulf of Mexico.¹
Background The Port of Port Lavaca-Point Comfort, governed by the Calhoun Port Authority, serves
as a gateway to world markets for the Texas Mid-Coast Region. The port plays a vital
role in supporting Texas chemical manufacturing industries and in building a stable
economic foundation for Calhoun County. It is served by the Matagorda Ship Channel
and the Gulf Intracoastal Waterway. Primary cargos handled are chemicals,
petrochemicals, aluminum ore and agricultural fertilizer. A key part of this mix is very
high value chemicals produced by area industries and sold for export to markets
around the world.¹
Assets
Three liquid cargo facilities
Dry bulk dock that went into full operation in 2011. It can handle bulk carriers
up to 740 ft. in length. The cargo handling system includes a spiral conveyor
unloading tower that travels on dock rails to access each cargo hold and feed a
continuous conveyor system that extends to nearby industrial sites
Connectivity
Direct highway access to US Hwy 59, US Hwy 87, SH 35 and SH 172
Served by the Point Comfort and Northern Railway, a short line railroad which
connects to the Union Pacific main line at a point 20 miles north of the Port’s
main harbor
Current and Future Projects
Project Description Estimated Cost (FY 13) Estimated Cost (FY 14)
Heavy Weight Corridor between Port and
Formosa ― ―
Calhoun LNG ― ― Matagorda Ship Channel Dredge
Maintenance ― ―
New Dredge Placement Area ― ― TOTAL ESTIMATED COST $― $―

Revised 08/2014
1225 Main Street Beaumont, TX 77704 (409) 835-5367 www.portofbeaumont.com Port Director & CEO David C. Fisher Commissioners C.A. “Pete” Sheldon President At-Large Lee E. Smith Vice President Georgine Guillory Secretary-Treasurer Pat Anderson Bill Darling Louis M. Broussard, Jr. Governing Body Port of Beaumont is a
navigation district and
political subdivision of the
state of Texas. The port is
governed by six
commissioners, elected on
staggered six-year terms by
voters in the district. Principal Trading Partners Brazil, Canada, Iraq, Russia,
China, Chile, Peru, Norway
and Nigeria
Service Area Midwest and Western
United States, Texas,
Mexico and Canada
0% 20% 40% 60% 80%
Short Tonnage (Millions) Foreign Trade (63%)
Domestic Trade (37%)
PORT AT-A-GLANCE Port of Beaumont • Beaumont, Texas
Legal Name: Port of Beaumont Navigation District Draft: Deep Of Jefferson County, Texas US Port Ranking: 5th in total tonnage (U.S. Army Corps of Engineers, 2012)
Total Trade: 78,515,000 short tons
Annual Economic Impact: $122.2 million $11.6 million in state and local taxes and $23.3 million in federal taxes
Top Commodities
Imports Exports
Forest Products Bulk Grain
Steel Forest Products
Project Cargo Potash
Aggregate Project Cargo
Jobs
Jobs Total
Direct 970
Induced 730
Indirect 165
Related 1,865
14,705
Vessel Calls (annual)
including barge/tug calls

Revised 08/2014
1225 Main Street Beaumont, TX 77704 (409) 835-5367 www.portofbeaumont.com Port Director & CEO David C. Fisher Commissioners C.A. “Pete” Sheldon President At-Large Lee E. Smith Vice President Georgine Guillory Secretary-Treasurer Pat Anderson Bill Darling Louis M. Broussard, Jr. Governing Body Port of Beaumont is a
navigation district and
political subdivision of the
state of Texas. The port is
governed by six
commissioners, elected on
staggered six-year terms by
voters in the district. Principal Trading Partners Brazil, Canada, Iraq, Russia,
China, Chile, Peru, Norway
and Nigeria
Service Area Midwest and Western
United States, Texas,
Mexico and Canada
PORT PROFILE
Port of Beaumont • Beaumont, TX The Port of Beaumont is a large cargo port located approximately 84 miles east of
Houston in Jefferson County. It is accessible from the Gulf Intracoastal Waterway
through the Sabine-Neches ship channel. The Port of Beaumont includes layberths for
ships of the Maritime Administration as well as various facilities to accommodate the
international and U.S. products that pass through the port. The Port of Beaumont is an
integral part of the Sabine-Neches Waterway, which is an 80-mile-long complex of
diversified public and private terminals on the Gulf of Mexico. The Sabine-Neches
Waterway is consistently ranked #4 in the United States in foreign waterborne
commerce and is referred to as "America's Energy Gateway.” The waterway is the
nation's #1 crude oil import channel; refineries along the ship channel produce some
60 percent of America's commercial jet fuel and 13 percent of the nation's daily fuel
consumption. The Port of Beaumont is the busiest port in the world for the U.S.
Military.
Assets
Port facilities include more than 620,000 square feet of covered storage space
alongside nine berths and more than 80 acres of open-air storage
Roll-On/Roll-Off Ramp, immediately downstream from Harbor Island Marine
Terminal
3.5-million-bushel-capacity grain elevator and dry bulk cargo facilities
Rail-to-ship bulk transfer facility; ship loading rate: 10,000 metric tons/day
Connectivity
Connected with the U.S. inland waterways
Three Class 1 railroads – BNSF, Kansas City Southern, Union Pacific
Connected to five (5) highways

Revised 08/2014
1225 Main Street Beaumont, TX 77704 (409) 835-5367 www.portofbeaumont.com Port Director & CEO David C. Fisher Commissioners C.A. “Pete” Sheldon President At-Large Lee E. Smith Vice President Georgine Guillory Secretary-Treasurer Pat Anderson Bill Darling Louis M. Broussard, Jr. Governing Body Port of Beaumont is a
navigation district and
political subdivision of the
state of Texas. The port is
governed by six
commissioners, elected on
staggered six-year terms by
voters in the district. Principal Trading Partners Brazil, Canada, Iraq, Russia,
China, Chile, Peru, Norway
and Nigeria
Service Area Midwest and Western
United States, Texas,
Mexico and Canada
Current and Future Projects (FY14)
Project Description Port Funding Port Access Funding
Orange County Crude Facility Rail
Improvement
$25,000,000 ―
Access Roadway to Hwy 90 with Overpass at
KCS
$9,000,000 ―
New Orange County Entrance & Security
Checkpoint
$2,250,000 ―
Power Substation/Cogeneration Plant for
Orange County
$8,000,000 ―
Siding Track Parallel to Union Pacific
Mainline
$15,600,000 ―
Multimodal Loading or Industrial Facility $45,000,000 ―
Barge Loading and Unloading (North of KCS
Bridge)
$25,000,000 ―
Lease Warehouses located along I-10 $17,000,000 ―
Second Access Roadway to I-10 $2,000,000 ―
Ship berths Acrsoss from ExxonMobil $65,000,000 ―
215-Acre Orange County Property
Mitigation and Fill
$35,000,000 ―
Deep Water Bulk Berth (OC Berth 2) $30,000,000 ―
Carroll St. Wharf Concrete Overlay $300,000 ―
Asphalt Paving of Lots 1 $1,100,000 ―
Demolition of North Yard and Realighment
of BNSF Track
$450,000 ―
Overpass at Carroll Street Crossing Port
Main Lead Track
$10,000,000 ―
Development of Carroll St. & Beford St. Lots $5,700,000 ―
Improvements to Lot No. 5 $1,500,000 ―
Remove and Replace Wharves No. 2, 3, 4 $43,250,000 ―
Wood Chip Lot Bulk Handling ― ―
Storage & Conveyors with Rail Improvements $10,000,000 ―
Construction of New Transit Shed at Wharves
2, 3, 4
$6,000,000 ―
Barge Loading and Unloading at Barge Dock $2,000,000 ―
Dock No. 1 Demolition and Construction of
Layberth
$20,000,000 ―

Revised 08/2014
1225 Main Street Beaumont, TX 77704 (409) 835-5367 www.portofbeaumont.com Port Director & CEO David C. Fisher Commissioners C.A. “Pete” Sheldon President At-Large Lee E. Smith Vice President Georgine Guillory Secretary-Treasurer Pat Anderson Bill Darling Louis M. Broussard, Jr. Governing Body Port of Beaumont is a
navigation district and
political subdivision of the
state of Texas. The port is
governed by six
commissioners, elected on
staggered six-year terms by
voters in the district. Principal Trading Partners Brazil, Canada, Iraq, Russia,
China, Chile, Peru, Norway
and Nigeria
Service Area Midwest and Western
United States, Texas,
Mexico and Canada
Project Description Port Funding Port Access Funding
New Grain Dock Pier and Export Towers $30,000,000 ―
Grain Dock Repairs $5,350,000 ―
Grain Dock Tower Foundation Replacements $7,000,000 ―
Harbor Island Pile Repairs $750,000 ―
Puzzle Switch at Grain Elevator Rail Yard $1,400,000 ―
Low Line Drainage & Pump Station $1,000,000 ―
Bank Stabilization – New Bulkhead Upstream
of Wharf 7
$5,000,000 ―
Jefferson/Orange County Maintenance
Dredging
$1,500,000 ―
TOTAL $431,150,000 ―
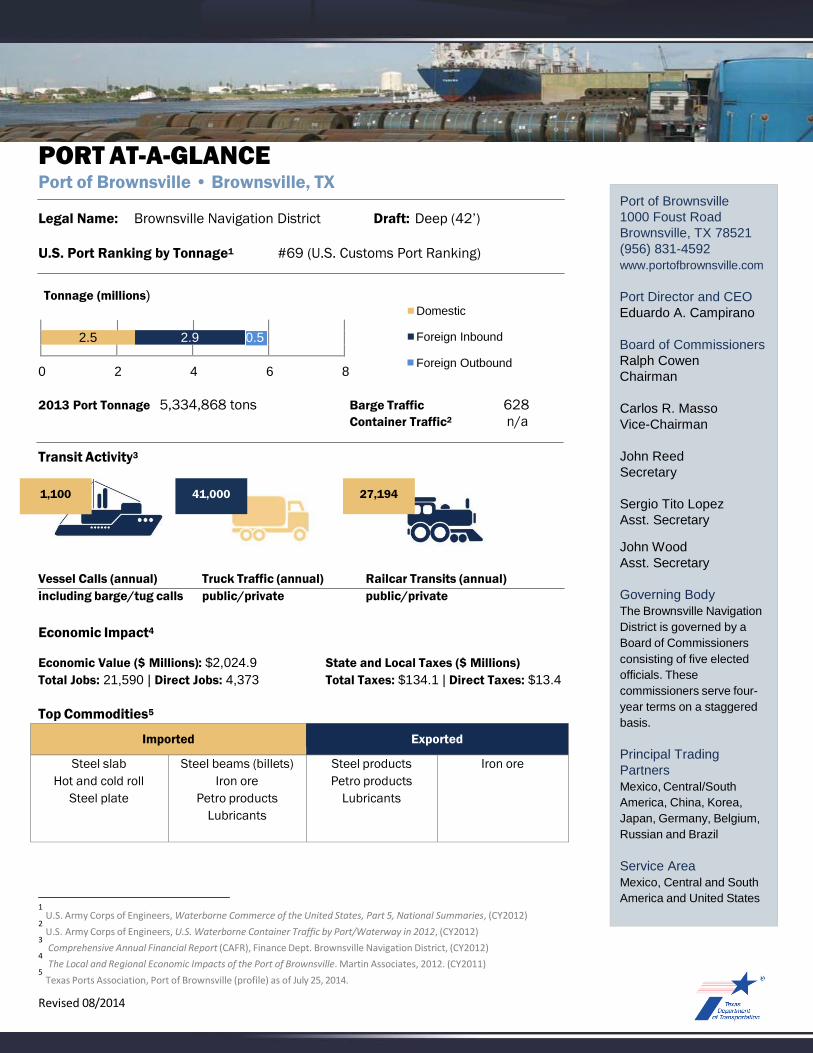
Revised 08/2014
PORT AT-A-GLANCE Port of Brownsville • Brownsville, TX
Legal Name: Brownsville Navigation District Draft: Deep (42’)
U.S. Port Ranking by Tonnage1 #69 (U.S. Customs Port Ranking)
Port of Brownsville 1000 Foust Road Brownsville, TX 78521 (956) 831-4592 www.portofbrownsville.com
Tonnage (millions)
2.5 2.9 0.5
0 2 4 6 8
Domestic
Foreign Inbound
Foreign Outbound
Port Director and CEO Eduardo A. Campirano
Board of Commissioners Ralph Cowen Chairman
2013 Port Tonnage 5,334,868 tons Barge Traffic 628
Container Traffic2 n/a
Transit Activity3
1,100 41,000 27,194
Carlos R. Masso Vice-Chairman
John Reed Secretary
Sergio Tito Lopez Asst. Secretary
Vessel Calls (annual)
including barge/tug calls
Economic Impact4
Truck Traffic (annual)
public/private
Railcar Transits (annual)
public/private
John Wood Asst. Secretary
Governing Body The Brownsville Navigation District is governed by a Board of Commissioners
Economic Value ($ Millions): $2,024.9 State and Local Taxes ($ Millions)
Total Jobs: 21,590 | Direct Jobs: 4,373 Total Taxes: $134.1 | Direct Taxes: $13.4
Top Commodities5
Imported
Exported
Steel slab
Hot and cold roll
Steel plate
Steel beams (billets)
Iron ore
Petro products
Lubricants
Steel products
Petro products
Lubricants
Iron ore
1 U.S. Army Corps of Engineers, Waterborne Commerce of the United States, Part 5, National Summaries, (CY2012)
2 U.S. Army Corps of Engineers, U.S. Waterborne Container Traffic by Port/Waterway in 2012, (CY2012)
3 Comprehensive Annual Financial Report (CAFR), Finance Dept. Brownsville Navigation District, (CY2012)
4 The Local and Regional Economic Impacts of the Port of Brownsville. Martin Associates, 2012. (CY2011)
5 Texas Ports Association, Port of Brownsville (profile) as of July 25, 2014.
consisting of five elected officials. These commissioners serve four- year terms on a staggered basis.
Principal Trading Partners Mexico, Central/South America, China, Korea, Japan, Germany, Belgium, Russian and Brazil
Service Area Mexico, Central and South America and United States

Revised 08/2014
PORT PROFILE Port of Brownsville • Brownsville, TX
The Port of Brownsville is located at the
southernmost tip of Texas at the end of a 17-mile
channel that meets the Gulf of Mexico at the Brazos
Santiago Pass. The Port sustains a vital ship
recycling industry that works on 80 percent of the
ships recycled in the U.S.6 During 2012, Keppel
AmFELS employed 2,400 to repair mobile drilling rigs
and platforms. More than 50 percent of the direct
revenue is generated by the oil rig and ship repair
operations. In terms of total revenue, scrap
generates the greatest revenue impact followed by
petroleum products. Barge and bunkering operations
generate the second largest local revenue impact,
followed by trucking operations.
Assets
Approximately 40,000 acres of land
Storage: 13 acres covered, 65 acres open
18 docks (12 cargo, 4 oil, 1 liquid, 1 bulk)
Foreign-Trade Zone (FTZ) #627
Source: TxDOT
Connectivity
Nearby several inland ports of entry into Mexico within Brownsville/Los Indios area
Barge lines serve the Port via the Gulf Intracoastal Waterway (GIWW)
Entrance Channel is 250 feet wide by 42 feet deep with a Turning Basin of 1,200 feet wide by 36 feet deep
Intermodal railroad services offered by Brownsville & Rio Grande Int’l Railroad (BRG)
Air freight service at the Brownsville/South Padre Island International Airport

Revised 08/2014
PORT PROFILE Port of Brownsville • Brownsville, TX
Current and Future Projects8
Project Description Estimated Cost (FY 13) Estimated Cost (FY 14)
Deepening and Widening Feasibility Study – Total estimated
costs: $650,000
$325,000 $325,000
Lift Station Improvements – Total estimated costs: $60,000 $30,000 $30,000
Water Tank Rehabilitation – Total estimated costs:
$1,033,000
$516,500 $516,500
Improvements to Docks, Warehouses and Cargo Laydown
Areas – Total estimated costs: $3,502,000
$1,751,000 $1,751,000
Port Security Improvements – Total estimated costs:
$3,986,000
$1,993,000 $1,993,000
Rail Improvements – Total estimated costs: $2,220,000 $1,100,000 $1,100,000
Deepening and Widening Feasibility Study: Total estimated
costs: $500,000
$250,000 $250,000
Improvements to Docks, Warehouses, and Cargo Laydown
Areas – Total estimated costs: $26,038,000
$13,019,000 $13,019,000
Water Tank Rehabilitation – Total estimated costs:
$982,000
$491,000 $491,000
TOTAL ESTIMATED COST $38,951,000 $19,475,500 $19,475,500
6 News Release #: MARAD 03‐13, Maritime Administrator Matsuda Tours Port of Brownsville, Dated: March 4, 2013
7 Foreign‐Trade Zone #62 operations during CY 2012 ranked nationally at #11 and #1 in Merchandise Received and Exports activity, respectively, according to the 74th Annual Report of the Foreign‐Trade Zones Board to the Congress of the United States, Appendix C, August 2013
8 Texas Ports 2013 – 2014 Capital Program, Texas Department of Transportation, page A‐5
9 Dock No. 16 construction partially funded by a $12 million federal TIGER (MARAD) grant in FY 2012 to expand Port container operations.

Revised 10/2014
1. Port of Corpus Christi website, http://www.portofcorpuschristi.com/index.php/general-information-155/statistics/yearly-statistics
Commodity
Tons
Petroleum
74,994,238
Dry Bulk
8,700,428
Grain
2,984,208
Chemical
1,951,762
Liquid Bulk
475,785
Break Bulk
348,059
PORT AT-A-GLANCE Port Corpus Christi • Corpus Christi, TX
Legal Name: Port of Corpus Christi Authority Draft: Deep
US Port Ranking: 5th Largest in U.S. for tonnage
222 Power Street Corpus Christi, TX 78401 (361) 882-5633 http://portofcorpuschristi.com/
Executive Director John LaRue
6,870¹
Vessel Calls (annual)
including barge/tug calls
2013 Cargo Tonnage: 89,454,480² (All commodity types in tons)
Cargo: Heavily focused on
liquid bulk, specifically
petroleum
Commissioners Judy Hawley Chairman
Richard Borchard Vice Chairman
Charles Zahn Secretary
Barbara Canales
Annual Economic Impact: $13.1 billion Direct Jobs 13,746 Induced Jobs 16,767 Indirect Jobs 15,607
Top Commodities Tonnage Figures for 2013
All tonnages are given in short tons
Al Jones
Richard Valls, Jr.
David Engel
Governing Body The Port Commission is comprised of seven members, each serving a staggered term of three years. Three commissioners are appointed by the Corpus Christi City Council, three commissioners are appointed by the Nueces County Commissioners Court, and one is appointed by the San Patricio County Commissioners Court.

Revised 10/2014
1. Port of Corpus Christi website, http://www.portofcorpuschristi.com/index.php/general-information-155/statistics/yearly-statistics
PORT PROFILE Port Corpus Christi• Corpus Christi, TX
The Port Corpus Christi has been generating business and jobs in South Texas for 88 years.
Strategically located on the western Gulf of Mexico, Port Corpus Christi is the fifth largest port
in the United States in total tonnage. The Port provides a straight, 45’ deep channel and
quick access to the Gulf of Mexico and the entire United States inland waterway system.
The Port of Corpus Christi Authority district boundaries encompass all of Nueces and San
Patricio counties.
Assets
The Port offers 36 miles of ship channel, more than 125 acres of open storage and
fabrication sites and more than 295,000 sq ft of covered dockside storage. Port Corpus
Christi operates Foreign Trade Zone #122. On July 2013, the Port received approval to
reorganize under the Alternative Site Framework. FTZ #122 now includes six counties within
its service area—Aransas, Bee, Jim Wells, Kleberg, Nueces and San Patricio.
222 Power Street Corpus Christi, TX 78401 (361) 882-5633 http://portofcorpuschristi.com/
Executive Director John LaRue
Commissioners Judy Hawley Chairman
Richard Borchard Vice Chairman
Charles Zahn Secretary
Barbara Canales
Al Jones
Richard Valls, Jr. David Engel Governing Body The Port Commission is comprised of seven members, each serving a staggered term of three years. Three commissioners are appointed by the Corpus Christi City Council, three commissioners are appointed by the Nueces County Commissioners Court, and one is appointed by the San Patricio County Commissioners Court.

Revised 10/2014
1. Port of Corpus Christi website, http://www.portofcorpuschristi.com/index.php/general-information-155/statistics/yearly-statistics
Connectivity
The Port has on-site and direct connections to three Class-I railroads, BNSF, KCS and UP,
and direct, vessel-to-rail discharge capabilities through Corpus Christi Rail Terminal. The Joe
Fulton International Trade Corridor provides direct access to Interstate 37 and Highway 181.
• Nueces River Railyard - June 2012 the U.S. DOT awarded a $10 million TIGER grant for the
port’s first phase of construction of the Nueces River Railyard (NRRY)
1. When complete the NRRY will include an 8,000 ft. unit train siding and a four ladder
track interchange yard totaling 15,400 track feet, enough space for over 335 rail cars
2. Scope of work consists of construction of a 6 track rail interchange yard,
service road, drainage infrastructure, wetlands mitigation site, bike trail, light
relocation, fencing and railcar AEI readers
3. Contract awarded June 11, 2013. Completion is expected in Spring 2015.
4. Phase 2 currently under design and will expand first phase for a total of 8 – 8,000
feet long sidings, totaling over 72,000 track feet and 1,200 rail cars.
Current and Future Projects
• Completion of the La Quinta Trade Gateway
1. Construction contract awarded in October 2012 by USACE for dredging 1.4 mile
extension of the La Quinta Ship Channel. The PCCA deepened the channel extension
to -45’ in 2014. Voestalpine Texas, the Austrian steelmaker and anchor tenant at La
Quinta Trade Gateway, has started construction of their $750 million hot briquetted
iron facility and ship dock project. The facility will be operational by December 2015
and will employ 150 employees during Phase 1.
• La Quinta Gateway Dock
1. Project includes constructing 1,000 ft multipurpose dock facility and associated
storage yard facilities to handle a diverse range of bulk and project cargo. Final
design to be completed in 2014 and construction in 2015.
• Barge Mooring Facility
1. Construction of 25 acre barge fleeting area to accommodate increased barge traffic.
Construction to begin late 2014.
• Oil Dock Construction
1. Oil dock to be constructed to support M&G, the Italian plastics company and their
new $900 million PET and PTA plants located in the Port’s Inner Harbor. Currently
under final permitting and construction to begin late 2014.
Others Items of Interest
• Eagle Ford Shale
1. The Eagle Ford Shale play in South Texas continues to be a huge economic
stimulator. Port Corpus Christi has played a vital role as the logistical and
distribution center for cargoes used for drilling, fracturing and pipeline placement.
The Port continues to invest in new rail infrastructure and liquid docks to support the
continued growth.
Current and Future Projects (FY15)
222 Power Street Corpus Christi, TX 78401 (361) 882-5633 http://portofcorpuschristi.com/
Executive Director John LaRue
Commissioners Judy Hawley Chairman
Richard Borchard Vice Chairman
Charles Zahn Secretary
Barbara Canales
Al Jones
Richard Valls, Jr. David Engel Governing Body The Port Commission is comprised of seven members, each serving a staggered term of three years. Three commissioners are appointed by the Corpus Christi City Council, three commissioners are appointed by the Nueces County Commissioners Court, and one is appointed by the San Patricio County Commissioners Court.
Project Description Port Funding Port Access Funding
La Quinta Terminal $42,500,0000 $42,500,0000
Tule Lake Lift Bridge $8,000,000 $8,000,000
Ship Channel Widening $15,000,000 $15,000,000
TOTAL ESTIMATED COST $106,000,000 $65,500,000 $65,500,000

1. Port of Freeport Comprehensive Annual Financial Report 2013, pg. 61, http://www.portfreeport.com/annual_files/2013Report.pdf
UPDATED 8/2014
200 W. Second St. Freeport, TX 77541 (972) 233-2667 www.portfreeport.com Executive Director Glenn Carlson Commissioners John Hoss Chairman Paul Kresta Vice Chairman Shane Pirtle, P.E. Secretary Ravi K. Singhania Vice Secretary Thomas S. Perryman Governing Body Port Freeport encompasses approximately 85 percent of Brazoria County, Texas. The Port Commission is comprised of six members. Five positions represent a specific geographic area, and one position is at-large. Each Port Commissioner serves a term of six years.
4.7 35.2
0 20 40 60
Total Tonnage: 24,537,964¹
Domestic
Total (public and private)
PORT AT-A-GLANCE Port Freeport • Freeport, TX
Legal Name: Port Freeport Draft: Deep US Port Ranking: 24th in foreign tonnage | 30th in total tonnage
2013 Total Container Cargo: 100,816 Twenty-foot Equivalent Units (T.E.U.s)¹
Vessel Calls (annual)
including barge/tug calls
Truck Traffic (annual)
public/private
Railcar Transits (annual)
public/private
Annual Economic Impact: $17.9 billion 13,362 Direct Jobs | 27,656 Induced Jobs
Top Commodities:
Imported Exported
Aggregate
Chemicals
Clothing
Crude
Foods
LNG
Paper goods
Resins
Windmills
Autos
Chemicals
Clothing
Foods
Paper goods
Resins
Rice
LNG
3,000 155,000 50,000

1. Port of Freeport Comprehensive Annual Financial Report 2013, pg. 61, http://www.portfreeport.com/annual_files/2013Report.pdf
UPDATED 8/2014
200 W. Second St. Freeport, TX 77541 (972) 233-2667 www.portfreeport.com Executive Director Glenn Carlson Commissioners John Hoss Chairman Paul Kresta Vice Chairman Shane Pirtle, P.E. Secretary Ravi K. Singhania Vice Secretary Thomas S. Perryman Governing Body Port Freeport encompasses approximately 85 percent of Brazoria County, Texas. The Port Commission is comprised of six members. Five positions represent a specific geographic area, and one position is at-large. Each Port Commissioner serves a term of six years.
PORT PROFILE
Port Freeport • Freeport, TX
Brazoria County is one of Texas' most fertile agricultural areas, one of the nation's most
successful commercial fishing ports, and one of the region’s more prolific fuel and mineral
areas. The primary economic bases of the county include chemical manufacturing, petroleum
processing, offshore production maintenance services, diversified manufacturing, biochemical
and electronic industries, commercial fishing and agriculture. In addition, the area's deep-water
channel and port facilities, sports fishing services and tourism are major components of the
county's economic base.
Assets
Port Freeport land and operations currently include 186 acres of developed land and 7,723
acres of undeveloped land, 14 operating berths (public and private docks), a 45-foot deep
Freeport Harbor Channel and a 70-foot-deep berthing area. Future expansion includes building
a 1,300-acre multi-modal facility, two multi-purpose 1,200-foot berths on 50 feet of water and
two dockside 120,000 square-foot transit sheds.
Connectivity
Port Freeport is conveniently
accessible by rail, waterway and
highway routes. There is direct
access to the Gulf Intracoastal
Waterway, Brazos River
Diversion Channel, State
Highways 36 & 288 and rail
service provided by the Union
Pacific Railroad.
Union Pacific Railroad (UPRR)
and the Port are focused on
improving rail service and
capacity to and from the Port.
1. The replacement of the
swing bridge in downtown Freeport across the old Brazos River and improvements to
the primary rail corridor between the Port and the Angleton switching yards were
completed in 2011 by the UPRR.
2. New port multi-modal facilities could include up to three new rail lines each
approximately 5,000 feet long, providing service enhancements related to both the
Parcel 25 and the new Velasco Terminal.
These investments will significantly improve capacity for Port clients, service by UPRR and is
necessary to accommodate the increase in rail shipments.

1. Port of Freeport Comprehensive Annual Financial Report 2013, pg. 61, http://www.portfreeport.com/annual_files/2013Report.pdf
UPDATED 8/2014
200 W. Second St. Freeport, TX 77541 (972) 233-2667 www.portfreeport.com Executive Director Glenn Carlson Commissioners John Hoss Chairman Paul Kresta Vice Chairman Shane Pirtle, P.E. Secretary Ravi K. Singhania Vice Secretary Thomas S. Perryman Governing Body Port Freeport encompasses approximately 85 percent of Brazoria County, Texas. The Port Commission is comprised of six members. Five positions represent a specific geographic area, and one position is at-large. Each Port Commissioner serves a term of six years.
Current and Future Projects
Channel improvements.
1. Widening of the Channel is moving forward with construction to begin in early 2014,
and has been locally funded.
2. Deepening the Channel to 55 feet is advancing as well, with a key U.S. Army Corps of
Engineers report that was released in January 2013 signifying the completion of the ten
year feasibility study. The next steps will be the pre-engineering design and funding
which is anticipated to be completed in three years.
A new 22 acre truck queuing area is being planned. Plans call for an environmentally friendly
off-road parking/staging area for trucks entering the Port and surrounding industrial facilities. It
will be located south of State Highway 36 in close proximity to the Port entrances. It is
anticipated that the Port will apply for Federal grant funds to offset a portion of the project cost.
Current and Future Projects (FY13-14)
Project Description Port Funding Port Access Funding
Velasco Terminal Project $7,500,000 $7,500,000
Project cargo storage and related
development
– –
Security Related $135,000 $135,000
Miscellaneous Projects $499,000 $499,000
ZPMC Panamax Class Container
Cranes
$20,000,000 $20,000,000
Velasco Civil Site Work $19,000,000 $16,000,000
Non-federal Widening by FLNG – $35,000,000
TOTAL ESTIMATED COST: $70,998,000 $19,499,000 $51,499,000

1. U.S. Department of Transportation Website, www.dot.gov/maritime-waterways 2. Comprehensive Annual Financial Report, Port of Galveston, pg. 56 3. Galveston Cruise Industry On A Successful Course, Houston Chronicle, Stanton, Robert, July 19, 4. Port of Galveston website – www.portofgalveston.com/civicalerts.aspx?AID=28 5. Martin Associate Economic Impact Report on Texas Ports Sponsored by Texas Port Association, 2011
6. Guide to the Economic Value of Texas Ports, Center for Transportation Research The University of Texas at Austin,
Dec. 2008e 40 7. Presentation given at Panama Canal Stakeholder. Working Group Meeting. POHA, Bayport Container
Terminal, Houston, Texas. August 27, 2012. [Slide number 21] UPDATED 8/2014
PORT AT-A-GLANCE Port of Galveston • Galveston, Texas
Legal Name: Board of Trustees of the Galveston Wharves Draft: Deep US Port Ranking: 4th busiest cruise port¹ | 40th in total tonnage (U.S. Customs Port
Ranking)
Ranked #41 (2011) in tonnage which was a 52.1% increase from the previous year.¹
2013 Total Tonnage: 4,464,309 tons²
Ranked #3 in U.S.
Cruise Industry
Vessel Calls (annual)
including barge/tug calls
Annual Economic Impact: $3,060,700,000 BIL⁵ 3,326 Direct Jobs | 3,794 Induced Jobs
Top Commodities:
Import Export
Wind power equipment
Agricultural equipment
Machinery
Vehicles
Fertilizer products
Lumber Products
Military-related cargos
Bulk grains
Containers
Machinery
Vehicles
Linerboard and paper
Carbon Black
Light fuels
912 (2013)² Welcomed 604,994
passengers (2013)²

UPDATED 8/2014
123 Rosenberg Ave. Galveston, TX 77550 www.portofgalveston.com (409) 766-6105 Port Director Michael Mierzwa Board of Trustees Benjamin F. Holland, Jr. Chairman Edward Walsh, III Vice Chairman Members Gerald Sullivan Mayor James Yarbrough Richard Devries John A. Smecca Albert Shannon Governing Body The Board of Trustees of the Galveston Wharves (Port of Galveston), a body politic and corporate, is comprised of seven trustees who are appointed by the Galveston City Council. One member of the Board of Trustees is an ex-officio representative of the City Council. The Board of Trustees of the Galveston Wharves fully manages, controls, maintains and operates Port improvements and facilities owned by the city of Galveston.
PORT PROFILE
Port of Galveston • Galveston, Texas
The Port of Galveston is located at the mouth of Galveston Bay along the Upper Texas Coast in
Galveston County. Associated by the public as port terminal for cruises, it has historically handled
containerized cargo, dry and liquid bulk, break-bulk, roll-on/roll-off cargo, and refrigerated and
project cargo. Commodities arriving at the port are often destined for Galveston County, Harris
County, Fort Bend County, Brazoria County, the state of Texas, as well as Texas’ neighboring states
and the United States Midwest region. The ports international trading partners include Mexico,
Guatemala, Panama, Columbia, Venezuela, Brazil, Dominican Republic, Spain, Italy, Egypt, Israel,
Turkey, Bulgaria, Belgium, England, Germany, Saudi Arabia, United Arab Emirate, Kuwait,
Singapore and China.⁶
Assets
Significant Roll-on/Roll-off (RoRo) operation and its matured profile of RoRo operations.
Vigorous cruise line port terminal.
Proximity to the Port of Houston and Texas City

UPDATED 8/2014
123 Rosenberg Ave. Galveston, TX 77550 www.portofgalveston.com (409) 766-6105 Port Director Michael Mierzwa Board of Trustees Benjamin F. Holland, Jr. Chairman Edward Walsh, III Vice Chairman Members Gerald Sullivan Mayor James Yarbrough Richard Devries John A. Smecca Albert Shannon Governing Body The Board of Trustees of the Galveston Wharves (Port of Galveston), a body politic and corporate, is comprised of seven trustees who are appointed by the Galveston City Council. One member of the Board of Trustees is an ex-officio representative of the City Council. The Board of Trustees of the Galveston Wharves fully manages, controls, maintains and operates Port improvements and facilities owned by the city of Galveston.
PORT PROFILE
Port of Galveston • Galveston, Texas
Connectivity
Situated 50 miles south of Houston and at the entrance of the Galveston-Texas City-
Houston Port Complex located in Galveston Bay.
Ground accessibility via IH 45, Gulf freeway
Has two Class 1 rail companies, Union Pacific (UP) and Burlington Northern & Santa Fe
(BNSF) with switch yards immediately adjacent to the Port’s West End
Potential Improvements to Infrastructure
Improvements needed to ensure adequate rail capacity in Class One manifest yards and
main lines to and from the ports to handle increases in exports and imports.⁷
Adequate maintenance dredging of channels to ensure consistent authorized depths, and
construction to provide additional deepening to maximum feasible depths to controlling
drafts at the expanded Panama Canal.⁵
“First Mile” and “Last Mile” highway and roadway connectors to reduce congestion and
improve port productivity. ⁵
Pelican Island Project
o Desalination plant
o A 3000-megawatt cogeneration facility that uses biomass to produce electricity at a
cost of 3.5 cents/kilowatt
o A four-lane vehicular bridge from Galveston to Pelican Island
o A new railroad bridge and a railroad switching yard
Current and Future Projects (FY13)
Project Description Port Funding Port Access Funding
41st Street Harborside Entrance $750,000 $750,000
Internal Traffic Circulation $2,500,000 $2,500,000
Vessell Fendering System $475,000 $475,000
Fill Slips 12-14 $20,650,000 $20,650,000
Develop Pelican Island $10,887,500 $10,887,500
Expand and Improve Cruise Terminal
#2
$5,525,000 $5,525,000
Fill Slips 37-38, 38-39, and
Construct Wharf
$23,865,000 $23,865,000
Pelican Island Vehicular and
Railroad Bridges Preliminary Study
$2,000,000 $2,000,000
TOTAL ESTIMATED COST: 129,165,000 $64,825,500 $64,825,500
.

Revised 08/2014
146.0 72.0
Imported
Exported
Liquid Fertilizer
Sand
Aggregates
Gasoline
Diesel
Ethanol
Raw Sugar
Cotton
Sorghum
Corn
PORT AT-A-GLANCE Port of Harlingen • Harlingen, TX
Legal Name: Port of Harlingen Authority Draft: Shallow (12’)
U.S. Port Ranking by Tonnage n/a
Barge Activity
Inbound Outbound
0 50 100 150 200 250
Port Tonnage 800,000 Barge Traffic 218
Container Traffic1 n/a
Transit Activity2
218 939 161
Vessel Calls (annual) Truck Traffic (annual) Railcar Transits (annual)
Port of Harlingen Authority P.O. Box 2646 Harlingen, TX 78551 (956) 423-0283 www.portofharlingen.com
Port Director (interim) Walker Smith
Alan Johnson Chairman
Alejandro Hinojosa, Sr Secretary
Bryan Duffy Commissioner
Governing Body The Port of Harlingen Authority is a navigation district and political subdivision of the state of Texas. The Authority is
including barge/tug calls
Economic Impact (2006)5
public/private3 public/private4 governed by a Port Commission composed of three elected commissioners.
Economic Value ($ Millions): $19.3 State and Local Taxes ($ Millions)
Total Jobs: 88 | Direct Jobs: 40 Total Taxes: $0.4
Top Commodities6
Principal Trading Partners Mexico
Service Area South Texas and northern Mexico
1 U.S. Army Corps of Engineers, Waterborne Commerce of the United States, Part 5, National Summaries, (CY2011)
2 Mirna Del Castillo, Port of Harlingen activity during FY 2012 (personal communication via e‐mail, September 9, 2013)
3 Cement (686) and liquid fertilizer (253) represent the commodities transported most from barge to trucks at the Port of Harlingen (FY2012).
4 Liquid fertilizer is the commodity transported most from barge to rail at the Port of Harlingen (FY2012).
5 0‐5538‐P1, Guide to the Economic Value of Texas Ports, Center for Transportation Research, 2008
6 Texas Ports Association, Port of Brownsville (profile), Accessed: September 6, 2013

Revised 08/2014
PORT PROFILE Port of Harlingen • Harlingen, TX
The Port of Harlingen is a shallow draft barge port
located in the geographic center of the lower Rio
Grande Valley four miles east of the city of Harlingen,
Texas. The Port exports 100 percent of the sugar
produced in the Rio Grande Valley. And, the Port
imports critical Valley resources, such as 90 percent
of fertilizer used by South Texas farmers and 70
percent of the refined petroleum products for the
South Texas region.7
The Port is connected to the Gulf Intracoastal
Waterway by means of the Harlingen Channel. The
Harlingen Channel extends from the Gulf Intracoastal
Waterway 25 miles west of Mile 646 and is supplied
by the Arroyo Colorado, a fresh water source.8
Assets
650' (195m) general dry/liquid cargo wharf
100' (30m) dry bulk wharf
Five smaller docks (50' X 25' or 7.5m X
15m) located near the turning basin and extend
into the Harlingen channel
Over 150 acres of open storage
Connectivity
Nearby several inland ports of entry into Mexico within Brownsville/Los Indios area
Barge lines serve the Port via the Gulf Intracoastal Waterway (GIWW)
Intermodal railroad services offered by Union Pacific (UP)
Harlingen Channel, the waterway of the Port, is maintained to 120 feet wide by 12 feet deep
Air freight service available at the Valley International Airport (Harlingen, Texas)
Current and Future Projects9
Source: TxDOT
Project Description Port Funding Port Access Fund
Security Enhancements – Total Cost: $130,000 ― ―
TOTAL ESTIMATED COSTS ― ―
7 Port of Harlingen website http://portofharlingen.com as of September 10, 2013
8 Port of Harlingen – Tariff #006 as of September 3, 2013, http://portofharlingen.com/wp‐content/uploads/2012/10/Port‐of‐Harlingen.pdf
9 Texas Ports 2013 – 2014 Capital Program, Texas Department of Transportation, page A‐5

1. Port of Houston Authority Website: http://www.portofhouston.com/about-us/overview/ 2. TxDOT Port Report, Texas Department of Transportation, pg. 5 3. http://www.portofhouston.com/about-us/overview/ 4. http://www.portofhouston.com/about-us/overview/ UPDATED 8/2014
111 East Loop North Houston, Tx 77029 www.portofhouston.com (713) 670-2400 Port Executive Director Roger Guenther Commission Members Janiece M. Longoria Chairman John D. Kennedy Dean E. Corgey Clyde Fitzgerald Theldon R. Branch, III Stephen H. DonCarolos Roy D. Mease Governing Body Governed by a board of seven commissioners and selected by governmental entities within Harris County, the port commissioners set policy and provide guidance to the Port Authority staff. Commissioners serve staggered two-year terms.
35.8
0 10 20 30 40
Tonnage (Millions)
PORT AT-A-GLANCE Port of Houston • Houston, Texas
Legal Name: Port of Houston Authority Draft: Deep US Port Ranking: 1st in U.S. in foreign waterborne tonnage and 2nd in U.S. in total
tonnage¹ (U.S. Customs Ports Ranking)
Total Trade Value: 22.9 MIL tons valued at $53.5 BIL Barge and Vessel Calls
(annual)
Annual Statewide Economic Impact: $178.5 BIL
Direct Jobs: 53,952 | Induced Jobs: 71,065 | Indirect Jobs: 49,835
Top Commodities
(In ranking order)
Exports
Imports
Resins & Plastics
Chemicals & Minerals
Machinery, Appliances & Electronics
Food & Drink
Automotive
Steel & Metal
Fabrics Incl. Raw Cotton
Food & Drink
Hardware & Construction Material
Machinery, Appliances & Electronics
Steel & Metals
Chemicals & Minerals
Retail Consumer Goods
Furniture
208,000ᶾ

1. Port of Houston Authority Website: http://www.portofhouston.com/about-us/overview/ 2. TxDOT Port Report, Texas Department of Transportation, pg. 5 3. http://www.portofhouston.com/about-us/overview/ 4. http://www.portofhouston.com/about-us/overview/ UPDATED 8/2014
111 East Loop North Houston, Tx 77029 www.portofhouston.com (713) 670-2400 Port Executive Director Roger Guenther Commission Members Janiece M. Longoria Chairman John D. Kennedy Dean E. Corgey Clyde Fitzgerald Theldon R. Branch, III Stephen H. DonCarolos Roy D. Mease Governing Body Governed by a board of seven commissioners and selected by governmental entities within Harris County, the port commissioners set policy and provide guidance to the Port Authority staff. Commissioners serve staggered two-year terms.
PORT PROFILE
Port of Houston • Houston, Texas
The Port of Houston is a 25-mile-long complex of diversified public and private facilities
located just a few hours by ship from the Gulf of Mexico. The port is consistently
ranked 1st in the United States in foreign waterborne tonnage; 1st in U.S. imports; 1st in
U.S. export tonnage and 2nd in the U.S. in total tonnage. It is also the nation’s leading
breakbulk post, handling 65 percent of all major U.S. project cargo. The Port of
Houston Authority is the sponsor of the Houston Ship Channel which is 45 feet deep
and 530 feet wide.
The Port of Houston is made up of the public terminals owned, managed and leased by
the Port of Houston Authority, and the 150-plus private industrial companies along the
52-mile long Houston Ship Channel.

1. Port of Houston Authority Website: http://www.portofhouston.com/about-us/overview/ 2. TxDOT Port Report, Texas Department of Transportation, pg. 5 3. http://www.portofhouston.com/about-us/overview/ 4. http://www.portofhouston.com/about-us/overview/ UPDATED 8/2014
111 East Loop North Houston, Tx 77029 www.portofhouston.com (713) 670-2400 Port Executive Director Roger Guenther Commission Members Janiece M. Longoria Chairman John D. Kennedy Dean E. Corgey Clyde Fitzgerald Theldon R. Branch, III Stephen H. DonCarolos Roy D. Mease Governing Body Governed by a board of seven commissioners and selected by governmental entities within Harris County, the port commissioners set policy and provide guidance to the Port Authority staff. Commissioners serve staggered two-year terms.
Assets
Home to a $15 billion petrochemical complex, the largest in the nation and
second largest in the world.
Largest Texas port with 46% of market share by tonnage and 95% market
share in containers by total TEUs in 2013
Connectivity
The Port is located in the 4th largest city in the US.
The Port has access to numerous local and state highways as well as two major
interstate corridors.
There are 3 Class 1 Railroads
The Port is home to the most extensive port terminal railroad, the Port Terminal
Railroad Association (PTRA) that operates along the Houston Ship Channel. The
PTRA serves more than 220 customers from seven rail yards and maintains
154 miles of track and 20 bridges.
The Port is in the Gulf Coast Rail District which works to address rail congestion
in the Houston region.
Potential Improvements to Infrastructure
The Port is beginning work on a channel improvement project at the Port
Authority's two container terminals that will deepen the channels from 40 feet
to 45 feet, making it match the depth of the Houston Ship Channel.
o The project will also widen or realign the channels by up to 100 feet to
better accommodate larger ships.
o The Port Authority is funding the $68 million project at its sole cost to
ensure the channel improvements are available as soon as possible to
better accommodate larger container ships in preparation of the
opening of the expanded Panama Canal in 2016.
Current and Future Projects (FY13-14)
Project Description Port Funding Port Access Funding
Barbours Cut Terminal $28,450,000 $28,450,000
Bayport Terminal $103,935,000 $103,935,000
Turning Basin Terminal $10,000,000 $10,000,000
Barbours Cut Terminal $29,345,000 $29,345,000
TOTAL ESTIMATED COST: $343,460,000 $171,730,000 $171,730,000

Revised 09/2013
Port of Port Isabel 250 Industrial Drive Port Isabel, TX 78578 (956) 943-7826 www.portofportisabel.com Port Director Steve Bearden Board of Commissioners Victor Barrera Chairman M.R. Garcia II Secretary Robert Ostos Asst. Secretary Governing Body The Port of Isabel/San Benito Navigation District is governed by a Board of Commissioners consisting of three elected officials. These commissioners serve four-year terms on a staggered basis. Service Area Mexico, Central and South America and United States
13 60 25
0 20 40 60 80 100 120
Vessel Activity1
Deep Water
Shallow GIWW
Shallow Other
PORT AT-A-GLANCE Port of Port Isabel • Port Isabel, TX
Legal Name: Port of Isabel/San Benito Navigation District Draft: Deep (36’) U.S. Port Ranking by Tonnage n/a Port Tonnage 50,000 tons (est) Barge Traffic 85 Container Traffic n/a Transit Activity1
Economic Impact (2006)2 Economic Value ($ Millions): $85.6 State and Local Taxes ($ Millions) Total Jobs: 948 | Direct Jobs: 605 Total Taxes: $2.7
Top Commodities1
Imported Exported
Concrete Sand
Aggregate
n/a
1 Steve Beardon, Port Director at Port Isabel/San Benito Navigation District estimates 2012 Port activity (personal communication via e‐mail, September 11, 2013) 2 0‐5538‐P1, Guide to the Economic Value of Texas Ports, Center for Transportation Research, 2008.(CY2006)
Vessel Calls (annual) including barge/tug calls
Truck Traffic (annual) public/private
Railcar Transits (annual) public/private
100 500 n/a
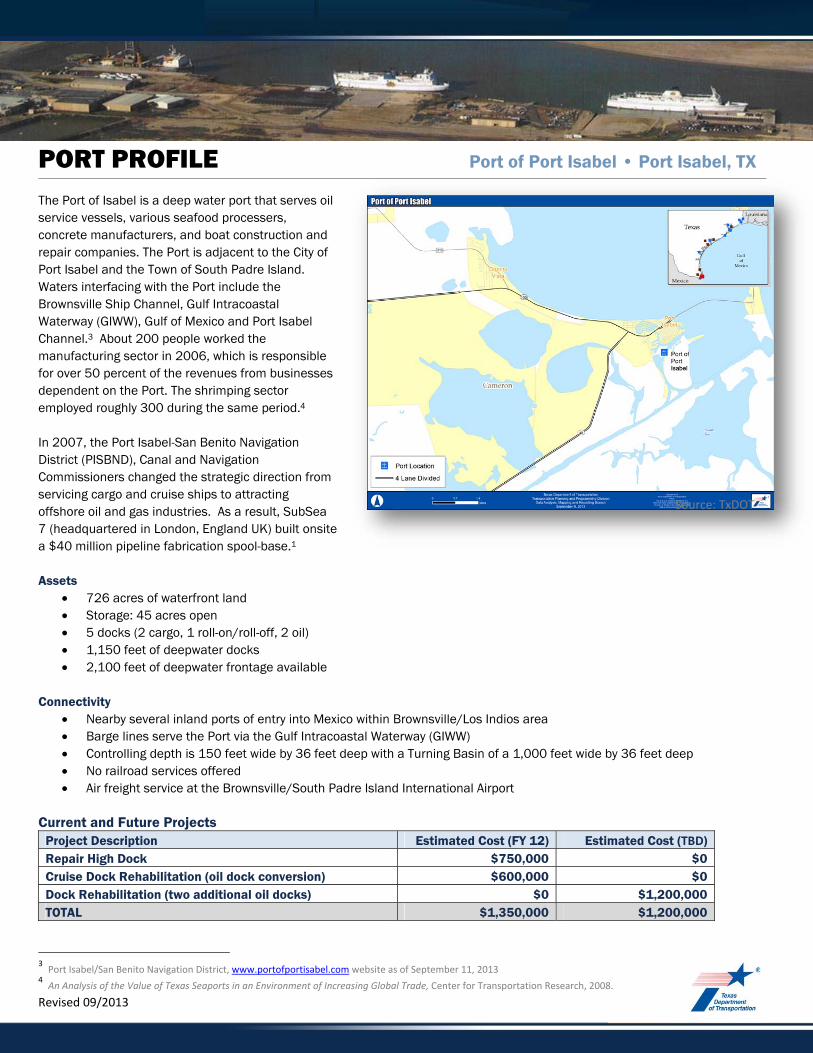
Revised 09/2013
PORT PROFILE Port of Port Isabel • Port Isabel, TX The Port of Isabel is a deep water port that serves oil service vessels, various seafood processers, concrete manufacturers, and boat construction and repair companies. The Port is adjacent to the City of Port Isabel and the Town of South Padre Island. Waters interfacing with the Port include the Brownsville Ship Channel, Gulf Intracoastal Waterway (GIWW), Gulf of Mexico and Port Isabel Channel.3 About 200 people worked the manufacturing sector in 2006, which is responsible for over 50 percent of the revenues from businesses dependent on the Port. The shrimping sector employed roughly 300 during the same period.4 In 2007, the Port Isabel-San Benito Navigation District (PISBND), Canal and Navigation Commissioners changed the strategic direction from servicing cargo and cruise ships to attracting offshore oil and gas industries. As a result, SubSea 7 (headquartered in London, England UK) built onsite a $40 million pipeline fabrication spool-base.1 Assets
726 acres of waterfront land Storage: 45 acres open 5 docks (2 cargo, 1 roll-on/roll-off, 2 oil) 1,150 feet of deepwater docks 2,100 feet of deepwater frontage available
Connectivity
Nearby several inland ports of entry into Mexico within Brownsville/Los Indios area Barge lines serve the Port via the Gulf Intracoastal Waterway (GIWW) Controlling depth is 150 feet wide by 36 feet deep with a Turning Basin of a 1,000 feet wide by 36 feet deep No railroad services offered Air freight service at the Brownsville/South Padre Island International Airport
Current and Future Projects
Project Description Estimated Cost (FY 12) Estimated Cost (TBD) Repair High Dock $750,000 $0 Cruise Dock Rehabilitation (oil dock conversion) $600,000 $0 Dock Rehabilitation (two additional oil docks) $0 $1,200,000 TOTAL $1,350,000 $1,200,000
3 Port Isabel/San Benito Navigation District, www.portofportisabel.com website as of September 11, 2013 4 An Analysis of the Value of Texas Seaports in an Environment of Increasing Global Trade, Center for Transportation Research, 2008.
Source: TxDOT

Updated 08/2014
Orange County Navigation & Port District 1201 Childers Road Orange, Texas 77632 (409) 883-4363 www.portoforange.com Port Director Gene Bouillion Commissioners Jerry Hughes President Jimmy Smith Vice President Keith Wallace Secretary/Treasurer John Young Barbara Winfree Governing Body Port of Orange is a navigation district and political subdivision of the state of Texas. The port is governed by 5 commissioners, elected on staggered 4-year terms by voters in the district.
PORT AT-A-GLANCE Port of Orange • Orange, TX
Legal Name: Orange County Navigation and Port District Draft: Deep
2011 Cargo Tonnage: 94,504
(All commodity types in tons)
Annual Economic Impact: $1.9 million (in 2004)
Background The port is located on the Sabine-Neches waterway and is linked to the “Golden
Triangle” ports which include the Port of Port Arthur, Beaumont and Orange – an area
that has become strategically more important to Texas ports growth since 2003. It has
handled an annual tonnage of around 800,000 since 2001 and traditionally has acted
as a successful landlord port, complementing activities at larger ports on the Sabine-
Neches channel. It is also used for lay berthing.

Updated 08/2014
Orange County Navigation & Port District 1201 Childers Road Orange, Texas 77632 (409) 883-4363 www.portoforange.com Port Director Gene Bouillion Commissioners Jerry Hughes President Jimmy Smith Vice President Keith Wallace Secretary/Treasurer John Young Barbara Winfree Governing Body Port of Orange is a navigation district and political subdivision of the state of Texas. The port is governed by 5 commissioners, elected on staggered 4-year terms by voters in the district.
Assets
The Port is the mechanical, electrical repair, and fabrication of ocean-going
barges of the type used to service deep water Gulf oil rigs
A total of 2,300 feet of docking space at a depth of 30 feet
Four (4) berths with a grain elevator and bagging facility
Eight (8) warehouses
Used by MARAD to service, repair, and maintain the military ready reserve fleet
Current and Future Projects (FY14)
Project Description Port Funding Port Access Funding
Dredge Material Placement Area ---
---
TOTAL --- ---

1. Texas Ports 2013-2014 Capital Program, Page 25 2. Texas Port Association website: www.texasports.org/ports/palacios 3. Guide to the Economic Value of Texas Ports, Center for Transportation Research The University of Texas at Austin, Dec. 2008, page 40 4. Texas Ports 2013 – 2014 Capital Program, pg. 24
UPDATED 8/2014
1602 Main Street P O Box 551 Palacios, Tx 77465 Phone: (361) 972-5556 Chairman Ted R. Bates, Jr. Vice Chairman Victor L. Eggemeyer Secretary Jimmy E. Neeley Commissioner Bryan L. Fields
Commissioner Greg T. Seaman
Port Director Debbie Morris Governing Body The Port of Palacios is governed by 5 member panel of elected commissioners.
PORT AT-A-GLANCE Port of Palacios – Palacios, Texas
Legal Name: Matagorda County Navigation Dist. #1 Draft: Shallow
2009 Cargo Tonnage: 15.1 million (All commodity types in tons)¹
Annual Economic Impact: $41.2 MIL² 541 Direct Jobs | 43 Induced Jobs
Top Commodity
Shrimping industry

1. Texas Ports 2013-2014 Capital Program, Page 25 2. Texas Port Association website: www.texasports.org/ports/palacios 3. Guide to the Economic Value of Texas Ports, Center for Transportation Research The University of Texas at Austin, Dec. 2008, page 40 4. Texas Ports 2013 – 2014 Capital Program, pg. 24
UPDATED 8/2014
1602 Main Street P O Box 551 Palacios, Tx 77465 Phone: (361) 972-5556 Chairman Ted R. Bates, Jr. Vice Chairman Victor L. Eggemeyer Secretary Jimmy E. Neeley Commissioner Bryan L. Fields
Commissioner Greg T. Seaman
Port Director Debbie Morris Governing Body The Port of Palacios is governed by 5 member panel of elected commissioners.
Background The Port of Palacios is located on the Upper Gulf Coast approximately 110 miles south
of Houston in Matagorda County. Traditionally, Palacios’ chief industry has been
shrimpingᶾ. Fishing, tourism and shipbuilding, including barges, tugs and commercial
and recreational boats of various sizes and configurations are increasing. The Port
also provides a safe harbor for commercial fishermen from the three counties around
Matagorda Bay – Matagorda, Jackson and Calhoun counties.⁴ Assets
The Port has over 130 commercial fishing boats which operate from the four
turning basins at the Port and are affiliated with the fish houses located at the
Port
Fish houses and commercial boats employ approximately 400 people.
Properties also included with the Matagorda County Navigation District #1 are
the Texas State Marine Education Center, Bay Side RV Park, Brooking-Hays
Yacht Harbor Subdivision
4 turning basins with 13,000 linear feet of dock space
2 recreational marinas with 55 slips
Currently own over 800 acres of developable land
Connectivity
Currently there are no major direct shipments of import/export cargos from
Palacios and no Class 1 railroad connections
Current and Future Projects (FY13-14)
Project Description Port Funding Port Access Funding
Shipyard Construction $1,125,000 $1,125,000
Turning Basin Improvements $600,000 $1,973,800
Rail Access --- ---
Land Bridge --- ---
TOTAL ESTIMATED COST: $4,823,800 $1,725,000 $3,098,800
.

1. Port Report, Texas Dept. of Transportation, 2014, pg. 5
UPDATED 8/2014
221 Houston Avenue Port Arthur, Texas (409) 983-2011 www.portofportarthur.com Executive Port Director Floyd Gaspard Secretary/Treasurer of the Board Commissioners John Comeaux President Raymond C. Johnson Vice President Linda Turner Spears Secretary/Treasurer Morris Albright Mark Underhill Governing Body Port of Port Arthur is a
political subdivision of the
state of Texas. A Port
Commission composed of
five at-large elected
commissioners governs the
Port.
PORT AT-A-GLANCE Port of Port Arthur • Port Arthur, Texas
Legal Name: Port of Port Arthur Navigation Draft: Deep District of Jefferson County, Texas
US Port Ranking: 14th in total tonnage (U.S. Customs Port Ranking)
2011 Total Tonnage: 341,751¹
Annual Economic Impact: $128.0 (in millions) Of that, $11.1 million went to state and local taxes and $31.6 million went to custom
receipts
Top Commodities
Imports Exports
Steel Slabs Forest Products
Forest Products Petroleum Coke
Project Cargo Steel Pipe
Misc. Steel Project Cargo
Jobs
Jobs Total
Direct 1,509
Induced 1,132
Indirect 192
Related 3,093
1,183
Vessel Calls (annual)
including barge/tug calls

1. Port Report, Texas Dept. of Transportation, 2014, pg. 5
UPDATED 8/2014
221 Houston Avenue Port Arthur, Texas (409) 983-2011 www.portofportarthur.com Executive Port Director Floyd Gaspard Secretary/Treasurer of the Board Commissioners John Comeaux President Raymond C. Johnson Vice President Linda Turner Spears Secretary/Treasurer Morris Albright Mark Underhill Governing Body Port of Port Arthur is a
political subdivision of the
state of Texas. A Port
Commission composed of
five at-large elected
commissioners governs the
Port.
PORT PROFILE
Port of Port Arthur • Port Arthur, TX The Port of Port Arthur is situated directly on the Gulf Intracoastal Waterway (GIWW)
and only 19 miles from the Gulf of Mexico. Port Arthur’s strategic location on the GIWW
provides easy barge transportation on the U.S. inland waterway system to cities along
the Mississippi, Ohio, Arkansas, and Tennessee, Missouri and Illinois Rivers plus its
many tributaries. Panamex size vessels began taking advantage of the ports new 2000
terminal expansion for lay berthing. Port Arthur has emerged as a major break-bulk port
for forest products, project cargo, steel and military redeployments. Port Arthur’s
principal trading partners include South America, the European Continent, United
Kingdom, Mediterranean Area, Middle East and Mexico.
Assets
Two Class 1 Rail lines – Kansas City Southern and Union Pacific
Contains 3,104 feet of docks
48,000 square meters of shed storage and over 68,000 square meters of open
asphalt-paved storage
The Port is served by three wharf rail tracks with 150-car capacity, two shed tracks
with 80-car capacity and six storage yard tracks with 140-car capacity
Connectivity
Direct access to interstate highway system
Rail and truck service to all points within the United States, Canada and
Mexico.

1. Port Report, Texas Dept. of Transportation, 2014, pg. 5
UPDATED 8/2014
221 Houston Avenue Port Arthur, Texas (409) 983-2011 www.portofportarthur.com Executive Port Director Floyd Gaspard Secretary/Treasurer of the Board Commissioners John Comeaux President Raymond C. Johnson Vice President Linda Turner Spears Secretary/Treasurer Morris Albright Mark Underhill Governing Body Port of Port Arthur is a
political subdivision of the
state of Texas. A Port
Commission composed of
five at-large elected
commissioners governs the
Port.
Barge service to cities along the Gulf Intracoastal Waterway and the
Mississippi, Missouri, Illinois, Ohio and Tennessee River Systems.
Current and Future Projects
Project Description Port Funding Port Access Funding
Berth 6 and Shoreline Stabilization $ 12,500,000 $ 12,500,000
Road and Site Access $ 750,000 $ 750,000
Security
$ 600,000 $ 600,000
Rail Reliever
$ 2,000,000 $ 2,000,000
Gulfway Drive and Houston Ave $ - $ -
TOTAL ESTIMATED COST: $31,700,000 $ 15,850,000 $ 15,850,000

1. Port of Victoria, Texas Newsletter, June 2013, Volume 1, Issue 1, www.portofvictoria.come/Libraries/Documents
2. Port of Victoria Website: http://www.portofvictoria.com/Default/About.aspx
1934 FM 1432 Victoria, Texas 77905 (361) 570-8855 www.portofvictoria.com Executive Director Paul “Skip” Kaup Commissioners Robby Burdge Chairman Elton Calhoun Vice Chairman Claud Jacobs Secretary Kevin Krueger Robert Loeb Governing Body The Victoria County Navigation District (Port of Victoria) is comprised of five members appointed by Victoria County Commissioners Court.
PORT AT-A-GLANCE Port of Victoria • Victoria, Texas
Legal Name: Victoria County Navigation District Draft: Shallow
Vessel Calls (annual)
including barge/tug calls
Railcar Transits (annual)
public/private
Annual Economic Impact: $6.6 BIL (2011) - Of the $6.6 BIL, $1.5 BIL is direct business revenue
and the remaining $5 BIL is the value of the output
to the State of Texas due to cargo moving via the
port. These numbers do not include the Eagle Ford
Shale.¹
Induced Jobs: 21,000
Commodities
Chemicals
Petrochemicals,
Frac Sand
Crude Oil
Liquid Fertilizers
Dry Fertilizers
Grain
Aggregates
5,711² 228,205 bbls
crude

1. Port of Victoria, Texas Newsletter, June 2013, Volume 1, Issue 1, www.portofvictoria.come/Libraries/Documents
2. Port of Victoria Website: http://www.portofvictoria.com/Default/About.aspx
1934 FM 1432 Victoria, Texas 77905 (361) 570-8855 www.portofvictoria.com Executive Director Paul “Skip” Kaup Commissioners Robby Burdge Chairman Elton Calhoun Vice Chairman Claud Jacobs Secretary Kevin Krueger Robert Loeb Governing Body The Victoria County Navigation District (Port of Victoria) is comprised of five members appointed by Victoria County Commissioners Court.
PORT AT-A-GLANCE Port of Victoria • Victoria, Texas
The Port of Victoria is located approximately 80 miles northeast of Corpus Christi and recent
expansions should significantly increase the tonnage operated by the port. The Port serves all
other ports along the Inland Waterway System within the United States. The main products
traded at the port include chemicals, petrochemicals, sand, gravel, grain, project cargo,
fertilizers and frac sand.
Assets
New Industrial Park with multi-modal access
Center for the chemical, construction and steel fabrication and agribusiness industries
offering access to all transportation modes.
New lighting system that allows for 24-hour operations
Foreign Trade Zone
Connectivity
The turning basin area is situated on over 2,000 acres
Rail spur with rail serviced provided by Union Pacific Railroad with track agreements
with Union Pacific, Kansas City Southern and BNSF
Potential Improvements to Infrastructure
Container on barge service is being planned.

1. Port of Victoria, Texas Newsletter, June 2013, Volume 1, Issue 1, www.portofvictoria.come/Libraries/Documents
2. Port of Victoria Website: http://www.portofvictoria.com/Default/About.aspx
1934 FM 1432 Victoria, Texas 77905 (361) 570-8855 www.portofvictoria.com Executive Director Paul “Skip” Kaup Commissioners Robby Burdge Chairman Elton Calhoun Vice Chairman Claud Jacobs Secretary Kevin Krueger Robert Loeb Governing Body The Victoria County Navigation District (Port of Victoria) is comprised of five members appointed by Victoria County Commissioners Court.
Current and Future Projects
Project Description Port Funding Port Access Funding
Staging Area Enlargement $3,250,000 $3,250,000
Liquid Cargo Dock Additions $1,750,000 $1,750,000
Erosion Control in Inner Harbor $750,000 $750,000
Rail Extension $2,750,000 $2,750,000
Road Improvements $3,000,000 $3,000,000
Container Dock Construction $6,275,000 $6,275,000
RORO Facility $2,750,000 $2,750,000
TOTAL ESTIMATED COST: $41,050,000 $20,525,000 $20,525,000

1. Texas Port Association Website: www.texasports.org/ports/west-calhoun
402 South Main Street Seadrift, Texas 77983 (361) 785-6492 Chairman Jack Campbell, Jr. Secretary Teddy Hawes
PORT AT-A-GLANCE Port of West Calhoun • Long Mott, Texas
Legal Name: West Side Calhoun County Navigation District
Draft: Shallow
Background The West Side Calhoun County Navigation District (the District) was formed on
July 8, 1946 and was approved for $125,000 bond issue for the building of the
barge Canal. The District operates the Port of West Calhoun, which is linked to
the Gulf Intracoastal Waterway via the Victoria Barge Canal.
Port facilities include berths for commercial seafood productions and oil and
gas exploration. The waterway is also used for barge shipments of industrial
products including petroleum coke and chemicals.¹

1. Texas Port Association Website: www.texasports.org/ports/west-calhoun
402 South Main Street Seadrift, Texas 77983 (361) 785-6492 Chairman Jack Campbell, Jr. Secretary Teddy Hawes
Current and Future Projects (FY14)
Project Description Port Funding Port Access Funding
Dredge Maintenance $1,500,000 1,500,000–
Infrastructure Improvements – –
TOTAL ESTIMATED COST: $3,000,000 $1,500,000 $1,500,000

TEXAS PORTS 2015 – 2016 CAPITAL PROGRAM
Appendix C Water Resources Reform and Development Act of 2014

TEXAS PORTS 2015 – 2016 CAPITAL PROGRAM
Water Resources Reform and Development Act of 2014 PAGE 1
Water Resources Reform and Development Act of 2014 On June10, 2014, the President signed H.R. 3080, the Water Resources Reform and Development Act of 2014. This was the first Water Resources and Development Act bill to be passed in seven years. Normally, this bill is passed on every two years. The bill had strong bipartisan support in both houses of Congress and was widely viewed as being fiscally sound piece of legislature that will create jobs, spur economic development, expand international trade and reform federal bureaucracy.
Critical elements of the bill that effect the Texas navigation system are as follows:
• Creates a pathway for full use of Harbor Maintenance Trust Fund which provides the US Army Corps of Engineers (USACE) revenue for channel operations and maintenance.
• Streamlines the USACE study process- Studies capped at 3 years duration with a cost not to exceed $3 million.
• Allows non-federal sponsors to contribute their own funds to advance studies, projects and expedite permits
• Creates a Public Private Partnership pilot program and Water Infrastructure Finance Innovation Act (WIFIA) program
• Requires USACE to conduct an assessment of the operation and maintenance needs for the Gulf Intracoastal Waterway.
• Authorized three new channel development and improvement projects along the Texas Coast (Table 1)
Channel Name Current Channel Depth (ft)
New Channel Depth (ft)
Federal Cost
(000)
Non-Federal Cost
Total
Sabine Neches Waterway
40 48 $748,070 $365,970 $1,114,040
Freeport Harbor 45 55 $121,000 $118,300 $239,300
Corpus Christi Ship Channel
45 52 $182,582 $170,649 $353,231
The Sabine Neches Waterway is the country’s number 1 crude oil import channel and Department of Defense’s most heavily used port for the movement of military cargo in support of the Global War on Terrorism. The channel supports the Ports of Beaumont, Orange and Port Arthur.
The Freeport Harbor improvements will enable the port to service larger vessels, reduce light loading and support the future export opportunities for LNG.
The Corpus Christ Channel deepening project will enable port to service a larger class of crude of vessel and more efficiently move product from the Eagle Ford development to market.
These three projects will play a pivotal role in strengthening the state’s waterway infrastructure to promote competition, economic growth, and the creation of good-paying jobs across the country.

TEXAS PORTS 2015 – 2016 CAPITAL PROGRAM
Appendix D Texas Transportation Code

CHAPTER 55. FUNDING OF PORT SECURITY, PROJECTS, AND STUDIES Page 1
TRANSPORTATION CODE
TITLE 4. NAVIGATION
SUBTITLE A. WATERWAYS AND PORTS
CHAPTER 55. FUNDING OF PORT SECURITY, PROJECTS, AND STUDIES Sec. 55.001. DEFINITIONS. In this chapter:
(1) "Commission" means the Texas Transportation Commission. (2) "Committee" means the Port Authority Advisory Committee. (3) "Department" means the Texas Department of Transportation. (4) "Fund" means the port access account fund. (5) "Port security, transportation, or facility project" means a project that is
necessary or convenient for the proper operation of a maritime port and that will improve the security, movement, and intermodal transportation of cargo or passengers in commerce and trade.
Added by Acts 2001, 77th Leg., ch. 1268, Sec. 1, eff. Sept. 1, 2001. Amended by Acts 2003, 78th Leg., ch. 1325, Sec. 18.02, eff. June 21, 2003. Amended by: Acts 2011, 82nd Leg., R.S., Ch. 480, Sec. 1, eff. September 1, 2011.
Sec. 55.002. PORT DEVELOPMENT FUNDING.
(a) From money in the fund, the department shall fund: (1) port security, transportation, or facility projects; and (2) maritime port studies.
(b) The commission by rule may establish matching fund requirements for receiving money from the fund.
(c) Port security, transportation, or facility projects eligible for funding under this chapter include:
(1) construction or improvement of transportation facilities within the jurisdiction of a maritime port;
(2) the dredging or deepening of channels, turning basins, or harbors; (3) the construction or improvement of wharves, docks, structures, jetties, piers,
storage facilities, cruise terminals, or any facilities necessary or useful in connection with maritime port transportation or economic development;
(4) the construction or improvement of facilities necessary or useful in providing maritime port security;
(5) the acquisition of container cranes or other mechanized equipment used in the movement of cargo or passengers in international commerce;
(6) the acquisition of land to be used for maritime port purposes; (7) the acquisition, improvement, enlargement, or extension of existing maritime
port facilities; and (8) environmental protection projects that:
(A) are required as a condition of a state, federal, or local environmental permit or other form of approval;
(B) are necessary for the acquisition of spoil disposal sites and improvements to existing and future spoil sites; or
(C) result from the undertaking of eligible projects.
CHAPTER 55. FUNDING OF PORT SECURITY, PROJECTS, AND STUDIES Page 2
(d) The department, in consultation with the committee, shall review the list of projects recommended by the committee to evaluate the economic benefit of each project. The commission, after receiving recommendations from the committee and from the department, shall approve projects or studies for funding based on its review.
Added by Acts 2001, 77th Leg., ch. 1268, Sec. 1, eff. Sept. 1, 2001. Amended by Acts 2003, 78th Leg., ch. 1325, Sec. 18.03, eff. June 21, 2003. Amended by:
Acts 2011, 82nd Leg., R.S., Ch. 480, Sec. 2, eff. September 1, 2011. Sec. 55.003. GIFTS AND GRANTS. The department may accept gifts, grants, and donations from any source for the purposes of this chapter. Added by Acts 2001, 77th Leg., ch. 1268, Sec. 1, eff. Sept. 1, 2001.
Sec. 55.004. AUDIT. The department may subject a project that receives money under this chapter to a final audit. Added by Acts 2001, 77th Leg., ch. 1268, Sec. 1, eff. Sept. 1, 2001. Amended by Acts 2003, 78th Leg., ch. 1325, Sec. 18.04, eff. June 21, 2003. Sec. 55.005. PORT ACCESS ACCOUNT FUND.
(a) The port access account fund is an account in the general revenue fund. (b) The following money shall be credited to the fund:
(1) money received from gifts, grants, and donations; and (2) interest earned on deposits and investments of the fund.
(c) Money in the fund may be appropriated only to the department to perform the department's powers and duties concerning maritime port transportation and economic development under this chapter and to pay the department's expenses incurred under this chapter.
(d) The financial transactions of the fund are subject to audit by the state auditor. Added by Acts 2001, 77th Leg., ch. 1268, Sec. 1, eff. Sept. 1, 2001. Amended by:
Acts 2011, 82nd Leg., R.S., Ch. 480, Sec. 3, eff. September 1, 2011. Sec. 55.006. PORT AUTHORITY ADVISORY COMMITTEE.
(a) The committee consists of seven members appointed by the commission. The members shall be appointed as follows:
(1) one member from the Port of Houston Authority; (2) three members who represent maritime ports on the upper Texas coast; and (3) three members who represent maritime ports on the lower Texas coast.
(b) A committee member serves at the pleasure of the commission. (c) The committee must meet at least semiannually. (d) A member is not entitled to compensation for service on the committee but is
entitled to reimbursement for reasonable expenses the member incurs in performing committee duties.

CHAPTER 55. FUNDING OF PORT SECURITY, PROJECTS, AND STUDIES Page 3
(e) Section 2110.002, Government Code, does not apply to the committee. Added by Acts 2001, 77th Leg., ch. 1268, Sec. 1, eff. Sept. 1, 2001. Amended by Acts 2003, 78th Leg., ch. 1325, Sec. 18.05, eff. June 21, 2003. Amended by:
Acts 2011, 82nd Leg., R.S., Ch. 480, Sec. 4, eff. September 1, 2011. Sec. 55.007. DUTIES OF COMMITTEE.
(a) The committee shall: (1) prepare a maritime port mission plan; (2) review each project eligible to be funded under this chapter and make
recommendations for approval or disapproval to the department; (3) every two years prepare a report on Texas maritime ports, with a list of
projects that have been recommended by the committee, including: (A) the recommended funding level for each project; and (B) if staged implementation of the project is appropriate, the funding
requirements for each stage; and (4) advise the commission and the department on matters relating to port
authorities. (b) The committee shall update the report on Texas maritime ports and shall submit
the report not later than December 1 of each even-numbered year to the commission for distribution to:
(1) the governor; (2) the lieutenant governor; and (3) the speaker of the house of representatives.
Added by Acts 2001, 77th Leg., ch. 1268, Sec. 1, eff. Sept. 1, 2001. Amended by Acts 2003, 78th Leg., ch. 1325, Sec. 18.06, eff. June 21, 2003. Amended by:
Acts 2011, 82nd Leg., R.S., Ch. 480, Sec. 5, eff. September 1, 2011. Sec. 55.008. CAPITAL PROGRAM.
(a) The committee shall prepare a two-year port capital program defining the goals and objectives of the committee concerning the development of maritime port facilities and an intermodal transportation system. The port capital program must include projects or studies submitted to the committee by any maritime port and recommendations for:
(1) the construction of transportation facilities connecting any maritime port to another transportation mode; and
(2) the efficient, cost-effective development of transportation facilities or maritime port facilities for the purpose of:
(A) enhancing international trade; (B) enhancing security; (C) promoting cargo flow; (D) increasing cruise passenger movements; (E) increasing maritime port revenues; and (F) providing economic benefits to the state.
(b) The committee shall update the port capital program and shall submit the capital program not later than December 1 of each even-numbered year to:

CHAPTER 55. FUNDING OF PORT SECURITY, PROJECTS, AND STUDIES Page 4
(1) the governor; (2) the lieutenant governor; (3) the speaker of the house of representatives; and (4) the commission.
Added by Acts 2001, 77th Leg., ch. 1268, Sec. 1, eff. Sept. 1, 2001. Amended by Acts 2003, 78th Leg., ch. 1325, Sec. 18.07, eff. June 21, 2003. Amended by:
Acts 2011, 82nd Leg., R.S., Ch. 480, Sec. 6, eff. September 1, 2011. Sec. 55.009. RULES. The commission shall adopt rules to implement this chapter. Added by Acts 2003, 78th Leg., ch. 1325, Sec. 18.08, eff. June 21, 2003.