texture, & learning - wur e-depot home
TRANSCRIPT

Texture,energy density& learningimplications for food intake
Pleunie S. Hogenkamp

Thesis committee
Thesis supervisorProf. dr. ir. Kees de Graaf
Professor of Sensory Science and Eating Behaviour Wageningen University, Wageningen
Thesis co-supervisorsDr. ir. Annette Stafleu
Scientist TNO, Zeist
Dr. ir. Monica Mars Scientist Wageningen University, Wageningen
Other membersProf. dr. Martin Yeomans
University of Sussex, Brighton (UK)
Dr. ir. Liesbeth Zandstra Unilever R&D Vlaardingen, Vlaardingen
Dr. Harold Bult NIZO food research, Ede
Prof. dr. ir. Tiny van Boekel Wageningen University, Wageningen
This research was conducted under the auspices of the Graduate School VLAG (Food Technology, Agrobiotechnology, Nutrition, and Health Sciences)

Pleunie S. Hogenkamp
Thesissubmitted in fulfilment of the requirements for the degree of doctor
at Wageningen Universityby the authority of the Rector Magnificus
Prof. dr. M.J. Kropff,in the presence of the
Thesis Committee appointed by the Academic Boardto be defended in publicon Friday 13 January 2012
at 4 p.m. in the Aula.
Texture,energy density
& learningimplications for food intake

Pleunie S. Hogenkamp
Texture, energy density & learning: implications for food intake144 pages
Thesis, Wageningen University, Wageningen, NL (2012)With references, with abstract in English and summary in Dutch
ISBN: 978-94-7173-122-7

Abstract
IntroductionFood texture has been shown to be an important factor in the regulation of food (energy) intake. Liquid foods e.g. elicit weaker satiety responses than solid foods with a similar energy content, and texture affects satiation, i.e. ad libitum food intake. Whether the effect of food texture on food intake stays the same over repeated exposure requires further investigation.
AimThe aim of this thesis is to investigate the role of food texture in learned satiation. We assessed the effect of texture on changes in ad libitum intake and expected satiation after repeated consumption of foods with different energy density.
MethodsWe conducted a series of learning experiments with healthy young adults. Participants repeatedly consumed a low-energy-dense (LE) and a high-energy-dense (HE) yogurt, which were either low (n=24) or high (n=22) in viscosity in one study; and consumed with a straw (liquid yogurt, n=34) or with a spoon (liquid yogurt, n=36; semi-solid yogurt, n=35) in a second study.Next, we investigated changes in expected satiation and intake after repeated consumption of a LE soup (n=32) or a HE soup (n=32) with similar appearance; and of a liquid and a semi-solid custard with a similar energy density (n=53). Additionally, we assessed the effect of texture, flavour and means of consumption on expected satiation of iso-caloric dairy products in 3 single-meal experiments.Finally, we served a fixed amount of a LE or HE food - either liquid or semi-solid - at each meal on 3 consecutive days, and measured ad libitum buffet intake directly after consump-tion of these foods (n=27).
ResultsTexture clearly affected satiation: ad libitum intake was up to 30% higher of liquid foods when compared with semi-solids foods in all experiments (p<0.0001). Participants expected semi-solid foods to be more satiating than iso-caloric liquid foods (p<0.01), irrespective of the product’s flavour or its means of consumption. The texture of a fixed amount of food did not affect subsequent intake of other foods.
Participants were able to learn about the foods’ satiating capacity after repeated consump-tion. Ad libitum intake of a HE high-viscous yogurt decreased and was 10% lower compared with a LE high-viscous yogurt after repeated consumption, while intake of a LE and HE low-viscous yogurt did not differ (interaction effect: p=0.04). We also observed that appetite sensations changed when participants repeatedly consumed a liquid and semi-solid custard with a similar energy density (p<0.05). In addition, participants increased their intake from the ad libitum buffet after repeated consumption of a LE food (from 1745 ± 577 to 1979 ± 567 kcal), while their intake did not change after a HE food (interaction effect: p=0.02). This increase was observed irrespective of the texture of the test foods. Ad libitum intake was higher of liquid foods when compared with semi-solid foods, also after learning about the energy content of a food over repeated exposure.

Participants did not adjust their intake and expected satiation consistently. Intake did not change when participants consumed a LE and a HE yogurts with a straw or with a spoon. We also did not observe profound changes in the expected satiation of a LE and HE soup or a liquid and semi-solid custard.
ConclusionsHealthy young adults learned about the foods’ satiating capacity after repeated consump-tion. Changes in intake and expectations in response to this learning did not depend on food texture.Food intake and expected satiation were not easily changed. The effect of food texture on satiation is important in the regulation of food intake, also after repeated exposure.

Contents
1 Introduction 9
2 Effect of viscosity on learned satiation 19 Physiology & Behavior, 2009, 98 (1-2): p. 60-66
3 Intake during repeated exposure to low- and high-energy-dense 35 yogurts with different means of consumption American Journal of Clinical Nutrition, 2010, 91: p. 841-847
4 Expected satiation after repeated consumption of 51 low- or high-energy-dense soup British Journal of Nutrition, accepted for publication
5 Texture, not flavour, affects expected satiation of dairy products 67 Appetite, 2011, 57 (3): p. 635-641
6 Changes in ad libitum intake and appetite sensations after repeated 83 consumption of iso-caloric liquid and semi-solid dairy foods Submitted for publication
7 Learning about the energy density of liquid and semi-solid foods 95 International Journal of Obesity, accepted for publication
8 General discussion 111
Samenvatting (summary in Dutch) 129
Dankwoord (acknowledgements) 133
About the author 139


Chapter 1 Introduction

10 Chapter1
Regulation of energy intake
The capacity to adjust energy intake in response to immediate and long-term energy requirements is critical for survival (1,2). Through the process of energy homeostasis, food (energy) intake is adjusted in response to changes in the energy content of the diet to pro-mote stability in the body fat stores (2). Food intake consists of a sequence of discrete eat-ing occasions, and adjustments in intake must therefore involve changes in meal size, meal frequency, or both (1). The size and the frequency of meals are regulated by both environ-mental and biological variables (e.g. 3,4). Important physiological aspects in the short-term control of food intake are the satiety signals that are generated by the sight and consump-tion of food (2,5).Satiety signals in response to food intake have not changed over the last decades, but the variety of foods increased and the food’s sensory aspects changed largely (6). Sensory signals are important in food choice and liking (7): a drive for variety in the diet and the immedi-ate pleasure derived from eating are important reasons for consumption (8,9). The sensory reward signals generated during ingestion may be stronger than can always be controlled by satiety signals (6,9). This may contribute to overconsumption.The availability of many processed foods that can be consumed at a very high eating rate (10) and the increased intake of energy-containing beverages (e.g. 11-13) are other important characteristics of the eating environment in the industrialized society that may limit the control of food intake by satiety signals. The oral exposure to these foods during consump-tion is only short, and satiety signals to stop eating may not have time to occur (7). This is a possible explanation for the weaker dietary compensation for modifications of energy intake via liquid foods when compared to solid foods (14). A higher intake of energy-containing beverages is associated with a higher energy intake and weight gain, and with an increased risk of obesity (15,16). Obesity results from a positive energy balance, i.e. ingesting calories in excess of energy requirements. Recent evidence suggests that physical activity energy expenditure has not declined in the United States and Europe since the 1980s, implying that an increased energy intake is the main cause of the current obesity pandemic (17,18). With the increasing number of public health problems related to obesty (19), it is of impor-tance to better understand the factors that may undermine the control of energy intake at healthy levels.One of the factors that is potentially important in the regulation of energy intake is food texture. Energy consumed as a beverage e.g. elicits only weak satiety responses when com-pared to energy consumed as a semi-solid or solid food (20). Consumption of ‘liquid calo-ries’ may add to the total energy intake and increase the risk of a positive energy balance (14,20), when intake of these calories is not compensated in an adequate manner.The research described in this thesis investigates the role of food texture in the regulation of energy intake. To better understand how texture can affect food intake, the factors that are important in the short-term regulation of food intake are introduced in this chapter. The thesis aim and outline will be presented thereafter.
SatiationandsatietyThe satiety signals involved in the short-term control of food intake are illustrated by the satiety cascade (21). This framework (figure 1.1) explains the sensory, cognitive and physi-

11Introduction
ological processes that occur before, during and after food consumption, and examines the impact of foods on satiation and satiety. Satiation and satiety are different but related proc-esses that influence the size and frequency of meals and snacks. Satiation is the process that results in meal termination, and thereby determines the amount consumed. Satiety is the process that suppresses hunger and inhibits further eating in the period between meals, and consequently determines initiation of a new meal (22).
Even before actual consumption of the food, physiological signals are generated by the sight and smell of food. These cephalic phase responses to sensory stimulation are rapid, short-lived, and small (relative to the signals when the food is actually metabolized) and prepare the body for effective food digestion (23). After ingestion, signals from the oral cav-ity and gastrointestinal tract further control appetite responses.Food-induced effects that reduce appetite include gastric distension, gastric emptying, and a rise of food metabolites in the circulation, like glucose, fatty acids, and amino acids. In addition, satiety hormones, like cholecystokinin, glucogon-like peptide 1, and insulin are released in response to food ingestion and neural receptors, like gastric stretch receptors, are activated during digestion (5,24). These satiety signals from the gastrointestinal tract are transmitted to the central nervous system and result in the feeling of fullness or sati-ety perception after consumption (5,22). The magnitude and duration of satiety responses depend among others on the macronutrient composition, energy density, and volume of the food (5).
Figure 1.1 The satiety cascade illustrates the psychological and physiological events that occur
before,duringandafterfoodconsumptionthatinhibitfurthereatinguntilthereturnofhun-
gersignals(from(22).
Satiation is driven by several sensory and cognitive processes that take place during con-sumption (25). Palatability of the food and the volume consumed are important determi-nants in this. People tend to consume a constant weight or volume of a food rather than a constant amount of energy (5,26), so that energy intake generally increases as energy den-sity of a food increases (27). Palatability of a specific food is related to a preferred combination of sensory cues (e.g. smell, taste, and texture) in a food (28). An enhanced palatability of a food may increase its intake (29). Palatability changes during consumption, and decreases more for an eaten food than for a non-eaten food. This process is referred to as sensory specific satiety (30). In this case, one is specifically satiated to the sensory attributes of the consumed food, but not fully satiated per se. Sensory specific satiety has been demonstrated for several attributes of food (25), such as flavour (31), texture (32), weight/volume (33,34), and appearance (31,35).

12 Chapter1
Dietary learning
The role of sensory factors in eating behaviour is not limited to effects of palatability and sensory specific satiety on intake. Sensory attributes acquire further meaning when associ-ated with the post-ingestive consequences (36-38) (figure 1.2). A clear example of these nutrient-sensory interactions is that a sweet taste in nature gener-ally indicates the availability of calories from carbohydrates and a bitter taste of unaccept-able or toxic substances (39,40). And indeed, human infants show an innate preference for sweet tastes and a dislike for bitter tastes (39). These innate preferences, however, are modi-fied from the beginning by learning processes that shape our eating pattern.In the earliest stage of life, food intake is largely controlled by internal, biological cues (40). Already during weaning food acceptance is enhanced by exposure to a variety of fla-vours (41). Thereafter, children learn what is edible and what is not, when to eat, in which amounts, and what are appropriate combinations (42). The use of a specific food in a spe-cific context may depend on the cultural and/or economic environment (9,43), and on learning processes that take place in our daily life. The learned associations between the sensory signals and the consequences during and after eating will eventually result in a cog-nitive attitude towards foods and eating (40). There may be a number of learning processes that explain the development of our eating behaviour.
Figure 1.2 Associative processes underlying the learning process that shape our eating behaviour.
Sensorypropertiesacquiremeaningwhenassociatedwithphysiologicaleffects,andena-
bletoanticipatetheconsequencesoffoodconsumption(from(7).
MereexposureThe simplest concept of dietary learning may be ‘mere exposure’. It is hypothesized that repeated exposure to a specific stimulus already results in an increased liking of that stim-ulus (44). This process may be interpreted as ‘learned safety’, i.e. the absence of negative consequences after consumption of the food (45,46). The learning process may explain the development of food preferences (47) and may also reduce food neophobia, i.e. the ten-dency to reject new foods (48).
AssociativeconditioningAnother concept in the development of eating behaviour is the occurrence of learn-ing based on associative conditioning. In the view of dietary learning, the condition-ing process involves the association of a neutral conditioned stimulus, e.g. the flavour

13Introduction
of the food, with a relevant unconditioned stimulus. This unconditioned stimulus can be an aspect of the social context or the atmosphere of eating (evaluative condition-ing, e.g. social learning), a familiar and liked flavour (flavour-flavour learning), or the post-ingestive consequences of the food (flavour-consequence learning) (42,49,50). The clearest example of this latter type of learning may be conditioned taste aversion, in which one may acquire a dislike for the flavour of a food when ingestion is followed by ill-ness or any negative physiological experiences (49). Positive physiological experiences, on the other hand, may result in flavour preferences, e.g. for drinks with psychoactive conse-quences, such as alcohol and caffeine (50). Flavour-consequence learning may also account for the generalized preference for high-energy-dense foods (26), when the hunger reduc-tion after consumption is associated with the flavour of the foods (50).
Dietary learning about satiation and satiety
The learning processes described above explain how preferences are acquired, but dietary learning also influences the amount of food that is consumed. Already when tasting a food, people may link the food’s sensory signals to the satiety perception after consumption of the food. This process is defined as conditioned satiety (37,38).Learned associations may be useful in the control of food intake: they enable individuals to anticipate the energy that would be provided by the food (51). In most cases, the physiolog-ical signals after consumption may not yet be fully effective at the moment of meal termi-nation (52). Learning from previous experiences, however, will help to adjust energy intake (53) and to select an appropriate amount of food for consumption during the meal (54).
EnergyintakeadjustmentsLearned satiation/satiety has been successfully demonstrated in several animal studies: rats (37), cats (55), and monkeys (56) adjusted their food intake in response to energy manipu-lation of their diet. Booth and colleagues (38) were the first to demonstrate the process of learned satiety in human adults. The effect of repeated exposure to a low- or high-energy-dense food on energy intake compensation have been investigated in several conditioning studies thereafter. Results of studies in children (57,58) have been more consistent than results of studies in human adults. Some studies report that adults adjusted energy intake in response to different energy levels provided by the test foods (59-61), while others do not (62-64). Better understanding of the factors that limit or enhance adequate intake adjust-ments is important to reduce the risk of overconsumption.
The occurrence of energy intake adjustments after repeated consumption of a food may be limited by the lifelong experience with thousands of food items that may make new learning relatively difficult (51). Human adults have a complex food environment and may be aware of only a fraction of the decisions that relate to food intake (43). Meals are most often initiated at set time points that may be largely controlled by external and social cues (3,65), and consumed in its entirety (66).In addition, people do not seem to adjust energy intake adequately when ingesting calories from liquid foods. Multiple studies report that liquid foods produced lower satiety scores (67-71) and a weaker compensatory response to balance energy intake throughout the day

14 Chapter1
(14,72,73) or over several weeks (74-76) compared with iso-caloric semi-solid or solid foods. This suggests that liquid calories may add to the total energy intake during the day, and that the texture of a food is important in the regulation of food intake.
TheeffectoffoodtextureonfoodintakeEnergy consumed as a liquid may elicit weaker satiety responses (20), increasing the risk of a positive energy balance. In addition, it was observed that intake of liquid foods was 30% higher than of semi-solid foods when iso-caloric foods were offered ad libitum (77). This difference disappeared when eating rate was standardized. The higher intake of a liquid food may be attributable to a higher eating rate, or a shorter sensory signal, while consum-ing liquid foods compared with consuming semi-solids foods (77). This may mean that satiety signals that contribute to satiation do not have time to occur. A longer oral sensory exposure to a food may result in earlier sensory specific satiety and regular satiety signals, with a reduced intake as a consequence (77). Comparison of normal eating with gastric infusion, thereby bypassing oral sensory stimulation, also showed the importance of sen-sory exposure in the satiating efficiency of a food (78). Oral ingestion of a food reduced subjective hunger ratings and intake at a subsequent meal more than gastric infusion of the same food (79,80). In line, it can be hypothesized that the short sensory exposure time to liquid foods limits the ability to associate the sensory attributes of a liquid food with its satiating effects after consumption. Hence, a longer sensory exposure would facilitate learning about the energy of a food: food texture may play an important role in successful observations of learned satiation. This may give an explanation for the absence of adjustments in energy intake in the studies that used liquid foods as test foods (63,64). Whether one would adjust energy intake more adequately when repeatedly consuming semi-solid foods compared with liq-uid foods have not been investigated however. This research question will be addressed in this thesis.
SatietyexpectationsLearned satiation may enable individuals to adjust their food intake. Rather than affect-ing meal termination, learning about a food’s satiating effects may be of importance in decisions on the size of meals (or snacks) prior to a meal (51). People can predict the consequences of consumption of a specific food and decide whether or not to eat the food apparently easy, based on previous experiences. As a result, the amount that peo-ple eat may be largely determined by how much they put on their plate (66). Pilgrim & Kamen (81) explored predictors of food consumption of military personnel and observed that the subjective satiety or ‘fillingness’ was a better predictor for consump-tion than the palatability or the macronutrient composition of the foods (81). In addi-tion, participants indicated that wholemeal (high-fibre) bread and protein-rich spreads were expected to be more satiating when compared with white (low-fibre) bread and high-fat spreads when shown photographs of these foods (82), or that sweet high-fat snacks were more filling than other snack types (83). These results suggest that human are well able to express their expectations about the consequences of consuming food. Expectations in this latter study were not reflected in a measure of intake (83). The concept of learned satiation suggests that people may adjust their expectations about

15Introduction
a the satiating effects of a food (i.e. expected satiation/satiety) after repeated ingestion. Insight in the underlying factors of changes in these expectations about satiation, e.g. the food characteristics that play a role in this, will expand our current knowledge on the regu-lation of food intake.
Aim and thesis outline
Better understanding of the factors that may limit the adequate control of energy intake is important to reduce the risk of overconsumption. One of the factors that is potentially important in the regulation of intake is food texture. The aim of this thesis is to investigate the role of food texture in learned satiation. We assessed the effect of texture on changes in ad libitum intake and in expected satiation after repeated consumption of foods with dif-ferent energy density.We first conducted two flavour-conditioning studies in which participants repeatedly con-sumed a low- and a high-energy-dense yogurt. The yogurts in these studies were either low or high in viscosity (chapter 2) or different in texture and consumed with a straw or a spoon (chapter 3). Thereafter, we investigated whether repeated consumption of a fixed amount of a low- or high-energy-dense soup with similar appearance would result in changes in expectations about the food’s satiating capacity (chapter 4, study 1), and whether participants were able to discriminate between different types of soup based on these expectations (chapter 4, study 2). Chapter 5 describes three single-meal experiments in which participants indicated their expectations about the satiating effects of dairy products with different texture and/or flavour. We investigated whether repeated consumption of a liquid and semi-solid custard with a similar energy density altered appetite sensations, satiety expectations and intake in chapter 6.
In the studies described in chapter 2 to 6 we offered the test foods once a day as a single-item meal. In the last study described in this thesis (chapter 7), we served low- or high-energy-dense foods that were either liquid or solid as a fixed part of consecutive meal occasions, and we measured ad libitum buffet intake with which the meals continued.
In the final chapter (chapter 8), the presented results are summarized and discussed, and implications and directions for further research are presented.

16 Chapter1
References
1 Morton GJ, Cummings DE, Baskin DG, Barsh GS, Schwartz MW. Central nervous system control of food intake and body weight. Nature 2006; 443(7109): 289-95.
2 Woods SC, Seeley RJ, Porte D, Schwartz MW. Signals that regulate food intake and energy homeostasis. Science 1998; 280(5368): 1378-1383.
3 Smith GP. The direct and indirect controls of meal size. Neurosci Biobehav Rev 1996; 20(1): 41-6.4 de Castro JM. Genetic influences on daily intake and meal patterns of humans. Physiol Behav 1993; 53(4): 777-782.5 de Graaf C, Blom WA, Smeets PA, Stafleu A, Hendriks HF. Biomarkers of satiation and satiety. Am J Clin Nutr
2004; 79(6): 946-61.6 Rolls ET. Understanding the mechanisms of food intake and obesity. Obes Rev 2007; 8: 67-72.7 de Graaf C, Kok FJ. Slow food, fast food and the control of food intake. 2010; 6(5): 290-293.8 Rolls BJ, Rowe EA, Rolls ET, Kingston B, Megson A, Gunary R. Variety in a meal enhances food intake in man.
Physiol Behav 1981; 26(2): 215-21.9 Mela DJ. Why do we like what we like? J Sci Food Agric 2001; 81(1): 10-16.10 Viskaal-van Dongen M, Kok FJ, de Graaf C. Eating rate of commonly consumed foods promotes food and energy intake.
Appetite 2011; 56(1): 25-31.11 Duffey KJ, Popkin BM. Shifts in patterns and consumption of beverages between 1965 and 2002. Obesity 2007;
15(11): 2739-47.12 Popkin BM. Patterns of beverage use across the lifecycle. Physiol Behav 2010: doi:10.1016/j.physbeh.2009.12.022.13 Bleich SN, Wang YC, Wang Y, Gortmaker SL. Increasing consumption of sugar-sweetened beverages among US adults:
1988-1994 to 1999-2004. Am J Clin Nutr 2009; 89(1): 372-81.14 Mattes RD. Dietary compensation by humans for supplemental energy provided as ethanol or carbohydrate in fluids.
Physiol Behav 1996; 59(1): 179-87.15 Malik VS, Schulze MB, Hu FB. Intake of sugar-sweetened beverages and weight gain: a systematic review. Am J Clin
Nutr 2006; 84(2): 274-88.16 Vartanian LR, Schwartz MB, Brownell KD. Effects of soft drink consumption on nutrition and health: a systematic
review and meta-analysis. Am J Public Health 2007; 97(4): 667-75.17 Westerterp KR, Speakman JR. Physical activity energy expenditure has not declined since the 1980s and matches energy
expenditures of wild mammals. 2008; 32(8): 1256-1263.18 Swinburn BA, Sacks G, Lo SK, Westerterp KR, Rush EC, Rosenbaum M et al. Estimating the changes in energy flux
that characterize the rise in obesity prevalence. Am J Clin Nutr 2009; 89(6): 1723-1728.19 TaskForce IO. The global challenge of obesity and the international obesity task force. International Obesity Task Force,
IASO.: London, 2002.20 Mattes RD. Beverages and positive energy balance: the menace is the medium. Int J Obes 2006; 30(S3): S60-S65.21 Blundell J, Rogers PJ, Hill AJ. Evaluating the satiating power of foods: implications for acceptance and consumption. In:
Solms J, Booth DA (eds). Food Acceptance and Nutrition. Academic Press: London, 1987, pp 205-219.22 Blundell JE. The control of appetite: basic concepts and practical implications. Schweiz Med Wochenschr 1999; 129(5):
182-8.23 Mattes RD. Physiologic responses to sensory stimulation by food: nutritional implications. J Am Diet Assoc 1997; 97(4):
406-410, 413.24 Woods SC. Gastrointestinal satiety signals I. An overview of gastrointestinal signals that influence food intake. Am J
Physiol Gastrointest Liver Physiol 2004; 286(1): G7-13.25 Blundell J, De Graaf C, Hulshof T, Jebb SA, Livingstone B, Lluch A et al. Appetite control: methodological aspects of
the evaluation of foods. Obes Rev 2010; 11(3): 251-270.26 Drewnowski A. Energy density, palatability, and satiety: implications for weight control. Nutr Rev 1998; 56(12):
347-353.27 Rolls BJ. The relationship between dietary energy density and energy intake. Physiol Behav 2009; 97(5): 609-615.28 Yeomans MR. Taste, palatability and the control of appetite. Proc Nutr Soc 1998; 57(4): 609-15.29 Sorensen LB, Moller P, Flint A, Martens M, Raben A. Effect of sensory perception of foods on appetite and food intake:
a review of studies on humans. Int J Obes Relat Metab Disord 2003; 27(10): 1152-66.30 Rolls BJ, Rolls ET, Rowe EA, Sweeney K. Sensory specific satiety in man. Physiol Behav 1981; 27(1): 137-42.31 Rolls BJ, Rowe EA, Rolls ET. How sensory properties of foods affect human feeding behavior. Physiol Behav 1982;
29(3): 409-17.32 Guinard JX, Brun P. Sensory-specific satiety: comparison of taste and texture effects. Appetite 1998; 31(2): 141-57.

17Introduction
33 Rolls BJ, Bell EA, Waugh BA. Increasing the volume of a food by incorporating air affects satiety in men. Am J Clin Nutr 2000; 72(2): 361-8.
34 Bell EA, Roe LS, Rolls BJ. Sensory-specific satiety is affected more by volume than by energy content of a liquid food. Physiol Behav 2003; 78(4-5): 593-600.
35 Weijzen PL, Liem DG, Zandstra EH, de Graaf C. Sensory specific satiety and intake: the difference between nibble- and bar-size snacks. Appetite 2008; 50(2-3): 435-42.
36 Le Magnen J. Increased food intake induced in rats by changes in the satiating sensory input from food (first published in French in 1956). Appetite 1999; 33(1): 33-35.
37 Booth DA. Conditioned satiety in the rat. J Comp Physiol Psychol 1972; 81(3): 457-71.38 Booth DA, Lee M, McAleavey C. Acquired sensory control of satiation in man. Brit J Psychol 1976; 67(2): 137-147.39 Steiner JE. Discussion paper: Innate, discriminative human facial expressions to taste and smell stimulation. Ann N Y
Acad Sci 1974; 237(1): 229-233.40 Westenhoefer J. Establishing good dietary habits - capturing the minds of children. Public Health Nutr 2001; 4(1a):
125-129.41 Mennella JA, Jagnow CP, Beauchamp GK. Prenatal and postnatal flavor learning by human infants. Pediatrics 2001;
107(6): e88.42 Birch LL, Fisher JO. Development of eating behaviors among children and adolescents. Pediatrics 1998; 101(Supple-
ment 2): 539-549.43 Wansink B, Sobal J. Mindless Eating. Environ Behav 2007; 39(1): 106-123.44 Zajonc RB. Attitudinal effects of mere exposure. . J Personal Soc Psychol 1968; 9(2): 1-27.45 Kalat JM, Rozin P. “Learned safety” as a mechanism in long-delay taste-aversion learning in rats. J of Comp Physiol
Psychol 1973; 83: 198-207.46 Pliner P, Salvi S. Food Neophobia in Humans. In: Shepard RM, Raats M (eds). The psychology of food choice. CABI:
Wallingford, 2006, pp 75-92.47 Birch LL, Marlin DW. I don’t like it; I never tried it: Effects of exposure on two-year-old children’s food preferences.
Appetite 1982; 3(4): 353-360.48 Wardle J, Herrera ML, Cooke L, Gibson EL. Modifying children’s food preferences: the effects of exposure and reward
on acceptance of an unfamiliar vegetable. 2003; 57(2): 341-348.49 Rozin P, Zellner D. The role of pavlovian conditioning in the acquisition of food likes and dislikes. Ann N Y Acad Sci
1985; 443(1): 189-202.50 Yeomans MR. The role of learning in development of food preferences. In: Shepherd R, Raats M (eds). Psychology of
food choice. CABI: Wallingford, 2006, pp 92-112.51 Brunstrom JM. Associative learning and the control of human dietary behavior. Appetite 2007; 49(1): 268-271.52 Stunkard A. Satiety is a conditioned reflex. Psychosom Med 1975; 37(5): 383-387.53 Booth DA. Food-conditioned eating preferences and aversions with interoceptive elements: conditioned appetites and
satieties. Ann N Y Acad Sci 1985; 443(1): 22-41.54 Brunstrom JM, Shakeshaft NG, Scott-Samuel NE. Measuring ‘expected satiety’ in a range of common foods using a
method of constant stimuli. Appetite 2008; 51(3): 604-14.55 Castonguay TW. Dietary dilution and intake in the cat. Physiol Behav 1981; 27(3): 547-549.56 Booth DA, Grinker JA. Learned control of meal size in spontaneously obese and nonobese bonnet macaque monkeys.
Physiol Behav 1993; 53(1): 51-57.57 Birch LL, Deysher M. Conditioned and unconditioned caloric compensation: Evidence for self-regulation of food intake
in young children. Learn Motiv 1985; 16(3): 341-355.58 Birch LL, McPhee L, Steinberg L, Sullivan S. Conditioned flavor preferences in young children. Physiol Behav 1990;
47(3): 501-505.59 Booth DA MP, Fuller J. Starch content of ordinary foods associatively conditions human appetite and satiation, indexed
by intake and eating pleasantness of starch-paired flavours. Appetite 1982; 3(2): 163-184.60 Louis-Sylvestre J, Tournier A, Verger P, Chabert M, Delorme B, Hossenlopp J. Learned caloric adjustment of human
intake. Appetite 1989; 12(2): 95-103.61 Yeomans MR, Weinberg L, James S. Effects of palatability and learned satiety on energy density influences on breakfast
intake in humans. Physiol Behav 2005; 86(4): 487-99.62 Specter SE, Bellisle F, Hémery-Véron S, Fiquet P, Bornet FRJ, Slama G. Reducing ice cream energy density does not
condition decreased acceptance or engender compensation following repeated exposure. Eur J Clin Nutr 1998; 52(10): 703-10.
63 Zandstra EH, Stubenitsky K, De Graaf C, Mela DJ. Effects of learned flavour cues on short-term regulation of food intake in a realistic setting. Physiol Behav 2002; 75(1-2): 83-90.

18 Chapter1
64 Van Wymelbeke V, Beridot-Therond ME, de La Gueronniere V, Fantino M. Influence of repeated consumption of beverages containing sucrose or intense sweeteners on food intake. Eur J Clin Nutr 2004; 58(1): 154-161.
65 Woods SC, Strubbe JH. The psychobiology of meals. Psychonom Bulletin Rev 1994; 1(2): 141-155.66 Fay SH, Ferriday D, Hinton EC, Shakeshaft NG, Rogers PJ, Brunstrom JM. What determines real-world meal size?
Evidence for pre-meal planning. Appetite 2011; 56(2): 284-289.67 Mattes RD, Campbell WW. Effects of food form and timing of ingestion on appetite and energy intake in lean young
adults and in young adults with obesity. J Am Diet Assoc 2009; 109(3): 430-7.68 Hulshof T, De Graaf C, Weststrate JA. The effects of preloads varying in physical state and fat content on satiety and
energy intake. Appetite 1993; 21(3): 273-86.69 Haber GB, Heaton KW, Murphy D, Burroughs LF. Depletion and disruption of dietary fibre. Effects on satiety,
plasma-glucose, and serum-insulin. Lancet 1977; 2(8040): 679-82.70 Flood-Obbagy JE, Rolls BJ. The effect of fruit in different forms on energy intake and satiety at a meal. Appetite 2009;
52(2): 416-22.71 Mattes RD, Rothacker D. Beverage viscosity is inversely related to postprandial hunger in humans. Physiol Behav 2001;
74(4-5): 551-7.72 Mourao DM, Bressan J, Campbell WW, Mattes RD. Effects of food form on appetite and energy intake in lean and
obese young adults. Int J Obes 2007; 31(11): 1688-1695.73 Tournier A, Louis-Sylvestre J. Effect of the physical state of a food on subsequent intake in human subjects. Appetite
1991; 16(1): 17-24.74 DiMeglio DP, Mattes RD. Liquid versus solid carbohydrate: effects on food intake and body weight. Int J Obes Relat
Metab Disord 2000; 24(6): 794-800.75 Raben A, Vasilaras TH, Moller AC, Astrup A. Sucrose compared with artificial sweeteners: different effects on ad libi-
tum food intake and body weight after 10 wk of supplementation in overweight subjects. Am J Clin Nutr 2002; 76(4): 721-9.
76 Tordoff MG, Alleva AM. Effect of drinking soda sweetened with aspartame or high-fructose corn syrup on food intake and body weight. Am J Clin Nutr 1990; 51(6): 963-9.
77 Zijlstra N, Mars M, de Wijk RA, Westerterp-Plantenga MS, de Graaf C. The effect of viscosity on ad libitum food intake. Int J Obes 2008; 32(4): 676-83.
78 French SJ, Cecil JE. Oral, gastric and intestinal influences on human feeding. Physiol Behav 2001; 74(4-5): 729-34.79 Cecil JE, Francis J, Read NW. Comparison of the effects of a high-fat and high-carbohydrate soup delivered orally and
intragastrically on gastric emptying, appetite, and eating behaviour. Physiol Behav 1999; 67(2): 299-306.80 Cecil JE, Francis J, Read NW. Relative contributions of intestinal, gastric, oro-sensory influences and information to
changes in appetite induced by the same liquid meal. Appetite 1998; 31(3): 377-90.81 Pilgrim FJ, Kamen JM. Predictors of human food consumption. Science 1963; 139(3554): 501-2.82 de Graaf C, Stafleu A, Staal P, Wijne M. Beliefs about the satiating effect of bread with spread varying in macronutrient
content. Appetite 1992; 18(2): 121-128.83 Green SM, Blundell JE. Subjective and objective indices of the satiating effect of foods. Can people predict how filling a
food will be? Eur J Clin Nutr 1996; 50(12): 798-806.

Chapter 2 Effect of viscosity on learned satiation
Monica Mars
Pleunie Hogenkamp
Antonie Gosses
Annette Stafleu
Kees de Graaf
Physiology & Behavior (2009) 98: p. 60-66

20 Chapter2
Abstract
A higher viscosity of a food leads to a longer orosensory stimulation. This may facilitate the learned association between sensory signals and metabolic consequences. In the current study we investigated the effect of viscosity on learned satiation. In two intervention groups, a low viscosity (LV) yogurt (n=24) and a high viscosity (HV) yogurt (n=22) was offered ad libitum for breakfast. In a learning period of 4 weeks, sub-jects consumed ad libitum a novel flavoured high energy density (HE) yogurt (150 kcal/100 g) or low energy density (LE) yogurt (50 kcal/100 g), with 10 exposures to each yogurt on alternate days. Over the repeated exposures, an interaction effect of exposure time*energy*viscosity on intake was seen (F(1,771)=4.12; p=0.04). In the HV intervention group a borderline signifi-cant interaction between exposure and energy density was observed (F(1,369)=3.61; p=0.06); after 10 exposures, the LE yogurt resulted in a 46 ± 16 g higher intake compared with the HE yogurt. In the LV group, no significant interaction between exposure and energy den-sity was seen (F(1,401)=1.04; p=0.31); after 10 exposures intake difference between the LE and HE yogurts was only 1.5 ± 15 g. These results suggest that a higher viscosity facilitates learned satiation.

21Effectofviscosityonlearnedsatiation
Introduction
Multiple studies show that the texture of a product affects food intake regulation. Com-pared with iso-energetic solid foods, liquids produce lower satiety scores (1-3) and a weaker compensation of energy intake throughout the day (4,5). Furthermore, we showed recently that meal size is affected by viscosity: subjects drank 30% more of a liquid compared with a semi-solid product, which was similar in nutrient composition and palatability. When eat-ing rate was standardized this difference disappeared (6), suggesting that the lower intake of a more viscous product may be attributable to a lower eating rate and consequently, to a longer oral sensory exposure.
Meal size in humans is partly based on previous experiences with food items, where sensory and physiological cues play an important role (7,8). Initially, subjects are not familiar with the post-ingestive consequences of a novel food. After repeated consumption an associa-tion may form between sensory properties of the food and its post-ingestive consequences (8-10). These associations enable subjects to predict the satiating capacity of the food. The effects of repeated exposure in regulation of meal termination have been defined as learned satiation (8,9,11).Several studies have investigated the effect of repeated exposure on energy intake compen-sation. Results of studies in animals (12,13) and children (14,15) have been more consistent than results of studies in human adults. Some studies report energy intake compensation in response to different energy levels provided by test foods (10,14-17), but others do not (18-23). The absence of consistent energy intake compensation in adults may be explained by sev-eral factors. First, human adults already have a lifelong experience with thousands of food items, which may make new learning relatively difficult (24). Secondly, compared to labo-ratory animals and young children, human adults have a complex food environment and often do not pay much attention to the food they eat (25). Another potential explanation for the absence of learning in the last six studies is that all these studies used liquids. It may be that the short sensory exposure time in liquids has been insufficient to enable subjects to associate the sensory attributes of these foods with their satiating effects. A longer sensory exposure with solid foods may facilitate learning. Hence, it can be hypothesized that intake of more viscous products with a longer sensory exposure will be reduced after repeated exposure, especially when energy density is high and a more satiating feeling is evoked compared with consumption of foods with lower energy content. In contrast, consumption levels of a liquid food will not be affected by repeated exposure. The effect of a food’s viscosity in the process of conditioned satiation is tested in this learning experiment.
Besides effect on intake, learning of the satiating capacity of foods is assumed to lead to increased liking of the flavours (8). The mechanism of flavour-energy learning predicts a greater liking of a flavour, when it is paired with a substance that is rewarding after it is ingested (26). It can be expected that foods with high energy levels will be rewarding and thus cause an increase in liking of the flavour coupled to this food. Pleasantness is assumed to be positively related to intake (27-29), which might result in a higher consumption level. On the other side, intake levels are hypothesized to decline due to learning of the post-

22 Chapter2
ingestive feedback. Over repeated exposures, learning of the satiating effect of a food will thus result in an increased liking, but decreased consumption.
In order to test these hypotheses we performed a learning experiment in two groups. In one group, subjects consumed a liquid, low viscosity (LV) yogurt and in the other group, subjects consumed a semi-solid, high viscosity (HV) yogurt. All subjects were repeatedly exposed to a low energy (LE) and a high energy (HE) dense yogurt. We measured ad libitum intake levels over the repeated exposures.
Methods
SubjectsYoung healthy adults (inclusion criteria: 18-30 y, BMI: 18.5-25.0 kg/m²) were recruited from Wageningen and surroundings. Exclusion criteria for participation were: restraint eating (Dutch Eating Behaviour Questionnaire-restraint scale (30), men: > 2.89, women: score > 3.39); lack of appetite for any (unknown) reason; using an energy restricted diet for the last 2 months; weight loss or weight gain of more than 5 kg during the last 2 months; stomach or bowel diseases; diabetes, thyroid disease or any other endocrine disorder; hypersensitiv-ity for milk products, i.e. intolerance or allergy for milk components; and participation in the pilot test. Moreover, subjects had to like yogurt products and eat breakfast regularly (≥ 5 times a week).Forty-nine subjects were eligible for the intervention. These subjects were matched for gen-der, BMI and age, and were randomized over the intervention subgroups (see design). Dur-ing the first measurement two subjects did not show up and one subject became ill after the first day of the experiment. Therefore, in total 46 subjects were included in the data-analyses (see table 2.1 for subject characteristics).Subjects were not aware that the primary outcome of the study was ad libitum food intake, as this could affect the outcome of the study. They were told that the aim was to test the acceptance of repeated consumption of novel yogurt products. After the study, subjects were debriefed. All subjects gave their written informed consent before participation. The study protocol was approved by the Medical Ethics Committee of Wageningen University (NL17534.081.07). Subjects received a financial compensation.
Table 2.1 Subjectcharacteristicsa(means±SD)forthelowviscosity(LV)andhighviscosity(HV)inter-
ventiongroup
LV yogurt (n=24) HV yogurt (n=22)
Male/female 4/20 4/18Age (years) 21.5 ± 1.8 21.6 ± 2.3Weight (kg) 65.8 ± 7.2 66.4 ± 9.6BMI (kg/m²) 21.7 ± 2.2 21.8 ± 1.5DEBQ b 2.1 ± 0.7 2.3 ± 0.5
a Subjects were matched on gender, age and BMI.b Restraint eating score on Dutch Eating Behavior Questionnaire (30).

23Effectofviscosityonlearnedsatiation
Design
The study was designed as a parallel intervention in two groups, consisting of three parts: a baseline measurement, a learning period and an end measurement (table 2.2). During the baseline and the end measurements, a preference ranking test and a fixed preload experi-ment with ad libitum test meal were carried out. During the learning period of four weeks, subjects consumed alternately HE and LE yogurts as breakfast at Wageningen University and Research Centre. Half of the subjects (n=24) received a LV yogurt; the remainder of the sub-jects (n=22) received a HV yogurt. Procedures are described in detail below.
Table 2.2 Schematicoverviewoftheparallelinterventiondesignwithalowviscosity(LV)andahigh
viscosity(HV)yogurtinterventiongroup
Baseline measurement Learning period End measurement week 1 week 2-5 week 6 day 1 day 2 day 3 days 1-20 day 1 day 2 day 3
LV rank order preload LE + HE a repeated flavour RA & SS b preload LE + HE a rank order c
HV rank order preload HE + LE a repeated flavour RA & SS b preload HE + LE a rank order c
a Preloads with low energy (LE) and high energy (HE) yogurts were offered in randomized order; half of the group received the LE preload first, half of the group received the HE preload first. The ad libitum test meal was served after 90 min.
b Half of the subjects received ‘spice speculaas’ (SS) flavour coupled with the LE yogurt and ‘rose apple’ (RA) flavour with HE yogurt, and half of the subjects received ‘spice speculaas’ coupled with the HE yogurt and ‘rose apple’ coupled with LE yogurt. Th e pre-The pre-sentation order of the LE and HE yogurt was randomized.
c Following the second rank order test, subjects were asked to point out the flavour that was coupled to the HE yogurt during the learning period.
TestfoodsThe yogurt beverages were developed and prepared especially for this experiment (Royal FrieslandCampina, Deventer, the Netherlands). The ingredients and nutritional composi-tion of the yogurts can be found in table 2.3. Yogurts with two different viscosities were produced (figure 2.1), both in a LE (50 kcal/100 g) and a HE (150 kcal/100 g) variant. Two different flavours were used during the learning period, chosen on the basis of a pilot test.
During this pilot test, 30 subjects scored 19 differently flavoured LV yogurts on pleasant-ness, familiarity of the flavour and novelty of the flavour in combination with yogurt. All yogurts had normal energy density levels (semi-skimmed yogurt with 10% added sugar; 73.3 kcal/100 g). From these 19, two flavours were selected. The flavours were chosen based on the following criteria: moderate liking score so that they had the possibility to decrease or increase after the learning period, similar liking score, relatively novel in combination with yogurt, and finally, they had to be clearly distinguishable from each other. For the latter criterion we chose a fruitlike and a nutlike flavour. Out of the 12 fruity flavours in the pilot test, the flavour ‘rose apple’ (type nr L131257, 0.02 wt.%) was added to half of the yogurts; to the other half ‘spice speculaas’ (type nr 514009H, 0.08 wt.%) was added. ‘Speculaas’ is a typical Dutch spice blend, consisting of amongst others cinnamon, ginger and nutmeg. The blend is normally used in spiced biscuits, which are consumed especially in winter. Both flavours were provided by Givaudan SA Corp. (Vernier, Switzerland).

24 Chapter2
Figure 2.1 Apparent viscosities of the four basic yogurts used in thepreload test and the learning
period.Measurementsweremadeat10°Cwithshearrates increasingfrom0to500per
secondin10minutes(ModularCompactReology-meter,typeMCR300).
Procedures
A preference ranking test was performed at baseline and after the learning period (table 2.2). On this separate test day, subjects came in the morning in a fasted state and ranked a total of six yogurts in order of preference. This ranking test included the flavours that were used during the condition period, ‘spice speculaas’ and ‘rose apple’, as well as four other flavours that were intermediately liked during the pilot test: ‘almond’ (type nr 511542H, 0.1 wt.%), ‘pumpkin’ (514366H, 0.01 wt.%), ‘meringue’ (DA53211, 0.15 wt.%) and ‘prickly pear’ (L-125124, 0.1 wt.%) (Givaudan SA Corp., Vernier, Switzerland). The products that were ranked had an energy density that was equal to the LE products that were developed for the learning period. The rank order test was performed with the same viscosity as the subject would receive during the learning period, i.e. LV yogurts for the low viscosity group and HV yogurts for the high viscosity group.
At baseline and after the learning period, a fixed preload test was performed on two consec-utive days for both the LE and HE yogurt that the subject would receive during the learning period, in randomized order (table 2.2). On both days, the subjects came in a fasted state to the research centre and consumed a fixed amount of the LE and the HE yogurt, i.e. 400 g for women and 500 g for men. Fasted state was defined as no eating or drinking after 22:00 on the evening preceding the test day, but non-caloric beverages were allowed until one hour before the test session. Before and 15, 30, 45, 60 and 90 min after start of consumption, subjects scored their appetite (hunger, fullness, desire to eat, prospective consumption, appetite for something savoury, appetite for something sweet) and thirst by means of visual analogue scales (VAS) (31). The 100 mm lines were anchored with ‘not at all’ to ‘extremely’ and were completed on paper by the subjects. The questionnaires were generated and read

25Effectofviscosityonlearnedsatiation
by means of the Teleform® scanning station and software package (Consilium Benelux DCS BV, Rotterdam, the Netherlands), which automatically reads the distance between the left anchor and the rating of the subject at a precision of 1 mm.At 90 min after the start of the preload, subjects received an ad libitum test meal, after which subjects again scored their appetite ratings (at 110 min).
Table 2.3 Ingredients and nutritional composition of the low viscosity (LV) and high viscosity (HV)
yogurts, lowenergy(LE)andhighenergy(HE)variants,used in thepreloadtestandthe
learningperiod
LV yogurts HV yogurts LE HE LE HE
Ingredients (g/100g)Low fat yogurt 96 65 96 66Cream (35% fat) 3.8 25.2 1.0 22.0Pectine YM115 H 0.25 0.25 0.25 0.25Sucrose - 10 - 10Starch CH3010 - - 3.0 2.5Aspartame 0.019 - 0.019 -Saccharine 0.004 - 0.004 -
Nutrient composition (g/100g) a Carbohydrates 5.5 13.8 7.5 15.7Protein 3.6 2.9 3.5 2.8Fat 2.0 9.3 0.9 8.1Energy (kcal/100g) 51 150 52 147
a Based on chemical analyses of the laboratory of the division of Human Nutrition of Wageningen University. A homogenous mixture of 3 batches was analyzed. Means of both flavours are presented.
The test meal consisted of sandwiches with three different fillings: jam, ham and cheese (see table 2.4 for the nutrient composition of the test meal). The sandwiches were presented in quarters; in total 12 quarters were presented per filling, thus 36 pieces per subject in total. Subjects were instructed to eat until they were pleasantly satisfied within a time-span of 20 min. During the test meal, tap water and tea without milk or sugar was available. Leftovers were counted and intake was calculated of the sandwiches both in weight (g) and energy content (kcal).
Table 2.4 Energy,nutrientcompositiona(per100g)andenergypercentage(en%)ofthead libitum
testmealthatwasofferedafterthefixedpreload
Jam Sandwich Ham sandwich Cheese sandwich
Energy, kcal 275 268 292Carbohydrates, g (en%) 47.4 (69) 37.5 (56) 35.8 (49)Fat, g (en%) 6.1 (20) 6.1 (22) 11.5 (35) Protein, g (en%) 6.9 (10) 15.8 (24) 10.8 (15)Fibre, g 4.8 5.0 4.8Portion size, g 20 20 20
a Based on chemical analyses of the laboratory of the Division of Human Nutrition of Wageningen University.

26 Chapter2
Additionally, consumption time of the yogurt was measured to test the assumed difference in eating rate.
During the learning period, all subjects were offered two different flavour-energy-combina-tions: half of the subjects got ‘spice speculaas’ flavour coupled with the LE yogurt and ‘rose apple’ flavour with HE yogurt; and half of the subjects got ‘spice speculaas’ coupled with the HE yogurt and ‘rose apple’ coupled with LE yogurt. Flavours were coupled to energy density levels under double blind conditions. Subjects consumed the yogurts for breakfast on weekdays only. The order of the LE and HE yogurts was randomized within subjects and within each week, with the condition that subjects were exposed a maximum of two days in a row to each yogurt. Over the weekend this was a maximum of three exposures in a row. Moreover, subjects were exposed to each yogurt five times in the first two weeks and five times in the second two weeks, so that total exposure time for each subject was ten times to both the LE and the HE yogurt (table 2.2).
In the learning period, subjects came in a fasted state to the research centre during one of the three test sessions: 8:00 (n=19), 8:30 (n=19) or 9:00 (n=8). Intervention groups and fla-vour subgroups were equally divided over the test sessions. Subjects were tested individu-ally in the same moment in time as much as possible to standardize individual satiety state.Subjects consumed the yogurts with a thick straw (length 26 cm, diameter 0.9 cm) from a non-transparent bottle of 1 L, so they could not get any visual or weight cues on their consumption level. Subjects were instructed to drink until pleasantly satisfied; they had to be seated for at least 20 min. If needed, a second bottle was given to the participant; this happened four times within the same subject. During all exposures, yogurts were scored on pleasantness after the first sip. Before and after consumption, the bottle was weighed to the nearest 1 g on a digital scale (model XP-3000, Denver Instruments, Germany) to obtain the ad libitum consumption of the yogurt.
After the learning period, the preload and rank order tests were performed again as described above. Following the second ranking test, subjects were debriefed on the exact aim of the study. Moreover, they were instructed to taste the two conditioned flavours again (with intermediate energy content) and to indicate which of the flavours was combined with the HE yogurt during the learning period.
DataanalysisContinuous variables are presented as means and standard errors of the means, unless oth-erwise specified. Categorical variables are presented as frequencies of percentages and were tested by means of Chi-square tests. Data of the flavour-energy subgroups was combined.In order to test whether the flavour-energy learning effect over time is depended on the vis-cosity of the yogurts, we first tested the effects of viscosity, energy and exposure time on ad libitum intake and on pleasantness in a 3-way ANOVA model. When a significant interaction was shown, we continued with testing exposure time effects separately for the LV and HV yogurts. Within-subjects analyses were performed for LE and HE yogurts.The mixed model procedure was used to perform the ANOVA and linear regression analyses to contrast the effects of viscosity and energy density over time on food intake and on pleas-

27Effectofviscosityonlearnedsatiation
antness; unpaired t-tests were used comparisons were made between the means of the LV and HV groups; differences within the two viscosity groups were tested by means of paired t-tests; and areas under the curve were calculated for the appetite profiles by means of the trapezoid rule.The ANOVA models regarding changes in intake and pleasantness took subject as random variable into account and were adjusted for baseline values by adding it as co-variable in the regression model. Tests were performed two-sided, p-values <0.05 were considered sig-nificant. Data was analysed using the statistical program SAS (version 9.1; SAS Institute Inc., Cary, NC, USA).
Results
Over the repeated exposures there was an interaction effect of exposure time*energy*viscosity: the F-value for this 3-way interaction was significant (F(1,771)=4.12; p=0.04). This implies that the flavour-energy learning effect over time was depended of the viscosity of the yogurts.
Figure 2.2 Ad libitumintakeofthefourbasicyogurtsduringthelearningperiod(mean±SEM).Intake
ispresentedingram(upperpanel)andkcal(lowerpanel).

28 Chapter2
Figure 2.2 shows ad libitum intake of the four basic yogurts during the learning period. In the HV intervention group, linear regression showed a borderline significant interaction between exposure time and energy density (F(1,369)=3.61; p=0.06); after 10 exposures, the LE yogurt resulted in a 46 ± 16 g higher intake compared with the HE yogurt. In the LV intervention group, the intake difference between the energy levels after 10 exposures was only 1.5 ± 15 g and the interaction effect was not observed (F(1,401)=1.04; p=0.31).
The lower panel of figure 2.2 shows that energy intake for subjects consuming the LE yogurts was significantly lower than for subjects consuming HE yogurts in the LV intervention group (F(1,401)=37.01; p<0.0001), as well as in the HV intervention group (F(1,369)=7.01; p<0.0001). Pleasantness related positively to intake (r=0.21; p<0.0001) and this confounded analysis on intake levels. Therefore, we corrected for pleasantness by adding this factor as a covariate to the ANOVA models. This made the interaction between exposure time and energy density in the HV intervention group stronger; when adjusted for pleasantness the difference in intake between the LE and HE versions of this yogurt enlarged to 67 ± 15 g after 10 exposures (F(1,363)=4.19; p=0.04). Again, no effect between exposure time and energy density was seen in the group consuming LV yogurts (F(1,390)=0.74; p=0.39).
The influence of exposure time, viscosity and energy on pleasantness ratings were tested in a 3-way ANOVA. No significant interaction between these three factors was seen (F(1,758)=0.00; p=0.99), but pleasantness scores changed over time (F(1,763)=4.10; p=0.04). By testing the yogurts separately it was shown that rated pleasantness of the LV yogurts decreased (F(1,394)=10.51; p=0.001), while ratings for the HV products remained unchanged (F(1,367)=0.04; p=0.84). In addition, figure 2.3 shows that in the LV group the LE yogurt was rated as more pleasant than the HE yogurt, while the reverse pattern was evi-dent in the HV group. This is seen in a significant interaction between viscosity and energy (F(1,762)=20.56; p<0.0001).
Figure 2.3 Pleasantnessratings(100-unitVAS)ofthefourbasicyogurtsduringthelearningperiod
(mean±SEM).

29Effectofviscosityonlearnedsatiation
Baseline appetite scores (hunger, fullness, desire to eat, prospective consumption, appe-tite for something savoury, appetite for something sweet) and thirst did not differ at the start of the preload tests between the test days nor between preload tests before and after the learning period. Measurements of all appetite sensations showed a similar response in time: a sharp drop in appetite ratings immediately after consumption of the preloads, increasing appetite scores up to the ad libitum test meal and lowest scores following the sandwich meal. Appetite just before the test meal intake (at 90 min) did not reach base-line levels in any of the intervention groups. At all points in time, the number of repeated exposures, viscosity or energy density of the yogurts did not affect the appetite ratings or thirst significantly and no differences were observed for the areas under the curves (data not shown). A significant time-effect was seen for all appetite responses (LV: F(6,318)=28.99; HV: F(6,291)=30.36; p<0.0001).Results of the fixed preload test did not show an effect of viscosity or energy density of the yogurts on ad libitum sandwich intake. Changes in consumption before and after the learn-ing period were not significantly different between the viscosity groups; 0.3 and 0.5 quarters of a sandwich or 3.3 and 6.4 kcal for LV and HV group, respectively (figure 2.4).
Figure 2.4 Ad libitumintakeofthetestmealafterafixedlowenergy(LE)andhighenergy(HE)preload
atbaselineandduringendmeasurement(mean±SEM).Intakeispresentedingram(upper
panel)andkcal(lowerpanel).Nosignificantchangeinintakeofinanythetestmealswas
observedbetweenbaselineandendmeasurement(pairedT-test,allp-values>0.05).

30 Chapter2
Consumption time was longer for the fixed amount of HV yogurt than for LV yogurts (t=3.90; p<0.001): on average, the LV preload was consumed in 3.1 ± 1.7 min and the HV preload in 4.9 ± 2.7 min. In the rank order test, the increase of rank numbers was 0.42 higher for HE yogurts com-pared to LE yogurts. However, this difference was not statistically significant and no main effect of viscosity in the increase of rank numbers was observed (F(1,41)=0.11; p=0.74). Overall, rank numbers were higher for ‘rose apple’ than for ‘spice speculaas’ flavours (data not shown).Analysis of the debriefing questionnaire showed that 64% of the subjects in the LV interven-tion group were able to point out the flavour that was coupled to the HE yogurt during the learning period. This proportion was not significantly different from the group consuming the HV yogurts, in which 75% of the subjects answered correctly (χ2=0.63; p=0.43).
Discussion
The current experiment showed that a higher viscosity of a food facilitated the process of learned satiation. Subjects that got high viscosity yogurts did adjust their ad libitum intake: consumption of the high energy yogurt was 46 g lower compared with the intake of low energy yogurt. After 10 alternating exposures to low and high energy, low viscosity yogurts, subjects did not adjust their intake.As the primary outcome we measured changes in ad libitum intake over time, unlike the majority of similar studies that used fixed preloads and measured intake of subsequent test meals as primary outcome variable. The reason for this was that we expected viscosity to be a food property that affects meal size (6). Therefore the focus was on meal termination and not on the size of a second meal after a fixed preload. The learning effect for energy content is consistent with earlier conditioning studies reporting learned satiety (10,14-16). The effect of viscosity on ad libitum intake also aligns with single meal experiments showing a higher intake with lower viscosity (6). This result is also in line with weaker dietary intake com-pensation for beverages than for solid food forms of comparable nutrient content (32,33). The intake of the low viscosity products remained significantly higher than that of more viscous products throughout the whole experiment (figure 2.2).
The size of the decreased intake of the high viscosity product was small. This may suggest that the differences in oral processing time between the products were not large enough to find bigger effects. We did not obtain exposure time to the food during the ad libitum meal, but measurements on eating time of the fixed load showed a small difference in eating rate. It took the subjects about 1.5 times longer to consume the high viscosity product compared with the low viscosity product. One might need much higher differences in oral processing time in order to find more pronounced effects, In the study of Haber et al., it took subjects 10 times longer to consume apples than the equivalent amount of apple juice (1).In the current study, subjects consumed test foods in a fasted state. Due to flavour-energy learning an increase in pleasantness of flavours coupled to the more satiating high viscosity yogurts was expected (34) and the hungry state of the subjects was assumed to contribute to this increase (16,35). Previous studies with a similar design showed an increased pleas-antness of high energy dense products (15,16,21,35), or a less palatable evaluation of the low

31Effectofviscosityonlearnedsatiation
energy dense test food (20). Our results did not show any changes in pleasantness in high viscosity yogurts, and no effect of viscosity was seen in results of the rank order test. These unchanged pleasantness and ranking scores might have been the result of ‘anchoring’; i.e. subjects’ remembrance of their initial liking score of the product. Nonetheless, subjects decreased consumption of the high energy yogurt but did not report a decrease in pleasant-ness ratings of this yoghurt over repeated exposure. This confirms adjustment to the food’s energy content, caused by learning of its satiating capacity.
For low viscosity yogurts, a decrease in pleasantness ratings was observed during the learn-ing period. Remarkably, pleasantness of the low energy was higher compared with the high energy in low viscosity yogurt. The high energy content of this latter yogurt (150 kcal/100 g) resulted in a relatively fatty flavour. The number of commercial available liquids with a similar energy content is limited to products that are supposed to be diluted or to be used in small portion sizes only, i.e. condensed milk (36). This suggests that the nutritional com-position as applied in this study is not appropriate for liquid foods, which might therefore be experienced as unusual and probably unpleasant.The results of the fixed preload tests and similar responses in the appetite profiles suggest that satiating effects of viscosity and energy are limited to satiation and do not affect satiety. However, the time delay of 90 min between preload volume and test meal might have been too long to show any effect on consumption levels in the second meal. It has been suggested that shorter time intervals might show a more satiating effect of liquid preloads compared to solid preloads and this would have been of interest for our LV and HV yogurts (37).
The absence of compensational behaviour might be explained partly by the tendency of humans to eat in episodes (38) and portion sizes are likely to be determined by routine; ‘my habitual intake at lunch’. Results of the sandwich intake (figure 2.4) suggest that weight intake was constant across the different groups. We found that subjects could learn the energy content of a product that was high in viscos-ity, while there was a lack of learning of the energy difference of the low viscosity product. This difference is probably due to a longer oral processing time and sensory exposure of more viscous products. Several studies failed to show any learning effect after exposures to low and high energy dense products. These studies used either (drink) yogurts (21,28) or flavoured mineral water (20), both low viscosity products. The short orosensory exposure of these foods might explain the absence of learning of energy content of the foods.Although our results support this hypothesis, physiological feedback mechanisms cannot be excluded in the satiating capacity of a food. For example, cephalic phase response, a reflex of the body that prepares the body for ingestion a certain food (39), might be more outspoken for a more viscous food compared with a liquid food. However, results of a sin-gle meal study did not show clear differences in several physiological parameters after con-sumption of liquid and semi-solid products (40). Further studies should clarify the role of underlying physiological mechanisms.
We conclude that viscosity plays a role in learned satiation, but not in satiety. In addition, satiating feelings have a greater effect on intake than on pleasantness. The finding that these effects were more pronounced in the high viscosity products, confirms the hypothesis that difference in energy content can be identified and learned to control for in (semi-) solid

32 Chapter2
foods but not in liquid foods. The higher eating rate of less viscous products is assumed to contribute to the insignificant learning effect for these foods, with a failure in energy adjustments as a consequence. It will be interesting to further study the underlying physi-ological mechanism of learned satiation and investigate to what extent orosensory stimula-tion is important in this phenomenon.
AcknowledgementsWe thank all participants in these studies and research assistants Lieke Tobben, Natasja Hück, Marijke de Cock, Suzanne Olthof; Royal FrieslandCampina, Deventer, the Neth-erlands; Tineke van Roekel for the chemical analyses and Harry Baptist for the rheological measurements.
References 1 Haber GB, Heaton KW, Murphy D, Burroughs LF. Depletion and disruption of dietary fibre. Effects on satiety,
plasma-glucose, and serum-insulin. Lancet 1977; 2(8040): 679-82.2 Mattes RD, Rothacker D. Beverage viscosity is inversely related to postprandial hunger in humans. Physiol Behav 2001;
74(4-5): 551-7.3 Tsuchiya A, Almiron-Roig E, Lluch A, Guyonnet D, Drewnowski A. Higher satiety ratings following yogurt consump-
tion relative to fruit drink or dairy fruit drink. J Am Diet Assoc 2006; 106(4): 550-7.4 Tournier A, Louis-Sylvestre J. Effect of the physical state of a food on subsequent intake in human subjects. Appetite
1991; 16(1): 17-24.5 Mattes RD. Dietary compensation by humans for supplemental energy provided as ethanol or carbohydrate in fluids.
Physiol Behav 1996; 59(1): 179-87.6 Zijlstra N, Mars M, de Wijk RA, Westerterp-Plantenga MS, de Graaf C. The effect of viscosity on ad libitum food
intake. Int J Obes 2008; 32(4): 676-83.7 Shaffer SE, Tepper BJ. Effects of learned flavor cues on single meal and daily food intake in humans. Physiol Behav
1994; 55(6): 979-986.8 Brunstrom JM. Dietary learning in humans: directions for future research. Physiol Behav 2005; 85(1): 57-65.9 Booth DA, Davis JD. Gastrointestinal factors in the acquisition of oral sensory control of satiation. Physiol Behav 1973;
11(1): 23-29.10 Yeomans MR, Weinberg L, James S. Effects of palatability and learned satiety on energy density influences on breakfast
intake in humans. Physiol Behav 2005; 86(4): 487-99.11 Booth DA, Grinker JA. Learned control of meal size in spontaneously obese and nonobese bonnet macaque monkeys.
Physiol Behav 1993; 53(1): 51-57.12 Sclafani A. Learned Controls of Ingestive Behaviour. Appetite 1997; 29(2): 153-158.13 Booth DA. Conditioned satiety in the rat. The Journal of comparative and physiological psychology 1972; 81(3):
457-71.14 Birch LL, Deysher M. Conditioned and unconditioned caloric compensation: Evidence for self-regulation of food intake
in young children. Learn Motiv 1985; 16(3): 341-355.15 Birch LL, McPhee L, Steinberg L, Sullivan S. Conditioned flavor preferences in young children. Physiol Behav 1990;
47(3): 501-505.16 Booth DA, Mather P, Fuller J. Starch content of ordinary foods associatively conditions human appetite and satiation,
indexed by intake and eating pleasantness of starch-paired flavours. Appetite 1982; 3(2): 163-184.17 Louis-Sylvestre J, Tournier A, Verger P, Chabert M, Delorme B, Hossenlopp J. Learned caloric adjustment of human
intake. Appetite 1989; 12(2): 95-103.18 Specter SE, Bellisle F, Hémery-Véron S, Fiquet P, Bornet FRJ, Slama G. Reducing ice cream energy density does not
condition decreased acceptance or engender compensation following repeated exposure. Eur J Clin Nutr 1998; 52(10): 703-10.
19 Zandstra EH, Stubenitsky K, De Graaf C, Mela DJ. Effects of learned flavour cues on short-term regulation of food intake in a realistic setting. Physiol Behav 2002; 75(1-2): 83-90.

33Effectofviscosityonlearnedsatiation
20 Van Wymelbeke V, Beridot-Therond ME, de La Gueronniere V, Fantino M. Influence of repeated consumption of beverages containing sucrose or intense sweeteners on food intake. Eur J Clin Nutr 2004; 58(1): 154-161.
21 Brunstrom JM, Mitchell GL. Flavor-nutrient learning in restrained and unrestrained eaters. Physiology & Behavior 2007; 90(1): 133-141.
22 Raben A, Vasilaras TH, Moller AC, Astrup A. Sucrose compared with artificial sweeteners: different effects on ad libi-tum food intake and body weight after 10 wk of supplementation in overweight subjects. Am J Clin Nutr 2002; 76(4): 721-9.
23 DiMeglio DP, Mattes RD. Liquid versus solid carbohydrate: effects on food intake and body weight. Int J Obes Relat Metab Disord 2000; 24(6): 794-800.
24 Golan M. Social learning and weight-related problems. In: Saracho ON, Spodek B (eds). Contemporary Perspectives on Socialization and Social Development in Early Childhood Education. Information Age Publishing: Charlotte, 2007, pp 241-266.
25 Wansink B. Mindless eating: Why we eat more than we think, Bantam Dell: New York, 2006.26 Sclafani A. Psychobiology of food preferences. Int J Obes 2001; 25: S13-S16.27 Pliner P, Mann N. Influence of social norms and palatability on amount consumed and food choice. Appetite 2004;
42(2): 227-237.28 Zandstra EH, De Graaf C, Mela DJ, Van Staveren WA. Short- and long-term effects of changes in pleasantness on food
intake. Appetite 2000; 34(3): 253-260.29 Yeomans MR, Gray RW, Mitchell CJ, True S. Independent effects of palatability and within-meal pauses on intake and
appetite ratings in human volunteers. Appetite 1997; 29(1): 61-76.30 Van Strien T. Nederlandse Vragenlijst voor Eetgedrag (NVE). Handleiding, Boom Test Publishers: Amsterdam, the
Netherlands, 2005.31 Hill AJ, Rogers PJ, Blundell JE. Techniques for the experimental measurement of human eating behaviour and food
intake: a practical guide. Int J Obes Relat Metab Disord 1995; 19(6): 361-75.32 Mourao DM, Bressan J, Campbell WW, Mattes RD. Effects of food form on appetite and energy intake in lean and
obese young adults. Int J Obes 2007; 31(11): 1688-1695.33 DiMeglio DP, Mattes RD. Liquid versus solid carbohydrate: Effects on food intake and body weight. International
Journal of Obesity 2000; 24(6): 794-800.34 Capaldi ED, Privitera GJ. Flavor-nutrient learning independent of flavor-taste learning with college students. Appetite
2007; 49(3): 712-715.35 Mobini S, Chambers LC, Yeomans MR. Effects of hunger state on flavour pleasantness conditioning at home: Flavour-
nutrient learning vs. flavour-flavour learning. Appetite 2007; 48(1): 20-28.36 Voedingscentrum (Gezondheidsraad SN. Nederlandse Voedingsmiddelentabel, vol. 40e druk. 2004.37 Almiron-Roig E, Chen Y, Drewnowski A. Liquid calories and the failure of satiety: How good is the evidence? Obesity
Reviews 2003; 4(4): 201-212.38 Gibney MJ, Wolever TMS. Periodicity of eating and human health: Present perspective and future directions. Br J Nutr
1997; 77: S3-S5.39 Mattes RD. Physiologic responses to sensory stimulation by food: nutritional implications. J Am Diet Assoc 1997; 97(4):
406-13.40 Zijlstra N, Mars M, de Wijk RA, Westerterp-Plantenga MS, Holst JJ, de Graaf C. Effect of viscosity on appetite and
gastro-intestinal hormones. Physiol Behav 2009; 97(1): 68-75.


Chapter 3 Intake during repeated exposure to
low- and high-energy-dense yogurts by different means of consumption
Pleunie Hogenkamp
Monica Mars
Annette Stafleu
Kees de Graaf
American Journal of Clinical Nutrition (2010) 91: p. 841-847

36 Chapter3
Abstract
An important question in the regulation of energy intake is whether dietary learning of energy content depends on the food’s characteristics, such as texture. Texture might affect the duration of sensory exposure and eating rate. The objective of this study was to inves-tigate whether a long sensory exposure, due to differences in means of consumption and in viscosity, enhances learned associations between sensory signals and metabolic conse-quences, and hence, facilitates energy intake compensation.A total of 105 healthy young adults with a mean (± SD) age of 22 ± 3 y and a body mass index (in kg/m²) of 21.6 ± 1.7 participated in a parallel intervention in 3 groups: liquid yogurt with a straw (liquid/straw; n=34), liquid yogurt with a spoon (liquid/spoon; n=36), or semi-solid yogurt with a spoon (semi-solid/spoon; n=35). Novel flavoured yogurts were offered ad libitum for breakfast in 2 energy densities: low (≈215 kJ/100 g) and high (≈600 kJ/100 g). Subjects were repeatedly exposed (10 times), and yogurt intake was measured.Intake (p=0.01) and eating rates (p=0.01) were highest in the liquid/straw group. Average intake over 10 exposures was 575 ± 260 g for liquid/straw, 475 ± 192 g for liquid/spoon, and 470 ± 223 g for semi-solid/spoon; average eating rate was 132 ± 83 g/min for liquid/straw, 106 ± 53 g/min for liquid/spoon, and 105 ± 88 g/min for semi-solid/spoon. No significant interaction for intake between intervention group, energy density, and repeated exposure was observed, and intake of the low- and high-energy-dense yogurts did not change over time in any of the intervention groups.We observed no energy intake compensation after repeated exposure to yogurt products. Differences in ad libitum yogurt intake could be explained by eating rate, affected by dif-ferent means of consumption. This trial was registered with the Dutch trial registration (NTR 1853).

37Repeatedexposuretolow-andhigh-energyyogurts
Introduction
‘Learned satiation’ is defined as the learned association between the sensory properties of food and its post-ingestive effects (1). It is assumed that, after consecutive exposures, an orosensory satiating signal based on this association will help to control meal size (2): the learning of a food’s satiating capacity enables subjects to anticipate the energy that will be provided by the food (3) and consequently, to adjust their intake. Young children learn to adjust the energy intake of new foods after a few exposures (4,5). Adults however, do not demonstrate robust energy intake compensation following repeated exposures to low- and high-energy-dense products. Explanations for the inconsistent results in human adults (e.g. 6-8 vs. 9-12) include the possibility that learning occurs mainly in childhood or that experimental stimuli are not sufficiently novel to evoke adjustments in eating behaviour within the exposure period, since many cues have been already associated with their post-ingestive effects (3).
In terms of prevention of overconsumption, it is of interest to get better insight in the fac-tors that could determine occurrence of learning and subsequent energy intake compensa-tion. An important question in the control of energy intake is whether or not this learned satiation depends on the food’s characteristics. One of the possible characteristics is the texture of foods. The way that texture might be involved in the learning process is through different oral sensory exposure with different textures. Consumption of a liquid food results in a short oral sensory exposure, due to its higher eating rate (13). This short exposure may be insuf-ficient to link to the physiological satiety signals when compared with the longer sensory exposure to a solid food. In our previous study on the process of learned satiation (14), we showed that a higher viscosity may facilitate energy intake compensation in novel flavoured yogurts. The difference in viscosity between liquid and semi-solid yogurts was small, result-ing in small differences in eating rate. A bigger difference in oral sensory exposure might enable better dietary learning and as a result, more pronounced energy intake compensa-tion (14).
In the current study, we further investigated the role of oral sensory exposure in learned satiation, using consumption time and eating rate as a proxy for sensory exposure. We per-formed a parallel intervention in 3 groups using similar yogurts as in our preceding study (14), but with assumed different oral sensory exposures: consumption of a liquid yogurt with a straw, consumption of a liquid yogurt with a spoon, or consumption of a semi-solid, pudding-like yogurt with a spoon. In all groups, subjects were repeatedly exposed to novel flavoured yogurts with low and high energy densities. We measured ad libitum intake of the yogurts during these exposures, and consumption times were recorded.

38 Chapter3
Methods
SubjectsHealthy young adults (mean ± SD: 22 ± 3 y) with a normal weight (body mass index (BMI): 21.6 ± 1.7 kg/m²) were recruited from Nijmegen and surrounding areas. Subjects had to like yogurt products and eat breakfast regularly (≥ 5 times/wk). Exclusion criteria were as follows: restraint eating (Dutch Eating Behaviour Questionnaire-restraint scale (15) score of ≥ 2.25 for men and ≥ 2.80 for women); lack of appetite, weight loss or weight gain of > 5 kg during the past 2 mo; hypersensitivity to dairy products; and gastrointestinal or endo-crine disorders. A total of 118 subjects were matched for sex, BMI and age, and randomly assigned to 1 of 3 intervention groups (see ‘Design’ below). During the measurements, 11 subjects withdrew due to personal reasons or lack of compliance, one was oversensitive to high-energy dairy products, and one developed glandular fever. Therefore, 105 subjects were included in the data analyses, the characteristics of whom are shown in table 3.1.
Table 3.1 Subjectcharacteristicsforthe3interventiongroupsa
Liquid/straw (n=34) Liquid/spoon (n=36) Semi-solid/spoon (n=35)
Male/female 16 / 18 13 / 23 17 / 18Age (y) 21.8 ± 2.6 21.1 ± 2.7 21.8 ± 2.5BMI (kg/m²) 21.3 ± 1.4 21.6 ± 1.7 21.7 ± 1.9Restraint score (15) 1.7 ± 0.6 1.3 ± 0.5 1.5 ± 0.5
a All values are means ± SDs. Subjects were matched for age, BMI and gender. There were no significant differences between the groups for any of these characteristics. Liquid/straw, liquid yogurt consumed with a straw; liquid/spoon, liquid yogurt consumed with a spoon; semi-solid/spoon, semi-solid yogurt consumed with a spoon.
All subjects gave their written informed consent before participation. The study protocol was approved by the Medical Ethics Committee of Wageningen University (NL23795.081.08).
DesignIn a parallel intervention, subjects were randomly assigned to 1 of 3 groups, differentiated by the means of consumption or viscosity of yogurt to provide different oral sensory expo-sures. One group received a liquid yogurt and consumed this yogurt from a bottle with a straw (length: 26 cm; diameter: 0.9 cm) to shorten consumption time (liquid/straw; n=34), another group consumed the same liquid yogurt from a bowl with a spoon to increase con-sumption time (liquid/spoon; n=36), and the last group received a semi-solid yogurt – like commercially available milk pudding - in a bowl and consumed this with a spoon (semi-solid/spoon, n=35).
The study consisted of 4 parts: a baseline measurement, a period with repeated exposures, an end measurement, and a reversal test (table 3.2). During the baseline and end measure-ments, subjects received a fixed preload of yogurt and the intake of a subsequent ad libitum test meal of currant buns was measured. During the reversal test, the procedure of the end measurement was repeated, but flavour-energy combinations of the yogurts were covertly switched. During repeated exposure, yogurts were offered ad libitum and then intake was measured. Subjects were not aware of the measurements of intake, nor were they aware that
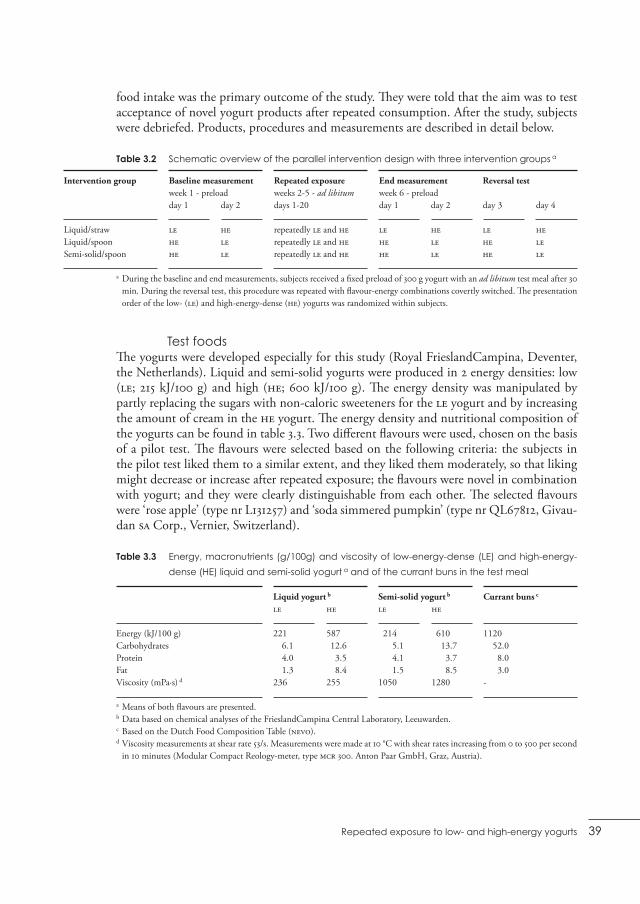
39Repeatedexposuretolow-andhigh-energyyogurts
food intake was the primary outcome of the study. They were told that the aim was to test acceptance of novel yogurt products after repeated consumption. After the study, subjects were debriefed. Products, procedures and measurements are described in detail below.
Table 3.2 Schematicoverviewoftheparallelinterventiondesignwiththreeinterventiongroupsa
Intervention group Baseline measurement Repeated exposure End measurement Reversal test week 1 - preload weeks 2-5 - ad libitum week 6 - preload day 1 day 2 days 1-20 day 1 day 2 day 3 day 4
Liquid/straw LE HE repeatedly LE and HE LE HE LE HELiquid/spoon HE LE repeatedly LE and HE HE LE HE LESemi-solid/spoon HE LE repeatedly LE and HE HE LE HE LE
TestfoodsThe yogurts were developed especially for this study (Royal FrieslandCampina, Deventer, the Netherlands). Liquid and semi-solid yogurts were produced in 2 energy densities: low (LE; 215 kJ/100 g) and high (HE; 600 kJ/100 g). The energy density was manipulated by partly replacing the sugars with non-caloric sweeteners for the LE yogurt and by increasing the amount of cream in the HE yogurt. The energy density and nutritional composition of the yogurts can be found in table 3.3. Two different flavours were used, chosen on the basis of a pilot test. The flavours were selected based on the following criteria: the subjects in the pilot test liked them to a similar extent, and they liked them moderately, so that liking might decrease or increase after repeated exposure; the flavours were novel in combination with yogurt; and they were clearly distinguishable from each other. The selected flavours were ‘rose apple’ (type nr L131257) and ‘soda simmered pumpkin’ (type nr QL67812, Givau-dan SA Corp., Vernier, Switzerland).
Table 3.3 Energy,macronutrients(g/100g)andviscosityof low-energy-dense(LE)andhigh-energy-
dense(HE)liquidandsemi-solidyogurtaandofthecurrantbunsinthetestmeal
a During the baseline and end measurements, subjects received a fixed preload of 300 g yogurt with an ad libitum test meal after 30 min. During the reversal test, this procedure was repeated with flavour-energy combinations covertly switched. The presentation order of the low- (LE) and high-energy-dense (HE) yogurts was randomized within subjects.
Liquid yogurt b Semi-solid yogurt b Currant buns c
LE HE LE HE
Energy (kJ/100 g) 221 587 214 610 1120Carbohydrates 6.1 12.6 5.1 13.7 52.0Protein 4.0 3.5 4.1 3.7 8.0Fat 1.3 8.4 1.5 8.5 3.0Viscosity (mPa·s) d 236 255 1050 1280 -
a Means of both flavours are presented.b Data based on chemical analyses of the FrieslandCampina Central Laboratory, Leeuwarden. c Based on the Dutch Food Composition Table (NEVO).d Viscosity measurements at shear rate 53/s. Measurements were made at 10 °C with shear rates increasing from 0 to 500 per second
in 10 minutes (Modular Compact Reology-meter, type MCR 300. Anton Paar GmbH, Graz, Austria).

40 Chapter3
a All values are means ± SDs. Data were combined for the 2 flavours. Liquid/straw, liquid yogurt consumed with a straw; liquid/spoon, liquid yogurt consumed with a spoon; semi-solid/spoon, semi-solid yogurt consumed with a spoon.
b P-values report a significant difference between LE and HE yogurts (ANOVA). There were no perceived differences for the sensory attributes between the intervention groups, except for thickness (p<0.001). Subjects in the main study (n=105) reported similar thickness scores as panel members (data not shown).
Throughout the study, all subjects were offered 2 yogurts with a different flavour-energy-combination: half of the subjects got soda simmered pumpkin coupled with the LE yogurt and rose apple flavour with HE yogurt, and half of the subjects got the reverse energy-flavour combination. This resulted in a total of 12 different variants of yogurt used in the study.
In a one-day sensory panel test separate from the main study, 30 untrained subjects (8 men and 22 women; aged 19 ± 2 y; BMI: 22.7 ± 3.4 kg/m²) evaluated sensory properties (pleas-antness, creaminess, sweetness, sourness, and thickness) of all 12 yogurts on a 100-unit VAS (16). Subjects on the panel reported higher pleasantness, creaminess, and sweetness scores and lower sourness scores for the HE than for the LE yogurts. Both panel members and sub-jects in the main study perceived semi-solid yogurts to be most thick, and liquid yogurts consumed with a straw to be thicker than liquid yogurts consumed with a spoon. For liq-uid/straw and liquid/spoon, HE yogurts were perceived to be thicker than LE liquid yogurts (table 3.4).
Table 3.4 Scoresforsensoryattributes(100-unitvisualanaloguescale)forlow-energy-dense(LE)and
high-energy-dense(HE)yogurtsasperceivedbyuntrainedsensorypanelmembers(n=30)a
Liquid/straw Liquid/spoon Semi-solid/spoon LE HE pb LE HE p b LE HE p b
Pleasant 35 ± 27 52 ± 25 <0.001 38 ± 27 51 ± 25 0.007 31 ± 26 43 ± 29 0.01Creamy 44 ± 22 67 ± 19 <0.001 34 ± 20 54 ± 23 <0.001 45 ± 25 62 ± 24 <0.001Sweet 48 ± 22 63 ± 17 <0.001 50 ± 22 63 ± 16 <0.001 40 ± 24 59 ± 22 <0.001Sour 46 ± 24 28 ± 22 <0.001 40 ± 22 29 ± 18 <0.001 58 ± 25 38 ± 23 <0.001Thick 28 ± 22 49 ± 26 <0.001 14 ± 14 23 ± 20 <0.001 63 ± 24 69 ± 21 0.08
ProceduresThe 3 interventions were conducted simultaneously. On all test days, subjects came to the research centre in fasted state and consumed yogurt for breakfast during 1 of 3 time shifts: 7.45 (n=42), 8.15 n=42), and 8.45 (n=21). The intervention groups and flavour-energy combinations were equally divided over the time shifts. All experimental measurements of one subject took place in the same time shift to standardize the fasted state. Fasted state was defined as no eating or drinking after 11.00 pm the evening before the test day, but non-caloric beverages were allowed until 1 h before the test session. Subjects were seated in sensory booths and were not allowed to have social interactions during the test ses-sion. Reading or other distracting activities were postponed until the yogurt breakfast was finished.During the 4-wk period of repeated exposure, the subjects consumed LE and HE yogurts alternately on weekdays only. The order of the LE and HE yogurts was randomized within subjects and within each week, with the condition that subjects were exposed a maximum

41Repeatedexposuretolow-andhigh-energyyogurts
of 2 d in a row to each yogurt. The subjects were exposed to each yogurt 5 times in the first 2 wk and 5 times in the second 2 wk. Thus, total exposure time was 10 times for each yogurt (table 3.2). The subjects were offered a bottle or bowl with 1 L yogurt and were instructed to drink or eat until pleasantly satisfied. If needed, a second bottle or bowl was given to the subject. This happened 10 times (3 times in the HE condition) in 4 different subjects. These subjects (n=4) also emptied their bottles 7, 4, 2 and 1 times, without asking for a new one. Another 15 subjects had 1 L of yogurt for breakfast 3-5 times (n=4) or once or twice (n=11) without asking for a new bottle or bowl. These subjects were from the liquid/straw (n=8), liquid/spoon (n=3) and semi-solid/spoon (n=8) groups. In all other cases subjects consumed < 1 L.At baseline and at the end of the study, we performed a fixed preload-test meal experiment, to investigate to what extent subjects would learn to compensate for the energy content of the yogurt in a second meal. Subjects consumed a fixed load of 300 g of LE yogurt (645 kJ) on one day and of HE yogurt (1800 kJ) on the following day, in randomized order (table 3.2). Thirty minutes after the start of this preload, subjects received an ad libitum test meal that consisted of 15 mini currant buns (average weight of bun: 24 ± 2 g). The nutrient com-position of the buns is shown in table 3.3. The small size of the buns should limit attention of familiar portion sizes and promote consumption until satiation. When > 10 buns were consumed, researchers provided a new plate of buns, to avoid ‘empty your plate’ behaviour. Subjects were instructed to eat from the test meal until they were pleasantly satisfied and were asked to remain seated for ≥ 20 minutes.As a final measurement, we performed a reversal test to test whether energy-flavour associa-tions were established during repeated exposure to the yogurts. The subjects were offered a fixed preload of yogurt (300 g) and a test meal according to the procedure as described above, but flavour-energy combinations of the yogurts were covertly switched. After debriefing, subjects were instructed to taste the 2 flavours again (both LE versions) and to indicate which of the flavours was combined with the HE yogurt during the period of repeated exposure.
MeasurementsThe main outcome of the study was ad libitum yogurt intake over the repeated exposures. To obtain yogurt intake, the bottles and bowls were weighed on a digital scale with a preci-sion of 0.1 g (model XP-3000, Denver Instruments, Göttingen, Germany) before and after consumption. Likewise, test meals were weighed before and after consumption to calculate test meal intake.Before (0 min) and 25 min after the start of yogurt consumption, the subjects scored their motivation to eat (hunger, fullness, desire to eat, and prospective consumption), thirst, and pleasantness and thickness of the yogurts by means of a 100-unit VAS (16). Additionally, subjects measured consumption time of the yogurt meal (from the start of consumption to the time of the last bite or sip) using a stopwatch.
DataanalysisContinuous variables are presented as means ± SDs, and categorical variables are presented as frequencies, unless otherwise indicated. Data of the flavour-energy subgroups were com-bined. Due to technical failures, we lost information on yogurt intake on day 11. Subjects did consume their yogurts, as on other days, but the values were missing. For the same rea-
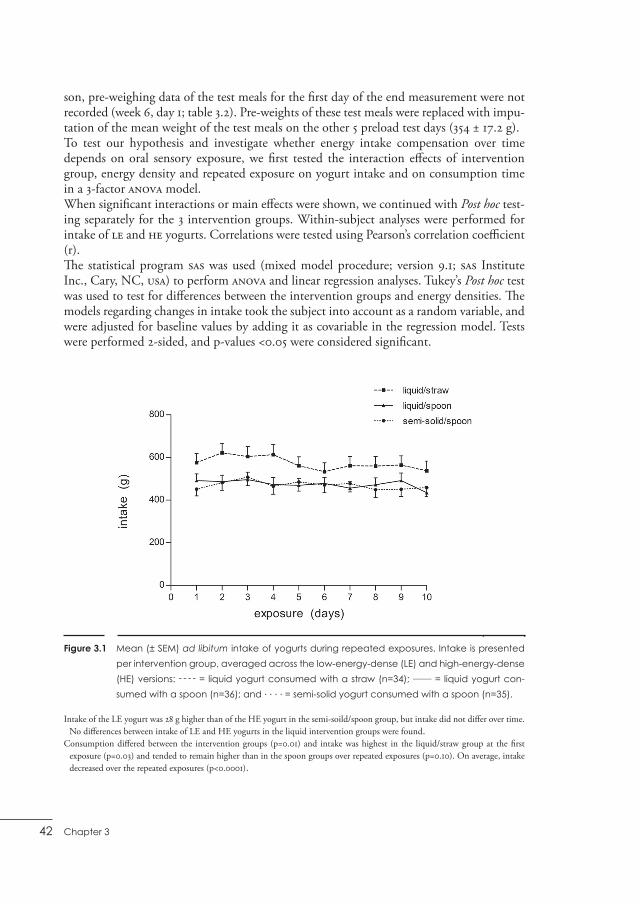
42 Chapter3
son, pre-weighing data of the test meals for the first day of the end measurement were not recorded (week 6, day 1; table 3.2). Pre-weights of these test meals were replaced with impu-tation of the mean weight of the test meals on the other 5 preload test days (354 ± 17.2 g).To test our hypothesis and investigate whether energy intake compensation over time depends on oral sensory exposure, we first tested the interaction effects of intervention group, energy density and repeated exposure on yogurt intake and on consumption time in a 3-factor ANOVA model. When significant interactions or main effects were shown, we continued with Post hoc test-ing separately for the 3 intervention groups. Within-subject analyses were performed for intake of LE and HE yogurts. Correlations were tested using Pearson’s correlation coefficient (r).The statistical program SAS was used (mixed model procedure; version 9.1; SAS Institute Inc., Cary, NC, USA) to perform ANOVA and linear regression analyses. Tukey’s Post hoc test was used to test for differences between the intervention groups and energy densities. The models regarding changes in intake took the subject into account as a random variable, and were adjusted for baseline values by adding it as covariable in the regression model. Tests were performed 2-sided, and p-values <0.05 were considered significant.
Figure 3.1 Mean(±SEM)ad libitumintakeofyogurtsduringrepeatedexposures.Intakeispresented
perinterventiongroup,averagedacrossthelow-energy-dense(LE)andhigh-energy-dense
(HE)versions:----= liquidyogurtconsumedwithastraw(n=34);____= liquidyogurtcon-
sumedwithaspoon(n=36);and....=semi-solidyogurtconsumedwithaspoon(n=35).
Intake of the LE yogurt was 28 g higher than of the HE yogurt in the semi-soild/spoon group, but intake did not differ over time. No differences between intake of LE and HE yogurts in the liquid intervention groups were found.
Consumption differed between the intervention groups (p=0.01) and intake was highest in the liquid/straw group at the first exposure (p=0.03) and tended to remain higher than in the spoon groups over repeated exposures (p=0.10). On average, intake decreased over the repeated exposures (p<0.0001).

43Repeatedexposuretolow-andhigh-energyyogurts
Results
Ad libitumyogurtintakeOver 10 exposures, we observed main effects of intervention group (p=0.01), repeated expo-sure (p<0.001) and energy density (p=0.02) on intake; no significant interaction between these factors was observed. Intake of the yogurts – regardless of energy density - differed between the 3 intervention groups at the first exposure (p=0.03) and over the repeated exposures (p=0.01) (figure 3.1). Post hoc tests showed that intake on the first exposure was highest in the straw group (576 ± 245 g) and lowest in the semi-solid spoon group (452 ± 189 g) (p=0.03). Yogurt intake – regardless of energy density - decreased over the repeated exposures in all groups (p<0.001), with the biggest reduction in the liquid/straw group (estimated effect exposure on intake = -90 g). The average intake in the liquid/straw groups (575 ± 260 g), however, tended to remain higher than intake in the spoon groups over the repeated exposures (p=0.10). The average intake over the exposures was not different between the liquid/spoon (475 ± 192 g) and semi-solid/spoon (470 ± 223 g). A main effect of energy density on intake was observed (p=0.02). Post hoc tests showed no differences between intake of LE and HE yogurt in the liquid/straw and liquid/spoon groups. Subjects in the semi-solid/spoon group ate on average a larger amount of the LE (486 ± 246 g) than of the HE (458 ± 204 g) yogurt (p=0.002). Energy intake from the HE yogurt (2791 ± 1245 kJ), however, was higher than from LE yogurt (1040 ± 527 kJ) (p<0.0001). Intake of both the LE and HE yogurts, however, did not differ over time in any of the intervention groups.Pleasantness was correlated with intake (r=0.36; p<0.001). When corrected for pleasant-ness ratings, intake of the LE yogurts was estimated to be 31 g higher than of the HE yogurts (p<0.01). After this correction for pleasantness, we again did not observe changes in intake of the LE and HE yogurts over time.
ConsumptiontimeConsumption time of the fixed loads of yogurt was shortest for yogurts consumed with a straw when compared with the spoon groups (p<0.001). We observed no differences between the spoon groups in consumption time of the preloads (liquid/spoon: 194 ± 92 s; semi-solid/spoon: 193 ± 81 s; liquid/straw: 140 ± 81 s). There were no differences in con-sumption time between LE and HE yogurts within any of the intervention groups.Average consumption time of the ad libitum yogurts over the 10 exposures (i.e. meal dura-tion) was not significantly different between the intervention groups (liquid/straw: 293 ± 134 s; liquid/spoon: 296 ± 103 s; and semi-solid/spoon: 319 ± 130 s; p=0.12); however, the eating rate (ie, intake in g/min) was higher in the liquid/straw group (132 ± 83 g/min) than in the spoon groups (liquid/spoon: 106 ± 53 g/min; semi-solid/spoon: 105 ± 88 g/min; p=0.01).
MotivationtoeatThere were no differences in the scores indicating motivation to eat before consumption (0 min) or after consumption (25 min) between LE and HE preloads, nor between the inter-vention groups (table 3.5). Results following the ad libitum breakfasts were similar to those after the fixed preloads (data not shown).

44 Chapter3
Table 3.5 Initial(0min)andchange(∆:25min-0min) inappetitescores(100-unitvisualanalogue
scale)afterthelow-(LE)andhigh-energy-dense(HE)preloadofyogurt(n=105)a
Initial LE Initial HE ∆LE b ∆HE b P2 (∆LE-HE) c
Hunger 67 ± 20 67 ± 20 -20 ± 23 -24 ± 23 0.11Fullness 21 ± 17 21 ± 17 26 ± 23 30 ± 25 0.22Desire to eat 71 ± 19 72 ± 19 -18 ± 23 -22 ± 23 0.20Prospective consumption 60 ± 19 60 ± 19 -16 ± 19 -19 ± 20 0.13Thirst 67 ± 24 65 ± 25 - 6 ± 16 - 4 ± 17 0.10
a All values are means ± SDs. Appetite scores at baseline did not differ significantly between LE and HE preload conditions, between intervention groups or on separate test days (data not shown).
b Changes in appetite scores from 0 to 25 min after consumption of 300 g of LE or HE yogurt.c P values indicate the effect of energy density on the delta scores (ANOVA).
TestmealintakeTest meal intake did not differ between the intervention groups. The average energy intake of currant buns was 1394 ± 832 kJ (124 ± 74 g) after the preload of LE yogurt and 1167 ± 749 kJ (104 ± 67 g) after the preload of HE yogurt (NS). Intake of the test meals was higher in the end measurement (mean intake regardless of energy: 1326 ± 828 kJ/118 ± 74 g) when compared with the baseline measurement (1167 ± 690 kJ/104 ± 62 g) for both LE and HE preloads (p=<0.001) (see figure 3.2).
Figure 3.2 Mean(±SEM)intakeofthead libitumtestmeal(blackbars)andfixedpreloadofyogurt
(whitebars) in the low-energy-dense (LE)andhigh-energy-denseconditionsatbaseline,
theendofmeasurementandafterthereversaltest.Intakewasnotdifferentbetweenthe
interventiongroups;therefore,dataforthegroupswerecombined(n=105).
45Repeatedexposuretolow-andhigh-energyyogurts
ReversaltestanddebriefingSubjects did not adjust their intake from the test meal when subjects switched from the LE yogurt containing the flavour associated with the LE yogurt to the LE yogurt containing the flavour that was previously associated with the HE yogurt, or when switched from the reverse energy-combination. Test meal intakes did not differ between the end measurement and the reversal test.After debriefing, 36 out of 101 subjects identified the correct flavour as high energy. Of these 36 subjects, 7 indicated that they were 'completely sure', 18 were 'rather sure', 9 were 'rather unsure' and 2 were 'completely unsure'.
Discussion
The objective of this study was to investigate the role of sensory exposure in the process of energy learning. We expected intake of the HE yogurts to decrease over the consecutive exposures due to learning of energy content, and intake of the LE yogurts to remain con-stant, or even to increase. We hypothesized that energy learning and the subsequent energy intake compensation would be most pronounced for the group consuming the semi-solid yogurts, due to the longest sensory exposure. The results, however, showed no evidence of learned associations. Intake of both LE and HE yogurts remained constant over the repeated exposures.We assumed that differences in the manner of consumption and viscosity would result in differences in oral sensory exposure, on the basis of eating rate as a proxy. Eating rates were comparable with earlier findings of eating rates of liquid foods (17,18). Consumption of yogurt with a straw increased the eating rate and thus shortened the oral sensory exposure to the yogurt. The difference in viscosity between the liquid and semi-solid yogurts con-sumed with a spoon did not have an effect on eating rate. In line with the similar eating rates, we observed similar intake of these two yogurts when offered ad libitum. This might be explained by the fact that the semi-solid yogurt did not require chewing, and no pro-longed oral processing for swallowing. Since information on micro eating behaviour (e.g. bite size and rate) was not feasible to measure in this design, we could not assess possible differences in orosensory exposure due to a higher viscosity. Our results, however, suggest that eating rate is a more important determinant of short-term intake than texture per se, when texture differences are relatively small. The differences in consumption times between straw and spoon groups also show the importance of eating rate in meal size. Test meal intake was higher at the end of the measurement and after the reversal test than during at baseline (p<0.001). Test meal intake after the reversal test was not different from that at the end of measurement. Differences in energy intake depend on the different energy content of the preloads.Consumption with a straw resulted in a 20% higher intake than in the spoon groups, while scores on hunger and fullness after the ad libitum breakfasts were not different between the intervention groups.
All yogurts were especially developed for this experiment, with the best possible match on all sensory attributes. Evaluation by the subjects, though, showed that the HE yogurt was found to be sweeter and more creamy in all groups, attributes that might be associated

46 Chapter3
with sources of calories (19). Subjects did not act according a possible awareness of energy manipulation, and we found no adjustments of intake of the high-energy-dense products. Moreover, only one third of the subjects noted the correct flavour as being of high energy density, which was less than chance would predict. We thus did not expect occurrence of energy learning and consequent intake adjustments when sensory attributes for LE and HE versions would have been more adequately matched. The HE yogurts were also evaluated to be more pleasant than the LE yogurts. Correction for these higher pleasantness ratings did not affect our conclusions on energy intake compensation.In our preceding study, on the contrary, we used similar yogurts (14) and subjects decreased intake of high-energy-dense yogurts high in viscosity over time. How can we explain the mixed outcomes of these learning studies?
Average intake of the yogurts was > 400 g, resulting in an energy difference of > 1600 kJ. Since this energy difference is already more than a typical breakfast of young adults in the Netherlands (20), we expected it to be sufficient to evoke clear differences in postingestive effects. Nevertheless, subjects in the current study did not adjust their intake in response to the energy surpluses during the 4-wk study period. Despite the fasted state, subjects did not seem to be sensitive to the differences in energy content. Studies reporting no intake adjust-ments after repeated exposure (9-11,21) might suggest that energy differences do not induce learning in human adults or that there is no need for energy compensation on a daily basis in the current environment. The human body is assumed to compensate intake in response to energy deficit (22), but might not be sufficiently evolved to adequately down-regulate intake in response to energy surpluses in a relatively short experimental period. People tend to eat a consistent weight of food, and when energy density of a meal increases, energy intake increases (23-26). Accurate compensation in response to changes in energy density beyond the meal provided seems unlikely (27,28).
Positive findings of energy compensation based on learned satiety or learned satiation on the other hand, suggest that explanations for mixed outcomes must also be found else-where. The conflicting results show the difficulty to confirm processes of dietary learning. Several suggestions on methodology have been made to determine occurrence of learning effectively (3,29). These suggestions address among others individual differences between subjects, because these differences may be one of the most important explanations of the mixed outcomes. We matched subjects for sex, BMI, level of dietary restraint and age, and standardized hungry state to diminish between-subject variation in our study.
Another reason for absence of learned satiation might be that intake adjustments are not made when consuming the specific food in a subsequent exposure, but when consum-ing other foods in a next meal. In our current and previous study, we do not have all the information to assess possible energy compensation beyond the meals provided. Although we already suggested that accurate compensation is unlikely, it is recommended to record subjects’ motivation to eat during the next meal. It will be even more interesting to keep subjects under observation till the next eating occasion and measure motivation to eat and intake throughout the day. Moreover, it is recommended to fix the time delay between the test food and the lunch meal. This might create a more pronounced association between satiety and satiation and result in an intake effect according to energy density. A choice

47Repeatedexposuretolow-andhigh-energyyogurts
of test foods should be made conscious with respect to the energy challenge, appropriate-ness of the ingested volume and novelty. This might explain the lack of positive findings in conditioning studies using test foods with familiar flavours (9,11), or with a relatively short exposure period only (21). We therefore selected our flavours based on unfamiliarity and novelty in combination with yogurt (14). Yogurt as such, however, is not novel and is com-mercially available in many flavours.An explanation for the inconsistent findings in our learning studies might be that cogni-tive factors (e.g. perception of a liquid as either a food or a beverage) play an important role in control of food intake. In the current study, visual cues in the spoon groups might have resulted in adjustment to the 'average portion size of a breakfast', in contrast to our previous study where subjects drank from a non-transparent bottle (14). The absence of dif-ference in the sensations of hunger and fullness support the selection of a habitual portion when making decisions on meal size. Several studies already showed that differences in food form and manner of eating (30-32), eating culture (33,34), familiarity (35) or visual cues (36) may be more important than physiological cues with respect to short-term intake.
We conclude that in the current study, young adults did not adjust intake for energy con-tent of yogurt products within a meal, after repeated exposure to the foods. Energy intake at a meal depended on the energy density of the available foods. The results of this study suggest that eating rate is an important determinant of meal size and that cognitive factors may not be neglected. It remains of great interest to get insight in the factors that play a role in energy learning and, accordingly, contribute to a decreased energy intake. Future investi-gations in the mechanism of learned satiation should therefore consider include consump-tion of fixed amount of test food during learning to avoid habitual and cognitive responses; measurements of expectations of the food’s satiating capacity and measurements of com-pensation beyond the meal provided.
AcknowledgementsWe thank all participants and research assistants (Natasja Hück, Juliëtte Nederpelt, Lieke van Rongen, Lara Kwant and Maarten de Jonge); Royal FrieslandCampina, Deventer, the Netherlands; Els Siebelink for dietary advice and Harry Baptist for the rheological measurements.

48 Chapter3
References
1 Booth DA, Lee M, McAleavey C. Acquired sensory control of satiation in man. Brit J Psychol 1976; 67(2): 137-147.2 Davis JD, Smith GP. The conditioned satiating effect of orosensory stimuli. Physiol Behav 2009; 97(3-4): 293-303.3 Brunstrom JM. Associative learning and the control of human dietary behavior. Appetite 2007; 49(1): 268-271.4 Birch LL, Deysher M. Conditioned and unconditioned caloric compensation: Evidence for self-regulation of food intake
in young children. Learn Motiv 1985; 16(3): 341-355.5 Birch LL, McPhee L, Steinberg L, Sullivan S. Conditioned flavor preferences in young children. Physiol Behav 1990;
47(3): 501-505.6 Yeomans MR, Weinberg L, James S. Effects of palatability and learned satiety on energy density influences on breakfast
intake in humans. Physiol Behav 2005; 86(4): 487-99.7 Booth DA, Mather P, Fuller J. Starch content of ordinary foods associatively conditions human appetite and satiation,
indexed by intake and eating pleasantness of starch-paired flavours. Appetite 1982; 3(2): 163-184.8 Louis-Sylvestre J, Tournier A, Verger P, Chabert M, Delorme B, Hossenlopp J. Learned caloric adjustment of human
intake. Appetite 1989; 12(2): 95-103.9 Specter SE, Bellisle F, Hémery-Véron S, Fiquet P, Bornet FRJ, Slama G. Reducing ice cream energy density does not
condition decreased acceptance or engender compensation following repeated exposure. Eur J Clin Nutr 1998; 52(10): 703-10.
10 Zandstra EH, Stubenitsky K, De Graaf C, Mela DJ. Effects of learned flavour cues on short-term regulation of food intake in a realistic setting. Physiol Behav 2002; 75(1-2): 83-90.
11 Van Wymelbeke V, Beridot-Therond ME, de La Gueronniere V, Fantino M. Influence of repeated consumption of beverages containing sucrose or intense sweeteners on food intake. Eur J Clin Nutr 2004; 58(1): 154-161.
12 Brunstrom JM, Mitchell GL. Flavor-nutrient learning in restrained and unrestrained eaters. Physiol Behav 2007; 90(1): 133-141.
13 Zijlstra N, Mars M, de Wijk RA, Westerterp-Plantenga MS, de Graaf C. The effect of viscosity on ad libitum food intake. Int J Obes 2008; 32(4): 676-83.
14 Mars M, Hogenkamp PS, Gosses AM, Stafleu A, De Graaf C. Effect of viscosity on learned satiation. Physiol Behav 2009; 98(1-2): 60-66.
15 Van Strien T. Nederlandse Vragenlijst voor Eetgedrag (NVE). Handleiding [Dutch Eating Behaviour Questionnaire. Manual], Boom Test Publishers: Amsterdam, the Netherlands, 2005.
16 Hill AJ, Rogers PJ, Blundell JE. Techniques for the experimental measurement of human eating behaviour and food intake: a practical guide. Int J Obes Relat Metab Disord 1995; 19(6): 361-75.
17 Viskaal-van Dongen M, Kok FJ, de Graaf C. Eating rate of commonly consumed foods promotes food and energy intake. Appetite 2011; 56(1): 25-31.
18 Kissileff HR, Klingsberg G, Van Itallie TB. Universal eating monitor for continuous recording of solid or liquid con-sumption in man. Am J Physiol 1980; 238(1): R14-22.
19 Rozin P, Vollmecke TA. Food Likes and Dislikes. Annual Review of Nutrition 1986; 6(1): 433-456.20 Voedingscentrum. Zo eet Nederland 1998. {Dutch Food Consumption Survey 1998}. : Den Haag, 1998.21 Brunstrom JM, Mitchell GL. Flavor-nutrient learning in restrained and unrestrained eaters. Physiology & Behavior
2007; 90(1): 133-141.22 Goldberg GR, Murgatroyd PR, McKenna APM, Heavey PM, Prentice AM. Dietary compensation in response to cov-
ert imposition of negative energy balance by removal of fat or carbohydrate. British Journal of Nutrition 1998; 80(02): 141-147.
23 Bell EA, Castellanos VH, Pelkman CL, Thorwart ML, Rolls BJ. Energy density of foods affects energy intake in normal-weight women. Am J Clin Nutr 1998; 67(3): 412-420.
24 Rolls BJ. The relationship between dietary energy density and energy intake. Physiol Behav 2009; 97(5): 609-615.25 Duncan KH, Bacon JA, Weinsier RL. The effects of high and low energy density diets on satiety, energy intake, and eat-
ing time of obese and nonobese subjects. Am J Clin Nutr 1983; 37(5): 763-767.26 Levitsky DA. The non-regulation of food intake in humans: hope for reversing the epidemic of obesity. Physiol Behav
2005; 86(5): 623-32.27 Levitsky DA, Obarzanek E, Mrdjenovic G, Strupp BJ. Imprecise control of energy intake: absence of a reduction in food
intake following overfeeding in young adults. Physiol Behav 2005; 84(5): 669-75.28 Caputo FA, Mattes RD. Human dietary responses to covert manipulations of energy, fat, and carbohydrate in a midday
meal. Am J Clin Nutr 1992; 56(1): 36-43.29 Yeomans M. Understanding individual differences in acquired flavour liking in humans. Chemosens Percept 2010;
3(1): 34-41.

49Repeatedexposuretolow-andhigh-energyyogurts
30 Mourao DM, Bressan J, Campbell WW, Mattes RD. Effects of food form on appetite and energy intake in lean and obese young adults. Int J Obes 2007; 31(11): 1688-1695.
31 Haber GB, Heaton KW, Murphy D, Burroughs LF. Depletion and disruption of dietary fibre. Effects on satiety, plasma-glucose, and serum-insulin. Lancet 1977; 2(8040): 679-82.
32 Mattes R. Soup and satiety. Physiology & Behavior 2005; 83(5): 739-747.33 Capaldi ED, Owens JQ, Privitera GJ. Isocaloric meal and snack foods differentially affect eating behavior. Appetite
2006; 46(2): 117-123.34 Pliner P, Zec D. Meal schemas during a preload decrease subsequent eating. Appetite 2007; 48(3): 278-288.35 Brunstrom JM, Shakeshaft NG, Scott-Samuel NE. Measuring `expected satiety’ in a range of common foods using a
method of constant stimuli. Appetite 2008; 51(3): 604-614.36 Viskaal-van Dongen M, de Graaf C, Siebelink E, Kok FJ. Hidden fat facilitates passive overconsumption. J Nutr 2009;
139(2): 394-9.


Chapter 4Expected satiation after repeated consumption
of low- or high-energy-dense soup
Pleunie Hogenkamp
Jeff Brunstrom
Annette Stafleu
Monica Mars
Kees de Graaf
British Journal of Nutrition, accepted for publication

52 Chapter4
Abstract
We investigated whether repeated consumption of low-energy-dense (LE; 208 kJ/100g) or high-energy-dense (HE; 645 kJ/100g) soup modifies expectations relating to the satiating capacity of the food, and its subsequent intake. In study 1, participants consumed either a novel-flavoured LE (n=32; 21 ± 1.6 y, BMI: 21.4 ± 1.6 kg/m²) or a HE soup (n=32; 21 ± 1.6 y, BMI: 21.3 ± 1.7 kg/m²). Soup was served in a fixed amount on days 1-4 and ad libitum on day 5. ‘Expected satiation’ was measured on day 1, 2, and 5. Expected satiation did not change after repeated consumption for LE or HE soup. Ad libitum intake did not differ between LE (461 ± 213 g) and HE soup (391 ± 164 g). Only on day 1, expected satiation was higher for HE than for LE soup (p=0.03), suggesting a role for sensory attributes in expected satiation.In study 2, 30 participants (21 ± 1.6 y, BMI: 21.3 ± 1.7 kg/m²) performed a single measure-ment of expected satiation of the LE and HE soup, and four commercially available types of soup. Ratings on sensory attributes were associated with expected satiation. Results on expected satiation coincided with those of study 1. Thickness and intensity of taste were independently associated with expected satiation. Expectations may initially rely on sen-sory attributes and previous experiences, and are not easily changed.

53Expectedsatiationofdifferenttypesofsoup
Introduction
The amount that people eat of a particular food is based on previous exposure to the food item (1). Two important factors that play a role in the amount eaten are the perception of sensory attributes of the food and the physiological effects after ingestion (1,2). Initially, people are not aware of the post-ingestive effects of a novel food and may decide on a specific volume independent of the food’s energy content (3). People will learn about the energy content by repeated exposure, and associate this with the sensory characteristics of the food. These learned associations help to estimate the satiating capacity of many foods, and to regulate food intake by adjusting portion size or energy intake in a subsequent eat-ing occasion (1,4-6).Studies on energy intake compensation in adults, however, have shown inconsistent results. Some studies report intake compensation in response to different energy levels provided by test foods (1,4-6), while others do not (7-10). These inconsistent results have been explained by several factors (6,11). A potential expla-nation for the lack of compensation is that a specific amount eaten may reflect life-long habitual intake (12), making new learning relatively difficult. Also, human tend to clean their plate (13), reducing the occurrence of within-meal intake compensation.A lack of response may also indicate that better control over the underlying factors (e.g. an adequate number of exposures or differences in energy loads to ensure effects) is needed to increase understanding of the mechanism of energy intake adjustments, and give further insight in the determinants of meal size.
The satiating efficiency per calorie is one of the determinants that may affect actual intake (14), and indeed, expectations about the satiation effects of a food differ markedly across a broad range of food items (15). Changes in expected satiation are thought to be required for an adjustment in meal size. Expectations can be modified by learning about the food’s satiating capacity by repeated consumption. Results of a previous study showed that par-ticipants changed expected satiation after one exposure to a novel test food of which energy density was covertly manipulated (either low or high), but this was not reflected in sub-sequent intake (16). Changes in expected satiation were only small, and the single expo-sure may not have been sufficient to allow for profound learning. Repeated exposure, on the other hand, might increase the demonstrated changes in expected satiation, and con-sequently results in behavioral changes in intake (16). In addition, familiarity tends to increase with repeated exposure, and it is suggested that familiarity with a food influences its expected satiation (17).
To test the hypothesis that expected satiation will change consistently after repeated con-sumption, we conducted a conditioning experiment (study 1) in which participants repeat-edly consumed a fixed portion of either a low-energy-dense (LE) or a high-energy-dense (HE) soup. We anticipated that learning would be demonstrated by a condition-dependent shift in expected satiation on day 5 relative to baseline. To explore the extent to which expected satiation was associated with actual intake we offered the soup ad libitum on day 5.We observed a difference in expected satiation between the energy conditions at baseline in study 1 that suggested a role for sensory attributes in expected satiation. In a second study (study 2), we investigated whether participants were able to discriminate between

54 Chapter4
the expected satiation of different types of soup. We measured expected satiation of the LE and HE soup from study 1 and of four commercially available types of soup. Subsequently, expected satiation was linked to the product’s sensory characteristics.
Study 1 Expectedsatiationofalow-orhigh-energy-densesoupoverrepeatedconsumption
Methods
ParticipantsHealthy, normal-weight young adults (range 18-35 years) were recruited from Wageningen and the surrounding areas. Exclusion criteria were restrained eating (restraint scores based on the Dutch Eating Behaviour Questionnaire (18): males ≥ 2.25, females ≥ 2.80), being a vegetarian, a change in body weight of > 5 kg during the last two months, an energy-restricted diet during the last two months, having difficulties with swallowing/eating, lack of appetite, and suffering from gastrointestinal or endocrine disorders. Participants were pair-matched for BMI, restraint score, and age, and randomly assigned to one of two conditions, consuming either a LE or a HE soup. In total, sixty-four participants completed the conditioning experiment (see table 4.1 for characteristics).Participants were unaware of the exact aim of the study, and were told that we investigated the effect of frequent consumption of ‘soup as a main course’ on their daily dietary pattern. The present study was conducted according to the guidelines laid down in the Declaration of Hel-conducted according to the guidelines laid down in the Declaration of Hel-sinki and all procedures involving human subjects were approved by the Medical Ethical Com-Medical Ethical Com-mittee of the Wageningen University (NL28577.081.09). This trial has been registered with the Dutch Trial Register (NTR 1988). Written informed consent was obtained from all subjects.
Table 4.1 Characteristicsofparticipants(mean±SD)instudy1,inbothlow-energy-dense(LE)orhigh-
energy-dense(HE)soupconditionsa,andinstudy2b
Study 1 Study 2 LE (n=32) HE (n=32) (n=30)
Male/female 12 / 20 11 / 21 10 / 20BMI (kg/m²) 21.4 ± 1.6 21.3 ± 1.7 22.7 ± 2.1Restraint score (DEBQ c) 1.9 ± 0.6 2.0 ± 0.5 2.6 ± 0.8Age (y) 21 ± 1.6 21 ± 1.6 27 ± 5.8
a Participants were matched for BMI, restraint score, and age. b Different participants were tested in study 1 and study 2.c DEBQ = Dutch Eating Behaviour Questionnaire (18). Restraint scale: 1= not at all; 5= very high.
DesignIn a between-subject design, participants were offered either a LE or a HE soup for lunch on 5 consecutive days (Monday to Friday). On days 1-4, the soup was served in a fixed vol-ume; on day 5 the soup was served ad libitum and intake was assessed. Expected satiation was measured on day 1, 2 and 5, to get further insight in the effect of repeated consumption
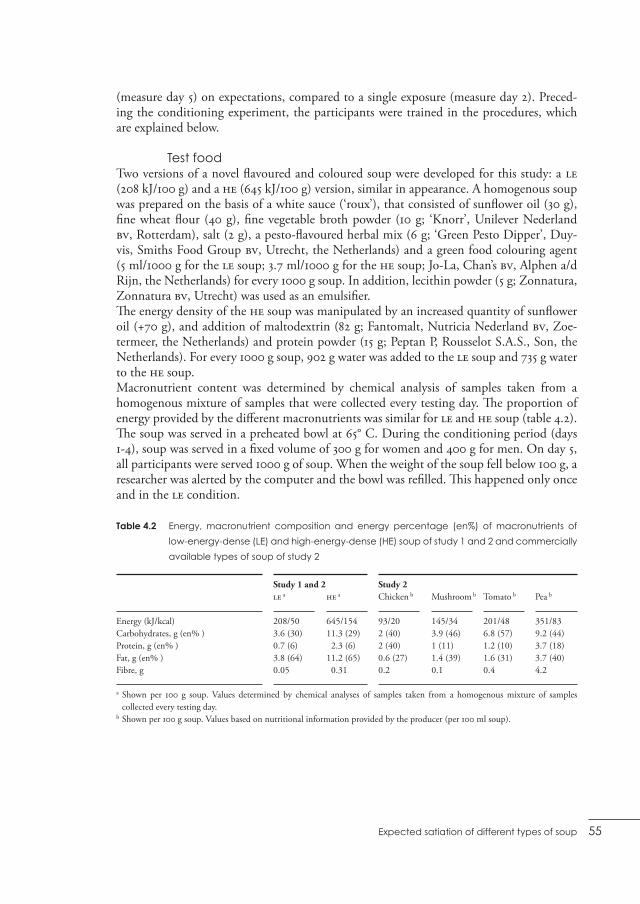
55Expectedsatiationofdifferenttypesofsoup
(measure day 5) on expectations, compared to a single exposure (measure day 2). Preced-ing the conditioning experiment, the participants were trained in the procedures, which are explained below.
TestfoodTwo versions of a novel flavoured and coloured soup were developed for this study: a LE (208 kJ/100 g) and a HE (645 kJ/100 g) version, similar in appearance. A homogenous soup was prepared on the basis of a white sauce (‘roux’), that consisted of sunflower oil (30 g), fine wheat flour (40 g), fine vegetable broth powder (10 g; ‘Knorr’, Unilever Nederland BV, Rotterdam), salt (2 g), a pesto-flavoured herbal mix (6 g; ‘Green Pesto Dipper’, Duy-vis, Smiths Food Group BV, Utrecht, the Netherlands) and a green food colouring agent (5 ml/1000 g for the LE soup; 3.7 ml/1000 g for the HE soup; Jo-La, Chan’s BV, Alphen a/d Rijn, the Netherlands) for every 1000 g soup. In addition, lecithin powder (5 g; Zonnatura, Zonnatura BV, Utrecht) was used as an emulsifier.The energy density of the HE soup was manipulated by an increased quantity of sunflower oil (+70 g), and addition of maltodextrin (82 g; Fantomalt, Nutricia Nederland BV, Zoe-termeer, the Netherlands) and protein powder (15 g; Peptan P, Rousselot S.A.S., Son, the Netherlands). For every 1000 g soup, 902 g water was added to the LE soup and 735 g water to the HE soup.Macronutrient content was determined by chemical analysis of samples taken from a homogenous mixture of samples that were collected every testing day. The proportion of energy provided by the different macronutrients was similar for LE and HE soup (table 4.2). The soup was served in a preheated bowl at 65° C. During the conditioning period (days 1-4), soup was served in a fixed volume of 300 g for women and 400 g for men. On day 5, all participants were served 1000 g of soup. When the weight of the soup fell below 100 g, a researcher was alerted by the computer and the bowl was refilled. This happened only once and in the LE condition.
Table 4.2 Energy,macronutrient composition and energy percentage (en%) ofmacronutrients of
low-energy-dense(LE)andhigh-energy-dense(HE)soupofstudy1and2andcommercially
availabletypesofsoupofstudy2
Study 1 and 2 Study 2 LE a HE a Chicken b Mushroom b Tomato b Pea b
Energy (kJ/kcal) 208/50 645/154 93/20 145/34 201/48 351/83Carbohydrates, g (en% ) 3.6 (30) 11.3 (29) 2 (40) 3.9 (46) 6.8 (57) 9.2 (44)Protein, g (en% ) 0.7 (6) 2.3 (6) 2 (40) 1 (11) 1.2 (10) 3.7 (18)Fat, g (en% ) 3.8 (64) 11.2 (65) 0.6 (27) 1.4 (39) 1.6 (31) 3.7 (40)Fibre, g 0.05 0.31 0.2 0.1 0.4 4.2
a Shown per 100 g soup. Values determined by chemical analyses of samples taken from a homogenous mixture of samples collected every testing day.
b Shown per 100 g soup. Values based on nutritional information provided by the producer (per 100 ml soup).

56 Chapter4
MeasurementexpectedsatiationIn both studies, expected satiation was measured using a ‘method of adjustment’ (based on Brunstrom et al. (15). This method has been shown to be an effective and sensitive meas-ure of expectations (15,16). During the measurements, the soup was physically present and assessed against 7 commonly consumed ‘comparison foods’. Pictures of each comparison food were shown on a computer screen. The order of appearance of these foods was ran-domized across participants, and the trial started with a different and randomly selected amount for each comparison food. After a single spoonful of soup, participants were asked to ‘indicate the amount of food on the picture that would be equally as satiating as the bowl of soup in front of you immediately after consumption’. The amount could easily be adjusted using the arrow keys on the keyboard. The pictures were loaded with sufficient speed in a way that continuous use of the arrow keys gave the impression that the change in amount of food was ‘animated’. The amount that could be displayed ranged from 347 to 3138 kJ (83 to 750 kcal). A total of 51 pictures was used to display these amounts. Picture number 25 displayed a 1046 kJ (250 kcal) portion. Picture number 0 displayed 0.3 times and picture number 50 displayed 3 times this amount; i.e. the amount increased 1.05 times with each picture in the series. All comparison foods used were meal items, i.e. foods commonly consumed to satiation, which were familiar to our participants (indicated on a question-naire at intake). We assumed this would enable the participants to indicate the expected satiation precisely based on previous exposure to the comparison foods. The comparison foods included small potatoes (boiled) (314 kJ/100 g), rice curry (‘chicken tikka masala’) (460 kJ/100 g), penne and tomato sauce (502 kJ/100 g), spaghetti Bolognese (590 kJ/100 g), oven fries (1100 kJ/100 g), cheese and tomato pizza (1293 kJ/100 g), and baguettes with garlic and herb butter (1423 kJ/100 g).
ProceduresParticipants were asked to refrain from eating from 23.00 the day before each test day and to consume a self-selected, identical breakfast on each test day. Participants consumed their standardized breakfast at least 3 h before the start of the lunch. Consumption of non-energy beverages was permitted up to 1 h before the test session. After each test session the partici-pants were instructed not to eat anything for at least 2 h. Food diaries were used to increase compliance to the eating and drinking restrictions; and reported consumption confirmed adherence to the procedures. Participants were tested in isolated sensory cabins at the same time each test day, either 11.30 (n=20), 12.30 (n=29) or 13.30 (n=15). Soup was prepared freshly for every lunch ses-sion. On arrival, participants rated their appetite sensations (hunger, fullness, desire to eat, and prospective consumption). Ratings were performed on a 100-unit visual analogue scale (VAS), anchored ‘not at all’ to ‘extremely’ for hunger, fullness and desire to eat, and ‘noth-ing at all’ to ‘very much’ for prospective consumption. Participants then received a bowl of soup, consumed a single spoonful, and rated the pleasantness, familiarity and sensory attributes of the soup, all on a 100-unit VAS. Sensory attributes included sweetness, salti-ness, creaminess, thickness, intensity of taste, intensity of herbs, and intensity of after-taste. On days 1, 2, and 5, expected satiation was measured immediately after these ratings. On day 1 and 2, participants were then instructed to consume the fixed load of soup. On day 5, soup was offered ad libitum and participants were instructed ‘to eat as much as you like until you feel comfortably satiated’. The bowls were weighed before and after consump-

57Expectedsatiationofdifferenttypesofsoup
tion to obtain soup intake. On day 3 and 4, participants consumed the fixed load of soup immediately after rating the sensory attributes of the soup. After soup consumption, par-ticipants again rated its pleasantness, familiarity and sensory attributes, and their appetite sensations on a 100-unit VAS.
DataanalysisContinuous variables are presented as means and standard deviations (SD), and categori-cal variables are presented as frequencies. For each participant, the selected amounts of all 7 comparison foods (in kJ) were averaged. This average represents the expected satiation of the soup, i.e. the amount (in kJ) that is expected to be equally as filling as the bowl of soup. Expected satiation scores were log-transformed before being entered into our analy-sis. For reasons of clarity we converted the data into corresponding kJs when mean values are presented. Effects of repeated consumption, energy condition and their interaction effect on expected satiation, appetite sensations and sensory attributes were tested using ANOVA (mixed-model procedure), and Tukey’s Post hoc tests were used to test for differences between the energy conditions and test days. Delta scores refer to the decrease in ratings on hunger, desire to eat and prospective consumption, and the increase in fullness ratings after consumption of the soup. We used an independent samples t-test to compare differences in ad libitum intake (both volume and energy) of the LE and HE soup.Data were analyzed using SAS (version 9.1; SAS Institute Inc., USA). Results at a p-value of <0.05 were considered significantly different.
Results
ExpectedsatiationExpected satiation did not change over repeated consumption (F(1,126)=0.01; p=0.89); not for the LE soup (F(1,63)=0.96; p=0.33) nor for the HE soup (F(1,63)=2.11; p=0.15). We observed a main effect of energy condition on expected satiation (F(1,62)=5.07; p=0.03). Post hoc tests revealed that the expected satiation of the HE soup was higher than the LE soup on day 1 (t=-2.16; p=0.03); and did not differ between the LE and HE soup on the sub-sequent test days (figure 4.1). The interaction between energy condition and repeated con-sumption was not statistically significant (F(1,62)=2.80; p=0.10).
Ad libitumintakeThe volume of soup consumed when offered ad libitum was not significantly different between the LE (461 ± 213 g) and the HE soup (391 ± 164 g) (p=0.14). Energy intake, how-ever, was higher in the HE (2452 ± 1029 kJ) than in the LE condition (925 ± 427 kJ) (t=-9.23; p<0.0001).

58 Chapter4
AppetitesensationsNo differences in any of the sensations of appetite before or after consumption, nor in the delta scores were found between the LE and HE soup (all p>0.05). Delta scores were signifi-cantly greater after ad libitum intake compared to consumption of the fixed loads of soup (all p<0.01), except for fullness on day 1 compared to fullness after ad libitum intake (data not shown).
Figure4.1 Expected satiation (kJ)of the low-energy-dense (LE;bolddotted line)andhigh-energy-
dense(HE;boldsolidline)soupoverrepeatedconsumptioninstudy1(mean±SD).1
Theactualenergyload(kJ)asservedintheLE(thindottedline)andHE(thinsolidline)con-
ditionisindicatedasweightedaverageofgender(womenwereserved300g,men400g).
*ExpectedsatiationoftheHEsoupwashigherthantheLEsouponday1(p=0.03).
SensoryattributesNone of the ratings on the sensory attributes did change over repeated consumption, but we observed a main effect of energy condition on pleasantness (F(1,254)=6.59; p=0.01), creaminess (F(1,254)=16.96; p<0.0001), thickness (F(1,254)=9.22; p=0.003). Ratings on these attributes after one spoonful differed between energy conditions (all p<0.01), with the HE soup evaluated to be more pleasant, thicker, and creamier than the LE soup on day 1 (table 4.3). Differences in creaminess and thickness soup persisted over all test days (p<0.001). Pleasantness ratings after one spoonful were not different between the LE and HE soup on day 2 to 5, or after consumption of a complete bowl of soup on any of the test days. Familiarity ratings increased over repeated consumption (51 ± 20 units VAS on day 1 to 69 ± 25 units VAS on day 5; F(1,248)=56.08; p<0.0001), but were not different between the LE and HE soup (F(1,248)=0.16; p=0.69).

59Expectedsatiationofdifferenttypesofsoup
Table 4.3 Ratingsaonpleasantness,familiarityandsensoryattributes(mean±SD)ofthelow-energy-
dense(LE)andhigh-energy-dense(HE)soupinstudy1andof6typesofsoupinstudy2,and
correlationcoefficients (r)with95%confidence intervals (CI)ofattributeswithexpected
satiationinstudy2
Interim discussion
The objective of this study was to investigate whether expected satiation changes in response to repeated consumption of a LE or HE soup, indicating that learning modifies expectations. Our results show that expected satiation remained unchanged over the 5-d period.At baseline, expected satiation of the HE soup was higher than of the LE soup. This dif-ference was relatively small compared to the actual difference in energy content, and we observed no differences in expected satiation after repeated consumption. To explore the direct effect of expected satiation on food intake, we offered the soup ad libitum on day 5. The ad libitum intake was equal in the LE and HE condition, corresponding with the lack of differences in expected satiation. Although we did not measure ad libitum intake at baseline, the similar volume intake after repeated consumption implies that participants did not have reason to adjust their meal size in response to the considerable differences in energy density of the soup in the two conditions. Participants may have consumed a ‘regular amount’ of soup, with the volume consumed as primary determinant of intake regulation (3,19). As a consequence, the energy intake in the HE condition (2452 kJ) was more than two-fold the energy intake in the LE condition (925 kJ). Since we were especially interested in the effects of learning on meal size, we did not collect information on feelings of satiety or food intake during the remainder of the day. Adequate intake compensation in response to the differences in energy density beyond the meal provided, however, seems unlikely (14,20,21).
Study 1 Study 2 LE HE LE HE Chicken Mushroom Tomato Pea Pearson’s r (n=32) (n=32) (n=30) (n=30) (n=30) (n=30) (n=30) (n=30) (95% CI)
Pleasant 63 ± 16 b 74 ± 14 b 45 ± 23 54 ± 26 70 ± 20 60 ± 22 56 ± 24 74 ± 25 NSFamiliar 49 ± 19 53 ± 22 39 ± 30 43 ± 30 87 ± 15 83 ± 17 72 ± 27 90 ± 17 NSSweet 28 ± 21 32 ± 20 33 ± 22 34 ± 25 20 ± 18 25 ± 19 52 ± 24 22 ± 20 NSSalt 63 ± 20 55 ± 17 63 ± 22 48 ± 23 64 ± 23 55 ± 23 50 ± 20 51 ± 20 NSCreamy 56 ± 19 b 73 ± 15 b 62 ± 23b 78 ± 16b 8 ± 14 71 ± 23 35 ± 24 42 ± 26 0.28 c
(0.14-0.41)Thick 44 ± 20 b 60 ± 13 b 48 ± 25b 71± 21b 7 ± 11 61 ± 22 50 ± 19 88 ± 12 0.55 c
(0.44-0.65)Intensity of 58 ± 17 60 ± 17 51±25 53 ± 21 59 ± 26 56 ± 26 64 ± 29 71 ± 13 0.32 c taste (0.18-0.45)Intensity of 63 ± 15 61 ± 16 56 ± 25 47 ± 26 48 ± 27 45 ± 25 67 ± 18 62 ± 17 0.18 c
herbs (0.03-0.32)Intensity of 58 ± 19 48 ± 21 48 ± 25 44 ± 23 48 ± 25 43 ±23 53 ± 25 63 ± 22 0.25 c
after-taste (0.10 -0.38)
a Ratings were performed on a 100-unit VAS scale after one spoonful. For study 1, ratings of day 1 were reported. b Ratings LE and HE soup significantly different (all p<0.05). Pleasantness ratings in study 1 were not different between the LE and
HE soup on day 2 to day 5. c Sensory attributes were positively correlated with expected satiation in study 2 (p<0.001).

60 Chapter4
Participants consumed the soup in a fasted state and abstained from eating 2 h after the test session, to ensure awareness of the satiating effects. Expected satiation, however, did not change after repeated consumption of the LE or HE soup. Several reasons can be considered for the apparent absence of learning about the satiating capacity of this test soup.
When the soup was offered ad libitum at day 5, the volume consumed was higher than the fixed load of soup provided on days 1-4, resulting in greater changes in sensations of appe-tite. This implies that participants may not have been comfortably satiated during the con-ditioning period. It has been suggested that learning is most effective when a food is eaten to fullness, and causes a persistent change in expectations of the specific food (22). The fixed amount we served was based on the average intake at lunch of Dutch young adults (male/female: 2540 kJ/1766 kJ) (23), and on previous results on ad libitum intake of a homoge-neous soup with similar energy density as our low-energy-dense soup (intake males: 423 g, females: 340 g) (24). The fixed loads in the current study, however, may not have been adequate to evoke significant differences in post-ingestive effects that facilitate learning.
Additionally, the study aim communicated to the participants may have modified their expectations. ‘Frequent consumption of soup as a main course’ implies that the soup will provide a substantial meal, which will be satiating upon finishing. Previous studies investi-gating hedonic expectations show that evaluation after consumption is generally adjusted towards expectations (25,26), especially after negative confirmation (27). Only when foods taste much better than expected (25) or when there is a large contrast between expectation and evaluation (28), future expectations will be adjusted. This adjustment of evaluation towards prior expectations may also affect changes in expectations of the satiating capac-ity of a food (25). Despite the large difference in energy density of the provided soups, the contrast between the ‘expected substantial meal’ and actual post-ingestive effects may not have been sufficient to change expected satiation.
It can be argued that the ‘pesto’-soup was novel within the category of soup products, but not highly novel in itself. Increases in familiarity ratings were only small, and possibly not sufficient to affect expectations. Expectations could then have been based on soup in gen-eral and reflect beliefs on an ‘prototypical’ item of the specific food category (29). Based on repeated consumption over life-time, people have learned that soup in general is a very satiating product (30,31). This may have limited the learning of new flavour-nutrient asso-ciations, thereby inhibiting a possible change in expected satiation. Moreover, four days of repeated consumption may have been insufficient to change beliefs about a familiar prod-uct (32,33). Results in figure 4.1 suggest that participants adjusted their expected satiation after the first exposure already, although the adjustments were small and not statistically significant. Using a more novel food may have resulted in profound changes in expected satiation after one exposure (16).
Overall, the results indicate that cognitive factors related to the food’s satiating capacity are very hard to change. The apparent absence of adequate learning may facilitate overcon-sumption, since conditions that are required for learning to occur may be sub-optimal in the complex dietary environment in our daily life.

61Expectedsatiationofdifferenttypesofsoup
Since expected satiation may play a role in decisions on meal size, understanding its under-lying factors can expand our current insight in the regulation of food intake. To further investigate the determinants of expected satiation, we refer to the difference in expected satiation between the two test soups at baseline. This difference indicates that participants discriminated the two soups based on the first spoonful, and implies that expectations were not exclusively based on volume of the soup. Other factors, such as differences in sensory characteristics (table 4.3), may also play a role. We examined this difference in expected satiation in more detail, and assessed the extent to which participants were able to discriminate between different food items from one product category, i.e. to discriminate between different types of soup. We performed a single measure of expected satiation of the LE and HE soup from study 1, and of four com-mercially available types of soup (study 2). Participants evaluated all six types of soup, and judged perceived intensity of several sensory attributes that were subsequently associated with expected satiation.
Study 2 Expectedsatiationofsixtypesofsoup
Methods
ParticipantsA total of 30 adults participated in the present study (see table 4.1 for characteristics). Recruitment procedures were as in study 1. Different participants were tested in study 1 and study 2.
DesignIn a within-subject design, participants conducted a single measurement of expected satia-tion of 6 types of soup: the LE and HE soup from study 1, and four commercially available types of soup that were assumed to be consumed regularly. Soup was presented in a fixed volume of 300 g for women and 400 g for men, and participants tasted a single spoonful from each type of soup. Ratings on perceived intensity of sensory attributes were associated with expected satiation.
TestfoodWe measured expected satiation of the LE and HE soup from study 1, and of four commer-cially available types of soup: chicken ('Unox Stevige-soep-in-blik', Unilever Nederland BV, Rotterdam, the Netherlands), mushroom, tomato, and pea (all 'Unox Soep-in-zak', Uni-lever Nederland BV). The chicken soup was a clear soup with pieces of chicken (5.5%), car-rot and noodles; the mushroom soup was a cream soup (based on skimmed-milk powder) with mushrooms (6.5%); the tomato-soup contained tomatoes (82%), basil, and oregano; the pea-soup contained peas (21%), smoked sausage (5%), and small pieces of potato, car-rot, bacon and onion (all <4%). Energy density and macronutrient composition of all types of soup are reported in table 4.2.

62 Chapter4
ProceduresParticipants had a single test session at 11.00 (n=7), 12.00 (n=12), 13.00 (n=9) or 14.00 (n=2). Breakfast was consumed at least 3 h before the start of the session. Participants rated their appetite sensations on a 100-unit VAS on arrival, and ratings on hunger, fullness, desire to eat and prospective consumption confirmed adherence to the breakfast instructions. We demonstrated the measurement of expected satiation, and presented the first bowl of soup. Participants tasted a single spoonful, rated pleasantness, familiarity and sensory attributes (sweetness, saltiness, creaminess, thickness, intensity of taste, intensity of herbs, and inten-sity of after-taste), and completed the measure of expected satiation. Participants were then instructed to return the bowl of soup and to neutralize their taste by eating plain crack-ers and drinking water. This procedure was repeated for all the types of soup. The order of presentation was randomized within participants. The measurement of expected satiation was conducted as in study 1.
DataanalysisAs in study 1, the selected amounts of all 7 comparison foods (in kJ) were averaged for each participant to calculate the expected satiation of each soup. Analyses were conducted with log transformed data, and converted into corresponding kJ when mean values are presented. The effect of type of soup on expected satiation was tested using ANOVA, and Tukey’s post hoc test was used to test for differences between the types of soup. We assessed associations between sensory attributes and expected satiation using Pearson’s correlation coefficients (r) and their associated 95% confidence intervals (CI). Multivariate stepwise linear regression analysis with backward elimination was used to test independence of these associations. The differences in expected satiation between study 1 and 2 were tested with a two-sample t-test.Data were analyzed using SAS (version 9.1; SAS Institute Inc.). Results at a p-value of <0.05 were considered significantly different.
Results
ExpectedsatiationFigure 4.2 shows the expected satiation for each of the 6 types of soup, as well as their actual energy content as served. Except for the HE soup, all types were expected to be more filling than the comparison foods, kJ-for-kJ. Expected satiation differed significantly across the soups (F(5,145)=14.87; p<0.0001). Post hoc tests showed that expected satiation of the chicken soup was lower than of all other types of soup; expected satiation of the pea soup was higher than of all other types of soup (all p<0.0001). The difference between expected satiation of the LE and HE soup was bor-derline significant (t=2.85; p=0.06). Expected satiation did not differ from study 1 for the LE soup (study 1: 1113 ± 238 kJ vs. study 2: 1099 ± 309 kJ; t=0.13, p=0.90) or the HE soup (study 1: 1224 ± 254 kJ vs. study 2: 1289 ± 449 kJ; t=-0.19, p=0.85). We observed no differ-ences in expected satiation between the tomato soup, the mushroom soup and the LE soup, or between the tomato soup, the mushroom and the HE soup.

63Expectedsatiationofdifferenttypesofsoup
Figure 4.2 Expectedsatiation(kJ;•)andactualenergyload(kJ;∆)of6typesofsoupasservedinstudy
2(weightedaverageofgender;womenwereserved300g,men400g).LE=low-energy-
densesoupfromstudy1;HE=high-energy-densesoupfromstudy1.
SensoryattributesThickness, creaminess, intensity of taste, intensity of after-taste and intensity of herbs were positively correlated with expected satiation of the different types of soup (table 4.3). Regression analysis showed that only thickness and intensity of taste were independently associated with expected satiation. These 2 sensory attributes accounted for 40% of the vari-ability in expected satiation (R²=0.40).
Discussion
In this second study, we conducted a single measurement of expected satiation of the LE and HE soup and four commercially available types of soup in a within-subject design, and with different participants tested. Our findings coincide with those from study 1. They show that the used method of adjustment is a reproducible measure, and a precise means to assess expectations. Moreover, the results indicate that people discriminated the test soups and estimated the order of the satiating capacity of different types of soup reasonably well.
Expected satiation is assumed to guide decisions on meal size, with selection of differ-ent portion sizes of food items differing in expected satiation. A previous study, however, reported similar intake of the two test foods despite differential changes in expected satia-tion (16). One explanation for the similar intake is that prolonged exposure will be required before behavioral changes may be observed. Another explanation is that the type of test foods, i.e. sorbets, may have limited the observation of intake compensation: one may not be used to eat dessert-specific products until satiation, since these foods are in general con-sumed in a fixed amount after dinner. Meals consumed in daily life, however, often con-

64 Chapter4
sist of several food items, and intake compensation may be demonstrated more easily by adjusted intake of food items that are used to be eaten until satiation, e.g. familiar staple foods. The satiating capacity of these foods may be well-known and may therefore facili-tate decisions on an adequate portion size. The effect of differences in expected satiation on actual intake warrants further investigation.
The differences in expected satiation in study 2 suggest that the absence of changes in expected satiation in study 1 is not due to insensitivity to differences between soups, and that equal volumes of the different soups do not result in equal expectations of satiating capacity per se. Instead, the differences suggests that we are sensitive to subtle characteris-tics of soup, but prior experiences with these characteristics, familiarity with the test food’s product category, and an insufficient contrast between expectations and evaluation may have limited relearning in study 1. Expectations as reported in study 2 may reflect the actual satiation that has been experienced throughout life when consuming that specific soup. Expectations may also reflect the evaluation of the sensory characteristics in general, with perceived thickness as an important determinant of expected satiation: more solid foods have been experienced to be more satiating than liquid foods (34-36). In either way, this suggests that expectations relating to the satiating capacity of a food are based on learning throughout life-time, and are not easily changed. This may explain the absence of energy adjustments in other flavour-nutrient learning studies. It also gives further insight in the particular conditions that are required for learning to occur. As suggested, a prolonged exposure period may be essential for a behavioral change, but it will be hard to define the extent to which the conditioning period must be extended to show evidence for learning, or relearning. Also, serving highly novel foods might enable learning to occur: expected satiation of novel foods will not yet be strongly based on previ-ous experiences and therefore susceptible to change. More important, learning may be pro-moted by a large contrast between the pre-existing beliefs and the post-ingestive evaluation of a specific food. This can be realized by e.g. large differences in energy density or texture between the versions of the test food, which do not comply with expectations relating to the food's satiating capacity.
Conclusion
Adults did not adjust their expected satiation in response to repeated consumption of the LE or HE soup in study 1. The apparent absence of learning and consequent intake adjustments may facilitate overconsumption. Energy learning may require a large contrast between expectations and post-consumption evaluation to occur. Results of study 2 indicate that expected satiation did not exclusively depend on the volume served, but that participants were able to discriminate between soups with different sensory attributes and energy con-tent. Expectations may initially rely on sensory attributes and previous experiences.Expected satiation is assumed to be an important determinant in decision on portion size. It will be interesting to further investigate its role in actual food intake, and to get more insight in the possibility to change expectations regarding a food’s satiating capacity and in the food characteristics that may play a role this.

65Expectedsatiationofdifferenttypesofsoup
AcknowledgementsWe thank all participants and research assistants (Natasja Hück, Kathryn Brown, Nicole Konijn, Sandra Bukman); Els Siebelink, Karin Borgonjen, Pauline Claessen and Corine Perenboom for dietary advice; and Tineke van Roekel for the chemical analyses.
References1 Booth DA, Mather P, Fuller J. Starch content of ordinary foods associatively conditions human appetite and satiation,
indexed by intake and eating pleasantness of starch-paired flavours. Appetite 1982; 3(2): 163-184.2 Shepherd R. Sensory influences on salt, sugar and fat intake. Nutr Res Rev 1988; 1(01): 125-144.3 Bell EA, Roe LS, Rolls BJ. Sensory-specific satiety is affected more by volume than by energy content of a liquid food.
Physiol Behav 2003; 78(4-5): 593-600.4 Yeomans MR, Weinberg L, James S. Effects of palatability and learned satiety on energy density influences on breakfast
intake in humans. Physiol Behav 2005; 86(4): 487-99.5 Louis-Sylvestre J, Tournier A, Verger P, Chabert M, Delorme B, Hossenlopp J. Learned caloric adjustment of human
intake. Appetite 1989; 12(2): 95-103.6 Mars M, Hogenkamp PS, Gosses AM, Stafleu A, De Graaf C. Effect of viscosity on learned satiation. Physiol Behav
2009; 98(1-2): 60-66.7 Specter SE, Bellisle F, Hémery-Véron S, Fiquet P, Bornet FRJ, Slama G. Reducing ice cream energy density does not
condition decreased acceptance or engender compensation following repeated exposure. Eur J Clin Nutr 1998; 52(10): 703-10.
8 Zandstra EH, Stubenitsky K, De Graaf C, Mela DJ. Effects of learned flavour cues on short-term regulation of food intake in a realistic setting. Physiol Behav 2002; 75(1-2): 83-90.
9 Raben A, Vasilaras TH, Moller AC, Astrup A. Sucrose compared with artificial sweeteners: different effects on ad libi-tum food intake and body weight after 10 wk of supplementation in overweight subjects. Am J Clin Nutr 2002; 76(4): 721-9.
10 Hogenkamp PS, Mars M, Stafleu A, de Graaf C. Intake during repeated exposure to low- and high-energy-dense yogurts by different means of consumption. Am J Clin Nutr 2010; 91(4): 841-847.
11 Yeomans M. Understanding individual differences in acquired flavour liking in humans. Chemosens Percept 2010; 3(1): 34-41.
12 Brunstrom JM, Mitchell GL. Flavor-nutrient learning in restrained and unrestrained eaters. Physiol Behav 2007; 90(1): 133-141.
13 Fay SH, Ferriday D, Hinton EC, Shakeshaft NG, Rogers PJ, Brunstrom JM. What determines real-world meal size? Evidence for pre-meal planning. Appetite 2011; 56(2): 284-289.
14 Kissileff HR, Gruss LP, Thornton J, Jordan HA. The satiating efficiency of foods. Physiol Behav 1984; 32(2): 319-32.15 Brunstrom JM, Shakeshaft NG, Scott-Samuel NE. Measuring ‘expected satiety’ in a range of common foods using a
method of constant stimuli. Appetite 2008; 51(3): 604-14.16 Wilkinson LL, Brunstrom JM. Conditioning `fullness expectations’ in a novel dessert. Appetite 2009; 52(3): 780-783.17 Brunstrom JM, Shakeshaft NG, Alexander E. Familiarity changes expectations about fullness. Appetite 2010; 54(3):
587-590.18 Van Strien T. Nederlandse Vragenlijst voor Eetgedrag (NVE). Handleiding (Dutch Eating Behaviour Questionnaire.
Manual), Boom Test Publishers: Amsterdam, the Netherlands, 2005.19 Rolls BJ, Castellanos VH, Halford JC, Kilara A, Panyam D, Pelkman CL et al. Volume of food consumed affects satiety
in men. Am J Clin Nutr 1998; 67(6): 1170-1177.20 Levitsky DA, Obarzanek E, Mrdjenovic G, Strupp BJ. Imprecise control of energy intake: absence of a reduction in food
intake following overfeeding in young adults. Physiol Behav 2005; 84(5): 669-75.21 Caputo FA, Mattes RD. Human dietary responses to covert manipulations of energy, fat, and carbohydrate in a midday
meal. Am J Clin Nutr 1992; 56(1): 36-43.22 Irvine MA, Brunstrom JM, Rogers PJ. Exploring expected satiety for common foods with a novel psychophysical meth-
odology. Appetite 2009; 52(3): 839-839.23 Hulshof K, Ocké M, Van Rossum C, Buurma-Rethans E, Brants H, Drijvers J et al. Resultaten van de Voedselcon-
sumptionpeiling 2003. In: Report 350030002/2004 RIVM, National Institute for Public Health and the environ-ment, 2003.

66 Chapter4
24 Bolhuis DP, Lakemond CMM, de Wijk RA, Luning PA, de Graaf C. Effect of salt intensity on ad libitum intake of tomato soup similar in palatability and on salt preference after consumption. Chem Senses 2010; 35(9): 789-799.
25 Wansink B, Ittersum K, Painter JE. How diet and health labels influence taste and satiation. J Food Sci 2004; 69(9): S340-S346.
26 Cardello AV, Sawyer FM. Effects of disconfirmed consumer expectations on food acceptability. J Sens Stud 1992; 7(4): 253-277.
27 Siret F, Issanchou S. Traditional process: influence on sensory properties and on consumers’ expectation and liking Appli-cation to `pâté de campagne’. Food Qual Prefer 2000; 11(3): 217-228.
28 Yeomans MR, Chambers L, Blumenthal H, Blake A. The role of expectancy in sensory and hedonic evaluation: The case of smoked salmon ice-cream. Food Qual Prefer 2008; 19(6): 565-573.
29 Brunstrom JM. Associative learning and the control of human dietary behavior. Appetite 2007; 49(1): 268-271.30 Mattes RD. Soup and satiety. Physiol Behav 2005; 83(5): 739-47.31 Rolls BJ. The relationship between dietary energy density and energy intake. Physiol Behav 2009; 97(5): 609-615.32 O’Sullivan HL, Alexander E, Ferriday D, Brunstrom JM. Effects of repeated exposure on liking for a reduced-energy-
dense food. Am J Clin Nutr 2010; 91(6): 1584-1589.33 Brunstrom JM. Dietary learning in humans: directions for future research. Physiol Behav 2005; 85(1): 57-65.34 Hulshof T, De Graaf C, Weststrate JA. The effects of preloads varying in physical state and fat content on satiety and
energy intake. Appetite 1993; 21(3): 273-86.35 Haber GB, Heaton KW, Murphy D, Burroughs LF. Depletion and disruption of dietary fibre. Effects on satiety,
plasma-glucose, and serum-insulin. Lancet 1977; 2(8040): 679-82.36 Mattes RD, Rothacker D. Beverage viscosity is inversely related to postprandial hunger in humans. Physiol Behav 2001;
74(4-5): 551-7.
Chapter 5 Texture, not flavour, determines
expected satiation of dairy products
Pleunie Hogenkamp
Annette Stafleu
Monica Mars
Jeff Brunstrom
Kees de Graaf
Appetite (2011) 57: p. 635-641

68 Chapter5
Abstract
Consumers’ expectations about the satiating capacity of a food may differ markedly across a broad range of food products, but also between foods within one product category. Our objective is to investigate the role of sensory attributes and means of consumption in the expected satiation of dairy products.In three independent experiments we measured the expected satiation of (1) commercially available yogurts and custards (29 adults, age: 26 ± 5 y, BMI: 22.9 ± 2.4 kg/m²); (2) lemon- and meringue-flavoured custards with different textures (30 adults, age: 23 ± 4 y, BMI: 22.1 ± 2.1 kg/m²); and (3) chocolate milk and chocolate custard consumed with either a straw or a spoon (30 adults, age: 20 ± 2.2 y, BMI: 21.5 ± 2.2 kg/m²); all based on a single mouthful. Expected satiation was linked to the product’s perceived characteristics.We observed an effect of texture (p<0.0001), but not of flavour on expected satiation (p=0.98) in Experiment 2; and an effect of texture (p<0.0001), but not of means of con-sumption on expected satiation (p=0.63) in Experiment 3. Thickness was positively corre-lated with expected satiation in Experiment 1 (r=0.45; p<0.001) and Experiment 2 (r=0.54; p<0.001). Expected satiation of dairy products increased consistently with increasing thick-ness; flavour characteristics or means of consumption as tested did not change expected satiation effects.

69Texture,notflavour,affectsexpectedsatiation
Introduction
Sensory attributes of foods play an important role in eating behaviour (1) by promoting intake of particular foods (1-3). It has been proposed that decisions on food choice and por-tion size are generally made before actual consumption (4). These decisions are among oth-ers influenced by food liking (5) and hedonic expectations (e.g. 6-8). Flavour, odour and food texture are important determinants of hedonic responses (9).Intake of a particular food, however, is not solely governed by hedonic responses (10). The learned association between the sensory attributes of a food and its metabolic consequences after consumption is another important determinant of decisions on intake (11-14). These associations may be the basis of expectations relating to the satiating capacity of a selected food: when a food is expected to be highly satiating, the selected portion may be adjusted, i.e. decreased.
Expectations about satiating capacity differ markedly across a broad range of food products (15), and depend among others on energy content of the selected food, familiarity with the food and its appropriateness for the specific eating occasion. Expectations may also differ between foods within one product category (16), where familiarity and appropriateness of the foods may be similar. Determinants of satiety expectations about foods within one product category of familiar foods have not been investigated before. Further insight in these determinants may increase understanding of decisions on meal size. We hypothesized that the expected satiation of foods within a product category may specifically rely on the sensory attributes of foods.
Important dimensions of sensory attributes are texture and flavour. In addition, a longer duration or higher intensity of the sensory signal may promote satiation (17). Throughout life, we experience that the satiating capacity of liquid products is generally lower than that of iso-caloric semi-solid and solid products (e.g. 18,19). This difference in satiating capacity may among others be attributable to a shorter sensory signal during consumption of liquid foods compared with consumption of semi-solid foods (20). Accordingly, we hypothesized that both food texture and the duration of the sensory signal, which we manipulated by means of consumption, affect expectations about a food’s satiating capacity. In addition, wehypothesized that flavour of a food also signals its energy content, and that e.g. a creamy flavour will enhance a food’s expected satiation when compared with a fruity flavour.
To test these hypotheses, we measured the expectations about the satiating effects of a range of foods differing in sensory attributes (Experiment 1 and 2) or different means of consump-tion (Experiment 3) within the food category of dairy products. We first explored whether adults can discriminate between six types of commercially dairy foods based on expected satiation (Experiment 1); and we investigated the effect of flavour and texture on expected satiation of lemon- and meringue-flavoured custards with varying textures (Experiment 2); and the effect of texture and means of consumption on expected satiation of chocolate milk and chocolate custard tasted with either a straw or a spoon (Experiment 3).

70 Chapter5
Methods
ParticipantsHealthy, normal weight participants, aged 18–40 years, were recruited from Wagenin-gen and the surroundings. Participants completed an inclusion questionnaire, in which body weight and height were reported. Exclusion criteria were: lack of appetite, follow-ing an energy-restricted diet or change in body weight >5 kg during the last 2 months, stomach or bowel diseases, diabetes, thyroid disease or any other endocrine disorder, hypersensitivity for food products under study, and being a vegetarian. A sample size of 29 participants would provide 80% power to detect a 30% difference in expectations. Different participants were tested in each experiment. Twenty-nine adults (M/F: 6/23, age: 26 ± 4.9 y, BMI: 22.9 ± 2.4 kg/m²) participated in Experiment 1, 30 adults (M/F: 9/21, age: 23 ± 4.2 y, BMI: 22.1 ± 2.1 kg/m²) in Experiment 2, and 30 adults (M/F: 0/30, age: 20 ± 2.2 y, BMI: 21.5 ± 2.2 kg/m²) in Experiment 3.
ProceduresParticipants attended a single test session, and were not allowed to eat at least two hours before the start of this session. We measured sensations of appetite (hunger, fullness, prospective consumption and desire to eat) before each session to confirm compliance to these procedures on 100-mm visual analogue ratings scales (VAS) anchored ‘not at all’ and ‘extremely’ (21). Participants were tested individually in sensory cabins with normal lighting. Participants tasted a single mouthful of the test food. They then rated sensory attributes on 100-mm VAS anchored ‘not at all’ and ‘extremely’, and completed the measure-ment of expected satiation (described below). This procedure was repeated for all test prod-ucts. Between each product, participants cleansed their palate by eating plain crackers and drinking water. We provided a fixed amount of crackers and water with the instructions to use these for taste neutralization throughout the whole test session. The presentation order of the products was randomized across participants.Participants attended the test session between 8.30 and 9.00 (n=4), between 11.00 and 14.00 (n=15), or between 15.00 and 16.00 (n=10) in Experiment 1; at 11.30 (n=15) or 13.00 (n=15) in Experiment 2; and at 11.00 (n=10) or 12.00 (n=12) and 13.00 (n=8) in Experiment 3 for logistic reasons. Participants did not have to follow instructions on eating or drinking after the test session.
MeasurementofexpectedsatiationDuring the measurement of expected satiation the test product was physically present and assessed against pictures of five ‘comparison foods’ (based on Brunstrom et al. (22). All comparison foods used were main-meal items, i.e. foods commonly consumed to satia-tion that were familiar to our participants. Comparison foods included: spaghetti Bolog-nese, penne and tomato sauce, rice curry (chicken tikka masala), oven fries, and cheese and tomato pizza. Pictures of each comparison food were shown on a computer screen. For each comparison food, a total of 51 pictures was used to display amounts that represented an energy content ranging from 83 kcal to 750 kcal: for each food, picture number 25 displayed a 250 kcal portion, picture number 0 displayed 0.3 times and picture number 50 displayed 3 times this energy load. The order of the comparison foods was randomized across partici-pants, and each trial started with a different and randomly selected energy load.
71Texture,notflavour,affectsexpectedsatiation
Participants consumed one single spoonful of each test product (or single sip when tast-ing by means of a straw in Experiment 3), and were then asked to ‘select the amount of food on the picture that would be equally as satiating as the dairy food in front of you’ for all comparison foods. Participants adjusted the amount of the comparison food using the arrow keys on the keyboard. For each participant, an arithmetic mean was derived based on the energy load (kcal) that was selected across comparison foods for the specific test food. This mean represents the expected satiation of the test food, i.e. the energy load (in kcal) that is expected to be equally as filling as the presented amount of the dairy product. In each experiment, participants tasted and rated all test foods. Test foods presented will be described in more detail below.
Testfoods
Exp. 1 Commerciallyavailableyogurtsandcustards
Test foods were dessert-specific products that are all commercially available in the Nether-lands. The macronutrient composition is reported in table 5.1. Test foods were presented in a fixed 250 g portion in a transparent bowl, and included full-fat plain yogurt (‘De Zaanse Hoeve’, Albert Heijn, Zaandam); low-fat lemon curd (‘Optimel kwark', Royal Friesland-Campina, Amersfoort); high-fat lemon yogurt (‘AH Milde Roomyoghurt’, Albert Heijn); low-fat chocolate custard (‘Optimel Vla’, Royal FrieslandCampina); ‘regular’ chocolate cus-tard (‘De Zaanse Hoeve’, Albert Heijn); and high-fat chocolate custard (‘Slagroomvla’, Royal FrieslandCampina).Participants rated sweetness, sourness, creaminess, thickness, freshness, and intensity of taste (table 5.2), and palatability and familiarity. Palatability ratings tended to differ between the products (product effect: p=0.06): the high-fat lemon yogurt (68 ± 20 mm VAS) tended to be more palatable compared with the low-fat chocolate custard (50 ± 27 mm VAS; p=0.05) and the regular chocolate custard (51 ± 26 mm VAS; p=0.10). Palatability rat-ings were not significantly associated with the food’s expected satiation.Plain yogurt was found to be more familiar (85 ± 14 mm VAS) than all other products (range: 45-58 mm VAS) (p<0.0001). Familiarity was negatively associated with expected satiation (r=-0.24; p=0.001).
Exp. 2 Lemon-andmeringue-flavouredcustardswithdifferenttexture
The test foods were milk-based products with different textures (four structures varying in thickness) and distinctive flavours (lemon-flavour - assumed to be ‘fresh and fruity’, and meringue-flavour - assumed to be ‘rich and full’), resulting in 8 product combinations. Macronutrient composition of the test foods is reported in table 5.1. The test products were presented in a fixed 480 g portion in a transparent bowl. Pictures used in the measurement of expected satiation displayed amounts that represented an energy content ranging from 50 kcal to 1250 kcal. Picture number 25 again displayed a 250 kcal portion.

72 Chapter5
Table 5.1 Energy,macronutrientcomposition(per100g)andenergypercentageofmacronutrients
ofcommerciallyavailableyogurtsandcustards(Experiment1),lemon-andmeringue-fla-
vouredcustardswithadifferenttexture(Experiment2),andchocolatemilkandchocolate
custard(Experiment3).
The test products were milk-based products with skimmed milk, cream, sugar, lactose, modified corn starch, aroma, salt and carrageen; and were developed for this study by Royal FrieslandCampina (Deventer). The type and degree of modification of the thicken-ing agents was manipulated to obtain four products with different textures but a similar macronutrient composition. Specifically, these were ‘liquid’ – of which viscosity may be comparable with ‘light cream’ (24); semi-liquid – with a viscosity in between of the liquid and semi-solid product and comparable with custards commercially available in the Neth-erlands; ‘semi-solid’ – of which viscosity may be comparable to ‘heavy cream’ (24); and ‘solid’ – of which viscosity and adhesiveness may be best comparable with ‘cream cheese’ (24) or commercially available stiff custard pudding. The products were flavoured with a lemon aroma (lemon flavour JN-299-483-5; Givaudan SA Corp., Vernier, Switzerland) or with a meringue aroma (schuimgebak aroma DA53211, Givaudan SA Corp.).To further characterize the differences in texture and flavour of the products, a trained panel (n=12) at Royal FrieslandCampina (Deventer) performed a sensory analysis according to standard sensory analysis techniques (25). The sensory attributes describing the products were evaluated on a 100-mm VAS anchored ‘not’ and ‘very’ (intensity of smell; sweetness of smell; thickness after visual inspection; jelly-like texture after visual inspection; sweetness of taste; intensity of lemon taste; intensity of caramel/vanilla taste; thickness; mealy ‘mouth feel’; and stickiness) (table 5.3). The average scores of the attribute ratings for each test food were associated with the food’s expected satiation.
Energy Carbohydrates, g Protein, g Fat, g Fibre, g c
(kcal/kJ) (% energy) (% energy) (% energy)
Experiment 1 a
Full-fat plain yogurt 59/250 4.5 (31) 3.5 (24) 3.0 (45) -Low-fat lemon curd 40/190 4.3 (43) 5.6 (55) 0.1 (2) -High-fat lemon yogurt 140/595 15.0 (43) 2.5 (7) 8.0 (50) 0.1Low-fat chocolate custard 55/230 8.9 (71) 3.6 (29) 0.0 (0) 0.1Regular chocolate custard 95/400 15.0 (62) 2.5 (10) 3.0 (27) 0.5High-fat chocolate custard 130/540 16.1 (51) 3.0 (10) 5.6 (39) -
Experiment 2 a
Liquid custard 96/402 14.0 (59) 3.1 (13) 3.0 (28) -Semi-liquid custard 98/410 14.5 (60) 3.1 (13) 3.0 (27) -Semi-solid custard 98/410 14.5 (60) 3.1 (13) 3.0 (27) -Solid custard 97/407 13.5 (56) 3.9 (16) 3.0 (27) -
Experiment 3 b
Chocolate milk 98/408 13.9 (58) 2.8 (12) 3.4 (30) -Chocolate custard 100/420 14.0 (57) 3.2 (12) 3.7 (32) -
a Shown per 100 g product. Values based on nutritional information provided by the manufacturer. b Shown per 100 g product. Values determined by chemical analyses of samples taken from a homogenous mixture of samples
collected in previous studies (23).c Information on fiber not available for all products, indicated with -.

73Texture,notflavour,affectsexpectedsatiation
Palatability of the products was rated by the participants (n=30), familiarity was not meas-ured. Palatability ratings differed between the products (product effect ANOVA: p<0.01): participants evaluated the meringue-flavoured semi-liquid custard (74 ± 15 mm VAS) as more palatable compared with the lemon-flavoured liquid and semi-solid custards (53 ± 25 mm and 53 ± 26 mm VAS respectively; both p<0.01) and the meringue-flavoured semi-solid custard (54 ± 22 mm VAS; p=0.02). Palatability ratings were not significantly associated with the food’s expected satiation.
Exp. 3 Chocolatemilkandchocolatecustardwithdifferentmeansofconsumption
The test foods were presented in a fixed 250 g portion, either in a cup and consumed with a straw (length: 17.5 cm; diameter: 0.9 cm) or in a transparent bowl and consumed with a tablespoon, resulting in 4 product combinations. The macronutrient composition of the foods is reported in table 5.1.The test products were milk-based with chocolate flavour, with whole fat milk (68%), water (18%), sugar (6.5%), modified starch (3.5%), cream (2%), cacao powder (1.5 %) and carra-geen (0.05%); and were especially developed for this study (NIZO food research BV, Ede). The type and concentration of thickening agents (starch) was manipulated to produce two otherwise identical products that differed only in texture; ‘chocolate milk’ and ‘chocolate custard’. These test products are described in detail elsewhere (23). Participants rated sweet-
Full-fat Low-fat High-fat Low-fat ‘Regular’ High-fat Pearson’s r plain lemon lemon chocolate chocolate chocolate (95% CI) yogurt curd yogurt custard custard custard
Expected satiation a 180 ± 79 c 227 ± 72 d,e 249 ± 70 e,f 231 ± 68 e,d 198 ± 60 c,d 278 ± 78 f -
Sweet 22 ± 17 51 ± 24 61 ± 18 65 ± 17 65 ± 17 75 ± 14 0.29 b
(0.15, 0.42)Sour 70 ± 24 63 ± 23 50 ± 24 12 ± 12 15 ± 17 11 ± 14 -0.15 c
(-0.29, 0.00)Creamy 51 ± 26 62 ± 21 75 ± 22 57 ± 24 52 ± 24 86 ± 11 0.37 b
(0.24, 0.49)Fresh 78 ± 13 77 ± 15 78 ± 12 24 ± 20 26 ± 19 27 ± 21 -0.22 c
(-0.35, -0.07)Thick 47 ± 25 74 ± 13 86 ± 12 71 ± 16 45 ± 25 86 ± 10 0.45 b
(0.32, 0.56)Intensity of 69 ± 16 78 ± 15 72 ± 16 64 ± 23 73 ± 18 72 ± 17 NS taste
a Mean expected satiation scores of 250 g portions followed by different letters differ significantly (p< 0.05)b Correlation coefficients significant (p<0.001).c Correlation coefficients significant (p<0.05).
Table 5.2 Ratingsonsensoryattributes(mmonVAS,mean±SD)andexpectedsatiationscores(kcal,
mean ± SD)of 6 typesof commercially available yogurts andcustards; andcorrelation
coefficients(r)ofattributeswithexpectedsatiationinExperiment1(n=29)

74 Chapter5
a Average scores on the sensory attributes rated by the trained panel (n=12) were inserted as new variables (i.e. ‘product character-istics’) to explore associations between sensory attributes and expected satiation, as rated by the participants (n=30).
b Mean expected satiation scores (n=30) of 480 g portions followed by different letters differ significantly (p<0.0001)c Correlation coefficients significant (p <0.001).
ness, sourness, bitterness, intensity of taste, creaminess, thickness, roughness, smoothness, firmness, intensity of after-taste and creaminess of after-taste (table 5.4), and palatability and familiarity. Ratings on palatability and familiarity did not significantly differ across products, and were not associated with the food’s expected satiation.
DataanalysisContinuous variables were presented as means (± SD) and categorical variables were pre-sented as frequencies. Expected satiation scores, i.e. the average of the selected energy loads of all comparison foods, were log transformed before being entered into our analysis to improve normality. For reasons of clarity, however, we converted the data into correspond-ing kcals when mean values are presented.ANOVA (mixed model procedure) was used to explore the product effects on expected satia-tion in Experiment 1; to evaluate the interaction and main effects of texture and flavour on expected satiation in Experiment 2; and to evaluate the interaction and main effects of texture and means of consumption on expected satiation in Experiment 3. Tukey’s post hoc tests were used to test for differences, if any, between the products, texture, flavours and means of consumption.In addition, we investigated the relation between the flavour and textural attributes and expected satiation by calculating Pearson’s correlation coefficients (r) and associated 95% confidence intervals (CI) in Experiment 1 and 2. Stepwise linear regression analysis with backward elimination was used to test the independency of these correlations.All data were analyzed using SAS (version 9.1; SAS Institute Inc.); results were considered sta-tistically significant at p-values < 0.05.
Lemon-flavoured custards Meringue-flavoured custards Pearson’s r Liquid custard Semi-liquid custard Semi-solid custard Solid custard Liquid custard Semi-liquid custard Semi-solid custard Solid custard (95% CI)
Expected satiation b 249 ± 79 d 319 ± 79 e 453 ± 145 f 422 ± 142 f 246 ± 93 d 332 ± 101 e 419 ± 122 f 454 ± 146 f -Intensity of smell 79 ± 20 66 ± 26 77 ± 18 79 ± 16 65 ± 22 57 ± 32 72 ± 14 78 ± 16 0.23 (0.10, 0.34) c
Sweetness of smell 26 ± 23 20 ± 19 27 ± 23 32 ± 25 74 ± 20 59 ± 33 74 ± 20 73 ± 21 NSThick (visual inspection) 8 ± 7 48 ± 14 71 ± 16 98 ± 5 2 ± 4 43 ± 12 73 ± 16 97 ± 6 0.53 (0.44, 0.62) c
Jelly-like texture (visual inspection) 0 ± 1 29 ± 24 71 ± 17 99 ± 2 0 ± 0 22 ± 21 71 ± 22 99 ± 2 0.53 (0.43, 0.61) c
Sweet (flavour) 65 ± 23 52 ± 26 49 ± 23 35 ± 24 93 ± 9 77 ± 15 63 ± 20 56 ± 28 -0.39 (-0.49, -0.27) c
Intensity of lemon-flavour 60 ± 32 60 ± 30 61 ± 29 58 ± 34 0 ± 0 0 ± 0 0 ± 0 0 ± 0 NSIntensity of caramel / vanilla-flavour 3 ± 5 1 ± 2 0 ± 2 0 ± 1 92 ± 11 76 ± 19 65 ± 19 55 ± 32 NSThick (mouth feel) 5 ± 6 38 ± 16 72 ± 19 95 ± 8 1 ± 3 32 ± 14 72 ± 20 96 ± 8 0.54 (0.44, 0.62) c
Mealy (mouth feel) 7 ± 8 39 ± 31 49 ± 34 49 ± 40 9 ± 16 34 ± 31 46 ± 34 50 ± 41 0.54 (0.44, 0.62) c
Sticky (mouth feel) 0 ± 1 10 ± 12 49 ± 29 71 ± 26 0 ± 0 12 ± 13 57 ± 32 76 ± 25 0.51 (0.41, 0.60) c
Table 5.3 Ratings on sensory attributes (mm on VAS,mean ± SD) scored by a trained panel and
expected satiation (kcal,mean± SD)of8 typesofcustardwith lemon-ormeringue-fla-
vour;andcorrelationcoefficients(r)ofattributes(bothflavours)withexpectedsatiationain
Experiment2(n=30)

75Texture,notflavour,affectsexpectedsatiation
Chocolate milk (straw) Chocolate milk (spoon) Chocolate custard (straw) Chocolate custard (spoon)
Expected satiation b 165 ± 45 c 149 ± 52 c 197 ± 63 d 214 ± 71 d
Creamy 56 ± 24 46 ± 23 65 ± 20 60 ± 19Thick 21 ± 15 14 ± 13 73 ± 16 72 ± 18Rough 18 ± 17 24 ± 23 39 ± 24 44 ± 24Smooth 81 ± 11 68 ± 23 66 ± 22 54 ± 24Firm 23 ± 16 15 ± 11 60 ± 20 63 ± 20Creaminess of after taste 52 ± 24 42 ± 24 57 ± 22 51 ± 24
a Ratings on sweetness, sourness, bitterness, intensity of taste, and intensity of after taste of the chocolate products did not signifi-cantly differ across products (data not reported).
b Mean expected satiation scores of 250 g portions followed by different letters differ significantly (p< 0.05)
Results
Experiment 1
ExpectedsatiationExpected satiation differed significantly across the products (p<0.0001). Plain yogurt and regular chocolate custard were expected to be less satiating than the other products (all p<0.001), except for regular chocolate custard compared with low-fat lemon curd and with low-fat chocolate custard (NS). Expected satiation of high-fat chocolate custard was not sig-nificantly different from high-fat lemon yogurt, but was higher than the expected satiation of the other products (all p<0.02) (table 5.2).
Lemon-flavoured custards Meringue-flavoured custards Pearson’s r Liquid custard Semi-liquid custard Semi-solid custard Solid custard Liquid custard Semi-liquid custard Semi-solid custard Solid custard (95% CI)
Expected satiation b 249 ± 79 d 319 ± 79 e 453 ± 145 f 422 ± 142 f 246 ± 93 d 332 ± 101 e 419 ± 122 f 454 ± 146 f -Intensity of smell 79 ± 20 66 ± 26 77 ± 18 79 ± 16 65 ± 22 57 ± 32 72 ± 14 78 ± 16 0.23 (0.10, 0.34) c
Sweetness of smell 26 ± 23 20 ± 19 27 ± 23 32 ± 25 74 ± 20 59 ± 33 74 ± 20 73 ± 21 NSThick (visual inspection) 8 ± 7 48 ± 14 71 ± 16 98 ± 5 2 ± 4 43 ± 12 73 ± 16 97 ± 6 0.53 (0.44, 0.62) c
Jelly-like texture (visual inspection) 0 ± 1 29 ± 24 71 ± 17 99 ± 2 0 ± 0 22 ± 21 71 ± 22 99 ± 2 0.53 (0.43, 0.61) c
Sweet (flavour) 65 ± 23 52 ± 26 49 ± 23 35 ± 24 93 ± 9 77 ± 15 63 ± 20 56 ± 28 -0.39 (-0.49, -0.27) c
Intensity of lemon-flavour 60 ± 32 60 ± 30 61 ± 29 58 ± 34 0 ± 0 0 ± 0 0 ± 0 0 ± 0 NSIntensity of caramel / vanilla-flavour 3 ± 5 1 ± 2 0 ± 2 0 ± 1 92 ± 11 76 ± 19 65 ± 19 55 ± 32 NSThick (mouth feel) 5 ± 6 38 ± 16 72 ± 19 95 ± 8 1 ± 3 32 ± 14 72 ± 20 96 ± 8 0.54 (0.44, 0.62) c
Mealy (mouth feel) 7 ± 8 39 ± 31 49 ± 34 49 ± 40 9 ± 16 34 ± 31 46 ± 34 50 ± 41 0.54 (0.44, 0.62) c
Sticky (mouth feel) 0 ± 1 10 ± 12 49 ± 29 71 ± 26 0 ± 0 12 ± 13 57 ± 32 76 ± 25 0.51 (0.41, 0.60) c
Table 5.4 Ratingsonsensoryattributesa(mmonVAS,mean±SD)andexpectedsatiation(kcal,mean
±SD)ofchocolatemilkandchocolatecustard,consumedwithstrawandspooninExperi-
ment3(n=30)

76 Chapter5
SensoryattributesTable 5.2 gives an overview of the mean ratings of the sensory attributes. Thickness, creami-ness, and sweetness intensity were positively correlated with expected satiation; freshness, and sourness were negatively correlated. Thickness (figure 5.1), freshness, intensity of taste, sourness, and sweetness intensity together explained 30% of the variance in expected satia-tion effects in the final regression equation (R²=0.30). Thickness accounted for 22% of the variance explained.
Figure 5.1 Ratingsonexpectedsatiation(kcal,mean±SEM)asafunctionofperceivedthickness(mm
VAS)ofthe6typesofcommerciallyavailableyogurtsandcustardsaspresented(250gpor-
tion)inExperiment1(n=29)
Experiment 2
ExpectedsatiationExpected satiation differed significantly across textures (p<0.0001), but there was no effect of flavour (p=0.98) and no texture*flavour interaction effect (p=0.30) on expected satiation. Post hoc tests showed that expected satiation did not differ between the solid and semi-solid products. These products were expected to be more satiating than the semi-liquid prod-ucts (p<0.0001), which in turn were expected to be more satiating than the liquid products (p<0.0001) (table 5.3).
SensoryattributesTable 5.3 gives an overview of the mean ratings on the sensory attributes. Thick and mealy mouth feel, stickiness, thickness and jelly-like texture after visual inspection, and inten-sity of smell were positively correlated with expected satiation; sweet taste was negatively correlated.Thick mouth feel (figure 5.2), jelly-like texture and thickness after visual inspection together explained up to 30% (R²=0.31) of the variance in expected satiation in the final regression equation. Thickness accounted for 20% of the variance explained.

77Texture,notflavour,affectsexpectedsatiation
Experiment 3
ExpectedsatiationThe custard products were expected to be more satiating than the milk products (p<0.0001). We did not observe an effect of means of consumption on expected satiation (p=0.63). The texture*means of consumption interaction was statistically significant (F(1,29)=6.83; p=0.01), with custard consumed with a straw expected to be more satiating than milk con-sumed with a spoon (table 5.4).
Figure 5.2 Ratingsonexpectedsatiation(kcal,mean±SEM)asafunctionofperceivedthickness(mm
VAS)ofthe8typesofcustardsaspresented(480gportion)inExperiment2(n=30)
Discussion
The objective of the current experiments was to investigate the role of texture and fla-vour attributes and means of consumption on expectations about the satiation effects of dairy products. Results consistently showed an increase in expected satiation with increased thickness of the dairy products presented, whereas flavour characteristics and means of con-sumption as tested did not affect the expected satiation of the foods.Expectations about satiating effects of foods within a single product category have not been investigated before. Results of Experiment 1 showed that participants were able to discrimi-nate between commercially available types of yogurts and custards, and that the method of adjustment was an adequate measure to assess the expected satiation. Previous studies showed that the method of adjustment is a reproducible measure and a precise means to assess expectations, explained by the use of very familiar comparison foods that enabled the participants to identify their expected satiation precisely. Moreover, these studies showed that snack- or dessert-specific food items that were physically present, like fruit smooth-ies (26), sorbets (27), or dairy smoothies (28) can be compared with meal items shown on pictures successfully.

78 Chapter5
Dairy products may differ largely in sensory attributes, whereas familiarity with the foods and appropriateness may be similar across a range of dairy products. The products pre-sented in Experiment 2 were similar in the characteristics except texture and flavour. This enabled us to investigate the effect of differences in texture or flavour on satiation expec-tations of dairy products, independent of macronutrient composition or appropriateness for time of consumption. We observed a clear increase in expected satiation with increased thickness, regardless of the flavours of the custards. In Experiment 3, the chocolate cus-tard was expected to be more satiating than the chocolate milk, regardless of its means of consumption.
Our results showed a highly consistent, but modest effect of perceived thickness on expected satiation. This suggests that other factors, like product perception, will also play a role in formation of these expectations. Individual differences in feelings of hunger and fullness may have affected portion perception (29). We standardized appetite sensations prior to each experiment and offered the products in a randomized order to limit these effects, but we did not take possible differences in ratings between participants into account. Also, the perceived volume of a product is observed to modulate expectations around satiation (30). Visual cues explained part of the variance of the expected satiation in Experiment 2, but we did not further address the effect of volume on satiety expectations in the current experi-ments. In addition, product information and habits may also be important in product per-ception and expectations about satiation.The current experiments addressed the effect of sensory attributes of dairy foods on expected satiation, not on actual food intake. It can be argued that tasting of a single mouthful of a food results an increased desire for that food (31), or that food liking may influence esti-mated portion size (5). When a single exposure would induce an increased desire for the food eaten, this would have been the case for all test foods in the experiment. It therefore does not seem likely that a possible sensitization-effect would have influenced our results. In addition, we did not observe an association between palatability ratings of the foods and their expected satiation. Also, previous studies observed that liking was not a good predic-tor of satiety expectations (22). In the absence of direct metabolic feedback when consum-ing only one mouthful, experience from a general class of foods with certain nutritional and sensory attributes will be used to form satiety expectations about foods that share those attributes.
Results of Experiment 1 indicated a role for both texture and flavour properties in expected satiation. Nevertheless, participants reported large differences in flavour characteristics between plain yogurt and regular chocolate custard, but did not report differences in expected satiation of these products. Results of Experiment 2 showed that flavour did not affect the expectations about the satiation effects of the products, despite a clear difference between the flavour characteristics of the fruity-flavoured and creamy-flavoured products.Studies that investigated the effect of flavour characteristics on actual intake showed that satiation, i.e. ad libitum intake, was not affected by the salt intensity of soup products (32) or by the sweet or savory taste of a rice meal (33) with equal palatability. This suggests that flavour characteristics may affect food intake via other mechanisms than satiation, such as meal initiation and food choice. Decisions on the amount eaten depend among others on texture characteristics.

79Texture,notflavour,affectsexpectedsatiation
In general, semi-solid and solid foods have been experienced to be more satiating than liq-uid foods (18,34,35), explaining the effect of texture on expected satiation. In addition, the food texture experienced at the start of an eating occasion might predict the duration of the sensory exposure to the food and consequently, its expected satiating capacity. Eating rate has been shown to be an important determinant of satiation (20,36). Differences in means of consumption were observed to affect intake of a dairy food (37), but did not modulate the expected satiation of the milk or custard products in Experiment 3. Expectations relat-ing to the satiating capacity of these foods predominantly relied on texture. Differences in eating rate and in means of consumption may directly affect intake or feelings of satiety, but continuation of the eating occasion may be required to observe these effects. However, evi-dence is inconclusive: some studies did not observe a difference in satiety profiles between a yogurt that was eaten with a spoon and a drinkable version (38) or between fixed-portion meals consumed at different rates (39), where other studies showed a 20% higher intake when a liquid was consumed with a straw compared with consumption with a spoon (37) and a greater decrease in hunger ratings after consuming a liquid food with a spoon than after drinking an identical amount of a similar food (40,41).
From the current experiments, we conclude that an increase in thickness results in an increased expected satiation, while flavour characteristics and means of consumption as tested did not affect expected satiation of dairy products. Expected satiation of a food is assumed to be one of the determinants of portion size (22) and do not seem suscepti-ble to change (16,42). Further investigation of the effect of satiety expectations on actual intake may be important to better understand our regulation of food intake.
AcknowledgementsWe thank all participants, and Natasja Hück and Lisette Kamps for assistance.

80 Chapter5
References
1 Sorensen LB, Moller P, Flint A, Martens M, Raben A. Effect of sensory perception of foods on appetite and food intake: a review of studies on humans. Int J Obes Relat Metab Disord 2003; 27(10): 1152-66.
2 Shepherd R. Sensory influences on salt, sugar and fat intake. Nutr Res Rev 1988; 1(01): 125-144.3 Yeomans MR, Blundell JE, Leshem M. Palatability: response to nutritional need or need-free stimulation of appetite?
Br J Nutr 2004; 92(SupplementS1): S3-S14.4 Fay SH, Ferriday D, Hinton EC, Shakeshaft NG, Rogers PJ, Brunstrom JM. What determines real-world meal size?
Evidence for pre-meal planning. Appetite 2011; 56(2): 284-289.5 Brogden N, Almiron-Roig E. Food liking, familiarity and expected satiation selectively influence portion size estimation
of snacks and caloric beverages in men. Appetite 2010; 55(3): 551-555.6 Deliza R, MacFie H. The generation of sensory expectation by external cues and its effect on sensory perception and
hedonic ratings: a review. J Sens Stud 1996; 11(2): 103-128.7 Yeomans MR, Chambers L, Blumenthal H, Blake A. The role of expectancy in sensory and hedonic evaluation: The case
of smoked salmon ice-cream. Food Qual Prefer 2008; 19(6): 565-573.8 Cardello AV, Sawyer FM. Effects of disconfirmed consumer expectations on food acceptability. J Sens Stud 1992; 7(4):
253-277.9 Drewnowski A. Taste preferences and food intake. Annu Rev Nutr 1997; 17(1): 237-253.10 Mela DJ. Food choice and intake: the human factor. Proc Nutr Soc 1999; 58(03): 513-521.11 Booth DA, Lee M, McAleavey C. Acquired sensory control of satiation in man. Brit J Psychol 1976; 67(2): 137-147.12 Louis-Sylvestre J, Tournier A, Verger P, Chabert M, Delorme B, Hossenlopp J. Learned caloric adjustment of human
intake. Appetite 1989; 12(2): 95-103.13 Yeomans MR, Weinberg L, James S. Effects of palatability and learned satiety on energy density influences on breakfast
intake in humans. Physiol Behav 2005; 86(4): 487-99.14 Mars M, Hogenkamp PS, Gosses AM, Stafleu A, De Graaf C. Effect of viscosity on learned satiation. Physiol Behav
2009; 98(1-2): 60-66.15 Brunstrom JM, Shakeshaft NG, Scott-Samuel NE. Measuring ‘expected satiety’ in a range of common foods using a
method of constant stimuli. Appetite 2008; 51(3): 604-14.16 Hogenkamp PS, Brunstrom JM, Stafleu A, Mars M, de Graaf C. Expected satiation after repeated consumption of
low- or high-energy-dense soup. Br J Nutr 2011.17 Blundell J, De Graaf C, Hulshof T, Jebb SA, Livingstone B, Lluch A et al. Appetite control: methodological aspects of
the evaluation of foods. Obes Rev 2010; 11(3): 251-270.18 Haber GB, Heaton KW, Murphy D, Burroughs LF. Depletion and disruption of dietary fibre. Effects on satiety,
plasma-glucose, and serum-insulin. Lancet 1977; 2(8040): 679-82.19 Mattes RD, Rothacker D. Beverage viscosity is inversely related to postprandial hunger in humans. Physiol Behav 2001;
74(4-5): 551-7.20 Zijlstra N, de Wijk RA, Mars M, Stafleu A, de Graaf C. Effect of bite size and oral processing time of a semisolid food
on satiation. Am J Clin Nutr 2009; 90(2): 269-75.21 Stubbs RJ, Hughes DA, Johnstone AM, Rowley E, Reid C, Elia M et al. The use of visual analogue scales to assess
motivation to eat in human subjects: a review of their reliability and validity with an evaluation of new hand-held com-puterized systems for temporal tracking of appetite ratings. Br J Nutr 2000; 84(4): 405-15.
22 Brunstrom JM, Rogers PJ. How many calories are on our plate? Expected fullness, not liking, determines meal-size selec-tion. Obesity 2009; 17(10): 1884-1890.
23 Zijlstra N, Mars M, de Wijk RA, Westerterp-Plantenga MS, de Graaf C. The effect of viscosity on ad libitum food intake. Int J Obes 2008; 32(4): 676-83.
24 Szczesniak AS, Brandt MA, Friedman HH. Development of standard rating scales for mechanical parameters of texture and correlation between the objective and the sensory methods of texture evaluation. J Food Sci 1963; 28(4): 397-403.
25 Stone H. Quantitative Descriptive Analysis (QDA). In: Hootman RC (ed) Manual on descriptive analysis testing for sensory evaluation, vol. 15-21, 1992.
26 Brunstrom JM, Brown S, Hinton EC, Rogers PJ, Fay SH. ‘Expected satiety’ changes hunger and fullness in the inter-meal interval. Appetite 2011; 56(2): 310-315.
27 Wilkinson LL, Brunstrom JM. Conditioning `fullness expectations’ in a novel dessert. Appetite 2009; 52(3): 780-783.28 Fay SH, Hinton EC, Rogers PJ, Brunstrom JM. Product labelling can confer sustained increases in expected and actual
satiety. In: British Feeding and Drinking Group. Belfast, 2011.29 Brogden N, Almiron-Roig E. Estimated portion sizes of snacks and beverages differ from reference amounts and are
affected by appetite status in non-obese men. Public Health Nutr 2011; FirstView: 1-9.

81Texture,notflavour,affectsexpectedsatiation
30 Brunstrom JM, Collingwood J, Rogers PJ. Perceived volume, expected satiation, and the energy content of self-selected meals. Appetite 2010; 55(1): 25-29.
31 Hill AJ, Magson LD, Blundell JE. Hunger and palatability: tracking ratings of subjective experience before, during and after the consumption of preferred and less preferred food. Appetite 1984; 5(4): 361-71.
32 Bolhuis DP, Lakemond CMM, de Wijk RA, Luning PA, de Graaf C. Effect of salt intensity on ad libitum intake of tomato soup similar in palatability and on salt preference after consumption. Chem Senses 2010; 35(9): 789-799.
33 Griffioen-Roose S, Mars M, Finlayson G, Blundell JE, de Graaf C. Satiation due to equally palatable sweet and savory meals does not differ in normal weight young adults. J Nutr 2009; 139(11): 2093-8.
34 Tournier A, Louis-Sylvestre J. Effect of the physical state of a food on subsequent intake in human subjects. Appetite 1991; 16(1): 17-24.
35 Almiron-Roig E, Chen Y, Drewnowski A. Liquid calories and the failure of satiety: how good is the evidence? Obes Rev 2003; 4(4): 201-12.
36 Zijlstra N, Mars M, Stafleu A, de Wijk RA, Prinz JF, Hück NL et al. Effect of bite size and oral processing time of food on satiation. Appetite 2008; 51(3): 753-753.
37 Hogenkamp PS, Mars M, Stafleu A, de Graaf C. Intake during repeated exposure to low- and high-energy-dense yogurts by different means of consumption. Am J Clin Nutr 2010; 91(4): 841-847.
38 Tsuchiya A, Almiron-Roig E, Lluch A, Guyonnet D, Drewnowski A. Higher satiety ratings following yogurt consump-tion relative to fruit drink or dairy fruit drink. J Am Diet Assoc 2006; 106(4): 550-7.
39 Karl JP, Young AJ, Montain SJ. Eating rate during a fixed-portion meal does not affect postprandial appetite and gut peptides or energy intake during a subsequent meal. Physiol Behav 2011; 102(5): 524-531.
40 Mattes RD. Soup and satiety. Physiol Behav 2005; 83(5): 739-47.41 Martens M, Westerterp-Plantenga MS. Mode of consumption plays a role in allevating hunger and thirst. In: Benjamin
Franklin Lafayette Seminar. Fréjus, 2011.42 O’Sullivan HL, Alexander E, Ferriday D, Brunstrom JM. Effects of repeated exposure on liking for a reduced-energy-
dense food. Am J Clin Nutr 2010; 91(6): 1584-1589.


Chapter 6 Changes in ad libitum intake and appetite
sensations after repeated consumption ofiso-caloric liquid and semi-solid dairy foods
Pleunie Hogenkamp
Monica Mars
Annette Stafleu
Kees de Graaf
Submitted for publication

84 Chapter6
Abstract
Food intake and expected satiety initially rely on sensory properties, and people will learn about the food’s satiating capacity by exposure. We investigated whether repeated consump- tion changed expected satiety and intake of iso-energetic liquid and semi-solid foods.In a randomized cross-over study, participants (n=53; age: 21 ± 2.9 y; BMI: 21.8 ± 2.0 kg/m²) consumed one of two iso-energetic dairy foods for breakfast in each 5-day test condition: liquid or semi-solid. Expected satiety was measured on day 1,2, and 5. Foods were offered ad libitum on day 1 and 5 and in a fixed amount on day 2 to 4. Appetite sensations were rated up to 180 min after consumption on set time points. Expected satiety of the semi-solid food was higher than of the liquid food on all days (p<0.0001). Ad libitum intake of the liquid food was higher than of the semi-solid food on day 1 (liquid: 391 ± 177 g, semi-solid: 277 ± 98 g; p<0.0001) and day 5 (liquid: 477 ± 161 g, semi-solid: 375 ± 148 g; p<0.0001). On day 2, the appetite response was stronger after the semi-solid compared with the liquid product; on day 4, no differences were observed (significant product*exposure interaction AUC). Participants learned about the equal satiat-ing capacity of the foods after repeated consumption, but expected satiety remained lower, and ad libitum intake higher for the liquid compared with the semi-solid food. The effect of texture on expected satiety and ad libitum intake appears to be larger than the effect of learned metabolic satiety. Satiety expectations are not easily changed.

85Repeatedconsumptionofiso-caloricdairyfoods
Introduction
The intake of a particular food is partly based on previous experience with the food. More precise, people may learn about the energy content of a food by exposure, and link post-ingestive appetite sensations to the food’s sensory properties (1,2). This concept has been defined as learned satiety (3-5) and results in expectations about the food’s satiating capac-ity. Expected satiety is suggested to play a role in decisions on portion size (6), and conse-quently in energy intake.
Satiety expectations of a specific food depends on both the food’s energy content and on its sensory properties (7). One of the sensory properties that is important in appetite control and food intake is the texture of a food. In a preceding experiment, we observed that an increase in perceived thickness of several dairy products resulted consistently in an increase in expected satiation (8). This is in line with the results of several studies that showed that solid foods produce higher satiety ratings than iso-energetic liquid foods (e.g. 9,10), or that ad libitum intake of solid or semi-solid foods is lower than of liquid foods (11-13).
Expected satiety of a specific food also depends on the food’s energy content. Previous stud-ies, however, showed that satiety expectations did not change when repeatedly consum-ing low or high-energy-dense foods that were similar in appearance (14,15). When satiety expectations based on the sensory properties of a food are not congruent with the food’s energy content and with the satiety sensation that is experienced after consumption, this may disrupt energy intake regulation (16). It can also be reasoned that a large incongruence (between expected satiety and experienced satiety) may promote learning about a food’s satiating capacity with adjustments in satiety expectations (17) and intake as a consequence. We assume that changes in expected satiety of a food in response to learning will result in changes in intake of this food.
In the current experiment we investigated changes in expected satiety and intake after repeated consumption of dairy foods that were similar in energy density, but different in their sensory properties and in their expected satiety at baseline: low (a liquid dairy food) or high (a semi-solid dairy food). We hypothesized that participants adjust expected satiety in response to learning about the satiating capacity of the foods, and change their intake accordingly. In a cross-over experiment, participants repeatedly consumed either the liquid or the semi-solid test food in a 5-day test condition and rated appetite sensations after con-sumption. On day 1 and 5, expected satiety and ad libitum intake were measured.

86 Chapter6
Methods
DesignIn a randomized cross-over design with two test conditions, participants were served dairy products for breakfast on 5 consecutive days (Monday to Friday). In each test condition, participants consumed one of the two iso-energetic test foods of which expected satiety at baseline was either low (a liquid dairy food) or high (a semi-solid dairy food). On day 1 and 5, test foods were offered ad libitum and intake was measured; on day 2, 3, and 4, a fixed amount of test food was offered and consumed entirely. Expected satiety of the products was measured on day 1, 2, and 5.The order of conditions was randomized and balanced within subjects. Conditions were separated by a period of at least one week. Preceding the study, the participants were trained in the procedures that are explained below.
ParticipantsHealthy, normal weight participants, aged 18–40 y, were recruited from Wageningen and the surroundings. Exclusion criteria were: restrained eating (Dutch eating behaviour ques-tionnaire (18): men score > 2.25; women score > 2.80), lack of appetite, following an energy-restricted diet or change in body weight > 5 kg during the last 2 months, stomach or bowel diseases, diabetes, thyroid disease or any other endocrine disorder, hypersensitivity for food products under study, smoking, and being a vegetarian. Body weight and height were measured. In total, 53 participants (M/F: 12/41, age: 21 ± 2.9 y, BMI: 21.8 ± 2.0 kg/m²) completed the study. They were unaware of the exact aim of the study, and were informed that we were interested in taste sensations and acceptance of dairy products for breakfast. Par-ticipants were debriefed after the study. All participants signed an informed consent and received financial compensation. The present study was conducted according to the ethi-cal standards of the Medical Ethical Committee (MEC) of Wageningen University and all procedures involving human subjects were approved by the MEC of Wageningen University (NL32016.081.10) and registered with the Dutch trial registration (NTR 2374).
TestfoodsThe test foods were milk based products specially developed for this study (Royal Fries-landCampina, Deventer) to obtain two iso-energetic products (each 407 kJ/100 g) with similar macronutrient content (table 6.1). The degree of modification of the thickening agents, however, was varied in the products to have a difference in their physical state: a liquid product, comparable with very thin custard, and a semi-solid product, comparable with firm pudding. The liquid product was flavoured with a lemon-aroma (Lemon Fla-vour JN-299-483-5; Givaudan SA Corp, Vernier, Switzerland), the semi-solid product with a meringue-aroma (Schuimgebak aroma DA53211, Givaudan SA Corp). A colouring agent (‘caramel’) was added to the semi-solid product to have the product appearance assumed to be congruent with flavour attributes (sulfiet-ammoniakkaramel E150d, ButterEssence BV, Zaandam); no colouring agents were added to the liquid product. It was observed that fla-vour did not affect expectations of these products (8).

87Repeatedconsumptionofiso-caloricdairyfoods
Table 6.1 Compositionandcharacteristicsoftheliquidandsemi-solidtestfoods:energy,macronu-
trientsaandenergypercentage;andratingsb(mean±SD)onpleasantness,familiarityand
sensorypropertiesonday1.
Liquid Semi-solid
Energy (kcal/kJ) 96/402 98/410Carbohydrates, g (% energy) 14.0 (59) 14.5 (60)Protein, g (% energy) 3.1 (13) 3.1 (13)Fat, g (% energy) 3.0 (28) 3.0 (27)
Pleasant 58 ± 22 55 ± 23Familiar c 36 ± 24 51 ± 25Thick c 15 ± 14 85 ± 13Sweet c 71 ± 19 64 ± 17Sour c 40 ± 25 14 ± 12Intensity of taste c 66 ± 14 55 ± 18
a Shown per 100 g. Values calculated from recipe provided by the producer.b Ratings were performed on a 100-unit VAS scale after one spoonful of the test food.c Mean ratings differ significantly between liquid and semi-solid products (p< 0.05). Differences persisted over all test days, except
for differences in familiarity ratings: these ratings increased over repeated consumption (F(1,376)=44.02, p<0.0001) and were not different on day 5.
The test foods were selected on the basis of a preceding experiment (8), in which 30 par-ticipants conducted a single measure of pleasantness and expected satiation of 8 milk-based custards different in flavour (lemon or meringue) and texture (4 different structures with increasing viscosity). The products chosen were different in expected satiety, but similar in liking. This was confirmed in the current experiment by ratings on expected satiety at first exposure (see results) and pleasantness (see table 6.1 and ‘test food characteristics’ below).
The test foods were served in transparent bowls (1 L content) that were taken from the refrigerator 30 minutes before consumption. On day 1 and 5, all participants were offered 1000 g of the test food and instructed to eat until they were pleasantly satiated. Before and after consumption, the bowl was weighed to obtain ad libitum intake. On day 2, 3, and 4, participants consumed a fixed amount of the test food. This amount provided 20% of the individual’s daily energy needs, estimated by means of the Schofield equation 1 (19), taking into account gender, age, weight and a physical activity level of 1.6. Calculated amounts were categorized per 25 g. Portions ranged from 400 to 575 g (average 468 ± 41 g) for women and from 550 to 650 g (average 594 ± 41 g) for men. Meal duration was measured daily, and used to calculate eating rate (g/min). Both products were consumed with a spoon.
Seven participants failed to consume the product in its entirety on day 2, of which 6 times in the semi-solid condition (leftovers: all <150 g). Two of these participants did also not consume the entire amount of semi-solid product on day 3 (leftovers: 54 g of 600 g served; and 83 g of 575 g). Appetite ratings after incomplete consumption were considered as miss-ing values.

88 Chapter6
TestfoodcharacteristicsPleasantness ratings were not different between the test foods on any of the test days. Famil-iarity ratings were lower for the liquid than for the semi-solid product on day 1 (p<0.0001) (table 6.1). Ratings increased over repeated consumption (p<0.0001) and were not different for the liquid and semi-solid product on day 5. The sensory profile showed that the semi-solid product was evaluated to be thicker than the liquid product (p<0.0001). The liquid product was evaluated to be sweeter (p=0.04), more sour (p<0.0001), and with a higher intensity of taste (p=0.001) (table 6.1). Overall, meal duration of the fixed amount was longer for the semi-solid (387 ± 140 sec) compared with the liquid products (295 ± 99 sec) (p<0.0001). Consequently, eating rate was higher for the liquid (114 ± 45 g/min) compared with the semi-solid product (88 ± 38 g/min) (p=0.0004). Eating rate changed over repeated consumption (F(1,52)=27.37; p<0.0001): for both products, eating rate was higher on day 5 than on day 1. Meal duration did not differ between day 1 and day 5.
MeasurementexpectedsatietyExpected satiety was measured using the ‘method of adjustment’ (based on Brunstrom et al. (20). During the measurement, the fixed amount of test food was physically present and assessed against 5 commonly consumed ‘comparison foods’. The comparison foods were spaghetti Bolognese, penne and tomato sauce, rice curry (chicken tikka masala), oven fries, and cheese and tomato pizza. Pictures of each comparison food were shown on the screen of a laptop. The order of appearance of these foods was randomized across participants, and the trial started with a different and randomly selected amount for each comparison food. Participants were then asked to taste a single spoonful of the test food and to 'indicate the amount of food on the picture that would be equally satiating as the bowl of dairy product in front of you'. The amount on the screen could easily be adjusted using the arrow keys on the keyboard. The amount of food on the pictures ranged from 209 kJ (50 kcal) to 5225 kJ (1250 kcal). A total of 51 pictures was used to display these amounts, with a portion of 1045 kJ (250 kcal) shown on picture number 25. Picture number 0 showed 0.2 times and picture number 50 displayed 5 times this amount.
ProceduresIn each test condition, participants came to the research centre on 5 consecutive days and consumed the test food for breakfast at 7.30 (n=24), 8.15 (n=19) or 9.00 (n=10). Participants were tested at the same time in isolated sensory cabins during all sessions.Participants were asked to refrain from eating starting 23.00 the day before each test day. Non-caloric beverages were allowed up to 1 hour before the test session. Participants were instructed not to eat anything for 3 hours after each test session.On arrival, participants rated their appetite sensations (hunger, fullness, desire to eat, prospective consumption) (t=0). Ratings were performed on a 100-mm vis-ual analogue scale (VAS), anchored ‘not at all’ to ‘extremely’. Participants then received the test food, consumed a single spoonful, and rated pleasantness, familiar-ity, and sensory properties (sweetness, sourness, intensity of taste, and thickness). On day 1, 2 and 5, expected satiety was measured immediately after these ratings. Participants consumed the test food and rated appetite sensations at regular time intervals: immediately after consumption and at 30, 60, 90, 120, and 180 min after the start of the

89Repeatedconsumptionofiso-caloricdairyfoods
session. For five participants (n=2 in liquid condition; n=3 in semi-solid condition), data on appetite sensations in the second test condition were not available due to lack of compli-ance with the procedures, and considered as missing values.
DataanalysisContinuous variables are presented as means (± SD) and categorical variables are presented as frequencies. Ratings on pleasantness, familiarity and sensory properties are reported as evaluated on day 1, and differences between the products were analysed by means of a paired t-test (unless otherwise specified). Differences in ad libitum intake and eating rate between product conditions, and before and after repeated consumption were also tested using paired t-tests. The selected amounts (in kJ) of the 5 comparison foods were averaged for each participant. This average represents the expected satiety, ie. the amount (in kJ) that is expected to be equally as filling as the fixed amount of the test food. Statistical analyses were conducted with log transformed data of the comparison foods to meet assumption of normality. For reasons of clarity, however, we converted the data into corresponding calories when mean values are presented. Expected satiety over time was tested by means of ANOVA (mixed model procedure) for an overall treatment (=product) effect, effect of repeated consumption (days) and their inter-action. Tukey’s ost hoc tests were used to test for differences between the products and test days. For all appetite sensations, total areas under the curve (AUC) from time points t=0 to t=180 were calculated (expand procedure, SAS). Differences in the AUCs between the liquid and semi-solid product were tested using ANOVA (mixed model procedure). The effect of repeated consumption and the product*repeated consumption interaction effect on AUCs were tested separately for day 2, 3, and 4 (consuming the fixed amounts) and day 1 and 5 (ad libitum consumption).Data were analysed using SAS (version 9.1; SAS Institute Inc.). Results at a p-value of <0.05 were considered significantly different.
Results
ExpectedsatietyThe semi-solid product was expected to be more satiating higher than the liquid product on all test days (F(1,51)=78.63; p<0.0001). Overall, expected satiety tended to increase over repeated consumption (F(1,258)=3.15; p=0.08). Post hoc tests showed that expected satiety of the semi-solid product remained unchanged (F(1,102)=0.94, p=0.33). The increase in expected satiety of the liquid product was borderline significant (F(1,63)=2.11, p=0.05). The product*repeated consumption interaction was not statistically significant (F(1,258)=0.28; p=0.59).
Ad libitumintakeAverage intake of the liquid product was higher compared with the semi-solid product on both day 1 (t=6.19; p<0.0001) and day 5 (t=5.64; p<0.0001) (figure 6.1). On day 5, ad libi-tum intake was significantly higher than on day 1 for both products (both p<0.01) (figure 6.1).

90 Chapter6
Figure 6.1 Intakeoftheliquidandsemi-solidproductwhenofferedad libitumbefore(day1)andafter
(day5)repeatedconsumptionofthefixedamountsoffoods.Thedottedlineindicatesthe
averageofthefixedamountsservedonday2,3and4(497±67g).
*Forbothproducts,intakeonday5washigherthanonday1(bothp<0.01).
#Onday1and5,intakeofliquidproductswashigherthanofsemi-solidproducts(p<.0001).
AppetitesensationsBaseline (t=0) ratings for hunger, fullness, desire to eat and prospective consumption did not differ between the product conditions or test sessions. After ad libitum intake, appetite sensations did not differ between liquid and semi-solid products (AUC not different), but ratings were lower for hunger, desire to eat and prospec-tive consumption (all p<0.0001) and higher for fullness (p=0.0002) on day 5 compared with day 1. AUC after consumption of the fixed amounts indicated that overall, the appetite response was stronger after the semi-solid product compared with the liquid product (product effect all appetite sensations: p<0.0001). We also observed a significant product*repeated con-sumption interaction for the AUCs of hunger (p=0.005; figure 6.2), fullness (p=0.04; figure 6.2) and desire to eat (p=0.008); and a borderline significant interaction for prospective consumption (p=0.06). Post hoc tests showed that the semi-solid product decreased hun-ger, desire to eat, and prospective consumption and increased fullness more than the liquid product on day 2 (all p<0.0001), but appetite sensations did not differ between the prod-ucts on day 4, except for fullness (p=0.03)
Discussion
The aim of this study was to investigate whether expected satiety and intake changed in response to repeated consumption of iso-energetic foods with different satiety expectations at baseline.

91Repeatedconsumptionofiso-caloricdairyfoods
Figure 6.2 Top:mean(±SEM)ratingsforhungeronday2,day3,andday4onsettimepointsupto
180minutesafterconsumptionofafixedamountofliquidproduct(--●--)andsemi-solid
product(—■—).
Below:mean(±SEM)ratingsforfullnessonday2,day3andday4onsettimepointsupto
180minutesafterconsumptionofafixedamountofliquidproduct(--●--)andsemi-solid
product(—■—).
Before repeated consumption (day 1), expected satiety of the semi-solid foods was higher than the expected satiety of the iso-energetic liquid foods; this was anticipated and con-sistent with the results of the preceding experiment with the same test foods (8). In line with these findings, ad libitum intake on day 1 was about 30% (100 g) higher for the liquid compared with the semi-solid product, while appetite sensations were similar. On day 2, participants reported a stronger satiety response after consumption of the fixed amount of semi-solid product compared with the liquid product. After repeated consumption, how-ever, appetite sensations were similar: the foods were perceived to be equally satiating on day 4. Still, expected satiety remained lower, and ad libitum intake higher for the liquid compared with the semi-solid product on day 5. Pleasantness is not likely to account for the differences in expectations or intake, since pleasantness ratings of both test foods were simi-lar. In addition, findings of our preceding experiment showed that flavour did not affect satiety expectations for these specific test foods (8). This suggests that the texture properties of the food remained important in these outcomes. Most of the single-meal studies to the effect of texture on appetite and satiety observed a weaker satiety response after consumption of liquid foods (9,10,21,22). Appetite sensations in the current study were initially were initially in line with these findings, possibly based on the differences in visual and oral cues of the products. An explanation for this weaker response may be that foods differing in their physical state are consumed at a different eat-ing rate (23) or evoke different metabolic effects (24-26). However, not all studies report different metabolic responses (27-29). The changes in appetite responses in the current

92 Chapter6
study these responses were initially based on the texture of the foods, i.e. on the differences in visual and oral cues. Only after repeated consumption, participants learned that these ‘anticipated’ sensations were not reflected in the post-ingestive effects of the iso-energetic liquid and semi-solid products. Changes in appetite sensations, however, may have been too subtle or too unconscious to be reflected in the cognitive or behavioural measures. Expected satiety and meal size did not change in the anticipated direction. Satiety beliefs based on life-long experiences with different texture stimuli may have limited the extent to which learning will result in behavioural changes (14,15). Participants may have relied on beliefs about sensory properties embedded in daily dietary behaviour; and not on the little awareness, if any, of changes in appetite responses. Intake may be based on habitual eating behaviour, with generalized beliefs and volume consumed as important determinants in this (30). Intake, however, was susceptible to change. We observed that several participants struggled to finish the fixed amount on day 2, but did not encounter this problem on day 4. Moreover, ad libitum intake increased after repeated consumption compared to baseline, which could be best explained by the increase in the eating rate over repeated consump-tion (31-33). In addition, it seemed that participants adjusted ad libitum intake to the fixed amounts they had been exposed to during the week. This implies that people get used to portions larger than their self-selected ideal portion sizes within several days. We assumed that satiety expectations contribute to decisions on portion size (6), but the increase in ad libitum was not preceded by profound changes in expected satiety. This suggests that this contribution may be only small or easily overruled, by e.g. food properties - especially when a single food is consumed during the eating occasion. Results from previous studies show that, in the view of texture properties, eating rate is also of great importance in ad libitum intake (11,32,33).
We conclude that participants learned about the foods’ satiating capacity: changes in appe-tite sensations over repeated consumption indicated that the fixed amounts of liquid and solid foods were perceived to be equally satiating. Learning did not result in the anticipated changes in satiety expectations or ad libitum intake. In addition, ad libitum intake increased over repeated consumption in the direction of the fixed portion size. Texture remained important in ad libitum intake and satiety expectations. These results show that decisions on meal size do not easily change, and that generalized beliefs about the food’s sensory properties remain of great importance in short-term intake. Sensory properties of a food, however, are not always congruent to its energy content. This may be of great use in further understanding of both short and longer term regulation of energy intake.
AcknowledgementsWe kindly thank Jeffrey Brunstrom for sharing with us his computer task, Natasja Hück for research assistance, and Hans Meijer for technical support.

93Repeatedconsumptionofiso-caloricdairyfoods
References
1 Zandstra EH, Stubenitsky K, De Graaf C, Mela DJ. Effects of learned flavour cues on short-term regulation of food intake in a realistic setting. Physiol Behav 2002; 75(1-2): 83-90.
2 Yeomans MR, Weinberg L, James S. Effects of palatability and learned satiety on energy density influences on breakfast intake in humans. Physiol Behav 2005; 86(4): 487-99.
3 Brunstrom JM. Associative learning and the control of human dietary behavior. Appetite 2007; 49(1): 268-271.4 Booth DA, Davis JD. Gastrointestinal factors in the acquisition of oral sensory control of satiation. Physiol Behav 1973;
11(1): 23-29.5 Booth DA, Grinker JA. Learned control of meal size in spontaneously obese and nonobese bonnet macaque monkeys.
Physiol Behav 1993; 53(1): 51-57.6 Brunstrom JM, Rogers PJ. How many calories are on our plate? Expected fullness, not liking, determines meal-size selec-
tion. Obesity 2009; 17(10): 1884-1890.7 Sorensen LB, Moller P, Flint A, Martens M, Raben A. Effect of sensory perception of foods on appetite and food intake:
a review of studies on humans. Int J Obes Relat Metab Disord 2003; 27(10): 1152-66.8 Hogenkamp PS, Stafleu A, Mars M, Brunstrom JM, de Graaf C. Texture, not flavor, determines expected satiation of
dairy products. Appetite 2011; 57(3): 635-641.9 Hulshof T, De Graaf C, Weststrate JA. The effects of preloads varying in physical state and fat content on satiety and
energy intake. Appetite 1993; 21(3): 273-86.10 Mattes RD, Rothacker D. Beverage viscosity is inversely related to postprandial hunger in humans. Physiol Behav 2001;
74(4-5): 551-7.11 Zijlstra N, Mars M, de Wijk RA, Westerterp-Plantenga MS, de Graaf C. The effect of viscosity on ad libitum food
intake. Int J Obes 2008; 32(4): 676-83.12 Mars M, Hogenkamp PS, Gosses AM, Stafleu A, De Graaf C. Effect of viscosity on learned satiation. Physiol Behav
2009; 98(1-2): 60-66.13 Hogenkamp PS, Mars M, Stafleu A, de Graaf C. Intake during repeated exposure to low- and high-energy-dense yogurts
by different means of consumption. Am J Clin Nutr 2010; 91(4): 841-847.14 O’Sullivan HL, Alexander E, Ferriday D, Brunstrom JM. Effects of repeated exposure on liking for a reduced-energy-
dense food. Am J Clin Nutr 2010; 91(6): 1584-1589.15 Hogenkamp PS, Brunstrom JM, Stafleu A, Mars M, de Graaf C. Expected satiation after repeated consumption of
low- or high-energy-dense soup. Br J Nutr 2011.16 Swithers SE, Davidson TL. A role for sweet taste: Calorie predictive relations in energy regulation by rats. Behav Neu-
rosci 2008; 122(1): 161-173.17 Wansink B, Ittersum K, Painter JE. How diet and health labels influence taste and satiation. J Food Sci 2004; 69(9):
S340-S346.18 Van Strien T. Nederlandse Vragenlijst voor Eetgedrag (NVE). Handleiding [Dutch Eating Behaviour Questionnaire.
Manual], Boom Test Publishers: Amsterdam, the Netherlands, 2005.19 WHO. Estimates of energy and protein requirements of adults and children. In: Energy and protein requirements.
Report of a Joint FAO/WHO/UNU Expert consultation, 2 edn. World Health Organization: Geneva, 1985, pp 71-112.
20 Brunstrom JM, Shakeshaft NG, Scott-Samuel NE. Measuring ‘expected satiety’ in a range of common foods using a method of constant stimuli. Appetite 2008; 51(3): 604-14.
21 Bolton RP, Heaton KW, Burroughs LF. The role of dietary fiber in satiety, glucose, and insulin: studies with fruit and fruit juice. Am J Clin Nutr 1981; 34(2): 211-7.
22 De Graaf C, Hulshof T. Effects of Weight and Energy Content of Preloads on Subsequent Appetite and Food Intake. Appetite 1996; 26(2): 139-152.
23 Kokkinos A, le Roux CW, Alexiadou K, Tentolouris N, Vincent RP, Kyriaki D et al. Eating slowly increases the post-prandial response of the anorexigenic gut hormones, peptide YY and glucagon-like peptide-1. J Clin Endocrinol Metab 2010; 95(1): 333-337.
24 Marciani L, Gowland PA, Spiller RC, Manoj P, Moore RJ, Young P et al. Gastric response to increased meal viscosity assessed by echo-planar magnetic resonance imaging in humans. J Nutr 2000; 130(1): 122-7.
25 Peracchi M, Santangelo A, Conte D, Fraquelli M, Tagliabue R, Gebbia C et al. The physical state of a meal affects hormone release and postprandial thermogenesis. Br J Nutr 2000; 83(6): 623-8.
26 Meyer JH. Gastric emptying of ordinary food: effect of antrum on particle size. Am J Physiol 1980; 239(3): G133-5.27 Karl JP, Young AJ, Montain SJ. Eating rate during a fixed-portion meal does not affect postprandial appetite and gut
peptides or energy intake during a subsequent meal. Physiol Behav 2011; 102(5): 524-531.
94 Chapter6
28 Zijlstra N, Mars M, de Wijk RA, Westerterp-Plantenga MS, Holst JJ, de Graaf C. Effect of viscosity on appetite and gastro-intestinal hormones. Physiol Behav 2009; 97(1): 68-75.
29 Martens MJI, Lemmens SGT, Born JM, Westerterp-Plantenga MS. A solid high-protein meal evokes stronger hunger suppression than a liquefied high-protein meal. Obesity 2011; 19(3): 522-527.
30 Bell EA, Roe LS, Rolls BJ. Sensory-specific satiety is affected more by volume than by energy content of a liquid food. Physiol Behav 2003; 78(4-5): 593-600.
31 Smit HJ, Kemsley EK, Tapp HS, Henry CJK. Does prolonged chewing reduce food intake? Fletcherism revisited. Appe-tite 2011; 57(1): 295-298.
32 Martin CK, Anton SD, Walden H, Arnett C, Greenway FL, Williamson DA. Slower eating rate reduces the food intake of men, but not women: implications for behavioral weight control. Behav Res Ther 2007; 45(10): 2349-59.
33 Andrade AM, Greene GW, Melanson KJ. Eating slowly led to decreases in energy intake within meals in healthy women. J Am Diet Assoc 2008; 108(7): 1186-91.

Chapter 7Learning about the energy density
of liquid and semi-solid foods
Pleunie Hogenkamp
Annette Stafleu
Monica Mars
Kees de Graaf
International Journal of Obesity, accepted for publication

96 Chapter7
Abstract
People learn about a food’s satiating capacity by exposure, and consequently adjust energy intake. The aim of this study was to investigate the effect of energy density and texture on subsequent energy intake adjustments during repeated consumption.In a randomized cross-over design, participants (n=27, age: 21 ± 2.4 y, BMI: 22.2 ± 1.6 kg/m²) repeatedly consumed highly novel foods that were either low-energy-dense (LE: 30 kcal/100 g) or high-energy-dense (HE: 130 kcal/100 g), and either liquid or semi-solid, resulting in 4 product conditions. In each condition, a fixed portion of test food was con-sumed 9 times as an obligatory part of breakfast, lunch, dinner on 3 consecutive days. All meals continued with an ad libitum buffet, and food items for evening consumption were provided. Intake (kcal/day) was measured.Buffet intake depended on energy density and day of consumption of the test foods (day*energy interaction: p=0.02): daily buffet intake increased from day 1 (1745 ± 577 kcal) to day 3 (1979 ± 567 kcal) in the LE conditions; intake did not change in the HE conditions (day 1: 1523 ± 429 kcal, day 3: 1589 ± 424 kcal). Food texture did not affect intake (p=0.56).Intake did depend on energy density of the test foods: participants increased their buffet intake over days in response to learning about the satiating capacity of the low-energy-dense foods, but did not change buffet intake over days when repeatedly consuming a high-energy-dense food as part of their meal. The adjustments in intake were made irrespective of food texture.

97Learningaboutenergydensityindifferenttextures
Introduction
The amount of food consumed is largely based on previous experiences with the specific food items. It is assumed that people learn about the energy density of a food by exposure, and link the post-ingestive effects to the food’s properties (1). This association enables peo-ple to predict the satiating capacity of foods (2,3) and to select an appropriate meal size. Studies that investigated intake adjustments in response to repeated consumption of low- or high-energy-dense foods, however, show inconsistent results, (e.g. 4-6 vs. 7-9). When intake is not adjusted adequately, energy intake increases with increasing energy density (10). In view of the prevention of overconsumption, it is of interest to better understand the elements that play a role in energy intake adjustment.
Intake also depends on factors other than energy density, like food texture. It has been shown that liquids produce lower satiety sensations (11,12) and a weaker compensation of energy intake throughout the day (13) compared with iso-caloric solid foods, and that ad libitum intake of a liquid food may be up to 30% higher compared with a semi-solid food with similar energy content and palatability (14). Moreover, we observed a higher ad libi-tum intake of liquid foods after repeated consumption irrespective of energy density (15,16).
This may suggest that the texture of a food is more important than its energy density in self-selected meal size. In these studies, however, we served the test foods as a single-item meal, therewith eliminating possible changes in intake from other items during this eating occa-sion. Moreover, we did not assess intake during the rest of the day (15,16). Accurate adjust-ments in response to changed intake or energy manipulations may be limited (e.g. 17,18), but individuals might use different strategies to guide their intake, and regulate energy intake on a daily base or on day-to-day base (19).To investigate the role of texture in energy intake adjustments, we assessed daily energy intake when repeatedly consuming low- and high-energy-dense test foods with different texture. Test foods were highly novel, and served as a fixed part of all meal occasions on 3 consecutive days. All meals continued with an ad libitum buffet, and intake was measured.
Methods
DesignIn a randomized cross-over design, participants repeatedly consumed highly novel foods that were different in energy density (low or high) and texture (liquid or semi-solid), result-ing in four product conditions. In each condition, participants consumed the same product nine times - a fixed amount was served as obligatory part of breakfast, lunch and dinner on 3 consecutive days. All meals continued with free choice from a buffet, with a variety of food items offered ad libitum. Food intake was measured during all meal occasions. Participants were instructed to abstain from eating between breakfast and lunch and between lunch and dinner. We provided fruit, ginger bread and currant buns or nut bread for consumption after dinner. Leftovers were recorded to calculate food intake.

98 Chapter7
On the fourth day, after the nine exposures, the test food was served ad libitum for break-fast and intake was measured. This procedure was repeated for all four conditions, which were scheduled in consecutive weeks. The order of conditions was randomized within and balanced between participants.
ParticipantsHealthy, young adults (aged 18 to 35 years) with normal weight (BMI: 18.5-25.0 kg/m²) used to eat breakfast regularly (≥ 5 times/wk) were recruited from Wageningen and the sur-roundings. Exclusion criteria were: restrained eating (restraint scores based on the Dutch Eating Behaviour Questionnaire (DEBQ) (20): men > 2.25, women score > 2.80), lack of appetite, following an energy-restricted diet or change in body weight > 5 kg during the last 2 months, stomach or bowel diseases, diabetes, thyroid disease or any other endocrine disorder, hypersensitivity for the ingredients of the foods under study, smoking, and being a vegetarian. Twenty-seven participants (M/F: 9/18, age: 21 ± 2.4 y, BMI: 22.2 ± 1.6 kg/m², restraint score: M: 1.6 ± 0.3/F: 2.1 ± 0.5 on the DEBQ (20) completed all conditions. Initially, 38 participants were enrolled in the study. On the first day, 9 participants withdrew because of aversion to the test foods. These participants were equally distributed over the product conditions. Two participants withdrew from the study because of personal reasons and lack of compliance.Participants gave their written informed consent before the study. They were unaware of the exact aim of the study; they were informed that we investigated ‘pleasantness and acceptance of supplementary meal items in our daily food pattern’. After completion of the study, participants were debriefed and received financial compensation. The study was approved by the Medical Ethical Committee of Wageningen University (NL34062.081.10) and registered with the Dutch trial registration (NTR 2574).
TestfoodsTest foods were especially developed for this study (NIZO food research BV, Ede). Liquid and semi-solid foods were produced in two energy densities: low (LE: 30 kcal/100 g) and high (HE: 130 kcal/100 g). The basic ingredients of the foods were gelatin, starch and oil. Energy density of the HE foods was increased by addition of sunflower oil, gelatin and starch, so that the proportion of energy provided by the different macronutrients was similar to the LE foods. The differences in viscosity were achieved by using different types of starch (table 7.1). The foods were highly novel with respect to its sensory characteristics; we assumed that this would limit existence of learned associations with the energy content. Table 7.2 provides a description of the test foods obtained from an independent consumer panel. Distinctive flavouring and colouring agents were added to the foods, to further increase novelty. Foods were flavoured with either a ‘pandan rice’ aroma in combination with a green colour (Koepoe Koepoe); with ‘spicy orange’ aroma (De Lange) and orange colour-ing (Chr. Hansen); with ‘rose apple’ aroma (Givaudan SA Corp., Vernier, Switzerland) and yellow colouring (Chr. Hansen); and ‘fenugreek’ aroma (Het Blauwe Huis) with camine (pink) colouring (Chr. Hansen). Flavour-colour combinations were randomly assigned to the 4 test products, under the condition that they were equally distributed. All participants received each of the flavour-colour combinations once.

99Learningaboutenergydensityindifferenttextures
The fixed amount of the HE foods provided 50% of the individual’s daily estimated energy needs per day, i.e. 16.7% per meal occasion. Energy needs were estimated by means of the Schofield equation 1 (21), taking into account gender, age, and weight, and a physical activ-ity level of 1.6. The fixed amount of the LE foods was identical in weight and volume, and provided 12% of daily energy needs, i.e. 3.9% per meal occasion. The fixed amounts ranged from 273 to 330 g for women, and from 354 to 418 g for men. A 330 g portion, for example, provided 99 kcal/meal and 296 kcal/day in the LE conditions, and 427 kcal/meal and 1281 kcal/day in the HE conditions. Test foods were served in non-transparent plastic cups (500 mL content).On day 4, the test food was served ad libitum. We served 1000 g in large plastic cups (1 L content) and participants were instructed to eat until pleasantly satiated. The intake was measured. The semi-solid foods were consumed with a spoon; the liquid foods were consumed directly from the cup.
BuffetintakeFood items appropriate for the meal occasion were served in buffet style, and were con-sumed in a realistic meal setting in the dining room of the research center. We served bread, sandwich fillings, and fruit at breakfast and dinner; and a hot meal and fruit salad at lunch. To measure intake and not food choice, the number of food items, i.e. variety, was lim-ited at the buffet, but items were offered ad libitum. Participants could return to the buf-fet as often as they liked, and they did not have to empty their plates. Selected foods were weighed or counted, and leftovers were taken into account in intake calculations.
Low energy High energy liquid semi-solid liquid semi-solid
Energy (kcal/kJ) 30/125 30/125 130/543 130/543Carbohydrates, g (en% ) 0.75 (10) 0.75 (10) 3.25 (10) 3.25 (10)Protein, g (en% ) 4.5 (60) 4.5 (60) 19.5 (60) 19.5 (60)Fat, g (en%) 1 (30) 1 (30) 4.33 (30) 4.33 (30)Eating rate, mean (SD) 448 (386) 93 (53) 491 (576) 71 (41)
Ingredients (g/100g)Starch (various types) 4.4 4.1 19.5 19.49Guar 0.1 0.1 - -+ alginate (agar) - 0.3 - -Gelatin 0.8 0.8 3.25 3.25Sunflower oil 1.00 1.00 4.33 4.33Aspartame 0.36 0.36 0.18 0.36Food acid 0.14 0.14 0.85 0.85Water b 93.2 93.2 71.9 71.7
a Eating rate was assessed by 10 subjects (M/F: 2/8, age: 39 ± 11 y, BMI: 22.1 ± 2.6 kg/m²) different from the participants in the cur-rent study. These subjects consumed 200 g of the 4 test foods on separate occasions (just before lunch or dinner), and recorded consumption time.
b Small amounts of colouring and flavouring agents (< 0.15 g) were exchanged with water.
Table 7.1 Energy,macronutrientcomposition(per100g)andenergypercentage(en%),eatingrate
(g/min)aandingredientsofthelow-andhigh-energy-denseliquidandsemi-solidtestfoods

100 Chapter7
The buffet at breakfast and dinner (table 7.3) consisted of mini buns, low-fat margarine and four sandwich fillings: one cheese filling (we provided either Gouda 48+ or cheese spread 45+), one meat filling (ham or liver sausage), one ‘chocolate’ filling (sprinkles, flakes, or spread), and one ‘other’ sweet filling (jam, fruit sprinkles, or apple spread); and 2 types of fruit (apple, pear, kiwi or banana). Fillings and fruit were supplied on a rotating base over the days, with identical fillings at breakfast and dinner within one day. The hot meal at lunch consisted of 3 meal items: vegetables, pieces of meat that were pre-mixed with sauce, and either pasta, potatoes or rice. To prevent boredom, 6 different dishes were prepared for week 1 and 2, and were repeated in week 3 and 4 (table 7.3). On all days, fruit salad was available at the lunch buffet as a ‘dessert’. Liquid and semi-solid foods were limited at the buffet: we did not provide juices, milk, yogurt or custards, and only 50 g sauce was added to every 200 g meat. To prevent the par-ticipants from consuming amounts similar to those consumed habitually, plates larger than regular dinner plates were used and foods were provided in unusual portion sizes (table 7.3).
After dinner, we provided food items to take home for evening consumption: three pieces of one type of fruit (that had been available at the buffet that day), five slices of gingerbread, and either four currant buns or nut bread on a rotating base.
Low energy High energy liquid semi-solid liquid semi-solid
Pleasant b,c 3.9 ± 2.1 a 2.7 ± 1.3 b 2.5 ± 1.5 b 3.1 ± 1.8 a,b
Familiar b 2.6 ± 1.7 2.6 ± 1.9 2.5 ± 1.7 2.6 ± 2.1Thick c 11 ± 15 a 67 ± 19 b 15 ± 20 a 90 ± 12 c
Creamy c 23 ± 25 a 57 ± 28 b 33 ± 28 c 58 ± 28 b
Smooth 75 ± 28 74 ± 22 68 ± 31 66 ± 29Firm c 10 ± 18 a 64 ± 21 b 12 ± 19 a 87 ± 17 c
Fatty c 27 ± 29 a 47 ± 27 b 28 ± 29 a 55 ± 32 b
Jelly c 10 ± 14 a 71 ± 24 b 15 ± 20 a 76 ± 25 b
Intenstiy of smell c 63 ± 27 a 50 ± 27 b 64 ± 25 a 46 ± 30 b
Sweet smell 44 ± 29 47 ± 29 36 ± 29 44 ± 30Sweet taste c 63 ± 24 a 43 ± 28 b 51 ± 29 c 53 ± 28 c
Sour taste c 26 ± 26 a 34 ± 26 a 49 ± 28 b 48 ± 29 b
Intensity of taste c 66 ± 23 a 59 ± 24 b 70 ± 20 a 69 ± 20 a
Intensity of after taste c 42 ± 28 a 44 ± 26 a 54 ± 27 b 58 ± 26 b
a The consumer panel included different subjects than those from the current study (n=20; M/F: 2/18, age: 22 ± 2.3 y, BMI: 20.8 ± 2.4 kg/m², restraint score (DEBQ): 2.7 ± 0.7). Sensory properties were rated on a 100-unit VAS anchored ‘not at all’ to ‘extremely’.
b Ratings of day 1, made by participants of the current study (n=27) on a 10-point scare anchored ‘not at all’ to ‘extremely’. Ratings increased over repeated exposure (average on day 4: pleasantness 3.9 ± 2.1, familiarity 6.5 ± 3.4). This increase was irrespective of texture or energy density of the test foods.
c Mean ratings followed by different letters differ significantly (p<0.05).Ratings on the intensity and sweetness of smell, and intensity and sweetness of taste were slightly higher for the spicy orange-
flavoured foods compared with the other flavours used in the design. These differences were independent of energy density or texture. No other differences between flavours were observed (data not shown).
Table 7.2 Ratingsonpleasantness,familiarity,andsensoryproperties(unitsonVAS,mean±SD)ofthe
low-andhigh-energy-denseliquidandsemi-solidtestfoodsasperformedbytheconsumer
panel(n=20)a

101Learningaboutenergydensityindifferenttextures
a During breakfast and dinner, 4 types of sandwich fillings (one of each category) were provided on a rotating base. b Two types of fruit were selected from the items listed, and were all provided per piece.c All meal items of the hot dishes were provided on request. Meat components were served in pieces pre-mixed with the sauce. The 6 different dishes were prepared for week 1 and 2, and repeated in week 3 and 4.
Table 7.3 Nutritionalcomposition(kcal/100g)andportionsizeofthefoodsprovidedatthe
ad libitum buffet
Meal items breakfast/dinner kcal/100 g portion (g) Meal items hot lunch c kcal/100 g
Bread rolls (white and wheat) 246 22 Dish 1Low-fat margarine 363 50 Pork steak in sauce chasseur 139 Ratatouille 16Cheese fillings a Pasta, whole-wheat 126Gouda 48+ 376 ± 80 (4 slices)Cheese spread 45+ 245 50 Dish 2 Chicken breast in curry sauce 138Meat fillings a Mixed Chinese vegetables 27Ham 130 ± 72 (4 slices) Rice, boiled 147Liver sausage 322 50 Dish 3Chocolate fillings a Minced meat with white sauce 195Chocolate sprinkles 410 150 Broccoli 24Chocolate spread 530 150 Potatoes, boiled 76Chocolate flakes 420 150 Dish 4Other sweet fillings a Minced meat with tomato sauce 195Sprinkles, fruit-flavoured 395 150 Mixed Italian vegetables 17Jam, cherry or apricot 254 150 Pasta, whole-wheat 126Apple spread 295 150 Dish 5Fruit b Pork steak in pangang sauce 156Apple 50 ±120 (per piece) Mexican vegetables 68Pear 60 ±120 (per piece) Rice, boiled 147Kiwi 40 ± 75 (per piece) Banana 88 ±150 (per piece) Dish 6 Chicken breast in sour cream sauce 142Food items evening Spinach 26Ginger bread 30 100 (5*20g) Potatoes, boiled 76Currant buns 268 200 (4*50g) Nut bread 280 232 (4*58g) All days (‘dessert’) Fruit salad 63
Consumption of water, tea, and coffee was allowed during the day. Participants could add milk and/or sugar when used to do so. Only four participants used this opportunity; their milk and sugar intake was added to intake in the preceding meal occasion.
AppetitesensationsandpleasantnessParticipants came to the research centre for breakfast (between 7.30 and 8.30), lunch (between 12.00 and 13.15) and dinner (between 17.30 and 18.00). Participants were instructed to abstain from eating between breakfast and lunch, and between lunch and dinner. We provided food items for the evening, but participants were instructed to refrain from eating after 23.00 on the evening before each test day.

102 Chapter7
On arrival, participants rated their appetite sensations (hunger, fullness, desire to eat, pro-spective consumption) and thirst. Participants consumed the fixed amount of test food, rated appetite sensations, and continued their meal immediately with free choice from the buffet. Upon finishing their meal, participants again rated appetite sensations, and pleas-antness of the buffet. Pleasantness of the test food was rated once every test day, based on the first single mouthful at breakfast. All ratings were performed on a 10-point scale anchored ‘not at all’ to ‘extremely’, using a personal digital assistant (HP iPAQ), with software of EyeQuestion (version 3.8.3., Logic8 BV, Elst, the Netherlands).
Bodyweight,familiarityandexpectedsatiationBody weight was measured before and after repeated consumption of the test foods, i.e. on arrival at the research centre for breakfast on day 1 and day 4. Participants assessed both familiarity and expected satiation of the test foods before break-fast on day 1 and day 4. Familiarity ratings were performed on a 10-point scale anchored ‘not at all’ to ‘extremely’. Expected satiation was measured using the ‘method of adjust-ment’ (based on Brunstrom et al. (22). The cup with the fixed amount of test food was assessed against pictures of 5 commonly consumed ‘comparison foods’ that were shown on a laptop: spaghetti Bolognese, penne and tomato sauce, rice curry (chicken tikka masala), oven fries, and cheese and tomato pizza. After a single mouthful of the test food, partici-pants were asked to ‘indicate the amount of food on the picture that would be equally as satiating as the cup of food in front of you’, using the arrow keys on the keyboard. The amount that could be displayed ranged from 50 kcal to 1250 kcal. A total of 51 pictures was used to display these amounts. Picture number 25 displayed a 250 kcal portion. Picture number 0 displayed 0.2 times and picture number 50 displayed 5 times this amount. The order of appearance of these foods was randomized across participants, and the trial started with a different and randomly selected amount for each comparison food.After the measurement of expected satiation, participants continued with the fixed amount of test food and the breakfast buffet on day 1. On day 4, the test foods were served ad libi-tum for breakfast. There were no other measurements on day 4, or on days 5, 6 and 7. Par-ticipants returned the consecutive week.
DataanalysisContinuous variables are presented as means (± SD) and categorical variables are presented as frequencies, unless otherwise indicated.Daily energy intake (kcal/day), i.e. the intake from the buffet and the food items provided in the evening, was tested by means of ANOVA (mixed model procedure) for effects of tex-ture, energy density, repeated consumption (days), with their interaction tested in the same model. Tukey’s post hoc tests were used to test for differences between product conditions or days. We also tested for effects of texture, energy density, and repeated consumption (days) on energy intake at the different meal occasions. When pleasantness ratings of the buffet of one meal occasion differed between days, we corrected for pleasantness by adding this fac-tor as a covariate to the ANOVA models.The effects of texture, energy density and repeated consumption (days) on appetite sensa-tions (hunger, desire to eat, prospective consumption, fullness) and thirst were tested for
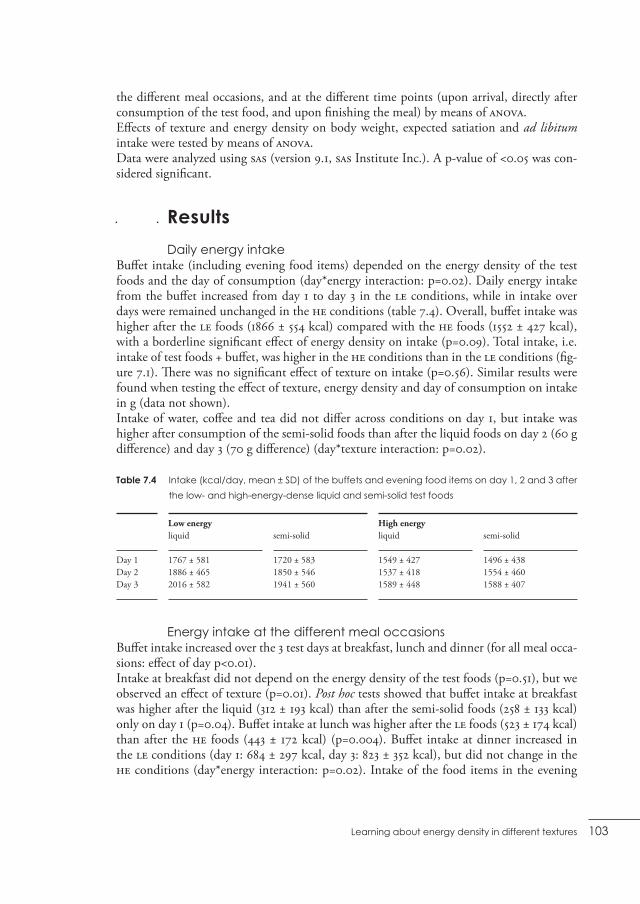
103Learningaboutenergydensityindifferenttextures
the different meal occasions, and at the different time points (upon arrival, directly after consumption of the test food, and upon finishing the meal) by means of ANOVA.Effects of texture and energy density on body weight, expected satiation and ad libitum intake were tested by means of ANOVA.Data were analyzed using SAS (version 9.1, SAS Institute Inc.). A p-value of <0.05 was con-sidered significant.
Results
DailyenergyintakeBuffet intake (including evening food items) depended on the energy density of the test foods and the day of consumption (day*energy interaction: p=0.02). Daily energy intake from the buffet increased from day 1 to day 3 in the LE conditions, while in intake over days were remained unchanged in the HE conditions (table 7.4). Overall, buffet intake was higher after the LE foods (1866 ± 554 kcal) compared with the HE foods (1552 ± 427 kcal), with a borderline significant effect of energy density on intake (p=0.09). Total intake, i.e. intake of test foods + buffet, was higher in the HE conditions than in the LE conditions (fig-ure 7.1). There was no significant effect of texture on intake (p=0.56). Similar results were found when testing the effect of texture, energy density and day of consumption on intake in g (data not shown). Intake of water, coffee and tea did not differ across conditions on day 1, but intake was higher after consumption of the semi-solid foods than after the liquid foods on day 2 (60 g difference) and day 3 (70 g difference) (day*texture interaction: p=0.02).
Table 7.4 Intake(kcal/day,mean±SD)ofthebuffetsandeveningfooditemsonday1,2and3after
thelow-andhigh-energy-denseliquidandsemi-solidtestfoods
Low energy High energy liquid semi-solid liquid semi-solid
Day 1 1767 ± 581 1720 ± 583 1549 ± 427 1496 ± 438Day 2 1886 ± 465 1850 ± 546 1537 ± 418 1554 ± 460Day 3 2016 ± 582 1941 ± 560 1589 ± 448 1588 ± 407
EnergyintakeatthedifferentmealoccasionsBuffet intake increased over the 3 test days at breakfast, lunch and dinner (for all meal occa-sions: effect of day p<0.01). Intake at breakfast did not depend on the energy density of the test foods (p=0.51), but we observed an effect of texture (p=0.01). Post hoc tests showed that buffet intake at breakfast was higher after the liquid (312 ± 193 kcal) than after the semi-solid foods (258 ± 133 kcal) only on day 1 (p=0.04). Buffet intake at lunch was higher after the LE foods (523 ± 174 kcal) than after the HE foods (443 ± 172 kcal) (p=0.004). Buffet intake at dinner increased in the LE conditions (day 1: 684 ± 297 kcal, day 3: 823 ± 352 kcal), but did not change in the HE conditions (day*energy interaction: p=0.02). Intake of the food items in the evening

104 Chapter7
decreased in the HE conditions (day 1: 326 ± 178 kcal, day 3: 227 ± 140 kcal), but did not change in the LE conditions (day*energy interaction: p=0.03). We observed small differences in pleasantness ratings between the dishes served at lunch. Correction for pleasantness did not alter the effect of energy density on buffet intake at lunch (p=0.005). Pleasantness ratings for breakfast or dinner were not different across days.
Figure 7.1 Totalintake(kcal/day)onday1,2,and3inthelow-energy-denseandhigh-energy-dense
conditions.Totalintake=fixedamountoftestfood(whitebars)+ad libitumbuffetintake
(mean±SE,blackbars).
AppetiteratingsIn general, participants had greater appetite (higher ratings for hunger, desire to eat, pro-spective consumption and lower ratings for fullness) on day 2 and 3 than on day 1. Also, appetite ratings were higher before lunch and dinner than before breakfast (data not shown). On arrival for every meal, ratings did not differ across conditions for any of the appetite sensations (all p>0.05).Participants experienced greater appetite and less thirst immediately after consumption of the liquid foods when compared with the semi-solid foods (all p<0.001). The differences in energy density of the foods did not affect the ratings on appetite sensations immediately after consumption, except for thirst ratings that were higher after the HE foods compared with the LE foods (p<0.001). Flavour of the test foods did not affect appetite sensations (all p>0.05). Appetite sensations after buffet intake did not depend on the energy density or texture of the test foods, except for fullness ratings that were higher after the meals that included semi-solid foods compared with liquid foods (p=0.04).
ExpectedsatiationOn day 1, the semi-solid foods were expected to be more satiating than the liquid foods (p<.0001), and we observed no effect of energy density on expected satiation (p=0.49). Sati-

105Learningaboutenergydensityindifferenttextures
ety expectations changed over repeated consumption (p=0.0002). On day 4, the semi-solid foods were still expected to be more satiating than the liquid foods (p=0.003), and also, the HE foods were expected to be more satiating than the LE foods (p=0.01). No interaction was observed between texture and energy density (p=0.55) (figure 7.2).Ratings on familiarity and pleasantness increased over repeated consumption (both p<0.0001, familiarity from 2.6 to 6.5 and pleasantness from 3.3 to 3.9 on a 10-point scale), irrespective of texture or energy density of the test foods.
Figure 7.2 Expectedsatiation(kcal,mean±SE)ofthetestfoodsbefore(day1,whitebars)andafter
(day 4, black bars) repeated consumption of the low-energy-dense and high-energy-
densetestfoods,bothliquidandsemi-solid.
Ad libitumintakeAd libitum intake of the test foods on day 4 was 439 ± 274 g for the liquid LE foods; 365 ± 224 g of the liquid HE foods; 308 ± 261 g of the semi-solid LE foods; and 261 ± 196 g of the semi-solid HE foods. On average, intake of the liquid foods was higher when compared with the semi-solid foods (p<0.0001), and intake of the LE foods higher when compared with the HE foods (p=0.01). We did not observe a significant texture*energy interaction effect on intake (p=0.52).
BodyweightBody weight decreased when consuming LE foods (-0.4 ± 0.9 kg) (p=0.05) and remained stable in the HE conditions.

106 Chapter7
Discussion
The aim of the current study was to investigate the effect of energy density and texture on energy intake adjustments when repeatedly consuming low- and high-energy-dense foods with different texture. Buffet intake increased over days when repeatedly consuming the low-energy-dense test foods, irrespective of the food’s texture. Participants did not adjust intake after repeated consumption of the high-energy-dense foods. Intake increased over days in the low-energy conditions, but total energy intake remained lower in comparison with the high-energy conditions. These results confirm that consumption of low-energy-dense foods results in a lower daily energy intake when compared to consumption of high-energy-dense foods (10,23,24). What is more, our findings indicate that participants learned about the satiating capacity of the low-energy-dense foods after repeated consumption: they did not persist consum-ing a consistent weight of foods across conditions of energy density (25), but up-regulated energy intake in the low-energy conditions.
We assumed energy intake to be susceptible to change, since beliefs about the satiating capacity of the novel test foods would not be strongly based on previous experiences (26). Familiarity ratings indicated that the test foods were perceived as novel, being very low at the start of each condition and increasing greatly over repeated consumption. Moreover, we frequently served a substantial amount of test food and therewith created a large difference in energy intake: the low- and high-energy-dense foods provided 12% and 50% of the daily energy requirements, respectively. Consequently, experimental conditions were optimal for energy learning to occur, but we observed intake adjustments in the low-energy conditions only. This may be best explained by the finding that human may adjust for ‘missing’ energy relatively easy (27), while they may have a weak ability to regulate energy intake in response to a ‘surplus’ of energy appropriately (17,28). We assumed that the healthy, young participants in our studies were in energy balance at baseline. Changes in intake and weight were observed in the low-energy condition, sug-gesting that the energy balance was not largely challenged in the high-energy conditions on the 3 consecutive days. Supplementation of the high-energy-dense foods in repetitive meal occasions may have resulted in pleasant feelings of satiety, rather than in a ‘surplus’ of energy. The need for adjustments may therefore be low. The energy density of these test foods was relatively low compared with commercially available foods. This may have resulted in unpleasant sensations of hunger, and in physiological signals that triggered energy intake.
These findings cannot automatically be generalized to other settings or individuals. Results suggest that the average intake of 2850 kcal/day in the high-energy-dense conditions (while the calculated energy requirement was 2560 kcal/day) did result in adjustments in intake of lean individuals on the 3 consecutive days. This was observed under controlled condi-tions: subjects had no access to high-energy-dense ‘snack’ foods other than the test foods, and abstained from eating between the meals. Conditions for optimal intake adjustments may be limited in daily practice. The energy density levels of commercial foods may be higher than of the test foods and the physiological needs for energy lower – and the con-stant abundance of foods may contribute to passive overconsumption (29). It has been

107Learningaboutenergydensityindifferenttextures
calculated that only a small daily energy imbalance affects body weight on the long term (30). Availability of high-energy-dense foods and limited/inadequate intake compensa-tion and may thus be important determinants of the current obesity epidemic. We also do not expect older individuals (27) or overweight (31,32) or obese subjects (33) to adjust intake more adequately in response to energy manipulation of their diet. It is suggested that e.g. obese subjects may rely on external signals such as visual food cues to regulate their food intake (33), therewith limiting the adequate intake in response to physi-ological signals.
The appetite ratings showed that participants did not experience more hunger in the low-energy conditions, suggesting that participants anticipated the interval to the next eating occasion and up regulated their intake accordingly. On the other hand, appetite ratings in both energy conditions may be similar due to demand effects, i.e. feeling hungry at the start of a meal irrespective of the energy condition. Considering this, it can be questioned whether the participants just responded to feelings of hunger (34) resulting from the con-sumption of low-energy-dense foods, or whether they learned about the energy density of the novel test foods and anticipated their intake accordingly.The expected satiation measures confirm that the awareness of the foods’ energy density changed over repeated consumption. The high-energy-dense foods were expected to be more satiating than the low-energy-dense foods on day 4, while energy density did not affect expectations at first exposure. The ad libitum intake did also depend on the energy density of the test foods, with a higher intake of the test foods in the low-energy conditions.Food texture remained also very important in these measures of ad libitum intake (14) and expected satiation (35). Texture indeed affected satiation: intake of the liquid foods was higher when compared with the semi-solid foods when offered ad libitum after repeated consumption. From the weaker satiety responses immediately after consumption of the liquid test foods, one may also have expected a larger buffet intake in the liquid conditions when compared to the semi-solid conditions (11,12,14). The physical state of the test foods did however not affect energy intake from the buffet, except for the very first exposure.
These results suggest that the effect of texture on intake may be especially important when consuming a single food item only, i.e. in satiation. Meal termination in these occasions may largely depend on the eating rate and oral sensory exposure to a food (14,36), and the effect of texture on ad libitum intake may be larger than the effect of learning about the food’s satiating capacity. When people had access to a large array of food items within one eating occasion, however, the amount eaten depended on the energy density of the test food, irrespective of its texture. Texture effects on satiety responses in these occasions may be relatively small compared to effects of energy density (10). Almiron-Roig et al. (37) reviewed a large number of studies on the role of texture in intake and appetite sensations. They concluded that texture effects on satiety critically depend on the volume consumed and on the time delay to the subsequent meal: when the food volume is large or this time delay is short, liquid and solid foods are observed to be equally satiating. The similar adjust-ments in the liquid and semi-solid conditions show that a higher viscosity did not facilitate energy intake adjustments, but that these conclusions persist over repeated consumption.

108 Chapter7
We conclude that participants increased intake over days in response to learning about the satiating capacity only for the low-energy-dense foods. Intake adjustments were made irrespective of the texture of foods. Participants did not adjust energy intake in response to an additional amount of energy supplied over days, when repeatedly consuming the high-energy-dense foods as part of their meal. Accordingly, we expect that in our com-plex dietary environment, where conditions are not optimal for energy learning to occur, energy intake adjustments will also be limited, or even absent. Availability of high-energy-dense foods may therefore easily facilitate overconsumption and contribute to a positive energy balance. Moreover, one should also be aware of the effect of food texture on intake when consuming single food items: liquid foods may promote overconsumption especially within these single-item meals.
AcknowledgementsWe thank all participants; and Celine Brattinga, Ingrid Heemels, Rudolf van der Helm, Marja Kanning, Dorthe Klein, Els Siebelink, Cecile Spoorenberg, and Merel van Veen for their help in carrying out the study.
References1 Booth DA, Lee M, McAleavey C. Acquired sensory control of satiation in man. Brit J Psychol 1976; 67(2): 137-147.2 Davis JD, Smith GP. The conditioned satiating effect of orosensory stimuli. Physiol Behav 2009; 97(3-4): 293-303.3 Brunstrom JM. Associative learning and the control of human dietary behavior. Appetite 2007; 49(1): 268-271.4 Booth DA, Mather P, Fuller J. Starch content of ordinary foods associatively conditions human appetite and satiation,
indexed by intake and eating pleasantness of starch-paired flavours. Appetite 1982; 3(2): 163-184.5 Louis-Sylvestre J, Tournier A, Verger P, Chabert M, Delorme B, Hossenlopp J. Learned caloric adjustment of human
intake. Appetite 1989; 12(2): 95-103.6 Yeomans MR, Weinberg L, James S. Effects of palatability and learned satiety on energy density influences on breakfast
intake in humans. Physiol Behav 2005; 86(4): 487-99.7 Zandstra EH, Stubenitsky K, De Graaf C, Mela DJ. Effects of learned flavour cues on short-term regulation of food
intake in a realistic setting. Physiol Behav 2002; 75(1-2): 83-90.8 Van Wymelbeke V, Beridot-Therond ME, de La Gueronniere V, Fantino M. Influence of repeated consumption of
beverages containing sucrose or intense sweeteners on food intake. Eur J Clin Nutr 2004; 58(1): 154-161.9 Specter SE, Bellisle F, Hémery-Véron S, Fiquet P, Bornet FRJ, Slama G. Reducing ice cream energy density does not
condition decreased acceptance or engender compensation following repeated exposure. Eur J Clin Nutr 1998; 52(10): 703-10.
10 Rolls BJ. The relationship between dietary energy density and energy intake. Physiol Behav 2009; 97(5): 609-615.11 Hulshof T, De Graaf C, Weststrate JA. The effects of preloads varying in physical state and fat content on satiety and
energy intake. Appetite 1993; 21(3): 273-86.12 Mattes RD, Rothacker D. Beverage viscosity is inversely related to postprandial hunger in humans. Physiol Behav 2001;
74(4-5): 551-7.13 Mattes RD. Dietary compensation by humans for supplemental energy provided as ethanol or carbohydrate in fluids.
Physiol Behav 1996; 59(1): 179-87.14 Zijlstra N, Mars M, de Wijk RA, Westerterp-Plantenga MS, de Graaf C. The effect of viscosity on ad libitum food
intake. Int J Obes 2008; 32(4): 676-83.15 Mars M, Hogenkamp PS, Gosses AM, Stafleu A, De Graaf C. Effect of viscosity on learned satiation. Physiol Behav
2009; 98(1-2): 60-66.16 Hogenkamp PS, Mars M, Stafleu A, de Graaf C. Intake during repeated exposure to low- and high-energy-dense yogurts
by different means of consumption. Am J Clin Nutr 2010; 91(4): 841-847.17 Levitsky DA, Obarzanek E, Mrdjenovic G, Strupp BJ. Imprecise control of energy intake: absence of a reduction in food
intake following overfeeding in young adults. Physiol Behav 2005; 84(5): 669-75.

109Learningaboutenergydensityindifferenttextures
18 Caputo FA, Mattes RD. Human dietary responses to covert manipulations of energy, fat, and carbohydrate in a midday meal. Am J Clin Nutr 1992; 56(1): 36-43.
19 Tarasuk V, Beaton GH. Day-to-day variation in energy and nutrient intake: Evidence of individuality in eating behav-iour? Appetite 1992; 18(1): 43-54.
20 Van Strien T. Nederlandse Vragenlijst voor Eetgedrag (NVE). Handleiding [Dutch Eating Behaviour Questionnaire. Manual], Boom Test Publishers: Amsterdam, the Netherlands, 2005.
21 WHO. Estimates of energy and protein requirements of adults and children. In: Energy and protein requirements. Report of a Joint FAO/WHO/UNU Expert consultation, 2 edn. World Health Organization: Geneva, 1985, pp 71-112.
22 Brunstrom JM, Shakeshaft NG, Scott-Samuel NE. Measuring ‘expected satiety’ in a range of common foods using a method of constant stimuli. Appetite 2008; 51(3): 604-14.
23 de Castro JM. Dietary energy density is associated with increased intake in free-living humans. J Nutr 2004; 134(2): 335-341.
24 Bell EA, Castellanos VH, Pelkman CL, Thorwart ML, Rolls BJ. Energy density of foods affects energy intake in normal-weight women. Am J Clin Nutr 1998; 67(3): 412-420.
25 Blatt AD, Roe LS, Rolls BJ. Hidden vegetables: An effective strategy to reduce energy intake and increase vegetable intake in adults. Am J Clin Nutr 2011; 93(4): 756-763.
26 Brunstrom JM, Shakeshaft NG, Alexander E. Familiarity changes expectations about fullness. Appetite 2010; 54(3): 587-590.
27 Appleton KM, Martins C, Morgan LM. Age and experience predict accurate short-term energy compensation in adults. Appetite 2011; 56(3): 602-606.
28 Prentice AM, Jebb SA. Fast foods, energy density and obesity: a possible mechanistic link. Obesity Reviews 2003; 4(4): 187-194.
29 Poppitt SD, Prentice AM. Energy density and its role in the control of food intake: evidence from metabolic and com-munity studies. Appetite 1996; 26(2): 153-174.
30 Hall KD, Sacks G, Chandramohan D, Chow CC, Wang YC, Gortmaker SL et al. Quantification of the effect of energy imbalance on bodyweight. Lancet 2011; 378(9793): 826-837.
31 Campbell RG, Hashim SA, Van Itallie TB. Studies of food-intake regulation in man. Responses to variations in nutri-tive density in lean and obese subjects. N Engl J Med 1971; 285(25): 1402-1407.
32 Ebbeling CB, Sinclair KB, Pereira MA, Garcia-Lago E, Feldman HA, Ludwig DS. Compensation for energy intake from fast food among overweight and lean adolescents. JAMA 2004; 291(23): 2828-2833.
33 Carnell S, Gibson C, Benson L, Ochner CN, Geliebter A. Neuroimaging and obesity: current knowledge and future directions. Obes Rev 2011: no-no.
34 De Castro JM, McCormick J, Pedersen M, Kreitzman SN. Spontaneous human meal patterns are related to prepran-dial factors regardless of natural environmental constraints. Physiol Behav 1986; 38(1): 25-29.
35 Hogenkamp PS, Stafleu A, Mars M, Brunstrom JM, de Graaf C. Texture, not flavor, determines expected satiation of dairy products. Appetite 2011; 57(3): 635-641.
36 Weijzen PL, Liem DG, Zandstra EH, de Graaf C. Sensory specific satiety and intake: the difference between nibble- and bar-size snacks. Appetite 2008; 50(2-3): 435-42.
37 Almiron-Roig E, Chen Y, Drewnowski A. Liquid calories and the failure of satiety: how good is the evidence? Obes Rev 2003; 4(4): 201-12.


Chapter 8General discussion
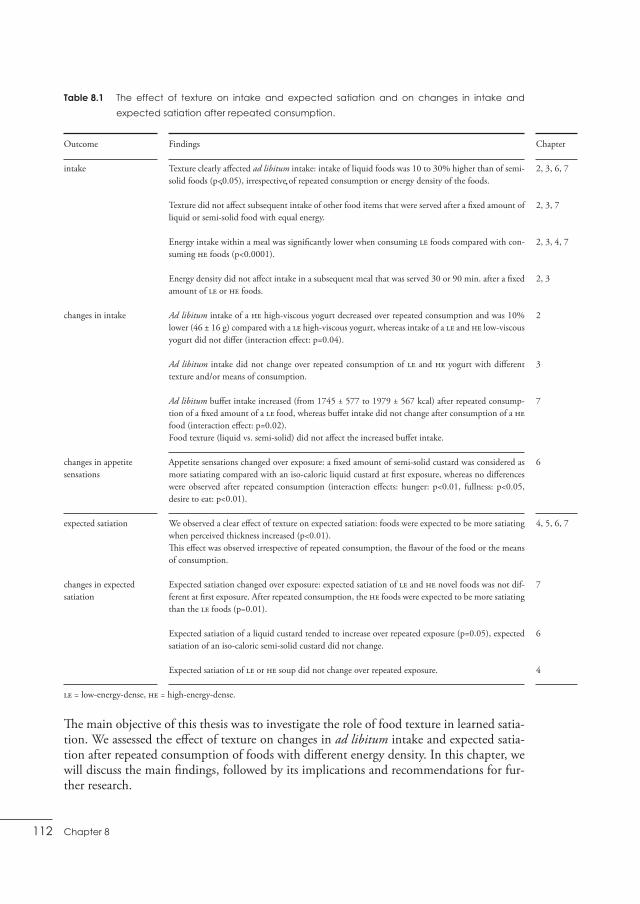
112 Chapter8
Chapter
2, 3, 6, 7
2, 3, 7
2, 3, 4, 7
2, 3
2
3
7
6
4, 5, 6, 7
7
6
4
Outcome
intake
changes in intake
changes in appetite sensations
expected satiation
changes in expected satiation
Table 8.1 The effect of texture on intake and expected satiation and on changes in intake and
expectedsatiationafterrepeatedconsumption.
Findings
Texture clearly affected ad libitum intake: intake of liquid foods was 10 to 30% higher than of semi-solid foods (p<0.05), irrespective of repeated consumption or energy density of the foods.
Texture did not affect subsequent intake of other food items that were served after a fixed amount of liquid or semi-solid food with equal energy.
Energy intake within a meal was significantly lower when consuming LE foods compared with con-suming HE foods (p<0.0001).
Energy density did not affect intake in a subsequent meal that was served 30 or 90 min. after a fixed amount of LE or HE foods.
Ad libitum intake of a HE high-viscous yogurt decreased over repeated consumption and was 10% lower (46 ± 16 g) compared with a LE high-viscous yogurt, whereas intake of a LE and HE low-viscous yogurt did not differ (interaction effect: p=0.04).
Ad libitum intake did not change over repeated consumption of LE and HE yogurt with different texture and/or means of consumption. Ad libitum buffet intake increased (from 1745 ± 577 to 1979 ± 567 kcal) after repeated consump-tion of a fixed amount of a LE food, whereas buffet intake did not change after consumption of a HE food (interaction effect: p=0.02).Food texture (liquid vs. semi-solid) did not affect the increased buffet intake.
Appetite sensations changed over exposure: a fixed amount of semi-solid custard was considered as more satiating compared with an iso-caloric liquid custard at first exposure, whereas no differences were observed after repeated consumption (interaction effects: hunger: p<0.01, fullness: p<0.05, desire to eat: p<0.01).
We observed a clear effect of texture on expected satiation: foods were expected to be more satiating when perceived thickness increased (p<0.01). This effect was observed irrespective of repeated consumption, the flavour of the food or the means of consumption.
Expected satiation changed over exposure: expected satiation of LE and HE novel foods was not dif-ferent at first exposure. After repeated consumption, the HE foods were expected to be more satiating than the LE foods (p=0.01).
Expected satiation of a liquid custard tended to increase over repeated exposure (p=0.05), expected satiation of an iso-caloric semi-solid custard did not change.
Expected satiation of LE or HE soup did not change over repeated exposure.
LE = low-energy-dense, HE = high-energy-dense.
The main objective of this thesis was to investigate the role of food texture in learned satia-tion. We assessed the effect of texture on changes in ad libitum intake and expected satia-tion after repeated consumption of foods with different energy density. In this chapter, we will discuss the main findings, followed by its implications and recommendations for fur-ther research.

113Generaldiscussion
Main findings
The main findings of the studies described in this thesis are summarized in table 8.1. We observed a clear effect of food texture on satiation: ad libitum intake of liquid foods was up to 30% higher when compared with semi-solid foods (chapter 2, 3, 6, and 7), also after repeated consumption. We also observed that semi-solid foods were expected to be more satiating than iso-caloric liquid foods (chapter 5, 6, and 7). This effect of texture on expected satiation was observed independent of the flavour or the means of consumption of dairy products (chapter 5) and of repeated consumption (chapter 6 and 7). The texture of a fixed amount of food did not affect subsequent intake of other food items (chapter 2, 3, and 7).
Our results showed that participants decreased ad libitum intake when repeatedly consum-ing a high-energy-dense viscous yogurt (chapter 2). In addition, participants increased their intake from the ad libitum buffet when they consumed a low-energy-dense food three times a day, and changed their expectations about the satiating effects of low-energy-dense and high-energy-dense novel foods after repeated consumption (chapter 7). We also observed changes in appetite sensations when participants repeatedly consumed an iso-caloric liquid and semi-solid custard (chapter 6). These changes were made irrespective of the texture of the test foods (chapter 6 and 7).Our findings indicate that participants can learn about a food’s satiating capacity after repeated consumption. Changes in response to learning about the energy content of a food did not depend on the food’s texture. Food intake and expected satiation were, however, not easily adjusted (chapter 3, 4, and 6). Also when participants learned about the satiating capacity of foods, ad libitum intake of the liquid foods was higher and expected satiation lower compared with the semi-solid foods (chapter 6 and 7). The effect of food texture on food intake was important, also after repeated consumption.
Methodological considerations
This section discusses the methodological considerations of the selected study designs that are important to take into account when interpreting the results, such as the selected test foods and outcome measures. Other factors that may determine whether flavour-nutrient learning can occur have been discussed recently (1-3), and include the energy load provided by the test foods, individual differences and hungry or need state.
TestfoodsThe type of food and differences in texture are important to assess the actual effect of tex-ture. We investigated the effect of texture in the range from liquid to semi-solid foods. Tex-ture characteristics other than viscosity, such as hardness or homogeneity of a food, were out of scope of this thesis.We did not compare texture differences larger than a liquid vs. a semi-solid version of the food. We assumed that the appropriateness for the eating occasion of these versions of the test foods were similar, e.g. consuming ‘yogurt’ or ‘custard’ for breakfast. For liquid vs. solid

114 Chapter8
foods, the cognitive representation and appropriateness may be different (i.e. ‘beverage’ vs. ‘food’), and this may interfere with the effect of texture on energy learning. The use of liq-uid and semi-solid test foods was therefore appropriate to investigate the effect of texture on learned satiation.
In order to learn about differences in energy content of foods, large contrasts in energy den-sity are required. Texture properties and other sensory attributes should however be similar across energy dimensions. We created considerable energy differences (about 100 kcal/100 g) between the low- and high-energy-dense versions of the test food, with the proportion of energy provided by the different macronutrients similar for both versions in most of the test foods.Energy differences of 50 vs. 150 kcal/100 g were observed to be sufficiently contrasting to evoke changes in intake in response to energy learning (chapter 2). It can be reasoned that a relative larger energy contrast in energy density, created by lowering the absolute levels of energy of both the low- and high-energy-dense foods, may enable better learning. We therefore created test foods with energy differences of 30 vs. 130 kcal/100 g (chapter 4 and 7). We believe that we optimized the energy differences between the test foods and were able to investigate energy learning adequately.
We observed small differences in palatability between the test foods (e.g. chapter 2 and 3) that may have affected ad libitum intake (4,5). The low-energy-dense liquid foods in chap-ter 2, for example, were rated higher on palatability than the high-energy-dense liquid foods, although we expected higher ratings for the high-energy-dense foods (e.g. 6). The high energy content was probably unusual and the foods therefore less palatable: most of the liquid foods with a similar high energy content (7) are supposed to be diluted - like syrup, or used in small portions only - like coffee creamer.The differences in palatability ratings were similar over exposure and it is therefore assumed that possible effects of palatability on intake have been constant. Moreover, we observed a decrease in intake of the high-energy-dense yogurts, while palatability of the foods did not change (chapter 2). This indicates that the possible effects of palatability on intake did not limit participants to adjust their intake, as is expected according to the process of learned satiation. We therefore do not expect that differences in palatability affected our conclusions.
We also observed that the test foods described in chapter 7 were disliked, and were there-fore most likely not rewarding. Although palatability affects satiation (4,5) and not sati-ety, one can argue that the low palatability of the test foods influenced subsequent intake. Food reward is determined by both oral and post-oral stimuli (8). A minimum intake of the buffet items may therefore have been required for immediate (oral) reward. When the oral stimulus would have been more rewarding, i.e. better liked, buffet intake may be bet-ter adjusted in response to the foods’ energy load. Intake in the high-energy conditions did however not change when the test foods became better accepted (probably due to mere exposure/learned safety). This indicates that the low palatability ratings did not influence our results.

115Generaldiscussion
To promote learning, we selected test foods with novel aspects to avoid existing associa-tions between a familiar flavour and a particular energy load. The novel-flavoured yogurts (chapter 2 and 3) and soup (chapter 4), however, may have been perceived as ‘just (another) yogurt/soup’. Participants may have consumed a physical amount conform expectations on how satiating these foods are meant to be in general (9), rather than that they adjusted their intake in response to the metabolic effects after ingestion of the specific test foods.It is suggested that a contrast in satiety expectations and actual post-ingestive effects will promote learning (10). This was confirmed in the study described in chapter 6. Learning was however not reflected in behavioural changes when serving a relatively familiar type of test food (custard). Intake and associations may be more susceptible to change when serv-ing novel foods (chapter 7).It was challenging to define a type of test food with different texture and/or energy dimen-sions that was both novel and appropriate for repeated consumption, i.e. not ‘too experi-mental’. The foods used in the study described in chapter 7 were not very well liked. This novel type of foods, however, enabled us to assess the effect of texture on learned satia-tion, whereas the use of relatively familiar foods lowered the chance to observe changes in expected satiation (chapter 4, 11-13) and intake.
Outcomemeasures:ad libitumintakeandexpectedsatiationWe anticipated that learned satiation would be demonstrated by condition-dependent changes in (expected) satiation, and expected that energy learning would directly affect meal termination. We therefore measured ad libitum food consumption (14) of the test foods over repeated exposures under standardized conditions. We considered ad libitum intake to be a more objective and accurate measure for actual intake behaviour than meas-ures on rating scales. We belief that ad libitum intake is therefore an appropriate outcome measure when investigating learned satiation.
In the study described in chapter 7, we measured ad libitum intake of a buffet and not of the test foods. The buffet was served immediately after a fixed amount of the test foods. We assumed that participants were familiar with the foods that were selected for the buffet, and that they would associate differences in post-ingestive effects after the meals with differ-ences between the test foods accordingly. This assumption was confirmed by the changes in expected satiation of the test foods after repeated consumption when compared to baseline.We referred to learned satiation, since we were interested in the changes in meal size. It would have been more accurate to refer to satiety effects - with a very short time interval, rather than to satiation (14), using the preload-test meal paradigm. What is more impor-tant, is that the results indicated that changes in meal size did not depend on the texture of the foods.
We also measured expected satiation (based on Brunstrom et al. (11) to assess energy learn-ing in addition to ad libitum intake. To measure these expectations (11), the test foods were compared with pictures on a computer screen (as discussed in chapter 5). Pictures repre-sented a familiar, ‘prototypical’ food from a specific category (e.g. pizza, rice or pasta dish). The expected satiation scores are given with the precision of kcal. It is, however, not clear how these absolute scores relate to e.g. actual intake of the foods as tested, or to iso-caloric foods other than the test foods.

116 Chapter8
Our results suggest that expected satiation did not predict actual intake per se (chapter 6). It is, however, important to point out that we were especially interested in differences in expected satiation between test foods and in changes over repeated consumption to dem-onstrate energy learning. Our findings indicate that the measure is a precise and distinc-tive means to assess expected satiation (chapter 4 (study 2) and 5). In addition, results of a previous study (15) and of our final experiment (chapter 7) showed that the measure is ade-quately sensitive to demonstrate changes in expected satiation. Expected satiation is there-fore an appropriate outcome to investigate learned satiation. To provide good insight in the association between expected satiation and actual intake, however, it is recommended to include both outcome measures in the design.
StudydesignThe number of exposures in the conditioning period was different across the studies. It was challenging to define the optimal, or minimum, number of exposures for learning to occur. It can be reasoned that a prolonged exposure period may be necessary for a change in behaviour (15) (chapter 2 and 7), and that several exposures on one day may promote responsiveness to different levels of satiety perception (chapter 7). Prolonged exposure may increase the opportunity to show evidence for the principle of learning, rather than be of practical relevance. Characteristics of the test food and of the subjects may be of greater importance for translation of our the results to daily practice.
We expected that an order effect would limit flavour-nutrient learning when a using cross-over design. We matched subjects for gender, BMI, level of dietary restraint and age to reduce variation between the groups (chapter 2, 3, and 4). The use of between-subject designs made it difficult to state firm conclusions on the changes in intake that were observed in chapter 2 and that were absent in chapter 3, or on the (apparent) absence of differences in satiation in chapter 4.We used a randomized cross-over design in the studies described in chapter 5, 6, and 7, and we did not observe order effects. This design allowed for better comparison of effects, con-trolling for individual differences related to food intake behaviour (1,3).
SubjectsTo demonstrate changes in energy intake, subjects should be sensitive and responsive to differences in energy content of the diet. It was observed that animals (16-18) and children (19,20) can adjust their food intake adequately. We were interested in learned responses of adults. We recruited lean, healthy young adults who were in energy balance, and who were assumed to regulate energy intake at healthy levels. In addition, we excluded subjects that scored high on restrained eating behaviour (21,22). A high dietary restraint score refers to the tendency to control food intake at a cognitive level, which may override the metabolic processes that are responsible for the control of food intake (3). Our study population con-sisted of lean, non-restrained participants, which is appropriate to investigate learned satia-tion and to assess the role of texture in this.

117Generaldiscussion
NeedstateWe assumed that the motivational state when consuming a food, i.e. the physiological need for energy, would increase the perception of its satiating effects, which is in line with find-ings in flavour-preference learning studies (e.g. 23-25) . Participants therefore consumed the test foods in a fasted state, i.e. after an overnight fast (chapter 2, 3, and 6) or after food restriction between meals (chapter 4 and 7). It has been observed that when fasted, one may consume a specific volume to decrease hunger rather than a specific amount of energy (14,26,27). This may have limited awareness of the exact amount consumed (28) when the foods were offered ad libitum (chapter 2 and 3), and of the formation of precise expecta-tions about satiation. Repeated consumption of a fixed amount of food can support more precise learning of the satiating capacity of the food. To further increase learning, partici-pants abstained from eating for a set time period after ingestion of the test foods.More important is that the need state during the studies did not differ largely from condi-tions in daily practice: one may be used to fast overnight, or between breakfast and lunch. Our test conditions allow for comparison with daily practice, but limited optimal learning, whereas more extreme eating restrictions would improve learning about the satiety percep-tion of a food.
Discussion and interpretation of the results
TheeffectoffoodtextureonfoodintakeTexture clearly affected satiation: ad libitum intake of liquid foods was up to 30% higher when compared with iso-caloric semi-solid foods (chapter 2, 3, 6, and 7), even when learned that the satiating capacity was similar for these foods. The effects of texture on satiation were consistent, and in line with previous findings in both laboratory (29) and real-life set-tings (30).We also observed a stronger satiety response immediately after consumption of a fixed amount the semi-solid test foods (chapter 7), but we did not find an effect of texture on subsequent intake (chapter 2, 3, and 7). These results correspond with e.g. the observation of Flood & Rolls (31), who did not observe differences in subsequent intake after consump-tion of a preload of soup that was served in different food forms. In addition, Mattes & Rothacker (32) also observed a greater reduction of hunger after a thicker shake when com-pared to a thin shake, but no significant differences in the size or time of the first meal or 24 h energy intake.
Our findings contrast with a number of studies that observed an effect of texture on sub-sequent intake (e.g. 33-36). This inconsistency can among others be explained by the dif-ferences in the representation of the test foods (i.e. the occasion/context of consumption) (e.g. 37-40) that may interfere with the effects of texture on intake. Participants in our stud-ies consumed both the liquid and semi-solid test foods in a similar (meal) occasion, while DiMeglio & Mattes reported (36) that the solid load in their study was consumed as a food (snack) in almost all occasions and the liquid load as a beverage with a meal in half of the occasions. The act of chewing, required when eating a solid food, may also contribute to a greater satiating effect when compared with a liquid food (41,42).
118 Chapter8
In addition, it was observed that subsequent intake may critically depend on the volume consumed and on the time delay to the following meal: when the food volume is large or this delay is short (as was in chapter 7), liquid and solid foods were observed to be equally satiating (43). Liquid foods consumed between meals may elicit weaker satiety responses than solid foods (43) and promote a positive energy balance (36), although soup seems to be an exception in this (44-46).Together with our findings, these results indicate that the texture of a food, or viscosity, has a larger effect on satiation than on satiety. The effect of texture on satiety depends among others on the setting and the characteristics of the test foods.
UnderlyingmechanismsoftheeffectoffoodtextureonfoodintakeAn important element in appetite suppression is the oral exposure to a food (47). Bite size, bite frequency and oral processing time are important determinants in this (48,49). The duration of oral exposure is different when consuming a liquid or a solid food (50). This may be an important explanation for the differences in ad libitum intake between the test foods (chapter 2, 3, 6, and 7).It was observed that differences in ad libitum intake disappeared when the oral exposure to liquid and semi-solid foods was standardized – by controlling the eating rate (30). We also observed that ad libitum intake was higher when a liquid yogurt was consumed with a straw (at a high rate) when compared to eating the same product with a spoon (at a lower rate) (chapter 3), and that ad libitum intake of liquid and semi-solid custards increased with increasing eating rate (chapter 6). Differences in eating rate are an important element of the effect of food texture on food intake (30,51). The effect of texture on food intake may also be explained by differences in physiological responses after consumption of liquid and (semi) solid foods. We did not investigate the physiological consequences of ingestion of the test foods in our studies, but it has been observed that foods differing in their physical state may evoke differences in gastric empty-ing or hormone release (e.g. 52-54). It was also observed that eating at a lower rate already resulted in a more pronounced gut peptide response than eating fast (55,56). In addition, not all studies report different effects after ingestion of liquid or semi-solid foods (57,58). This suggests that for liquid and semi-solid foods the effect of texture on intake may be best explained by differences in oral exposure between the test foods.
We already suggested that the act of chewing may increase the satiety perception of a food (41,42), due to satiety signals that are not induced by swallowing a liquid (50). Chewing gum suppressed rated hunger and appetite in some (59,60) but not all (61) studies. Chew-ing, additionally to tasting, was required to elicit cephalic phase responses (62). It was also suggested that tasting liquids did not provide adequate stimulation for vagal activation to result in increases in gut hormones greater than fasting, when compared with solid stimuli (63). The absence of chewing can explain the weaker satiety response after consumption of liquid foods in studies that compared liquid and solid foods in regard to food intake regu-lation (e.g. 35,41,50,64). These findings also indicate that a greater oral sensory stimulation is an important determinant of the satiating capacity of a food.Extensive chewing was not required for consumption of the liquid and semi-solid test foods, but our results show that differences in oral exposure were already adequate to result in differences in intake.
119Generaldiscussion
TheeffectoffoodtextureonlearnedsatiationIn line with the effect of food texture on intake, we expected food texture to affect learned satiation: a longer oral exposure time may facilitate linking the sensory attributes of a food to its post-ingestive effects. Our results showed that participants did not adjust their energy intake more adequately when consuming semi-solid foods compared with liquid foods. We observed that participants consuming high-viscous yogurts decreased ad libitum intake of the high-energy-dense version, while participants consuming liquid yogurts did not (chapter 2), but we could not replicate these findings (chapter 3). The between-subject designs of these studies made it difficult to draw firm conclusions on the effect of texture in learned satiation.The changes in intake (meal size in chapter 7), expected satiation (chapter 7), and appetite sensations (chapter 6) also showed that participants learned about the energy content of the test foods. These learning processes were, however, not modified by the texture of the food.
Also when participants learned about the satiating capacity of the foods, ad libitum intake of the liquid foods was higher than of the semi-solid foods (chapter 6 and 7). The effect of food texture on satiation is important in food intake, also after repeated exposure (chapter 2, 3, 6, and 7).It has been suggested that we learned since birth that more viscous diets are associated with higher calorie content (65): ‘early’ mothers’ milk tends to be low in calories, and ‘later’ milk may be more energy dense, and also more viscous. In addition, weaning foods have in general a higher energy density than milk (65). This may explain why the effects of food texture on intake are robust and have a long lasting impact, and may overrule the satiation effects that have been learned recently. It also supports generalisation of our results to other settings or other individuals: we expect that the effect of texture on food intake will also be found in daily practice, or in different study populations. As a result, energy from liquid foods may easily contribute to passive overconsumption.
LearnedsatiationOur findings indicated that participants were able to learn about the satiating capacity of a food after repeated consumption, although food intake and expected satiation did not easily change. The texture of a food and the volume consumed (26,66,67) are important determi-nants of intake (chapter 2, 3, 6, and 7) and of expected satiation (chapter 5, 6, and 7), also after repeated consumption. This may explain why intake was consistent across energy con-ditions in the studies described in chapter 2, 3, and 4. As a result, energy intake was lower when consuming low-energy-dense foods compared with high-energy-dense foods (chapter 2, 3, 4, and 7). This was also observed in previous studies (e.g. 5,67-69).Intake adjustments in response to energy learning may be observed in subsequent meal occasions, or in foods that do not differ in texture largely. Participants indeed up-regulated energy intake in the low-energy conditions when frequently consuming low- and high-energy-dense foods over the course of the day. Intake was not adjusted in the high-energy conditions (chapter 7). The weaker ability to adjust energy intake in response to a ‘surplus’ of energy (70-72) compared with ‘missing’ energy (73) has also been observed in previous studies.

120 Chapter8
EnergyintakeadjustmentsOur results suggest that energy intake was adjusted only when repeatedly consuming low-energy-dense foods, i.e. when in a more negative energy balance. We assumed that the healthy, young participants in our studies were in energy balance at baseline. From a physi-ological point of view, this balance may not have been challenged largely when consuming the high-energy-dense foods on 3 subsequent days. The physiological feedback signals that control meal termination depend a.o. on the individual’s need state: when feeling full, sati-ety signals that stop eating will occur. Consumption of the high-energy-dense foods may have resulted in pleasant feelings of satiety, rather than in a ‘surplus’ of energy. The need for changes may therefore have been low.In addition, food intake is also determined by environmental factors, that lack negative feedback signals after food intake, therewith limiting the adequate meal termination that is triggered by physiological signals. One may respond to the physiological signals especially when in a more negative energy balance, i.e. when frequently consuming the low-energy-dense foods.It can also be reasoned that the tendency to maximize energy intake have been favoured the process by natural selection. To better survive times of food scarcity, it was advantageous for hunter-gatherers to be efficient in the collection, intake and processing of food to body fat deposits during periods of food abundance (74,75), and there was no reason to compensate for a ‘surplus’ of energy. This can be another explanation for the absence of changes after consumption of the high-energy-dense foods. This may also explain the observation that a higher intake of energy-sweetened beverages contributes to weight gain (76-78), while reduction of these beverages would not result in changes in body weight per se (79).
Thus, changes in intake were less pronounced in response to high-energy-dense foods than to low-energy-dense foods that were consumed under controlled conditions. In addition, intake adjustments in healthy young adults in response to energy manipulation of the diet were limited. There would be no reason to assume that older individuals (73) or overweight (80,81) or obese subjects (82) would adjust intake more adequately in response to energy manipulation of their diet. It is suggested that e.g. obese subjects may rely more on exter-nal signals such as visual food cues to regulate their food intake (82). It is also not likely that changes in energy intake are more pronounced in daily practice, where most foods are already familiar and the physiological needs for energy are low. The constant abundance of foods may contribute to passive overconsumption (67).
SatietyexpectationsOur expectations about a food enable us to anticipate the consequences of consumption, and these expectations play a role in decisions in meal size (1). Eating is a complex behav-iour that - in adults - may be largely based on habits, i.e. learned sequences that are trig-gered automatically by specific environmental cues (83). Eating differs from non-habitual behaviour in several aspects (83): involvement in food-related decisions may be low and people require little information to make decisions (84), intentions do not always predict actual behaviour (83), and eating is influenced or triggered by specific situational or envi-ronmental cues (83), such as texture (this thesis), portion size (e.g. 85-87), variety (88), dis-traction (89) or social influences (90,91).

121Generaldiscussion
Dietary habits may have hindered changes in expected satiation of familiar foods (chapter 4 and 6). We observed changes in intake in the absence of changes in expected satiation (chapter 6). It was observed that expected satiation correlate highly with ideal portion size (92), but expected satiation did not always predict food choice (93) or actual intake (15). Only for novel foods expectations will be weak (13), and intake of these foods will be based on the available information. This would explain why expectations relied on texture prop-erties at first exposure, and changed to reliance on energy content when post-ingestive con-sequences were experienced (chapter 7).These findings suggest that expected satiation represents a strong attitude towards a specific food that will contribute to decisions on meal size. This attitude towards the food is not easily changed (13) (chapter 4 and 6). Expected satiation does therefore not predict intake per se.
The expected satiation of a dairy product was not influenced by its flavour or means of con-sumption (chapter 5). Dairy products are commonly consumed in the Netherlands, and it is likely that our participants were used to a large variety in dairy products. They may have experienced that flavour does not affect energy content per se. Other studies that investi-gated the effect taste characteristics on satiation, such as intensity (94) or type of taste (95) or aroma (96), however, showed that actual intake (satiation) was also not affected by fla-vour characteristics. Flavour may affect food intake via other mechanisms than satiation, such as meal initiation and food choice.
Manipulating product information, on e.g. the energy or macronutrient content or the health aspects of a food, has been shown to influence intake (97-100), liking (101) and expected and perceived satiety (102). It has also been observed that the expectation of having consumed caffeine can improve performance and mood (103). Moreover, it was observed that physiological responses in the regulation of hunger and fullness were con-sistent with expectations about a food, rather than with its actual nutritional value (104): consumption of a milkshake with high-calorie ‘indulgent’ label resulted in a steeper decline in ghrelin compared with consumption of the same milkshake with a low-calorie ‘sensible’ label. This suggests that cognitive influences are important in the control of food intake.
Implications and suggestions for future research
In the perspective of the increasing number of health problems related to obesity it is important to understand the factors involved in the control of food intake. A reduction in food intake would reduce weight gain and/or promote weight loss according to the prin-ciple of energy balance (calories in vs. calories out) (105). A calculation of energy-balance dynamics indicated that changes in energy intake of about 100 kJ (~25 kcal) per day will lead to an eventual body weight change (in ~3 years) of about 1 kg in overweight adults (106). This suggests that only little adjustments in intake may already contribute to weight maintenance or weight loss (106). A better self-imposed control of food intake will be ben-eficial for adequate intake compensation, and for effective weight management (107). We observed that healthy, lean individuals are able to change energy intake and expected satiation. Changes in response to learning about the satiating effects of a food were limited,

122 Chapter8
and the effect of texture on food intake remained important. It also has been observed that current dieters consume fewer beverage calories, but not fewer food calories, than unre-strained eaters (108). Together with our findings, this suggests that energy from liquid foods contributes to a positive energy balance. Further examination of the longer term effects after ad libitum intake of foods with a different texture and of eating patterns with limited ‘liquid’ calories on body weight is therefore of interest.Food intake during a meal may be guided by habitual behaviour, aiming on the reduction of hunger. Changes in intake during a meal may therefore have been limited. Whether intake adjustments may be more pronounced when test foods are served ad libitum as a snack - and not during a (habitual) meal occasion - requires further investigation. It should also be considered to investigate food-related effects on (changes in) intake in a study popu-lation that consists of children, who have less rigid beliefs about foods.Another strategy to show evidence for energy learning may be the inclusion of periods of food restriction that are more extreme than overnight fasting. Learned control of intake behaviour may be stronger after associative conditioning with energy state cues, i.e. after extreme food deprivation, as was observed in rats (109). This will increase the understand-ing of the mechanism of learned satiation, but translation of these results to daily practice may be difficult.We assumed that awareness would promote learning, but we did not test this. Ideally, the effect of the physiological responses on energy learning (by conducting a study with cov-ert energy manipulations) should be compared with the effects of both physiological and cognitive responses (by conducting a study with overt energy manipulations) (110) to con-clude on the role of cognitive influences in energy learning and in decisions on intake after repeated consumption.
Satiety responses after ingestion depended on expectations about a food rather than on its actual nutritional value (chapter 6) (102,104). This indicates that cognitive influences play a role in human eating behaviour. Whether different physiological responses after iso-caloric (104) foods sustain over time, however, should be investigated. Moreover, the effect of cog-nitive influences on satiety responses suggests that e.g. the rewarding value of a food after ingestion can be manipulated. The rewarding value of a food may be important in decisions on intake (111,112). Food reward is not limited to palatability of the food (113); reward can also be achieved by satisfying hunger. This suggests that any food (palatable or not) would make a meal into a rewarding experience (114).It may be interesting to assess individual differences (in e.g. restraint eating, external eat-ing or emotional eating) in food reward sensitivity. Neuroimaging techniques may contrib-ute greatly to the understanding of the distinct mechanisms of appetite control and food intake. It will e.g. be interesting to investigate the contrasts in brain activity to differently sized portions of energy-rich and low-caloric food stimuli and for individual differences in eating behaviour; or to investigate whether changes in satiety responses over exposures (as in chapter 6) are reflected in brain activity.When cognitive influences remain important, it should be investigated whether food per-ceptions and expectations can be used to promote healthy, ‘mindful’ eating behaviour accordingly. Promoting the rewarding value of a low-energy-dense food via product infor-mation, changing associations of snack foods through evaluative conditioning (115) to e.g.

123Generaldiscussion
discourage the wanting for a second portion, or affecting food choice via a shift in food preferences (116) towards a flavour of interest are favourable developments. Eating at a lower rate is important in the control of food intake (51), and is therefore advised in weight loss programs. Our results provide further evidence for the effect of eating rate, and suggests that eating rate can be easily manipulated using different means of consump-tion. It will be interesting to investigate whether the use of different means of consumption or differences in bite size (49,117) will affect the habitual eating style of individuals (118), and whether these effects sustain over time. When changes in eating rate will on the long term result in a decreased food (energy) intake and body weight (119), changing individuals’ eating rate may be a useful application in the clinical setting.
It may also be of great interest to investigate how characteristics of texture other than vis-cosity influence food intake. When aspects of texture that prolong oral processing, such as heterogeneity and oral coating, will result in earlier satiation, this will have consequences for meal size.It can be measured whether a commercial portion size is larger or smaller than ‘ideal’ (92). This can indicate whether a portion is perceived as adequately rewarding and/or satiating or whether one would like a second serving. This may support food industry, retail and food suppliers to define optimal portion sizes that contribute to the control of food intake.
Conclusions
Texture had a clear effect on satiation: ad libitum intake was higher of liquid foods when compared with semi-solids foods. The liquid and semi-solid foods did not affect satiety differently.The effect of texture on satiation is consistent; the effect of texture on subsequent intake depends on the food’s texture characteristics and on the setting in which it is consumed.
Healthy young adults are able to learn about a foods’ satiating capacity after repeated con-sumption. Learned satiation occurred independent of the texture of the foods.In addition, food intake and expected satiation are not easily changed. Learning may be promoted by repeated consumption of novel foods, or by a large contrast between the exist-ing expectations about the satiating effects of a food and the physiological consequences after its ingestion.Also when participants learned about the satiating capacity of foods, ad libitum intake of the liquid foods was higher and expected satiation lower compared with the semi-solid foods. The effect of food texture on food intake is important also after repeated consumption.
124 Chapter8
1 Brunstrom JM. Associative learning and the control of human dietary behavior. Appetite 2007; 49(1): 268-271.2 Yeomans MR. Understanding the nature of the reinforcer in human flavour-nutrient learning. Appetite 2011; 57(Sup-
plement 1): S47-S47.3 Yeomans M. Understanding individual differences in acquired flavour liking in humans. Chemosens Percept 2010;
3(1): 34-41.4 Sorensen LB, Moller P, Flint A, Martens M, Raben A. Effect of sensory perception of foods on appetite and food intake:
a review of studies on humans. Int J Obes Relat Metab Disord 2003; 27(10): 1152-66.5 Rolls BJ. The relationship between dietary energy density and energy intake. Physiol Behav 2009; 97(5): 609-615.6 Drewnowski A. Energy density, palatability, and satiety: implications for weight control. Nutr Rev 1998; 56(12):
347-353.7 Voedingscentrum (Gezondheidsraad SN. Nederlandse Voedingsmiddelentabel, vol. 40e druk. 2004.8 Sclafani A. Oral and postoral determinants of food reward. Physiol Behav 2004; 81(5): 773-779.9 Rolls BJ. The role of energy density in the overconsumption of fat. J Nutr 2000; 130(2): 268S-271S.10 Wansink B, Ittersum K, Painter JE. How diet and health labels influence taste and satiation. J Food Sci 2004; 69(9):
S340-S346.11 Brunstrom JM, Shakeshaft NG, Scott-Samuel NE. Measuring ‘expected satiety’ in a range of common foods using a
method of constant stimuli. Appetite 2008; 51(3): 604-14.12 Brunstrom JM, Shakeshaft NG, Alexander E. Familiarity changes expectations about fullness. Appetite 2010; 54(3):
587-590.13 O’Sullivan HL, Alexander E, Ferriday D, Brunstrom JM. Effects of repeated exposure on liking for a reduced-energy-
dense food. Am J Clin Nutr 2010; 91(6): 1584-1589.14 Blundell J, De Graaf C, Hulshof T, Jebb SA, Livingstone B, Lluch A et al. Appetite control: methodological aspects of
the evaluation of foods. Obes Rev 2010; 11(3): 251-270.15 Wilkinson LL, Brunstrom JM. Conditioning `fullness expectations’ in a novel dessert. Appetite 2009; 52(3): 780-783.16 Booth DA. Conditioned satiety in the rat. J Comp Physiol Psychol 1972; 81(3): 457-71.17 Castonguay TW. Dietary dilution and intake in the cat. Physiol Behav 1981; 27(3): 547-549.18 Booth DA, Grinker JA. Learned control of meal size in spontaneously obese and nonobese bonnet macaque monkeys.
Physiol Behav 1993; 53(1): 51-57.19 Birch LL, Deysher M. Conditioned and unconditioned caloric compensation: Evidence for self-regulation of food intake
in young children. Learn Motiv 1985; 16(3): 341-355.20 Birch LL, McPhee L, Steinberg L, Sullivan S. Conditioned flavor preferences in young children. Physiol Behav 1990;
47(3): 501-505.21 Van Strien T, Frijters JER, Bergers GPA, Defares PB. The Dutch Eating Behavior Questionnaire (DEBQ) for Assess-
ment of Restrained, Emotional, and External Eating Behavior. Int J Eat Disord 1986; 5(2): 295-315.22 Van Strien T. Nederlandse Vragenlijst voor Eetgedrag (NVE). Handleiding [Dutch Eating Behaviour Questionnaire.
Manual], Boom Test Publishers: Amsterdam, the Netherlands, 2005.23 Appleton KM, Gentry RC, Shepherd R. Evidence of a role for conditioning in the development of liking for flavours in
humans in everyday life. Physiol Behav 2006; 87(3): 478-486.24 Yeomans MR. The role of learning in development of food preferences. In: Shepherd R, Raats M (eds). Psychology of
food choice. CABI: Wallingford, 2006, pp 92-112.25 Cabanac M, Duclaux R. Specificity of internal signals in producing satiety for taste stimuli. Nature 1970; 227:
996-997.26 Bell EA, Roe LS, Rolls BJ. Sensory-specific satiety is affected more by volume than by energy content of a liquid food.
Physiol Behav 2003; 78(4-5): 593-600.27 Bolhuis DP, Lakemond CMM, de Wijk RA, Luning PA, De Graaf C. Effect of salt intensity in soup on ad libitum
intake and on subsequent food choice. Submitted for publication 2011.28 Wansink B. Mindless eating: Why we eat more than we think, Bantam Dell: New York, 2006.29 de Wijk RA, Zijlstra N, Mars M, de Graaf C, Prinz JF. The effects of food viscosity on bite size, bite effort and food
intake. Physiol Behav 2008; 95(3): 527-532.30 Zijlstra N, Mars M, de Wijk RA, Westerterp-Plantenga MS, de Graaf C. The effect of viscosity on ad libitum food
intake. Int J Obes 2008; 32(4): 676-83.31 Flood JE, Rolls BJ. Soup preloads in a variety of forms reduce meal energy intake. Appetite 2007; 49(3): 626-34.32 Mattes RD, Rothacker D. Beverage viscosity is inversely related to postprandial hunger in humans. Physiol Behav 2001;
74(4-5): 551-7.
References

125Generaldiscussion
33 Mourao DM, Bressan J, Campbell WW, Mattes RD. Effects of food form on appetite and energy intake in lean and obese young adults. Int J Obes 2007; 31(11): 1688-1695.
34 Tournier A, Louis-Sylvestre J. Effect of the physical state of a food on subsequent intake in human subjects. Appetite 1991; 16(1): 17-24.
35 Flood-Obbagy JE, Rolls BJ. The effect of fruit in different forms on energy intake and satiety at a meal. Appetite 2009; 52(2): 416-22.
36 DiMeglio DP, Mattes RD. Liquid versus solid carbohydrate: effects on food intake and body weight. Int J Obes Relat Metab Disord 2000; 24(6): 794-800.
37 Wansink B, Payne CR, Shimizu M. “Is this a meal or snack?” Situational cues that drive perceptions. Appetite 2010; 54(1): 214-216.
38 Pliner P, Zec D. Meal schemas during a preload decrease subsequent eating. Appetite 2007; 48(3): 278-288.39 Capaldi ED, Owens JQ, Privitera GJ. Isocaloric meal and snack foods differentially affect eating behavior. Appetite
2006; 46(2): 117-23.40 Viskaal-van Dongen M, de Graaf C, Siebelink E, Kok FJ. Hidden fat facilitates passive overconsumption. J Nutr 2009;
139(2): 394-9.41 Cassady BA, Hollis JH, Fulford AD, Considine RV, Mattes RD. Mastication of almonds: effects of lipid bioaccessibil-
ity, appetite, and hormone response. Am J Clin Nutr 2009; 89(3): 794-800.42 Li J, Zhang N, Hu L, Li Z, Li R, Li C et al. Improvement in chewing activity reduces energy intake in one meal and
modulates plasma gut hormone concentrations in obese and lean young Chinese men. Am J Clin Nutr 2011; 94(3): 709-716.
43 Almiron-Roig E, Chen Y, Drewnowski A. Liquid calories and the failure of satiety: how good is the evidence? Obes Rev 2003; 4(4): 201-12.
44 Rolls BJ, Fedoroff IC, Guthrie JF, Laster LJ. Foods with different satiating effects in humans. Appetite 1990; 15(2): 115-26.
45 Kissileff HR, Gruss LP, Thornton J, Jordan HA. The satiating efficiency of foods. Physiol Behav 1984; 32(2): 319-32.46 Kissileff HR. Effects of physical state (liquid-solid) of foods on food intake: procedural and substantive contributions. Am
J Clin Nutr 1985; 42(5 Suppl): 956-65.47 French SJ, Cecil JE. Oral, gastric and intestinal influences on human feeding. Physiol Behav 2001; 74(4-5): 729-34.48 Zijlstra N, de Wijk RA, Mars M, Stafleu A, de Graaf C. Effect of bite size and oral processing time of a semisolid food
on satiation. Am J Clin Nutr 2009; 90(2): 269-75.49 Bolhuis DP, Lakemond CMM, De Wijk RA, Luning PA, De Graaf C. Both a higher number of bites and a longer
orosensory exposure reduce ad libitum intake in men. In: Pangborn Sensory Science Symposium. Toronto, 2011.50 Haber GB, Heaton KW, Murphy D, Burroughs LF. Depletion and disruption of dietary fibre. Effects on satiety,
plasma-glucose, and serum-insulin. Lancet 1977; 2(8040): 679-82.51 Scisco JL, Muth ER, Dong Y, Hoover AW. Slowing bite-rate reduces energy intake: an application of the bite counter
device. J Am Diet Assoc 2011; 111(8): 1231-1235.52 Marciani L, Gowland PA, Spiller RC, Manoj P, Moore RJ, Young P et al. Gastric response to increased meal viscosity
assessed by echo-planar magnetic resonance imaging in humans. J Nutr 2000; 130(1): 122-7.53 Peracchi M, Santangelo A, Conte D, Fraquelli M, Tagliabue R, Gebbia C et al. The physical state of a meal affects
hormone release and postprandial thermogenesis. Br J Nutr 2000; 83(6): 623-8.54 Meyer JH. Gastric emptying of ordinary food: effect of antrum on particle size. Am J Physiol 1980; 239(3): G133-5.55 Kokkinos A, le Roux CW, Alexiadou K, Tentolouris N, Vincent RP, Kyriaki D et al. Eating slowly increases the post-
prandial response of the anorexigenic gut hormones, peptide YY and glucagon-like peptide-1. J Clin Endocrinol Metab 2010; 95(1): 333-337.
56 Karl JP, Young AJ, Montain SJ. Eating rate during a fixed-portion meal does not affect postprandial appetite and gut peptides or energy intake during a subsequent meal. Physiol Behav 2011; 102(5): 524-531.
57 Zijlstra N, Mars M, de Wijk RA, Westerterp-Plantenga MS, Holst JJ, de Graaf C. Effect of viscosity on appetite and gastro-intestinal hormones. Physiol Behav 2009; 97(1): 68-75.
58 Martens MJI, Lemmens SGT, Born JM, Westerterp-Plantenga MS. A solid high-protein meal evokes stronger hunger suppression than a liquefied high-protein meal. Obesity 2011; 19(3): 522-527.
59 Hetherington MM, Boyland E. Short-term effects of chewing gum on snack intake and appetite. Appetite 2007; 48(3): 397-401.
60 Hetherington MM, Regan MF. Effects of chewing gum on short-term appetite regulation in moderately restrained eaters. Appetite 2011; 57(2): 475-482.
61 Julis RA, Mattes RD. Influence of sweetened chewing gum on appetite, meal patterning and energy intake. Appetite 2007; 48: 167-175.

126 Chapter8
62 Teff KL, Devine J, Engelman K. Sweet taste: effect on cephalic phase insulin release in men. Physiol Behav 1995; 57(6): 1089-95.
63 Teff KL. Cephalic phase pancreatic polypeptide responses to liquid and solid stimuli in humans. Physiol Behav 2010; 99(3): 317-23.
64 Hulshof T, De Graaf C, Weststrate JA. The effects of preloads varying in physical state and fat content on satiety and energy intake. Appetite 1993; 21(3): 273-86.
65 Swithers SE. Development of ingestive behavior: the influence of context and experience on sensory signals modulating intake. In: Blumberg MS, Freeman JH, Robinson SR (eds). Oxford handbook of developmental behavioral neuro-science vol. 1. Oxford University Pres: Oxford, 2009, pp 454-474.
66 De Graaf C, Hulshof T. Effects of weight and energy content of preloads on subsequent appetite and food intake. Appetite 1996; 26(2): 139-152.
67 Poppitt SD, Prentice AM. Energy density and its role in the control of food intake: evidence from metabolic and com-munity studies. Appetite 1996; 26(2): 153-174.
68 de Castro JM. Dietary energy density is associated with increased intake in free-living humans. J Nutr 2004; 134(2): 335-341.
69 Bell EA, Castellanos VH, Pelkman CL, Thorwart ML, Rolls BJ. Energy density of foods affects energy intake in normal-weight women. Am J Clin Nutr 1998; 67(3): 412-420.
70 Prentice AM, Jebb SA. Fast foods, energy density and obesity: a possible mechanistic link. Obes Rev 2003; 4(4): 187-94.71 Levitsky DA, Obarzanek E, Mrdjenovic G, Strupp BJ. Imprecise control of energy intake: absence of a reduction in food
intake following overfeeding in young adults. Physiol Behav 2005; 84(5): 669-75.72 Prentice AM, Jebb SA. Fast foods, energy density and obesity: a possible mechanistic link. Obesity Reviews 2003; 4(4):
187-194.73 Appleton KM, Martins C, Morgan LM. Age and experience predict accurate short-term energy compensation in adults.
Appetite 2011; 56(3): 602-606.74 Neel JV. Diabetes mellitus: A “thrifty” genotype rendered detrimental by “progress”? Am J Hum Genet 1962; 14:
353-362.75 Smeets PAM. Dietary learning: both consistency and congruency matter. 2010; 6(8).76 Malik VS, Schulze MB, Hu FB. Intake of sugar-sweetened beverages and weight gain: a systematic review. Am J Clin
Nutr 2006; 84(2): 274-88.77 Vartanian LR, Schwartz MB, Brownell KD. Effects of soft drink consumption on nutrition and health: a systematic
review and meta-analysis. Am J Public Health 2007; 97(4): 667-75.78 Raben A, Vasilaras TH, Moller AC, Astrup A. Sucrose compared with artificial sweeteners: different effects on ad libi-
tum food intake and body weight after 10 wk of supplementation in overweight subjects. Am J Clin Nutr 2002; 76(4): 721-9.
79 Mattes RD, Shikany JM, Kaiser KA, Allison DB. Nutritively sweetened beverage consumption and body weight: a systematic review and meta-analysis of randomized experiments. Obesity Reviews 2011; 12(5): 346-365.
80 Campbell RG, Hashim SA, Van Itallie TB. Studies of food-intake regulation in man. Responses to variations in nutri-tive density in lean and obese subjects. N Engl J Med 1971; 285(25): 1402-1407.
81 Ebbeling CB, Sinclair KB, Pereira MA, Garcia-Lago E, Feldman HA, Ludwig DS. Compensation for energy intake from fast food among overweight and lean adolescents. JAMA 2004; 291(23): 2828-2833.
82 Carnell S, Gibson C, Benson L, Ochner CN, Geliebter A. Neuroimaging and obesity: current knowledge and future directions. Obes Rev 2011: no-no.
83 Riet Jvt, Sijtsema SJ, Dagevos H, De Bruijn G-J. The importance of habits in eating behaviour. An overview and rec-ommendations for future research. Appetite 2011; 57(3): 585-596.
84 Verbeke W. Impact of communication on consumers’ food choices. Proc Nutr Soc 2008; 67: 281-288.85 Nisbett RE. Determinants of food intake in obesity. Science 1968; 159(3820): 1254-1255.86 Rolls BJ, Morris EL, Roe LS. Portion size of food affects energy intake in normal-weight and overweight men and
women. Am J Clin Nutr 2002; 76(6): 1207-13.87 Herman CP, Polivy J. External cues in the control of food intake in humans: The sensory-normative distinction. Physiol
Behav 2008; 94(5): 722-728.88 Rolls BJ, Rowe EA, Rolls ET, Kingston B, Megson A, Gunary R. Variety in a meal enhances food intake in man.
Physiol Behav 1981; 26(2): 215-21.89 Wansink B. Environmental factors that increase the food intake and consumption volume of unknowing consumers.
Annu Rev Nutr 2004; 24(1): 455-479.90 Herman CP, Polivy J. Normative influences on food intake. Physiol Behav 2005; 86(5): 762-772.91 Herman CP, Roth DA, Polivy J. Effects of the presence of others on food intake: a normative interpretation. Psychol Bull
2003; 129(6): 873-86.

127Generaldiscussion
92 Brunstrom JM, Rogers PJ. How many calories are on our plate? Expected fullness, not liking, determines meal-size selec-tion. Obesity 2009; 17(10): 1884-1890.
93 Bilman EM, van Trijp JCM, Renes RJ. Consumer perceptions of satiety-related snack food decision making. Appetite 2010; 55(3): 639-647.
94 Bolhuis DP, Lakemond CMM, de Wijk RA, Luning PA, de Graaf C. Effect of salt intensity on ad libitum intake of tomato soup similar in palatability and on salt preference after consumption. Chem Senses 2010; 35(9): 789-799.
95 Griffioen-Roose S, Mars M, Finlayson G, Blundell JE, de Graaf C. Satiation due to equally palatable sweet and savory meals does not differ in normal weight young adults. J Nutr 2009; 139(11): 2093-8.
96 Ramaekers MG, Luning PA, Ruijschop RMAJ, Lakemond CMM, van Boekel MAJS. The effect of aroma type on satiation and ad libitum food intake. Appetite 2011; 57(2): 564.
97 Shide DJ, Rolls BJ. Information about the fat content of preloads influences energy intake in healthy women. J Am Diet Assoc 1995; 95(9): 993-998.
98 Wooley SC. Physiologic versus cognitive factors in short term food regulation in the obese and nonobese. Psychosom Med 1972; 34(1): 62-68.
99 Caputo FA, Mattes RD. Human dietary responses to perceived manipulation of fat content in a midday meal. Int J Obes Relat Metab Disord 1993; 17(4): 237-40.
100 Provencher V, Polivy J, Herman CP. Perceived healthiness of food. If it’s healthy, you can eat more! Appetite 2009; 52(2): 340-344.
101 Gould NJ, Zandstra EH, Yeomans MR. Manipulating expectations about the calorie content of a breakfast influences acquired liking. Appetite 2011; 57(2): 558-558.
102 Fay SH, Hinton EC, Rogers PJ, Brunstrom JM. Product labelling can confer sustained increases in expected and actual satiety. In: British Feeding and Drinking Group. Belfast, 2011.
103 Dawkins L, Shahzad F-Z, Ahmed SS, Edmonds CJ. Expectation of having consumed caffeine can improve performance and mood. Appetite 2011; 57(3): 597-600.
104 Crum AJ, Corbin WR, Brownell KD, Salovey P. Mind over milkshakes: Mindsets, not just nutrients, determine ghrelin response. Health Psychol 2011; 30(4): 424-429.
105 Rutter H. Where next for obesity? Lancet 2011; 378(9793): 746-747.106 Hall KD, Sacks G, Chandramohan D, Chow CC, Wang YC, Gortmaker SL et al. Quantification of the effect of
energy imbalance on bodyweight. Lancet 2011; 378(9793): 826-837.107 Johnson F, Pratt M, Wardle J. Dietary restraint and self-regulation in eating behavior. 2011.108 Lowe MR, Goldstein S, Katterman S. Current dieters consume fewer beverage calories - but not fewer food calories -
than unrestrained eaters in the natural environment. Appetite 2011; 57(Supplement 1): S28-S28.109 Martin AA, Davidson TL. Energy state cues overshadow auditory cues for the discriminative control of behavior. Appe-
tite 2011; 57(Supplement 1): S28-S28.110 Zandstra EH, Stubenitsky K, De Graaf C, Mela DJ. Effects of learned flavour cues on short-term regulation of food
intake in a realistic setting. Physiol Behav 2002; 75(1-2): 83-90.111 Epstein L. Obesity as a disorder of reinforcement pathology. In: -, (ed) 9th Pangborn Sensory Science Symposium.
Toronto, 2011.112 Mela DJ. Nutrition and food acceptance: Is it better to be wanted or liked? In: -, (ed) 9th Pangborn Sensory Science
Symposium. Toronto, 2011.113 Berridge KC, Robinson TE, Aldridge JW. Dissecting components of reward: ‘liking’, ‘wanting’, and learning. Curr
Opin Pharmacol 2009; 9(1): 65-73.114 Olszewski PK, Alsiö J, Schiöth HB, Levine AS. Opioids as facilitators of feeding: Can any food be rewarding? Physiol
Behav 2011; 104(1): 105-110.115 Lebens H, Roefs A, Martijn C, Houben K, Nederkoorn C, Jansen A. Making implicit measures of associations with
snack foods more negative through evaluative conditioning. Eating Behaviors; (0).116 Zandstra EH, El-Deredy W. Effects of energy conditioning on food preferences and choice. Appetite 2011; 57(1): 45-49.117 Zijlstra N, Mars M, Stafleu A, de Wijk RA, Prinz JF, Hück NL et al. Effect of bite size and oral processing time of food
on satiation. Appetite 2008; 51(3): 753-753.118 Ioakimidis I, Zandian M, Eriksson-Marklund L, Bergh C, Grigoriadis A, Södersten P. Description of chewing and
food intake over the course of a meal. Physiol Behav 2011; 104(5): 761-769.119 Ford AL, Bergh C, Sodersten P, Sabin MA, Hollinghurst S, Hunt LP et al. Treatment of childhood obesity by retrain-
ing eating behaviour: randomised controlled trial. BMJ 2010; 340: b5388. doi:10.1136/bmj.b5388.


Samenvatting(summary in Dutch)
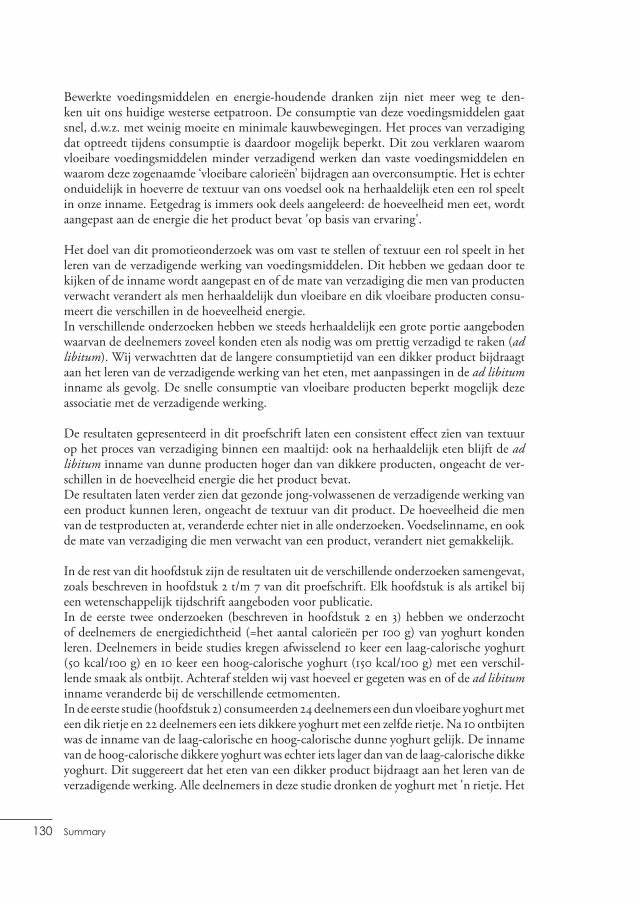
130 Summary
Bewerkte voedingsmiddelen en energie-houdende dranken zijn niet meer weg te den-ken uit ons huidige westerse eetpatroon. De consumptie van deze voedingsmiddelen gaat snel, d.w.z. met weinig moeite en minimale kauwbewegingen. Het proces van verzadiging dat optreedt tijdens consumptie is daardoor mogelijk beperkt. Dit zou verklaren waarom vloeibare voedingsmiddelen minder verzadigend werken dan vaste voedingsmiddelen en waarom deze zogenaamde ‘vloeibare calorieën’ bijdragen aan overconsumptie. Het is echter onduidelijk in hoeverre de textuur van ons voedsel ook na herhaaldelijk eten een rol speelt in onze inname. Eetgedrag is immers ook deels aangeleerd: de hoeveelheid men eet, wordt aangepast aan de energie die het product bevat 'op basis van ervaring'.
Het doel van dit promotieonderzoek was om vast te stellen of textuur een rol speelt in het leren van de verzadigende werking van voedingsmiddelen. Dit hebben we gedaan door te kijken of de inname wordt aangepast en of de mate van verzadiging die men van producten verwacht verandert als men herhaaldelijk dun vloeibare en dik vloeibare producten consu-meert die verschillen in de hoeveelheid energie. In verschillende onderzoeken hebben we steeds herhaaldelijk een grote portie aangeboden waarvan de deelnemers zoveel konden eten als nodig was om prettig verzadigd te raken (ad libitum). Wij verwachtten dat de langere consumptietijd van een dikker product bijdraagt aan het leren van de verzadigende werking van het eten, met aanpassingen in de ad libitum inname als gevolg. De snelle consumptie van vloeibare producten beperkt mogelijk deze associatie met de verzadigende werking.
De resultaten gepresenteerd in dit proefschrift laten een consistent effect zien van textuur op het proces van verzadiging binnen een maaltijd: ook na herhaaldelijk eten blijft de ad libitum inname van dunne producten hoger dan van dikkere producten, ongeacht de ver-schillen in de hoeveelheid energie die het product bevat. De resultaten laten verder zien dat gezonde jong-volwassenen de verzadigende werking van een product kunnen leren, ongeacht de textuur van dit product. De hoeveelheid die men van de testproducten at, veranderde echter niet in alle onderzoeken. Voedselinname, en ook de mate van verzadiging die men verwacht van een product, verandert niet gemakkelijk.
In de rest van dit hoofdstuk zijn de resultaten uit de verschillende onderzoeken samengevat, zoals beschreven in hoofdstuk 2 t/m 7 van dit proefschrift. Elk hoofdstuk is als artikel bij een wetenschappelijk tijdschrift aangeboden voor publicatie.In de eerste twee onderzoeken (beschreven in hoofdstuk 2 en 3) hebben we onderzocht of deelnemers de energiedichtheid (=het aantal calorieën per 100 g) van yoghurt konden leren. Deelnemers in beide studies kregen afwisselend 10 keer een laag-calorische yoghurt (50 kcal/100 g) en 10 keer een hoog-calorische yoghurt (150 kcal/100 g) met een verschil-lende smaak als ontbijt. Achteraf stelden wij vast hoeveel er gegeten was en of de ad libitum inname veranderde bij de verschillende eetmomenten.In de eerste studie (hoofdstuk 2) consumeerden 24 deelnemers een dun vloeibare yoghurt met een dik rietje en 22 deelnemers een iets dikkere yoghurt met een zelfde rietje. Na 10 ontbijten was de inname van de laag-calorische en hoog-calorische dunne yoghurt gelijk. De inname van de hoog-calorische dikkere yoghurt was echter iets lager dan van de laag-calorische dikke yoghurt. Dit suggereert dat het eten van een dikker product bijdraagt aan het leren van de verzadigende werking. Alle deelnemers in deze studie dronken de yoghurt met 'n rietje. Het
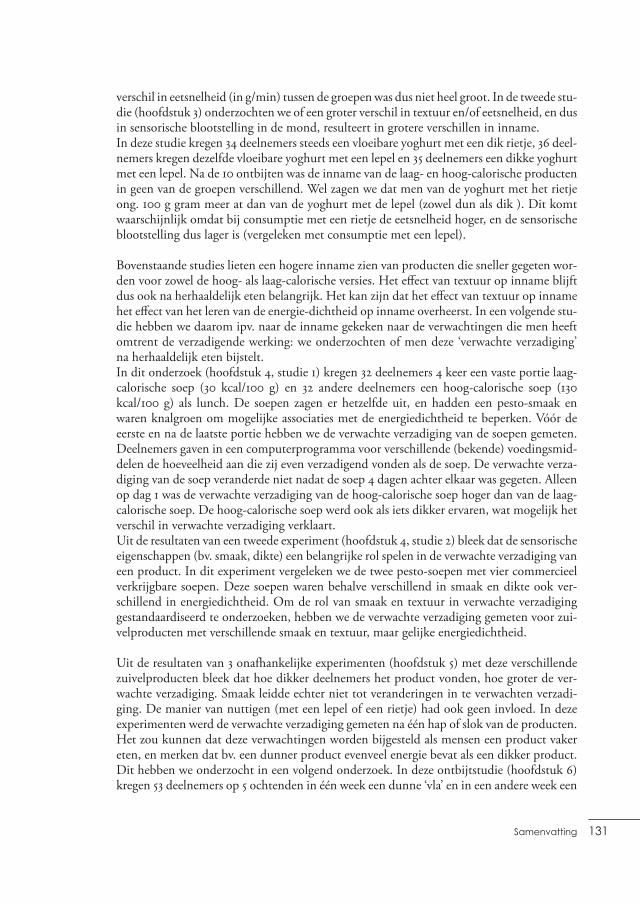
131Samenvatting
verschil in eetsnelheid (in g/min) tussen de groepen was dus niet heel groot. In de tweede stu-die (hoofdstuk 3) onderzochten we of een groter verschil in textuur en/of eetsnelheid, en dus in sensorische blootstelling in de mond, resulteert in grotere verschillen in inname. In deze studie kregen 34 deelnemers steeds een vloeibare yoghurt met een dik rietje, 36 deel-nemers kregen dezelfde vloeibare yoghurt met een lepel en 35 deelnemers een dikke yoghurt met een lepel. Na de 10 ontbijten was de inname van de laag- en hoog-calorische producten in geen van de groepen verschillend. Wel zagen we dat men van de yoghurt met het rietje ong. 100 g gram meer at dan van de yoghurt met de lepel (zowel dun als dik ). Dit komt waarschijnlijk omdat bij consumptie met een rietje de eetsnelheid hoger, en de sensorische blootstelling dus lager is (vergeleken met consumptie met een lepel).
Bovenstaande studies lieten een hogere inname zien van producten die sneller gegeten wor-den voor zowel de hoog- als laag-calorische versies. Het effect van textuur op inname blijft dus ook na herhaaldelijk eten belangrijk. Het kan zijn dat het effect van textuur op inname het effect van het leren van de energie-dichtheid op inname overheerst. In een volgende stu-die hebben we daarom ipv. naar de inname gekeken naar de verwachtingen die men heeft omtrent de verzadigende werking: we onderzochten of men deze ‘verwachte verzadiging’ na herhaaldelijk eten bijstelt.In dit onderzoek (hoofdstuk 4, studie 1) kregen 32 deelnemers 4 keer een vaste portie laag-calorische soep (30 kcal/100 g) en 32 andere deelnemers een hoog-calorische soep (130 kcal/100 g) als lunch. De soepen zagen er hetzelfde uit, en hadden een pesto-smaak en waren knalgroen om mogelijke associaties met de energiedichtheid te beperken. Vóór de eerste en na de laatste portie hebben we de verwachte verzadiging van de soepen gemeten. Deelnemers gaven in een computerprogramma voor verschillende (bekende) voedingsmid-delen de hoeveelheid aan die zij even verzadigend vonden als de soep. De verwachte verza-diging van de soep veranderde niet nadat de soep 4 dagen achter elkaar was gegeten. Alleen op dag 1 was de verwachte verzadiging van de hoog-calorische soep hoger dan van de laag-calorische soep. De hoog-calorische soep werd ook als iets dikker ervaren, wat mogelijk het verschil in verwachte verzadiging verklaart.Uit de resultaten van een tweede experiment (hoofdstuk 4, studie 2) bleek dat de sensorische eigenschappen (bv. smaak, dikte) een belangrijke rol spelen in de verwachte verzadiging van een product. In dit experiment vergeleken we de twee pesto-soepen met vier commercieel verkrijgbare soepen. Deze soepen waren behalve verschillend in smaak en dikte ook ver-schillend in energiedichtheid. Om de rol van smaak en textuur in verwachte verzadiging gestandaardiseerd te onderzoeken, hebben we de verwachte verzadiging gemeten voor zui-velproducten met verschillende smaak en textuur, maar gelijke energiedichtheid.
Uit de resultaten van 3 onafhankelijke experimenten (hoofdstuk 5) met deze verschillende zuivelproducten bleek dat hoe dikker deelnemers het product vonden, hoe groter de ver-wachte verzadiging. Smaak leidde echter niet tot veranderingen in te verwachten verzadi-ging. De manier van nuttigen (met een lepel of een rietje) had ook geen invloed. In deze experimenten werd de verwachte verzadiging gemeten na één hap of slok van de producten. Het zou kunnen dat deze verwachtingen worden bijgesteld als mensen een product vaker eten, en merken dat bv. een dunner product evenveel energie bevat als een dikker product. Dit hebben we onderzocht in een volgend onderzoek. In deze ontbijtstudie (hoofdstuk 6) kregen 53 deelnemers op 5 ochtenden in één week een dunne ‘vla’ en in een andere week een

132 Summary
dikke, lobbige ‘pudding’ met gelijke energiedichtheid (ong. 100 kcal/100 g). Op dag 1 en 5 werden de producten ad libitum gegeten en werd de verwachte verzadiging gemeten. Op dag 2, 3 en 4 kregen de deelnemers een vaste hoeveelheid. Iedereen rapporteerde elke dag 3 uur lang na het ontbijt hun gevoelens van honger en verzadiging.Op dag 2 gaven deelnemers aan meer honger te hebben na het eten van de dunne produc-ten dan na het eten van de dikke producten. Op dag 4 was er geen verschil in hongerscores of in de andere parameters van verzadiging. Ondanks dat dit aangeeft dat de verzadigende werking van de vaste portie van de producten gelijk is, was zowel vóór als na herhaaldelijk eten de verwachte verzadiging lager en de ad libitum inname hoger van de dunne produc-ten dan van de dikke producten. Dit suggereert dat het effect van textuur op ad libitum inname en op de verwachte verzadiging groter is dan het effect van de geleerde (metabole) verzadiging.
In voorgaande studies waren de dunne en dikkere producten steeds het enige voedings-middel van de maaltijd. Hiermee werd de mogelijkheid om inname aan te passen beperkt tot het testproduct zelf, met mogelijke interferentie van het effect van textuur op inname.In de laatste studie (hoofdstuk 7) onderzochten we weer het effect van textuur op aanpas-singen in inname door herhaaldelijk dunne en dikkere testproducten met verschillende energiedichtheid aan te bieden. Deelnemers aten van deze nieuwe testproducten echter steeds een vaste hoeveelheid aan het begin van elke maaltijd. Direct daarna daarna aten ze verder van een ad libitum buffet met bekende producten: een warme lunch met afwisselend pasta, rijst, of aardappels en 2 x per dag een broodmaaltijd. Gedurende 3 dagen hebben we de inname van het buffet gemeten. De buffet inname nam over de dagen toe na het eten van de laag-calorische producten, terwijl de buffet-inname na de hoog-calorische produc-ten constant bleef. De textuur van de producten (dun vs. dikker) had geen effect op de inname van het buffet. De textuur had wel invloed op de inname van de testproducten zelf, toen we deze op de 4e dag ook nog ad libitum hebben aangeboden.
De algemene discussie (hoofdstuk 8) beschrijft de belangrijkste bevindingen van dit pro-motieonderzoek en de interpretatie hiervan. Hier worden ook de methodologische kwes-ties van de verschillende studies samengevat. Onze resultaten tezamen met resultaten van andere onderzoeken laten een consistent effect zien van textuur op de ad libitum inname, ook na herhaaldelijk eten. Het effect van textuur van een vaste portie eten op de inname van andere voedingsmiddelen binnen een maaltijd of bij een volgende maaltijd is niet con-sistent, en hangt o.a. af van de grootte van de vaste portie en van de tijd tot de inname van de andere voedingsmiddelen.De resultaten suggereren verder dat het leren van de verzadigende werking afhangt van bepaalde omstandigheden, welke in ons dagelijks leven waarschijnlijk niet vaak voorkomen (bv. het eten van compleet nieuwe producten, of van producten waarvan de verzadigende werking na het eten volledig anders is dan de verwachtingen vooraf ). De inname van een product en de verwachte verzadiging verandert dus niet makkelijk. Het is daarom voor vervolgonderzoek van belang de cognitieve invloeden op ons eetgedrag beter te begrijpen. Onderzoek naar bv. de hersenactiviteit van mensen met verschillen in eetgedrag of van de gevoeligheid voor de belonende waarde van voedsel helpt om beter inzicht te krijgen in de mechanismen die een rol spelen in ons eetgedrag. Daarnaast is meer onderzoek nodig naar het effect van manipulaties van productinformatie op ons eetgedrag op de lange termijn.
Dankwoord(acknowledgements)

134 Acknowledgements
M’n boekje is af!! Met het schrijven van deze laatste pagina’s van mijn proefschrift komt er ook langzaam een einde aan een geweldige periode bij de afdeling Humane Voeding. Ik heb van (bijna) elke minuut van mijn aio-project genoten, mede dankzij al mijn collega’s hier. Heel veel dank voor de leerzame en leuke tijd die ik bij en met jullie heb gehad!Ook de medewerkers, collega-onderzoekers en partners van TIFN wil ik bijzonder danken voor alle interessante discussies en ontmoetingen, voor het meedenken over (on)mogelijke testproducten en designs en voor de wijze waarop ik mijn onderzoek kon uitvoeren en presenteren.
Kees, ik heb bewondering voor je kennis, visie en ideeën en voor de manier waarop je deze steeds weer weet uit te voeren. Ik heb veel van jouw manier van werken geleerd! Dank je wel voor het delen van je kijk op de wetenschappelijke wereld, en voor alle kansen en vrij-heid die je me hebt gegeven! Annette, jouw inzet en je betrokkenheid als projectleider van B1001 en als mijn co-promo-tor waren enorm. Dank voor je adviezen en bijdrages op alle fronten! Monica, jij hebt me geïntroduceerd in de literatuur en het praktisch werk. Dank voor alle ‘tips en tricks’ en voor de tijd die er altijd was voor een brainstorm over product of resultaat.Dank jullie wel voor de begeleiding en voor het geduld als ik weer eens wat meer woorden nodig had.
Jeff, I very much enjoyed discussing (the absence of ) results, methodology and new ideas. The meetings on international conferences as well as in Bristol and Wageningen have always been fun and inspiring. I hope the exchange will continue in the future. Thanks a lot for your contribution to my papers!
Tiny van Boekel, Liesbeth Zandstra, Harold Bult and Martin Yeomans, I would like to thank you for the critical reading of my thesis and for the willingness to participate in my committee.
Zonder deelnemers geen onderzoek. Ik wil dan ook graag alle 419 proefpersonen bedanken voor hun inzet tijdens al die weken, en voor het eten of proeven van ruim 3500 L yoghurt, soep en alles wat daarvoor moest doorgaan.
Het uitvoeren van de onderzoeken kon ik niet alleen. Dione, dank voor je hulp bij het werven van mogelijke proefpersonen. Antonie, dank je wel voor jouw aandeel in het eerste onderzoek. Natasja, Juliette, Lieke, Lara, Maarten, Paulette, Femke, Floor, Nicole, Lisette, Sandra, Cecile en Rudolf, door jullie enthousiasme was er zelf op de meest onmogelijk tijdstippen geen tijd voor een ochtendhumeur! Dank jullie wel voor de bijdrage aan mijn onderzoeken. Kathryn, thanks for your contribution. Ik heb een aantal van jullie ook mogen begeleiden tijdens jullie afstudeerproject binnen mijn onderzoek. Juliette, Lieke, Lara, Maarten, Nicole, en Cecile: ik hoop dat jullie net zo veel van mij hebben geleerd als ik van jullie!

135Dankwoord
Een heel aantal collega’s heeft mij op allerlei manieren geholpen. Els, de hoeveelheid werk die jij verzet tijdens een voedingsproef is bewonderenswaardig. Dank voor al je hulp, erva-ring en de gezelligheid. Corine, Karin, Ingrid, Dorthe, Merel en Paulien, zonder jullie is ’t voedings-team niet compleet – dank voor de adviezen en hulp! Hans Meijer, zonder tech-nische support was de data-invoer een project op zich geworden, dank! Eric en Riekie, dank voor het regelen van alle financiële beslommeringen. Lidwien, bedankt voor alle organisa-torische zaken die je voor mijn project en de afdeling geregeld hebt. Gabrielle, Cornelia, Karen, Gea, en Marie, jullie zijn onmisbaar, dank voor alles. Corine, fijn dat ik met mijn vragen bij je terecht kon als TIFN-projectleider a.i.. Harry Baptist, Tineke van Roekel en Paul Hulshof, dank jullie wel voor het uitvoeren van alle objectieve analyses.
Jelle, mijn proefschrift had niet mooier kunnen zijn! Alex, ik ben Heel Blij met mijn school-bordjes! Dank jullie wel voor het vormgeven van m'n boekje!
Ik wil hier ook graag al mijn directe (oud-)collega’s bedanken voor alle informele advie-zen, het proeven van testproducten in pilot-studies en voor alle leuke momenten tijdens en naast het werk. De PhD-tour naar het noorden was 'super'leuk, en Ruslandgangers, het weekendje St. Petersburg zal ik nooit vergeten!! Mijn Maastrichtse B1001-collega’s, Jurri-aan, Sofie, Mieke en Margriet, bedankt voor alle input en voor de gezelligheid tijdens alle meetings, uitjes en congressen. De Eetclub, a.k.a. Drinkclub, dank jullie wel voor alle leuke formele en informele bijeenkomsten; ik hoop dat we elkaar nog regelmatig tegen zullen komen. Nicolien, dankzij jouw betrokkenheid voelde ik mij meteen thuis in ons TIFN-team. Na jouw vertrek naar Unilever moest ik wel even wennen dat onze discussies niet meer vanzelfsprekend waren. Dank je wel voor al je adviezen en gezelligheid. Dieuwerke, Mirre en Victoire, dat lunchen hadden we eerder moeten ontdekken! Dank voor jullie inte-resse, tips en afleiding! ‘Andere’ Sanne (B), je zit een beetje ver weg, maar gelukkig is er af en toe tijd voor discussies en andere verhalen tijdens het forenzen. Succes met het vieren! Akke, ik vind het jammer dat je er niet bij kunt zijn, maar ‘op reis’ reken ik goed als excuus! Dank je wel voor alles wat we vooral de laatste maanden konden delen.
Op deze plek wil ik graag mijn paranimfen in het zonnetje zetten: Sanne en Esmee, ik ben blij dat ik tijdens mijn verdediging niet alleen sta! Esmee, na onze voedingsmiepen-start in 2001 zijn we elkaar ‘in vlagen’, maar gelukkig met grote regelmatig tegengekomen in de collegebanken, Zuid-Afrika en nu hier op de afde-ling. Helaas was er niet altijd tijd voor koffie, maar het zou leuk zijn als we deze regelmaat nog wat langer kunnen volhouden! Succes met de laatste loodjes bij het afronden van jouw proefschrift. Ik ben benieuwd!Sanne, ik vind het heel bijzonder dat we van begin tot eind onze onderzoeken en alles er omheen 'samen' mochten uitvoeren. Ik ga je zeker weten missen! Jouw enthousiasme en creatieve inzichten lijken wel onuitputtelijk en ik heb veel van onze discusscies en je kri-tische kijk op zaken geleerd. De reisjes die we maakten zijn niet meer op twee handen te tellen en ik heb hard genoten van deze en alle andere 'secundaire arbeidsvoorwaarden'! Het wordt wennen als ik mijn bord straks weer alleen leeg moet eten ☺. Dank voor alles!!

136 Acknowledgements
Er zijn een hoop vriendinnen, vrienden en familieleden die mijn onderzoeken de afgelopen jaren met interesse gevolgd hebben. Iedereen bedankt voor de belangstelling! Daarnaast waren alle (roze) borrels, de etentjes, tennis, spelletjes, golf en weekendjes weg natuurlijk een aangename afleiding van het werk.Moon, ik kijk al uit naar onze Skype-borrels!! Siets, Lien & Moon, ik ben nog steeds niet goed in marinade: komen jullie helpen met de gravad lax? Mliek, fijn dat we ook op afstand op de hoogte blijven van alle aio-perikelen en andere zaken: dank voor 't meeleven! Senaat, zullen we die lustrum-trip gaan plannen, of gaan we gewoon weer lekker ploeteren in de Zeeuwse klei?
Lieve (schoon)familie, ik weet niet of ik altijd goed heb laten merken dat ik heel blij werd van alle steun en interesse (ook al was ‘t niet altijd te volgen of eigenlijk niet te eten) en voor alles wat zorgde voor de nodige afleiding van het werk. Bij deze dus!!
En dan toch als laatste... Lieve Wouter, ik ben echt superblij met jou!! Ik weet niet hoe ik je kan bedanken voor je eindeloze geduld als ik me weer eens veel te druk maak om mijn deelnemers, boekje of andere (oninteressante) zaken, voor je vertrouwen en voor het plezier dat ik met je heb. Ik mag straks weer lekker met jou op reis en ik heb heel erg veel zin in ons nieuwe avontuur!
pleunie


About the authorPleunie Hogenkamp

140 Abouttheauthor
Curriculum vitae
Pleunie Hogenkamp was born on October 21, 1982 in Zevenaar. She completed secondary school at the Christelijk Lyceum Veenendaal in Veenendaal in 2001. She started the Bachelor program Nutrition and Health at Wageningen University and enrolled in the Master program thereafter. She completed her Master’s thesis at the Nutri-tion Department of the North West University in Potchefstroom (South Africa) where she did a literature study on the role of selenium in HIV/aids disease progression. She also inves-tigated the association between consumption of black tea and iron status in adult Africans in the North West Province by analysing data of the THUSA study, which resulted in a pub-lication in the British Journal of Nutrition. She completed an internship at the Unilever Food and Health Research Institute in Vlaardingen, and obtained her Master’s degree in November 2007.She was appointed as a PhD-fellow at the Top Institute Food and Nutrition and the Divi-sion of Human Nutrition of Wageningen University in the project ‘Effects of physical chemical properties of food on sensory satiety, metabolic satiety, reward and food intake regulation’ in January 2008. Her research focused on the role of food texture in learned satiation, as described in this thesis.During her PhD project, Pleunie joined the educational program of the graduate school VLAG, she attended several international conferences and was selected for the European Nutrition Leadership Programme. Pleunie was involved in teaching at the BSc and MSc level and she was a member of the Research Committee of the Division of Human Nutri-tion and a member and chair of the VLAG PhD-council. After finishing her PhD-thesis, Pleunie was appointed as a post-doctoral fellow at the Department of Neuroscience at the Uppsala University to continue research in the field of food intake regulation.

141Abouttheauthor
Publications in peer-reviewed journals
Hogenkamp P.S., Jerling J.C., Hoekstra T., Melse-Boonstra A., Macintyre U.E. (2008): Association between consumption of black tea and iron status in adult Africans in the North West Province: The THUSA study. British Journal of Nutrition, 100 (2), p. 430-437.
Mars M.*, Hogenkamp P.S.*, Gosses A.M., Stafleu A., De Graaf C. (2009): Effect of vis-cosity on learned satiation. Physiology and Behavior, 98 (1-2), p. 60-66. *equal authorship
Pleunie S Hogenkamp, Monica Mars, Annette Stafleu, Cees de Graaf (2010): Intake dur-ing repeated exposure to low- and high-energy-dense yogurts with different means of con-sumption. American Journal of Clinical Nutrition, 91, p. 841-847.
Pleunie S. Hogenkamp, Annette Stafleu, Monica Mars, Jeffrey M. Brunstrom, Cees de Graaf (2011): Texture, not flavor, affects the expected satiation of dairy products. Appetite, 57 (3), p. 635-641.
Pleunie S. Hogenkamp, Jeffrey M. Brunstrom, Annette Stafleu, Monica Mars, Cees de Graaf (in press): Expected satiation after repeated consumption of low or high-energy-dense soup. British Journal of Nutrition, accepted for publication.
Pleunie S. Hogenkamp, Annette Stafleu, Monica Mars, Cees de Graaf (in press): Learning about the energy density of liquid and semi-solid foods. International Journal of Obesity, accepted for publication.
Pleunie S. Hogenkamp, Monica Mars, Annette Stafleu, Cees de Graaf (submitted): Changes in ad libitum intake and appetite sensations after repeated consumption of iso-caloric liq-uid and semi-solid dairy foods.
Sanne Griffioen-Roose, Pleunie S. Hogenkamp, Monica Mars, Graham Finlayson, Cees de Graaf (submitted): Taste of a 24-h diet and its effect on food preferences and satiety.
Book contributions
Annette Stafleu, Nicolien Zijlstra, Pleunie Hogenkamp and Monica Mars. Texture and Diet Related Behavior: A Focus on Satiation and Satiety.In: Preedy, Victor R.; Watson, Ronald Ross; Martin, Colin R. (eds) Handbook of Behavior, Food and Nutrition. 2011, p. 133-142. ISBN 978-0-387-92270-6
142 Abouttheauthor
Abstracts
P.S. Hogenkamp, A. Gosses, M. Mars, A. Stafleu, C. de Graaf (2008): The effect of viscosity on learned satiation. Appetite 51 (2), p. 373.(Abstract annual meeting 2008, Society of Study of Ingestive Behaviour, poster presentation)
P. Hogenkamp, A. Gosses, M. Mars, A. Stafleu, C. de Graaf (2009): The effect of viscosity on learned satiation. EJCN 63 (S3), p. S11.(Abstract Wageningen Nutritional Sciences Forum 2009, poster presentation)
P.S. Hogenkamp, J.M. Brunstrom, M. Mars, A. Stafleu, C. De Graaf (2010): Changes in expected satiation after repeated consumption of a low- or high-energy-dense soup. Appe-tite 54 (3), p. 650.(Abstract annual meeting 2010, Society of Study of Ingestive Behaviour, poster presentation)
Pleunie Hogenkamp, Annette Stafleu, Monica Mars, Cees de Graaf (2010): Eating rate and viscosity in learned satiation. Appetite, Volume 55 (1), p. 170.(Abstract annual meeting 2010 British Feeding and Drinking Group, oral presentation)
P.S. Hogenkamp, J.M. Brunstrom, M. Mars, A. Stafleu, C. De Graaf (2011): Changes in expected satiation after repeated consumption of a low or high-energy-dense soup. Appe-tite 57 (2) p. 548.(Abstract annual meeting 2010 British Feeding and Drinking Group, oral presentation)
P. Hogenkamp, M. Mars, A. Stafleu, C. De Graaf (2011): Repeated consumption of iso-caloric liquid and semi-solid custards. Does the satiating capacity change? Appetite 57 (2), p. 561.(Abstract annual meeting 2011 British Feeding and Drinking Group, oral presentation)
143Abouttheauthor
Overview of completed training activities
Discipline specific activitiesCourse ‘Regulation of Food Intake and its Implications for Nutrition and Obesity’Society of Study of Ingestive Behaviour (SSIB) 16th annual meeting 18th annual meetingWageningen Nutritional Sciences Forum 2009
British Feeding and Drinking Group (BFDG) 33rd annual meeting 34th annual meeting 35th annual meeting17th European Congres on Obesity (ECO)Pangborn Sensory Science Symposium 8th Pangborn Sensory Science Symposium 9th Pangborn Sensory Science Symposium‘Frontiers in Ingestive Behaviour’ (SSIB) 3rd annual SymposiumBenjamin La Fayette Seminar 2011‘Epigenesis & epigenetics’ course
General courses and workshopsSeveral PhD workshops
PhD introduction weekPresentation skillsScientific writingMasterclass ‘Starting with the Client: New approaches to effective health promotion’Techniques for Writing and Presenting Scientific PapersPhilosophy and Ethics of Food Science and TechnologyPostdoc retreat Career Perspectives European Nutrition Leadership Programme (ENLP)
Optional courses and activititiesResearch presentationsPreparation research proposalsLiterature group 'Oldsmobiles' and 'Journal Club'PhD study tour Nordic Countries
Organizer & locationGraduate school VLAG, Maastricht (NL)
SSIB Paris (FR) Pittsburgh (USA)Division of Human Nutrition, Wageningen University (WU) Arnhem (NL)BFDG Swansea (UK) Maastricht (NL) Belfast (UK)EASO, Amsterdam (NL)Elsevier Florence (IT) Toronto (CA)SSIB Leeds (UK)AgroParisTech, Fréjus (FR)Graduate schools WIAS/VLAG, Wageningen (NL)
TIFN, Wageningen (NL)NWO, Utrecht (NL)Graduate School VLAG, Bilthoven (NL)Wageningen Graduate Schools (WGS), Wageningen (NL)WGS, Wageningen (NL)Graduate school VLAG & Nederlandse Zuivel Organisatie, Wageningen (NL)WGS, Wageningen (NL)WGS/Graduate School VLAG, Wageningen (NL)Postdoc career development initiative (PCDI), Heeze (NL)ENLP, Luxembourg (L)
Division of Human Nutrition (WU), Wageningen (NL)
2008
2008201020092009
2009201020112009
20092011
200920112011
20082008-201020082009200920092009
201020112011
2008-20112008-20102008-20092009

Colophon
The research described in this thesis was financially supported by Top Institute Food and Nutrition.
Financial support from Wageningen University and Top Institute Food and Nutrition for printing this thesis is gratefully acknowledged.
Coverdesign Alexander Griffioen en Pleunie S. Hogenkamp
Layoutdesign Jelle J. Botma en Pleunie S. Hogenkamp
Printing Grafisch Service Centrum Wageningen
Copyright © Pleunie S. Hogenkamp 2012
