ipv - wur e-depot home
TRANSCRIPT


IPV v2.0
Upgrading the established
inactivated polio vaccine production process
Yvonne Elisabeth Thomassen

Thesis committee
Promotor
Prof. Dr R.H. Wijffels
Professor of Bioprocess Engineering
Wageningen University
Co‐promoters
Dr W.A.M. Bakker
Senior scientist, Institute for Translational Vaccinology, Bilthoven
Dr L.A. van der Pol
Senior scientist, Institute for Translational Vaccinology, Bilthoven
Other members
Prof. Dr M.M. van Oers, Wageningen University
Prof. Dr J.J. Heijnen, Delft University of Technology
Prof. Dr ‐Ing. U. Reichl, Max Planck Institute for Dynamics of Complex Technical Systems,
Magdeburg, Germany
Dr G.M. Zijlstra, DSM Biologics, Groningen
This research was conducted under the auspices of the Graduate School of VLAG
(Advanced studies in Food Technology, Agrobiotechnology, Nutrition and Health
Sciences).

IPV v2.0
Upgrading the established
inactivated polio vaccine production process
Yvonne Elisabeth Thomassen
Thesis
submitted in fulfillment of the requirements for the degree of doctor
at Wageningen University
by the authority of the Rector Magnificus
Prof. Dr M.J. Kropff,
in the presence of the
Thesis committee appointed by the Academic Board
to be defended in public
on Tuesday 15 April 2014
at 4 p.m. in the Aula.

Yvonne E. Thomassen
IPV v2.0 ‐ Upgrading the established inactivated polio vaccine production process,
232 pages.
PhD thesis, Wageningen University, Wageningen, NL, (2014)
With references, with summaries in Dutch and English
ISBN 978‐94‐6173‐856‐1

“You have to believe. Otherwise, it will never happen.”
― Neil Gaiman (Stardust)


Contents
Chapter 1 Introduction 9
Chapter 2 Inactivated polio vaccine development for technology transfer
using attenuated Sabin poliovirus strains to shift from Salk‐IPV to
Sabin‐IPV
19
Chapter 3 Multivariate data analysis on historical IPV production data for
better process understanding and future improvements
37
Chapter 4 Development of a fast ELISA for quantifying polio D‐antigen in in‐
process samples
55
Chapter 5 Scale‐down of the inactivated polio vaccine production process 67
Chapter 6 Transfer of an adherent Vero cell culture method between two
different rocking motion type bioreactors with respect to cell
growth and metabolic rates
89
Chapter 7 Next generation inactivated polio vaccine manufacturing to
support post polio‐eradication biosafety goals
113
Chapter 8 Isoelectric point determination of live polioviruses by capillary
isoelectric focusing with whole column imaging detection
133
Chapter 9 Improved poliovirus D‐antigen yields by application of different
Vero cell cultivation methods
147
Chapter 10 General discussion
IPV v2.0 ‐ Upgrading the established inactivated polio vaccine
production process
163
References 177
Summary 199
Samenvatting 205
Dankwoord 215
Curriculum vitae 221
List of publications 225
Overview of completed training activities 229


Chapter 1
Introduction

Chapter 1
10
Polio Polio (or poliomyelitis) is a highly infectious viral disease that can cause paralysis. The
typical signature of the disease is crippled legs. Paralysis of breathing muscles may also
occur and is potentially fatal. Infections, generally localized to the small intestine, are
often asymptomatic or lead to mild symptoms such as sore throat, fever or malaise,
enteritis and diarrhea. They are caused by ingestion of fecal contamination from an
infected human. Upon infection, an immune response is elicited which results in good
protection against reinfection. On rare occasions, one in 200 cases, poliovirus enters the
blood stream and invades the central nervous system. There it infects and destroys motor
neurons, which results in the typical irreversible paralysis (Racaniello 2007). Polio cannot
be cured. However, there are highly effective vaccines available.
Poliovirus The causative agent of polio, the poliovirus, belongs to the Enterovirus genus of the
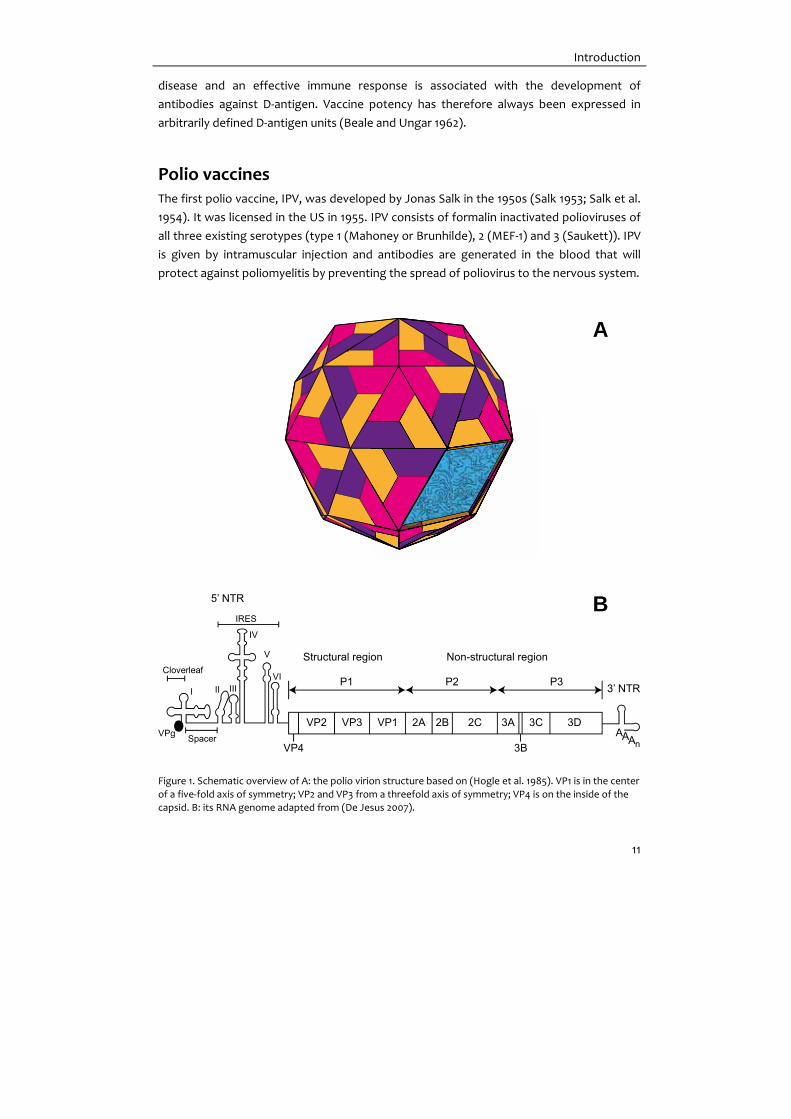
Picornaviridae family. It is a small (30 nm in diameter) non‐enveloped, positive strand RNA
virion with icosahedral symmetry (Figure 1A). Virus capsid includes 60 protomers, each
consisting of one copy of capsid protein VP1, VP2, VP3 and VP4 (Figure 1A). VP1, VP2 and
VP3 are located on the outside of the capsid while VP4 resides on the inner site of the
capsid (Hogle et al. 1985). The capsid encloses the mRNA genome, ~7500 bp in length
(Figure 1B). Its 5´ non‐coding region (~740 nt) is required for replication initiation and
ribosome entry, which is essential for cap‐independent initiation of translation (Wimmer et
al. 1993). The 3´ non‐coding region is vital for negative strand RNA synthesis. The protein
coding region, in between the 5´ and 3´ non‐coding regions, encodes a single polyprotein.
This protein can be proteolytically cleaved into precursor proteins, which give the final
four capsid proteins and seven non‐structural proteins. These are required for virus replication and assembly and include proteases (2A, 3C and 3CD), the RNA polymerase
(3D), a helicase (2C) other replication essential proteins (2B, 2BC, 3A, and 3B) and a 5´
capping protein (3B or VPg) (Wimmer et al. 1993).
Polioviruses are classified into three serotypes (type 1, 2 and 3) based on the cross‐
neutralization of poliovirus isolates by polyclonal sera raised against the different
poliovirus strains (Bodian 1951). Four major epitopes, or antigenic sites, have been
recognized. These are located on the surface‐exposed loops in of the capsid proteins VP1‐3
(Minor 1990). VP1, VP2 and VP3 also form the location for the poliovirus receptor (CD155)
which is located on cell membranes.
Two distinct antigenic forms of poliovirus exist, D‐ and C‐antigen, sometimes referred to as
N‐ and H antigen (Mayer et al. 1957). The D‐antigenic form represents the native infectious
virus whereas C‐antigen represents non‐infectious empty particles. Recovery against
Introduction
11
disease and an effective immune response is associated with the development of
antibodies against D‐antigen. Vaccine potency has therefore always been expressed in
arbitrarily defined D‐antigen units (Beale and Ungar 1962).
Polio vaccines The first polio vaccine, IPV, was developed by Jonas Salk in the 1950s (Salk 1953; Salk et al.
1954). It was licensed in the US in 1955. IPV consists of formalin inactivated polioviruses of
all three existing serotypes (type 1 (Mahoney or Brunhilde), 2 (MEF‐1) and 3 (Saukett)). IPV
is given by intramuscular injection and antibodies are generated in the blood that will
protect against poliomyelitis by preventing the spread of poliovirus to the nervous system.
Figure 1. Schematic overview of A: the polio virion structure based on (Hogle et al. 1985). VP1 is in the center
of a five‐fold axis of symmetry; VP2 and VP3 from a threefold axis of symmetry; VP4 is on the inside of the capsid. B: its RNA genome adapted from (De Jesus 2007).
VP2 VP3 VP1 2A 2B 2C 3A 3C 3D
VP4 3B
5’ NTR
3’ NTR
Structural region Non-structural region
P1 P2 P3
AAAn
VPg
Cloverleaf
Spacer
IRES
I II III
IV
V
VI
A
B

Chapter 1
12
In 1978, a method of producing a more potent IPV was developed by van Wezel in the
Netherlands (van Wezel et al. 1980). This vaccine has been referred to as enhanced‐
potency IPV (eIPV) and currently is referred to as conventional IPV (cIPV) or Salk‐IPV.
The other vaccine, oral polio vaccine (OPV), was developed in the 1960s by Albert Sabin
(Sabin and Boulger 1973) and was licensed in the US in 1961‐1962. It is a trivalent vaccine,
against all serotypes, based on attenuated poliovirus strains, the so‐called Sabin strains.
Attenuation was obtained by repeatedly passaging virulent strains of type 1 (Mahoney)
and type 3 (Leon), in monkeys under conditions that triggered high selection pressure.
Sabin type 2 originated from a naturally low neurovirulent poliovirus type 2 isolate (Sabin
and Boulger 1973). OPV is administered orally and antibodies are generated both in the
blood and, like in natural infection, a local immune response in the intestinal and nasal
mucosa, the primary sites for poliovirus entry and multiplication, is obtained (Ogra et al.
2011). This intestinal immune response can rapidly stop person‐to‐person transmission of
wild poliovirus (Okayasu et al. 2011).
Both vaccines are considered extremely safe, however, in rare occasions (1 in every 2.7 ×
106 first doses) the live attenuated vaccine, OPV, can cause paralysis (Nkowane et al. 1987).
This disease is referred to as vaccine‐associated paralytic poliomyelitis (VAPP). A second
disadvantage of the use of OPV is the possibility that the attenuated polioviruses revert
and start to circulate in a population. These viruses are known as circulating vaccine
derived polioviruses (cVDPV) and possess the same neurovirulence and transmission
properties as wild‐type polioviruses (Kew et al. 2005).
OPV was adopted by most of the countries, except the Netherlands, Sweden and Finland,
mainly due to the ease of administration and the low costs (Sabin 1985). It has also been
the main tool for use in the polio eradication program. In the last decade, an increasing
number of (polio‐free) countries have switched to IPV for routine immunization because of
its better safety profile.
Polio eradication program In 1988, the World Health Assembly adopted a resolution to eliminate wild polioviruses
globally and the Global Polio Eradication Initiative (GPEI) was established. It was estimated
that, at that time, over 350,000 children developed polio annually and polio was endemic
in 125 countries (Hadler et al. 2008). By the year 2012, the annual incidence of polio had
decreased >99.9% (to 223 cases) compared with 1988 and the number of countries where
polio is endemic had reduced to 3 (Afghanistan, Nigeria and Pakistan) (WHO 2013b) (Figure
2). Eradication of polio has shown to be more difficult than initially anticipated and the
targets for eradication have not been met, the initial target for eradication was the year

Introduction
13
2000. Eradication of wild type poliovirus type 2 has been achieved; the last wild type was
reported in India in 1999.
From 2005 to 2009 monovalent OPV (mOPV) against poliovirus type 1 and from late 2009
onwards bivalent OPV (bOPV) were used to specifically target poliovirus type 1 and 3. Both
mOPV and bOPV induced better immune responses compared to trivalent OPV indicating
interference of poliovirus type 2 in the trivalent vaccine (Sutter et al. 2010). The
introduction of mOPV and bOPV campaigns resulted in a polio‐free India in 2012, which had
long been one of the remaining endemic countries, and a rapid decrease in wild‐type polio
cases (Figure 2 insert). In 2012, the World Health Assembly declared the completion of the
polio eradication a programmatic emergency (WHO 2012b). The main reasons are the
persistence of endemic wild poliovirus transmission and the recurring outbreaks in polio‐
free countries.
Figure 2. Geographical distribution of children with polio associated with wild‐type poliovirus in 2012 and
(insert) the total number of polio cases reported and the number of countries with polio cases in the years 1996‐2012. Map and data are from WHO (www.polioeradication.org).
wild poliovirus type 1wild poliovirus type 3wild poliovirus type 1/3
endemic countriesimportation countries
0
5
10
15
20
25
30
35
0
500
1000
1500
2000
2500
1996
1997
1998
1999
2000
2001
2002
2003
2004
2005
2006
2007
2008
2009
2010
2011
2012
num
ber
ofco
unt
rie
sw
ithca
ses
Co
nfir
me
dw
ildty
pepo
lioca
ses countries
cases
Chapter 1
14
In 2013, a new strategy plan was drafted for the endgame in polio eradication. Key
objectives are i) to stop all WPV transmission by the end of 2014 and any new outbreaks
due to a cVDPV within 120 days of confirmation of the index case; ii) cVDPV elimination by
termination of OPV use (starting with type 2) and introduction of (new) inactivated
vaccines; iii) certification of polio‐free regions (3 years without cases) and safe
containment of all polioviruses; iv) transfer of the knowledge and experience from the
polio eradication program towards other health and development benefits (WHO, 2013c).
Preceding this plan the Strategic Advisory Group of Experts (SAGE) recommended that at
least one dose of IPV is introduced into all routine immunization programs to safeguard
against the withdrawal of the type 2 serotype prior to the switch from tOPV to bOPV
(excluding poliovirus type 2) (WHO 2013a). The expected global increase in IPV demands
pushes manufacturers to accommodate. The current four IPV manufacturers (GSK, Sanofi,
Staten Serum Institute, Bilthoven Biologicals (formerly Netherlands Vaccine Institute;
acquired in 2011 by Serum Institute India)) may increase production capacity and additional
IPV producers will arise, and will likely be situated in the new economies. In addition, the
large difference in cost prices for IPV (at $3/dose) and OPV (at $0.15‐0.20/dose) (Venczel et
al. 2009) and the ability from the new markets to carry those additional costs requires an
endeavor for IPV cost price reduction. Moreover, in view of biosafety aspects after
achievement of polio eradication, the use of wild type viruses in areas with potential low
vaccine coverage should not be established. Development of an IPV production process
using attenuated Sabin strains may open the possibility for new industries to meet the
biosafety criteria.

Introduction
15
Thesis outline With polio eradication on our doorstep, the World Health Organization is pursuing a new
IPV based on non‐wild‐type strains to increase the biosafety of vaccine manufacturing
(Aylward et al. 2006; Heymann et al. 2005). In addition, and due to the pending OPV
cessation, the demand for affordable IPV is increasing (Venczel et al. 2009). To
accommodate these questions two research programs were started at the Netherlands
Vaccine Institute. One concerned optimization of the current Salk‐IPV production process,
the other the manufacturing of an affordable Sabin‐IPV with the aim of technology
transfer to developing countries manufacturers.
Figure 3. Thesis outline. Starting from analyzing the routine Salk‐IPV manufacturing a representative model at lab‐scale was developed. This model was further used to quickly implement preparation of a next
generation IPV based on Sabin strains with minor process development. Ongoing steps, not described in
this thesis, are indicated in grey boxes.
In the 1970s, the widely used production process for IPV, one of the first large scale cell
culture based biological production processes, has been developed in Bilthoven (the
Netherlands). IPV manufacturing has been part of the regular vaccine manufacturing
program ever since. The history and past process developments in IPV manufacturing are
described in Chapter 2. Although IPV manufacturing has been ongoing for decades, the
development knowledge had faded with time. To overcome the existing gap in process
knowledge and increase process understanding the current manufacturing process was
Technology transfer
Process optimization of Salk-IPV
Alternative equipment
Routine Salk-IPV Manufacturing
Process understanding
Lab-scale equivalent for complete process
Analysis development forin-process quantification
Sabin-IPV process development
Sabin-IPV clinical lot production
Process optimization of Sabin-IPV
Characterizationof Sabin virus

Chapter 1
16
analyzed using multivariate data analysis (Chapter 3). This statistical method allows
presentation and subsequent interpretation of large datasets with many variables. Both
the analysis and the data acquisition provided important knowledge for the present
process developers.
One of the gaps in the data was located in product quantification during processing. The
available assay for D‐antigen concentrations had high variability. A so‐called fast D‐antigen
ELISA was established which could be used to measure the D‐antigen concentrations in
the different matrixes present during the production process (Chapter 4). Based on the
refreshed knowledge, a scale‐down model of the IPV production line was setup (Chapter
5). This lab‐scale equivalent allows studying effects of process changes which might be
related to for instance process optimization. The unit operations from the established
scale‐down model can be used separately, as well as sequentially, to study variations and
critical product attributes in the production process. The benefit of a good scale‐down
model is the possibility of direct implementation of changes, which for instance result in
process optimization, at large scale without intermediate pilot scale studies. The further
studies on process optimization for the Salk‐IPV based on this model are not described in
this thesis. Alternatively, for practical reasons, the work continued aiming at Sabin‐IPV
development.
The upcoming of disposables in GMP manufacturing triggered the study on alternatives
for the first filtration unit (clarification) (Chapter 5) and alternative, Wave‐type,
bioreactors (Chapter 6). This type of bioreactors makes use of sterilized disposable bags,
which could be beneficial in a GMP environment.
In view of WHOs pursuit towards an IPV manufacturing process with increased biosafety
the development of Sabin‐IPV, an IPV based on the attenuated Sabin strains, was taken up.
Prior to the production of Sabin‐IPV clinical lots a proof of principle study was done
(Chapter 2). Subsequently and using the available IPV scale‐down model, Sabin strain
specific adaptations like MOI and lower virus culture temperature were studied. To be
able to quickly show proof‐of‐principle, no further process optimization and/or
modernization was done and the manufacturing of Sabin‐IPV was carried out (Chapter 7).
An immunogenic product both in animals (Chapter 7) and in humans (Verdijk et al. 2013)
was successfully prepared. However, the product yield was extremely low and further
process development is needed to obtain an affordable Sabin‐IPV. Especially the yield of
Sabin poliovirus type 2 after ion exchange chromatography was low. To determine if this
effect could be due to a difference in the isoelectric point (pI) of the poliovirus a method
for pI measurement of live virus was developed (Chapter 8). In parallel, studies to increase
virus yields during upstream processing were done. Methods for cultivations at increased

Introduction
17
cell densities, using an animal component free medium, were compared for their effect on
virus yields (Chapter 9).
In Chapter 10, the results described in the thesis are summarized and discussed with
respect to future inactivated polio vaccine manufacturing at affordable costs.


Chapter 2
Inactivated polio vaccine development for
technology transfer using attenuated Sabin
poliovirus strains to shift from Salk‐IPV to Sabin‐IPV
Published as:
Bakker, W.A.M., Thomassen, Y.E., Van ’t Oever, A.G., Westdijk, J, van Oijen M.G.C.T.,
Sundermann, L.C., Van ’t Veld, P., Sleeman, E., van Nimwegen, F.W., Hamidi, A., Kersten,
G.F.A., van den Heuvel, N., Hendriks, J.T., van der Pol, L.A. (2011) Inactivated polio vaccine
development for technology transfer using attenuated Sabin poliovirus strains to shift from
Salk‐IPV to Sabin‐IPV.
Vaccine 29(41):7188‐7196
dx.doi.org/10.1016/j.vaccine.2011.05.079

Chapter 2
20
Abstract Industrial‐scale inactivated polio vaccine (IPV) production dates back to the 1960s when at
the Rijks Instituut voor de Volksgezondheid (RIV) in Bilthoven a process was developed
based on micro‐carrier technology and primary monkey kidney cells. This technology was
freely shared with several pharmaceutical companies and institutes worldwide. In this
contribution, the history of one of the first cell‐culture based large‐scale biological
production processes is summarized. Also, recent developments and the anticipated
upcoming shift from regular IPV to Sabin‐IPV are presented. Responding to a call by the
World Health Organization (WHO) for new polio vaccines, the development of Sabin‐IPV
was continued, after demonstrating proof of principle in the 1990s, at the Netherlands
Vaccine Institute (NVI). Development of Sabin‐IPV plays an important role in the WHO
polio eradication strategy as biocontainment will be critical in the post‐OPV cessation
period. The use of attenuated Sabin strains instead of wild‐type Salk polio strains will
provide additional safety during vaccine production. Initially, the Sabin‐IPV production
process will be based on the scale‐down model of the current, and well‐established, Salk‐
IPV process. In parallel to clinical trial material production, process development,
optimization and formulation research is being carried out to further optimize the process
and reduce cost per dose. Also, results will be shown from large‐scale (to prepare for
future technology transfer) generation of Master‐ and Working virus seedlots, and clinical
trial material (for phase I studies) production. Finally, the planned technology transfer to
vaccine manufacturers in low and middle‐income countries is discussed.

IPV development for technology transfer
21
Introduction As a result of continuous WHO‐efforts polio eradication is moving forward. The first
milestone, cessation of wild‐type poliovirus transmission, is now anticipated by the end of
2012 (WHO 2010a). However, even after polio eradication, countries may consider to
continue immunization against poliomyelitis to prevent the risk of a global outbreak due
to accidental or deliberate re‐introduction of the virus. Following the demonstration of a
proof of principle in the 1990s (Kersten et al. 1999) and responding to WHO's call for new
polio vaccines (Aylward et al. 2006; Heymann et al. 2005), the Netherlands Vaccine
Institute (NVI) continued the development of a Sabin‐IPV (inactivated poliovirus vaccine,
based on attenuated ‘Sabin’ poliovirus strains, formalin‐inactivated, injectable). In this
contribution, a short history of one of the first cell‐culture based large‐scale biological
production processes, and the roadmap towards Sabin‐IPV is presented. Finally, the future
perspectives will be addressed.
Global polio eradication initiative & rationale for Sabin‐IPV development
The prevalence of poliovirus has largely been decreased by the use of Oral Polio Vaccine
(OPV), based on life‐attenuated Sabin polio strains. However, OPV appears less fit for the
post‐eradication era. Therefore, development of Sabin‐IPV plays an important role in the
WHO polio eradication strategy (www.polioeradication.org). The use of attenuated Sabin
instead of wild‐type Salk polio strains will provide additional safety during vaccine
production. Moreover, to prevent the emergence of circulating vaccine‐derived
polioviruses (cVDPVs), the use of OPV should be discontinued following polio eradication,
and replaced by IPV. These cVDPVs are transmissible and can become neurovirulent
(similar to wild polioviruses) resulting in vaccine associated paralytic poliomyelitis (Agol
2006; Kew et al. 2005). Such strains can potentially re‐seed the world with polioviruses and
negate the eradication accomplishments (Minor 2009). Containment in appropriate
facilities, reduction of reversion risks in virus passaging, and inactivation of the Sabin
strains will further minimize this risk.
Most experts agree that worldwide use of IPV is preferable (Chumakov and Ehrenfeld
2008; John 2009; Minor 2009) because of its proven protective track‐record and safety.
However, when compared to OPV, the cost‐prize for IPV is significantly higher (Heinsbroek
and Ruitenberg 2010; John 2009; WHO 2010b). This is mainly due to requirements for: (i)
more virus per dose; (ii) additional down‐stream processing (i.e. concentration,
purification and inactivation), and the related QC‐testing, and (iii) containment. Until now,
the financial challenge has been a major drawback for IPV innovation and implementation
in low and middle‐income countries. Therefore, cost‐prize reduction is a primary objective
in the development of a new IPV. The additional biosafety properties are in favour of using
Sabin polio strains in such an endeavour.

Chapter 2
22
Overview of worldwide Sabin‐IPV development activities
In the past decades several attempts have been made to prepare a Sabin‐IPV product (Doi
et al. 2001; Kersten et al. 1999; Murph et al. 1988; Simizu et al. 2006). From these studies it
appeared that, relative to using wild‐type (Salk) strains for regular IPV, more Sabin virus
(or D‐antigen) was required to induce comparable levels of immune response. For this
reason some companies stopped their Sabin‐IPV development programmes in the past
decade. However, activities continued elsewhere due to shifting factors in the risk–
benefit–cost equation (Ehrenfeld et al. 2009), and the product has been reported in
various stages of development. The Japanese Polio Research Institute (JPRI) conducted
clinical studies (Doi et al. 2001; Simizu et al. 2006), and entered in collaboration with
Takeda for the commercialization (Hickling 2010; Venczel et al. 2009). Recently, the
Chinese Academy of Medical Sciences (Kunming Institute of Medical Biology), conducted
phase II studies (Liao et al. 2010). Early 2011, in the Netherlands, the research and
development and clinical departments of the NVI have rejoined the National Institute for
Public Health and the Environment (RIVM). Therefore, Sabin‐IPV development is now done
at RIVM, and consequently RIVM is planning phase I studies in 2011. In Table 1 the chosen
D‐antigen amounts per dose for Sabin‐IPV are given. From these data it can be concluded
that in all cases the target dose for type 1 was chosen lower, for type 2 higher, and for type
3 equal or higher, when compared to that for regular Salk‐IPV.
Table 1. Sabin‐IPV target D‐antigen dose used in clinical studies and compared to the dose of regular Salk‐
IPV.
Salk‐IPV (DU shd‐1) Sabin‐IPV (DU shd‐1)
Murph
(1988)
Doi
(2001)
Simizu
(2006)
Liao
(2010)
NVI plan
2011
Type 1 40 20 30 3 30 10
Type 2 8 12.5 30 100 32 16
Type 3 32 35 50 100 45 32
DU shd‐1 = D‐antigen Units per single human dose of 0.5 mL
Several differences in immune response between Salk‐IPV and Sabin‐IPV have been found
(Table 1) and multiple efforts have been made to understand this. For example, antigenic
properties and immunogenicity of Sabin‐IPV are being studied using various methods and
techniques at different laboratories (Dragunsky et al. 2004; Martin et al. 2003; Tano et al.
2007). This makes the interpretation and comparison between the various laboratories
challenging. Therefore, standardization in analytics and quantification is being strived for
and advised (Baca‐Estrada and Griffiths 2006; Kersten et al. 1999; Minor 2006).
In order to achieve cost‐prize reduction, both the production process and the immune
response should be optimized. In addition to that, new stable and attenuated seed strains
could be developed such that favourable immunogenic properties are included (Venczel et

IPV development for technology transfer
23
al. 2009) and containment costs might be reduced. However, activities in this field are
relatively recent (Cello et al. 2002; Macadam et al. 2006; Vignuzzi et al. 2008) and
implementation of this approach in a GMP setting needs to be expedited. While polio
eradication is moving forward, an alternative for OPV should become available shortly.
Therefore, in the current study the readily available Sabin polio strains were used to
prepare a Sabin‐IPV product. Phase I clinical trial materials were prepared according to the
current Salk‐IPV production process. Further optimization of the production process is
part of a parallel research and development effort, in which also optimization of the
immune response is studied by alternative inactivation methods (Jiang et al. 1986) and the
use of adjuvants (Dragunsky et al. 2004; Yang et al. 2009).
Salk‐IPV technology by Anton van Wezel IPV production at NVI (and its predecessors RIVM and RIV) dates back to the 1950s. Later,
in the 1960s at the RIV in Bilthoven, a process was developed based on micro‐carrier
technology and primary monkey kidney cells. This technology, developed by Anton van
Wezel (van Wezel 1967; van Wezel 1985; van Wezel et al. 1979; van Wezel et al. 1984) and
co‐workers, was freely shared with several pharmaceutical companies (GSK, Sanofi
Pasteur, Novartis) and institutes worldwide. Even today, at various locations, comparable
processes are in operation for the production of polio (Duchene 2006; Montagnon et al.
1983; Vidor et al. 1997) and other viral vaccines (van Wezel et al. 1984; van Wezel et al.
1978).
The IPV production process has been described earlier (Duchene et al. 1990; Montagnon et
al. 1983; van Wezel 1985; van Wezel et al. 1979; van Wezel et al. 1984). Therefore, here it is
outlined in short and a schematic overview is given in Figure 1. Cell culture can be divided
in three scale‐up stages. The process is started by batch‐wise cell‐growth on Cytodex 1
micro‐carriers (GE Healthcare) in a 15 L pre‐culture bioreactor on serum supplemented cell‐
culture medium. Subsequently, for scale‐up, cells are detached from the micro‐carriers by
trypsinization. In the second stage the working volume is increased to 40 L, and extra
micro‐carriers are added. After an initial batch period, recirculation with fresh medium is
started. In this way, up to 5 × 10⁶ viable cells mL‐1 are obtained. For further scale‐up, cell
detachment is performed externally in a trypsinization unit. Finally, the cell harvest is split
into two identical (or ‘twin’) production vessels. In this third stage, the cells are grown up
to 1.5 × 10⁶ viable cells mL‐1 in a batch‐wise mode. On average, the total time‐line for the cell
culture stages is 15 days. For virus replication, cell‐culture medium is drained and replaced
by serum‐free medium. Temperature is lowered and seed‐virus is added. After three to
four days (when full cytopathological effect is observed) poliovirus is harvested. Virus is
purified by filtration (clarification by a series of filters, followed by 100 kD cut off
ultrafiltration), size exclusion chromatography (SEC) on Sepharose CL‐6B (GE Healthcare)

Chapter 2
24
Figure 1. Schematics of the inactivated polio vaccine production process. During upstream processing cells are expanded using two pre‐culture steps prior to cell culture and virus culture. The downstream
processing consists of clarification, concentration, size exclusion chromatography and ion exchange
chromatography followed by inactivation. To obtain trivalent polio vaccine this procedure is followed for each poliovirus type separately prior to mixing for end product formulation.
and ion exchange chromatography (IEX) on DEAE Sephadex A‐50 (GE Healthcare) in a
phosphate buffer. To the processed virus, M199 and glycine (final concentration 5 g L‐1) are
added and the fluid is filtered through a 0.22 μm pore size filter (Millipak‐200, Millipore)
prior to inactivation. Inactivation is performed using 0.025% formalin during 13 days (with
in between 0.22 μm filtration) at 37 °C according to World Health Organization (WHO)
requirements. In summary, some unique characteristics of this platform production
process are:
• Cell culture start‐up directly from the ampoule into the pre‐culture bioreactor
(van Wezel 1985).
• Use of micro‐carriers as surface for adherent cell culture and scale‐up in
bioreactors (van Wezel 1967).
• Efficient scale‐up using industrial‐scale production vessels in only three pre‐
culture expansion steps (Van Wezel and van der Velden‐de Groot 1978).
• Application of engineering principles to animal cell‐culture, resulting in no
requirement for additional oxygen sparging (van Hemert et al. 1969; Van Wezel
and van der Velden‐de Groot 1978).
Up-Stream Processing (USP)VERO cellsMicro-carriersMedia
1 pre-culturest nd2 pre-culturetrypsinization trypsinization cell and virus culture
virus
Down-Stream Processing (DSP)
clarification concentration SEC IEX inactivation

IPV development for technology transfer
25
• Serum‐free production stage due to washing‐steps and media exchange before
virus inoculation (Van Wezel and van der Velden‐de Groot 1978).
• Highly purified virus, resulting in relatively low levels of host‐cell proteins (below
0.3 μg protein nitrogen/dose) (van Wezel et al. 1979; van Wezel et al. 1984), and
host‐cell DNA (below 5 pg/dose) (Montagnon et al. 1984; van Wezel et al. 1981) in
the trivalent vaccine.
• Applicable to various viral vaccines (van Wezel et al. 1979; van Wezel et al. 1978).
Scale‐up in bioreactors (Bilthoven units)
The IPV production process has been updated several times. Initially, starting in the 1950s,
primary monkey kidney cells growing in monolayers in culture flasks were used to replicate
the poliovirus. However, seeing the growing IPV demand, soon scale‐up and reduction of
the required number of monkeys became major objectives (van Wezel 1981; van Wezel et
al. 1980). This resulted in using the micro‐carrier technology (van Wezel 1967) in
combination with the so‐called “Bilthoven Units” (bioreactor vessels and control units
originally used for microbial cultures) (van Hemert et al. 1969) for large‐scale (up to 300 L)
production in the 1970s (Van Wezel and van der Velden‐de Groot 1978). Further, secondary
and tertiary monkey kidney cells were used from the 1980s onwards (van der Velden‐de
Groot 1995). Also in the mid 1980s, industrial scale (700 L) micro‐carrier based cell cultures
were realized in twin 350 L bioreactors. Subsequently, in 2004 the Vero cell line was
introduced at NVI, followed by scale‐up to twin 750 L bioreactors in 2005. Although polio
eradication might be on the doorstep the innovation and optimization remains a topic of
attention. An example of such a possible innovation is the development of Sabin‐IPV based
on attenuated polio strains. Moreover, awareness regarding the potential risk of
introducing foreign agents is growing and may require the development of production
processes free of animal‐derived components.
Scale‐down for future improvements
From the substantial history in polio vaccine production at RIV, RIVM and NVI, a valuable
data set has been generated. It comprises more than 60 production runs, based on Vero
cell culture, at two different (350 L and 750 L) bioreactor scales. To extract relevant
information, like operating ranges, multivariate data analysis (MVDA) was applied (Bakker
et al. 2010; Thomassen et al. 2010). This statistical approach is stimulated by ICH to improve
the scientific understanding of production processes for trouble shooting, and to support
better process control. Subsequently, based on the MVDA analysis, a scale‐down model of
the current twin 750 L bioreactors has been setup for both up‐steam processing (USP: cell‐
and virus‐culture) (Bakker et al. 2010) and down‐stream processing (DSP: clarification,
concentration, purification and inactivation) unit operations. Currently, at this lab‐scale,
both USP and DSP approximate the large‐scale process and improvement studies are in
progress. This includes the application of other culture methods at increased cell densities,

Chapter 2
26
animal component free media, and optimizations by a design‐of‐experiments approach
(e.g. for nutrients, micro‐carrier concentration, multiplicity of infection (MOI)) in multiple
parallel bioreactors.
Figure 2. Purification of Sabin type 3 poliovirus. Panel A: Chromatogram of SEC, grey lines indicate product collection; Panel B: Chromatogram of IEX, grey lines indicate product collection; Panel C: SDS‐Page, Lane M:
Marker; Lane 1: Clarified virus harvest; Lane 2: Purified and inactivated Sabin type 3 product. Bands in lane 2
represent the viral proteins VP1 (33 kDa) VP2 (30 kDa) and VP3 (26 kDa).
Sabin‐IPV development Before moving to the preparation of clinical trial material, initial proof‐of‐principle studies
have been done to confirm immunogenicity of Sabin‐IPV. For that, monovalent OPV bulk
products were provided by the largest WHO pre‐qualified OPV Manufacturer (Bio Farma,
Indonesia) to subsequently prepare Sabin‐IPV, using the Salk‐IPV scale‐down model of the
DSP unit operations (see Figure 1). In these lab‐scale proof‐of‐principle studies 10–20 L OPV
bulk per virus type was purified and inactivated by formalin treatment. In Figure 2, an
example of results for purification of Sabin virus is given. Initial purification is done using
SEC (Figure 2A) to separate virus (2nd peak) from large (intra‐cellular) molecules (1st peak).
During the following IEX (Figure 2B) impurities are bound to the column matrix and the
product remains unbound. SDS‐PAGE (Figure 2C) shows the starting material (Lane 1)
compared to the purified product (Lane 2). The purified and inactivated viruses are
subsequently formulated in a trivalent Sabin‐IPV. The obtained trivalent product was used
for characterization and formulation studies, and immunogenicity studies in rats. The
results showed that the product was immunogenic in rats and indicated future human
dose requirements (Table 1). Purification of OPV bulks using the scale‐down model was
successful. This implies that current OPV manufacturers could, in principle, switch to IPV
020406080
100120140
B
mA
U
0.00 0.20 0.40 0.60 0.80
CV
050
100
150200250300
mA
U
0.00 0.10 0.20 0.30 0.40 0.50
CV
A 350
M 1 2
14
22
31
45
6697
116200
C

IPV development for technology transfer
27
production by implementation of the DSP unit operations. However, for IPV production
relatively large quantities of virus are required (approximately a factor 100–800 more,
depending on the subtype and assumed in‐process yields) when compared to that for OPV
(Duchene et al. 1990; Kreeftenberg et al. 2006). Consequently, the cell‐ and virus‐culture
capacity should be scaled up accordingly. Therefore, from this point in the development
no OPV was used anymore as a starting material for DSP, and a switch was made to in‐
house USP (cell‐ and virus‐culture) at lab‐ and production‐scale.
Scale‐up–scale‐down approach
The Sabin‐IPV production process was based on the scale‐down model of the current, Salk‐
IPV process (using wild‐type poliovirus strains). After the proof‐of‐principle studies and
using the scale‐down model (Bakker et al. 2010; Thomassen et al. 2010), Sabin‐strain
specific adaptations like MOI and a lower virus culture temperature were initially studied
at lab‐scale to confirm earlier findings from large‐scale OPV production (Kreeftenberg et
al. 2006; van der Velden‐de Groot 1995). Additionally, the clarification unit was
modernized, using disposable filters (Millipore) instead of a Celite cake for depth‐filtration.
Subsequently, specifications were derived for the large‐scale operation. The resulting
Sabin‐IPV process was then developed up to a production‐scale (i.e. two 350 L bioreactors;
working volume) using well‐established equipment to produce inactivated trivalent polio
vaccine (according to current GMP‐guidelines) for pre‐clinical studies and clinical trial
purposes. The Sabin‐IPV product thus obtained meets the current European release
criteria for Salk‐IPV and will follow, where appropriate, WHO guidelines. To be able to
quickly show proof‐of‐principle, no further process optimization and/or modernization
(e.g. application of increased cell densities or replacement of animal‐derived components)
was done in this stage of process development. In parallel to production of the clinical trial
material, further process development, optimization and formulation research is being
carried out to optimize the process and ultimately reduce cost per dose. For that, a scale‐
down/scale‐up approach is being followed (Oosterhuis 1984; Rathore et al. 2005a; Rathore
et al. 2005b; Sweere et al. 1987). In summary, the scheme in Figure 3 will be applied for
shifting from large‐scale routine Salk‐IPV, via the lab‐scale equivalent, to future Sabin‐IPV
production. Initially, the lab‐scale process will be used for training purposes. Next, the
optimized process will be used at pilot‐scale. Technology transfer will allow local
manufacturers to implement the production‐scale version in their own facilities.

Chapter 2
28
Figure 3. Schedule for shifting from routine Salk‐IPV to Sabin‐IPV production by using a scale‐down
approach. The first two panels on the left have been done. Currently, improvements and optimization are studied at lab‐scale. Ultimately, the optimized process will be used at pilot‐scale for Technology Transfer
purposes
Virus seedlot (master & working) production
New Sabin polio master‐ and working‐virus seeds were prepared in compliance with cGMP‐
guidelines and viral safety guidelines using the routinely used NVI Vero working cell bank
(derived from the WHO Vero cell bank no. 87‐10). The virus master‐ and working‐seedlots
were prepared at a relatively large size (10 L and 350 L bioreactor working volume,
respectively) for this stage of product development. This was done to anticipate for future
technology transfer purposes and the related distribution of working seedlots to
collaborating partners.
Sabin poliovirus strains (starting materials) used for master seedlot production were
chosen as close as possible to the Sabin original strains:
• WHO Type 1 (LSc 2ab KP2), OPV (Sabin) Seed (SO+1 = Sabin Original + 1 passage)
1976 Behringwerke (supplied by WHO to RIVM in 1990).
• WHO Type 2 (P712 Ch2ab‐KP2): OPV (Sabin) Seed (SO+1) 1976 Behringwerke
(supplied by WHO to RIVM in 1990).
• Type 3 (Lot 457‐III‐Pfizer) RSO1 (RNA‐derived virus from Sabin strain Leon 12a1b),
1963 Pfizer (supplied by Institut Mérieux to RIVM in 1991).
From the produced master seedlots working seedlots were prepared. Production of both
master and working virus seedlots was done using the following conditions. Vero cell
cultivation setpoints were: T = 37 °C; DO = 50%; pH = 7.2. Virus cultivations setpoints were: T
Clinical lot
Salk-IPV
Routine
GMP
Production
Lab-scale equivalent
USP & DSP
MVDA for
Process
understanding
Sabin-IPV
Lab-scale
equivalent used
to set new specs.
Production
(GMP)
-
Salk-IPV & Sabin-IPV
At lab-scale &
Study improvements
optimize
pilot-scale
Scale-up to
Technology Transfer
for GMP
Production

IPV development for technology transfer
29
= 32.5 °C; DO = 25%; pH = 7.4. For master seedlots the used MOI for types 1, 2, and 3 was
0.04, 0.008, and 0.1, respectively (based on using one complete ampule and nominal
titers). The MOI used for working seedlots was 0.01 independent of the virus type. Master
seedlots were filled in 1, 10 and 20 mL vials, working seedlots were filled in 20, 25, 50, 100
and 125 mL vials. The obtained virus titers in the master‐ and working‐seedlots (Table 2)
meet general production requirements.
Table 2. Sabin poliovirus Master‐ and working seedlots virus titers (determined on Vero cells).
Sabin poliovirus Master seedlot Working seedlot
virus titer (Log10 CCID50 mL‐1) virus titer (Log10 CCID50 mL‐1)
Type 1 8.85 8.90
Type 2 7.52 7.55
Type 3 8.23 8.45
(Pre)clinical trial material production of Sabin‐IPV
Using the newly generated working seedlots, Sabin‐IPV was produced at production‐scale
(2 × 350‐L bioreactor working volume) under cGMP according to the slightly modified
(regarding MOI, virus culture temperature, and clarification unit) Salk‐IPV production
process. In this way, for each Sabin polio type two monovalent pools were produced (6
monovalent pools in total). Awaiting Quality Control testing for release for human use, the
pre‐clinical tests are being performed. The clinical phase I study is anticipated in 2011.
Table 3. Sabin poliovirus and D‐antigen yields per cell (this study) compared to that for Salk poliovirus
(Montagnon et al. 1981).
Vero cells1)
(×106 cells
mL‐1)
Virus titer1)
(Log10 CCID50
mL‐1)
D‐antigen1)
(DU mL‐1)
DU / cell
(×10‐5 DU
cell‐1)
Virus / cell
(CCID50 cell‐1)
DU / virus
[×10‐7 DU
CCID50‐1]
Type 1 Sabin 1.10 ± 0.22 8.65 ± 0.18 120 ± 9.42 11 402 2.7
Type 1 Salk 1.52 ± 0.69 8.25 ± 0.14 84.8 ± 8.68 5.6 117 4.8
Type 2 Sabin 0.97 ± 0.22 7.77 ± 0.26 24.5 ± 1.29 2.5 60 4.2
Type 2 Salk 1.06 ± 0.15 8.18 ± 0.46 20.3 ± 4.72 1.9 144 1.3
Type 3 Sabin 0.97 ± 0.14 8.28 ± 0.27 55.7 ± 11.0 5.7 195 2.9
Type 3 Salk 0.80 ± 0.27 7.83 ± 0.60 54.3 ± 9.96 6.7 83 8.1 1) average and standard deviation are given Sabin (n=4) Salk (n=6)
Despite the long‐standing history, polio production yields from cell culture stages are rare
in literature. To the authors knowledge no data on Sabin polio replication in Vero cells is
available in literature. Therefore, an initial comparison with Salk polio production data
available from Institut Mérieux (Montagnon et al. 1981) was made (Table 3). The observed
D‐antigen levels appear comparable for Salk and Sabin types 2 and 3, and slightly higher
for Sabin type 1 when compared to Salk type 1 (Table 3). However, direct comparison of D‐

Chapter 2
30
antigen concentrations (DU mL‐1) is questionable as other Vero cell densities and
experimental conditions were used. Therefore, yields per cell may give a better
comparison. From this, DU per cell and virus per cell appeared to be in the same order of
magnitude, where Sabin type 1 appears to be slightly higher. However, the amount of D‐
antigen per infectious virus particle appeared comparable (i.e. in the same order of
magnitude) for all types at approximately 4 × 10⁻⁷ DU/CCID50.
Before starting clinical studies pre‐clinical trivalent products (both Al(OH)3‐adjuvated and
non‐adjuvated) have been made for toxicity studies in New Zealand white rabbits. The
product requirements were extracted from EP (Ph Eur 6.7:0214 ; Ph Eur 6.3:0153) and WHO
guidelines (WHO 2002a; WHO 2004; WHO 2002b). Toxicity studies did not show vaccine
related toxic effects. A target vaccine dose was derived from immunogenicity studies
(described in the next paragraphs). The tested doses (chosen double compared to the
target dose) were 10–16–32 DU shd‐1 (D‐antigen Units per single human dose) for
adjuvated Sabin‐IPV, and 20–32–64 DU shd‐1 for plain Sabin‐IPV. Also Salk‐IPV was included
in these studies as a reference. The monovalent pools and the final lots (filled in vials) are
also used in stability studies at 2–8 °C, which will run for several years (four years for the
monovalent pools and three years for the final lot).
Plans for further process improvements
Animal derived components (e.g. bovine serum and trypsin) have been used in the current
Sabin‐IPV manufacturing. These components should preferably be replaced by animal
origin free alternatives to minimize the risk of adverse effects (e.g. the potential transfer
of viruses and/or prions). Therefore, the use of defined and animal‐component free cell
culture media is being investigated (Rourou et al. 2009a; Rourou et al. 2009b). Moreover a
better scientific understanding of the process resulting in improved process control and
ability for trouble shooting can be created. Another potential improvement can be found
in the currently used, relatively low, cell densities (at approximately 1 × 10⁶ cells mL‐1).
Assuming comparable virus quality and yields per cell, the use of increased cell densities
can potentially result in more efficient use of bioreactor capacity, and ultimately reduce
the cost per dose. The use of increased cell densities is a well‐known approach that can be
adapted from (heterologous) protein production processes. A drawback is the strictly
adherent growth (to micro‐carriers) of the Vero cells without carry‐over. This limits the
maximum obtainable cell‐densities in suspended bioreactor cultures to a relatively lower
level when compared to single cell suspension cultures. A start has been made to find
alternative cell culture methods to obtain high cell densities prior to virus cultivation or for
cell expansion. First experiments in animal‐component free media have yielded adherent
Vero cell concentrations of approx. 8 × 10⁶ cells mL‐1. Another limitation at higher cell
densities could be oxygen supply that may need to shift from head space aeration to
(mild) sparging (without causing adverse effects on the cells on microcarriers).

IPV development for technology transfer
31
Antigenicity, immunogenicity and standardization
Experimental lots (formulated both from lab‐scale, and large‐scale production) were
characterized for their antigenic and immunogenic (rat potency test) properties. The
immunogenicity of Sabin‐IPV was compared with that for the Salk‐IPV international
reference in rats. Sabin‐IPV type 1 immunogenicity per DU appeared to be higher than that
for Salk‐IPV. Immunogenicity of Sabin‐IPV type 2 per DU vaccine was lower as compared to
that of Salk‐IPV. Both Sabin‐IPV and the Salk‐IPV type 3 have comparable immunogenicity
per DU. This confirms earlier findings (Kersten et al. 1999). However, the use of Salk and
Sabin strains and the absence of a clinically tested Sabin‐IPV reference vaccine
compromises proper quantification. Ideally, a comparison based on active concentration
should be made. A detailed antigenic and immunogenic evaluation, addressing this
problem will be published elsewhere (Westdijk et al. 2011).
Table 4. Proposed D‐antigen content per single human dose (DU/shd) of Sabin‐IPV and Aluminum hydroxide
adjuvated Sabin‐IPV for phase I clinical studies.
Dose Sabin‐IPV
(type 1 – 2 – 3) (DU shd‐1)
Aluminum hydroxide adjuvated Sabin‐IPV
(type 1 – 2 – 3) (DU shd‐1)
High 20 – 32 – 64 10 – 16 – 32
Middle (target) 10 – 16 – 32 5 – 8 – 16
Low 5 – 8 – 16 2.5 – 4 – 8
Optimization of the immune response
From formulation research and rat potency testing, the target plain (non‐adjuvated) Sabin‐
IPV dose was set to 10–16–32 DU shd‐1 (for type 1, 2 and 3, respectively). For a comparison,
the Salk‐IPV reference is 40–8–32 DU shd‐1. In addition, to indicate possibilities for dose
sparing purposes, the use of an adjuvant (available in the public domain) was also studied.
Aluminum hydroxide increased the potency (dose 5–8–16 DU + 0.5 mg aluminum
hydroxide per dose) in rats with a factor 2–3 (type 1 and 3) or with a factor 2–4 (type 2).
From these results the proposed phase I clinical trial doses shown in Table 4 were derived.
Technology transfer RIV, RIVM and NVI have a long‐standing experience in large scale bioreactor‐based
bacterial and viral vaccine manufacturing and formulation, including combination vaccines
such as DPT–IPV (diphtheria–pertussis–tetanus–IPV). As Dutch governmental agencies, the
NVI and the RIVM strive to meet national public objectives but also contribute to
international goals such as to increase access to relevant vaccine technology for
Developing Country Vaccine Manufacturers (DCVM) (Jadhav et al. 2008; Milstien et al.
2007). A recent example of technology transfer by the NVI to DCVM partners is Hib

Chapter 2
32
(Haemophilus influenzae type b) as bacterial conjugate vaccine (Hong et al. 1996;
Kreeftenberg and Hamidi 2007).
Figure 4. Overview of the transfer of know‐how related to polio vaccine production. In the 1970s micro‐
carrier technology was transferred to different companies/institutes. After that, various courses were organized, and bulk product was supplied to local manufacturers. Sabin‐IPV technology transfer will
continue this tradition.
The transfer of know‐how related to polio vaccine manufacturing has been a continuous
activity since the 1970s and transferring the Sabin‐IPV technology will be a next step in this
existing tradition (Figure 4). For example, in the 1990s RIVM participated in a World Bank
project to transfer large‐scale production know‐how on OPV, Measles Virus, and DPT to
China (Kreeftenberg et al. 2006; van Noort 1992). This project not only included the
process development for these vaccines at the scale needed for the Chinese market, but
also the design, commissioning, realization and validation of the relevant equipment and
GMP compliant buildings for vaccine facilities in Kunming, Lanzhou and Shanghai.
Currently, the Kunming facilities are still in use to manufacture their Sabin‐IPV product
(now in phase II studies; see Table 1). Projects like the China Vaccine Project and the Hib
vaccine project had a worldwide impact on both the vaccine prices and the accessibility to
modern technologies.
1970
1980
1990
2000
2005
2010
1975
1985
1995
GSK
Sanofi
Novartis
Egypt
China
India
Sri Lanka
Brazi l
SIBP, China
LIBP, China
KIMB, China
Panacea, India
SII, India
BE, India
Glovax, Korea
Ye
ar
Micro-ca
rrier t
echnology
WHO C
ourse on Labora
tory
methods for t
itratio
n of
LiveViru
s Vaccines
WHO C
ourse on
Vaccine
PotencyTe
sting and
Polio D
iagnostic P
roce
dures
ChinaVacc
ine Pro
ject
Salk-IP
V supply
and transfe
r
of related Q
C testi
ng

IPV development for technology transfer
33
Sabin‐IPV workshop
As several DCVM have expressed interest in the Sabin‐IPV technology, NVI recently
organized a three‐day workshop to introduce the concepts of Sabin‐IPV manufacturing
and quality control. During this workshop 27 representatives from DCVM discussed the
feasibility of a number of crucial issues with key‐persons from WHO and NVI. For example,
containment regulations following GAPIII (Global Action Plan, version III, to minimize
poliovirus facility associated risk) (WHO 2009) and their necessity and applicability for
Sabin‐IPV determine the required investment level in manufacturing facilities. Also, it was
concluded that Sabin‐IPV specific regulatory guidelines should be developed. Both the
Sabin‐IPV workshop, and a call for expression of interest by the WHO, made it possible for
various parties to disclose their interest. As a result the first two potential partners were
selected. The transfer of technology at the individual manufacturer site is expected to
start in 2011. Future partners will receive the existing Sabin‐IPV production process and
related QC testing and are encouraged to participate in further optimization of the actual
process in order to make the vaccine more affordable.
Sabin‐IPV training course
RIVM is planning to follow approximately the same technology transfer strategy for Sabin‐
IPV know‐how as applied earlier for Hib vaccine. At first documents and support will be
provided to the partners in order to allow organization of the required infrastructure and
personnel. Secondly, hands‐on training will take place at the RIVM, to show the
manufacturing process at lab‐ or pilot‐scale and to transfer the related in‐house QC testing.
Finally, a follow‐up training program will be set‐up together with each partner individually.
This follow‐up training will most likely take place approximately 6 months later at the
partners site.
The concept of technology transfer for Sabin‐IPV was originally taken from WHO's hub
concept applied successfully for pandemic flu (Friede et al. 2009). In essence this is
designed to maximize the number of DCVM recipients, consistent with WHO's Global Plan
for such pandemic vaccine supply. Consequently, the thresholds for DCVM to be admitted
to courses and training activities is relatively low. In contrast, the WHO approach for Sabin‐
IPV technology transfer emphasizes on biocontainment criteria (GAPIII) and the historical
track record of the national regulatory agency of the country where the DCVM resides.
This led to a strong selection process, limiting the number of potential recipients. With the
successful applicants bilateral agreements will be negotiated based on their requirements
for support in bringing this new Sabin‐IPV product swiftly to the local markets.

Chapter 2
34
Conclusions Recently, the NVI and the RIVM continued the development of Sabin‐IPV. Such a new
vaccine plays an important role in the WHO polio eradication strategy because
biocontainment will be critical in the time after OPV vaccinations are stopped. The use of
attenuated Sabin strains instead of wild‐type Salk polio strains will significantly lower the
risk of facilities related outbreaks.
Initially, the Sabin‐IPV production process was based on a scale‐down model of the
current, and well‐established, Salk‐IPV process. Using this scale‐down model, Sabin‐strain
specific adaptations like MOI, a lower virus culture temperature, modernization of the
clarification, were initially studied at lab‐scale. In this way, specifications were derived for
the large‐scale operation. The resulting Sabin‐IPV process was then developed up to a
production‐scale to produce virus seedlots, and inactivated trivalent polio vaccine for pre‐
clinical studies and clinical trial purposes.
From characterization studies, it was confirmed that the immunogenicity of Sabin‐IPV in
rats is different as compared to Salk‐IPV. Sabin‐IPV type 1 is more immunogenic, type 2 is
less immunogenic whereas for type 3 only small differences in immunogenicity were
observed. The target dose was adapted accordingly. Further, the use of Aluminum
hydroxide as an adjuvant increased the potency by at least a factor 2. In parallel, process
development, optimization and formulation research is being carried out to further
modernize the process and reduce cost per dose.
Finally, technology transfer to vaccine manufacturers in low and middle‐income countries
is being planned. To inform potential partners, recently a three‐day workshop for DCVM
was organized at NVI, also including WHO representatives. Crucial issues like containment
(according to GAPIII), and development of Sabin‐IPV specific regulatory guidelines, were
addressed. Technology transfer is expected to start in 2011. Future partners will receive
training courses and are encouraged to participate in further optimization of the process,
and the formulation, in order to make the vaccine more affordable.
Acknowledgements This work was supported by the World Health Organization using funds provided by a
grant from the Bill and Melinda Gates Foundation. The authors are indebted to Tiny van
der Velden‐de Groot and Hans Kreeftenberg for their contributions to the Sabin‐IPV
workshop, carefully reading the manuscript, and fruitful discussions.


Chapter 3
Multivariate data analysis on historical IPV
production data for better process understanding
and future improvements
Published as:
Thomassen, Y.E., van Sprang, E.N.M., van der Pol, L.A., Bakker, W.A.M. (2010). Multivariate
data analysis on historical IPV production data for better process understanding and future
improvements.
Biotechnology and Bioengineering 107:96‐104
dx.doi.org/10.1002/bit.22788

Chapter 3
38
Abstract Historical manufacturing data can potentially harbor a wealth of information for process
optimization and enhancement of efficiency and robustness. To extract useful data
multivariate data analysis (MVDA) using projection methods is often applied. In this
contribution, the results obtained from applying MVDA on data from inactivated polio
vaccine (IPV) production runs are described. Data from over 50 batches at two different
production scales (700‐L and 1,500‐L) were available. The explorative analysis performed
on single unit operations indicated consistent manufacturing. Known outliers (e.g.,
rejected batches) were identified using principal component analysis (PCA). The source of
operational variation was pinpointed to variation of input such as media. Other relevant
process parameters were in control and, using this manufacturing data, could not be
correlated to product quality attributes. The gained knowledge of the IPV production
process, not only from the MVDA, but also from digitalizing the available historical data,
has proven to be useful for troubleshooting, understanding limitations of available data
and seeing the opportunity for improvements.

MVDA on historical IPV production data
39
Introduction The discovery of an inactivated polio vaccine (IPV) dates back to 1953 (Salk 1953). Even the
basis of the current Salk‐IPV production process has been established over 40 years ago by
van Wezel (van Wezel 1967) using microcarrier technology in the then famous Bilthoven
Units. While the production processes might be called “ancient,” current manufacturing is
performed in modern (GMP certified) production plants equipped with systems for
automated control as well as comprehensive data collection. In general, a wealth of
information for process optimization or enhancement of efficiency or robustness can be
found in the batch records (Charaniya et al. 2008).
Extraction of useful information from batch records requires collecting data from different
sources, like paper trace and data historians (systems for data storage), to build a dataset
and subsequently apply correct sophisticated statistical tools. Biopharmaceutical
manufacturing data are complex, and univariate or bivariate analysis can often be
inefficient and might result in misleading conclusions (Kourti 2004). Important information
is found in the relationships between process parameters and this information is ignored
when parameters are analyzed or tested separately. Multivariate data analysis (MVDA) by
means of projection methods overcomes challenges associated with applications such as
multidimensionality of the data set, missing data, and variation introduced by disturbing
factors such as experimental error and noise (Martin and Morris 2002). Principal
component analysis (PCA) (Ringner 2008) and partial least squares (PLS) (Wold et al. 2001)
are commonly used projection methods. PCA can be used for process diagnosis in which
clusters, outliers and trends evident in process data can be identified. Subsequently, PLS
can be used to understand relationships between process parameters and product
quantity and quality tests. These multivariate techniques have been used to investigate
fermentation and cell culture processes. For example, PCA and PLS have been shown to
yield useful information when applied to analyze a cell‐culture unit operation (Kirdar et al.
2007). Also, Gunther et al. (Gunther et al. 2007) showed that multivariate statistical
techniques allowed fault detection and diagnosis in an industrial fed‐batch cell culture
process using a relatively small number of batches (∼20).
Analysis of manufacturing data using MVDA is stimulated by the American Food and Drug
Administration (FDA 2004, guidance on “Process Analytical Technology”) in order to
improve process understanding of production processes. The initiative was taken up by
the European EMEA and the Japanese MHLW. Changes in the production processes, made
in order to improve them, bare a risk. Quantified risk assessment can only be done when
the influence of the changes on the process or product quality is sufficiently well
understood. Hence, central to the FDAs new approach is the knowledge about the
essential details of process equipment and its dynamical operation during both upstream
and downstream processing (Gnoth et al. 2007). Moreover process improvements should

Chapter 3
40
be based on thorough understanding of the production process. It is therefore imperative
to assess the impact of (critical) process parameter (CPP) variation on the products critical
quality attributes (CQA) and understand and characterize the sources of process variability
(Mitchell et al. 2008).
To improve the knowledge on the current Salk‐IPV production process, data mining, using
MVDA, on historical batches has been performed. By using data‐driven knowledge the
objective was to unveil hidden information that might provide insight on possible process
improvements that lead to increased robustness and further process optimization.
Data Analysis Strategy Seeing the rich history in Salk‐IPV production at NVI, a large and unique data set has
become available in the past decade. It comprised over 50 production runs of three
polioviruses, Mahoney (type 1), MEF‐1 (type 2), and Saukett (type 3) on the Vero cell line at
two different bioreactor scales and the subsequent unit operations that deal with virus
purification and inactivation. The available data are heterogeneous with respect to time
and data types. It contains on‐line data, which is measured continuously and recorded
digitally, and off‐line data, which is measured occasionally and recorded by paper trace.
The current polio vaccine production process is depicted in Figure 1. In short production of
a monovalent bulk comprises the following steps: after thawing, high cell number Working
Cell Bank (WCB) vials are used to directly start a 15‐L fed‐batch pre‐culture in which the
Vero cells grow on microcarriers (Cytodex 1); after trypsinization to remove cells from
microcarriers a 2nd pre‐culture consisting of a 40‐L recirculation culture (working volume
40‐L) is done. The final cell culture is, after trypsinization and reattachment to the
microcarriers, carried out in twin bioreactors of either 2 × 350‐L or 2 × 750‐L followed by a
medium change and virus culture. The end of culture for these processes is based on the
time after inoculation. Downstream processing consists of clarification by means of dead
end filtration followed by concentration using tangential flow filtration (TFF). The
purification is done using size exclusion chromatography (SEC) and ion exchange
chromatography (IEX). Finally the virus is inactivated using formaldehyde. To obtain a
trivalent polio vaccine this procedure is carried out for each poliovirus type separately
followed by mixing for end product formulation.
To analyze the data it is in principle preferred to have one model that captures the entire
production process, from pre‐culture to virus production, purification, and inactivation.
However to develop such a model the individual unit operations should be explored first.
Using this exploration the feasibility of an overall model can be determined. Important
factors to achieve an overall model are (i) the availability of data, (ii) the quality of the

MVDA on historical IPV production data
41
Figure 1. Schematics of the Salk‐IPV production process. During upstream processing cells are expanded
using two pre‐culture steps prior to cell culture and virus culture. The downstream processing consists of clarification, concentration, SEC, and IEX followed by inactivation. To obtain trivalent polio vaccine this
procedure is followed for each poliovirus type separately prior to mixing for end product formulation.
data, (iii) the informative power of the collected parameters, and (iv) the structure of the
data. This latter factor largely determines the preferred analysis method.
The collected process data can be divided in data measured occasionally (off‐line data),
that is, during sampling, and continuously (on‐line data). The first represents a status of
the process at the time of sampling while the second reflects the physical state of the
process and the controller responses that are a function of the underlying process
dynamics. In an exploratory analysis it is important to keep most of the information
present in the data. When combining different data types (i.e. on‐line and off‐line data)
data reduction methods are needed and much of the information is lost. The used
modeling strategy aimed at retaining as much information as possible while reducing the
dimensions of the data to a degree that analysis remained practical. It was therefore
chosen to analyze on‐line and off‐line data separately during the explorative analysis. The
analysis was unbiased meaning that it was performed by a statistical expert who had no
previous knowledge of the Salk‐IPV production process.
clarification concentration SEC IEX mixing inactivation
USP
1 pre-culturest trypsinization 2 pre-culturend trypsinization
DSP
cell and virus culture
virus

Chapter 3
42
Methods
Data Collection
In the past decade more than 50 production runs (including rejected and aborted batches)
of the poliovirus subtypes 1, 2, or 3 on the Vero cell line were performed. Data used in this
analysis comprised 38 batches produced at 700‐L scale (2 × 350‐L bioreactors) and 12
batches produced at 1,500‐L scale (2 × 750‐L bioreactors). For each unit operation both on‐
line data and off‐line data were collected. For example for the final cell culture, data
consisted of 75 off‐line measured parameters and 12 or 9 (350‐L or 750‐L respectively) on‐
line parameters. Off‐line parameters (like amount of media components, daily cell counts,
nutrient concentrations and sterilization times) had been recorded manually and were
collected from paper. On‐line parameters (e.g., pH, DO, T) were in a digital format.
Data Preprocessing
Off‐Line data
The data were collected for each unit operation in a matrix X (I × J), with I being the batch
and J the process variables. Process variables (J) with a large amount of missing values
(over 15%) and process variables with little or no variation were excluded from the analysis.
Data from this matrix was used for exploration of the CPP and univariate and bivariate
analysis.
Performance analysis was done using a multivariate approach as in‐process variables are
likely correlated. Prior to performance analysis, using PCA, data were centered (towards a
mean) so that the model describes deviations from the mean, and scaled so each
parameter has equal influence to the model. When applicable, volume specific data were
normalized or virus type specific data were omitted to investigate operational
performance.
On‐Line Data
On‐line data, consisting of real‐time process data measured with a regular time interval,
was synchronized to a reference batch to obtain equal run lengths. Synchronization was
done using the dynamic time warping strategy originally developed for speech recognition
(Sakoe and Chiba 1978). The synchronized batches were collected in a matrix Xsync (I × J)
with I being the batch and J the synchronized data. Performance analysis based on on‐line
data were done using PCA transformation.
In general, on‐line measured data could be discriminated in two groups. The first group
represents dynamic variables such as pH controller output and CO2 flow, the second group
represents non‐dynamic variables such as pH and temperature. Although the latter are

MVDA on historical IPV production data
43
important and give information in the operational settings of the batch, they were run at
setpoint and are not varied in this production process. For performance monitoring they
are less informative (the derivative is equal to zero).
Software
Commercially available technical computing software, MATLAB (MathWorks, Inc., Natick,
MA) was used to perform data analysis. Prior to analysis, process data were assembled in
Excel (Microsoft, Redmond, WA).
Expert Analyses for Interpretation
As the data analysis was performed unbiased by a statistical expert, interpretation of the
data for process understanding needed to be done by process development specialists
(Charaniya et al. 2008).
Results First the type of outputs that were obtained from MVDA will be introduced. Subsequently
the results from the analysis of the different unit operations will be given.
Projection of the matrix X(I × J) with I observations or batches and J variables or process
parameters by means of PCA is done by building a PCA model given by the mathematical
expression: ETPX ' (Eq.1)
where T is the score vector matrix, P, the loading matrix, and E is the contains the
residuals. The score vector matrix T (one vector for each component) consists of the
projected values for I objects in the hyperplane. The t‐values (also referred to as scores)
can be used to relate objects to another in a PCA score plot. The distance to the hyper
plane is determined by the residual matrix E. How the original variables J are weighted
together in a principal component (PC) is expressed by the loadings P (Gabrielsson et al.
2002).
A summary of the performance or the process behavior over time can be seen in a PCA
score plot (e.g., Figure 2). Here the vectors for the first two PCs are plotted, t1 and t2,
against each other (Cunha et al. 2002; Martin and Morris 2002). It is important to note the
percentage variability explained by the PCA model and the percentage explained by these
first two PCs when interpreting the significance of the plot. It is common to also plot an
ellipse on this set of axes to represent the Hotelling T2 95% confidence interval; here also
the 99% confidence intervals are depicted. Observations outside the 95% confidence
interval are considered outliers and these batches can be considered out of control (Kirdar
et al. 2007). Other outputs generated using PCA are the squared model residuals (E in Eq.

Chapter 3
44
1) and the scores (T in Eq. 1). These PCA score plots can be used for more detailed outlier
detection and root cause finding.
Pre‐Cultures
While the production line has been scaled‐up from 2 × 350‐L to 2 × 750‐L production
bioreactors, the 1st and 2nd pre‐culture stages have remained the same in scale. Since the
pre‐cultures are likely independent of the production scale, simultaneous PCA analysis of
all 50 batches, with 104 (1st pre‐culture) and 117 (2nd pre‐culture) off‐line variables, was
done for both unit operations. The PCA score plots of the 1st pre‐culture (Figure 2A) and 2nd
pre‐culture (Figure 2B) can explain 45% and 30% of the variation, respectively. The observed
outliers were checked and appeared to have known and reported deviations.
Figure 2. PCA score plot of the (A) 1st pre‐culture stage and (B) 2nd pre‐culture stage. Clustering between control unit 1 (blue circles) and control unit 2 (green squares) was found both indicating a structural difference introduced with the new bioreactor control unit. Outlier is indicated with an arrow.
Unexpectedly, clustering was observed when batches were marked based on production
line (i.e., final production vessel 2 × 350‐L or 2 × 750‐L) (Figure 2). The observed clustering
indicates the presence of structural operational differences. More detailed data analysis
revealed that the glucose concentration at the start of cultivation (being 7.9 ± 0.6 and
8.7 ± 0.7 mmol L‐1, respectively) was an important factor for the variation between the
production lines observed in the 1st pre‐culture. This difference in glucose concentrations
was caused by a minor adaptation in the media preparation. Detailed analysis for the 2nd
pre‐culture however did not result in a clear, or one parameter, distinction between the
production lines. A possible explanation for the difference might be found in the control
units that were used. Parallel to the scale‐up of the production bioreactors from 2 × 350‐L
to 2 × 750‐L the pre‐culture bioreactor control units were replaced. A new control unit,
same type and manufacturer, was installed. After close comparison of these units it was
concluded that different mass flow controllers, different software package and
automated instead of manual agitation strategy were introduced with the new unit. These
-15 -10 -5 0 5 10-6
-4
-2
0
2
4
695% limit
99% limitA
-15 -10 -5 0 5 10-6
-4
-2
0
2
4
6
- - --
-
-
-6
-4
-2
0
2
4
6
-6 -4 -2 0 2 4 6 8 10 12
B
-
-
-
- - -
Scores PC1
Sco
res
PC
2
95% limit
99% limit
Scores PC1
Sco
res
PC
2
95% limit
99% limit

MVDA on historical IPV production data
45
adjustments could have led to the observed differences. Likely this also is a factor during
the 1st pre‐culture in addition to the difference in glucose concentration at the start of
cultivation.
Cell Culture
The final cell culture was done in production scale twin bioreactors at two different scales,
2 × 350‐L and 2 × 750‐L. Due to the volumetric differences PCA analysis should be
performed for both bioreactors scales separately. When the data are analyzed
simultaneously, a PCA score plot depicting two groups representing the different
production scales is obtained as was shown previously (Bakker et al. 2010). Separate
multivariate analysis of the 2 × 750‐L bioreactors was not performed from this unit
operation due to the low number of productions at this scale. The performance of the
batch to batch consistency produced at 350‐L scale in two different production vessels
was studied by developing a subspace model. This five component PCA model (61.1%
explained variance) was based on 38 runs carried out in twin vessels resulting in 76 batch
runs with 48 process variables. The scatter plot of the first two PCs is given in Figure 3. The
individual bioreactors are marked with either open or closed circles. In Figure 3 it can be
seen that the open and closed circles are randomly distributed and that both bioreactors
were operated in a similar way.
Figure 3. PCA score plot of the cell culture at 2 × 350‐L scale. Individual bioreactors, marked as open green and closed blue circles, can be considered identical. Clusters indicated by boxes 1 and 2 represent batches
with deviating conditions. In cluster 3 the experimental batches are indicated by an asterisk.
-8-8
-6
-4
-2
0
2
4
6
8
10
Scor
esPC
2
-6 -4 -2 0 2 4 6 8
Scores PC1
95% limit
99% limit1
2 3
-4 2
*
*
*
*

Chapter 3
46
Following the comparison between the two vessels the batches that are far from the
center of the score plot were examined. For example the open circle in the upper right
corner (Figure 3) corresponds to a batch with a reported operational error. Next the
interesting areas in the data were observed. These are the areas where the data seems to
be clustered in the outer rim. These clusters are defined as cluster one, two, and three and
are marked by a box in Figure 3. The common features for the first cluster are: DO, glucose
and osmolarity. Relative low glucose concentration was observed at inoculation. The
second cluster has the following features in common: relative high cell density and relative
low DO. The common features for the third cluster are the microcarrier concentration, the
glucose consumption, the glucose concentration and the pH. While clusters were
observed in which DO or pH, both within controlled range, contributed to differentiation
of these clusters from the center, no extreme values were found. The data in cluster three,
four dots of the boxed data in the figure, corresponds with experimental batches in which
a different medium was used. Within the inner rim a cluster may be observed in the upper
left quadrant. Batches in this cluster have a lower microcarrier concentration in common.
Figure 4. Example of inspection at process variables level, like controller outputs. The blue line represents
the suspicious batch. The red area represents the range of operation of the synchronized profiles. The
observed different behavior is caused by an event that took place at the end of the culture and is evident from multiple variables.
Air Flow CO Flow2 O Flow2 Pressure
DO DOCO Stirrer speed Heating Controller Output
pH pH Controller Output Tempe rature Vessel wall Tempe rature

MVDA on historical IPV production data
47
Time series analysis of the synchronized on‐line data showed that specified ranges around
setpoints were maintained and a common characteristic profile for the controller outputs
was found. This confirms the conclusion based on the off‐line data that there is
consistency in de operational execution of the process. Moreover this synchronized data
can be used for performance monitoring. Using PCA, batches with divergent profile could
be discriminated (PCA score plot not shown). These batches were inspected at variables
level. In Figure 4 an example of such an inspection is given. The observed different
behavior is caused by an event that took place at the end of the culture and is evident
from multiple variables being the O2 flow, pH, pH controller output, temperature control,
and pressure. This example illustrates the possibilities of these analysis methods for
process control and their use in root cause finding for troubleshooting.
Using PLS the CQA (cell concentration at the end of culture and cell divisions) were related
to process parameters. The identified process parameters were the input variables, in
particular but not surprisingly the start cell concentration (data not shown). Unfortunately
it was not possible to statistical significantly relate other process variables to the yield
leaving a large part of the observed variation unexplained. Due to the relatively low
amount of batches for this type of statistical analysis it was not possible to prove that
weak relations between variables were statistical significant. Another difficulty that was
encountered using regression analysis for this kind of production data are that the
measurement variation (e.g., cell counts using a manually operated counting chamber) is
relatively large while important process variables like temperature and pH are strictly
controlled. Since the main variation during cell culture is caused by the input parameters
detection of possible deviating batches can be done using relative simple monitoring tools
like statistical process control charts as shown in Figure 5.
Virus Culture
On the level of process operation the poliovirus cultivation procedure is independent of
the virus strain which is produced. PCA analysis on the entire data set was done. Type
specific data like D‐antigen concentrations or virus titers was omitted from the matrix. The
analysis showed operation indeed was independent of poliovirus type (data not shown).
Using PLS, relations between process parameters that correlate with product yield were
studied. However, the process variation was small while the variation of the yield
measurements, an ELISA and virus titer assay (TCID50 test), was large. Therefore no
process parameters could be linked to product yield.

Chapter 3
48
Figure 5. Statistical control chart (Shewhart) depicting the cell concentration at the end of the 2nd pre‐culture stage. Outliers detected using this simple control chart correspond, indicated with arrow, with the outliers detected during PCA of the 2nd pre‐culture (Small PCA score plot equals Figure 2B).
Downstream Processing
The off‐line data from the unit operations in downstream processing, that is, from
clarification to inactivation, from both production lines and all three virus types were
analyzed simultaneously using PCA. Available data consisted of 176 variables for 38
batches at 700‐L and 12 batches at 1,500‐L scale. First analysis resulted in a PCA score plot
which could explain 52% of the data (figure not shown). The two groups that could be
distinguished represent the different production scales. This pattern was similar as was
previously found for cell culture (Bakker et al. 2010). Since downstream processing is a
physical operation it is expected that correction for volumes will result in a similar
operational behavior. To explore the differences in operational behavior the data set was
normalized for volume and the product quantities (D‐antigen) were excluded as the data
would have been dominated by the product quantities for individual unit operations. A
new PCA model is constructed explaining 57% of the total variation (Figure 6). Although it
was observed that batches from the 1,500‐L production runs appear to be located in the
lower part of the figure, they cannot be distinguished from the 700‐L production runs. It
was therefore concluded that the data are randomly distributed which implies that the
operational behavior between both production scales is similar. Moreover several clusters
(boxed) could be observed. Common features for the first cluster are input variables pH
and water at the start of inactivation. Cluster 2 is marked by low volumes prior to
0
1
2
3
4
5
6
7
8
9
10
productions (chronological order)
cell
con
cent
ratio
n(1
06
cells
mL
)
MeanControl limitsWarning limits
Scores PC1
Scor
esPC
2
-6
-4
-2
0
2
4
6
-6 -4 -2 0 2 4 6 8 10 12
95% limit99% limit
MeanControl limitsWarning limits
MeanControl limitsWarning limits
Scores PC1
Scor
esPC
2
-6
-4
-2
0
2
4
6
-6 -4 -2 0 2 4 6 8 10 12
95% limit99% limit
Scores PC1
Scor
esPC
2
-6
-4
-2
0
2
4
-6 -4 -2 0 2 4 6 8 10 12
95% limit99% limit
-
-
-
- - -
-1

MVDA on historical IPV production data
49
concentration and low volumes after SEC. The common feature of cluster 3 is the high
volume after IEX. This indicates that these batches have a high product yield. Upon
analysis of the D‐antigen data of the latter cluster it was found that indeed these batches,
three type 1 and one type 3 batch were the batches with the highest yield in terms of
absolute amount of D‐antigen per batch. It was unfortunately not possible to find a
common cause for this higher yield in these batches using PCA and PLS.
Figure 6. PCA score plot of the downstream processing phase at both 700‐L and 1,500‐L production scale. Green closed and blue open circles correspond with the 700‐L and 1,500‐L production scale respectively.
The data were volume normalized. Clusters 1, 2, and 3 are boxed and show deviating process conditions.
One of the CQA during DSP is the specific activity which is determined after IEX. The
specific activity is defined as the ratio D‐antigen and protein nitrogen content. For
prediction of the specific activity at 700‐L production scale a five‐factor PLS model was
developed. The number of components was determined using a full cross‐validation. The
results are depicted in Figure 7. The model characteristics show a R2 of 93% and a model
error (RMSECV) of approximately 0.6. These results show that the specific activity can be
reasonably well predicted from the process data. The highest correlation was found with
the D‐antigen concentration after the unit operation concentration. This result was
anticipated because the D‐antigen concentration is one of the determinants of the specific
activity.
95% limit
99% limit
Scores PC1
Scor
esPC
2
0 2 6 10-2-4-10 -8 -6 4 8
6
4
2
0
-2
-4
-6
1
2
3
--- - -
-
-
---- - -
-
-
-

Chapter 3
50
Figure 7. Prediction of specific activity. A five‐component PLS model was developed (R2 = 0.931; RMSECV = 0.618). Points represent actual figures, Lines represent model prediction. A: Predicted specific activity versus actual values. B: Time series of predicted and actual values for specific activity.
Discussion The exploratory analysis of polio vaccine manufacturing data described in this work shows
that MVDA is a powerful tool to extract information from large datasets. This is illustrated
by the ability to detect deviating and experimental production runs. Moreover MVDA
allowed the detection of differences that were not obvious, for example, the possible
influence of the control unit as was observed for the 1st and 2nd pre‐culture. Also the
observed differences in glucose concentration at the start of the 1st pre‐culture had not
been known prior to this MVDA. This observation has led to an optimization in media
preparation, resulting in a more robust media composition. Throughout the different unit
operations the large part of the variation was caused by a differences of input variables,
for example differences in glucose concentration or osmolarity during cell cultures. The
differences in input variables were incidental and thus not structural and mostly they
caused variation within specified ranged not leading to batch rejections.
Outliers detected using MVDA had known deviations (noted in the GMP paper trace)
moreover these outliers could also have been detected using simple statistical control
charts. These univariate control (or Shewhart) charts are traditionally used for routine
monitoring production performance and could be used in this case to monitor the relevant
process parameters. In general, using only univariate data analysis certain valuable
information will be missed (Kirdar et al. 2008; Kourti 2004). Here it is illustrated that PCA
analysis can be used to determine the similarity of twin bioreactors (Figure 3) or new
bioreactors (Figure 2). Moreover, based on the PCA and detailed analysis of the outliers it
was concluded that manufacturing had been consistent during the analyzed production
runs.
Specific activity 4.1
Pre
dict
ed
Sp
eci
fica
ctiv
ity4
.1
2
1
0
-1
-2
-2 -1 0 1 2
Productions (chronological order)
Pre
dict
ed
Spe
cific
activ
ity4
.1
-1
-2
2
1
0
5 10 15 20 25 30 35
A B
Specific activity 4.1
Pre
dict
ed
Sp
eci
fica
ctiv
ity4
.1
2
1
0
-1
-2
-2 -1 0 1 2
Productions (chronological order)
Pre
dict
ed
Spe
cific
activ
ity4
.1
-1
-2
2
1
0
5 10 15 20 25 30 35
Specific activity 4.1
Pre
dict
ed
Sp
eci
fica
ctiv
ity4
.1
2
1
0
-1
-2
-2 -1 0 1 2Specific activity 4.1
Pre
dict
ed
Sp
eci
fica
ctiv
ity4
.1
2
1
0
-1
-2
-2 -1 0 1 2
Productions (chronological order)
Pre
dict
ed
Spe
cific
activ
ity4
.1
-1
-2
2
1
0
5 10 15 20 25 30 35
Productions (chronological order)
Pre
dict
ed
Spe
cific
activ
ity4
.1
-1
-2
2
1
0
5 10 15 20 25 30 35
Productions (chronological order)
Pre
dict
ed
Spe
cific
activ
ity4
.1
-1
-2
2
1
0
5 10 15 20 25 30 35
A B

MVDA on historical IPV production data
51
Regression analysis using PLS did not result in defining correlations between relevant
process parameters and product quantity and quality attributes. The main difficulty in
finding relations between process parameters and product quantity and/or quality is first
of all that manufacturing is strict meaning the CPP are run at setpoint within well
controlled ranges. Secondly it was observed that the used product quantification and
characterization measurement methods had high standard variation which did not allow
determining significant correlations. During the manufacturing process poliovirus is
quantified and qualified using the tissue culture infective dose assay (TCID50) and the D‐
antigen ELISA, respectively. The TCID50 assay is valid within ± 0.5 log and the D‐antigen
ELISA is valid within a coefficient of variation (CV) of 10%. These assay variations are
common for these type of analysis (Wood et al. 1995) but large compared to the variation
in well controlled CPP.
The power of MVDA for yield improvement strategies in biotech processes has been
shown previously (Coleman et al. 2003; Kirdar et al. 2007). Coleman et al. (Coleman et al.
2003) have shown that analysis of historical data could result in novel suggestions for
increasing the product concentration. Their database consisted of experimental
fermentations in which variations in CPP was included. When manufacturing of complex
macromolecules is strictly controlled MVDA of production data might not result in new
knowledge on statistically significant correlations between CPP and CQA. This information
should be obtained using a correct scale‐down model of the production line where CPP
can be varied and linked to product quantity and quality by preferably using the design of
experiments approach together with MVDA methods.
While the MVDA could be used for root cause finding and thereby gaining knowledge on
process robustness, process optimization in terms of increased yield was not possible
using results obtained in this analysis. To accommodate future process optimization,
research was initiated on test development to enhance product characterization during
manufacturing and process development studies. The gained knowledge on performance
of the individual unit operations, in terms of ranges and their operating variation, is being
used to setup experiments in which tested ranges can be related to the anticipated
performance at the manufacturing site.
The gained knowledge of the IPV production process, not only from the MVDA, but also
from digitalizing the available historical data, has proven to be useful for troubleshooting,
understanding limitations of the available data and indicating the opportunity for future
improvements. Moreover the information is applied in present process development
studies in which a scale‐down model of the production line is being established for
research on further process improvements. Using the scale‐down model, the process the
knowledge and design space can be further explored. The data obtained at lab‐scale will

Chapter 3
52
be used for further model development. Although polio eradication is on the doorstep,
improvements on IPV manufacturing remain actual as IPV plays an important role in the
WHO polio eradication strategy (Aylward et al. 2006). At this moment the two main
process improvements concern firstly the potential risk of introducing foreign agents by
the use of bovine serum and porcine trypsin for which an animal‐component free media
could be used as an alternative. Secondly, NVIs current IPV manufacturing process is the
basis for the development of a new IPV variant based on the attenuated Sabin strains
(Kersten et al. 1999; Kreeftenberg et al. 2006).
Acknowledgements The authors like to thank Rob Kortink, Marvin Philippi and Ronald Lijffijt for their help on
data acquisition.


Chapter 4
Development of a fast ELISA for quantifying polio
D‐antigen in in‐process samples
Published as:
Ten Have, R., Thomassen, Y.E., Hamzink, M.R.J., Bakker, W.A.M., Nijst, O.E.M., Kersten, G.,
Zomer, G. (2012) Development of a fast ELISA for quantifying polio D‐antigen in in‐process
samples.
Biologicals 40:84‐87
dx.doi.org/10.1016/j.biologicals.2011.11.004

Chapter 4
56
Abstract A fast ELISA was developed and qualified for analysis of polio D‐antigen. The original 20 h‐
protocol was optimized by minimizing the total incubation time to 1 h, and by replacing the
signal reagent 3,3′,5,5′‐tetramethylbenzidine by a chemiluminogenic signal reagent with a
theoretical low intrinsic background and high dynamic range.

Fast polio D‐antigen ELISA
57
Introduction A sandwich enzyme‐linked immunosorbent assay (ELISA) may be used to quantify D‐
antigen units of poliovirus (PV) serotype 1, 2 and 3 in appropriate samples (Wood et al.
1995). This ELISA is set‐up to detect so‐called D‐antigen, an arbitrarily defined unit of which
the intact D‐form is immunorelevant. For detection of both PV, and vaccine (IPV, formalin
inactivated PV) a serotype and D‐antigen specific monoclonal or polyclonal antiserum may
be used (Sawyer et al. 1997; Wood et al. 1995).
For efficient process development and proper process control, in‐process samples taken
from the polio vaccine production process need to be analyzed prior to the next process
step is initiated. This requires a fast ELISA which will be used to measure the D‐antigen
concentration in for example samples with host cell debris that are taken during virus
cultivation, or in samples that contain purified and concentrated PV (Thomassen et al.
2010). It was considered that analysis of this variety of in‐process samples requires
detection of emitted light rather than absorbed light as a theoretical low background and
a high dynamic range appear to be required. Therefore, this research focuses on: A.
replacing the HRP substrate 3,3′,5,5′‐tetramethylbenzidine (TMB) by a chemiluminogenic
signal reagent, and B. reducing the incubation times in the original 20 h ELISA protocol
(Kersten et al. 1999).
A reduction in sample analysis time may be obtained by optimizing consecutive incubation
steps or by combining incubation steps. In the original ELISA protocol antigen detection
requires two consecutive incubation steps, the first is incubation with the detection
monoclonal antibody (IgG) which is followed by incubation with the HRP‐conjugate. In the
literature there is at least one example on combining these two incubation steps (Lewis
and Elder 2000). Co‐incubation appears advantageous, but also implies that both the
detection IgG, and HRP‐conjugate concentration need optimization in order to achieve a
proper signal to blank (S/B) ratio.
Materials and methods
ELISA
Micro titerplates (Greiner, white, high‐binding) were coated with type‐specific caprylated
bovine antiserum diluted 1:1600 in PBS (100 μL), overnight at 4 °C. Coated plates were
stored dry at a temperature of −80 °C. The plates were washed with wash buffer
containing: PBS, and 0.1 v/v % Tween20.
Trivalent inactivated polio vaccine (IPV, 10‐fold concentrated bulk product) was used for
test optimization (type 1, 411 DU mL‐1; type 2, 89 DU mL‐1; type 3, 314 DU mL‐1). This vaccine

Chapter 4
58
was diluted using assay buffer containing: PBS, 0.1 v/v % Tween20, and 0.5% Protifar
(Nutricia, Zoetermeer, The Netherlands) and 100 μL was added to the wells. Test
optimization experiments were performed once.
The sealed plate was incubated at 37 °C on a shaking incubator during 30 min and washed
two times using wash buffer.
Incubation with 100 μL of a mixture of type‐specific suitably diluted monoclonal (detection
antibody) and HRP‐labeled goat anti‐mouse (HRP‐conjugate) was performed at 37 °C on a
shaking incubator during 30 min. The detection monoclonal antibodies were, coded 3‐4E4
(type 1), 3‐14‐4 (type 2), and 1‐12‐9 (type 3), from in‐house mice ascites (Sawyer et al. 1997).
After washing four times using wash buffer, the signal reagent was added.
For detection with the signal reagent HighLite (Zomerbloemen B.V., Zeist, The
Netherlands), previously called GZ11 (Zomer and Hamzink 2009), buffer A, and B were
mixed and 100 μL was added to each well. Buffer A contains: PBS, 0.05 v/v % Tween20, 1
mM EDTA, 0.14 μg mL‐1 HighLite, 0.1 μg mL‐1 4‐phenylphenol. Buffer B contains: NaOAc pH
6.0, 0.015% (w/w) H2O2. The emitted light was detected using a luminometer (Centro
LB960, Berthold Technologies, Vilvoorde, Belgium).
The protocol for detection with TMB is described elsewhere (Kersten et al. 1999).
Detection with Supersignal Pico (Pierce, Rockford, USA) and Supersignal Femto (Pierce,
Rockford, USA) was performed according to the protocol of the supplier.
To increase the accuracy of the assay at least three sample dilutions are used to calculate
the antigen concentration.
Processing of the raw data and test criterions
A four parameter fit was used to generate a calibration curve which is described by:
⁄
Eq.1
where a = lower asymptote, b = slope at inflexion point, c = concentration at inflexion
point, and d = upper asymptote (Findlay and Dillard 2007). An in‐house Excel sheet was
used for data processing.
The following test criteria were used for acceptance of raw ELISA data: 1. The back
calculated response of the standards differs by no more than 10% from the expected value,
2. The calibration curve contains at least five out of eight standards, and 3. The calculated

Fast polio D‐antigen ELISA
59
concentrations of at least three sample dilutions ran in triplicate result in a standard error
of the mean of less than 15%.
Biosafety
To meet biosafety requirements the procedure for washing the 96‐wells plate was
performed in a biohazard cabinet. In this case removal of liquid containing biologically
active virus requires careful handling, excluding the procedure of inverting the 96‐wells
plate and tapping it to dryness. An autoclavable Immuno‐washer (Nunc, Rochester, USA)
was used here and waste was collected for destruction. Removal of liquid from the wells
was less efficient compared to tapping the plate to dryness. For that reason the number of
wash cycles was increased to 8 for active samples using the Immuno‐washer.
Results and discussion Fast analysis of PV containing samples requires an ELISA that can be performed on the
same day of sample collection. This required modification of the original 20 h ELISA
protocol (Kersten et al. 1999). Table 1 shows that besides minimizing the incubation time
to 1 h, also a reduction in the number of wash steps was realized. This is considered
beneficial from a biosafety perspective. Also the signal reagent was changed from TMB to
HighLite as this lowered the background signal and increased the theoretical dynamic
range.
Table 1. Protocol of the original ELISA, and the fast D‐antigen ELISA along with incubation times (tinc, hours) and wash steps.
Step ELISA layout
Original protocol tinc (h) Fast protocol tinc (h)
1 Incubation with antigen 16 Incubation with antigen 0.5
Wash step Wash step
2 Incubation with detecting
antibody
2.5 Combined incubation of detecting
antibody and HRP‐labeled conjugate
0.5
Wash step Wash step
3 Incubation with HRP‐
labeled conjugate
1.5
Wash step ‐
Addition of TMB Addition of HighLite
Measurement Measurement
Total incubation time 20 1
Total wash steps 3 2

Chapter 4
60
Development and optimization of a fast D‐antigen ELISA
Coating plates with a serotype specific antiserum
The effect of using different concentrations of coating antibody was studied in the range
from 1:200 to 1:1600 and appeared negligible (Lewis and Elder 2000). Therefore, a dilution
of 1:1600 was used throughout the experiments.
Overcoming non‐specific binding to the plate by blocking
Blocking by using 0.5% BSA or 0.5% milk proteins (Protifar) was equally effective in
reducing the background (not shown). Protifar was selected and was included in the assay
buffer.
Optimized binding of the antigen to the coat
Figure 1A shows that static incubation (original protocol, T = room temperature, rT)
resulted in an antigen concentration dependent binding rate, binding occurred faster at 20
DU mL‐1 than at 2.5 DU mL‐1 (5 and 10 DU mL‐1 were in between, result not shown). This
concentration dependency was not found upon shaking the microtiter plate during
incubation. Moreover, binding occurred faster compared to the static incubation. Binding
of antigen was anticipated to occur somewhat faster at a controlled temperature of 37 °C
compared to room temperature. For that reason the former was selected for further
experiments.
Upon applying these optimal conditions, a reduction in incubation time from overnight
(∼16 h) to 30 min was established (see Table 1).
Combined incubation of detection antibody and HRP‐labeled conjugate
In the original protocol two successive incubation steps are used (see Table 1) to allow
consecutive binding of the detection IgG, and the HRP‐conjugate. In that case, both
reagents may be used in excess to ensure complete saturation of the antigen.
It is anticipated that two successive incubation steps will render a signal that increases to a
maximum level upon increasing the detection IgG concentration (by decreasing the
dilution factor). Under these incubation conditions, comparable standard curves were
obtained at an IgG dilution factor of 102 and 103 showing that a maximum level of
saturation is obtained (see Figure 1B).
Unlike successive incubation, co‐incubation of detection IgG and the HRP‐conjugate
results in a signal that increases upon further diluting the detection IgG reagent in the
dilution factor range from 102 to 104 (see Figure 1B).
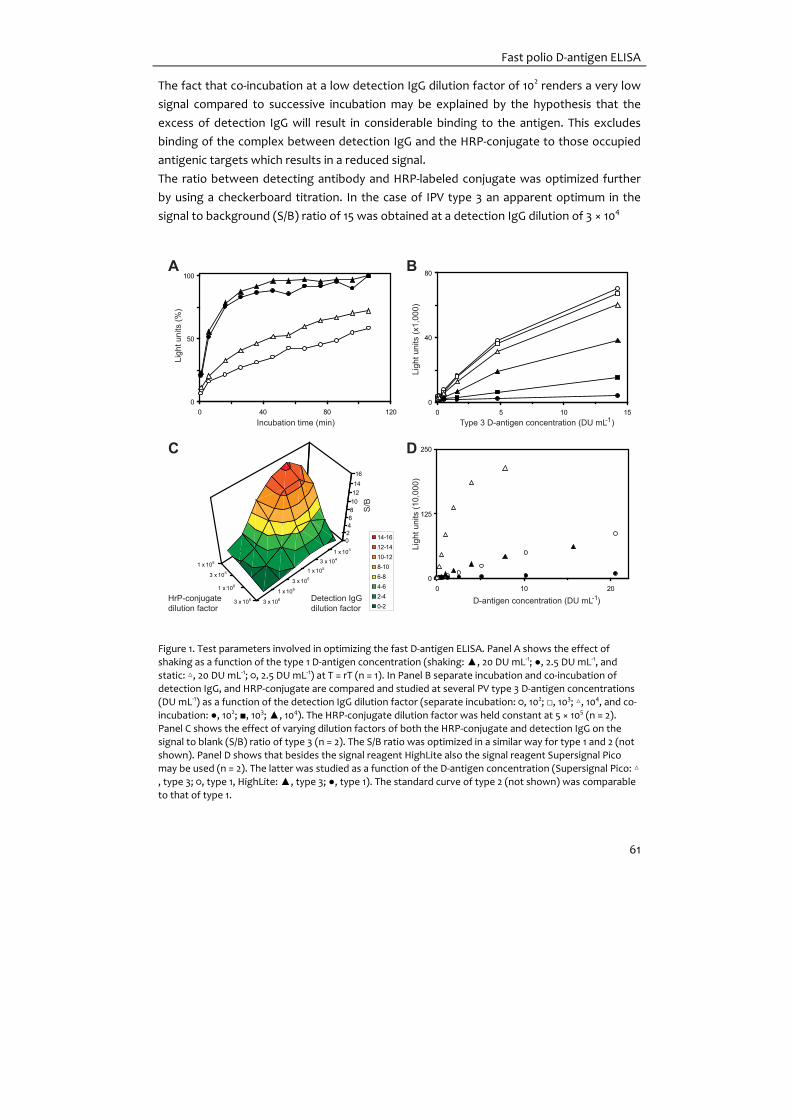
Fast polio D‐antigen ELISA
61
The fact that co‐incubation at a low detection IgG dilution factor of 102 renders a very low
signal compared to successive incubation may be explained by the hypothesis that the
excess of detection IgG will result in considerable binding to the antigen. This excludes
binding of the complex between detection IgG and the HRP‐conjugate to those occupied
antigenic targets which results in a reduced signal.
The ratio between detecting antibody and HRP‐labeled conjugate was optimized further
by using a checkerboard titration. In the case of IPV type 3 an apparent optimum in the
signal to background (S/B) ratio of 15 was obtained at a detection IgG dilution of 3 × 10⁴
Figure 1. Test parameters involved in optimizing the fast D‐antigen ELISA. Panel A shows the effect of
shaking as a function of the type 1 D‐antigen concentration (shaking: ▲, 20 DU mL‐1; ●, 2.5 DU mL‐1, and
static: ▵, 20 DU mL‐1; ○, 2.5 DU mL‐1) at T = rT (n = 1). In Panel B separate incubation and co‐incubation of detection IgG, and HRP‐conjugate are compared and studied at several PV type 3 D‐antigen concentrations
(DU mL‐1) as a function of the detection IgG dilution factor (separate incubation: ○, 102; □, 103; ▵, 104, and co‐
incubation: ●, 102; ■, 103; ▲, 104). The HRP‐conjugate dilution factor was held constant at 5 × 10⁵ (n = 2). Panel C shows the effect of varying dilution factors of both the HRP‐conjugate and detection IgG on the
signal to blank (S/B) ratio of type 3 (n = 2). The S/B ratio was optimized in a similar way for type 1 and 2 (not
shown). Panel D shows that besides the signal reagent HighLite also the signal reagent Supersignal Pico may be used (n = 2). The latter was studied as a function of the D‐antigen concentration (Supersignal Pico: ▵
, type 3; ○, type 1, HighLite: ▲, type 3; ●, type 1). The standard curve of type 2 (not shown) was comparable
to that of type 1.
0
50
100
0 40 80 120Incubation time (min)
Ligh
t uni
ts (%
)
0
40
80
0 5 10 15Li
ght u
nits
(x1,
000)
Type 3 D-antigen concentration (DU mL )-1
10 K30 K100 K300 K1 M3 M
0246810121416
14-1612-1410-128-106-84-62-40-2
1 x 10⁵
3 x 10⁶
1 x 10⁶
3 x 10⁵
3 x 10⁶
1 x 10⁶
3 x 10⁵
1 x 10⁵
3 x 10⁴
1 x 10³
HrP-conjugatedilution factor
Detection IgGdilution factor
S/B
0
125
250
0 10 20
D-antigen concentration (DU mL )-1
Ligh
t uni
ts (1
0,00
0)
A B
C D

Chapter 4
62
and HRP‐conjugate dilution of 1 × 10⁵ (see Figure 1C). Similar experiments were performed
for IPV type 1 and 2 (not shown). From these experiments the following dilution factors
were selected for the respective polio serotypes: type 1, IgG 5 × 10³, HRP‐conjugate 1 × 10⁴,
and type 2 and 3, IgG 5 × 10⁴, HRP‐conjugate 1 × 10⁵. This resulted in S/B values of 8, and 5
for type 1, and 2, respectively.
The fact that the optimized S/B ratio of type 3 is higher than that of type 1 and 2 may be
related to steric hindrance lowering the amount of IgG‐HRP‐conjugate per antigen particle.
It is hypothesized that that is supposedly more important in the case of type 1 and 2 than it
is for IPV type 3. Such an S/B difference was not observed upon using the original protocol
(result not shown).
This combined incubation method (step 2 in Table 1) has been used before for a protein
and small organic compounds (Thomassen et al. 2010). The work described here extends
the scope of that successful application by using a multi‐epitope analyte; each PV particle
contains 60 identical units, i.e. there are, at least in theory, 60 possible binding sites per
particle.
Antigen detection
Other signal reagents besides HighLite could also be used in the fast D‐antigen ELISA,
examples are: TMB, Supersignal Pico, and Supersignal Femto. However, not all signal
reagents perform equally.
Supersignal Femto was found to result in a disadvantageously high background of 10% of
the total detector scale and a dynamic range for type 3 of just 0‐1 DU mL‐1. Figure 1D shows
that Supersignal pico increases the signal of type 1 and 3 compared to HighLite. Like
Supersignal Femto the dynamic range for detection of type 3 D‐antigen was reduced
which is not preferred for the fast D‐antigen ELISA in which a trivalent mixture is used as a
reference. Therefore, use of the chemiluminescent signal reagent HighLite was preferred
as the background is <0.3% of the total detector scale and the dynamic range is at least
between 0 and 20 DU mL‐1 for each polio serotype.
Qualification of the fast D‐antigen ELISA
For qualification of the fast D‐antigen ELISA the average relative standard deviation (RSD),
reproducibility, specificity, and the estimated limit of detection (LOD) were studied (see
Table 2). The average RSD of a sample was obtained by calculating the average RSD of 40
samples.The obtained values are all below 10%. The reproducibility was estimated by using
data from independent D‐antigen concentration measurements of a single sample. All
values were below 20% which is considered acceptable.
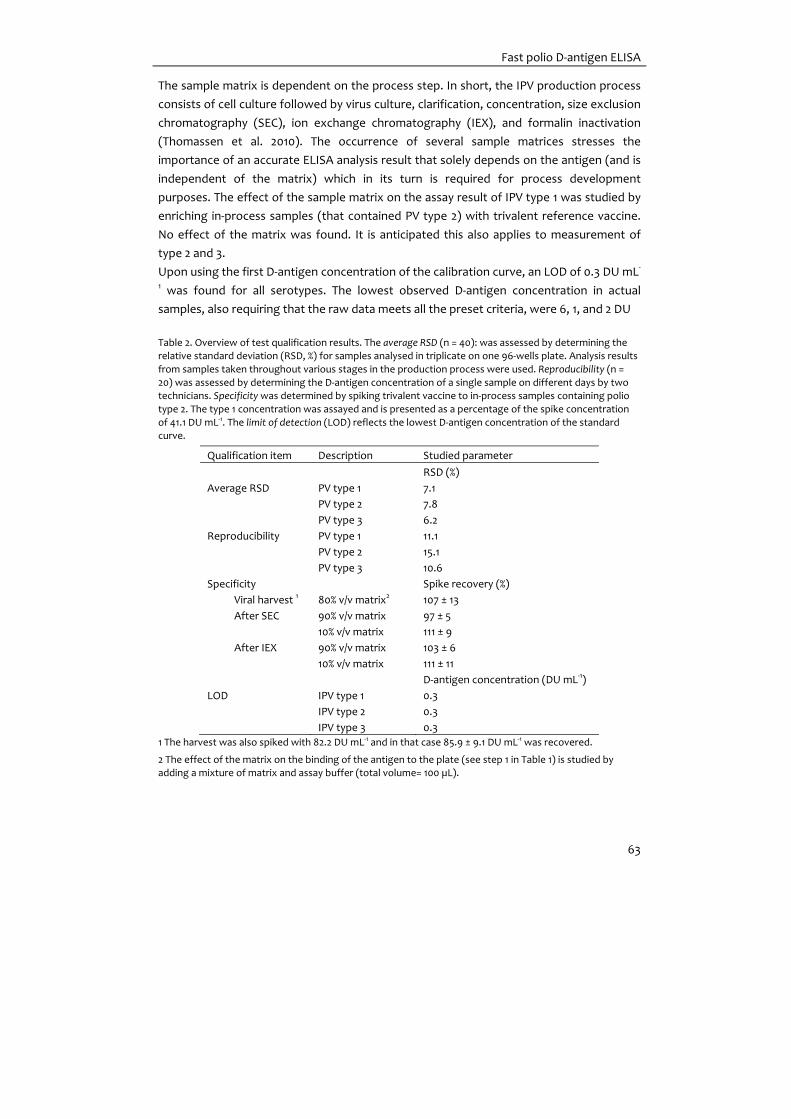
Fast polio D‐antigen ELISA
63
The sample matrix is dependent on the process step. In short, the IPV production process
consists of cell culture followed by virus culture, clarification, concentration, size exclusion
chromatography (SEC), ion exchange chromatography (IEX), and formalin inactivation
(Thomassen et al. 2010). The occurrence of several sample matrices stresses the
importance of an accurate ELISA analysis result that solely depends on the antigen (and is
independent of the matrix) which in its turn is required for process development
purposes. The effect of the sample matrix on the assay result of IPV type 1 was studied by
enriching in‐process samples (that contained PV type 2) with trivalent reference vaccine.
No effect of the matrix was found. It is anticipated this also applies to measurement of
type 2 and 3.
Upon using the first D‐antigen concentration of the calibration curve, an LOD of 0.3 DU mL‐
1 was found for all serotypes. The lowest observed D‐antigen concentration in actual
samples, also requiring that the raw data meets all the preset criteria, were 6, 1, and 2 DU
Table 2. Overview of test qualification results. The average RSD (n = 40): was assessed by determining the relative standard deviation (RSD, %) for samples analysed in triplicate on one 96‐wells plate. Analysis results
from samples taken throughout various stages in the production process were used. Reproducibility (n =
20) was assessed by determining the D‐antigen concentration of a single sample on different days by two technicians. Specificity was determined by spiking trivalent vaccine to in‐process samples containing polio
type 2. The type 1 concentration was assayed and is presented as a percentage of the spike concentration
of 41.1 DU mL‐1. The limit of detection (LOD) reflects the lowest D‐antigen concentration of the standard curve.
Qualification item Description Studied parameter
RSD (%)
Average RSD PV type 1 7.1
PV type 2 7.8
PV type 3 6.2
Reproducibility PV type 1 11.1
PV type 2 15.1
PV type 3 10.6
Specificity Spike recovery (%)
Viral harvest 1 80% v/v matrix2 107 ± 13
After SEC 90% v/v matrix 97 ± 5
10% v/v matrix 111 ± 9
After IEX 90% v/v matrix 103 ± 6
10% v/v matrix 111 ± 11
D‐antigen concentration (DU mL‐1)
LOD IPV type 1 0.3
IPV type 2 0.3
IPV type 3 0.3
1 The harvest was also spiked with 82.2 DU mL‐1 and in that case 85.9 ± 9.1 DU mL‐1 was recovered.
2 The effect of the matrix on the binding of the antigen to the plate (see step 1 in Table 1) is studied by adding a mixture of matrix and assay buffer (total volume= 100 µL).
Chapter 4
64
mL‐1 for PV type 1‐3, respectively. This method is suitable for in‐process analysis. However,
for release of final product more extensive validation is required.
Conclusions Here, a successful ELISA optimization strategy was outlined rendering a fast assay
requiring only 2 wash steps, and resulting in a minimal analysis time. The described
development strategy may be of use for optimizing other ELISA protocols as well.


Chapter 5
Scale‐down of the inactivated polio vaccine
production process
Published as:
Thomassen, Y.E., van ‘t Oever, A.G., Vinke, M., Spiekstra, A., Wijffels, R.H., van der Pol, L.A.,
Bakker, W.A.M. (2013) Scale‐down of the inactivated polio vaccine production process.
Biotechnology and Bioengineering 110(5):1354‐1365
dx.doi.org/10.1002/bit.24798

Chapter 5
68
Abstract The anticipated increase in the demand for inactivated polio vaccines resulting from the
success in the polio eradication program requires an increase in production capacity and
cost price reduction of the current inactivated polio vaccine production processes.
Improvement of existing production processes is necessary as the initial process
development has been done decades ago. An up‐to‐date lab‐scale version encompassing
the legacy inactivated polio vaccine production process was set‐up. This lab‐scale version
should be representative of the large scale, meaning a scale‐down model, to allow
experiments for process optimization that can be readily applied. Initially the separate unit
operations were scaled‐down at setpoint. Subsequently, the unit operations were applied
successively in a comparative manner to large‐scale manufacturing. This allows the
assessment of the effects of changes in one unit operation to the consecutive units at
small‐scale. Challenges in translating large‐scale operations to lab‐scale are discussed, and
the concessions that needed to be made are described. The current scale‐down model for
cell and virus culture (2.3‐L) presents a feasible model with its production scale
counterpart (750‐L) when operated at setpoint. Also, the current scale‐down models for
the DSP unit operations clarification, concentration, size exclusion chromatography, ion
exchange chromatography, and inactivation are in agreement with the manufacturing
scale. The small‐scale units can be used separately, as well as sequentially, to study
variations and critical product quality attributes in the production process. Finally, it is
shown that the scale‐down unit operations can be used consecutively to prepare trivalent
vaccine at lab‐scale with comparable characteristics to the product produced at
manufacturing scale.

Scale‐down of the IPV production process
69
Introduction Inactivated polio vaccine (IPV) was developed in the 1950s (Salk 1953). Soon after that, the
basis for a legacy large‐scale IPV production process, using microcarrier technology and
primary monkey kidney cells, was developed in our laboratories (van Wezel 1967) and
adopted worldwide (van Wezel et al. 1984).
The existing IPV production process has been described elsewhere (van Wezel 1985; van
Wezel et al. 1984), and a summary is given here (Figure 1). Monovalent inactivated bulks of
each poliovirus (PV) type (type 1 Mahoney, type 2 MEF‐1, and type 3 Saukett) are
manufactured separately, after which a trivalent vaccine can be formulated. To obtain a
monovalent bulk, Working Cell Bank (WCB) vials are thawed and used to directly start a 15‐
L fed‐batch bioreactor pre‐culture in which Vero cells (an African green monkey kidney cell
line) grow attached to microcarriers (Cytodex 1). After expansion growth and subsequent
trypsinization to remove cells from microcarriers, a second pre‐culture consisting of a 40‐L
recirculation culture is done. The final cell culture is, after a second trypsinization and
reattachment to the microcarriers, carried out in twin bioreactors at 2 × 750‐L scale,
followed by a culture medium change and subsequent virus culture. Downstream
processing consists of clarification by means of normal flow filtration (NFF) followed by
concentration using tangential flow filtration (TFF). The purification is done using size
exclusion chromatography (SEC) and ion exchange chromatography (IEX). The
monovalent bulks are finished after inactivation of the poliovirus using formaldehyde.
Figure 1. Schematics of the large scale IPV production process. Cells are expanded using two pre‐culture
steps prior to cell and subsequent virus culture. The downstream processing consists of clarification,
concentration, SEC, and IEX followed by inactivation with formaldehyde. To obtain trivalent polio vaccine this procedure is followed for each poliovirus type separately prior to mixing for the formulation of the
trivalent polio vaccine.
Improvements on the existing IPV manufacturing process are regularly under
consideration. For instance in the 1980s, a major improvement was made when the
primary monkey kidney cells were replaced by the Vero cell line (Montagnon et al. 1984;
van der Velden‐de Groot 1995). Other examples may be found in challenges like necessary
equipment replacement due to equipment ageing, or the growing awareness for biosafety
and quality issues that have led to the development of animal component free cell culture
1 pre-culturest nd2 pre-culturetrypsinization trypsinizationcell and
virus cultureclarification concentration SEC IEX inactivation

Chapter 5
70
media. Some of these changes may require new registration at the regulatory authorities.
It should always be proven that anticipated changes will not affect the product quality and
safety.
Current ICH guidelines (ICH Q8(R2) 2009; ICH Q9 2005; ICH Q10 2008) stimulate the
increase of scientific understanding on new and existing production processes. Using this
knowledge, future improvements on registered production processes may be done within
an established process design space or using representative and validated scale‐down
models. This approach would require less runs to validate the changes at manufacturing
scale.
The need for increased process knowledge, not only on new biopharmaceutical processes
but also on existing processes, promotes the application of scale‐down models for rapid
acquisition of relevant data. Scale‐down models, used in combination with a design of
experiments approach, allow the development of cause and effect models on input and
process parameters, their interactions and influence on product attributes, either as single
unit operations or as consecutive units using for instance partition designs (Perry et al.
2007; Pieracci et al. 2010).
To gain more knowledge on the IPV manufacturing process we have analyzed the available
data using multivariate data analysis (Thomassen et al. 2010). From this analysis, criteria,
for example, cell growth characteristics, for a scale‐down model could be derived. Here,
we describe the development of a model at lab‐scale, which not only allows the study of
single unit operations but also the effects of changes in one unit operation to the
consecutive units. The complete production process was scaled‐down in such a way that
lab‐scale unit operations can be used to produce representative trivalent vaccine.
Materials and Methods
Cell Line, Viruses, and Medium
Vero cells obtained from WHO (10–87) originally derived from ATCC (CCL‐81) were used as
host for PV production. PV type 1 Mahoney, type 2 MEF‐1, and type 3 Saukett were used.
For scale‐down experiments manufacturers working cell banks were subcultured in T‐
flasks (in the experiments passage no. up to 150 were used) and manufacturers virus seeds
were used. Vero cells were grown adherent to Cytodex 1 microcarriers (GE Healthcare,
Uppsala, Sweden; 3 g L−1). Culture media, EMEM supplemented with bovine serum for cell
culture, M199 for virus culture and other materials, prepared in‐house for manufacturing
of IPV, were used for scale‐down experiments.

Scale‐down of the IPV production process
71
Cell and Virus Culture
Cell culture consisted of a fed‐batch process with a daily glucose bolus feed given when
the glucose concentration was below 5 mM. Prior to virus culture the media was
exchanged.
Lab‐scale cell and virus cultures were carried out in 5‐L glass bioreactors equipped with
pitched three‐blade (angle 45°) impellers (axial flow impeller). Power consumption at
different rotational speeds was measured using a torque transducer (ETH‐Messtechnik,
Gschwend, Germany; DRDL‐l‐1‐0,1) mounted between the motor and the impeller shaft.
Power consumption was measured in water and corrected for power consumption in air.
Cultivations were controlled using Sartorius DCU‐3 control units and MFCS‐win software
(Sartorius AG, Melsungen, Germany). At manufacturing scale, twin 1,000‐L stainless steel
bioreactors (Applikon, Schiedam, The Netherlands) were used with axial blade impellers.
Starting working volumes were 2.3 and 750‐L for small and large‐scale, respectively
resulting in similar H/D ratios. Data from 116 cell and virus cultures (PV type 1: n = 40; PV
type 2: n = 22; and PV type 3: n = 52) were available for defining manufacturing cell and
virus culture characteristics.
Clarification
At manufacturing scale, the broth, after harvest through a 75 µm stainless steel sieve, was
clarified using continuously added Celite (577) filteraid on stainless steel mesh filters (pore
size 75 µm) followed by 0.45 and 0.22 µm filters. At lab‐scale, after pre‐clarification through
a 75 µm stainless steel sieve, an alternative clarification method using disposable
clarification units (Millipore, Billerica, MA; C0HC or Sartorius PB2) followed by a
0.45/0.22 µm combination filter was applied.
Concentration
At manufacturing scale the product was concentrated (approx. 1,000‐fold) using
tangential flow filtration via two consecutive UF filter steps (PTHK UF filters 100 kDa cut‐
off). At small‐scale, first, a Millipore Pellicon 2 system with a PLCK filter (UF filter cutoff
100 kDa; filter load 166 L m‐2) combined with a Quattroflow‐150 s (Quattroflow Fluid
Systems, Kamp‐Lintfort, Germany) low shear pump was used. Second, a Millipore lab‐scale
TFF with Biomax UF filters (PES filter cutoff 100 kDa; filter load 8 L m‐2) was used. The
transmembrane pressure (TMP) and the pressure difference (dP) were set to a maximum
of 0.6 and 0.5 bar for the TMP and dP, respectively.
Purification
SEC was done using a column (height: 80 ± 2 cm) containing separately sterilized (by
autoclave) CL‐6B matrix (GE Healthcare) at both scales. For IEX, a column (height:

Chapter 5
72
22 ± 2 cm) containing the positively charged DEAE Sepharose Fast Flow matrix (GE
Healthcare; separately sterilized by autoclave) was used at both scales. The virus was
eluted using an Äkta explorer system (GE Healthcare) with a 40 mM phosphate buffer (pH
7.0) on both occasions.
Stabilization and Inactivation
Because of the limited stability of the poliovirus in the phosphate buffer used during
chromatography, immediate stabilization using M199 (10×) was done after IEX fraction
collection. This was followed by dilution to obtain a correct D‐antigen concentration prior
to inactivation. During dilution, glycine was added which is needed for inactivation with
formaldehyde (Lycke et al. 1957). Prior to inactivation the pH of the product was set
(7.0 ± 0.2) and filtered (0.22 µm). Inactivation was done at 37°C for 13 days in an incubator.
Halfway the inactivation (after 6–8 days) an intermediate filtration (0.22 µm) was
performed to remove possible incompletely inactivated poliovirus aggregates (Nathanson
and Langmuir 1963) and so allow complete inactivation. Complete inactivation was, in
general, observed after 72–96 h. After inactivation the monovalent bulk product was
stored at 4°C. This procedure was similar at both scales.
Analytical Methods
Cell culture samples were taken daily for cell counts using a Nucleocounter NC‐100
(Chemometec, Allerød, Denmark) to determine total nuclei. Alternatively, total nuclei
colored with crystal violet were counted using a Fuchs‐Rosenthal hemocytometer. Both
methods were compared to exclude differences (data not shown). Cell culture
metabolites such as glucose, lactate, glutamine, glutamate, and ammonia were monitored
using a Bioprofile 100 Plus (Nova Biomedical, Waltham, MA).
Amino acid concentrations were determined using an Agilent HPLC method (Agilent, Santa
Clara, CA). Primary amino acids were derivatized with o‐phthalaldehyde 3‐
mercaptopropionic acid (OPA) detected by fluorescence at an excitation wavelength of
340 nm with an emission wavelength of 450 nm. Secondary amino acids were derivatized
with 9‐fluorenylmethyl chloroformate (FMOC) and were detected with an UV‐detector at
262 nm and by fluorescence at an excitation wavelength of 266 nm and an emission
wavelength of 305 nm. Chromatographic separation was achieved by mobile two‐phase
gradient elution on a reverse phase Agilent Zorbax Eclipse Plus C18 column AAA
(2.1 mm × 150 mm). Mobile phase A contains 10 mM Na2HPO4: 10 mM Na2B4O7, 1.25 mM
NaN3 (pH 8.2). Mobile phase B contains a mixture of Acetonitrile: Methanol: water
(45:45:10 v/v/v).
Poliovirus was quantified with a virus titer assay as decribed previously (Thomassen et al.
2012) and the quality was assessed using a D‐antigen ELISA (ten Have et al. 2012).

Scale‐down of the IPV production process
73
Immunogenicity of monovalent product was determined in the in vivo potency assay in
rats (van Steenis et al. 1981). Immunogenicity was expressed as the relative potency
compared to the reference vaccine (PU91‐01) using the parallel‐line method.
Vero host cell proteins were determined using the Vero Cell HCP ELISA kit F500 according
to the manufacturer's instructions (Cygnus Technologies, Southport, NC).
Equivalence Testing (TOST)
To determine equivalence between the manufacturing and lab‐scale unit operations the
key performance parameters were tested for equivalence using a two‐one‐sided test
(TOST) rather than a Student's t‐test, which is used to show differences. TOST has been
described in detail elsewhere (Schuirmann 1987) and is commonly used in technology
transfer or to demonstrate bioequivalence (2001). Briefly, equivalence testing is done to
test if the difference between two populations means (Δµ) is within a previously defined
tolerance interval [θl, θu]. This tolerance interval is chosen based on practical standpoints,
accounting for intrinsic process and assay variability and thus provides scientific meaning
to the test outcome rather than just statistical meaning.
The null hypothesis H0 is defined as : ∆ : ∆ . Equivalence is
concluded when both H01 and H02 are rejected. The above hypothesis H01 and H02 can be
tested separately using two one‐sided t‐tests. Thus equivalence is concluded at
significance level α when
∆
⁄⁄ and
∆
⁄⁄
where ΔX is the difference in means between two groups, s is the pooled standard
deviation, n1 and n2 are the respective sample size of group 1 and 2, t1−α(v) is the upper
probability α percentile of a t‐distribution with v degrees of freedom.
As two separate one‐sided t‐tests are used the confidence interval should be described as
(1−2α) × 100%. With a chosen significance level (α) of 0.05 the confidence interval is 90%.
The P‐value for equivalence is calculated as the maximum P‐value (Pmax) of either one of
the two one‐sided t‐tests. Like in traditional tests when the P‐value is below α, the null
hypothesis is rejected and the research hypothesis (here equivalence) is established.

Chapter 5
74
Results and Discussion
Scale‐Down of Upstream Processing
For scaling down upstream processing (USP) or bioreactors, several generally accepted
guidelines exist [see for instance (Li et al. 2006; Rathore et al. 2005b; van 't Riet and
Tramper 1991)]. These can be distinguished in hardware and operational guidelines.
Included in the hardware guidelines are: (i) similar vessel geometry, meaning that the H/D
ratio (height/diameter) and the impeller design and placement for both vessels is nearly
identical; (ii) similar (the same or scaled‐down) inoculum preparation; and (iii) similar
performance analysis systems (for example the cell counter system). Scale‐down (for an
overview see Table 1) was based on similar vessel geometry, that is, the working volume
for the scale‐down model was chosen such that the H/D ratio was similar. The aeration
method was kept similar, at both scales head‐space aeration was used. Other hardware
options, like impeller design and placement were limited to availability, however, chosen
such that they approximated the large‐scale.
Guidelines for scaling down operational settings are: (i) the use of the same media,
buffers, and microcarrier concentrations; (ii) similar sterilization procedures; (iii) similar
setpoints for volume independent parameters like pH, temperature, and schedule of
additions; (iv) linear adjustments of volume dependent parameters like inoculum volumes
and airflow rates; (v) adjustment of the agitation to obtain either (a) equivalent oxygen
transfer (kLa), (b) constant Reynolds number (NRe), (c) constant tip speed (vT), or (d)
constant power input per unit volume (P/V). The latter is also directly related to the shear
stress, which is an important factor regarding the shear sensitivity of the cultivation
methods using microcarriers (Nienow 2006). The operational variables were kept similar
except for the airflow rate over the head‐space which was not scaled linearly due to
technical limitations of low gas flows. Application of a higher gas flow at small scale was
considered acceptable since in surface aerated systems the effect of the gas flow rate on
the gas‐liquid oxygen transfer can be negated when the gas flow rate is above a minimum
(Moreira et al. 1995). To determine the agitation speed, theapproach for comparable
power input per unit volume (P/V) was chosen. This approach will also result in
comparable shear forces. Based on the power number (Np) of the large‐scale impeller the
applied P/V during cell culture (at 750‐L scale) was calculated using P = Np × ρ × N3 × D5 (van
't Riet and Tramper 1991) and estimated to be ∼5 W m−3. The relation between impeller
speed and power input was determined for the 5‐L Univessels by measuring the torque, or
rotational energy (Figure 2A). Concluding from Figure 2A, the agitation speed at small‐
scale should be around 65–95 rpm. This is well above the off‐bottom agitation speed
(Zwietering 1958) which is 40 rpm at small scale.

Scale‐down of the IPV production process
75
Table 1 Overview of scale‐down strategy for each unit operation
Parameter Scale‐down strategy
Cell and virus culture
Hardware Geometry H/D
Impeller design, placement
Similar
Approximate1
Inoculum Preparation Vero cells
Preparation virus seed
Different2
Similar
Assay systems Cell count, metabolite analysis, virus
analysis, and HCP
Similar
Operational Volume
dependent
Inoculum volume, feed volume, and
working volume
Volumetric scale‐down
326 times
Volume
independent
pH, DO, T, feed regime
media, buffers, and microcarriers
(type, concentration, preparation)
Similar setpoints,
same materials as
large‐scale
Non‐linear
parameter
Impeller agitation and
aeration
P/V equivalence
scale‐down 5 times1
Clarification
Hardware Equipment First clarification
Final filters
Different2
Comparable
Operational Filter load3 and feed material
Harvest method
Similar
Similar
Concentration
Hardware Equipment Pump
Filters
Comparable, low
shear1
Comparable materials1
Operational dPmax, TMPmax, concentration factor,
filter load, and feed material
Similar
Filter flush Different2
SEC
Column Matrix, height, HETP & asymmetry, and
column load
Similar
Operational Buffers, elution rate, T, pH,
conductivity, and feed material
Similar
IEX
Column Matrix, height, packing procedure, and
equilibration procedure
Similar
Operational Buffers, elution rate, T, pH,
conductivity, and feed material
Similar
Inactivation
Formaldehyde concentration, pH, T,
and procedure
Similar
1 Limited possibilities due to lab‐scale limitations (like availability) 2 See results & discussion for description 3 For final filters only; the filter area of the 1st clarification at manufacturing was not quantifiable.

Chapter 5
76
Figure 2. Determination of agitation for scale‐down model. Panel A: Effect of impeller speed on the P/V in 5‐
L Univessels. Panel B: Effect of impeller speed on the growth curve of Vero cells (n = 1).
The effects of the agitation speed (at 50, 70, and 90 rpm) on the Vero cell growth were
studied. In Figure 2B the results are depicted. Despite the small differences in viable cell
density a trend was observed where increased agitation speeds resulted in lower viable
cell densities and lower growth rates. Possibly this effect is due to the increased shear
stress resulting from higher agitation speeds. Shear stress is directly related to the P/V
(van 't Riet and Tramper 1991). While the difference in power input at these agitation
speeds is relatively low, an effect was anticipated since adherent growing cells are more
sensitive to shear than cells growing as single cell suspension (Croughan et al. 2006).
This scale‐down model for cell‐ and virus culture was subsequently qualified at setpoint
using cell growth characteristics, that is, cell concentrations, specific growth rate, specific
metabolite consumption rates, virus concentrations, and specific virus productivity
(virus/cell).
Qualification of Cell Culture
To qualify the scale‐down model usually all operating parameters are run at setpoint of the
manufacturing process. Subsequently the output parameters and sensitivity are
compared. For cell culture, cell growth characteristics, like growth rates and metabolite
production and consumption rates, are the main relevant performance parameters to
qualify the scale‐down. Moreover the product quality attributes, here virus quantity and
quality, should be used to qualify the model (Rathore et al. 2005b).
The growth curve at 2.3‐L lab‐scale resembles the growth curve at production scale (Figure
3A). Start‐ and end‐cell concentrations, the maximum specific growth rates, and the
growth rate at the time of virus infection (TOI ∼90 h) were comparable (Figures 3A & B).
However, minor differences between lab‐scale and production scale growth curves were
0
200
400
600
800
1000
1200
1400
1600
0 200 400 600 800
P/V
(W
m-3
)
Agitation (rpm)
0
4
8
12
16
20
0 30 60 90 120 150 180
A
0
0.2
0.4
0.6
0.8
1
1.2
0 20 40 60 80 100
Ce
ll c
on
c. (
x1
06
ce
lls m
L-1
)
Time (h)
50 rpm
70 rpm
90 rpm
B

Scale‐down of the IPV production process
77
found for the lag‐time. This difference was related to a difference in inoculum preparation.
At lab‐scale the use of a trypsinization apparatus for sub‐cultivation was not feasible and
therefore this procedure was carried out in a bottle. Moreover, a culture grown in regular
fed‐batch mode was used as pre‐culture method in contrast to the recirculation methods
applied at large‐scale. These differences were accepted based on applicability at small‐
scale yet it should be noted that both the pre‐culture type and the apparatus and time
needed for trypsinization at production scale have a negative impact on the cell fitness,
which is visible in the longer adaptation (or lag) time needed. The use of recirculation pre‐
cultures at lab‐scale resulted in a lag time that was approximately 20 h longer while the
growth curves (Figure 3A, open circles) and virus yields were similar (t‐test results P = 0.36;
α = 0.05).
Table 2. TOST (two‐one‐side‐test) Analysis of key performance parameters for scale comparison of cell and
virus culture. Comparisons were made during exponential growth (i.e. 40‐70 h cultivation time) unless
indicated otherwise. qNitrogen a.a. is calculated based on amino acid consumption without Ala and NH3 production. qCarbon a.a is calculated based total amino acid consumption. Data from PV type 1 cultures are
given.
Unit operation Parameter Mean S Θ pmax Result
Cell culture Cell density TOI
(106 cells mL‐1)
0.78 0.11 0.20 0.0110 Equivalent
Average µ (h‐1) 0.024 0.003 0.007 0.0435 Equivalent
µmax 0.035 0.005 0.010 0.0006 Equivalent
µ at TOI (h‐1) 0.031 0.003 0.010 0.0020 Equivalent
qGluc 0.346 0.051 0.100 0.0126 Equivalent
qLac 0.802 0.168 0.200 0.0230 Equivalent
qGln 0.060 0.018 0.020 0.0030 Equivalent
qGlu ‐0.013 0.006 0.007 0.0438 Equivalent
qNH3 0.036 0.008 0.010 0.2130 Not
Equivalent*
qNitrogen a.a. 0.172 0.046 0.050 0.0478 Equivalent
qCarbon a.a. 0.420 0.132 0.150 0.0293 Equivalent
YLac/Gluc 2.2 0.34 0.6 0.0356 Equivalent
YGln/Gluc 0.151 0.026 0.040 0.0021 Equivalent
YNH3/Gln 0.744 0.098 0.2 0.4376 Not
Equivalent*
Virus culture Virus titer
(10 log TCID50 mL‐1)
8.74 0.2 0.5 6 E‐05 Equivalent
D‐antigen (DU mL‐1) 90.0 8.9 30 0.0481 Equivalent
Yield titer (10 TCID50 106 cells‐1) 2.9 0.3 0.3 0.0244 Equivalent
Yield D‐antigen (DU 106 cells‐1) 131.2 40.7 50 0.0286 Equivalent
* Results at manufacturing were lower due to delayed sample analysis.

Chapter 5
78
Figure 3. Comparison of cell cultures at 2.3‐L (gray circles) and 750‐L (black squares). Panel A: Growth
curves, open circles represent cell cultures at lab‐scale where inoculum was used from a recirculation pre‐
culture; Panel B: specific growth rates, maximum and at the time of infection; Panel C: Glucose consumption (closed symbols; corrected for feeding and cumulative) and lactate production (open
symbols); Panel D: Glutamine concentration (closed symbols) and glutamate production (open symbols);
Panel E and F: Amino acid consumption based on respectively nitrogen and carbon; Panel G: Specific production and consumption rates determined during exponential growth (40–70 h); Panel H: Molar yields.
Production scale in white and scale‐down in gray, error bars give SD.
0
0.2
0.4
0.6
0.8
1
1.2
0 20 40 60 80 100 120
Ce
ll c
on
c. (
x1
06
ce
lls m
L-1
)
Time (h)
A
0
0.01
0.02
0.03
0.04
0.05
µ max µ TOI
Gro
wth
ra
te (
h-1
)
B
0
5
10
15
20
25
30
0
2
4
6
8
10
12
14
0 20 40 60 80 100
La
cta
te p
rod
uc
ed
(m
M)
Glu
co
se
co
nc
en
tra
tio
n (
mM
)
Time (h)
C
-0.2
-0.1
0
0.1
0.2
0.3
0.4
0.5
0
0.5
1
1.5
2
2.5
0 20 40 60 80 100
Glu
tam
ate
pro
du
ce
d (m
M)
Glu
tam
ine
co
nc
en
tra
tio
n (
mM
)
Time (h)
D
0
0.5
1
1.5
2
2.5
3
YLac/Gluc YGln/Gluc YNH3/Gln
Yie
lds
(m
ol/m
ol)
H
0
0.2
0.4
0.6
0.8
1
1.2
0
0.2
0.4
0.6
0.8
1
1.2
Gluc Lac Gln Glu NH3 AAN AAC
Sp
ec
ific
ra
tes
(m
mo
l 1
0-9
ce
lls h
-1)
Gln
, G
lu,
NH
3
Sp
ec
ific
ra
tes
(m
mo
l 1
0-9
ce
lls h
-1)
Glu
c, L
ac
, AA
N, A
AC
G
0
2
4
6
8
10
12
0 20 40 60 80 100
AA
Ca
rbo
n c
on
su
me
d (
mM
)
Time (h)
F
0
1
2
3
4
5
6
0 20 40 60 80 100AA
Nit
rog
en
co
ns
um
ed
w/o
NH
3, A
la
(mM
)
Time (h)
E

Scale‐down of the IPV production process
79
Next to the cell growth, nutrient consumption and waste metabolite production rates
were analyzed. In Figure 3C–F the cumulative consumption for glucose, glutamine, amino
acids and the production of lactate, and glutamate are given. While amino acid
consumption and more specifically glutamine and glutamate are similar, lactate
production starts sooner in the scaled‐down model. This corresponds with lower glucose
uptake observed at manufacturing scale. At the end of the cultivation period however
similar amounts of lactate are present and comparable amounts of glucose are consumed.
Moreover, during exponential growth (40–70 h) the specific consumption and production
rates for the main metabolites of Vero cell growth at lab‐scale are comparable with those
at manufacturing scale (Figure 3G). Also the molar yields of lactate on glucose are
comparable between scales (Figure 3H). The specific ammonium production rate was
lower at production scale (Figure 3G). In parallel, the yield of ammonia over glutamine was
also lower at manufacturing scale compared to lab‐scale. Both were related to delayed
sample measurements of manufacturing scale samples, which leads to a decrease in
ammonia concentrations likely caused by evaporation. Equivalence between scales for all
cell culture parameters, except for the NH3 related parameters, was shown (Table 2) using
the statistical test for equivalence (TOST). Together these findings illustrate that the small‐
scale cell culture is comparable to the manufacturing scale cell culture.
Qualification of Virus Culture
Virus culture is started after media exchange where the serum containing cell culture
medium is replaced with serum free medium. After 3 days virus culture is finished which is
characterized by total cell lysis or 100% CPE (cytopathic effect). The virus yields, measured
as infective particles (virus titer) and immunogenic particles (D‐antigen), for all three
subtypes are equal between scales (Figures 4A & B). Also the virus titer and D‐antigen
yields per cell were comparable (Figures 4C & D).
Previously, it was described that higher D‐antigen yields per cell were observed when at
manufacturing a scale‐up from 350 to 750‐L bioreactors was realized (Bakker et al., 2010).
This phenomenon could possibly be related to the growth rate at the moment of virus
infection (Bakker et al., 2010). Using the presented scale‐down model, research to
elucidate this relation is underway.
Scale‐Down of Downstream Processing
Scaling‐down of downstream processing (DSP) units can be considered straight forward as
the processes are based on physics (Godavarti et al. 2005; Rathore et al. 2005a). The most
important factor is the use of representative feed streams, that is, intermediate products,
resins and buffers from the full scale manufacturing when scaling down. The DSP unit
operations used in the IPV production process can be divided in two categories: filtration
units and chromatography units.

Chapter 5
80
Figure 4. Comparison of virus cultures of PV type 1, 2, and 3 between scales. Panels A and B: Virus titer and D‐antigen concentrations; Panels C and D: Product yield based on the production of infective particles
(titer) and immunogenicity (D‐antigen). Production scale in white and scale‐down in gray, error bars give
SD.
Filtration Units
Hardware guidelines for scale‐down of filtration units concern the retentate path length
and the shear stress caused by for instance the pump or system layout. In general, the
units are run at setpoints for retentate cross flow rate, transmembrane pressure (TMP),
inlet and outlet pressure, temperature, concentration factor, and filter load. The scale‐
down model can be qualified based on TMP versus flux curves and yields although the
latter may be lower at small‐scale due to higher system dead volumes.
0
2
4
6
8
10
PV type 1 PV type 2 PV type 3
Vir
us
tite
r (1
0L
og
CC
ID5
0 m
L-1
)
0
20
40
60
80
100
120
140
160
PV type 1 PV type 2 PV type 3
D-a
nti
ge
n c
on
ce
ntr
ati
on
(D
U m
L-1
)
0
1
2
3
4
PV type 1 PV type 2 PV type 3
Vir
us
yie
ld (
10
Lo
gC
CID
50 1
06
cel
ls-1
)
0
20
40
60
80
100
120
140
160
180
PV type 1 PV type 2 PV type 3
D-a
nti
ge
n y
ield
(D
U 1
06
cells
-1)
A B
DC

Scale‐down of the IPV production process
81
Two filtration units, clarification and concentration, are used during IPV manufacturing.
Lab‐scale equivalent filtration units of the large‐scale clarification were not available. It
was chosen to select a suitable (disposable) alternative. During this selection one of the
criteria was the flexibility in filter size which allows clarification of different volumes while
retaining a scale‐down model based on equivalent filter load.
Pre‐clarification was done using a 75 µm stainless steel sieve at both scales and resulted in
comparable feed material with respect to turbidity. The clarification unit was qualified
based on equivalence of turbidities and recoveries after filtration with similar flows.
Clarification of virus harvest at lab‐scale can be done using the Millipore C0HC filter. A
consecutive combination filter sized 0.45 and 0.22 µm was used. The selected scalable
disposable unit was successfully implemented for the preparation of Sabin IPV clinical trial
material (Bakker et al. 2011).
A lab‐scale version for concentration was setup (Table 1) with which comparable
recoveries, with a similar concentration factor, were observed. A drawback of this scale‐
down model is the inability to back‐flush the filters, which is done at large‐scale to retrieve
more product. To mimic the back‐flush of the filter, a 5 min recirculation step has been
introduced for both filtersteps followed by a flush step with 3–4 mL of fresh medium
(M199) to simulate the back‐flush of the second filter. Many factors may influence the
observed recoveries observed at manufacturing scale (73 ± 16%) among which are the filter
age, system feed flow and hold times, the quality of the start material but also assay
variation.
Chromatography Units
Important for scale‐down of chromatography units is the chosen chromatography
equipment, which should be able to accurately control flow. Concerning the column size, a
minimal diameter that can be applied is 10 mm due to the ratio of system dead volume to
column volume and wall effects. When this ratio is high it may result in pool
concentrations significantly lower than those seen at large‐scale (Rathore et al. 2005a).
Column packaging performance (HETP and asymmetry) should be the same. Critical
parameters for chromatography are (i) bed height and linear flow rates; (ii) column
loading (mL product/L resin); (iii) temperature; pH and conductivity; (iv) pooling criteria or
when applicable (v) gradient lengths. The setup of the lab‐scale units SEC and IEX were
essential the same as their large‐scale counterparts (Table 1).
To qualify a chromatography scale‐down model, the achieved separation should be at the
same level as at manufacturing scale. Yields (or recoveries) and the quality attributes
should be comparable to full‐scale. Regarding peak shape, retention times, or pool volume
some difference may be observed due to unavoidable scale differences like tubing or

Chapter 5
82
detectors. When these differences are understood the scale down model can be accepted
(Godavarti et al. 2005).
When applying the scale‐down model for SEC at setpoint, similar results were obtained
compared to large‐scale. In Figure 5, examples of SEC chromatograms of PV type 3 at
manufacturing and lab‐scale are given. The same concentrated virus was used to load the
columns. From these chromatograms it can be concluded that a similar purification is
obtained, that is, the peak shape and separation are in good agreement. It was observed
that retention times (expressed in %CV) at lab‐scale are longer. This dissimilarity could be
explained by the discrepancy in tubing path lengths and the UV detectors. The differences
in retention times were therefore negated. Besides chromatograms, the purity and yields
were considered important parameters to qualify the scale‐down model. The yields found
for the scaled‐down model were comparable to those at manufacturing scale for PV type 1
(63 ± 7% and 64 ± 1%), PV type 2 (77 ± 6% and 71 ± 14%), and PV type 3 (74 ± 10% and 84 ± 7%).
Purity of the intermediate fraction was assessed by SDS‐Pages (data not shown),
spectrophotometrically (ratio A260/A280; (Koch and Koch 1985)) and by determination of
the concentration of host cell proteins (HCP). Both the ratio A260/A280, for the scale‐
down 1.15 ± 0.02 and for the large‐scale 1.12 ± 0.03, and the HCP concentration, 11.9 ± 5.9
and 13.3 ± 4.8 µg mL−1 for respectively small‐scale and large‐scale, were in good agreement.
Figure 5. SEC chromatograms of PV type 3. Absorbance at 280 (blue line) and 254 nm (red line) are used to determine fractioning. The second peak corresponds to the virus peak. Panel A: at manufacturing scale;
Panel B: at lab‐scale. At lab‐scale the SEC running time was longer to show all (impurity) fractions.
Qualification of the scale‐down model for the IEX was a challenge due to observed
interactions of the virus with the column matrix. Although similar chromatograms, in
terms of peak shape, could be obtained also different peaks shapes were observed. Since
this variation also occurs at manufacturing scale the observed peak shapes were
considered to be within the existing variation at manufacturing scale and thus less critical
for qualification of the scale‐down model (Figure 6). IEX applied in this purification process
functions to capture impurities. The performance of this function can be described by
0
0.5
1.0
1.5
AU
0 5 10 15 20 25 30 35 L0
1.0
2.0
3.0
AU
0 20 40 60 80 100 120 140 mL
A B
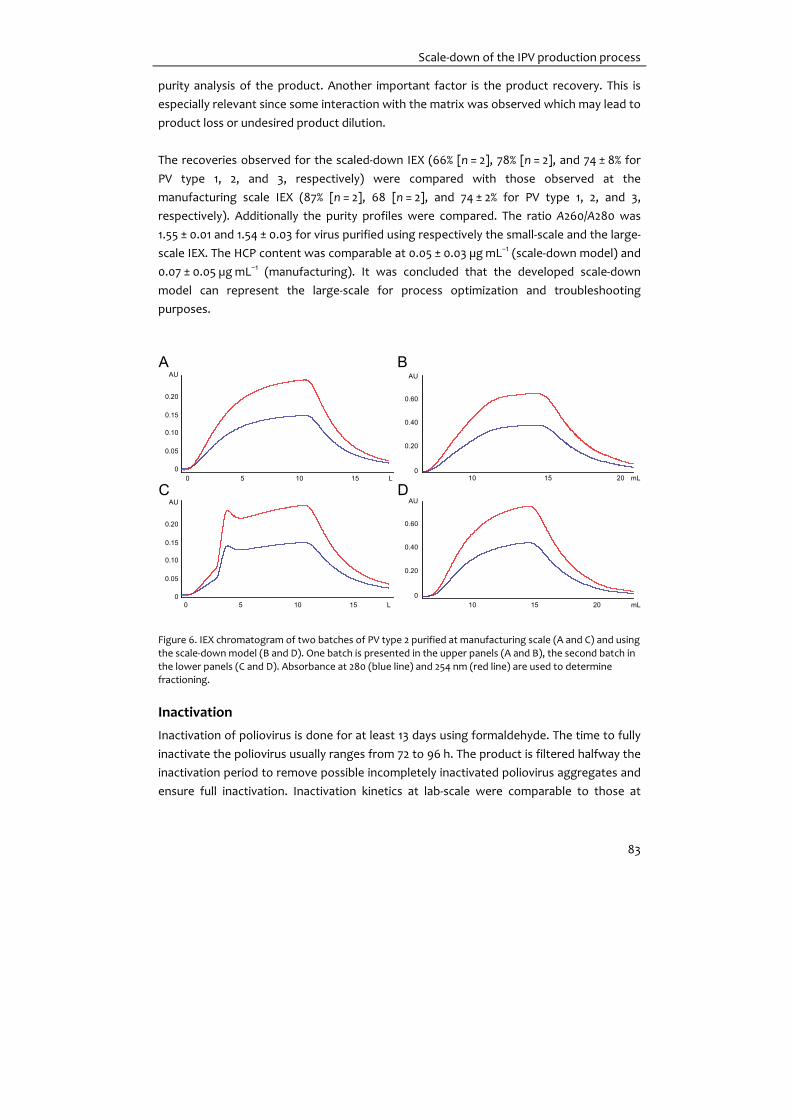
Scale‐down of the IPV production process
83
purity analysis of the product. Another important factor is the product recovery. This is
especially relevant since some interaction with the matrix was observed which may lead to
product loss or undesired product dilution.
The recoveries observed for the scaled‐down IEX (66% [n = 2], 78% [n = 2], and 74 ± 8% for
PV type 1, 2, and 3, respectively) were compared with those observed at the
manufacturing scale IEX (87% [n = 2], 68 [n = 2], and 74 ± 2% for PV type 1, 2, and 3,
respectively). Additionally the purity profiles were compared. The ratio A260/A280 was
1.55 ± 0.01 and 1.54 ± 0.03 for virus purified using respectively the small‐scale and the large‐
scale IEX. The HCP content was comparable at 0.05 ± 0.03 µg mL−1 (scale‐down model) and
0.07 ± 0.05 µg mL−1 (manufacturing). It was concluded that the developed scale‐down
model can represent the large‐scale for process optimization and troubleshooting
purposes.
Figure 6. IEX chromatogram of two batches of PV type 2 purified at manufacturing scale (A and C) and using
the scale‐down model (B and D). One batch is presented in the upper panels (A and B), the second batch in
the lower panels (C and D). Absorbance at 280 (blue line) and 254 nm (red line) are used to determine fractioning.
Inactivation
Inactivation of poliovirus is done for at least 13 days using formaldehyde. The time to fully
inactivate the poliovirus usually ranges from 72 to 96 h. The product is filtered halfway the
inactivation period to remove possible incompletely inactivated poliovirus aggregates and
ensure full inactivation. Inactivation kinetics at lab‐scale were comparable to those at
A BAU
0
0.05
0.10
0.15
0.20
0 5 10 15 L 10 15 20 mL
AU
0
0.20
0.40
0.60
AU
0
0.20
0.40
0.60
10 15 20 mL
D
0 5 10 15 L
AU
0
0.05
0.10
0.15
0.20
C

Chapter 5
84
manufacturing scale as can be concluded from Figure 7. The product loss during
inactivation was neglectable at both scales.
Figure 7. Time curves of inactivation of poliovirus with formaldehyde. Typical
inactivation curves are depicted for PV
type 1 (squares), PV type 2 (circles) and PV type 3 (triangles). Inactivation of
poliovirus at manufacturing scale is given
in black, the scaled down inactivation is given in gray. Error bars give the standard
assay variation. Dotted line shows lower
detection limit for the assay.
Overall Process
So far the described results concern the performance of the independent unit operations,
meaning that when using intermediate products obtained from manufacturing the scaled
down models act similarly to their large‐scale counterparts. Optimization studies at lab‐
scale, however, need to, besides the effects on the unit of interest, also describe the
effects on subsequent unit operations. It is therefore necessary to assess the performance
of the scaled‐down units consecutively. Three batches of monovalent PV type 1 were
produced at lab‐scale. To obtain sufficient harvest volumes cell and virus culture were
carried out in 5 and 10 L bioreactors and virus harvest was subsequently pooled. Virus
infection was done when the cell concentration was approximately 0.8 × 10⁶ cells mL−1. At
this time of infection the growth rate was ∼0.020 h−1. Virus cultures contained on average
93 DU mL−1 at the harvest time. The virus harvest was subsequently clarified, concentrated
and purified prior to inactivation at small‐scale. Product purity profile after IEX was
assessed. The A260/A280 ratio, here 1.62 ± 0.05, and HCP concentrations ranged from
0.01–0.3 µg mL−1 (on average 0.15 µg mL−1) indicate slightly higher impurities when
compared to the use of individual unit operations and to the values observed at large‐
scale. The difference in impurity profiles was largely due to peak collection after SEC and
IEX. This process is not automated but performed manually, both at manufacturing as at
lab‐scale, and therefore operator dependent. Current studies focus on the possibility to
automate product peak collection to decrease variation in the product profile. In Figure 8,
a comparison of the yields during the DSP process is given. For all unit operations
comparable product recoveries were observed. It can thus be concluded that a
comparable efficiency was observed throughout the downstream processing. Assessment
of the monovalent product immunogenicity was done using the batch‐release rat potency
test. The product prepared at lab‐scale induced sufficient neutralizing antibodies and met
0
2
4
6
8
10
12
0 20 40 60 80 100 120 140
Vir
us
tite
r (L
OG
10T
CID
50
mL
-1)
Inactivation time (h)

Scale‐down of the IPV production process
85
release criteria. From these results it was concluded that the obtained scale‐down model
can be used for lab‐scale experiments to explore the influence and effects of the different
parameters and possible changes to the production process.
A perfect scale‐down model should not only operate similar on setpoint, but also react in a
similar manner when operated beyond the setpoints. It is, however, not feasible to
generate the data at manufacturing scale which is necessary for this comparison.
Therefore, regarding process changes, confirmation runs at manufacturing scale are still
required. These confirmation runs will also provide information on the performance of the
scale‐down model. Additionally, by mimicking the deviations occurring at manufacturing
scale in the scale‐down model further model development can be pursued.
Figure 8. D‐antigen recoveries for purification of PV type 1. Large‐scale 1,500‐L (white; n = 16) and scaled‐down process 20‐L (gray; n = 3). The data presented for the scale‐down model represent consecutive processing, that is, the USP and DSP were done at lab‐scale. No statistically significant difference was found
for the yields (i.e., t‐test results α = 0.05; P > 0.05).
Conclusions The current scale‐down models for cell and virus culture (2.3‐L) and the subsequent
filtration, purification, and inactivation are in agreement with its production scale
counterpart (750‐L bioreactor and 1,500‐L virus harvest) when operated at setpoint. With
this model relatively large changes in the production process (like process optimization,
the use of different culture media, and other virus types) can be studied and used to
predict the large‐scale outcome.
0
20
40
60
80
100
120
clarification concentration SEC IEX inactivation overall
Yie
ld (
%)

Chapter 5
86
Acknowledgements The authors would like to thank G. van Eikenhorst for characterization of the lab‐scale cell
culture equipment, M. de Vries for assistance during DSP and HCP analysis, A. de Haan for
amino acid analysis, S. Haddad for virus titer analysis and D‐antigen ELISA and J. Ferreira
for help on statistical equivalence testing.

Scale‐down of the IPV production process
87
Nomenclature A260/A280 ratio between the absorbance at 260 and 280 nm D bioreactor diameter (m) DU D‐antigen Units H height of fluid in bioreactor (m) HCP Host cell proteins kLa mass transfer coefficient (s−1) MOI multiplicity of infection N Agitation speed (s−1) Np impeller power number NRE Reynolds number P power input (W) PV poliovirus q specific consumption or production rates (mmol 109 cells−1 h−1) TOI time of infection V volume of fluid (m3) vT impeller tip speed (m s−1)
Greek Symbols µ specific growth rate (h−1) ρ density of fluid (kg m−3)


Chapter 6
Transfer of an adherent Vero cell culture
method between two different rocking
motion type bioreactors with respect to
cell growth and metabolic rates
Published as:
Thomassen, Y.E., van der Welle, J.E., van Eikenhorst, G., van der Pol, L.A., Bakker, W.A.M.
(2012) Transfer of an adherent Vero cell culture method between two different rocking
motion type bioreactors with respect to cell growth and metabolic rates.
Process Biochemistry 47(2): 288‐296
dx.doi.org/10.1016/j.procbio.2011.11.006

Chapter 6
90
Abstract Rapid and simple cell and virus cultivation can currently be carried out using disposable
bioreactors. The CELL‐tainer® (CELLution Biotech BV) disposable bioreactor is a rocking‐
type bioreactor which not only has vertical movement but horizontal displacement as well.
Due to this two‐directional movement relatively high mass‐transfer capacities can be
reached when compared with conventional rocking motion‐type bioreactors.
Using the design of experiments (DoE) approach we have developed models for the
mixing times in both the CELL‐tainer® and the BIOSTAT® CultiBag RM (Sartorius Stedim
Biotech) bioreactor (standard rocking motion‐type). The conditions for cultivation of Vero
cells in the CELL‐tainer® bioreactor were chosen based on comparable mixing times.
Vero cells growing adherent to Cytodex 1 microcarriers were cultivated in the CELL‐tainer®
and in the BIOSTAT® CultiBag RM. Both bioreactors were controlled with regard to
temperature, pH and % dissolved oxygen. Vero cell growth in both bioreactors was
comparable with respect to the growth characteristics and main metabolite production
and consumption rates. Additionally, poliovirus production in both bioreactors was shown
to be similar.

Vero cell culture in rocking motion type bioreactors
91
Introduction Vero (African green monkey kidney) cells can be regarded as a platform for vaccine
production (Barrett et al. 2009). They have been widely used for over 30 years for the
production of inactivated polio and rabies vaccines (Montagnon et al. 1981; van Wezel et
al. 1978). Recent work regarding vaccine developments using Vero cells range from a
pandemic H5N1 influenza (Crowe et al. 2010) to flaviviruses like Dengue (Petiot et al.
2010b) or pediatric vaccines like respiratory syncytial virus (RSV) vaccine (Widjojoatmodjo
et al. 2010). Some of these anticipated vaccines, for instance a vaccine against a pandemic
influenza virus, would benefit from a fast‐track concept for development and
manufacture. In this respect, multi‐purpose bioprocess equipment and the use of standard
blue‐prints for protocols are essential.
Over the past few years disposable bioreactors have been increasingly used in
biopharmaceutical industry. The main advantages of disposable bioreactors are their
flexibility, ease of handling, reduced incidence of cross‐contamination and savings in time
and costs, mainly due to the pre‐sterility of the cultivation container which is guaranteed
by the vendor (Eibl et al. 2010). New systems for disposable bioreactors are continuously
under development. Fast application of these new systems using existing protocols on
essential operating parameters and cultivation conditions are indispensable for their
implementation.
Figure 1. Schematics of the motions of
rocking motion type bioreactors. In panel
a the conventional rocking motion type bioreactor (RM) (figure adapted from
(Singh 1999)) is shown. Both the rocking
speed and the angle can be adjusted. In panel b the CELL‐tainer® bioreactor (CT)
(figure adapted from (van der Heiden et
al. 2008)) is depicted, here the rocking speed, the horizontal and the vertical
displacement and the phase between the
horizontal and the vertical movement can be adjusted
Recently, a novel rocking motion type bioreactor, the CELL‐Tainer® (CT), was developed
(van der Heiden et al. 2008). The CT has a different type of rocking motion compared with
the conventional rocking motion or wave bioreactor (RM) described by Singh (Singh 1999)
(Figure 1). In rocking motion type bioreactors agitation and mixing are induced by a
rocking angle
rocking motion
rocking motion

Chapter 6
92
vertical displacement, which generates a wave in the cell culture. The RM tilts at a central
pivot point to generate the wave motion. The CT has such a movement that the pivot axis
follows a cyclical closed loop motion which causes the bioreactor to swivel both in vertical
as well as in horizontal direction. This two‐dimensional motion results in more gentle
waves and superior oxygen transfer capabilities.
Oxygen transfer coefficients (kLa) ranging from 200 h−1 to 700 h−1 are reported for the CT
(Chaudet et al. 2011; Oosterhuis and van den Berg 2011; Oosterhuis and van der Heiden
2010) compared to 2–4 h−1 for conventional RM bioreactors (Hanson et al. 2009; Singh
1999) or 0.7–1.5 h−1 (surface aerated cell culture) for standard stirred tank bioreactor
(Lavery and Nienow 1987).
Process transfer or scale‐up for stirred tank bioreactors is done based on different criteria
(Rathore et al. 2005b; Schmidt 2005; van 't Riet and Tramper 1991). Common criteria next
to geometric similarity are: (a) constant tip speed (vT), (b) constant Reynolds number
(NRE), (c) equivalent oxygen transfer (kLa), or (d) constant power input per unit volume
(P/V). The latter two are the preferred methods and result in similar mixing across scales
(Rathore et al. 2005b).
Consequently, mixing is one of the most significant factors affecting performance and is
often used in scale‐up and process transfer. One of the methods used to characterize
mixing is determination of the mixing time (Θm), which is defined as the time needed to
obtain a specific degree of homogeneity after a pulse signal of tracer. Although scaling
using a constant Θm is not always feasible due to increasing power needs at higher
volumes (Schmidt 2005; van 't Riet and Tramper 1991), it can be applied for process
transfer at comparable scales.
Protocols and cultivation conditions for growth of Vero cells adherent to microcarriers in
RM are available (Blüml 2007; Genzel et al. 2010; Schouwenberg et al. 2010). In this work,
we have determined the Θm in relation to operational settings using a design of
experiments approach for both the RM and the CT. Process transfer from the RM to the CT
was successfully done at comparable scale based on comparable Θm considering Vero cell
growth characteristics and poliovirus production.
Materials and methods
Cell lines and culture media
Adherent growing Vero cells obtained from WHO (10‐87) originally derived from ATCC
(CCL‐81) were adapted to grow in VP‐SFM (Invitrogen, #12559‐019) supplemented with L‐

Vero cell culture in rocking motion type bioreactors
93
glutamine (2 mM final concentration, Invitrogen, #25030‐123) at 37 °C. This medium is
further referred to as SFM.
Virus type and assays
The poliovirus strain used was Sabin type 1 (LS‐c 2ab KP2).
Virus titers were determined by 50% tissue culture infective dose (TCID50). Serial dilutions
(10‐fold) of the culture supernatants were prepared in culture medium. Vero cells in
culture medium (1 × 10⁴ cells/well) were added to a 96‐wells plate. Virus suspension (50
μL/well) was added. TCID50 assays were visually inspected for cytopathic effect (CPE) after
7 days incubation at 37 °C.
D‐antigen concentrations were determined via sandwich ELISA using monoclonal
antibodies (Kersten et al. 1999). In short, samples (when necessary diluted in PBS, 0.1 v/v%
Tween‐20, and 0.5% Protifar (Nutricia, Zoetermeer, The Netherlands) were added to
microtiter plates (Greiner, white, high‐binding) coated with caprylated bovine‐anti‐
poliovirus type 1. After washing with wash buffer (PBS, 0.1% v/v Tween‐20) poliovirus was
detected using an in‐house monoclonal antibody (3–4E4) and HRP‐labeled goat anti‐
mouse. For detection the luminescence signal reagent HighLite (Zomerbloemen B.V., Zeist,
The Netherlands) was used. The emitted light was detected using a luminometer (Fluostar
OPTIMA, BMG Labtech, Ortenberg, Germany).
Pre‐cultures
T‐flasks or HYPERflasks (Corning) were inoculated with approximately 3 × 10⁴ cells cm‐2 and
grown for 4 days in SFM. When fully confluent (∼2.5 × 10⁵ cells cm‐2) cells were washed
using PBS without Ca2+/Mg2+ (Invitrogen, #20012019) and detached using 1× TrypLE Select
(Invitrogen, #12563‐029). The TrypLE Select activity was not stopped. The cell suspension
was used to inoculate the bioreactors.
Microcarrier preparation
Microcarriers (Cytodex 1, GE healthcare #17‐0448‐03) were swollen in Ca2+/Mg2+ free PBS
for at least 3 h at room temperature and subsequently washed using fresh Ca2+/Mg2+ free
PBS before sterilization. Prior to use the microcarriers were washed twice using SFM.
Vero cell culture in standard rocking motion type bioreactor
For Vero cell cultivation in a 2 L BIOSTAT® Cultibag RM bioreactor (Sartorius Stedim
Biotech) 1 L SFM, 0.1% Pluronic F‐68 (Sigma‐Aldrich, #P5556), 3 g L−1 Cytodex 1 (GE
Healthcare, #17‐0448‐03), 4 mM Ca2+ and cells (start cell concentration 0.2 × 10⁶ cells mL−1;
corresponding with 10 cells/MC) were transferred to the Cultibag RM (Sartorius Stedim
Biotech, #DBO002L). The cultivation conditions were T: 37 °C; pH: 7.2 (controlled using CO2

Chapter 6
94
and NaHCO3); DO: 50% air saturation; rock speed: 16 rocks per minute (rpm); angle: 8°. The
DO was controlled using air, O2 and N2 via headspace aeration. Due to the large surface
area no sparging is required in rocking motion type bioreactors. A bolus feed of L‐
glutamine was given when the concentration was <0.5 mM. Cultures were performed at
least in triplicate.
Virus cultures (cultivation conditions: T 32.5 °C; pH 7.4; DO 25%) were performed without
media exchange. The used multiplicity of infection (MOI) was 0.01. Virus cultures were
complete (100% CPE) after 3 days.
Vero cell culture in CELL‐tainer® bioreactor
For cell and virus cultivations (3 L working volume) in a 20 L CELL‐tainer® Bioreactor Bag
(Cellution Biotech, #CB00010220) culture conditions were comparable to that in the RM.
CT (Figure 1) settings were phase: 25%; rock speed: 15 rpm; horizontal displacement: 40%;
vertical displacement: 30%.
Mixing time measurement
Mixing times (Θm) were determined using an acid (HCl) pulse in PBS. Homogeneity was set
at 85% of the final equilibrium. For determination of Θm optical pH sensors do not qualify
due to their relatively high response time (τp). As a rule of thumb the τp should be much
smaller than Θm (van 't Riet and Tramper 1991). Therefore, a glass pH sensor (VWR, 662‐
1788) with a response time (95% homogeneity) of <1 s was mounted in the center of the
disposable cell culture bags.
Microcarrier homogeneity
Determination mixing efficiency of Cytodex 1 microcarriers, or MC homogeneity, was done
visually. Microcarriers were stained using Trypan Blue, suspended in water and added to
the culture bag. The homogeneity of MC distribution throughout the fluid was quantified
using four categories. A: not mixed, microcarriers remain at bottom of bag; B: part of the
microcarriers is at the bottom of the bag, the other part is moving in the fluid; C: all
microcarriers are moving but some clouds are visible; D: microcarriers are evenly
distributed throughout the fluid. The categories were given values of 1, 3, 7 and 10,
respectively, for data analysis purposes.
Culture samples and analysis
Samples (5–10 mL) from the Cultibag and CELL‐tainer® were taken using a syringe through
a Luer‐Lock‐septum. Cell counts were measured using a Nucleocounter (Chemometec) to
determine total nuclei. Using a Bioprofile 100 Plus (Nova Biomedical) glucose, lactate,
glutamine, glutamate and ammonium were determined directly after sampling.

Vero cell culture in rocking motion type bioreactors
95
Cells were stained with hematoxylin and observed with inverted light microscopy (20×
magnification).
Calculation of specific rates and yields
Cell concentrations (cells mL−1) were corrected for the volume of the microcarriers.
Specific rates for growth rate (μ), glucose or glutamine consumption (qGlc, qGln) and lactate,
glutamate and ammonia production (qLact, qGlu, and qNH3) were calculated according to the
following equations:
(eq.1)
or (eq.2)
where X is the viable cell concentration, S and P, respectively, are the concentrations of
substrate and products. Smoothing of experimental points and generation of intermediate
points was achieved by fitting a polynomial curve, either 3rd of 4th order, to the
experimental data.
Design of experiments (DoE)
Response surface modeling using MODDE 9.0 software for design of experiments and
optimization (Umetrics) was applied to characterize the influence of the rocking settings
on the mixing times and MC homogeneity.
The fractional factorial design for mixing times and MC homogeneity in the CT consisted of
five factors namely, rocking speed, horizontal displacement, vertical displacement, phase
and volume at two levels comprising all the possible combinations. All mixing times were
measured in triplicate. Moreover a center point was measured in triplicate (phase
excluded this was only set at 25 or 50). A first analysis indicated a squared term in the
model therefore the factorial design was complemented to a response surface model
design namely a composite face centered design (CCF). All factors, that were significant
after the first screening have five levels in the CCF design.
For the RM a full factorial design for two factors, angle and rocking speed, was created on
2 levels. Also a center point was included. All measurements were performed in triplicate.
The design was complemented to a CCF with 2 factors and 5 levels due to the indication
that a squared term should be included in the model.
Experimental design and measured responses are given in supplementary data.

Chapter 6
96
Figure 2. Growth kinetics of Vero cells grown adherent to Cytodex 1 microcarriers in a 2 L RM in SFM. Graphs show the average curves with standard deviation (n = 3). Concentration of attached cells and specific
growth rate are shown in panel a and b, respectively; panel c shows glucose (closed diamonds) and lactate
(open squares) concentrations, their specific consumption or production rates are shown in panel d; panels e and f, respectively, show concentrations and specific rates for glutamine (closed diamonds) and
ammonium (open squares). At 70–80 h glutamine was fed to the bioreactor. Lines are for guidance.
0
0.01
0.02
0.03
0.04
0 20 40 60 80 100
sp
ec
ific
gro
wth
ra
te (
h-1
)
Time (hrs)
0
0.2
0.4
0.6
0.8
1
0 20 40 60 80 100
Ce
ll co
nc
. (x
10
6 c
ells
mL
-1)
Time (hrs)
0
10
20
30
0 20 40 60 80 100
Glu
co
se
& la
cta
te c
on
c (
mM
)
Time (hrs)
0
0.5
1
1.5
2
2.5
0 20 40 60 80 100
qla
ct&
qg
lc (m
mo
l 1
09
ce
lls-1
h-1
)
Time (hrs)
0
0.5
1
1.5
2
2.5
3
0 20 40 60 80 100
Glu
tam
ine
& N
H3
co
nc
(m
M)
Time (hrs)
0
0.05
0.1
0.15
0.2
0.25
0 20 40 60 80 100
qg
ln&
qN
H3
(mm
ol
10
9c
ells
-1 h
-1)
Time (hrs)
A
E
B
DC
F

Vero cell culture in rocking motion type bioreactors
97
Results
Cultivation of Vero cells in BIOSTAT® Cultibag RM bioreactor (RM)
In the following section, results obtained by cultivation of Vero cells grown adherent to
microcarriers in SFM medium in a conventional rocking motion type bioreactor are
described (Figure 2).
Previously a protocol for cultivation of Vero cells attached to Cytodex 1 microcarriers has
been reported (Blüml 2007). In this protocol it is described that during the first hours of
cultivation the angle and rock speed is adjusted repeatedly to allow cells to attach to the
microcarriers. For practical reasons the protocol was adapted to a single angle and rock
speed throughout the culture. The chosen angle and rock speed (8°; 16 rpm) were based
on MC homogeneity at the lowest possible rock speed.
Initial experiments were done to determine cultivation conditions with respect to
microcarrier concentration (2–4 g L−1), seeding cell concentration (5–20 × 104 cells mL−1)
and Ca2+ content (3–5 mM). Based on these initial experiments (results not shown) the
optimal conditions for cultivation of Vero cells in the RM bioreactor were chosen (see
Section 2). Using these culture conditions, Vero cells seeded at a cell concentration of 0.2 ×
106 cells mL−1 reached a cell concentration of 0.8 × 10⁶ cells mL−1 after 95 h of cultivation
(Figure 2; Table 1). Cells were equally distributed on the microcarriers both at the start (day
1) of the cell culture as at the end (day 4; Figure 3). The observed growth rate was
reasonably constant during the culture time. Consumption of glucose and glutamine
resulted in accumulation of by‐products lactate and NH4+. Steady lactate on glucose yield
(YLact/glc) of 1.9 was obtained indicating that nearly all of the glucose consumed was
converted to lactate. After 70 h of cultivation glutamine was added (to a concentration of
2 mM) to prevent limitation of glutamine for growth (Figure 2E). Vero cell growth in the
RM was reproducible with respect to cell and metabolite concentrations as well specific
rates for growth and metabolite consumption (Figure 2).
Mixing times
To be able to transfer the cultivation protocols from the RM to the CT, mixing times (Θm) in
both systems were determined. Besides an appropriate Θm, conditions in which
microcarriers remained suspended were chosen as prerequisite for cultivation. To assess
both Θm and MC homogeneity a design of experiments (DoE) approach was used. A first
screening was based on (fractional) factorial design which was later complemented to a
response surface model design namely a central composite face centered design (CCF). In
Figure 4A & B the prediction results of the models (Table 2) for the 2‐L RM are given. An
increase in angle or rocking speed correlates similarly with increased MC homogeneity as
decreased Θm. The applied conditions for cultivation of Vero cells as shown in Figure 2

Table 1. Growth characteristics and metabolic rates for adherent Vero cell growth in RM and CT bioreactors
a Literature values for STR or spinner flasks are given when similar cultivation conditions ((fed‐) batch cultivation with 2–3 g L−1 Cytodex 1 and SFM) are used. b Given specific rates are those ∼20 h after inoculation
CultiBag RM CELL‐tainer® Literature Literature References
(RM) (STR)a RM STR
start cell concentration
(106 cells mL‐1)
0.2 0.2 0.2 0.1‐0.4 (Genzel et al. 2010;
Schouwenberg et al.
2010)
(Merten et al. 1999; Petiot et al. 2010a;
Quesney et al. 2003; Rourou et al. 2007)
cell concentration at
95h
(106 cells mL‐1)
0.8 0.9 0.7‐1.2 0.9‐2.6 (Genzel et al. 2010;
Schouwenberg et al.
2010)
(Merten et al. 1999; Petiot et al. 2010b;
Rourou et al. 2007; Toriniwa and Komiya
2007)
µmax
(h‐1)
0.017 0.027 ‐ 0.017‐0.033 (Merten et al. 1999; Petiot et al. 2010a;
Quesney et al. 2003; Rourou et al. 2007)
accumulation of lactate
(mM)
26 27 ~17 9‐32 (Genzel et al. 2010) (Petiot et al. 2010b; Quesney et al. 2003;
Rourou et al. 2007)
accumulation of
ammonia
(mM)
2.3 2.0 ~2.3 0.8‐1.5 (Genzel et al. 2010) (Petiot et al. 2010b; Quesney et al. 2003;
Rourou et al. 2007)
qGlc
(mmol 109 cells‐1 h‐1)b
0.5 0.5 ‐ 0.3‐0.5 (Petiot et al. 2010b; Quesney et al. 2003)
qGln
(mmol 109 cells‐1 h‐1)b 0.1 0.1 ‐ 0.09‐0.11 (Petiot et al. 2010b)
qLact
(mmol 109 cells‐1 h‐1)b 1.0 1.3 ‐ 0.7 (Petiot et al. 2010b)
qNH3
(mmol 109 cells‐1 h‐1)b
0.1 0.1 ‐ 0.05 (Petiot et al. 2010b)
YLact/Glc 1.9 2.0 1.6 1.14‐1.7 (Genzel et al. 2010) (Petiot et al. 2010b; Quesney et al. 2003)
YNH3/Gln 1.0 1.0 ‐ 0.5 (Petiot et al. 2010b)

Vero cell culture in rocking motion type bioreactors
99
Figure 3. Distribution of Vero cells growing adherent to microcarriers in the RM at day 1 and 4 of the cell
culture. Cells were stained using hematoxylin and observed with inverted light microscopy (size bar = 200 μm).
Table 2. RSM models for mixing time and MC homogeneity in the RM and CT
Factor Coefficient
(scaled & centered)
Standard
error
P‐value
RM Mixing time
Rocking speed ‐125.815 8.662 < 0.000
Angle ‐42.891 7.945 < 0.000
(Rocking speed)2 135.652 15.283 < 0.000
(Rocking speed)×(Angle) 42.084 8.987 < 0.000
RM MC homogeneity
Rocking speed 5.432 0.921 < 0.000
Angle 2.766 0.685 0.001
CT Mixing time
Rocking speed ‐0.308 0.053 < 0.000
Vertical displacement ‐0.345 0.053 < 0.000
Volume 0.179 0.053 0.002
(Vertical displacement)2 0.219 0.104 0.042
(Rocking speed)×(Vertical displacement) ‐0.112 0.054 0.046
CT MC homogeneity
Horizontal displacement 1.188 0.288 < 0.000
Vertical displacement 2.313 0.288 < 0.000
Rocking speed 1.813 0.288 < 0.000
(Vertical displacement)2 ‐3.806 1.003 0.001
(Horizontal displacement)×(Vertical
displacement)
‐0.938 0.288 0.003
(Rocking speed)×(Vertical displacement) 1.063 0.288 0.001
RM models for mixing time (s) (R2 0.961; Q2 0.930) and MC homogeneity (R2 0.762; Q2 0.626) are described
by rocking speed (rpm) and angle (°). The CT model for mixing time (s) (R2 0.721; Q2 0.631) is described by rocking speed (rpm), vertical displacement (%) and volume (mL). The CT model for MC homogeneity (R2
0.853; Q2 0.777) is described by horizontal and vertical displacement (%) and rocking speed (rpm).
day 1 day 4
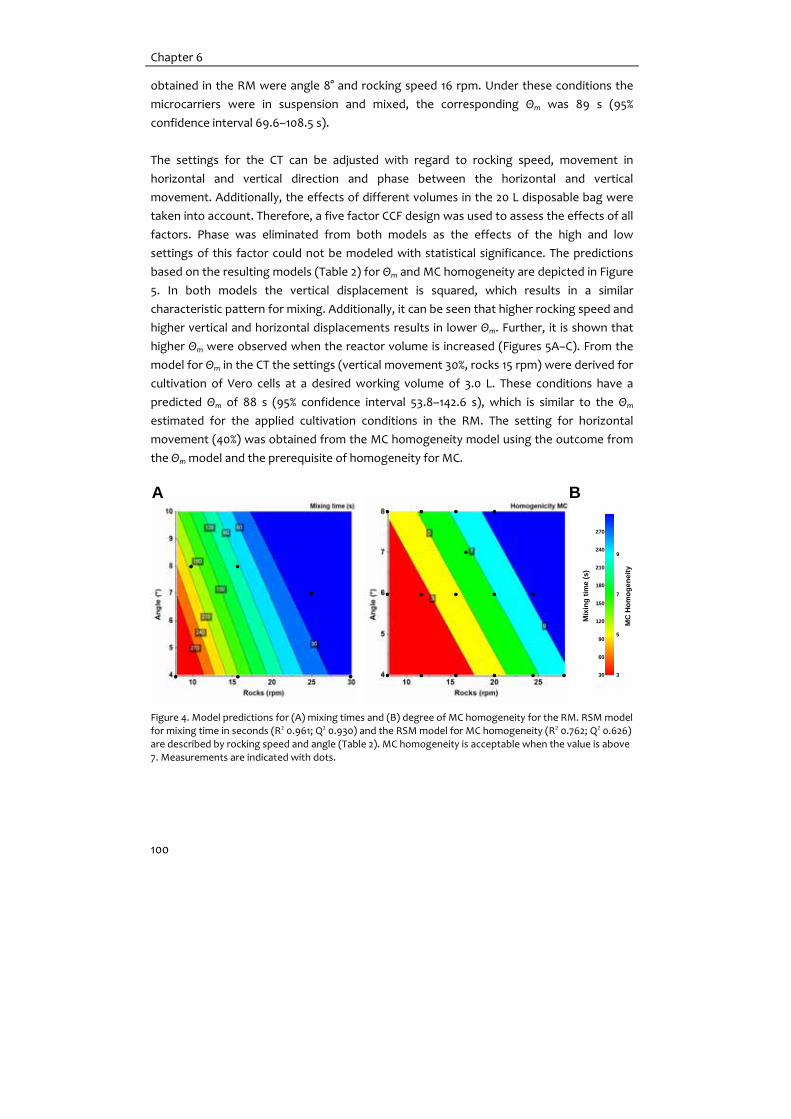
Chapter 6
100
obtained in the RM were angle 8° and rocking speed 16 rpm. Under these conditions the
microcarriers were in suspension and mixed, the corresponding Θm was 89 s (95%
confidence interval 69.6–108.5 s).
The settings for the CT can be adjusted with regard to rocking speed, movement in
horizontal and vertical direction and phase between the horizontal and vertical
movement. Additionally, the effects of different volumes in the 20 L disposable bag were
taken into account. Therefore, a five factor CCF design was used to assess the effects of all
factors. Phase was eliminated from both models as the effects of the high and low
settings of this factor could not be modeled with statistical significance. The predictions
based on the resulting models (Table 2) for Θm and MC homogeneity are depicted in Figure
5. In both models the vertical displacement is squared, which results in a similar
characteristic pattern for mixing. Additionally, it can be seen that higher rocking speed and
higher vertical and horizontal displacements results in lower Θm. Further, it is shown that
higher Θm were observed when the reactor volume is increased (Figures 5A–C). From the
model for Θm in the CT the settings (vertical movement 30%, rocks 15 rpm) were derived for
cultivation of Vero cells at a desired working volume of 3.0 L. These conditions have a
predicted Θm of 88 s (95% confidence interval 53.8–142.6 s), which is similar to the Θm
estimated for the applied cultivation conditions in the RM. The setting for horizontal
movement (40%) was obtained from the MC homogeneity model using the outcome from
the Θm model and the prerequisite of homogeneity for MC.
Figure 4. Model predictions for (A) mixing times and (B) degree of MC homogeneity for the RM. RSM model for mixing time in seconds (R2 0.961; Q2 0.930) and the RSM model for MC homogeneity (R2 0.762; Q2 0.626)
are described by rocking speed and angle (Table 2). MC homogeneity is acceptable when the value is above
7. Measurements are indicated with dots.
A B
9
7
5
330
60
90
120
150
180
210
240
270
Mix
ing
tim
e (
s)
MC
Ho
mo
ge
ne
ity

Vero cell culture in rocking motion type bioreactors
101
Figure 5. Model predictions for mixing times in the CT at different volumes: (a) 5‐L, (b) 10‐L and (c) 15‐L and
the MC homogeneity at different horizontal displacement (d) 5%, (e) 53% and (f) 100%. RSM model for
mixing time in seconds (R2 0.721; Q2 0.631) is described by rocking speed, vertical displacement and volume (Table 2). The RSM model for MC homogeneity (R2 0.853; Q2 0.777) is described by horizontal and vertical
displacement and rocking speed (Table 2). MC homogeneity is acceptable when the value is above 7.
Measurements are indicated with dots.
Cultivation of Vero cells in CELL‐tainer® bioreactor (CT)
The settings used for cultivation of Vero cells in the CT were obtained from the mixing
models described above. Other settings like temperature, cell concentration and medium
composition were kept constant when transferring the process from the RM to the CT.
Growth kinetics and metabolite concentration time courses for Vero cell culture in the CT
are presented in Figure 6 and Table 1. The specific growth rate of Vero cells in the CT
peaked to 0.027 h−1 at ∼30 h. Distribution of the cells on the microcarriers was comparable
with the photos shown in Figure 3. Specific glucose consumption rate was fairly constant
and decreased near the end of the culture. Glutamine consumption rate declined with
culture time. Glutamine was added to the bioreactor when the concentration was below
0.5 mM to prevent glutamine depletion (around 70–80 h). Accumulation of by‐products
was observed, lactate was produced to a maximum concentration of 27 mM with a yield of
9
7
5
3
MC
Ho
mo
ge
ne
ity
A B C
30
60
90
120
150
180
210
240
270
Mix
ing
tim
e (
s)
D E F
Chapter 6
102
Ylact/gluc 2.0 which suggests that all glucose was converted to lactate. Reproducibility of the
cell culture in the CT was reasonable with respect to cell and metabolite concentrations.
Larger variations were observed for specific rates mainly at the beginning of the culture.
Comparison of Vero cell growth and metabolic rates in RM and CT
Process transfer from the RM to the CT was considered satisfactory when both systems
performed equivalent with respect to Vero cell growth characteristics. Cells were equally
distributed over the carriers in both bioreactor systems. After 95 h cultivation a similar cell
density was obtained (Figures 2 & 6; Table 1). The maximum specific growth rate seemed
to differ between both systems. At a culture time of 20–40 h the growth rate in the CT was
significantly higher compared with the growth rates in the RM (Figures 2 & 6). This might
be due to the slightly longer lag phase observed in the CT. However, at the end of the
exponential phase the cells had the same growth rates. Glucose and glutamine
concentrations as well as the concentrations of the by‐products lactate and ammonium
were comparable throughout the culture (Figures 2 & 6). Moreover, the specific
consumption and production rates were similar (Figures 2 & 6; Table 1). Overall the growth
characteristics between both systems were considered equivalent showing that process
transfer at comparable scales based on mixing characteristics is applicable for rocking
motion bioreactors.
Table 3. Poliovirus production
Cell concentration at
infection (106 cells mL‐1)
Virus culture
time (h)
Virus titer
(10log TCID50 mL‐1)
D‐antigen
(DU mL‐1)
DU per cell
(10‐5 DU cell‐1)
RM 0.8 76 8.3 75 9.3
CT 0.8 72 8.3 77 9.6
Virus culture in the RM and CT
Vero cells grown in the RM or CT were infected with poliovirus (Sabin type 1) to assess
virus production capabilities of cells grown in these rocking motion type bioreactors. Cells
were infected at the end of the exponential phase when the cell concentration was 0.8 ×
106 cells mL−1 with a multiplicity of infection (MOI) of 0.01. Virus culture was complete
when 100% cytopathic effect (CPE) was observed; this occurred after approximately 75 h
both in the RM as in the CT. Virus yields based on virus titer were 8.3 log 10 TCID50 mL−1 for
both the RM as the CT. The D‐antigen content, a measure for the amount of
immunorelevant poliovirus, was similar at 75 and 77 DU mL−1 in the RM and CT, respectively
(Table 3). Therefore, it was concluded that the process transfer from the RM to the CT
based on mixing characteristics was suitable not only for the cell culture but also for the
virus culture.

Vero cell culture in rocking motion type bioreactors
103
Figure 6. Growth kinetics of Vero cells grown adherent to Cytodex 1 microcarriers in a 3 L CT in SFM. Graphs
show the average curves with standard deviation (n = 3). Concentration of attached cells and specific
growth rate are shown in panel a and b, respectively; panel c shows glucose (closed diamonds) and lactate (open squares) concentrations, their specific consumption or production rates are shown in panel d; panels
e and f, respectively, show concentrations and specific rates for glutamine (closed diamonds) and
ammonium (open squares). At 70–80 h glutamine was fed to the bioreactor. Lines are for guidance.
0
0.5
1
1.5
2
2.5
0 20 40 60 80 100
Glu
tam
ine
& N
H3
co
nc
(m
M)
Time (hrs)
0
0.2
0.4
0.6
0.8
1
0 20 40 60 80 100
Ce
ll c
on
c. (
x1
06
ce
lls m
L-1
)
Time (hrs)
0
0.01
0.02
0.03
0.04
0 20 40 60 80 100
sp
ec
ific
gro
wth
ra
te (
h-1
)
Time (hrs)
0
10
20
30
0 20 40 60 80 100
Glu
co
se
& la
cta
te c
on
c (
mM
)
Time (hrs)
0
0.5
1
1.5
2
2.5
0 20 40 60 80 100
qla
ct&
qg
lc (m
mo
l 1
09
ce
lls-1
h-1
)
Time (hrs)
0
0.05
0.1
0.15
0.2
0.25
0 20 40 60 80 100
qg
ln&
qN
H3
(mm
ol
10
9c
ells
-1 h
-1)
Time (hrs)
A
E
B
DC
F

Chapter 6
104
Discussion
Vero growth characteristics
Vero cells are widely used and several reports are available on Vero cell growth
characteristics in serum containing (SC) and serum free media (Genzel et al. 2010;
Mendonça and Pereira 1998; Merten et al. 1999; Petiot et al. 2010a; Quesney et al. 2003;
Rourou et al. 2007). The majority of these reports concerns data obtained in stirred tank
bioreactors. The first report on Vero cell growth in rocking motion type bioreactors
described yields of 1.4 × 10⁶ cells mL−1 after 96 h of growth using an inoculation density of
0.2 × 10⁶ cells mL−1 and 3 g L−1 Cytodex 1 microcarriers (Schouwenberg et al. 2010). In this
study the labor intensive protocol described by Pörtner (Pörtner 2007) was used. The
second article on Vero cell growth using a similar inoculation procedure as used here,
yielded 1.0 × 10⁶ cells mL−1 after 119 h of growth (Genzel et al. 2010). Using batch cultivation
in spinners with serum free medium, Vero cell yields may vary from 0.96 to 1.8 × 10⁶ cells
mL−1 (Table 1). In stirred tank bioreactors, cultivations in serum free media have resulted in
higher cell densities up to 2.6 × 10⁶ cells mL−1 (Rourou et al. 2007) using higher inoculation
densities and longer cultivation times. Application of different microcarrier concentrations
or different culture procedures as recirculation or perfusion may further increase cell
yields (Mendonça and Pereira 1998; Trabelsi et al. 2006).
Comparison of Vero cell growth between different systems and conditions is more
accurate when considering specific growth rates. In RM maximum specific growth rates
have not been reported previously. The maximum specific growth rates found here are
comparable to previously reported growth rates observed for Vero cells grown in stirred
tank bioreactors (Table 1). The growth rates found for the RM and the CT are in the same
range. Vero cell growth and cell yields can therefore be considered comparable between
the different rocking motion type bioreactors and between rocking motion type and
stirred tank bioreactors.
Specific rates for glucose and glutamine consumption for Vero cell growth were 0.5 and
0.1 mmol 109 cells−1 h−1 for glucose and glutamine consumption rates, respectively, in the
RM as well as in the CT. These specific consumption rates are in the same range observed
of other cultivation conditions for Vero cells and other kidney cell lines such as HEK293
cells (Garnier et al. 1994; Nadeau et al. 2000), BHK cells (Cruz et al. 2000) or MDCK cells
(Cruz et al. 2000; Glacken et al. 1986). High levels of lactate and ammonium were
accumulated during cultivation in rocking motion type bioreactors (Table 1). Ammonium
levels up to 2.5 mM were found not to be limiting Vero cell yields (Hassell et al. 1991). In
another study the ammonium concentration causing 50% reduction in cell yield (IC50) for
Vero cells was determined to be 5 mM (Huang et al. 2006). Based on these data we
assume that the ammonium concentration was not limiting cell growth. Lactate

Vero cell culture in rocking motion type bioreactors
105
concentrations around 20 mM at the end of batch cultivation have been found previously
(Petiot et al. 2010b; Trabelsi et al. 2005; Trabelsi et al. 2006). These currently observed
concentrations may be inhibitory (Quesney et al. 2003), yet also have been reported to
have negligible effects (Hassell et al. 1991). When both lactate and ammonium levels are
high a synergistic inhibitory effect may be observed (Hassell et al. 1991). Ylact/glc is relatively
high (1.9–2.0) compared to literature data. This high lactate over glucose yield indicates
that nearly all glucose is converted to lactate. This may occur when oxygen is limiting,
however, no oxygen depletion was observed during the culture (DO was successfully
controlled at 50%). This overflow metabolism is commonly observed in cultures of stable
cell lines like Vero (Quesney et al. 2003) or MDCK (Wahl et al. 2008). Medium optimization,
for instance the use of fructose as carbon source instead of glucose (Petiot et al. 2010b)
may be beneficial to lower the Ylact/glc.
The observed Vero cell growth and metabolite kinetics in the RM and CT are within usual
observed ranges. In particular growth resembles observations described for Vero cell
growth in the RM (Genzel et al. 2010), or in media containing similar amounts of glucose
(Petiot et al. 2010b).
Vero cell concentrations in rocking motion type bioreactors may be further increased using
different cultivation conditions like perfusion or recirculation strategies as shown for STR
cultivations (Mendonça and Pereira 1998; Trabelsi et al. 2006), alternative carbon sources
or feed strategies.
Virus production
Vero cells were infected with poliovirus at the end of the exponential phase. Virus yields,
both in the RM as in the CT, were 8.3 log 10 TCID50 mL−1. The obtained virus titers and yields
(in DU cell−1) are in good agreement with data obtained in stirred tank bioreactors (Merten
et al. 1999) and at industrial scale (Bakker et al. 2011; Kreeftenberg et al. 2006). In the
experiments described here virus culture was started without refreshing the medium.
Although the remaining glucose and glutamine levels were considered sufficient the
relatively high amounts of by‐products may have had a negative impact on virus
production. It has been reported that the presence of ammonia may be inhibitory for virus
production (Schneider et al. 1996). Further improvements to optimize virus yields may
therefore be possible.
Mixing characteristics
The first report on mixing times for rocking motion type bioreactors mentions Θm to range
from 5 to 10 s for 10‐L Wave bioreactors (Singh 1999). These figures were determined using
fluorescent dye and therefore may be an underestimation of the actual Θm. Later Eibl et al.
have reported that Θm in the RM range between 9 and 264 s in 2‐L bioreactors, and up to

Chapter 6
106
65–874 s in 200‐L bioreactors. Mixing times currently observed in the RM correspond with
those observed by Eibl et al. Settling of microcarriers has been reported to occur when
rocking speed is below 6 rpm (Singh 1999). In our study it was observed that rocking
speed should be as high as 15 rpm to avoid settling of microcarriers.
Mixing times in the CT are notably lower than in the RM, especially at lower rocking speed
(Figures 4 & 5). Also the MC homogeneity is better, at the lowest rocking speed sufficient
MC homogeneity can be obtained by applying a higher vertical displacement. However, for
the CT lower mixing times may be expected considering the difference in kLa values
reported for the CT (200–700 h−1 (Chaudet et al. 2011; Oosterhuis and van den Berg 2011;
Oosterhuis and van der Heiden 2010)) and the RM (2–60 h−1 (Glazyrina et al. 2010; Hanson
et al. 2009; Singh 1999)). This difference may be ascribed to the extremely large surface
area that can be generated in the CT which is due to its two‐dimensional motion.
Process transfer based on mixing characteristics
Mixing times for the RM and CT were determined using the pH response technique (van 't
Riet and Tramper 1991). In this method a tracer (here acid) is used and its concentration is
followed in time at a fixed point. This method is preferred above dye methods which are
often used for first indications on mixing configuration (Brown et al. 2004). Concerning
disposable bag bioreactors where the plastics are slightly opaque, pulse methods which
are detected using pH or conductometry are preferred. Although the use of conductivity
measurements is straightforward and allows detection of very low Θm a conductivity
electrode is not always available. All bioreactors are equipped with pH probes and
determining Θm using this method is therefore relatively simple. Critical is the response
time needed for the pH electrode to detect a change in H+ concentration. Since optical
probes usually used in disposable bioreactors have a long response time, a separate glass
pH electrode was applied to the bioreactor bags.
Process transfer from the RM to the CT was based on mixing times. Multiple rules can be
applied for process transfer or scale‐up (see for example (Rathore et al. 2005b; Schmidt
2005)). Mostly, constant volumetric oxygen transfer coefficients (kLa), Reynolds number
or ungassed power input per unit volume (P/V) are used in process transfer. In general, it is
not preferred to use constant mixing times as for scale‐up extremely high power
consumption may be needed to obtain a similar Θm compared to small scales (van 't Riet
and Tramper 1991). However, this rule could be applied since cultivation volumes were in
the same order of magnitude.
Using constant Θm for process transfer and determination of Θm with the pH method is
feasible in many laboratories and here it was shown that it can be applied to transfer
processes between different types of rocking motion bioreactors.

Vero cell culture in rocking motion type bioreactors
107
Acknowledgements The authors would like to thank CELLution Biotech BV for providing the CELL‐tainer®
bioreactor systems. The work was partially supported by NL Agency (no. IVG091769).

Chapter 6
108
Supplemental data Table S1. Experimental design and measured responses for modeling mixing times in the BIOSTAT CultiBag RM.
Run no. Rocking speed (rpm) Angle (°) Mixing time (s)
1 8 4 414.1
2 8 10 151.5
3 8 4 343.2
4 8 10 227.8
5 8 4 327.2
6 8 10 183.6
7 16 8 78.9
8 16 8 61.9
9 16 8 65
10 16 4 156.3
11 16 4 184.7
12 16 4 146.7
13 25 7 28.2
14 25 7 24.6
15 25 7 30
16 30 4 21.1
17 30 4 10.8
18 42 10 14.3
19 42 4 8.9
20 42 10 8.5
21 42 10 16.1

Vero cell culture in rocking motion type bioreactors
109
Table S2. Experimental design and measured responses for modeling microcarrier homogeneity in the
BIOSTAT CultiBag RM.
Run no. Rocking speed (rpm) Angle (°) MC Homogeneity
1 8 4 1
2 12 4 1
3 16 4 1
4 20 4 1
5 24 4 7
6 28 4 10
7 8 6 1
8 12 6 1
9 16 6 1
10 20 6 7
11 24 6 10
12 17 7 7
13 8 8 1
14 12 8 7
15 16 8 10
16 20 8 10
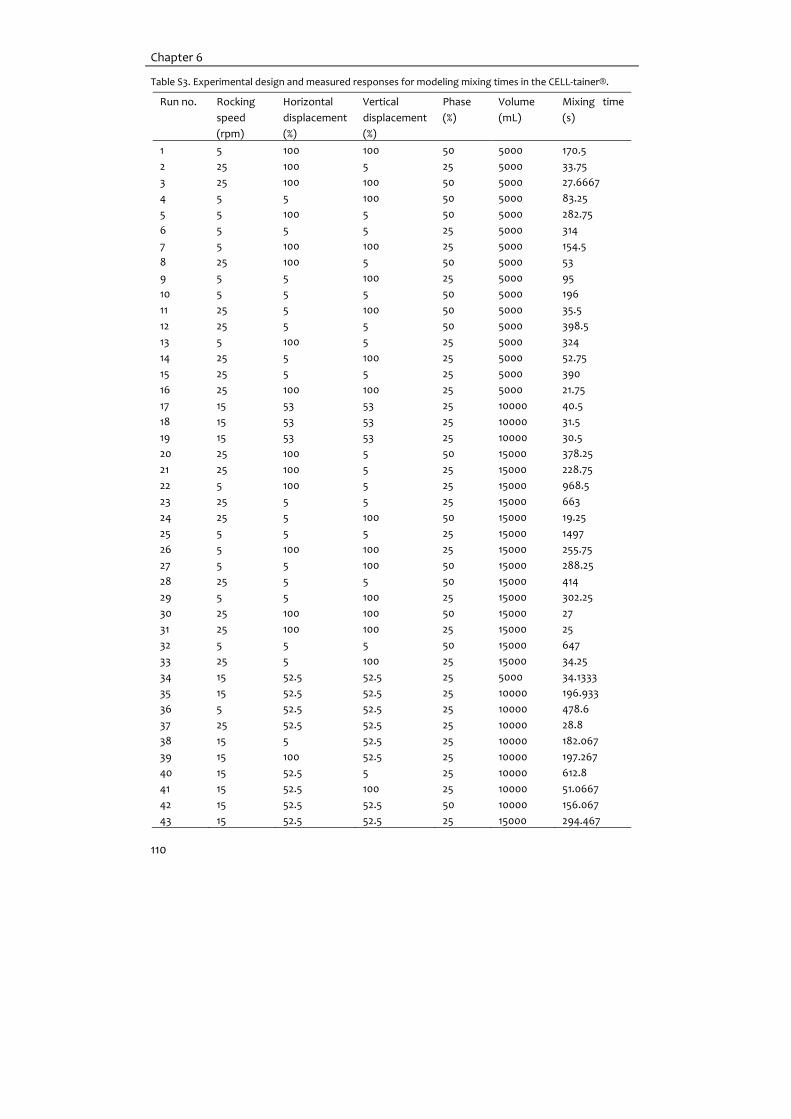
Chapter 6
110
Table S3. Experimental design and measured responses for modeling mixing times in the CELL‐tainer®.
Run no. Rocking
speed
(rpm)
Horizontal
displacement
(%)
Vertical
displacement
(%)
Phase
(%)
Volume
(mL)
Mixing time
(s)
1 5 100 100 50 5000 170.5
2 25 100 5 25 5000 33.75
3 25 100 100 50 5000 27.6667
4 5 5 100 50 5000 83.25
5 5 100 5 50 5000 282.75
6 5 5 5 25 5000 314
7 5 100 100 25 5000 154.5
8 25 100 5 50 5000 53
9 5 5 100 25 5000 95
10 5 5 5 50 5000 196
11 25 5 100 50 5000 35.5
12 25 5 5 50 5000 398.5
13 5 100 5 25 5000 324
14 25 5 100 25 5000 52.75
15 25 5 5 25 5000 390
16 25 100 100 25 5000 21.75
17 15 53 53 25 10000 40.5
18 15 53 53 25 10000 31.5
19 15 53 53 25 10000 30.5
20 25 100 5 50 15000 378.25
21 25 100 5 25 15000 228.75
22 5 100 5 25 15000 968.5
23 25 5 5 25 15000 663
24 25 5 100 50 15000 19.25
25 5 5 5 25 15000 1497
26 5 100 100 25 15000 255.75
27 5 5 100 50 15000 288.25
28 25 5 5 50 15000 414
29 5 5 100 25 15000 302.25
30 25 100 100 50 15000 27
31 25 100 100 25 15000 25
32 5 5 5 50 15000 647
33 25 5 100 25 15000 34.25
34 15 52.5 52.5 25 5000 34.1333
35 15 52.5 52.5 25 10000 196.933
36 5 52.5 52.5 25 10000 478.6
37 25 52.5 52.5 25 10000 28.8
38 15 5 52.5 25 10000 182.067
39 15 100 52.5 25 10000 197.267
40 15 52.5 5 25 10000 612.8
41 15 52.5 100 25 10000 51.0667
42 15 52.5 52.5 50 10000 156.067
43 15 52.5 52.5 25 15000 294.467

Vero cell culture in rocking motion type bioreactors
111
Table S4. Experimental design and measured responses for modeling microcarrier homogeneity in the CELL‐
tainer®.
Run no. Rocking
speed
(rpm)
Horizontal
displacement
(%)
Vertical
displacement
(%)
Phase
(%)
Volume
(mL)
MC homogeneity
(‐)
1 5 100 100 25 4500 7
2 5 5 100 50 4500 7
3 5 100 5 25 4500 3
4 25 5 100 25 4500 10
5 25 100 100 25 4500 10
6 5 5 5 50 4500 3
7 5 5 5 25 4500 3
8 25 5 5 25 4500 1
9 25 100 100 50 4500 10
10 5 100 5 50 4500 1
11 25 100 5 50 4500 10
12 25 100 5 25 4500 10
13 25 5 100 50 4500 10
14 5 100 100 50 4500 7
15 25 5 5 50 4500 1
16 5 5 100 25 4500 7
17 15 53 59 25 10000 10
18 15 53 59 25 10000 10
19 15 53 59 25 10000 10
20 25 100 5 25 15000 10
21 5 5 100 25 15000 7
22 25 5 100 50 15000 10
23 25 5 100 25 15000 10
24 25 5 5 50 15000 1
25 5 5 5 25 15000 1
26 25 100 100 50 15000 10
27 25 5 5 25 15000 1
28 5 5 100 50 15000 3
29 5 100 5 25 15000 1
30 5 5 5 50 15000 1
31 5 100 100 25 15000 7
32 5 100 100 50 15000 7
33 25 100 5 50 15000 10
34 5 100 5 50 15000 1
35 25 100 100 25 15000 10


Chapter 7
Next generation inactivated polio vaccine
manufacturing to support post polio‐eradication
biosafety goals
Published as:
Thomassen, Y.E., van ‘t Oever, A.G., van Oijen M.G.C.T., Wijffels, R.H., van der Pol, L.A.,
Bakker, W.A.M. (2013) Next generation inactivated polio vaccine manufacturing to support
post polio‐eradication biosafety goals.
PLoS ONE 8(12):e83374
dx.doi.org/10.1371/journal.pone.0083374

Chapter 7
114
Abstract Worldwide efforts to eradicate polio caused a tipping point in polio vaccination strategies.
A switch from the oral polio vaccine, which can cause circulating and virulent vaccine
derived polioviruses, to inactivated polio vaccines (IPV) is scheduled. Moreover, a
manufacturing process, using attenuated virus strains instead of wild‐type polioviruses, is
demanded to enhance worldwide production of IPV, especially in low‐ and middle income
countries. Therefore, development of an IPV from attenuated (Sabin) poliovirus strains
(sIPV) was pursued.
Starting from the current IPV production process based on wild type Salk strains,
adaptations, such as lower virus cultivation temperature, were implemented. sIPV was
produced at industrial scale followed by formulation of both plain and aluminium
adjuvanted sIPV. The final products met the quality criteria, were immunogenic in rats,
showed no toxicity in rabbits and could be released for testing in the clinic.
Concluding, sIPV was developed to manufacturing scale. The technology can be
transferred worldwide to support post polio‐eradication biosafety goals.

Next generation IPV manufacturing
115
Introduction Vaccines that provide protection against poliomyelitis have been available for decades
(Salk and Salk 1984). Yet large efforts are undertaken in WHO’s global polio eradication
initiative (GPEI) to obtain the next generation vaccines that are safe and available at low
costs (Aylward and Tangermann 2011). These vaccines are needed both for the ‘endgame’
in polio eradication and after eradication to prevent the risk of a global outbreak due to
accidental or deliberate re‐introduction of the virus. One of the anticipated next
generation vaccines is an inactivated polio vaccine (IPV) based on the attenuated Sabin
poliovirus strains resulting in a so‐called Sabin‐IPV (sIPV) (Bakker et al. 2011). The Sabin
polioviruses (PV) are currently used in live oral polio vaccines (OPV) (Sabin and Boulger
1973) and will provide additional bio‐safety, over the wild‐type viruses, during the
manufacturing process (WHO 2002a). Bio‐safety requirements are becoming more
stringent as new containment guidelines are drafted by the WHO’s Global Action Plan for
Wild Poliovirus Laboratory Containment III (GAPIII) (WHO 2009). Future production and
quality control of IPV using wild‐type strains will require at least biosafety level 3 facilities
(WHO 2004). This will not only increase manufacturing costs but will also limit the
possibility of IPV manufacturing in low‐ and middle income countries for instance due to
requirements on immunization coverage. The use of alternative strains like Sabin PV would
require less stringent biocontainment, is encouraged by the WHO (WHO 2002a) and allows
manufacturing in low‐ and middle income countries, which potentially lowers
manufacturing costs (Venczel et al. 2009). Moreover, the use of an IPV instead of OPV will
prevent the emergence of circulating vaccine‐derived PV (cVDPVs), which may potentially
re‐seed the world with PV and negate the GPEI accomplishments (Kew et al. 2005).
The development of the currently used IPV production process (for a process overview see
Figure 1) dates back to the 1960s when at the RIV in Bilthoven a process was developed
based on micro‐carrier technology and primary monkey kidney cells (van Wezel 1967; van
Wezel et al. 1979). This process was scaled‐up to 350‐L and later 750‐L bioreactors.
Additionally, the Vero cell line was introduced to replace the then used tertiary monkey
kidney cells. To support manufacturing and increase the knowledge on IPV manufacturing,
efforts like multivariate data analysis and the development of scale‐down models, i.e. lab‐
scale equivalents of the manufacturing‐scale processes, have been undertaken
(Thomassen et al. 2013b; Thomassen et al. 2010). The availability of scale‐down models,
unique in the vaccine world, allows rapid assessment of process changes.
Based on our vast history in IPV development and production (van Wezel et al. 1979), our
previous experience with sIPV (Kersten et al. 1999) and technology transfer (Kreeftenberg
and Hamidi 2007; Kreeftenberg et al. 2006; van Noort 1992) a project for the development
and technology transfer of sIPV manufacturing under supervision of the WHO was
initiated. Initially a proof‐of‐principle study was performed. In this study, sIPV was

Chapter 7
116
prepared from OPV as virus source. The three PV sub‐types, obtained separately (Bio
Farma, Indonesia), were concentrated, purified and inactivated and shown to yield a sIPV
that was immunogenic in an animal model (Bakker et al. 2011). In principle, OPV
manufacturers could, by acquiring correct downstream processing (DSP) equipment,
produce sIPV. However, larger quantities of virus harvest (100‐800 fold of current
production quantities) are needed and upstream processing (USP) should be scaled‐up
(Duchene et al. 1990).
Figure 1. Process overview for preparation of trivalent IPV. Monovalent bulks are prepared for each PV
(type 1, 2 and 3) separately. During monovalent bulk preparation Vero cells are expanded using two pre‐culture steps and a cell culture followed by virus culture. Virus is purified using normal flow filtration for
clarification, tangential flow filtration for concentration and two chromatography units, size exclusion and
ion exchange chromatography. Purified virus is subsequently inactivated using formaldehyde. Subsequently these are mixed to obtain trivalent bulk prior to formulation and filling.
Monovalent Bulks
Trivalent Bulk
Final Lot
Pre-culturesCell cultureVirus culture
Clarification
Concentration
SEC
IEX
Inactivation
Pre-culturesCell cultureVirus culture
Clarification
Concentration
SEC
IEX
Inactivation
Al(OH)3+/-
Mixing
Filling
Pre-culturesCell cultureVirus culture
Clarification
Concentration
SEC
IEX
Inactivation
FormulationFinal BulkDilution buffer
Polio virus type 1 Polio virus type 2 Polio virus type 3

Next generation IPV manufacturing
117
Here we report the results of limited (to be able to quickly show proof of concept) process
development for sIPV based on the established IPV production process, the subsequent
manufacturing of clinical lots, their stability and pre‐clinical studies. This work resulted in a
vaccine that has recently been tested in the clinic (phase I/IIa) (Verdijk 2012; Verdijk et al.
2013).
Methods
Ethics statements regarding animal studies
The abnormal toxicity study in suckling mice and guinea pigs and immunogenicity tests in
rats used in this study were agreed upon by the Committee on Animal Experimentation of
the Netherlands Vaccine Institute (Bilthoven, the Netherlands) (Study Permit numbers
AAP 201000262, 201000302, 201000303, 2010000304, 2010000305, 2010000306,
2010000307, 201000310, 201100030, 201100054, 201100056, 201100101, 201100151,
201100170, 201100195, 201100214, 201100289, 201100345, 201200137, 201200154, 201200227
and 201200262). Animal handling in this study was carried out in accordance with relevant
Dutch national legislation, including the 1997 Dutch Act on Animal Experimentation.
The protocol for the toxicity study in rabbits was reviewed and approved by the Animal
Welfare Officer and Ethical Committee of WIL Research Europe B.V. (former name: NOTOX
B.V.) as required by the Dutch Act on Animal Experimentation (Study Permit Numbers:
DEC 08‐48 and 10‐18). The OECD guidance document on humane endpoints
(ENV/JM/MONO/ 2000/7) is applicable for all animal studies carried out at WIL Research
Europe B.V.. No distress or discomfort was noted during this study.
Lab scale experiments
Upstream processing
Vero cells obtained from WHO (10‐87) originally derived from ATCC (CCL‐81) were used as
host for PV production. Sabin PV type 1 (LSc 2ab KP2), Sabin PV type 2 (P712 Ch2ab‐KP2) and
Sabin PV type 3 (Lot 457‐III‐Pfizer) were used.
Studies on virus culture conditions were carried out in 5‐L glass bioreactors (Sartorius
Stedim Biotech). Cell cultures were done in EMEM supplemented with bovine serum (BS)
and 3 g L‐1 micro‐carriers (Cytodex 1; GE Healthcare) with the following settings: T of 37°C,
pH of 7.2 and DO (dissolved oxygen) of 50% by headspace aeration. Glucose was added
daily when the concentration was below 5 mM. Prior to virus culture the media was
exchanged to M199. Virus cultures conditions were: T of 32.5 or 33.5°C, pH of 7.4, DO of 25%
by headspace aeration.

Chapter 7
118
Downstream processing
Virus was harvested, clarified, concentrated, purified, first on size using size exclusion
chromatography (SEC) and second by ion exchange chromatography (IEX), and finally
inactivated as described previously (Thomassen et al. 2013b).
Analytics
Cell counts were determined using a Nucleocounter (Chemometec). Glucose
concentration was determined using a Bioprofile 100 plus (Nova Biomedical, MA).
Cytopathic effects (CPE) were monitored microscopically. Virus was quantified by titer
measurements (CCID50) (Thomassen et al. 2012) and by a modified D‐antigen ELISA (ten
Have et al. 2012) for in‐process samples.
Clinical lots manufacturing
Cell and virus culture
Vero cells from a manufacturers working cell bank were used. Master and working
seedlots were prepared from Sabin type 1 LSc 2ab KP2 (WHO/Beringwerke SO+1, 1976),
type 2 P712 Ch2ab‐KP2 (WHO/Behringwerke SO+1, 1976) and type 3 (Pfizer RSO1, SO+5, lot
457‐III, 1963; supplied by Institute Mérieux to RIVM in 1991) (Bakker et al. 2012). Working
seedlots were additionally tested for neurovirulence in monkeys (Bio Farma, Indonesia)
(WHO 2002b) and analyzed with MAPREC (mutant analysis by PCR and restriction enzyme
cleavage; NIBSC/HPA, UK) (WHO 2012a) and RCT40 (replicating properties 36°C‐ 40°C;
AFSSAPS, France) (WHO 2002b) to assess genetic stability with respect to biosafety (Table
1).
Table 1. Biosafety and viral safety testing of Sabin PV master (MS) and working (WS) seedlots.
Seedlot Virus titer
(Log10 CCID50 mL‐1)
Monkey
Neurovirulence1
MAPREC2 RCT401 Extraneous
agents/Viral
safety3
MS PV type 1 8.85 Not determined Conform Conform Conform
MS PV type 2 7.52 Not determined Conform Conform Conform
MS PV type 3 8.23 Not determined Conform Conform Conform
WS PV type 1 8.90 Conform Conform Conform Conform
WS PV type 2 7.55 Conform Conform Conform Conform
WS PV type 3 8.45 Conform Conform Conform Conform 1 Reproductive Capacity at 40°C Temperature (RCT40) and Monkey Neurovirulence: Tests and requirements
according to WHO recommendations for OPV (WHO 2002b). 2 Mutant Analysis by PCR and Restriction Enzyme Cleavage (MAPREC): Test and requirements according to new WHO recommendations for OPV
(WHO 2012a). 3 Test and requirements according to the European Pharmacopoeia (Ph Eur 7.0:0214 ; Ph Eur
7.0:20616).

Next generation IPV manufacturing
119
Cell and virus culture was carried out in two 350‐L (working volume) bioreactors. In short,
thawed Vero cells were used to directly inoculate a 15‐L fed‐batch pre‐culture (EMEM
supplemented with BS and Cytodex 1 microcarriers) (van Wezel 1985). After trypsinization
(van Wezel 1985); a 2nd pre‐culture using the recirculation culture method (van Hemert et
al. 1969) was done to have sufficient cell to inoculate two 350‐L bioreactors at 0.1 × 10⁶
cells mL‐1. After medium exchange (van Wezel 1973), virus culture was started (M199;
Multiplicity of infection (MOI)=0.01; T=32.5°C).
Purification
Virus from the two 350‐L (working volume) bioreactors was harvested via a sieve (mesh 75
µm) to obtain a virus harvest free of micro‐carriers (Thomassen et al. 2013b). Clarification
was done using normal flow filtration with a Millipore POD‐holder containing C0HC depth
filters followed by an Express SHC 0.45/0.22 µm combination filter (Millipore) (Bakker et al.
2011; Thomassen et al. 2013b) . Concentration was done by tangential flow filtration using
100 kDa filters (Thomassen et al. 2013b). Purification was done by size exclusion
chromatography (Sepharose CL‐6B (GE Healthcare) (van Wezel et al. 1979; van Wezel et al.
1978); elution buffer 20mM phosphate buffer pH 7.0) and ion exchange chromatography
(DEAE‐Sephadex A50 (GE Healthcare) (van Wezel 1972; van Wezel et al. 1979); elution
buffer 20mM phosphate buffer pH7.0).
Inactivation
Purified virus was stabilized with concentrated M199 containing glycine (final conc. 5g L‐1).
Inactivation was done following the standard method: 0.025% formaldehyde incubation for
13 days at 37°C. An intermediate filtration (0.22 µm) was performed at day 6‐8 (WHO
2002a). The resulting monovalent bulk was stored at 2‐8°C.
Preparation of trivalent vaccine
Monovalent bulks of PV type 1, 2 and 3 were mixed to a ratio of 60:96:192 D‐antigen prior
to sterile filtration. The sIPV final bulk was subsequently prepared by addition (via 0.22 µm
filter) of the mixed trivalent bulk and dilution buffer containing phosphate,
phenoxyethanol and formaldehyde. Aluminium hydroxide adjuvanted sIPV final bulk was
prepared as described above with the inclusion of the addition of sterile Alhydrogel
(Brenntag) (directly) to the final bulk. Final bulks were mixed for 10 minutes prior to
setting the pH. The final lots were prepared by filling the final bulk in aliquots of 0.6‐0.7g in
3 mL sterile siliconized vials using a Bausch & Ströbel ksf 1027 machine.
Analytics
During the process, sampling was done, as required for release of sIPV final lots. In Table 2
a list of the most relevant assays for release is given. A qualified QC department carried
out these assays.

Chapter 7
120
Cell counts were performed using a hemocytometer. Cythopathic effects (CPE) were
monitored microscopically. Virus was quantified by titer measurements (CCID50) and D‐
antigen ELISA (Kersten et al. 1999) for release. SDS‐PAGE was done using precast 4‐20%
gradient gel (Pierce) with Tris‐HEPES buffer (Pierce). Vero host cell protein concentrations
were determined using a Vero Cell HCP ELISA kit F500 according to the manufacturer’s
instructions (Cygnus Technologies, NC). MAPREC and RCT40 were performed as described
in WHO guidelines (WHO 2012a; WHO 2002b).
Preclinical studies ‐ Rat immunogenicity
The rat immunogenicity was determined essentially as described previously (Ph Eur
7.0:0214 ; van Steenis et al. 1981). In short, TOX rats (weighing 175‐250 g) that were
screened for the absence of PV antibodies were injected intramuscularly with 0.5 mL of
prepared vaccine dilutions (group size 10 per dilution). Blood samples were taken 21 days
after injection. Collected sera (stored at ‐20°C until use) were analyzed for neutralizing
antibodies. Serial dilutions (with M199) of heat inactivated sera (30 min 56°C) were
prepared in a 96‐wells plate and incubated with 50 µl (2 × 10³ CCID50 mL‐1) PV type 1
Mahoney, PV type 2 MEF‐1, or PV type 3 Saukett for 3h at 35‐37°C in a CO2 incubator and
subsequently stored overnight at 2‐8°C. After addition of Vero cells (50 µL at 2 × 10⁵ cells
mL‐1) the 96‐wells plates were incubated for 7 days at 35‐37°C. Supernatants were
discarded and cells were stained with a crystal violet solution containing 5% formaldehyde.
Presence of full monolayers of Vero cells indicated a complete neutralization of the virus.
The neutralization antibody score represents the highest dilution (log2; with a test
maximum of 12) where complete neutralization was observed. For comparison of sIPV
with conventional IPV, the international standard PU91‐01 was diluted towards the
conventional IPV dose (40/8/32 DU shd‐1).
Preclinical studies ‐ Toxicity study in rabbits
A repeated dose and local tolerance toxicity study followed by a two week recovery
period was carried out in rabbits (NOTOX, the Netherlands) according to EMA guidelines
((EMEA/CPMP) 1998). In short, New Zealand white rabbits (group size of 16, equally
distributed among sexes) were treated by intramuscular injection with 0.5 mL vaccine or
placebo (vaccine without D‐antigen) at day 1, 15, 29, 43 and 57). Animals were necropsied
at day 60 (n=10) or day 71 (n=6). The following observations and examinations were
evaluated: clinical signs (daily), skin irritation (24 and 48 hours after each administration),
body weight (weekly), food consumption (twice weekly), ophthalmoscopic examination
(during pretest, end of treatment and end of recovery), rectal body temperature (during
pretest, prior to each dosing and approximately 2 hours after dosing), clinical pathology
(Pretest, Days 4, 57, 60 and 71), macroscopy at termination and organ weights and
histopathology on a selection of tissues.

Next generation IPV manufacturing
121
Statistical analysis
Two sided Student t‐tests were performed with α=0.05. Numbers are given as means with
standard deviations.
To determine the regression line slopes, no weighted regression was used. This was
chosen based on the use of medians when concerning animal tests in contrast to the use
of the means. In addition, the observed standard deviation from the median did not
increase with increasing values. The significance (95% confidence) of the slopes was tested
using an extra sum of squares F‐test with the null hypothesis being a horizontal line (i.e.
slope=0) (Graphad Prism 6 for Windows).
Results
Drafting product and process specifications
The specifications (Table 2) for the release and control of sIPV and aluminium hydroxide
adjuvanted sIPV were drafted based on WHO (WHO 2002a) and EP monograph (Ph Eur
7.0:0214) for IPV manufacturing. Some product requirements, like formaldehyde content
and pH, were based on the available IPV experience. Requirements related to the
adjuvation with aluminium hydroxide were set after initial research (Westdijk et al. 2013).
The WHO OPV guidelines (WHO 2002b) were taken into account to assess the Sabin PV
genetic stability with respect to biosafety, i.e. temperature sensitivity and revertants.
Process development prior to manufacturing of clinical lots
In view of the relatively short timelines in the polio eradication program it was chosen to
prepare a sIPV with limited process development time prior to production of clinical lots.
Process development therefore focused on Sabin strain specific adaptations like MOI and
virus cultivation temperature and chromatography (discussed below). In addition, a
disposable clarification unit was introduced to replace the Celite cake for depth‐filtration.
On all other aspects the production process was similar to conventional IPV
manufacturing.
Selection of MOI and virus cultivation temperature
In OPV manufacturing, the virus cultivation temperature for Sabin PV is lower (at a
maximum of 35°C (WHO 2002b)) than the temperature used for wild‐type PV in
conventional IPV manufacturing (36‐37°C) (Bakker et al. 2010; Duchene et al. 1990). This
lower temperature is required to ensure the temperature sensitivity of the Sabin PV and
minimize revertants to ensure a safe OPV. Although here an inactivated product has been
developed, manufacturing itself should be biosafe and one of the prerequisites was to
ensure the safety of the prepared virus harvest with respect to revertants of Sabin PV.

Table 2. Release requirements1) of plain and adjuvanted sIPV
Cell culture
Identity Vero cells
Mycoplasma Absent
Extraneous viruses Absent
Virus harvest
Sterility Absence of growth (Tryptic Soy Broth & Thioglycollate broth)
Mycoplasma Absent
Extraneous viruses Absent
Purified virus
Purity (ratio total protein and D‐antigen) ≤0.1 µg DU‐1
Sterility As above
Identity PV type 1, 2 OR 3
Residual host cell proteins Consistent clearance
Monovalent Bulk
Inactivation kinetics PV titer below detection limit after 120h
Formaldehyde >2 mM
Sterility As above
PV identity Contains PV type 1, 2 OR 3
Inactivation Full absence of active PV after 10 and 13 days
D‐antigen content Information for calculation
Trivalent bulk
Inactivation Full absence of active PV in 1,500 calculated human doses
Sterility As above
D‐antigen content Information for calculation
Final bulk Plain Adjuvanted
pH 6.8‐7.4 6.8‐7.4
Phenoxyethanol 31‐42 mM 31‐42 mM
Formaldehyde 2) 0.7‐2.4 mM 0.7‐1.3 mM
Sterility As above As above
D‐antigen content ≥75% nominal value ≥75% nominal value
Final lot Plain Adjuvanted
Appearance Bright red‐orange fluid Turbid red‐orange fluid
PV identity Contains type PV 1, 2 and 3 Contains type PV 1, 2 and 3
D‐antigen content ≥75% nominal value ≥75% nominal value
Residual host cell DNA 3) ≤100 pg shd‐1 ≤100 pg shd‐1
Bovin Serum Albumin 3) ≤50 ng shd‐1 ≤50 ng shd‐1
Total protein ≤20 µg mL‐1 ≤20 µg mL‐1
Endotoxin ≤10 IU mL‐1 ≤10 IU mL‐1
Extractable volume ≥0.5 mL ≥0.5 mL
pH 6.8‐7.4 6.8‐7.4
Sterility As above As above
Free D‐antigen Not applicable < 1%
Aluminium Not applicable 0.26‐0.36 mg mL‐1
Abnormal toxicity (in mice and guinea pigs) No illness No illness 1 Most important release tests drafted for the production of the phase I clinical lots are given. It should be
noted that the release criteria could change due to further product development. 2 Formaldehyde
requirement is dependent on the amount of monovalent bulk used to prepare the final bulk. 3 Test is performed at an earlier stage in view of the lower detection limit.

Next generation IPV manufacturing
123
The effects of virus culture temperature and multiplicity of infection (MOI) on the virus
culture yields and culture time were assessed using PV type 2. No differences in virus yields
were observed when the MOI was decreased from 0.1 to 0.01. Decreasing the temperature
from 33.5°C to 32.5°C, had a negative effect on virus yields. Virus titers were 7.7 ± 0.1 (n=3)
and 7.2 ± 0.1 (n=3) Log10 CCID50 mL‐1 for cultures at respectively 33.5°C and 32.5°C. D‐antigen
(a measure for immunogenic virus) concentrations were 25 ± 3 (at 33.5°C) and 11 ± 5 DU mL‐
1 (at 32.5°C). Under all tested conditions virus culture was complete within 4 days, i.e.
cytopathic effect (CPE) >90% and both virus titers and D‐antigen (a measure for
immunogenic virus) concentrations remained constant. Despite the lower yields at 32.5°C,
this cultivation temperature was selected for preparing the virus seeds and clinical trial
material. This choice was made to minimize the risk of PV revertants. Since no difference
was observed when using a lower MOI, an MOI of 0.01 was used as it is preferred since
smaller amounts of virus working seedlots will be needed.
Chromatography resin selection and buffer strength
Initial process development was done to confirm the use of resins and procedures
available for wild‐type PV. The present SEC resin and procedure were applicable for use
with Sabin PV (data not shown). For IEX a choice between two validated resins needed to
be made. Both DEAE Sephadex A‐50 (van Wezel 1972) and DEAE Sepharose Fast Flow
(Thomassen et al. 2013b) have been used for purification of PV. In both cases impurities
are captured while Salk PV flows through. Initial studies using Sabin PV Type 1 showed
some non‐specific binding of the PV to DEAE Sepharose Fast Flow; this was confirmed for
Sabin PV Type 2. The alternative resin DEAE Sephadex A50 allowed efficient separation of
Sabin PV type 1, 2 and 3.
During the proof of principle study (Bakker et al. 2012) in which OPV bulks were obtained
to generate IPV, a precipitate was noticed during inactivation. Analysis showed that this
precipitate was a phosphate based precipitate without product. The main source of the
phosphate was traced back to the purification process where a 40mM phosphate buffer
was used during chromatography (both SEC and IEX). Application of a weaker phosphate
buffer (20mM) and the impact on product elution and inactivation was assessed. Product
elution profiles in SEC and IEX using a 20mM phosphate buffer were comparable with
those obtained after eluting with a 40mM phosphate buffer. Inactivation of virus eluted
with 20mM phosphate was comparable while precipitates were absent.
Manufacturing of clinical lots
Preparation of virus seed
Sabin PV strains closest to the Sabin original strains (PV T1: SO+1 Behringwerke 1976; PV T2:
SO+1 Behringwerke 1976; and PV T3: RSO+1 Pfizer 1963) were used to produce new virus

Chapter 7
124
master seedlots at 10‐L scale. The virus working seedlots were produced at 350‐L scale
(Bakker et al. 2011). These seeds were tested for neurovirulence using the monkey
neurovirulence test (WHO 2002b). However, due to limited global test capacity and to
minimize costs it was chosen to only test the working seedlots. It was argued that the
working seeds represent, on a worst case base, the quality of the master seed with
respect to neurovirulence. Next to passing the neurovirulence test, the master and
working seedlots also passed the tests for extraneous agents, RCT40 (reproductive
capacity at 40°C temperature) and MAPREC (Mutant Analysis by PCR and Restriction
Enzyme Cleavage ) (Table 1).
Upstream processing
The preparation of sIPV was done in a physically separated production area in the
established cGMP facilities for conventional IPV manufacturing. For each virus type two
monovalent bulks were prepared. Vero cell culture was carried out in twin 350‐L
bioreactors (Thomassen et al. 2010). In Figure 2A, the average growth curve of the 12
cultures (6 bulks in twin bioreactors) at 350‐L scale is given. Cell culture was started at an
inoculation density of 0.1 × 10⁶ cells mL‐1. Cells grew adherent to micro‐carriers (average
growth rate 0.025 h‐1) to reach 1.1 × 10⁶ cells mL‐1 after 4 days when the micro‐carriers were
covered by a confluent layer of cells. At this point, the bovine serum containing medium
was exchanged with serum free virus culture media. Subsequently, cells were infected
with Sabin PV. Virus culture proceeded comparably and was independent of the virus type
used for infection. Cell lysis was complete after 4‐5 days as was determined based on the
CPE observed microscopically (Figure 2B). Virus yields were based on virus titers (Figure
2C) and D‐antigen (Figure 2D). While comparable virus titers were observed for the
production of Sabin PV type 1 and 3, the yields for Sabin PV type 2 were significantly lower
(2‐tailed t‐test; α=0.05 p=0.0043). D‐antigen yields are not comparable between virus
types as they are type (and antibody) specific (Westdijk et al. 2011). From Figures 2C&D it
was concluded that virus cultures were reproducible. The virus harvests were negative for
revertants of Sabin PV as analyzed by RCT40 and MAPREC.
Downstream processing
Virus from the twin bioreactors was harvested and pooled prior to purification. Harvested
virus was first clarified using normal flow filtration (NFF), which resulted in a decrease in
fluid turbidity from 54 ± 6 NTU (Nephelometric Turbidity Unit) to 0.4 ± 0.4 NTU (n=5;
determined mid‐processing). The clarified virus was subsequently concentrated from
approx. 700L to 1L using tangential flow filtration (TFF). Product recoveries, based on D‐
antigen units (DU), during the filtration steps were 90% ± 3% and 68% ± 11% for respectively
NFF and TFF (Table 3).

Next generation IPV manufacturing
125
The concentrated product was purified using 2‐step chromatography starting with SEC. In
Figure 3A a typical SEC elution pattern for Sabin PV is given. The 1st peak contains mostly
large cell components. PV is found in the 2nd peak as is illustrated by SDS‐PAGE (Figure 3B)
where the presence of the viral proteins is more pronounced when purification with SEC
was done. An average D‐antigen recovery of 68% ± 11% was found for SEC (Table 3).
Figure 2. Cell and virus culture. Panel A shows the average Vero cell growth curve (n=12; error bars represent SD) in 350‐L bioreactors. Photographs are light microscopy images (size bar 200 µm). Panel B
shows the average (of the three subtypes) Vero cell death during virus culture determined microscopically
(n=12; error bars represent SD). Photographs show corresponding images. Panel C shows average virus titers for Sabin PV type 1, 2 and 3 (n=4; error bars represent SD). Panel D shows average D‐antigen
concentrations after virus culture for Sabin PV type 1, 2 and 3 (n=4; error bars represent SD).
0.0
0.2
0.4
0.6
0.8
1.0
1.2
1.4
0 20 40 60 80 100
Via
ble
ce
llc
on
ce
ntr
atio
n(1
06
ce
lls
mL
-1)
Culture time (h)
2h 48h 96h
A
0
20
40
60
80
100
120
0 24 48 72 96 120
Cy
top
ath
ice
ffe
ct(%
)
Virus culture time (h)
96h72h48h
B
0
1
2
3
4
5
6
7
8
9
10
Sabin PV 1 Sabin PV 2 Sabin PV 3
Vir
us
tite
r(1
0L
OG
CC
ID5
0m
L-1
)
C
0
20
40
60
80
100
120
140
Sabin PV 1 Sabin PV 2 Sabin PV 3
D-a
nti
ge
nc
on
c.(
DU
mL
-1)
D

Chapter 7
126
Table 3. Product recovery during processing of two batches for each serotype. Losses due to sampling were
not considered for recovery calculations of individual unit operations. The overall product recovery includes
losses due to sampling for in‐process and release tests as well as sampling for research purposes.
Virus subtype Harvest Clarification Concentration SEC2 IEX3 Inactivation Overall1
Sabin PV type 1 100% 86% 82% 62% 90% 84% 38%
100% 89% 73% 67% 107% 85% 41%
Sabin PV type 2 100% 92% 77% 69% 20% 50% <15%
100% 96% 54% 51% 35% 64% <15%
Sabin PV type 3 100% 91% 75% 75% 87% 36% 18%
100% 88% 70% 83% 114% 72% 24% 1 The overall DSP yield was calculated by dividing the amount of D‐antigen units of the monovalent bulk by
the amount of D‐antigen units from the harvest.2 Size Exclusion Chromatography 3 Ion Exchange
Chromatography
Subsequently the negatively charged molecules, like nucleic acids and proteins, were
removed using IEX chromatography. PV should not interact with the matrix as was the
case for Sabin PV type 1 and 3, where a plug flow was observed (Figure 3C). However,
Sabin PV type 2 showed some interaction with the matrix as is apparent from the
chromatogram (Figure 3C). The presence of the plug flow type chromatogram for Sabin PV
type 1 and 3 allowed collection of the PV after IEX without major losses. Sabin PV type 1
and 3 were collected with 99.5% D‐antigen recovery (Table 3). Relatively high losses (72%)
were observed during IEX for Sabin PV type 2 (Table 3). The efficiency of the purification is
illustrated by the SDS‐PAGE in Figure 3B. After IEX the viral proteins are clearly purified
from the other protein present after SEC. Removal of impurities was also shown for Vero
host cell proteins and host cell DNA (Figure 3D). After IEX host cell protein concentrations
were below 0.3 µg mL‐1, corresponding to an over 1,000 times removal. Host cell DNA
concentrations were below the detection limit of 78.13 pg mL‐1 which is below the
maximum level allowed in a single human dose (shd) (Table 2).
After IEX the Sabin PV was inactivated during a 13‐day incubation period with
formaldehyde. PV was inactivated rapidly, i.e. within 4 days, as shown in Figure 3E. After 6
to 8 days an intermediate filtration step was carried out to remove possible aggregates
and ensure full inactivation. After inactivation a large variation in D‐antigen recovery was
observed, especially for Sabin PV type 3. Overall recoveries ranged from acceptable (in
conventional IPV manufacturing on average approximately 40% for all three sub‐types
(Thomassen et al. 2013b; van Wezel et al. 1984)), for Sabin PV type 1 (at 40%) to very low,
with respect to future cost competitive processing, for PV type 2 (Table 3). The obtained
monovalent bulks met all release criteria and were stored at 4°C prior to mixing for
formulation.

Next generation IPV manufacturing
127
Figure 3. Purification of Sabin PV. Panel A depicts a SEC chromatogram of Sabin PV type 1. The 1st peak
contained mostly large cell components; the 2nd peak contained the majority of PV, following peaks consist
of smaller components. Panel B shows a SDS‐PAGE (4‐20% gel); lanes represent (from left to right) the marker, the concentrated product, followed by the 1st and 2nd fraction of SEC and finally the IEX purified PV.
Panel C shows chromatograms of Sabin PV type 1 (left) and Sabin PV type 2 (right) IEX purification. Panel D
shows host cell protein (open) and DNA (solid) impurities. Panel E depicts the inactivation of PV, the gray area indicates the lower detection limit. In chromatograms A and C, the red and blue lines represent
absorbance at respectively 254nm and 280nm. Gray dotted lines indicate peak fractioning.
0
200
400
600
800
1000
1200
0 50 100 150 200
Ab
so
rba
nce
(mA
U)
Time (min)
0
2
4
6
8
10
12
0
100
200
300
400
500
600
Concentrate SEC IEX
Ho
st
Ce
llD
NA
(ng
mL
-1)
Ho
st
Ce
llP
rote
ins
(µg
mL
-1)
0
50
100
150
200
250
0 50 100 150 200
Ab
so
rba
nce
(mA
U)
Time (min)
0
2
4
6
8
10
0 2 4 6 8 10 12
Vir
us
tite
r(1
0L
OG
CC
ID50
mL
-1)
Inactivation time (days)
0
100
200
300
400
500
600
700
800
900
0 500 1000 1500 2000 2500
Ab
so
rba
nce
(mA
U)
Time (min)
D E
A B
C
M conc.SEC1st
SEC2nd IEX
200.0
116.397.466.2
45.0
31.0
21.514.4
6.5
VP1VP2VP3

Chapter 7
128
Formulation
Monovalent bulks were mixed to a trivalent bulk (Sabin PV type 1‐2‐3) in a ratio of 60‐96‐
192 DU mL‐1 prior to formulation to a final bulk. Different final bulks were prepared. Plain
sIPV was prepared in different final concentrations of D‐antigen to be able to test low (5‐8‐
16 DU shd‐1) middle (10‐16‐32 DU shd‐1) and high (20‐32‐64 DU shd‐1) dosages in (non‐)clinical
studies. Aluminium (Al(OH)3) adjuvanted vaccine was mixed at 2‐fold lower D‐antigen
values being: low (2.5‐4‐8 DU shd‐1), middle (5‐8‐16 DU shd‐1) and high (10‐16‐32 DU shd‐1).
Vaccine was filled in vials as 0.5 mL per single human dose.
Pre‐clinical studies
The immunogenicities in terms of the capacity to induce virus neutralizing antibody titers
(VNT) against the wild‐type PVs (PV Type 1 Mahoney, PV Type 2 MEF‐1 and PV Type 3
Saukett) of the six differently formulated vaccines were determined in rats (Ph Eur
7.0:0214 ; van Steenis et al. 1981). High VNT against wild‐type viruses were observed for all
prepared formulations (i.e. 0.5 mL of high, middle and low DU). The maximum VNT for PV
type 1 was lower than for PV type 2 and 3 (Figures 4A‐C). For all types, the VNT increased
with the dose and the addition of aluminium as adjuvant had a positive effect. For PV type
2 this effect was larger than for PV type 1 and PV type 3. Compared to conventional IPV,
immunization of rats with sIPV resulted in comparable wild‐type VNTs for PV type 1 and 3.
Lower VNTs were found for PV type 2 when immunized with sIPV, however the levels of
antibodies raised are very high (>8 log2) (Figures 4D‐F). These data suggest that sIPV may
be able to raise sufficient protective antibodies against all PV sub‐types in humans, where
the threshold for protection is 3 log2 (Vidor and Plotkin 2013) and thereby would be non‐
inferior to conventional IPV.
Stability of the clinical lots over a period of 24 months was assessed based on
immunogenicity in rats, D‐antigen concentration, amount of free D‐antigen (in case of
adjuvanted vaccine) and more general parameters like sterility, appearance and pH.
Vaccine stability with respect to immunogenicity in rats is illustrated in Figure 5A‐D. Based
on the regression line slopes (derived from Figure 5A) and their 95% confidence intervals
(Figure 5B) it was concluded that all formulated clinical lots were stable with respect to
immunogenicity in rats (null hypothesis slope=0; α=0.05; result p>0.05).
In a similar way, the stability of the D‐antigen content in the formulated clinical lots was
reviewed. Slopes and their 95% confidence intervals of the regression lines (as illustrated in
Figure 5C) were calculated. The measurement of D‐antigen in aluminium adjuvanted
formulations was difficult as the D‐antigen needed to be desorbed from the aluminium
prior to performing the D‐antigen ELISA. This hurdle is illustrated by the larger confidence
intervals found for the regression lines for D‐antigen stability for the adjuvanted vaccines
(Figure 5D).

Next generation IPV manufacturing
129
Figure 4. Rat immunogenicity (VNT against wild‐type viruses). Panel A, B and C: VNT (log2 titer) to
immunization with plain sIPV (blue) and adjuvanted sIPV (red) for PV type 1, 2 and 3 respectively; Panel D, E
and F: VNT of plain sIPV 20/32/64 (light blue), 10/16/32 (red), 5/8/16 (green) and plain IPV 40/8/32 (dark blue) for PV type 1, 2 and 3 respectively. Error bars in panel A‐F depict standard deviation of the median (n=10
rats).
As a result no conclusions with respect to D‐antigen stability could be drawn for the
adjuvanted vaccine. Stability regarding the D‐antigen content of the non‐adjuvanted
(plain) vaccine was good (null hypothesis slope =0; α=0.05; result p>0.05).
0
2
4
6
8
10
12
0 10 20 30 40 50 60 70
PV
type
3N
eu
tral
izin
gA
bsc
ore
s
D-antigen (DU/dose)
C
0
2
4
6
8
10
12
0 5 10 15 20 25
PV
typ
e1
Ne
utra
lizin
gA
bsc
ores
D-antigen (DU/dose)
0
2
4
6
8
10
12
0 5 10 15 20 25 30 35
PV
typ
e2
Ne
utra
lizin
gA
bsc
ores
D-antigen (DU/dose)
A B
0
2
4
6
8
10
12
0 100 200 300 400 500 600P
Vty
pe1
Ne
utr
aliz
ing
Ab
sco
res
Vaccine dose(µl)
D
0
2
4
6
8
10
12
0 100 200 300 400 500 600
PV
typ
e2
Ne
utra
lizin
gA
bsc
ores
Vaccine dose(µl)
0
2
4
6
8
10
12
0 100 200 300 400 500 600
PV
type
3N
eu
tral
izin
gA
bsc
ore
s
Vaccine dose(µl)
E F

Chapter 7
130
A repeated dose and local tolerance toxicity study in rabbits was conducted. Highest dose
plain and adjuvanted sIPV were compared to a placebo and conventional licensed IPV.
Some enlargement in local lymph nodes was found in all vaccine treated groups. Generally,
minimal to mild inflammation was observed microscopically at the injection sites of all
groups and could be attributed to the injection trauma. More intense inflammation was
shown in the adjuvanted sIPV group, which was, in contrast to the other groups, not
diminished after the two week recovery period. This was solely attributed to the apparent
persistence of the adjuvant. A longer recovery period should have been chosen. The
changes at the injection sites as well as the changes noted in the local lymph nodes are
common findings in intramuscular vaccine studies meaning that the vaccines are safe to
use in clinical trials.
Figure 5. Stability of sIPV. Panel A: PV type 1 VNT of plain sIPV 20/32/64 (blue), 10/16/32 (red), 5/8/16 (green)
in time, error bars depict standard deviation of the median (n=10 rats); Panel B: slopes of linear regression
lines determined for stability based on rat immunogenicity as illustrated in panel A, error bars depict 95% confidence interval; Panel C: Stability of PV type 1 D‐antigen of sIPV 20/32/64; Panel D: slopes of linear
regression lines determined for stability based on D‐antigen as illustrated in panel C, error bars depict 95%
confidence interval.
-1.7
-1.2
-0.7
-0.2
0.3
Slo
peo
f lin
ear
regr
essi
on
A
-0.5
-0.4
-0.3
-0.2
-0.1
0
0.1
sIP
Vpl
ain
5/8/
16T
ype
1
sIP
Vpl
ain
5/8/
16T
ype
2
sIP
Vpl
ain
5/8/
16T
ype
3
sIP
Vpl
ain
10/1
6/32
Typ
e1
sIP
Vpl
ain
10/1
6/32
Typ
e2
sIP
Vpl
ain
10/1
6/32
Typ
e3
sIP
Vpl
ain
20/3
2/64
Typ
e1
sIP
Vpl
ain
20/3
2/64
Typ
e2
sIP
Vpl
ain
20/3
2/64
Typ
e3
sIP
Vad
j2.5
/4/8
Typ
e1
sIP
Vad
j2.5
/4/8
Typ
e2
sIP
Vad
j2.5
/4/8
Typ
e3
sIP
Vad
j5/8
/16
Typ
e1
sIP
Vad
j5/8
/16
Typ
e2
sIP
Vad
j5/8
/16
Typ
e3
sIP
Vad
j10/
16/3
2T
ype
1
sIP
Vad
j10/
16/3
2T
ype
2
sIP
Vad
j10/
16/3
2T
ype
3
Slo
peo
f lin
ear
reg
ress
ion
C
0
1
2
3
4
5
6
7
8
0 5 10 15 20
PV
typ
e1
Ne
utra
lizin
gA
bsc
ore
s
Time (months)
0%
20%
40%
60%
80%
100%
120%
140%
0 6 12 18 24
PV
typ
e 1
D-a
ntig
en
(%o
ft=
0)
Time (months)
A B
C D
sIP
Vpl
ain
5/8
/16
Typ
e1
sIP
Vpl
ain
5/8
/16
Typ
e2
sIP
Vpl
ain
5/8
/16
Typ
e3
sIP
Vpl
ain
10/1
6/32
Typ
e1
sIP
Vpl
ain
10/1
6/32
Typ
e2
sIP
Vpl
ain
10/1
6/32
Typ
e3
sIP
Vpl
ain
20/3
2/64
Typ
e1
sIP
Vpl
ain
20/3
2/64
Typ
e2
sIP
Vpl
ain
20/3
2/64
Typ
e3
sIP
Vad
j2.5
/4/8
Typ
e1
sIP
Vad
j2.5
/4/8
Typ
e2
sIP
Vad
j2.5
/4/8
Typ
e3
sIP
Vad
j5/8
/16
Typ
e1
sIP
Vad
j5/8
/16
Typ
e2
sIP
Vad
j5/8
/16
Typ
e3
sIP
Vad
j10/
16/3
2T
ype
1sI
PV
adj1
0/16
/32
Typ
e2
sIP
Vad
j10/
16/3
2T
ype
3
Next generation IPV manufacturing
131
Discussion The polio eradication program strives to a switch from OPV to sIPV and currently at least
one dose of IPV is recommended (WHO 2013a). In view of the relatively short timelines in
the polio eradication program it was chosen to prepare a sIPV with limited process
development time prior to production of clinical lots. Based on the existing large scale IPV
manufacturing process development of sIPV was achieved. Main operating differences
were related to the observed precipitate during inactivation, intrinsic virus properties
resulting in adjustments in tests (i.e. aluminium desorption prior to D‐antigen
quantification) and limits required with respect to biosafety (i.e. virus culture
temperature). The final product met quality criteria and could be released for testing in the
clinical phase I/IIa studies in adults and infants to show safety and proof of principle.
Although a sIPV with required immunogenicity and purity could be produced, the
purification yields with respect to Sabin PV type 2 were very low. These low levels will not
result in a cost competitive IPV product. However, in light of the polio eradication
program, and to pursue the fast implementation of worldwide sIPV manufacturing, sIPV
production was continued despite the low type 2 yields. In this way it could be illustrated
whether such a product would be comparable or better for polio vaccination compared to
the conventional IPV.
The next step in the project is to transfer the manufacturing knowledge to current vaccine
manufacturers in low‐ and middle income countries to replace the OPV production with
sIPV production (Bakker et al. 2011). The presented manufacturing process is being
optimized in parallel with technology transfer. As product registration for market
authorization at local authorities will require local clinical studies, necessary process
optimizations for an economically feasible product can be implemented prior to this stage.
Worldwide efforts in the development of sIPV have recently resulted in market
authorization for two vaccines containing sIPV in Japan (Tanimoto et al. 2012). Further, the
Institute of Medical Biology, Chinese Academy of Medical Sciences (Kunming, China) (Liao
et al. 2012a) is currently performing clinical phase III studies (Liao et al. 2012b). This parallel
development of sIPV allows a solid base for future IPV availability and minimization of risks
with respect to biosafety during manufacturing.
Acknowledgements The authors thank Patrick Koedam (Bilthoven Biologicals) for the virus neutralization
assays performed for the rat immunogenicity studies carried out in collaboration with the
Intravacc Animal Research Center (formerly part of the Netherlands Vaccine Institute).


Chapter 8
Isoelectric point determination of live polioviruses
by capillary isoelectric focusing with whole column
imaging detection
Published as:
Thomassen, Y.E., van Eikenhorst, G., van der Pol, L.A., Bakker, W.A.M. (2013) Isoelectric
point determination of live polioviruses by capillary isoelectric focusing with whole column
imaging detection.
Analytical Chemistry 85(12):6089‐6094
dx.doi.org/10.1021/ac400968q

Chapter 8
134
Abstract Using a capillary isoelectric focusing–whole column imaging detection (CIEF‐WCID)
method, the isoelectric points (pI) of complete intact polioviruses were determined. The
polioviruses that were analyzed are the commonly used viruses for the production of
inactivated polio vaccines (IPV)—Mahoney (type 1), MEF‐1 (type 2), and Saukett (type 3)—
as well as for attenuated oral polio vaccines (OPV) and Sabin types 1, 2, and 3. A method
for analyzing biological hazardous components (biological safety level 2) was set up for
the CIEF‐WCID analyzer used. This method is based on closed circuits. The determined pI’s
were 6.2 for Mahoney, 6.7 for MEF‐1, and 5.8 for Saukett. The pI’s of Sabin types 1, 2, and 3
viruses were 7.4, 7.2, and 6.3, respectively. Resolution of the virus peaks was shown to be
reproducible. Using this adjusted CIEF‐WCID technique, the pI of biologically hazardous
components like toxins or viruses can be determined, which is beneficial for the
development of vaccine production methods among others.

pI of polioviruses
135
Introduction Polioviruses are members of the Picornaviridae. Picornaviruses are small (30 nm in
diameter), nonenveloped viruses with a capsid buildup of 60 replicas of four small viral
proteins (VP1, VP2, VP3, and VP4) arranged in an icosahedral lattice. The capsids enclose a
positive‐stranded 7200–8500‐nucleotide‐long RNA (Koch and Koch 1985; Racaniello 2007).
Poliovirus (PV) is the causative agent of poliomyelitis, a disease that can be prevented by
vaccination. Currently, two types of polio vaccines are in use, the live oral polio vaccine
(OPV) based on attenuated Sabin strains (types 1, 2, and 3) (Sabin and Boulger 1973) and
an injectable inactivated polio vaccine (IPV) based on wild type strains Mahoney (type 1),
MEF‐1 (type 2), and Saukett (type 3) (Salk 1953). The production processes of these
vaccines differ in that OPV is prepared by clarification of virus cultures (WHO 1999), while
IPV is further purified after virus culture and inactivated using formaldehyde (WHO 2002a).
For process development purposes, it is important to know the isoelectric point (pI or IEP)
of the product that is being produced. The pI is the pH value at which the virus, or a
protein, has a net charge of zero. Purification using ion exchange chromatography (IEX) is
based on the charge differences of the product and contaminants. Also, product
aggregation and choice of buffers in which the product stability can be ensured is, among
others, dependent on the product pI (Floyd and Sharp 1978a; Floyd and Sharp 1978b;
Vrijsen et al. 1983) (the electrochemical surface properties of the product). During the
production process of inactivated polio vaccine (IPV), IEX is used to purify the virus
(Thomassen et al. 2013b; Thomassen et al. 2010); moreover poliovirus has the tendency to
form aggregates (Floyd and Sharp 1979), which needs to be avoided especially during
inactivation and final storage. In the polio eradication effort (Aylward et al. 2006), a new
IPV based on the attenuated Sabin strains is under development (Bakker et al. 2011). In this
task, work on process development is being done to achieve a feasible production
process. Until now, the pI’s of PV Sabin type 2 and PV Sabin type 3 have not been reported.
Isoelectric focusing (IEF) is a high‐resolution technique in which molecules are separated
based on charge. It can be used to determine the pI of biomolecules or large complexes
like viruses. Capillary isoelectric focusing (CIEF) combines the high resolving power of
conventional gel IEF with automation and quantification of capillary electrophoresis (CE)
(Hjertén and Zhu 1985). The first applications of CIEF used a long (20–60 cm) capillary to
focus the molecule of interest and detect it with an on‐column UV absorbance meter.
Samples mixed with ampholytes are introduced on the column. After application of a high
DC voltage, a relatively stable pH gradient is established by the carrier ampholytes (Hjerten
et al. 1987). The molecule of interest, often a protein, moves to the pH where its net
charge is zero, or where its pI value equals the pH. Following focusing, a mobilization
process is required to move the focused protein zones through the detection point
(Hjertén and Zhu 1985). Problems associated with this mobilization include distortion of

Chapter 8
136
the pH gradient, risk of protein precipitation, uneven resolution due to nonuniform
mobilization speed, and increased analysis time (Mao and Pawliszyn 1999).
The development of whole column imaging detection (WCID) eliminates the requirement
of mobilization and allows detection during the focusing process (Wu and Pawliszyn 1994).
In CIEF‐WCID, the pI values of separated molecules are directly determined based on the
position of the focused molecule and the linear pH gradient in the column. CIEF‐WCID has
been applied successfully for the pI determination of various large complexes like virus‐like
particles (Goodridge et al. 2004), bacteriophages (Liu and Pawliszyn 2005), and bacteria
(Liu et al. 2007).
Determination of the pI of polioviruses poses another laboratory challenge, namely a
biosafety risk. The iCE280 analyzer (Convergent Bioscience; Toronto Canada) was adapted
to allow measurement of live viruses while biosafety is maintained. The here described
technique, for accurate measurement of pI of hazardous viruses, adds to the field of
vaccine production. In addition, other processes where adhesion or sorption of hazardous
viruses is important, like virus removal from drinking water (Michen et al. 2013), will
benefit from knowing the pI of these viruses.
Methods
Virus Samples
Six different PV strains were used in this study. Wild type strains, Mahoney (type 1), MEF‐1
(type 2), and Saukett (type 3), and attenuated strains Sabin type 1 (LSc 2ab KP2), type 2
(P712 Ch2ab‐KP2), and type 3 (Pfizer 457‐III).
Vero cells were cultivated adherent to microcarriers (Cytodex 1, GE Healthcare) in stirred
tank bioreactors, followed by PV infection (at low multiplicity of infection or MOI of 0.01–
0.05) and cultivation for 3–4 days. PV was purified by clarification, concentration, size
exclusion chromatography, and IEX in a phosphate buffer (pH 7) (van Wezel et al. 1979).
Virus samples had virus concentrations ranging from 8 to 48 mg mL‐1 assuming A260 nm =
81.6 for a 10 mg mL‐1 solution (Charney et al. 1961).
To prepare virus samples for analysis with CIEF‐WCID, 70 μL of 1% methyl cellulose solution
was mixed with 8 μL of Pharmalytes (pH 3–10), 50 μL of purified virus, 2 μL of pI marker
(pH 4.65), 2 μL of pI marker (pH 9.22), and 68 μL of Milli‐Q to make a final volume of 200
μL. The concentration of carrier ampholytes was 4%. Samples were analyzed at least in
triplicate.

pI of polioviruses
137
Virus Purity
Virus purity was assessed by analysis with SDS‐PAGE using 12% polyacrylamide gels (Precise
precast protein gels; Pierce). Samples (100 μL) were precipitated using TCA, reconstituted,
and loaded on the gel, which was stained after running with Coomassie Brilliant Blue.
Also, the A260/A280 ratio was used to determine virus purity. A ratio of 1.6–1.7 can be
considered to represent pure virus (Simizu et al. 2006; Westdijk et al. 2011).
Apparatus
CIEF‐WCID was done using the iCE280 analyzer (Convergent Bioscience; Toronto Canada).
It was equipped with a 50 mm × 100 μm internal diameter × 200 μm outer diameter silica
capillary column with its outside polyamide coating removed. On the inside, the capillary
was coated with fluoracarbon (Restek, Bellefonte, CA). The ends of the column were
connected with two pieces of 3 mm dialysis hollow fiber membrane (molecular weight
cutoff 18,000 Da; Spectrum Medical Industries, Los Angeles, CA).
The used electrolytes were 80 mM H3PO4 (anolyte) and 100 mM NaOH (catholyte).
The inlet capillary to the IEF column was connected to a tube which at the other end was
put in the sample vial (see Figure 1). The outlet capillary of the IEF column was connected
to a tube which at the other end was put in a waste vial containing chloride solution
(Actisan). Sample injection was done by applying a vacuum (using a 10 mL syringe) at the
waste site of the vial (Figure 1). When the whole capillary was filled (determined by WCID),
the sample was considered injected, and the vacuum was lifted. Subsequently the voltage
was applied to allow focusing.
The detection system consisted of a UV CCD camera for whole column optical adsorption
imaging detection operated at 280 nm. The used lamp was a deuterium lamp.
Reagents
Carrier ampholytes (Pharmalytes 3–10) were obtained from GE Healthcare. The pI markers
and methyl cellulose solution (1%) were obtained from Convergent Bioscience (Toronto
Canada).
Solutions were prepared in Milli‐Q. Electrolytes were prepared by dilution of H3PO4 or
NaOH in a 0.1% methyl cellulose solution to final concentrations of 80 and 100 mM,
respectively.

Chapter 8
138
Isoelectric Focusing
Virus samples were applied to the column as described above. Once the column was filled
with the sample (as detected by WCID), after approximately 8 min, a 1.5 kV dc voltage
prefocus was applied for 1 min followed by 3 kV dc voltage for 5 min to get IEF separation.
After this period, the focusing was complete, and an electropherogram was recorded.
Following focusing, the 3 kV dc voltage was turned off, and the sample solution in the IEF
column was washed to the waste vial by applying a vacuum in the waste vial. Between the
runs, the column was washed with 0.1% methyl cellulose for 3 min.
Figure 1. Schematic drawing of the method for
analysis.
cartidgeinletoutlet
samplewaste
+ -
apply vacuum pressurebypass

pI of polioviruses
139
Results and Discussion
Equipment Setup
Analysis of infectious viruses needs to be done with care for biosafety. To minimize
hazardous situations, the iCE280 analyzer was adjusted according to the schematics in
Figure 1 to obtain a closed system. This closed system allowed analysis of biologically
active poliovirus samples. The sample loading was done by applying a vacuum at the exit
site to draw the sample into the cartridge. After full loading of the cartridge, as could be
observed using the WCID camera, the vacuum was lifted and voltage was applied.
Focusing of PV was complete within 6 min.
Sample Preparation
To obtain highly pure PV, purification was done using size exclusion chromatography and
ion exchange chromatography. The purity of the virus was assessed by SDS‐PAGE (Figure
2). As is shown in this figure, nearly all of the proteins present after ion exchange
chromatography are the viral proteins. This was confirmed by the ratio A260/A280, which
was on average 1.62; a value of 1.7 is expected when pure poliovirus is analyzed (Simizu et
al. 2006; Westdijk et al. 2011).
Figure 2. SDS‐PAGE of purified PV type 1. Lane 1 of live virus using the iCE280 analyzer represents the product after size
exclusion chromatography, lane 2 after ion exchange
chromatography, and lane M is the marker.

Chapter 8
140
Figure 3. Electropherograms of PV type 1 Mahoney, different production batches (n = 4), and phosphate buffer. Batch A represents a fresh sample; batches B–D represent samples that have been frozen (−80 °C).
PVs were mixed with Pharmalytes (pH 3–10) and pI markers (4.65 and 9.22), which were used to calibrate
the pI scale. Detection at 280 nm was done after 6 min of focusing.
Poliovirus Elution Peak Shape and Reproducibility
Polioviruses are small (30 nm), rigid RNA viruses that consist of 60 replicates of four small
capsid proteins (VP1–4, 33, 30, 26 and 7 kDa respectively) (Koch and Koch 1985). Such large
biomolecules and microbes may be challenging in CIEF separation as not only size but also
the composition (lipid, proteins, and carbohydrates) and the higher‐order structure can
cause changes in the net surface pI. It has been shown that CIEF separation of norovirus
VLP (30–35 nm), consisting of a single major capsid protein, results in a main peak with few
side peaks. The peak shape and pI of these VLPs had good reproducibility (Goodridge et al.
2004). Yeast cells, which are much larger (4 μm), were found to have the tendency to
interact with the capillary inner wall. This was resolved by using a larger inner diameter
and low concentrations (1 cell μL‐1) (Shen et al. 2000).
In Figure 3, the electropherograms of purified PV type 1 Mahoney are given. The IEF
profiles show a broad peak. Aspects which could result in this peak shape are sample
interaction with the inner capillary wall, the focusing time, or sample related aspects like
impurities or virus characteristics. Prolonged focusing time did not result in a better
resolution. Neither did the virus interact with the capillary wall, as was concluded by
4 5 6 7 8 9 10
Isoelectric point (pI)
4.65 9.22
Phosphate buffer
Mahoney batch A
Mahoney batch C
Mahoney batch B
Mahoney batch D

pI of polioviruses
141
running an electropherogram after flushing the cartridge with running buffer. In Figure 3,
the electropherogram of the buffer, a phosphate buffer, is given, which explains most of
the broad peak shape. Although the virus samples were very pure (Figure 2), minor
impurities were present which may have attributed to the peak shape.
Table 1. Isoelectric point of polioviruses.
strain isoelectric point
PV type 1 Mahoney Overall 6.22 ± 0.05 (n=21)
Batch A 6.28 ± 0.01 (n=5)
Batch B 6.23 ± 0.03 (n=7)
Batch C 6.21 ± 0.01 (n=5)
Batch D 6.13 ± 0.03 (n=4)
Sabin Overall 7.42 ± 0.07 (n=7)
Batch E 7.37 ± 0.04 (n=4)
Batch F 7.49 ± 0.03 (n=3)
PV type 2 MEF‐1 Overall 6.68 ± 0.07 (n=7)
Batch G 6.74 ± 0.03 (n=4)
Batch H 6.62 ± 0.03 (n=3)
Sabin Overall 7.18 ± 0.08 (n=7)
Batch I 7.24 ± 0.02 (n=4)
Batch J 7.10 ± 0.04 (n=3)
PV type 3 Saukett 5.84 ± 0.05 (n=4)
Sabin 6.34 ± 0.03 (n=4)
The main peak, for PV type 1 Mahoney around a pI of 6.2, was used to determine the pI. To
assess the repeatability of the analysis of a single sample, it was analyzed at least three
times. Although the peak was not very sharp, possibly due to a low virus concentration,
the relative standard deviation of 0.5% was good. Additionally, four batches of PV 1
Mahoney were prepared separately, i.e. from cell and virus culture up to the purification to
assess the repeatability of pI determination between different sample preparations
(Figure 3). The peak shapes of batches A–D were comparable. In addition to that, no effect
of sample freezing on the IEF profiles was seen. Batch A represents a fresh sample, while
batches B–D were stored at −80 °C prior to analysis. A similar observation was found for
the freezing and thawing of echovirus (Zerda and Gerba 1984). Calculations of the pI
showed minor variation (Table 1). To determine the pI of PV type 1 Mahoney, the average
of all analysis was taken, resulting in a pI of 6.22 ± 0.05 (n = 21).
Determining the pI of Other Polioviruses
Other PV strains used in IPV manufacturing are PV type 2 MEF‐1 and type 3 Saukett. Next to
that, an IPV based on using attenuated Sabin polioviruses is under development (Bakker et
al. 2011). The pI’s of these Sabin polioviruses were also determined (Table 1) to aid future
process development. In Figure 4, the IEF profiles of the different PVs are compared. On

Chapter 8
142
the basis of these profiles, a distinction between the different viruses can be made.
Remarkable is the big difference in pI between PV type 1 Mahoney and Sabin type 1 virus.
The latter was established by attenuation of the Mahoney strain (Sabin and Boulger 1973).
Figure 4. Electropherograms of wild type and attenuated poliovirus strains. PVs were mixed with
Pharmalytes (pH 3−10) and pI markers (4.65 and 9.22), which were used to calibrate the pI scale. Detection at 280 nm was done after 6 min of focusing.
Literature Review
The pI’s of most of the PVs were determined earlier by others in the 1970s or early 1980s
(Table 2). When regarding the reported pI’s for PV type 1 Mahoney, the pI ranges from 6.7
to 8.2; in some cases, a second pI was found around 4.5. It was proposed that this second
pI represented an isoform (Mandel 1976). However, Vrijsen et al. (1983) suggested that the
second peak represented aggregated PV. These extremes in reported pI make comparison
with literature data challenging.
Recently, Michen and Graule (Michen and Graule 2010) reviewed the literature on the pI of
viruses. They concluded that variation in the data resulted from (i) the difference in virus
strains, (ii) insufficient purification, (iii) interactions of charged agents with the virus
interface such as specific adsorption and/or surface complexation, and (iv) diversity in host
cells. While the pI determination method may also be a potential source for variation, this
could not be assessed.
4 5 6 7 8 9 10
Isoelectric point (pI)
4.65 9.22
Type 1 Mahoney
Type 1 Sabin
Type 2 MEF-1
Type 2 Sabin
Type 3 Saukett
Type 3 Sabin

pI of polioviruses
143
Table 2. Literature overview on pI’s of various PV strains (only the pI of the monomeric “A” form is given).
IEP Method2 Host Purity Reference
PV type 1 Mahoney 8.3 ± 0.1 IEF‐DA HEp‐23 High (Floyd and Sharp 1978a)
7.0 IEF‐DA HeLa High (Alvarez and O'Brien 1982)
7.5 IEF‐DA HeLa High (O'Brien and Newman 1979)
7.0 IEF‐DA HeLa S3 High (Emini et al. 1983)
7.2 IEF‐A HeLa High (Rombaut et al. 1989)
7.0‐7.2 IEF‐A HeLa S3 High (Onodera and Phillips 1987)
6.7 IEF‐A HeLa S3 High (Putnak and Phillips 1981)
Brunhilde 7.0 IEF‐DA HeLa High (Mandel 1971)
7.0 IEF‐DA HeLa High (Mandel 1976)
6.5 IEF‐DA HeLa High (Vrijsen et al. 1983)
6.9 IEF‐DA HeLa High (Brioen et al. 1985)
7.3 IEF‐DA HEp‐23 High (Sharp and Leong, 1980)
7.1 IEF‐A nd1 nd (Zerda and Gerba 1984)
Brunender 7.4 IEF‐DA Nd nd (Colla La et al. 1972)
CHAT 7.0 IEF‐DA HeLa High (Ward 1980)
7.5 IEF‐DA HeLa High (Ward 1978)
E206 7.4‐7.6 TLE KB cells High (Bengtsson et al. 1964)
nd 7.4 IEF‐DA Nd nd (Nasser et al. 1992)
Sabin 7.4 IEF‐DA HeLa High (Mandel 1976)
7.0 IEF‐DA HeLa S3 High (Emini et al. 1983)
6.75 IEF‐DA Vero Low (Butler et al. 1985)
6.6 IEF‐A Nd nd (Zerda and Gerba 1984)
7.4‐7.6 TLE KB cells High (Bengtsson et al. 1964)
6.6 Calc.4 HeLa High (Murray and Parks 1980)
PV type 2 MEF‐1 6.8 IEF‐DA HeLa High (Mandel 1976)
Sabin 7.5 ± 0.2 IEF‐DA HeLa High (Taylor et al. 1981)
6.5 IEF‐DA HeLa‐O High (Butler et al. 1985)5, (Korant
and Lonberg‐Holm 1974)
6.85 IEF‐DA GMK cells High (Eggers and Rosenwirth
1988)
PV type 3 Saukett 6.6 IEF‐DA HeLa High (Mandel 1976) 1 nd = not described 2 Various methods of IEF are available: i) IEF in dense aqueous solutions, e.g. sucrose, ampholine (IEF‐DA); ii)
IEF in agarose gel (IEF‐A); iii) IEF in polyacrylamide gels (IEF‐PA); iv) capillary IEF (CIEF); v) thin layer electrophoresis (TLE). 3 HEp‐2 cells are contaminated with HeLA (Chen 1988) 4 calculated based on zeta potential 5 reference to Korant personal communication (Taylor et al. 1981)

Chapter 8
144
In Table 2, reported values for the pI of PV are given in addition to the analysis method, the
host cell used, and the sample purity. In general, the sample purity was high; mostly either
sedimentation (using sucrose) or isopycnographic (using CsCl) centrifugation was done.
Mostly HeLa cells were used to produce the virus, and the common method for analysis
was iso‐electrofocusing in dense aqueous solution (IEF‐DA). PV type 1 Mahoney is the most
analyzed poliovirus strain (n = 7). On average, a pI of 7.3 was measured with a wide range,
6.7–8.3. Other PV type 1 viruses have an average pI of 7.0, for both PV type 1 Brunhilde
(range 6.5–7.3) and PV type 1 Sabin (range 6.6–7.5).
In our studies, the pI of PV type 1 Mahoney and PV type 3 Saukett were lower (1.0 and 0.8
pH units, respectively) than reported in the literature. The observed pI’s of the other
strains are within 0.5 pH units of the mean of their respective strains. Comparing the
observed pI’s with the literature data appeared to be challenging, as in this study the Vero
cell line (a cell line most often used in the production of PV for vaccines) and different
purification methods have been applied. Concluding from these observed differences, it
can be stated that the pI of viruses needs to be determined at the conditions which are
relevant, meaning the conditions for the specific process development.
Although for some strains a large difference with reported literature data was found, the
CIEF‐WCID method was robust when analyzing different batches of PV. Additionally, the
accuracy of the CIEF‐WCID analysis is high. These findings back the significance of our
measurements. Using the pI of the PV will aid us in our current process improvement
efforts for a more affordable (Sabin‐)IPV.


Chapter 9
Improved poliovirus D‐antigen yields by application
of different Vero cell cultivation methods
In press as:
Thomassen, Y.E., Rubingh, O., Wijffels, R.H., van der Pol, L.A., Bakker, W.A.M. (2014)
Improved poliovirus D‐antigen yields by application of different Vero cell cultivation methods.
Vaccine
dx.doi.org/10.1016/j.vaccine.2014.02.022

Chapter 9
148
Abstract Vero cells were grown adherent to microcarriers (Cytodex 1; 3 g L‐1) using animal
component free media in stirred‐tank type bioreactors. Different strategies for media
refreshment, daily media replacement (semi‐batch), continuous media replacement
(perfusion) and recirculation of media, were compared with batch cultivation. Cell
densities increased using a feed strategy from 1 × 10⁶ cells mL‐1 during batch cultivation to
1.8, 2.7 and 5.0 × 10⁶ cells mL‐1 during semi‐batch, perfusion and recirculation, respectively.
The effects of these different cell culture strategies on subsequent poliovirus production
were investigated. Increased cell densities allowed up to 3 times higher D‐antigen levels
when compared with that obtained from batch‐wise Vero cell culture. However, the cell
specific D‐antigen production was lower when cells were infected at higher cell densities.
This cell density effect is in good agreement with observations for different cell lines and
virus types. From the evaluated alternative culture methods, application of a semi‐batch
mode of operations allowed the highest cell specific D‐antigen production.
The increased product yields that can easily be reached using these higher cell density
cultivation methods, showed the possibility for better use of bioreactor capacity for the
manufacturing of polio vaccines to ultimately reduce vaccine cost per dose. Further, the
use of animal‐component‐free cell‐ and virus culture media shows opportunities for
modernization of human viral vaccine manufacturing.

Improved PV yields by cultivation methods
149
Introduction Recently, we have produced Sabin‐IPV (inactivated polio vaccine based on attenuated
Sabin strains) clinical lots under cGMP for phase I safety (and indicative immunogenicity)
studies in human adults and infants (Bakker et al. 2011; Thomassen et al. 2013a). The
applied production process was based on a scale‐down model of the Salk‐IPV
manufacturing process (Thomassen et al. 2013b). The use of this scale‐down model
allowed fast development of a first generation Sabin‐IPV, for which the specifications are
closely related to that for the regular IPV product (Thomassen et al. 2013a). In parallel to
this fast‐track development an optimization and modernization research program for the
manufacturing of Sabin‐IPV was started. Examples for modernization are replacement of
the used animal derived components (e.g. bovine serum and porcine trypsin) and
antibiotics. These components should preferably be omitted (for the antibiotics primarily
to prevent any potential allergic reaction), or respectively replaced by animal component
free (ACF) alternatives to minimize the risk of adverse effects (e.g. the potential transfer
of viruses and/or prions). Moreover, a better scientific understanding of the process,
resulting in improved process control and ability for troubleshooting, can be created.
Optimization improvements can possibly be found in the currently used, low cell densities
(1 × 10⁶ cells mL‐1). Assuming comparable virus quality and yields per cell, the use of
increased cell densities can potentially result in more efficient use of bioreactor capacity,
and ultimately reduce the cost per dose. The demand for IPV is increasing as in 2012 the
WHO SAGE group advised all countries to introduce at least one dose IPV in their routine
immunization schedules (WHO 2013a). With the increased IPV demands, which will further
increase after oral polio vaccine (OPV) cessation, the production capacity will have to
increase by scale‐up and optimization causing the current IPV price of $ 3.00 per dose to
decrease to $ 0.52 ‐ $ 1.95 (Venczel et al. 2009). This is still four to fifteen times the current
price of OPV (cost per dose $ 0.14), the vaccine used in most countries. Process
optimization for IPV manufacturing will be needed to be able to further reduce
manufacturing costs below $ 0.50 to keep polio vaccination economically feasible when
switching from OPV to IPV (Sangrujee et al. 2004).
Here we report initial studies where four different adherent Vero cell cultivation methods
were applied using ACF cell culture media: i) batch, the currently used method for Sabin‐
IPV preparation; ii) semi‐batch, where daily media refreshments were applied; iii) perfusion
where continuous media refreshment was applied; and iv) recirculation where media was
circulated through the bioreactor and re‐used. With these commonly known cell culture
methods (Pirt 1975) higher cell densities were obtained and the subsequent virus culture,
also using ACF virus culture media, produced higher quantities of infectious and
immunogenic poliovirus.

Chapter 9
150
Materials and methods
Cells, virus
Vero cells obtained from WHO (10‐87) originally derived from ATCC (CCL‐81) were used as
host for poliovirus production. Poliovirus seeds (Bakker et al. 2011) Sabin type 1 (LSc 2ab
KP2; SO+3), Sabin type 2 ((P712 Ch2ab‐KP2; SO+3) and Sabin type 3 (Lot 457‐III‐Pfizer; RSO3)
were used.
Cultivation methods
Pre‐cultures
Vero cells were cultured in T‐flasks and Hyperflasks (Corning) in VP‐SFM (Invitrogen) to
expand the cell number. After trypisinization (TrypLE Select; Invitrogen) cells were
resuspended in VP‐SFM and added to the bioreactor.
Bioreactor Vero cell cultures
Different cultivation methods have been applied where Vero cells were grown adherent to
microcarriers (3 g L‐1 Cytodex 1; GE Healthcare). The cultures were maintained at pH 7.2,
37°C, 50% dissolved oxygen (DO) by headspace aeration only (1 L min‐1) and sampled at
least once a day.
Cell cultures were carried out in standard glass stirred‐tank type bioreactors, optionally
equipped with a spin filter (70 µm) to retain cells on microcarriers in the bioreactor when
needed (perfusion and recirculation culture mode). Alternatively, a harvest pipe with a
75µm sieve was used to remove media while retaining microcarriers. Cultivations were
controlled using Sartorius DCU‐3 control units and MFCS‐win software (Sartorius AG,
Melsungen, Germany).
Batch cultivations were carried out at 4L working volume with inoculation densities of 0.1
× 106 cells mL‐1. During cultivation, glucose and glutamine were added by bolus feeding to
10 mM glucose and 2 mM glutamine when concentrations were below 5 mM and 0.5 mM
respectively.
Semi‐batch cultivations were essentially performed as described by Mendonça (1998)
(Mendonça and Pereira 1998) at 3L working volume with an inoculation density of 0.1 × 10⁶
cells mL‐1. From day two onwards, daily 1L culture medium (1/3 culture volume) was
replaced with fresh medium. Media replacement was done after sedimentation of the
microcarriers without agitation. In addition, bolus feeding of glucose and glutamine was
done once 4 days after the start of cultivation to obtain concentrations of 20 mM glucose
and 2 mM glutamine.

Improved PV yields by cultivation methods
151
Perfusion cultivations were carried out using 1.5L working volume. Cells were inoculated at
0.1 × 10⁶ cells mL‐1 and retained in the bioreactor. After 2 days of batch cultivation,
continuous media feed was started at 1.5 L day‐1 (1 culture volume per day). Media feed
rate was kept constant for the remainder of the perfusion cultures.
Recirculation cultures, where cells are retained in the bioreactor (3L working volume)
while medium (15L total volume= culture volume + circulated volume) is circulated, were
carried out essentially as described previously (van Wezel 1985). Cells were inoculated at a
cell density of 0.6 × 10⁶ cells mL‐1. After 1 day, a continuous recirculation flow was started
with 15 L day‐1 (5 culture volumes per day), followed by daily increments to 22 L day‐1 and 30
L day‐1 (respectively 7.3 and 10 culture volume per day) at days 3 and 4.
Virus culture
Prior to virus infection, using the same bioreactor vessel used for Vero cell culture, the
media feed was stopped and pH, DO and temperature settings were adjusted to 7.4, 25%
and 32.5°C, respectively. Media was not refreshed but glucose and glutamine were fed
when concentrations were below 5 mM and 0.5 mM, respectively. Cells were infected with
poliovirus with an MOI (multiplicity of infection) of 0.01. Virus cultivation was considered
finished when 100% CPE (cytopathic effect) was observed microscopically.
Analytics
Cells were counted daily using a Nucleocounter NC‐100 (Chemometec).
Cell culture metabolites such as glucose, lactate, glutamine, glutamate and ammonia were
monitored using a Bioprofile 100 Plus (Nova Biomedical Waltham, MA).
Poliovirus was quantified with a virus titer assay as decribed previously (Thomassen et al.
2012). The amount of D‐antigen was assessed using a D‐antigen ELISA (ten Have et al.
2012).
Results
Vero cell growth
Vero cell cultures were performed in four different cultivation modes, batch, semi‐batch,
perfusion and recirculation. Batch cultivations were performed to obtain a reference
growth curve for later comparison with the more sophisticated culture methods where
either media is refreshed (semi‐batch and perfusion) or circulated (recirculation). After 3‐4
days of cultivation, a cell density at 1.0 × 10⁶ cells mL‐1 was reached in batch cultivation with
an average growth rate of 0.036 h‐1 during exponential growth and a growth rate of 0.022

Chapter 9
152
h‐1 at the moment of virus infection on day 4 (Figure 1; Table 1). At this point cells are
present as a monolayer on the microcarriers (Figure 2). Applying a daily partial medium
renewal in a semi‐batch mode allowed cell growth to continue and after 2 additional days
of culture (6 days in total) a cell density of 1.8 × 10⁶ cells mL‐1 was obtained. Here
comparable growth rates to batch cultivation were observed. The growth rate declined
during the feed phase from 0.034 h‐1 at day 3 to 0.006 h‐1 at day 6. Using a perfusion mode,
where medium renewal is continuous, cell growth could be prolonged to yield a cell
density of 2.7 × 10⁶ cells mL‐1 in 7 days. The growth rates of the Vero cells were lower
during the feed phase compared to the growth rates observed in semi‐batch cultivations
and decreased from 0.018 h‐1 at day 3 to 0.005 h‐1 at day 7.
Table 1 Cell culture characteristics of different Vero cell cultivation methods
Cultivation method Inoculation cell
density
Cell density at time
of infection
Culture
time
Growth rate at
virus infection
(× 106 cells mL‐1) (× 106 cells mL‐1) (days) (h‐1)
batch
(n=5)
0.10 ± 0.04 1.02 ± 0.07 4 0.022
semi‐batch (n=3) 0.14 ± 0.01 1.75 ± 0.32 6 0.006
perfusion (n=3) 0.08 ± 0.01 2.72 ± 0.10 7 0.005
recirculation (n=3) 0.64‡ ± 0.11 5.01 ± 0.40 4‡ 0.0004
Cells were present in a multilayer on the microcarriers at these cell concentrations (Figure
2). In the so‐called recirculation method (van Wezel 1985) cells were retained in the
bioreactor while medium from an external container was circulated. When starting with an
inoculation density of 0.6 × 10⁶ cells mL‐1 a monolayer was already formed after one day of
cultivation, and cells started to grow in a multilayer rapidly. Cell concentrations of 5.0 × 10⁶
cells mL‐1 were found after a culture time of 4 days, while growth rates decreased linearly
during the feed phase from 0.025 h‐1 at day 2 to 0.0004 h‐1 at day 4. It should be noted, that
the latter cultivation method was applied using higher inoculation densities, which implies
that a more extensive (or longer) pre‐culture was needed.
Glucose and glutamine concentrations during cell culture
The concentrations of glucose and glutamine were analyzed during the Vero cell growth in
different cultivation modes. Glucose and glutamine concentrations decreased rapidly
when the culture was in batch mode (Figure 3). When media was refreshed daily (semi‐
batch) or continuously (perfusion) or when media was circulated (recirculation), sufficient
glucose and glutamine were present during the complete cultivation time. During
perfusion and recirculation cultivations it is clear that from the moment the feed was
started the glucose and glutamine levels remained reasonably constant, whereas during
semi‐batch cultivations glucose and glutamine concentrations varied more. This was
directly correlated to the feeding times. It should be noted that during semi‐batch

Improved PV yields by cultivation methods
153
cultivations, an additional bolus feed of glucose and glutamine was given at day 4 (Figure
3).
Figure 1. Growth curves of Vero cells using different cultivation modes batch (B), semi ‐batch (S), perfusion (P) and recirculation (R). Different batches are indicated with different colours and symbols, where squares,
circles and triangles represent cultures that were infected with poliovirus type 1, 2 and 3 respectively.
Infection of cultures was done at the end of the shown growth curve.
0
1
2
3
4
5
6
7
8
0 1 2 3 4 5 6 7
Ce
ll c
on
cen
tra
tio
n (
106
cell
s m
L-1
)
Time (days)
P
0
1
2
3
4
5
6
7
8
0 1 2 3 4 5 6 7
Ce
ll c
on
cen
tra
tio
n (
106
cell
s m
L-1
)
Time (days)
R
0
1
2
3
4
5
6
7
8
0 1 2 3 4 5 6 7
Ce
ll c
on
cen
tra
tio
n (
106
cell
s m
L-1
)
Time (days)
B
0
1
2
3
4
5
6
7
8
0 1 2 3 4 5 6 7
Ce
ll c
on
ce
ntr
ati
on
(1
06
ce
lls m
L-1
)
Time (days)
S

Chapter 9
154
Figure 2. Photographs of Vero cells on microcarriers at the time of virus inoculation. Presence of multilayers at higher cell concentrations (1.0, 1.8, 2.7 and 5.0 × 10⁶ cells mL‐1 for respectively batch, semi‐batch,
perfusion and recirculation) is clearly visible.
Figure 3. Glucose (squares) and glutamine (diamonds) concentrations present in Vero cell cultivations using
batch (B), semi‐batch (S), perfusion (P) or recirculation (R). Figures are averaged numbers. Daily media exchange was started at day 2 (S), media feed at day 3 (P) and circulation at day 1 (R).
batch semi-batch recirculationperfusion
0
1
2
3
0
5
10
15
20
25
30
0 1 2 3 4 5 6 7
Glu
tam
ine
co
nce
ntr
ati
on
(m
M)
Glu
cose
co
nce
ntr
ati
on
(m
M)
Time (days)
R
0
1
2
3
0
5
10
15
20
25
30
0 1 2 3 4 5 6 7
Glu
tam
ine
co
nce
ntr
ati
on
(m
M)
Glu
cose
co
nce
ntr
ati
on
(m
M)
Time (days)
P
0
1
2
3
0
5
10
15
20
25
30
0 1 2 3 4 5 6 7
Glu
tam
ine
co
nce
ntr
ati
on
(m
M)
Glu
cose
co
nce
ntr
ati
on
(m
M)
Time (days)
B
0
1
2
3
0
5
10
15
20
25
30
0 1 2 3 4 5 6 7
Glu
tam
ine
co
nce
ntr
ati
on
(m
M)
Glu
cose
co
nce
ntr
ati
on
(m
M)
Time (days)
S
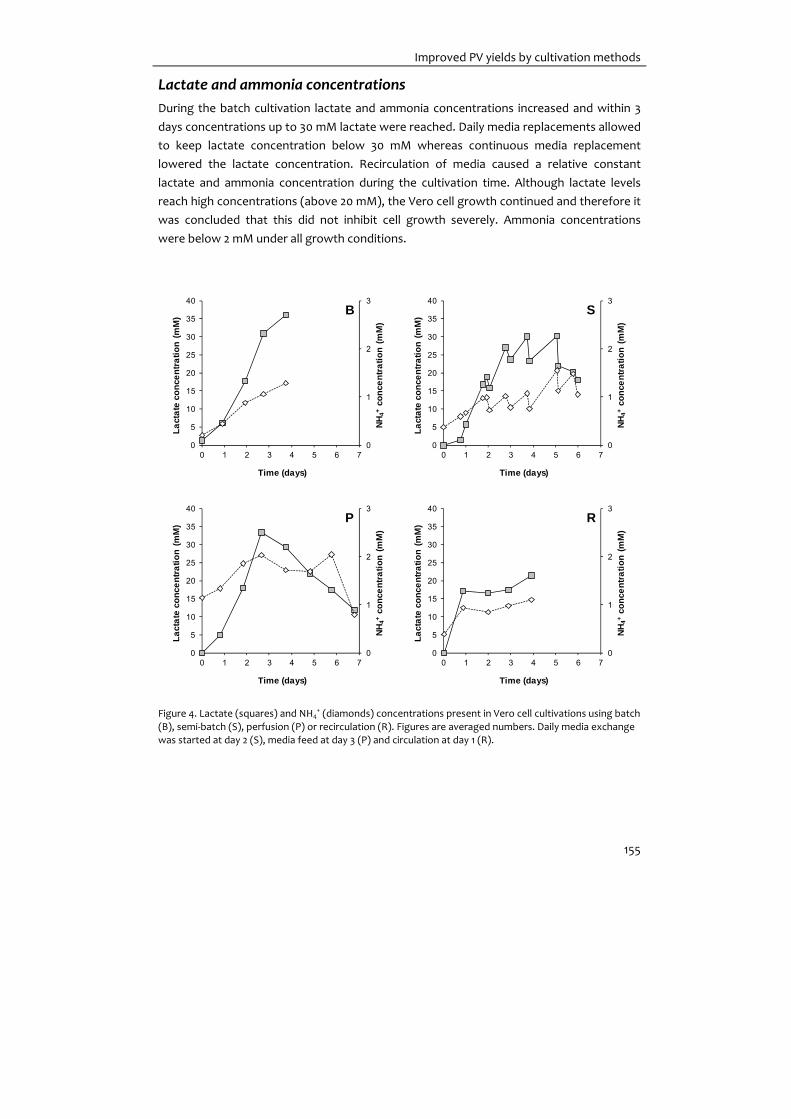
Improved PV yields by cultivation methods
155
Lactate and ammonia concentrations
During the batch cultivation lactate and ammonia concentrations increased and within 3
days concentrations up to 30 mM lactate were reached. Daily media replacements allowed
to keep lactate concentration below 30 mM whereas continuous media replacement
lowered the lactate concentration. Recirculation of media caused a relative constant
lactate and ammonia concentration during the cultivation time. Although lactate levels
reach high concentrations (above 20 mM), the Vero cell growth continued and therefore it
was concluded that this did not inhibit cell growth severely. Ammonia concentrations
were below 2 mM under all growth conditions.
Figure 4. Lactate (squares) and NH4+ (diamonds) concentrations present in Vero cell cultivations using batch
(B), semi‐batch (S), perfusion (P) or recirculation (R). Figures are averaged numbers. Daily media exchange was started at day 2 (S), media feed at day 3 (P) and circulation at day 1 (R).
0
1
2
3
0
5
10
15
20
25
30
35
40
0 1 2 3 4 5 6 7
NH
4+co
nce
ntr
ati
on
(m
M)
La
cta
te c
on
cen
tra
tio
n (
mM
)
Time (days)
S
0
1
2
3
0
5
10
15
20
25
30
35
40
0 1 2 3 4 5 6 7
NH
4+co
nce
ntr
ati
on
(m
M)
La
cta
te c
on
cen
tra
tio
n (
mM
)
Time (days)
B
0
1
2
3
0
5
10
15
20
25
30
35
40
0 1 2 3 4 5 6 7
NH
4+co
nce
ntr
ati
on
(m
M)
La
cta
te c
on
cen
tra
tio
n (
mM
)
Time (days)
P
0
1
2
3
0
5
10
15
20
25
30
35
40
0 1 2 3 4 5 6 7
NH
4+co
nce
ntr
ati
on
(m
M)
La
cta
te c
on
cen
tra
tio
n (
mM
)
Time (days)
R

Chapter 9
156
Virus culture
To determine the variability in poliovirus yields, three cell cultures (in batch mode) were
infected with poliovirus type 3. When virus culture was complete, virus titers were
measured to determine the amount of infectious poliovirus and D‐antigen was measured
to quantify the amount of immunogenic poliovirus. The RSD (relative standard deviations)
were 9% for the virus titer and 8% for the D‐antigen concentration. Both are within 10%,
which can be considered comparable. This means that cultures were very comparable as
the virus titer assay is valid within 0.5 log (=6%) and the RSD for test reproducibility for the
D‐antigen ELISA is 10.6% (ten Have et al. 2012). Based on good virus culture reproducibility,
it was chosen to compare the effects of different cell culture strategies on the virus yield
with n=1 for all three virus types.
Figure 5. Cell specific D‐antigen yields
(poliovirus type 1, black; type 2, grey;
type 3, white) after different cell culture methods. Similar virus culture
conditions were applied.
Comparable virus titers were found independent of the cell culture method that was
applied (Table 2). On the other hand, for all three poliovirus types differences in D‐antigen
concentrations were more pronounced. In all cases where media refreshments were used
during cell cultures an increase of the D‐antigen yield was observed, when compared with
batch‐wise cell culture. These increases ranged from approx. 1.5‐ to 2‐fold when cell
cultures were carried out in semi‐batch and perfusion mode to approx. 2.4‐ to 2.9‐fold
when cell cultures were executed in recirculation mode. Since cell concentrations at the
start of virus culture were different in the different settings (Table 1), the cell specific D‐
antigen yields were calculated and compared (Figure 5). Cell specific D‐antigen yields were
the highest when virus culture was carried out based on semi‐batch cell cultures for
poliovirus type 1 and batch or semi‐batch cell cultures for type 2 and 3. When perfusion or
recirculation cultures were used prior to virus culture, the cell specific D‐antigen yields
were a factor 2 lower.
0
50
100
150
200
250
batch semi-batch perfusion recirculation
D-a
nti
ge
n y
ield
(DU
106
cell
s-1 )

Table 2 Virus titers and D‐antigen concentrations observed using different Vero cell culture methods before virus replication.
Cultivation method during cell culture poliovirus type 1 poliovirus type 2 poliovirus type 3
Virus titer
(10 LOG TCID50 mL‐1)
D‐antigen
(DU mL‐1)
Virus titer
(10 LOG TCID50 mL‐1)
D‐antigen
(DU mL‐1)
Virus titer
(10 LOG TCID50 mL‐1)
D‐antigen
(DU mL‐1)
batch 8.7 175 8.8 44 8.8 ± 0.8 (n=3) 78 ± 6 (n=3)
semi‐batch 8.8 356 8.7 72 7.9 137
perfusion 9.3 320 8.3 65 8.6 115
recirculation 9.5 508 8.8 115 8.9 185

Chapter 9
158
Discussion The Vero cell line is one of the commonly used cell lines to produce viral vaccines (Barrett
et al. 2009). Classic cell culture processes used in vaccine manufacturing are often based
on batch‐wise cell and virus cultivations followed by extensive downstream processing,
concentration, purification and inactivation to yield a product (Montagnon et al. 1984; van
Wezel et al. 1984). While downstream processing is important, the virus of interest is
generated during upstream processing, i.e. cell and virus culture. It is also at this stage
where the intrinsic product quality is determined. Whereas product yields may be related
to both the cell concentration and the metabolic state of the cells, product quality is likely
largely influenced by the cells metabolic condition and the virus culture conditions. In
other words, the cell culture method may impact product quality. The cell cultures are
discussed first, followed by the observed D‐antigen levels as indicator of product quality.
The application of different cell culture strategies resulted in higher cell densities, up to 5 ×
106 cells mL‐1 during recirculation cultures. These cell concentrations were at comparable
levels to those previously reported for recirculation cultures (Trabelsi et al. 2005). In
addition, the cell densities reached using perfusion, semi‐batch and batch cultures were
comparable to those reported by others (Mendonça and Pereira 1998; Petiot et al. 2010b;
Rourou et al. 2007).
At the higher cell densities, cells were growing in multilayers on the microcarriers.
Recently it has been reported that the tumorgenicity of Vero cells is dependent not only
on the passage level as reported previously (Levenbook et al. 1984), but also on the
culture conditions (Manohar et al. 2008). The growth in dense cultures as well as the
adaptation to serum free media may result in the acquisition of a tumorgenic phenotype.
Moreover differences in cell morphology, i.e. the compactness of the monolayer, have
been reported for Vero cell growth in different serum free media (Chen et al. 2011). As
such, tumorgenicity of the Vero cells growing in multilayers in a specific ACF medium
should be investigated before these cells are used to produce clinical materials.
During all cell cultures, sufficient concentrations of glucose and glutamine were present.
At the end of cell culture lactate concentrations were high, up to 36 mM during batch,
approx. 20 mM during semi‐batch and recirculation and 12 mM during perfusion cultures.
Reports of high lactate concentrations during Vero cell growth are abundant when the
carbon source is glucose, see for example Petiot (2010b), and are caused by the overflow
metabolism. High lactate concentrations may be prevented by using other carbon sources
like fructose or galactose (Mendonça and Pereira 1998; Petiot et al. 2010b). The ammonia
concentration was around 1 mM at the end of the cultivations, which is at an acceptable
level that does not inhibit cell growth (Hassell et al. 1991). Since media was not changed

Improved PV yields by cultivation methods
159
prior to virus culture, these lactate and ammonia concentrations were present at virus
infection.
The use of VP‐SFM during cell and virus culture appeared beneficial for virus yields when
compared to cultivation using serum containing medium during cell culture and M199
during virus culture. In earlier studies (Bakker et al. 2011), using the latter media, D‐antigen
levels reported for production at 350‐L scale were 120, 25 and 56 DU mL‐1 for respectively
Sabin poliovirus type 1, 2 and 3. The use of VP‐SFM resulted in a 1.5 times higher level of
antigenic product concentration using batch cultivations and 4 fold when using a
recirculation culture prior to virus infection. It should be noted that here virus cultures
were carried out using spent media. Regarding the nutrient and waste metabolite
concentrations it might be even more beneficial to change the media prior to virus culture
or to feed possible depleted nutrients during virus culture. This type of optimization may
result in a favourable host cell metabolic condition with respect to virus production.
Differences in D‐antigen yield per cell between batch or semi‐batch and perfusion or
recirculation were observed (Figure 5). At higher cell densities the virus yield per cell
decreased. This might be an example of the so‐called “cell density effect” first described
by Wood (Wood et al. 1982) and observed for different virus cultivation systems (Bock et
al. 2011; Chen et al. 2011; Kamen and Henry 2004; Rourou et al. 2007). In several cases
nutrient limitation or the presence of inhibitory factors may have caused this effect (Bock
et al. 2011; Kamen and Henry 2004; Rourou et al. 2007). In others, the cause remains to be
found (Chen et al. 2011; Le Ru et al. 2010). Here, the concentrations of the main nutrients,
glucose and glutamine, and waste products, lactate and ammonia, were at less favourable
levels during batch or semi‐batch, while the highest specific product yields were observed
under these conditions. We thus concluded that these concentrations are less relevant
when compared with other phenomena that influence the cells ability to produce virus.
These other aspects could be the growth rate at virus infection, the presence of
multilayers, or the capacity (surface space) to continue growth after virus infection. Cell
growth rates at time of virus infection were lower under all high cell density strategies
compared to the growth rates observed in batch cultivations and thus do not explain for
the difference in cell specific D‐antigen yield observed between semi‐batch and perfusion
or recirculation cultures. Possibly, the presence of a multilayer has a more important
negative effect. It could be that in a multilayer not all cells present on the microcarrier
support virus replication in the same way. Moreover, the capacity to continue cell growth
at the moment of virus infection may be important as the applied MOI was 0.01 which
means 99% of the cells will not be infected during the first virus replication cycle and can
potentially grow further. These topics are currently under investigation to be able to
further optimize the virus culture at increased cell densities.

Chapter 9
160
The highest virus yields, based on D‐antigen concentrations, were observed using the
recirculation mode for cell culture. At a first glance, to maximize bioreactor capacity, this
seems to be the best choice. However, it should be mentioned that a larger pre‐culture
needs to be prepared as here the cell culture is started at 0.6 × 10⁶ instead of 0.1 × 10⁶ cells
mL‐1 used for the other cell culture strategies. Hence, extending the overall process
throughput time. Further, considering the cell specific D‐antigen productivity, the semi‐
batch cell culture strategy appeared to be a good alternative. In addition, this method can
be applied in existing manufacturing equipment without large investments. At present, we
are optimizing this method with respect to microcarrier concentration, feed frequency and
feed/bioreactor volume ratio. In addition, adaptation of downstream processing to
concentrate and purify the poliovirus obtained from increased cell density cultures is
studied. Focus points are the filter load with cell debris during clarification and
concentration and the removal of the increased concentrations of host cell proteins and
host cell DNA during column chromatography. Also, product quality and immunogenicity
after purification remains to be assessed. In that way, discrimination between intact virus
particles and virus progeny, which may have attributed to the observed increased D‐
antigen levels, can be made.
Conclusions This study shows that adherent Vero cell culture using different methods of medium
refreshment allows higher cell densities. Increased cell densities allowed up to 3 times
higher D‐antigen levels when compared with that obtained from batch‐wise Vero cell
culture. The cell specific D‐antigen production was lower when cells were infected at
higher cell densities. Application of a semi‐batch mode of operations allowed the highest
cell specific D‐antigen production, while 2 fold lower cell specific D‐antigen yields were
found using perfusion or recirculation cultures. This reduction may be related to the
presence of multilayers of cells on the microcarriers, which were observed at higher cell
densities that were reached using perfusion or recirculation mode. In our view, the most
promising concept for polio D‐antigen yield optimization would be semi‐batch cultivations.
This strategy has potential to be further improved and can be implemented in current
manufacturing facilities. Using the here presented method for semi‐batch cell culture and
subsequent virus culture, D‐antigen yields per run can be doubled.
Concluding, the use of increased cell densities can result in more efficient use of bioreactor
capacity, and may so reduce the vaccine cost per dose.

Improved PV yields by cultivation methods
161
Acknowledgements This work was supported by the World Health Organization using funds provided by a
grant from the Bill and Melinda Gates Foundation.


Chapter 10
General discussion
IPV v2.0 − Upgrading the established inactivated
polio vaccine production process

Chapter 10
164
Introduction The current available polio vaccines, introduced in the middle of the 20th century, are
among the most successful and widely used vaccines ever produced (Ehrenfeld et al.
2009). For the 1st inactivated polio vaccine (IPV) preparation, virus production was done in
roller bottles: poliovirus (PV) was propagated on primary monkey testis or kidney tissue in
Medium 199 (Morgan et al. 1950) followed by clarification through centrifugation and
storage at ‐20°C. After thawing, purification was done by centrifugation “until crystal
clear”. The purified PV was pooled and inactivated with formaldehyde resulting in an IPV
(Salk 1953). Later, in the 1960s in Bilthoven, a process was developed based on
microcarrier technology and primary monkey kidney cells (van Wezel 1967). Also, the
purification methods for PV were improved by applying both filtration (for concentration)
and chromatography, to obtain concentrated highly pure PV to be used for the vaccine
formulation (van Wezel et al. 1979). The developed technologies were freely shared with
several pharmaceutical companies (GSK, Sanofi Pasteur, Novartis) and institutes
worldwide (Duchene 2006; Montagnon et al. 1981). From the 1980s onwards, the Vero cell
line was introduced to replace the primary and tertiary monkey kidney cells (Montagnon
and Vincent‐Falquet 1998). Today, at various locations, comparable processes are in
operation for the production of polio (Duchene 2006; Montagnon et al. 1983; Thomassen
et al. 2013b; Vidor et al. 1997) and other viral vaccines (van Wezel et al. 1984; van Wezel et
al. 1978) (Chapter 2).
With the soon anticipated polio eradication, process development studies regarding this
legacy process have been given a boost. Studies on yield optimization aiming at cost price
reduction as well as the use of alternative, more biosafe (for manufacturing), PV are
actual. Here it is discussed how a new IPV production process using attenuated Sabin PV
strains can be setup based on the existing, legacy, IPV production process (Figure 1) with
its roots in the 1960s. Moreover aspects on cost price reduction and the impact of process
optimization on IPV costs are reviewed.
Reviving knowledge on existing manufacturing processes Historical manufacturing data can potentially harbour a wealth of information for process
optimization and enhancement of efficiency and robustness. In Chapter 3, the historical
data from conventional IPV (cIPV) manufacturing using the Vero cell line and wild type
polioviruses has been analysed by multivariate data analysis (MVDA). This approach is
stimulated by the ICH (International Conference on Harmonization) to improve the
scientific understanding of production processes for troubleshooting, and to support
better process control (ICH Q8(R2) 2009; ICH Q9 2005; ICH Q10 2008; ICH Q11 2012). As the
process development for IPV was done decades ago, application of MDVA on the historical
data was also applied to bring manufacturing knowledge up‐to‐date for the current

General discussion
165
process developers. Moreover, it was anticipated that leads for yield optimization would
be unravelled. The results of the analysis were disappointing on the latter which could be
attributed to two factors. First, manufacturing followed strict operating procedures,
according to cGMP guidelines. Therefore, too few critical process parameters were varied,
Figure 1 Process overview currently used for the preparation of a monovalent bulk. Cells are expanded
using two pre‐culture steps prior to cell and virus culture. Purification is done by clarification, concentration, size exclusion chromatography and ion exchange chromatography followed by inactivation. To obtain
trivalent polio vaccine this procedure is followed for each poliovirus type separately prior to mixing for end
product formulation.
1 pre-culturest
2 pre-culturend
trypsinization
trypsinization
cell culture
virus culture
clarification
concentration
size exclusionchromatographysize exclusion
chromatography
ion exchangechromatography
inactivation
intermediatefiltration
intermediatefiltration
inactivationcontinued
inactivationcontinued
storage
process time (weeks)0 1 2 3 4 5

Chapter 10
166
mostly as a result of (planned) process deviations, to indicate directions for yield
optimization. Second, the used product analytical methods, virus titers by tissue culture
infective dose and D‐antigen ELISA, had a relative high variation compared to the yield
variations (Chapter 3). Operating conditions of batches with high product yields could thus
not be identified. The MVDA did however allow robustness analysis, assessment of the
impact of equipment change and identification of batches deviating from the normal.
Knowledge on the existing production process for the current process developers was,
however, revived. Not only the analysis but also the data acquisition itself gave an impulse
on the process knowledge. Within the exercise, many aspects of manufacturing were
disclosed; from the type of measurements done at each processing step to the variation in
them; and the process changes and deviations that have occurred to the choices that were
made in the past. Follow ups on the MVDA include improvement of analytics (Chapter 4)
and introduction of Shewhart control charts, at manufacturing, to closely follow the
identified critical production parameters.
Scale‐down models for new process developments Based on the data acquired during the MVDA a lab‐scale model representing the
manufacturing process was setup. Following the guidelines for scale‐down, selections on
equipment and operational setting were made resulting in a full set of unit operations
required to make monovalent bulks for IPV (Chapter 5). A perfect scale‐down model is one
that not only operates comparably to manufacturing at setpoint but one where the
response of changes of key operating parameters is similar (Rathore et al. 2005b). This
means that when new operating conditions are selected at lab‐scale they can be directly
translated to production scale resulting is a similar process. Due to the unavailability of
data at large scale, the scale‐down model could only be made at setpoints. This is a
common problem in industrial settings as performing the necessary experiments at large‐
scale is too expensive. The development of a full scale‐down model should be an iterative
process where deviations occurring at manufacturing scale are mimicked at lab‐scale (Li et
al. 2006). The scale‐down model can subsequently be tweaked based on the newly
available data. With the scale‐down model set, process development is up to current
standards and can accommodate IPV related manufacturing questions and changes to
support the drug master file.
In parallel, the scale‐down model also can be used as a platform to develop similar vaccine
production processes with a higher success rate as scale‐up is more straightforward
because the large scale counterparts already exists. Both the upstream processing (USP)
unit operations, which are in place for adherent Vero cell culture, as the downstream
processing (DSP) unit operations representing normal and tangential flow filtrations as

General discussion
167
well as chromatography units are valuable for new development projects. One can think of
the process development of alternative IPV, either based on the attenuated Sabin strains
(Chapter 7) or newly designed attenuated PV (Macadam et al. 2006; Mueller et al. 2006;
Vignuzzi et al. 2008). As Vero cells are susceptible to a whole range of viruses, other
vaccine production processes based on Vero cells may also be developed using the
available scale‐down model. Among the viruses Vero cells are susceptible to are
Flaviviridae (Dengue, Yellow Fever, West Nile or Japanese Encephalitis) Rhabdoviridae
(Rabies), Reoviridae (Rotavirus), Rubiviridae (Rubella) or Paramyxoviridae (Measles or
Respiratory Syncytial virus). The production process for rabies vaccine for instance closely
resembles the IPV production process. To prepare rabies vaccine, the virus is propagated
on Vero cells, concentrated, inactivated and purified by chromatography using the DEAE‐
sepharose CL‐6B resin (Prem Kumar et al. 2005).
Viruses can be very diverse; they come in all shapes and sizes (up to 1 µm (Philippe et al.
2013)), can have different types of genetic material and can be enveloped or non‐
enveloped. Resulting, the chosen DSP methods for virus purification in production
processes are very different. Often, for the initial purification of viruses, the preferred unit
operation is gradient centrifugation, mostly using sucrose gradients. This method is
chosen as it is reasonably straightforward with a high success rate. Using gradient
centrifugation offers the availability of purified virus which is necessary for
characterization, aiding in selection of other possible purification methods, and assay
development, required both for the studies on process development as defining release
criteria and development of QC tests. While gradient centrifugation can be done batch
wise, the use of continuous gradient centrifugation is favoured at large scale. To further
be able to quickly design an initial (proof‐of–concept) vaccine production process the
available scale‐down unit operations should be expanded with a continuous centrifugal
unit operation for gradient centrifugation that is readily scalable to manufacturing. This
addition would provide a full platform to accommodate the development of new vaccine
production processes within a limited time frame.
IPV v2.0 – Yield A new IPV (v2.0), from attenuated Sabin strains (referred to as sIPV), was produced at
manufacturing scale based on the existing cIPV process (Chapter 7). The chosen timelines
were such that only limited process development, after an initial proof of principle study,
could be done prior to the production of clinical lots. Studies focused on i) virus cultivation
conditions: the multiplicity of infection and the temperature; and ii) the selection of the
ion exchange chromatography (IEX) resin combined with a lower molarity of the elution
buffer. Although research prior to manufacturing was limited we were surprised with the
low yields that were observed for Sabin PV type 2. These low yields were mainly attributed

Chapter 10
168
to low recoveries during purification. The lowest recovery was found during IEX. While for
Sabin PV type 1 and 3 high recoveries were observed (99.5%), for Sabin PV type 2 only 28%
of the product was retrieved (Chapter 7).
To explain the differences in the observed recoveries follow‐up studies were based on
product characterization. A method to determine the isoelectric point (pI), the pH value at
which the net charge on the molecule is zero, for polioviruses was setup (Chapter 8) since
IEX is a process based on the charge of the molecules passing through a charged matrix.
The difference in the products pI and the pH conditions during processing is pivotal. When
the pH is similar to the pI the product will aggregate. Moreover the IEX column is chosen
to bind negatively charged molecules while the PV flows through. The pI of Sabin PV type 2
was determined to be 7.2. During chromatography a pH of 7.0 is used both to equilibrate
the column as for the elution buffer. The small difference in the pI of Sabin PV type 2 with
the buffer pH could have resulted in aggregation of the PV. This aggregation will result in
product losses during the chromatography. In addition, unwanted product binding was
observed for Sabin PV type 2. This is related to the aggregation; self‐aggregated PV is
strongly negatively charged (Vrijsen et al. 1983) and thus binds to the positively charged
IEX resin. While PV‐resin binding may be expected for Sabin PV type 3, with a pI of 6.3 thus
resulting in a PV with a weak negative charge as pH> pI it was only observed for Sabin PV
type 2. Remarkably all wild type PV also are weakly negatively charged during IEX (pIs were
6.2, 6.7 and 5.8 for type 1, 2 and 3 respectively) and no product‐matrix interactions have
been observed in the past. It therefore seems that the main cause for the low recoveries
of Sabin PV type 2 is self‐aggregation. Optimization of the purification should be focused
on preventing the aggregation. In addition, the downstream processing for the three
serotypes of sIPV may need to be optimized for the serotypes individually resulting in virus
specific production settings.
When the new viruses had been better characterized prior to process development and
full scale manufacturing the low yields for Sabin PV type 2 probably would have been
predicted. Product characterization especially related to physical features like size, pI,
hydrophobicity or density, but also quality (or potency) aspects, is essential for process
development and should go hand in hand with process development.
IPV v2.0 – Biosafety and Immunogenicity goals The prepared clinical lots met all release criteria and despite the low yields discussed in the
previous paragraph sufficient material was prepared for phase I clinical studies. Pre‐clinical
studies with sIPV were done to assess vaccine safety and vaccine immunogenicity. These
studies using animal models are required prior to studies in human. The repeated dose and
local tolerance toxicity in rabbits showed vaccine safety was comparable to cIPV.

General discussion
169
Furthermore, the studies on immunogenicity illustrated that sIPV can elicit an immune
response comparable to cIPV (Chapter 7). Recently, the corresponding phase I study in
healthy male adults (first in human) has been reported (Verdijk et al. 2013). The study was
done to assess vaccine safety and tolerability (local and systemic reactions) upon
intramuscular injection with sIPV or adjuvanted sIPV. Reported side effects were mild or
moderate and transient. This is comparable to the side effects observed when vaccinated
with cIPV. Moreover, in all subjects, an increase in antibody titer for all types of poliovirus
(both Sabin and wild type strains) was observed 28 days after vaccination. sIPV as a
booster dose was equally immunogenic as cIPV (Verdijk et al. 2013). The follow up studies,
phase II/III, which are required prior to market introduction will be done after technology
transfer to partners in low‐ and middle income countries. The essential process
optimizations to obtain an economically feasible process (see below) can be implemented
prior to these studies.
While vaccine safety is pivotal, the development of an sIPV was done to increase biosafety
during the production process. Although Sabin PV are attenuated viruses, they are
genetically unstable and may revert to infectious PV which possess the same
neurovirulence and transmission properties as wild‐type PV. Regarding the production
process, this might occur during virus culture where new PV are produced (Taffs et al.
1995). To minimize the mutations in the Sabin PV during virus cultures, virus seed lots
closest possible to the Sabin original were prepared (Chapter 2). In addition, a low virus
culture temperature has been applied (Chapter 2 & 7). Genetic stability of the virus seed
lots has been assessed by the monkey neurovirulence test, the so‐called golden standard,
as well as by RCT40 (reproductive capacity at. 40˚C) and MAPREC (mutant analysis by PCR
and restriction enzyme cleavage). The genetic stability of the PV obtained after virus
culture during the production of monovalent bulk has been assessed by RCT40 and
MAPREC. All tests results were within specification concluding that the production process
was biosafe. These results show that the upgrade form cIPV to sIPV was successful in
terms of biosafety and product quality.
How affordable is IPV v2.0? The reason to develop an IPV v2.0 was not only to have a more biosafe production process
but to have an IPV which would be affordable for low‐ and middle income countries.
Current cIPV cost prices range from $2.25 to $4.14 per dose (Unicef 2012). A cost analysis
using the BioSolve software (v3.0) (Biopharm Services Ltd., Chesham, UK) for the sIPV was
performed.
BioSolve is an Excel‐based tool with which the cost of good based on the overheads of the
facility and the operating costs of the process can be calculated. The facility overhead

Chapter 10
170
consists of capital charges, taxes, and insurance. The operating costs of the process are
the direct costs and include materials, labour, and waste management. The cost model is
defined by describing a process definition including for example USP and DSP unit
operations, process scale (equipment sizing), product titer, resource allocation. A cost
database, which is built with data consisting of benchmarking information of among
others equipment and materials, is coupled to calculate costs for the process. Together
with the required utilities the manufacturing cost of goods can be determined.
The complete sIPV manufacturing process (Figure 1) was described to calculate the
manufacturing costs per dose, assess the costs drivers, and identify targets for cost price
reduction. Prior to analysis of the calculated manufacturing costs for sIPV the cost model
was justified using data on cIPV manufacturing at 2×1,000‐L bioreactor scale (based on
data from chapter 5). The calculated cost of goods were in good agreement with those
reported recently (Lopes et al. 2013). It was subsequently concluded that the model was
correct and suitable to analyse the manufacturing costs for sIPV produced at 700‐L scale
(2×350‐L bioreactors). As expected, based on the relatively low recoveries for Sabin PV
type 2, the calculated costs of goods of sIPV indicate the requirement for process
optimizations to reduce the costs of goods for a more cost competitive sIPV product.
To assess the main cost drivers for this process a cost breakdown was worked out. The
cost breakdown was done using the following categories: i) capital; ii) materials; iii) labour;
and iv) other. Capital costs were estimated based on the installed process, both unit
operations as required containers, and general equipment that was used. In addition the
costs for a new to build cGMP facility, its installations and validation were taken along.
Material costs include for example media costs based on in house media preparation and
listings for the primary raw materials in addition to costs for filters and reusable
chromatography resins. A labour headcount was estimated based on the allocated time
for batch productions. Also labour costs for logistics and QC, QA were included. Other
costs reflect costs for waste management, maintenance and utilities. The cost breakdown
for Sabin PV type 2 monovalent bulk production is depicted in Figure 2. Calculations for the
production of type 1 and 3 monovalent bulks resulted in a similar cost breakdown.
A major part of the manufacturing costs could be attributed to capital. The relative
contribution of capital investment can be lowered by increasing the production scale (here
2×350‐L bioreactors). This will also lower relative contribution of the costs for labour. The
most important target for manufacturing cost reduction however, is the low recovery for
Sabin PV type 2. In addition, optimization of the USP, i.e. cell and virus culture, to increase
product titers also will lower the cost price.

General discussion
171
Figure 2. Cost breakdown of manufacturing costs for the production of Sabin PV type 2 monovalent bulk. Largest costs are represented by capital. Media costs (here serum containing cell culture media) attribute
approximately 5% of total costs.
IPV v2.x: Cost price reduction On several aspects of the production process improvements can be envisaged. To increase
the yield of the total production process both an increase in PV, or D‐antigen units, per
bioreactor volume as well as reduction of the losses during purification can be tackled. In
chapter 9, optimization of the cell and virus culture is described. Several cell culture
methods, batch, semi‐batch, perfusion and recirculation, have been tested for their
capacity on increased cell numbers and the impact on the virus yields have been assessed.
In addition, these studies have been carried out using an animal component free (ACF)
medium for both the cell and the virus culture. The use of an animal component free
medium in the standard batch cultivation could increase the PV yield approximately 1.5
times (Chapter 9). Alternative cell culture methods to obtain high cell density cultures
resulted in an even higher product yields up to 3 times (Chapter 9). While the highest PV
yield was obtained with a cell culture in recirculation mode, it was considered not the most
practical method at large scale. The semi‐batch cell culture using ACF media was selected
as the most appropriate method to apply during cell culture to increase PV yields.
Using the developed cost model, the implication of the introduction of ACF media and/or
semi‐batch cultivations on the sIPV manufacturing costs (at 2×350‐L scale) was calculated.
In Figure 3, the cost reduction compared to the base case described in the previous
paragraph is illustrated. The manufacturing costs can be reduced at least by a factor 2 by
Capital
Labour
Other
Materials
Media
OtherMaterials

Chapter 10
172
changing the cell culture process to a semi‐batch culture and using ACF media for cell and
virus culture. Other process optimizations should focus on reducing the losses during DSP.
Assuming these process optimizations would result in DSP recoveries comparable to cIPV
figures the costs of sIPV can be further lowered. With these manufacturing costs, sIPV
would be more than cost‐competitive. In view of the costs breakdown (Figure 2) reduction
of the relative contribution of capital and labour by process scale‐up should be considered.
A feasible scale for cell – and virus culture would be 1,000‐L bioreactors (Montagnon et al.
1983). Increasing the scale to 2×1,000‐L bioreactors nearly halves the manufacturing costs
for the USP and DSP optimized process. Even the use of bioreactors up to 6,000‐L has
been described for Vero cell culture (Barrett et al. 2009) meaning further scale‐up can be
considered. In Figure 4, the cost breakdown for this 2×1000‐L optimized process is given.
As can be seen the contribution of both capital and labour is greatly reduced. Main costs
for the preparation of monovalent bulks can now be found in the materials, in which 22%
are medium costs.
Figure 3. Relative cost of goods for sIPV (at a formulation of plain 10/16/32 DU shd‐1 for PV type 1, 2 and 3 respectively), corresponding with different production scenarios.
sIP
V C
ost
of g
oo
ds
(arb
itra
ry u
nits
)
Base case2×350-L
ACFbatch
2×350-L
ACFsemi-batch
2×350-L
Optimized DSPACF
semi-batch2×350-L
Optimized DSPACF
semi-batch2×1,000-L

General discussion
173
Figure 4. Cost breakdown of manufacturing costs for the production of Sabin PV type 2 monovalent bulk (at
2×1,000‐L scale) using the optimized USP (ACF and semi‐batch) and DSP process. Largest costs are represented by materials. Media costs contribute 22% of total costs.
Manufacturing costs of sIPV may be further reduced when manufacturing is located in
low‐ and middle income countries. In addition, facility debottlenecking may increase
amount of batches that can be produced in a year and so reduce costs. Unit operations
that currently have the longest operation time are inactivation and cell and virus culture
(Figure 1). Inactivation can easily be done in parallel with other processes. Acquisition of an
additional production line for cell and virus culture would optimize the use of the
downstream unit operations and so increase the annual facility output. More drastically
would be a change in the cell line used for virus production. The use of single cell
suspension cell lines may allow for the use of technologies (e.g. perfusion systems) that
support increased cell densities. Recently, virus (wild‐type) yields obtained on Per.C6 cells
have been published to be on average 30‐fold higher compared to the yields on Vero cells
(Sanders et al. 2013). While these data seem promising, the impact of introducing another
cell line than the established Vero cell line will bring about technical, cost‐ and time‐
consuming challenges as the Per.C6 cell line is not used in an approved vaccine production
process.
Other ways of cost reduction for IPV immunization can be found formulation and delivery.
The current sIPV is dosed at 10/16/32 DU shd‐1. Vaccine formulations with a lower D‐antigen
content may results in comparable protective immune response. Whether this is feasible
needs to be tested in clinical studies. Alternatively this lower D‐antigen content may be
adjuvated with for instance aluminium (Al(OH)3) (Chapter 7, (Verdijk et al. 2013)),
Capital
Labour
Other
Materials
Media
OtherMaterials

Chapter 10
174
monophosphoryl lipid A (MPLA) or oil in water emulsions (e.g. EM030 or SWE02) (Westdijk
et al. 2013) to induce a protective immune response.
Instead of a standalone IPV, IPV could also be combined in vaccine formulations. For
instance when in a hexavalent vaccine (DTP‐HepB‐Hib‐IPV; diphtheria, tetanus, pertussis,
hepatitis B, Haemophilus influenzae b, and IPV) together with the other necessary
childhood vaccines, costs for administration due to fewer injections (reduce in cold chain
costs, syringes, waste management) will go down (Venczel et al. 2009). Moreover, often
these combination vaccines make use of adjuvants which in turn might allow the IPV
antigen content to be reduced.
A last cost reduction with respect to formulation is the use of multi‐dose (for instance 5 or
10 doses) instead of the single‐dose vials. Multi‐dose vaccine formats can lower
production, medical waste disposal, and storage costs per vaccinated individual but may
cause clinic‐level vaccine wastage or safety issues. In high patient demands, as is realistic
with childhood vaccinations, a greater dose is favored with respect to costs (Lee et al.
2010).
Recently studies on intradermal delivery of fractional or reduced doses, i.e. administering a
smaller volume of the existing formulation, of cIPV were done (Resik et al. 2010; Resik et
al. 2013). The feasibility of fractional doses (1/5th) of cIPV given intradermally as an antigen‐
sparing strategy could be demonstrated (Resik et al. 2010). Moreover, it was shown that
intradermal administration of a single fractional (1/5th) dose cIPV might be used for priming
(Resik et al. 2013). Altogether, it can be said that many different approaches can be
followed next to process optimizations to reduce the costs of cIPV and the new, biosafer
sIPV.
Currently the technology of the base case sIPV manufacturing is transferred to
manufacturers in low‐ and middle income countries. Depending on their preferred time to
market as well as the economic risks they may be willing to take, a selection of the most
appropriate method for cost price reduction to have a cost competitive sIPV product
needs to be made.
Acknowledgements I thank Ramona Ursache for the cost calculations.


References

References
178
A
B
Agol VI. 2006. Vaccine‐derived polioviruses. Biologicals 34(2):103‐108.
Alvarez ME, O'Brien RT. 1982. Mechanisms of inactivation of poliovirus by chlorine dioxide
and iodine. Appl. Environ. Microbiol. 44(5):1064‐1071.
Aylward B, Tangermann R. 2011. The global polio eradication initiative: Lessons learned and
prospects for success. Vaccine 29, Supplement 4:D80‐D85.
Aylward BR, Sutter RW, Cochi SL, Thompson KM, Jafari H, Heymann D. 2006. Risk
Management in a Polio‐Free World. Risk Anal. 26(6):1441‐1448.
Baca‐Estrada M, Griffiths E. 2006. Regulation and standardization of IPV and IPV
combination vaccines. Biologicals 34(2):159‐61.
Bakker WAM, Thomassen YE, van der Pol LA. 2010. Scale‐down approach for animal‐free
polio vaccine production. In: Noll T, editor. Cells and Culture; Proceedings of the 20th
ESACT Meeting, Dresden, Germany, June 17‐20, 2007: Springer Netherlands. p 541‐
550.
Bakker WAM, Thomassen YE, van 't Oever AG, Westdijk J, van Oijen MGCT, Sundermann
LC, van 't Veld P, Sleeman E, van Nimwegen FW, Hamidi A and others. 2011.
Inactivated Polio Vaccine development for technology transfer using attenuated
Sabin poliovirus strains to shift from Salk‐IPV to Sabin‐IPV. Vaccine 29(41):7188‐7196.
Bakker WAM, Thomassen YE, ’t Oever AG, Westdijk J, Oijen MGCT, Kersten GFA, Pol LA,
Hertroys R, Heuvel N, Hendriks J. 2012. Development of Inactivated Polio Vaccine
(IPV) Derived from Attenuated Sabin Strains. Proceedings of the 21st Annual Meeting
of the European Society for Animal Cell Technology (ESACT), Dublin, Ireland, June 7‐
10, 2009. In: Jenkins N, Barron N, Alves P, editors: Springer Netherlands. p 667‐670.
Barrett PN, Mundt W, Kistner O, Howard MK. 2009. Vero cell platform in vaccine
production: moving towards cell culture‐based viral vaccines. Expert Rev. Vaccines
8(5):607‐618.
Beale AJ, Ungar J. 1962. Potency and stability of combined pertussis, diphtheria, tetanus,
and poliomyelitis (quadruple) vaccine. The Lancet 280(7260):805‐808.
Bengtsson S, Philipson L, Persson H, Laurent TC. 1964. The basis for the interaction
between attenuated poliovirus and polyions. Virology 24:617‐625.
Blüml G. 2007. Microcarrier Cell Culture Technology. In: Pörtner R, editor. Animal Cell
Biotechnology: Humana Press. p 149‐178.
Bock A, Schulze‐Horsel J, Schwarzer J, Rapp E, Genzel Y, Reichl U. 2011. High‐density
microcarrier cell cultures for influenza virus production. Biotechnol. Prog. 27(1):241‐
250.

References
179
C
Bodian D. 1951. Immunologic classification of poliomyelitis viruses. I. A cooperative
program for the typing of one hundred strains. Am. J. Hyg. 54(2):191‐204.
Brioen P, Rombaut B, Boeye A. 1985. Hit‐and‐run neutralization of poliovirus. J. Gen. Virol.
66 ( Pt 11):2495‐2499.
Brown DAR, Jones PN, Middleton JC, Papadopoulos G, Arik EB. 2004. Experimental
methods. In: Paul EL, Atiemo‐Obeng VA, Kresta SM, editors. Handbook of industrial
mixing:science and practice. Hoboken: John Wiley & Sons. p 145‐201.
Butler M, Medlen AR, Taylor GR. 1985. Electrofocussing of viruses and sensitivity to
disinfection. Water Sci. Technol. 17:201‐210.
Cello J, Paul AV, Wimmer E. 2002. Chemical synthesis of poliovirus cDNA: generation of
infectious virus in the absence of natural template. Science 297(5583):1016‐1018.
Charaniya S, Hu WS, Karypis G. 2008. Mining bioprocess data: opportunities and
challenges. Trends Biotechnol. 26(12):690‐699.
Charney J, Machlowitz R, Tytell AA, Sagin JF, Spicer DS. 1961. The concentration and
purification of poliomyelitis virus by the use of nucleic acid purification. Virology
15:269‐280.
Chaudet N, Roze D, Guillaume JM, Jourdat C. Single‐use bioreactor for high density
bacterial fermentation: evaluation of the CELL‐tainer bioreactor; 2011 in: RPP‐6
Conference 16‐19 February 2011; Vienna, Austria.
Chen A, Poh SL, Dietzsch C, Roethl E, Yan ML, Ng SK. 2011. Serum‐free microcarrier based
production of replication deficient influenza vaccine candidate virus lacking NS1 using
Vero cells. BMC Biotechnol 11:81.
Chen TR. 1988. Re‐evaluation of HeLa, HeLa S3, and HEp‐2 karyotypes. Cytogenet. Cell
Genet. 48(1):19‐24.
Chumakov K, Ehrenfeld E. 2008. New generation of inactivated poliovirus vaccines for
universal immunization after eradication of poliomyelitis. Clin. Infect. Dis. 47(12):1587‐
1592.
Coleman MC, Buck KK, Block DE. 2003. An integrated approach to optimization of
Escherichia coli fermentations using historical data. Biotechnol. Bioeng. 84(3):274‐
285.
Colla La P, Marcialis MA, Mereu GP, Loddo B. 1972. Behaviour of a guanidine‐dependent
strain of poliovirus 1 in sucrose density and pH gradients. Experientia 28(9):1115‐1117.
Croughan MS, Hamel JF, Wang DI. 2006. Hydrodynamic effects on animal cells grown in
microcarrier cultures. 1987. Biotechnol. Bioeng. 95(2):295‐305.
Crowe BA, Brühl P, Gerencer M, Schwendinger MG, Pilz A, Kistner O, Koelling‐Schlebusch
K, Aichinger G, Singer J, Zeitlinger M and others. 2010. Evaluation of the cellular

References
180
D
E
immune responses induced by a non‐adjuvanted inactivated whole virus
A/H5N1/VN/1203 pandemic influenza vaccine in humans. Vaccine 29(2):166‐173.
Cruz HJ, Moreira JL, Carrondo MJT. 2000. Metabolically optimised BHK cell fed‐batch
cultures. J. Biotechnol. 80(2):109‐118.
Cunha CC, Glassey J, Montague GA, Albert S, Mohan P. 2002. An assessment of seed
quality and its influence on productivity estimation in an industrial antibiotic
fermentation. Biotechnol. Bioeng. 78(6):658‐669.
De Jesus NH. 2007. Epidemics to eradication: the modern history of poliomyelitis. Virol. J.
4:70.
Doi Y, Abe S, Yamamoto H, Horie H, Ohyama H, Satoh K, Tano Y, Ota Y, Miyazawa M,
Wakabayashi K and others. 2001. Progress with inactivated poliovirus vaccines
derived from the Sabin strains. Dev. Biol. (Basel) 105:163‐169.
Dragunsky EM, Ivanov AP, Wells VR, Ivshina AV, Rezapkin GV, Abe S, Potapova SG,
Enterline JC, Hashizume S, Chumakov KM. 2004. Evaluation of immunogenicity and
protective properties of inactivated poliovirus vaccines: a new surrogate method for
predicting vaccine efficacy. J. Infect. Dis. 190(8):1404‐1412.
Duchene M, Peetermans J, D'Hondt E, Harford N, Fabry L, Stephenne J. 1990. Production
of poliovirus vaccines: past, present, and future. Viral Immunol. 3(4):243‐72.
Duchene M. 2006. Production, testing and perspectives of IPV and IPV combination
vaccines: GSK biologicals' view. Biologicals 34(2):163‐166.
Eggers HJ, Rosenwirth B. 1988. Isolation and characterization of an arildone‐resistant
poliovirus 2 mutant with an altered capsid protein VP1. Antiviral Res. 9(1‐2):23‐35.
Ehrenfeld E, Modlin J, Chumakov K. 2009. Future of polio vaccines. Expert Rev. Vaccines.
8(7):899‐905.
Eibl R, Kaiser S, Lombriser R, Eibl D. 2010. Disposable bioreactors: the current state‐of‐the‐
art and recommended applications in biotechnology. Appl. Microbiol. Biotechnol.
86(1):41‐49.
Emini EA, Kao SY, Lewis AJ, Crainic R, Wimmer E. 1983. Functional basis of poliovirus
neutralization determined with monospecific neutralizing antibodies. J. Virol.
46(2):466‐474.
European agency for the evaluation of Medicinal products/Committee for Proprietary
Medicinal Products (EMA/CPMP). 1998. Note for guidance on preclinical
pharmacological and toxicological testing of vaccines (CPMP/SWP/465/95, June
1998).

References
181
F
G
European Pharmacopoeia 6.7 2009 Monograph 0214. Poliomeylitis Vaccine (Inactivated).
Strasbourg, France
European Pharmacopoeia 6.3 2009 Monograph 0153. Vaccines for human use. Strasbourg,
France.
European Pharmacopoeia 7.0 2010 Monograph 0214. Poliomeylitis Vaccine (Inactivated).
Strasbourg, France.
European Pharmacopoeia 7.0. 2011 Monograph 20616. Tests for extraneous agents in viral
vaccines for human use. Strasbourg, France.
Findlay JW, Dillard RF. 2007. Appropriate calibration curve fitting in ligand binding assays.
AAPS J 9(2):E260‐267.
Floyd R, Sharp DG. 1978a. Viral aggregation: effects of salts on the aggregation of
poliovirus and reovirus at low pH. Appl. Environ. Microbiol. 35(6):1084‐1094.
Floyd R, Sharp DG. 1978b. Viral aggregation: quantitation and kinetics of the aggregation
of poliovirus and reovirus. Appl. Environ. Microbiol. 35(6):1079‐1083.
Floyd R, Sharp DG. 1979. Viral aggregation: buffer effects in the aggregation of poliovirus
and reovirus at low and high pH. Appl. Environ. Microbiol. 38(3):395‐401.
Food and Drug Administration. 2001. Guidance for industry. Statistical approaches to
establishing bioequivalence. Rockville, MD.
Food and Drug Administration. 2004. Guidance for Industry PAT—A framework for
innovative pharmaceutical development, manufacturing, and quality assurance.
Available from: http://www.fda.gov/downloads/Drugs/GuidanceComplianceRegulato
ryInformation/Guidances/UCM070305.pdf [accessed 01.10.2009].
Friede M, Serdobova I, Palkonyay L, Kieny MP. 2009. Technology transfer hub for
pandemic influenza vaccine. Vaccine 27(5):631‐632.
Gabrielsson J, Lindberg N‐O, Lundstedt T. 2002. Multivariate methods in pharmaceutical
applications. J. Chemometrics 16(3):141‐160.
Garnier A, Cote J, Nadeau I, Kamen A, Massie B. 1994. Scale‐up of the adenovirus
expression system for the production of recombinant protein in human 293S cells.
Cytotechnology 15(1‐3):145‐155.
Genzel Y, Dietzsch C, Rapp E, Schwarzer J, Reichl U. 2010. MDCK and Vero cells for
influenza virus vaccine production: a one‐to‐one comparison up to lab‐scale
bioreactor cultivation. Appl. Microbiol. Biotechnol. 88(2):461‐475.
Glacken MW, Fleischaker RJ, Sinskey AJ. 1986. Reduction of waste product excretion via
nutrient control: Possible strategies for maximizing product and cell yields on serum
in cultures of mammalian cells. Biotechnol. Bioeng. 28(9):1376‐1389.

References
182
H
Glazyrina J, Materne EM, Dreher T, Storm D, Junne S, Adams T, Greller G, Neubauer P.
2010. High cell density cultivation and recombinant protein production with
Escherichia coli in a rocking‐motion‐type bioreactor. Microb. Cell Fact. 9:42‐53.
Gnoth S, Jenzsch M, Simutis R, Lubbert A. 2007. Process Analytical Technology (PAT):
batch‐to‐batch reproducibility of fermentation processes by robust process
operational design and control. J. Biotechnol. 132(2):180‐186.
Godavarti R, Petrone J, Robinson J, Wright R, Kelly BD. 2005. Scale‐down models for
purification processes: approaches and applications. In: Rathore AS, Sofer G, editors.
Process validation in manufacturing of biopharmaceuticals: guidelines, current
practices, and industrial case studies: CRC Press.
Goodridge L, Goodridge C, Wu J, Griffiths M, Pawliszyn J. 2004. Isoelectric point
determination of norovirus virus‐like particles by capillary isoelectric focusing with
whole column imaging detection. Anal. Chem. 76(1):48‐52.
Gunther JC, Conner JS, Seborg DE. 2007. Fault detection and diagnosis in an industrial fed‐
batch cell culture process. Biotechnol. Prog. 23(4):851‐857.
Hadler SC, Dietz V, Okwe‐Bele JM, Cutts FT. 2008. Immunization in developing countries.
In: Plotkin SA, Orenstein WA, Offit PA, editors. Vaccines. 5 ed. Philidelphia: WB
Saunders. p 1541‐1572.
Hanson MA, Brorson KA, Moreira AR, Rao G. 2009. Comparisons of optically monitored
small‐scale stirred tank vessels to optically controlled disposable bag bioreactors.
Microb. Cell Fact. 8:8‐44.
Hassell T, Gleave S, Butler M. 1991. Growth inhibition in animal cell culture. The effect of
lactate and ammonia. Appl. Biochem. Biotechnol. 30(1):29‐41.
Heinsbroek E, Ruitenberg EJ. 2010. The global introduction of inactivated polio vaccine can
circumvent the oral polio vaccine paradox. Vaccine 28(22):3778‐3783.
Heymann DL, Sutter RW, Aylward RB. 2005. A global call for new polio vaccines. Nature
434(7034):699‐700.
Hickling J JR, Nundy N. 2010. Improving the affordability of inactivated poliovirus vaccines
(IPV) for use in low‐ and middle‐income countries—an economic analysis of
strategies to reduce the cost of routine IPV immunization. PATH and Working in
Tandem report. Available from: www.polioeradication.org/content/publications
/TS_IPV_econ_analysis.pdf [accessed: 04.10.2010]
Hjertén S, Zhu M‐d. 1985. Adaptation of the equipment for high‐performance
electrophoresis to isoelectric focusing. J. Chromatogr. A 346:265‐270.

References
183
I
J
Hjertén S, Liao JL, Yao KQ. 1987. Theoretical and experimental study of high‐performance
electrophoretic mobilization of isoelectrically focused protein zones. J. Chromatogr.
387:127‐138.
Hogle JM, Chow M, Filman DJ. 1985. Three‐dimensional structure of poliovirus at 2.9 A
resolution. Science 229(4720):1358‐1365.
Hong HA, Ke NT, Nhon TN, Thinh ND, van der Gun JW, Hendriks JT, Kreeftenberg JG. 1996.
Validation of the combined toxin‐binding inhibition test for determination of
neutralizing antibodies against tetanus and diphtheria toxins in a vaccine field study
in Viet Nam. Bull. World Health Organ. 74(3):275‐282.
Huang H, Yi X, Zhang Y. 2006. Improvement of Vero cell growth in glutamate‐based culture
by supplementing ammoniagenic compounds. Process Biochem. 41(12):2386‐2392.
ICH Q8(R2). 2009. Harmonized tripartite guideline on pharmaceutical development.
Available from: http://www.ich.org/fileadmin/Public_Web_Site/ICH_Products/Guideli
nes/Quality/Q8_R1/Step4/Q8_R2_Guideline.pdf [accessed 04.10.2010]
ICH Q9. 2005. Harmonized tripartite guideline on quality risk management. Available from:
http://www.ich.org/fileadmin/Public_Web_Site/ICH_Products/Guidelines/Quality/Q9/
Step4/Q9_Guideline.pdf [accessed 04.10.2010]
ICH Q10. 2008. Harmonized tripartite guideline on pharmaceutical quality system. Available
from: http://www.ich.org/fileadmin/Public_Web_Site/ICH_Products/Guidelines/
Quality/Q10/Step4/Q10_Guideline.pdf [accessed 04.10.2010]
ICH Q11. 2012. Harmonized tripartite guideline on development and manufacture of drug
substances (chemical entities and biotechnological/biological entities). Available
from: http://www.ich.org/products/guidelines/quality/article/quality‐guidelines.html
[accessed 04.10.2013]
Jadhav S, Datla M, Kreeftenberg H, Hendriks J. 2008. The Developing Countries Vaccine
Manufacturers' Network (DCVMN) is a critical constituency to ensure access to
vaccines in developing countries. Vaccine 26(13):1611‐1615.
Jiang SD, Pye D, Cox JC. 1986. Inactivation of poliovirus with beta‐propiolactone. J. Biol.
Stand. 14(2):103‐109.
John J. 2009. Role of injectable and oral polio vaccines in polio eradication. Expert Rev
Vaccines 8(1):5‐8.

References
184
K
L
Kamen A, Henry O. 2004. Development and optimization of an adenovirus production
process. J. Gene Med. 6(S1):S184‐S192.
Kersten G, Hazendonk T, Beuvery C. 1999. Antigenic and immunogenic properties of
inactivated polio vaccine made from Sabin strains. Vaccine 17(15‐16):2059‐2066.
Kew OM, Sutter RW, de Gourville EM, Dowdle WR, Pallansch MA. 2005. Vaccine‐derived
polioviruses and the endgame strategy for global polio eradication. Ann. Rev.
Microbiol. 59(1):587‐635.
Kirdar AO, Conner JS, Baclaski J, Rathore AS. 2007. Application of Multivariate Analysis
toward Biotech Processes: Case Study of a Cell‐Culture Unit Operation. Biotechnol.
Prog. 23(1):61‐67.
Kirdar AO, Green KD, Rathore AS. 2008. Application of Multivariate Data Analysis for
Identification and Successful Resolution of a Root Cause for a Bioprocessing
Application. Biotechnol. Prog. 24(3):720‐726.
Koch F, Koch G. 1985. The molecular biology of poliovirus. Wien: Springer‐Verlag.
Korant BD, Lonberg‐Holm K. 1974. Zonal electrophoresis and isoelectric focusing of
proteins and virus particles in density gradients of small volume. Anal. Biochem.
59(1):75‐82.
Kourti T. 2004. Process analytical technology and multivariate statistical process control.
Part 1. Process Anal. Technol. 1:13‐19.
Kreeftenberg H, van der Velden T, Kersten G, van der Heuvel N, de Bruijn M. 2006.
Technology transfer of Sabin‐IPV to new developing country markets. Biologicals
34(2):155‐158.
Kreeftenberg H, Hamidi A. 2007. Annex 5. Lessons learned in the transfer of Hib conjugate
vaccine technology and the consequences for access to this vaccine in developing
countries. WHO Meeting Report. Intellectual Property Rights and Vaccines in
Developing Countries, April 19–20, 2004. WHO Document WHO/IVB/04.21.
Lavery M, Nienow AW. 1987. Oxygen transfer in animal cell culture medium. Biotechnol.
Bioeng. 30(3):368‐373.
Le Ru A, Jacob D, Transfiguracion J, Ansorge S, Henry O, Kamen AA. 2010. Scalable
production of influenza virus in HEK‐293 cells for efficient vaccine manufacturing.
Vaccine 28(21):3661‐3671.
Lee BY, Norman BA, Assi TM, Chen SI, Bailey RR, Rajgopal J, Brown ST, Wiringa AE, Burke
DS. 2010. Single versus multi‐dose vaccine vials: an economic computational model.
Vaccine 28(32):5292‐5300.
References
185
M
Levenbook IS, Petricciani JC, Elisberg BL. 1984. Tumorigenicity of Vero cells. J. Biol. Stand.
12(4):391‐398.
Lewis JG, Elder PA. 2000. Abbreviated direct and indirect ELISAs: a new and simple format.
Clin. Chem. 46(1):137‐139.
Li F, Hashimura Y, Pendleton R, Harms J, Collins E, Lee B. 2006. A systematic approach for
scale‐down model development and characterization of commercial cell culture
processes. Biotechnol. Prog. 22(3):696‐703.
Liao G, Li R, Li C, Sun M, Li Y, Chu J, Jiang S, Li Q. 2012a. Safety and Immunogenicity of
Inactivated Poliovirus Vaccine Made From Sabin Strains: A Phase II, Randomized,
Positive‐Controlled Trial. J. Infect. Dis. 205(2):237‐243.
Liao G, Li Y, Li C. 2012b. The Clinical Trial Protocol for the Inactivated Poliomyelitis Vaccine
Made From Sabin Strains (Sabin IPV). Clinicaltrials.gov [internet]: Bethesda (MD):
National Library of Medicine (US) 2000‐[cited 2013 May 30], Available from
http://clinicaltrials.gov/show/NCT01510366 NLM Identifier NCT01510366.
Liao GY, Li R, Li C. 2010. The Clinical Trial Protocol for the Inactivated Poliomyelitis Vaccine
Made From Sabin Strains (IPV) (Sabin IPV). Clinicaltrials.gov [internet]: Bethesda
(MD): National Library of Medicine (US) 2000‐[cited 2010 Oct 04], Available from
http://clinicaltrials.gov/show/NCT01056705 NLM Identifier NCT01056705.
Liu Z, Pawliszyn J. 2005. Behaviors of the MS2 virus and related antibodies in capillary
isoelectric focusing with whole‐column imaging detection. Electrophoresis 26(3):556‐
562.
Liu Z, Wu SS, Pawliszyn J. 2007. Characterization of plant growth‐promoting rhizobacteria
using capillary isoelectric focusing with whole column imaging detection. J.
Chromatogr. A 1140(1‐2):213‐218.
Lopes AG, Sinclair A, Titchener‐Hooker N. 2013. Inactivated poliovirus vaccine made in
modular facilities with single‐use technology. BioProcess Int. 11(S9):12‐19.
Lycke E, Melen B, Wrange G. 1957. Studies of the inactivation of poliomyelitis virus by
formaldehyde. Arch. Gesamte Virusforsch. 7(4):378‐383.
Macadam AJ, Ferguson G, Stone DM, Meredith J, Knowlson S, Auda G, Almond JW, Minor
PD. 2006. Rational design of genetically stable, live‐attenuated poliovirus vaccines of
all three serotypes: relevance to poliomyelitis eradication. J. Virol. 80(17):8653‐8663.
Mandel B. 1971. Characterization of type 1 poliovirus by electrophoretic analysis. Virology
44(3):554‐568.
Mandel B. 1976. Neutralization of poliovirus: a hypothesis to explain the mechanism and
the one‐hit character of the neutralization reaction. Virology 69(2):500‐510.

References
186
Manohar M, Orrison B, Peden K, Lewis AM, Jr. 2008. Assessing the tumorigenic phenotype
of VERO cells in adult and newborn nude mice. Biologicals 36(1):65‐72.
Mao Q, Pawliszyn J. 1999. Capillary isoelectric focusing with whole column imaging
detection for analysis of proteins and peptides. J. Biochem. Biophys. Methods 39(1‐
2):93‐110.
Martin EB, Morris AJ. 2002. Enhanced bio‐manufacturing through advanced multivariate
statistical technologies. J. Biotechnol. 99(3):223‐235.
Martin J, Crossland G, Wood DJ, Minor PD. 2003. Characterization of formaldehyde‐
inactivated poliovirus preparations made from live‐attenuated strains. J. Gen. Virol.
84(Pt 7):1781‐1788.
Mayer MM, Rapp HJ, Roizman B, Klein SW, Cowan KM, Lukens D, Schwerdt CE, Schaffer
FL, Charney J. 1957. The Purification of Poliomyelitis Virus as Studied by Complement
Fixation. J. Immunol. 78(6):435‐455.
Mendonça RZ, Pereira CA. 1998. Cell metabolism and medium perfusion in VERO cell
cultures on microcarriers in a bioreactor. Bioproc. Biosyst. Eng. 18(3):213‐218.
Merten OW, Kallel H, Manuguerra JC, Tardy‐Panit M, Crainic R, Delpeyroux F, Van der WS,
Perrin P. 1999. The new medium MDSS2N, free of any animal protein supports cell
growth and production of various viruses. Cytotechnology 30(1‐3):191‐201.
Michen B, Graule T. 2010. Isoelectric points of viruses. J. Appl. Microbiol. 109(2):388‐397.
Michen B, Fritsch J, Aneziris C, Graule T. 2013. Improved virus removal in ceramic depth
filters modified with MgO. Environ. Sci. Technol. 47(3):1526‐1533.
Milstien JB, Gaule P, Kaddar M. 2007. Access to vaccine technologies in developing
countries: Brazil and India. Vaccine 25(44):7610‐7619.
Minor PD. 1990. Antigenic structure of picornaviruses. Curr. Top. Microbiol. Immunol.
161:121‐154.
Minor P. 2006. Gaps in scientific knowledge for the post eradication world. Biologicals
34(2):167‐70.
Minor P. 2009. Vaccine‐derived poliovirus (VDPV): Impact on poliomyelitis eradication.
Vaccine 27(20):2649‐2652.
Mitchell JD, Abhinava K, Griffiths KL, McGarvey B, Seibert KD, Sethuraman S. 2008. Unit
Operations Characterization Using Historical Manufacturing Performance. Ind. Eng.
Chem. Res. 47(17):6612‐6621.
Montagnon BJ, Fanget B, Nicolas AJ. 1981. The large‐scale cultivation of VERO cells in
micro‐carrier culture for virus vaccine production. Preliminary results for killed
poliovirus vaccine. Dev. Biol. Stand. 47:55‐64.

References
187
N
Montagnon B, Vincent‐Falquet JC, Fanget B. 1983. Thousand litre scale microcarrier culture
of Vero cells for killed polio virus vaccine. Promising results. Dev. Biol. Stand. 55:37‐
42.
Montagnon BJ, Fanget B, Vincent‐Falquet JC. 1984. Industrial‐scale production of
inactivated poliovirus vaccine prepared by culture of Vero cells on microcarrier. Rev.
Infect. Dis. 6 Suppl 2:S341‐S344.
Montagnon BJ, Vincent‐Falquet JC. 1998. Experience with the Vero cell line. Dev. Biol.
Stand. 93:119‐123.
Moreira JL, Cruz PE, Santana PC, Feliciano AS, Lehmann J, Carrondo MJT. 1995. Influence
of power input and aeration method on mass transfer in a laboratory animal cell
culture vessel. J. Chem. Technol. Biotechnol. 62(2):118‐131.
Morgan JF, Morton HJ, Parker RC. 1950. Nutrition of animal cells in tissue culture; initial
studies on a synthetic medium. Proc. Soc. Exp. Biol. Med. 73(1):1‐8.
Mueller S, Papamichail D, Coleman JR, Skiena S, Wimmer E. 2006. Reduction of the rate of
poliovirus protein synthesis through large‐scale codon deoptimization causes
attenuation of viral virulence by lowering specific infectivity. J. Virol. 80(19):9687‐
9696.
Murph JR, Grose C, McAndrew P, Mickiewicz C, Mento S, Cano F, Radick L, Ritchey M,
Stout MG. 1988. Sabin inactivated trivalent poliovirus vaccine: first clinical trial and
seroimmunity survey. Pediatr. Infect. Dis. J. 7(11):760‐765.
Murray JP, Parks GA. 1980. Polio Virus Adsorption on Oxide Surfaces. Particulates in water.
Washington, DC: American Chemical Society. p 97‐133.
Nadeau I, Jacob D, Perrier M, Kamen A. 2000. 293SF Metabolic Flux Analysis during Cell
Growth and Infection with an Adenoviral Vector. Biotechnol. Prog. 16(5):872‐884.
Nasser AM, Battagelli D, Sobsey MD. 1992. Isoelectric focusing of hepatitis A virus in
sucrose gradients. Isr. J. Med. Sci. 28(1):73.
Nathanson N, Langmuir AD. 1963. The Cutter Incident. Poliomyelitis Following
Formaldehyde‐ Inactivated Poliovirus Vaccination in the United States during the
Spring of 1955. Ii. Relationship of Poliomyelitis to Cutter Vaccine. Am. J. Hyg. 78:29‐
60.
Nienow AW. 2006. Reactor engineering in large scale animal cell culture. Cytotechnology
50(1‐3):9‐33.
Nkowane BM, Wassilak SG, Orenstein WA, Bart KJ, Schonberger LB, Hinman AR, Kew OM.
1987. Vaccine‐associated paralytic poliomyelitis. United States: 1973 through 1984.
JAMA 257(10):1335‐1340.

References
188
O
P
O'Brien RT, Newman J. 1979. Structural and compositional changes associated with
chlorine inactivation of polioviruses. Appl. Environ. Microbiol. 38(6):1034‐1039.
Ogra PL, Okayasu H, Czerkinsky C, Sutter RW. 2011. Mucosal immunity to poliovirus. Exp.
Rev. Vaccines 10(10):1389‐1392.
Okayasu H, Sutter RW, Czerkinsky C, Ogra PL. 2011. Mucosal immunity and poliovirus
vaccines: impact on wild poliovirus infection and transmission. Vaccine 29(46):8205‐
8214.
Onodera S, Phillips BA. 1987. A novel method for obtaining poliovirus 14 S pentamers from
procapsids and their self‐assembly into virus‐like shells. Virology 159(2):278‐287.
Oosterhuis NMG. 1984. Scale‐up of bioreactors: a scale‐down approach. Delft, the
Netherlands: Delft University of Technology. Available from:
http://repository.tudelft.nl/view/ir/uuid:03a887b7‐8c20‐4052‐8d6b‐7fe76918d7ec/
[accessed 04.10.2010]
Oosterhuis NMG, van den Berg HJ. 2011. How Multipurpose is a Disposable Bioreactor?
BioPharm int. 24(3):51‐56.
Oosterhuis NMG, van der Heiden P. 2010. Mass Transfer in the CELL‐tainer Disposable
Bioreactor. In: Noll T, editor. vol;. 4 Cells and Culture: Springer Netherlands. p 371‐373.
Perry LA, Montgomery DC, Fowler JW. 2007. A partition experimental design for a
sequential process with a large number of variables. Qual. Reliab. Eng. Int. 23(5):555‐
564.
Petiot E, Fournier F, Geny C, Pinton H, Marc A. 2010a. Rapid screening of serum‐free media
for the growth of adherent Vero cells by using a small‐scale and non‐invasive tool.
Appl. Biochem. Biotechnol. 160(6):1600‐1615.
Petiot E, Guedon E, Blanchard F, Geny C, Pinton H, Marc A. 2010b. Kinetic characterization
of vero cell metabolism in a serum‐free batch culture process. Biotechnol. Bioeng.
107(1):143‐153.
Philippe N, Legendre M, Doutre G, Coute Y, Poirot O, Lescot M, Arslan D, Seltzer V, Bertaux
L, Bruley C and others. 2013. Pandoraviruses: amoeba viruses with genomes up to 2.5
Mb reaching that of parasitic eukaryotes. Science 341(6143):281‐286.
Pieracci J, Perry L, Conley L. 2010. Using partition designs to enhance purification process
understanding. Biotechnol. Bioeng. 107(5):814‐824.
Pirt SJ. 1975. Principles of microbe and cell cultivation. Oxford, United Kingdom: Blackwell
scientific publication.
Pörtner R, editor. 2007. Animal Cell Biotechnology: Methods and Protocols. 2nd ed.
Totowa, New Jersey: Humana Press Inc. 529 p.

References
189
QR
Prem Kumar AA, Mani KR, Palaniappan C, Bhau LNR, Swaminathan K. 2005. Purification,
potency and immunogenicity analysis of Vero cell culture‐derived rabies vaccine: a
comparative study of single‐step column chromatography and zonal centrifuge
purification. Microbes Infect. 7(9–10):1110‐1116.
Putnak JR, Phillips BA. 1981. Differences between poliovirus empty capsids formed in vivo
and those formed in vitro: a role for the morphopoietic factor. J. Virol. 40(1):173‐183.
Quesney S, Marc A, Gerdil C, Giminez C, Marvel J, Richard Y, Meignier B. 2003. Kinetics and
metabolic specificities of Vero cells in bioreactor cultures with serum‐free medium.
Cytotechnology 42(1):1‐11.
Racaniello VR. 2007. Field's Virology. 5th ed. Knipe DM, Howley PM, editors. Philidelphia:
Lippincott Williams & Wilkins. 3177 p.
Rathore A, Krishnan R, Tozer S, Smiley D, Rausch S, Seely J. 2005a. Scaling down of
biopharmaceutical unit operations ‐ Part 2: Chromatography and filtration. BioPharm
Int. 18(4):58‐64.
Rathore A, Krishnan R, Tozer S, Smiley D, Rausch S, Seely J. 2005b. Scaling down of
biopharmaceutical unit operations ‐ Part I: Fermentation. BioPharm Int. 18(3):60‐68.
Resik S, Tejeda A, Lago PM, Diaz M, Carmenates A, Sarmiento L, Alemani N, Galindo B,
Burton A, Friede M and others. 2010. Randomized controlled clinical trial of fractional
doses of inactivated poliovirus vaccine administered intradermally by needle‐free
device in Cuba. J. Infect. Dis. 201(9):1344‐52.
Resik S, Tejeda A, Sutter RW, Diaz M, Sarmiento L, Alemani N, Garcia G, Fonseca M, Hung
LH, Kahn AL and others. 2013. Priming after a fractional dose of inactivated poliovirus
vaccine. N. Engl. J. Med. 368(5):416‐24.
Ringner M. 2008. What is principal component analysis? Nat. Biotechnol. 26(3):303‐304.
Rombaut B, Vrijsen R, Boeye A. 1989. Denaturation of poliovirus procapsids. Arch. Virol.
106(3‐4):213‐220.
Rourou S, van der Ark A, van der Velden T, Kallel H. 2007. A microcarrier cell culture
process for propagating rabies virus in Vero cells grown in a stirred bioreactor under
fully animal component free conditions. Vaccine 25(19):3879‐3889.
Rourou S, van der Ark A, van der Velden, Kallel H. 2009a. Development of an animal‐
component free medium for vero cells culture. Biotechnol. Prog. 25(6):1752‐1761.
Rourou S, van der Ark A, Majoul S, Trabelsi K, van der Velden T, Kallel H. 2009b. A novel
animal‐component‐free medium for rabies virus production in Vero cells grown on
Cytodex 1 microcarriers in a stirred bioreactor. Appl. Microbiol. Biotechnol. 85(1):53‐
63.

References
190
S
Sabin AB, Boulger LR. 1973. History of Sabin attenuated poliovirus oral live vaccine strains.
J. Biol. Stand. 1(2):115‐118.
Sabin AB. 1985. Oral poliovirus vaccine: history of its development and use and current
challenge to eliminate poliomyelitis from the world. J. Infect. Dis. 151(3):420‐436.
Sakoe H, Chiba S. 1978. Dynamic programming algorithm optimization for spoken word
recognition. IEEE Trans. Acoust., Speech, Signal Process. 26(1):43‐49.
Salk D, Salk J. 1984. Vaccinology of poliomyelitis. Vaccine 2(1):59‐74.
Salk JE. 1953. Studies in human subjects on active immunization against poliomyelitis. I. A
preliminary report of experiments in progress. J. Am. Med. Assoc. 151(13):1081‐1098.
Salk JE, Bazeley PL, Bennett BL, Krech U, Lewis LJ, Ward EN, Youngner JS. 1954. Studies in
human subjects on active immunization against poliomyelitis. II. A Practical Means for
Inducing and Maintaining Antibody Formation. Am. J. Public Health Nations Health
44(8):994‐1009.
Sanders BP, Edo‐Matas D, Custers JHHV, Koldijk MH, Klaren V, Turk M, Luitjens A, Bakker
WAM, Uytdehaag F, Goudsmit J and others. 2013. PER.C6® cells as a serum‐free
suspension cell platform for the production of high titer poliovirus: A potential low
cost of goods option for world supply of inactivated poliovirus vaccine. Vaccine
31(5):850‐856.
Sangrujee N, Caceres VM, Cochi SL. 2004. Cost analysis of post‐polio certification
immunization policies. Bull. World Health Organ. 82(1):9‐15.
Sawyer LA, Wood D, Ferguson M, Crainic R, Beuvery EC, McInnis J, Albrecht P. 1997.
Potency of wild‐type or sabin trivalent inactivated poliovirus vaccine, by enzyme‐
linked immunosorbent assay using monoclonal antibiotics specific for each antigenic
site. Biologicals 25(3):299‐306.
Schmidt FR. 2005. Optimization and scale up of industrial fermentation processes. Appl.
Microbiol. Biotechnol. 68(4):425‐35.
Schneider M, Marison IW, von Stockar U. 1996. The importance of ammonia in mammalian
cell culture. J. Biotechnol. 46(3):161‐185.
Schouwenberg JE, Velden‐de Groot T, Blueml G. 2010. Vaccine Production Utilizing the
Potential of Microcarriers in Disposable Bioreactor. In: Noll T, editor. Cells and Culture
vol 4: Springer Netherlands. p 795‐801.
Schuirmann DJ. 1987. A comparison of the two one‐sided tests procedure and the power
approach for assessing the equivalence of average bioavailability. J. Pharmacokinet.
Biopharm. 15(6):657‐680.
Sharp DG, Leong J. 1980. Inactivation of poliovirus I (Brunhilde) single particles by chlorine
in water. Appl. Environ. Microbiol. 40(2): 381‐385.

References
191
T
Shen Y, Berger SJ, Smith RD. 2000. Capillary isoelectric focusing of yeast cells. Anal. Chem.
72(19):4603‐4607.
Simizu B, Abe S, Yamamoto H, Tano Y, Ota Y, Miyazawa M, Horie H, Satoh K, Wakabayashi
K. 2006. Development of inactivated poliovirus vaccine derived from Sabin strains.
Biologicals 34(2):151‐154.
Singh V. 1999. Disposable bioreactor for cell culture using wave‐induced agitation.
Cytotechnology 30(1‐3):149‐158.
Sutter RW, John TJ, Jain H, Agarkhedkar S, Ramanan PV, Verma H, Deshpande J, Singh AP,
Sreevatsava M, Malankar P and others. 2010. Immunogenicity of bivalent types 1 and
3 oral poliovirus vaccine: a randomised, double‐blind, controlled trial. Lancet
376(9753):1682‐1688.
Sweere APJ, Luyben KC, Kossen NWF. 1987. Regime analysis and scale‐down: Tools to
investigate the performance of bioreactors. Enz. Microb. Technol. 9(7):386‐398.
Taffs RE, Chumakov KM, Rezapkin GV, Lu Z, Douthitt M, Dragunsky EM, Levenbook IS.
1995. Genetic Stability and Mutant Selection in Sabin 2 Strain of Oral Poliovirus
Vaccine Grown under Different Cell Culture Conditions. Virology 209(2):366‐373.
Tanimoto T, Murashige N, Hosoda M, Kusumi E, Ono S, Kami M, Shibuya K. 2012.
Vaccination for whom? Time to reinvigorate Japanese vaccine policy. Lancet
380(9854):1647.
Tano Y, Shimizu H, Martin J, Nishimura Y, Simizu B, Miyamura T. 2007. Antigenic
characterization of a formalin‐inactivated poliovirus vaccine derived from live‐
attenuated Sabin strains. Vaccine 25(41):7041‐7046.
Taylor DH, Moore RS, Sturman LS. 1981. Influence of pH and electrolyte composition on
adsorption of poliovirus by soils and minerals. Appl. Environ. Microbiol. 42(6):976‐
984.
ten Have R, Thomassen YE, Hamzink MRJ, Bakker WAM, Nijst OEM, Kersten G, Zomer G.
2012. Development of a fast ELISA for quantifying polio D‐antigen in in‐process
samples. Biologicals 40(1):84‐87.
Thomassen YE, van Sprang ENM, van der Pol LA, Bakker WAM. 2010. Multivariate data
analysis on historical IPV production data for better process understanding and
future improvements. Biotechnol. Bioeng. 107(1):96‐104.
Thomassen YE, van der Welle JE, van Eikenhorst G, van der Pol LA, Bakker WAM. 2012.
Transfer of an adherent Vero cell culture method between two different rocking
motion type bioreactors with respect to cell growth and metabolic rates. Process
Biochem. 47(2):288‐296.

References
192
UV
Thomassen YE, van 't Oever AG, Van Oijen MGCT, Wijffels RH, Van der Pol LA, Bakker
WAM. 2013a. Next generation inactivated polio vaccine manufacturing to support
post polio‐eradication biosafety goals. PLoS ONE 8(12):e83374
Thomassen YE, van 't Oever AG, Vinke M, Spiekstra A, Wijffels RH, van der Pol LA, Bakker
WAM. 2013b. Scale‐down of the inactivated polio vaccine production process.
Biotechnol. Bioeng. 110(5):1354‐1365.
Toriniwa H, Komiya T. 2007. Japanese encephalitis virus production in Vero cells with
serum‐free medium using a novel oscillating bioreactor. Biologicals 35(4):221‐226.
Trabelsi K, Rourou S, Loukil H, Majoul S, Kallel H. 2005. Comparison of various culture
modes for the production of rabies virus by Vero cells grown on microcarriers in a 2‐l
bioreactor. Enz. Microb. Technol. 36(4):514‐519.
Trabelsi K, Rourou S, Loukil H, Majoul S, Kallel H. 2006. Optimization of virus yield as a
strategy to improve rabies vaccine production by Vero cells in a bioreactor. J.
Biotechnol. 121(2):261‐271.
Unicef. 2012. Current IPV supply and recent tender results & outlook for the future.
Available from: http://www.unicef.org/supply/index_66260.html [accessed
04.10.2013]
van 't Riet K, Tramper J. 1991. Basic bioreactor design. New York: Marcel Dekker, Inc.
van der Heiden P, Buevink M, Oosterhuis NMG; CELLUTION BIOTECH B.V. (Veendam, NL),
assignee. 2008. Method and apparatus for cultivating cells utilizing wave motion. US
Patent US20080160597.
van der Velden‐de Groot CAM. 1995. Microcarrier technology, present status and
perspective. Cytotechnology 18(1‐2):51‐56.
van Hemert P, Kilburn DG, van Wezel AL. 1969. Homogeneous cultivation of animal cells
for the production of virus and virus products. Biotechnol. Bioeng. 11(5):875‐85.
van Noort RB. 1992. The Children's Vaccine Initiative and vaccine supply: the role of the
public sector. Vaccine 10(13):909‐910.
van Steenis G, van Wezel AL, Sekhuis VM. 1981. Potency testing of killed polio vaccine in
rats. Dev. Biol. Stand. 47:119‐128.
van Wezel AL. 1967. Growth of cell‐strains and primary cells on micro‐carriers in
homogeneous culture. Nature 216(5110):64‐65.
van Wezel AL. 1972. New trends in the preparation of cell substrates for the production of
virus vaccines. Prog. Immunobiol. Stand. 5:187‐192.
References
193
van Wezel AL. 1973. Microcarrier cultures of animal cells. Tissue culture, methods and
applications VII Cell propagations on culture supports. New York and London:
Academic press. p 372‐376.
van Wezel AL, van Steenis G, Hannik CA, Cohen H. 1978. New approach to the production
of concentrated and purified inactivated polio and rabies tissue culture vaccines. Dev.
Biol. Stand. 41:159‐168.
Van Wezel AL, van der Velden‐de Groot CAM. 1978. Large scale cultivation of animal cells in
microcarrier culture. Process Biochem. 13(3):6‐8.
van Wezel AL, van Herwaarden JA, van de Heuvel‐de Rijk EW. 1979. Large‐scale
concentration and purification of virus suspension from microcarrier culture for the
preparation of inactivated virus vaccines. Dev. Biol. Stand. 42:65‐69.
van Wezel AL, van der Velden‐de Groot CA, van Herwaarden JA. 1980. The production of
inactivated poliovaccine on serially cultivated kidney cells from captive‐bred
monkeys. Dev. Biol. Stand. 46:151‐158.
van Wezel AL. 1981. Present state and developments in the production of inactivated
poliomyelitis vaccine. Dev. Biol. Stand. 47:7‐13.
van Wezel AL, van der Marel P, van Beveren CP, Verma I, Salk PL, Salk J. 1981. Detection
and elimination of cellular nucleic acids in biologicals produced on continuous cell
lines. Dev. Biol. Stand. 50:59‐69.
van Wezel AL, van Steenis G, van der Marel P, Osterhaus AD. 1984. Inactivated poliovirus
vaccine: current production methods and new developments. Rev. Infect. Dis. 6
Suppl 2:S335‐S340.
van Wezel AL. 1985. Monolayer growth systems: homogeneous unit processes. In: Spier
RE, Griffith JB, editors. Animal Cell Biotechnology. London: Academic Press. p 265‐
282.
Venczel L, Landry S, Aylward B, Sutter R, Sabow A, Smith G. 2009. Global post‐eradication
IPV supply and demand assessment: integrated findings commissioned by the Bill &
Melinda Gates Foundation and prepared by Oliver Wyman Inc. Available from
www.polioeradication.org/content/publications/SupplyLandscapeEconomics.09.06.2
010.pdf [accessed 04.10.2010].
Verdijk P. 2012. Safety and Immunogenicity of a New Inactivated Polio Vaccine in Healthy
Adults. In: Clinicaltrials.gov [internet]: Bethesda (MD): National Library of Medicine
(US) 2000‐[cited 2013 may 30], Available from
http://clinicaltrials.gov/show/NCT01708720 NLM Identifier: NCT01708720.
Verdijk P, Rots NY, Van Oijen MGCT, Oberste MS, Boog CJ, Okayasu H, Sutter RW, Bakker
WA. 2013. Safety and Immunogenicity of inactivated poliovirus vaccine based on
Sabin strains with and without aluminum hydroxide: a phase I trial in healthy adults.
Vaccine 31(47):5531‐5536.

References
194
W
Vidor E, Meschievitz C, Plotkin S. 1997. Fifteen years of experience with Vero‐produced
enhanced potency inactivated poliovirus vaccine. Pediatr. Infect. Dis. J. 16(3):312‐322.
Vidor E, Plotkin SA. 2013. Poliovirus vaccine‐inactivated. In: Plotkin SA, Orenstein WA, Offit
PA, editors. Vaccines. 6th ed: Elsevier.
Vignuzzi M, Wendt E, Andino R. 2008. Engineering attenuated virus vaccines by controlling
replication fidelity. Nat. Med. 14(2):154‐161.
Vrijsen R, Rombaut B, Boeye A. 1983. pH‐dependent aggregation and electrofocusing of
poliovirus. J. Gen. Virol. 64 (Pt 10):2339‐2342.
Wahl A, Sidorenko Y, Dauner M, Genzel Y, Reichl U. 2008. Metabolic flux model for an
anchorage‐dependent MDCK cell line: characteristic growth phases and minimum
substrate consumption flux distribution. Biotechnol. Bioeng. 101(1):135‐152.
Ward RL. 1978. Mechanism of poliovirus inactivation by ammonia. J. Virol. 26(2):299‐305.
Ward RL. 1980. Mechanisms of poliovirus inactivation by the direct and indirect effects of
ionizing radiation. Radiat. Res. 83(2):330‐344.
Westdijk J, Brugmans D, Martin J, Oever AV, Bakker WA, Levels L, Kersten G. 2011.
Characterization and standardization of Sabin based inactivated polio vaccine:
Proposal for a new antigen unit for inactivated polio vaccines. Vaccine 29(18):3390‐
3397.
Westdijk J, Koedam P, Barro M, Steil BP, Collin N, Vedvick TS, Bakker WAM, van der Ley P,
Kersten G. 2013. Antigen sparing with adjuvanted inactivated polio vaccine based on
Sabin strains. Vaccine 31(9):1298‐1304.
WHO. 1999. Recommendations for the production and control of Poliomyelitis Vaccine,
Oral; Revised 1999 TRS 904, Annex 1. Geneva: World Health Organization.
WHO. 2002a. Recommendations for the production and control of poliomyelitis vaccine
(inactivated). Annex 2 Technical report series No.910 Geneva: World Health
Organization.
WHO Expert committee on Biological Standardization. 2002b. Recommendations for the
production and control of poliomyelitis vaccine (oral). Fifthied report. Technical
report series No.904 World Health Organization 31‐93.
WHO. 2004. Guidelines for the safe production and quality control of inactivated
poliomyelitis vaccine manufactured from wild polioviruses (Addendum, 2003, to the
Recommendations for the Production and Quality Control of Poliomyelitis Vaccine
(Inactivated)). Annex 2 Technical report series No.926: 65‐89
WHO. 2009. WHO global action plan to minimize poliovirus facility‐associated risk after
eradication of wild polioviruses and cessation of routine OPV use. Available from:
References
195
http://www.polioeradication.org/content/publications/GAPIIIWORKINGDRAFT_07.pd
f [accessed 16.09.2013].
WHO. 2010a Global polio eradication initiative – strategic plan 2010–2012. Available from:
http://www.polioeradication.org/content/publications/GPEI.StrategicPlan.2010‐
2012.ENG.May.2010.pdf [accessed: 04.10.2010]
WHO. 2010b. Polio vaccines and polio immunization in the pre‐eradication era: WHO
position paper‐‐recommendations. Vaccine 28(43):6943‐6944.
WHO. 2012a. Recommendations to assure the quality, safety and efficacy of live
attenuated poliomyelitis vaccine (oral). Replacement of TRS 904, annex 1 and
addendum TRS 910, annex 1.
WHO. 2012b. Global polio eradication initiative. Poliomyelitis: intensification of the global
eradication initiative. Geneva: World Helath Organization. Available from
http://apps.who.int/gb/ebwha/pdf_files/WHA66/A66_18‐en.pdf [accessed 01.07.2013].
WHO. 2013a. Meeting of the Strategic Advisory Group of Experts on Immunization,
November 2012 ‐ conclusions and recommendations. Wkly. Epidemiol. Rec. 88(1):1‐16.
WHO. 2013b. The "Stop transmission of Polio (STOP)" programme of the Global Polio
Eradication Initiative, 1999‐2013. Wkly. Epidemiol. Rec. 88(25):257‐260.
WHO 2013c. Global polio eradication initiative. Polio Eradication & Endgame Strategic Plan
2013‐2018. Geneva: WHO. Available from
http://www.polioeradication.org/Resourcelibrary/Strategyandwork.aspx [accessed
04.10.2013]
Widjojoatmodjo MN, Boes J, van Bers M, van Remmerden Y, Roholl PJ, Luytjes W. 2010. A
highly attenuated recombinant human respiratory syncytial virus lacking the G
protein induces long‐lasting protection in cotton rats. Virol. J. 7:114‐123.
Wimmer E, Hellen CU, Cao X. 1993. Genetics of poliovirus. Annu. Rev. Genet. 27:353‐436.
Wold S, Sjöström M, Eriksson L. 2001. PLS‐regression: a basic tool of chemometrics.
Chemometr. Intell. Lab. Syst. 58(2):109‐130.
Wood DJ, Heath AB, Sawyer LA. 1995. A WHO Collaborative study on assays of the
antigenic content of inactivated poliovirus vaccines. Biologicals 23(1):83‐94.
Wood HA, Johnston LB, Burand JP. 1982. Inhibition of Autographa californica nuclear
polyhedrosis virus replication in high‐density Trichoplusia ni cell cultures. Virology
119(2):245‐254.
Wu J, Pawliszyn J. 1994. Application of capillary isoelectric focusing with absorption
imaging detection to the analysis of proteins. J. Chromatogr. B: Biomed. Appl.
657(2):327‐332.

References
196
YZ
Yang C, Shi H, Zhou J, Liang Y, Xu H. 2009. CpG oligodeoxynucleotides are a potent
adjuvant for an inactivated polio vaccine produced from Sabin strains of poliovirus.
Vaccine 27(47):6558‐63.
Zerda KS, Gerba CP. 1984. Agarose isoelectrofocusing of intact virions. J. Virol. Methods
9(1):1‐6.
Zomer G, Hamzink MRJ. 2009. Development and optimization of a fast and sensitive ELISA
for polio D‐antigen using a GZ11 based signal reagent. In: Shen X, Yang X‐L, Zhang X‐R,
Cui ZJ, Kricka LJ, Stanley PE, editors. Bioluminescence and chemiluminescence.
Singapore: World Scientific Publishing Co. Pte. Ltd. p 291‐294.
Zwietering TN. 1958. Suspending of solid particles in liquid by agitators. Chem. Eng. Sci.
8(3‐4):244‐253.


Summary

Summary
200
The first vaccine against poliovirus (PV), the causative agent of poliomyelitis, was
developed in the 1950s by Jonas Salk. The vaccine (IPV) consists of an injected dose of
purified and inactivated wild‐type PVs (all three serotypes). Soon after this discovery, at
the Rijks Instituut voor de Volksgezondheid (RIV) in Bilthoven, an industrial‐scale
production process for IPV was developed based on micro‐carrier technology and primary
monkey kidney cells. In the 1970s, the manufacturing of IPV was scaled up to 300‐L by the
development of well‐controlled bioreactors for cell culture, the so‐called “Bilthoven Units”
(originally used for bacterial fermentations). In 2004, the Vero cell line was introduced to
replace the then used tertiary monkey kidney cells followed by a scale‐up from 700 to
1,500‐L (from two 350‐L to two 750‐L bioreactors). IPV manufacturing has been part of the
regular vaccine manufacturing activities in Bilthoven ever since the establishment of the
IPV production process.
With polio eradication on our doorstep, the World Health Organization (WHO) is pursuing
a new IPV based on non‐wild‐type strains to increase the biosafety of vaccine
manufacturing. In addition, and due to the pending cessation of oral polio vaccines (OPV),
the global demand for affordable IPV is increasing. To accommodate these questions two
research programs were started at the Netherlands Vaccine Institute (now Institute for
Translational Vaccinology). One concerned optimization of the current conventional IPV
production process, the other the manufacturing of an affordable sIPV, an IPV based on
the attenuated Sabin PV strains normally used for OPV production. The technology of the
sIPV production process, developed in the latter project, is also aimed to be transferred to
developing countries manufacturers (Chapter 2).
From the substantial history in polio vaccine production in Bilthoven, a valuable dataset
has been generated. Data from over 50 batches at two different production scales (700‐L
and 1,500‐L) were analyzed using multivariate data analysis (MVDA). This statistical
method is stimulated by the ICH (International Conference on Harmonization of Technical
Requirements for Registration of Pharmaceuticals for Human Use) to improve scientific
understanding of production processes for troubleshooting and improved process control.
The initial explorative analysis, performed on single unit operations, indicated consistent
manufacturing. Known outliers (e.g., rejected batches) were identified using principal
component analysis (PCA). The source of operational variation was pinpointed to variation
of input such as cell‐ and virus culture media. Other relevant process parameters were in
control and, using this manufacturing data, could not be correlated to product quality
attributes. The gained knowledge of the IPV production process, not only from the MVDA,
but also from digitalizing the available historical data, has proven to be useful for
troubleshooting, understanding limitations of available data and seeing the opportunity
for improvements (Chapter 3).

Summary
201
One of the gaps in the data was located in the product quantification during processing.
The available assay used for determining the D‐antigen concentration in in‐process
samples had high variability. A so‐called fast ELISA was developed and qualified for
analysis of polio D‐antigen. The original 20h‐protocol was optimized by minimizing the
total incubation time to 1h, and by replacing the signal reagent 3,3',5,5'‐
tetramethylbenzidine by a chemiluminogenic signal reagent with a theoretical low intrinsic
background and high dynamic range. This fast D‐antigen ELISA was suitable for
measurement of D‐antigen concentrations in the different matrixes present during the
different unit‐operations in the production process (Chapter 4).
To accommodate research to improve and optimize the current cIPV production process
an up‐to‐date lab‐scale version encompassing the legacy inactivated polio vaccine
production process was set‐up based on the knowledge obtained during the MVDA of
historical data. This lab‐scale version was designed to be representative of the large scale,
meaning a scale‐down model, to allow experiments for process optimization that can be
readily applied to manufacturing scale. Initially the separate unit operations were scaled‐
down at setpoint. Subsequently, the unit operations were applied successively in a
comparative manner to large‐scale manufacturing. This allows the assessment of the
effects of changes in one unit operation to the consecutive units at small‐scale. The
developed scale‐down model for cell and virus culture (2.3‐L) presents a feasible model
with its production scale counterpart (750‐L) when operated at setpoint. Also, the scale‐
down models for the DSP unit operations clarification, concentration, size exclusion
chromatography, ion exchange chromatography, and inactivation are in agreement with
the manufacturing scale. The small‐scale units can be used separately, as well as
sequentially, to study variations and critical product quality attributes in the production
process. Finally, it has been shown that the scale‐down unit operations can be used
consecutively to prepare trivalent vaccine at lab‐scale with comparable characteristics to
the product produced at manufacturing scale (Chapter 5).
The upcoming of disposables in GMP manufacturing triggered the study on alternatives
for the clarification unit (Chapter 5) and alternative Wave‐type, bioreactors (Chapter 6).
This type of bioreactors makes use of sterilized disposable bags, which could be beneficial
in a GMP environment, for example to reduce the cleaning validation burden, or to
facilitate change‐over to another product using the same equipment. Wave‐type
bioreactors make use of vertical (standard rocking motion‐type) or both vertical and
horizontal displacement (CELL‐tainer® (CELLution Biotech BV)) for mixing instead of an
impeller, which is used in stirred tank reactors. Using the design of experiments (DoE)
approach, models for the mixing times in both the CELL‐tainer® and the BIOSTAT® CultiBag
RM (Sartorius Stedim Biotech) bioreactor (standard rocking motion‐type) were
developed. The conditions for cultivation of Vero cells in the CELL‐tainer® bioreactor were

Summary
202
chosen based on comparable mixing times. Vero cells growing adherent to Cytodex 1
microcarriers were cultivated in the CELL‐tainer® and in the BIOSTAT® CultiBag RM. Vero
cell growth in both bioreactors was comparable with respect to the growth characteristics
and main metabolite production and consumption rates. Additionally, poliovirus
production in both bioreactors was shown to be similar.
In view of WHOs pursuit towards an IPV manufacturing process with increased biosafety,
the development of sIPV was taken up. Prior to large scale production of clinical lots, an
initial proof of principle study was done (Chapter 2). Starting from the conventional IPV
(cIPV) production process, minimal adaptations, such as lower virus cultivation
temperature, were implemented. Also, the selected disposable filter unit (Chapter 5) was
implemented. To quickly prepare sIPV clinical lots and show proof‐of‐principle of sIPV in
human, no further process optimization and/or modernization was done. sIPV was
produced at industrial scale followed by formulation of both plain and aluminium
adjuvanted sIPV (Chapter 7). The final products met the quality criteria, were immunogenic
in rats, showed no toxicity in rabbits and could be released for testing in the clinic. While
an immunogenic product, both in animals as in humans was prepared, the product yield
was extremely low and further process development will be needed to obtain an
affordable sIPV.
Especially the yield of Sabin PV type 2 after ion exchange chromatography was low. To
determine if this effect could be due to a difference in the isoelectric point (pI) of the
poliovirus a method for pI measurement of live virus was developed (Chapter 8). A
method for analyzing biological hazardous components (biological safety level 2) was set
up for the capillary isoelectric focusing‐whole column imaging detection (CIEF‐WCID)
analyzer. This method is based on closed circuits. Subsequently, the pI’s of complete intact
polioviruses were determined. The polioviruses that were analyzed are the commonly
used viruses for the production of IPV ‐ Mahoney (type 1), MEF‐1 (type 2), and Saukett
(type 3) ‐ as well as for OPV ‐ Sabin types 1, 2, and 3. The determined pI's were 6.2 for
Mahoney, 6.7 for MEF‐1, and 5.8 for Saukett. The pI's of Sabin types 1, 2, and 3 viruses were
7.4, 7.2, and 6.3, respectively. With a pI of 7.2, Sabin PV type 2 is prone to self‐aggregation
at the pH used during chromatography (pH 7.0). Self‐aggregation was thus suggested to
be the main cause of low product yield and prevention of this self‐aggregation was
suggested to be the main focus point for process optimization.
Besides optimization of the downstream processing, optimization of the upstream
processing, i.e. increased virus yields after cell and virus culture was studied (Chapter 9).
Vero cells were grown adherent to microcarriers (Cytodex 1; 3 g L‐1) using animal
component free media in stirred‐tank type bioreactors. Different strategies for media
refreshment, daily media replacement (semi‐batch), continuous media replacement

Summary
203
(perfusion) and recirculation of media, were compared with batch cultivation. Cell
densities increased using a feed strategy from 1 × 10⁶ cells mL‐1 during batch cultivation to
1.8, 2.7 and 5.0 × 10⁶ cells mL‐1 during semi‐batch, perfusion and recirculation, respectively.
The effects of these different cell culture strategies on subsequent poliovirus production
were investigated. Increased cell densities allowed up to 3 times higher D‐antigen levels
when compared with that obtained from batch‐wise Vero cell culture. However, the cell
specific D‐antigen production was lower when cells were infected at higher cell densities.
This cell density effect is in good agreement with observations for different cell lines and
virus types. From the evaluated alternative culture methods, application of a semi‐batch
mode of operations allowed the highest cell specific D‐antigen production. The increased
product yields that can easily be reached using these higher cell density cultivation
methods, showed the possibility for better use of bioreactor capacity for the
manufacturing of polio vaccines to ultimately reduce vaccine cost per dose. Further, the
use of animal‐component‐free cell‐ and virus culture media shows opportunities for
modernization of human viral vaccine manufacturing.
To assess the affordability of sIPV the manufacturing costs were determined (Chapter 10).
The sIPV manufacturing costs, when produced as described in Chapter 7, indicate the
requirement for process optimizations. However, the manufacturing costs can be reduced
at least a factor 2 when implementing the upstream processing optimization, ACF media
and a semi‐batch process, as described in Chapter 9. Assuming improvements in
downstream processing will result in a process with yields comparable to the cIPV process
costs can be further lowered. In addition, a scale‐up from two 350‐L bioreactors to two
1,000‐L bioreactors would nearly halve the manufacturing costs resulting in a more than
cost competitive sIPV. These costs analysis showed that an affordable sIPV is feasible.


Samenvatting

Samenvatting
206
Poliomyelitis, ofwel polio, is een zeer besmettelijke ziekte die veroorzaakt wordt door het
poliovirus. Infecties met het poliovirus komen voornamelijk via de mond het lichaam in.
Het virus vermenigvuldigt zich vervolgens in de darmen. Het merendeel van de
besmettingen heeft geen of slechts een mild ziektebeeld tot gevolg, zoals keelpijn, koorts
of diarree. Het bekendste ziektebeeld is echter dat van verlamming van de ledematen. In
deze gevallen is het poliovirus het zenuwstelsel binnengekomen. Dit komt voor bij één op
de 200 besmettingen. In zeldzame gevallen treedt er verlamming van de
ademhalingsspieren op, wat de dood tot gevolg kan hebben. Er is geen geneesmiddel voor
polio.
Het poliovirus is een klein RNA virus van slechts 30 nm. Er bestaan 3 serotypes, ofwel
varianten, type 1, 2 en 3. Bij infectie met het poliovirus worden er door het lichaam
beschermende antilichamen gemaakt. Deze beschermende antilichamen zijn specifiek
voor het subtype en herkennen intacte poliovirussen, die dan dus in hun D‐antigeen vorm
zijn. De beschermende antilichamen zullen bij een nieuwe infectie het poliovirus snel laten
opruimen door het immuunsysteem. Met behulp van vaccinatie tegen polio kunnen er
beschermende antilichamen worden opgewekt (Figuur 1) die de ziekte voorkomen.
In de jaren 50 van de vorige eeuw is het eerste vaccin tegen het poliovirus ontwikkeld door
Jonas Salk. Dit vaccin (geïnactiveerd polio vaccin ofwel IPV) bestaat uit gezuiverde en
geïnactiveerde poliovirussen (alle drie de subtypes) en wordt toegediend door middel van
een injectie. Het andere poliovaccin (oraal polio vaccin ofwel OPV), ontwikkeld door Albert
Sabin in 1962, bestaat uit levende verzwakte poliovirussen (ook wel de Sabin stammen
genoemd) en wordt toegediend via de mond. OPV staat ook bekend als het suikerklontjes
vaccin.
OPV is door de meeste landen, met uitzondering van Nederland, Zweden en Finland,
opgenomen in het vaccinatieschema vanwege het gemak van toediening en de lage prijs.
OPV wordt ook door de wereld gezondheidsorganisatie (WHO) gebruikt in het “polio
eradicatie programma” om polio uit te roeien. Hoewel beide vaccins bekend staan
vanwege hun goede veiligheid kunnen er in uitzonderlijkere gevallen (1 op 2,7 miljoen)
verlammingsverschijnselen optreden bij het gebruik van OPV. Daarnaast kunnen er vaccin
gerelateerde poliovirussen ontstaan die dezelfde neurovirulente eigenschappen als de
wild type virussen hebben. Dit kan niet gebeuren bij vaccinatie met IPV omdat daar geen
levende poliovirussen in zitten. Om deze redenen gebruiken steeds meer landen IPV in het
vaccinatieprogramma.

Samenvatting
207
Figuur 1. De werking van poliovaccins. Er bestaan 2 vaccins tegen poliovirus. IPV, wat wordt toegediend door middel van een injectie, en OPV, toegediend via de mond. Beide vaccins zorgen voor een reactie van
het immuunsysteem wat de vorming van beschermende antilichamen tot gevolg heeft. Het gebruik van
OPV zorgt ook voor een lokale immuunreactie in de slijmvliezen.
Kort na de uitvinding van het eerste poliovaccin (IPV) is bij het toenmalige rijksinstituut
voor volksgezondheid (RIV) in Bilthoven een productie proces opgezet op basis van
primaire apennier cellen en microcarrier technologie. Deze technologie maakt het mogelijk
dierlijke cellen te laten groeien op een klein bolletje (de microcarrier) (Figuur 2). De cellen
op deze microcarriers kunnen in een bioreactor onder gecontroleerde omgevingsfactoren
(bij onder andere constante temperatuur, zuurgraad en zuurstof concentratie) gekweekt
worden. In de jaren 70 is de productie van IPV opgeschaald naar 300‐L (liter) bioreactoren
IPV wordttoegediend1
2
3Cellen van hetimmuunsysteem makenspecifieke antilichamen
4Antilichamen zijn aanwezig in hetbloed om bescherming te biedenbij infectie met poliovirus
Het immuunsysteemherkent de geïnactiveerdepoliodeeltjes
1OPV wordttoegediend
Immuunsysteem
2
3Cellen van het
immuunsysteem makenspecifieke antilichamen
Het immuunsysteemherkent de geïnactiveerde
poliodeeltjes
4
Antilichamen zijn aanwezig in het bloed en lokaal in het slijmvlies
om bescherming te biedenbij infectie met poliovirus
Nieuwe antilichamen
De werking van poliovaccins

Samenvatting
208
voor celkweek. Later, in 2004, is de Vero cellijn in gebruik genomen om de tertiaire
apennier cellen te vervangen. Ook is een verdere schaalvergroting van 700‐L naar 1.500‐L
uitgevoerd (van twee 350‐L naar twee 750‐L bioreactoren). Na de productie van het virus
in de bioreactoren wordt het virus gezuiverd op basis van grootte en lading. Vervolgens
wordt het product geïnactiveerd met formaline voordat het gemengd voor de
eindformulering (Figuur 3). De productie van IPV is sinds de ontwikkeling van het
productieproces altijd onderdeel geweest van de routine vaccin productie in Bilthoven.
Figuur 2. Vero cellen op microcarriers (links) en poliovirus onder het vergrootglas (1.000 maal vergroting).
Cellen zijn niet met het blote oog te zien. De microcarriers waar de cellen op groeien zijn ongeveer 0,2
millimeter (mm) groot, een cel diameter is maar ongeveer 0,05 mm en een poliovirus slechts 0,00003 mm ofwel 30 nm.
Met de eradicatie van polio in het vooruitzicht wordt er door de WHO gestreefd naar een
nieuw IPV op basis van verzwakte poliovirussen om zo de biologische veiligheid van de
vaccinproductie te vergroten. Na eradicatie zal het gebruik van OPV wereldwijd gestopt
worden en zal de vraag naar betaalbare IPV toenemen. Om de IPV productie veiliger en
goedkoper te maken zijn er twee onderzoeksprogramma’s gestart bij het Nederlands
Vaccin Instituut (nu het Instituut voor Translationele Vaccinologie). Het eerste programma
betrof de optimalisatie van het huidige conventionele IPV (cIPV), het tweede de productie
van een betaalbaar sIPV, een IPV op basis van de verzwakte Sabin poliovirussen die
normaal gebruikt worden voor de productie van OPV. Het is daarnaast de bedoeling dat de

Samenvatting
209
ontwikkelde technologie voor de productie van sIPV overgedragen wordt naar
producenten in ontwikkelingslanden (Hoofdstuk 2).
Figuur 3. Beschrijving van het productieproces voor IPV.
1e voorkweekVero cellen worden ontdooid en toegevoegd aan een bioreactor (40-L) met kweekmedium en microcarriers. In de bioreactor wordt de temperatuur, zuurgraad, en zuurstof concentratie gecontroleerd. De cellen gaan groeien en regelmatig wordt er nieuw medium toegevoegd. Na een kleine week zitten de microcarriers vol en worden de cellen geoogst.
2e voorkweekVero cellen worden na de oogst toegevoegd aan een bioreactor (40-L) met nieuw kweekmedium en nieuwe microcarriers. Ook hier wordt de temperatuur, zuurgraad en zuurstof concentratie gecontroleerd. De cellen gaan groeien en medium (het totale mediumvolume is 200 L) wordt gerecirculeerd. Zo is er geen gebrek aan voedingsstoffen en is de concentratie afvalstoffen niet te hoog. Na een wederom een kleine week worden de cellen geoogst.
1e trypsinisatieOm cellen te oogsten moeten ze van de microcarriers afgehaald worden. Dit gebeurt met het enzyme trypsine. Wanneer ze los zijn van de microcarriers worden ze aan een nieuwe bioreactor toegevoegd voor verdere vermenigvuldiging.
2e trypsinisatieEenzelfde procedure wordt gevolgd als bij de 1e trypsinisatie in hetzelfde apparaat. In het apparaat zit een zeef waar de microcarriers niet doorheen kunnen. Op deze manier kan het oude kweekmedium verwijderd worden.celkweek gevolgd door viruskweekDe Vero cellen uit oogst van de 2e voorkweek worden verdeeld over twee 750-L bioreactoren met nieuw kweekmedium en nieuwe microcarriers, wederom onder gecontroleerde omstandigheden. Er wordt geen medium toegevoegd, alleen glucose wanneer deze bijna op is. Na 4 dagen wordt het medium verwisseld en wordt er poliovirus toegevoegd dat de cellen infecteerd. Er wordt maar één type poliovirus per keer gekweekt. Na 4 dagen barsten de cellen en komt het virus vrij in het medium. De viruskweek is nu klaar.clarificatieDe virusoogst wordt via een zeef uit de bioreactor gehaald zodat de microcarriers in de bioreactor achterblijven. Vervolgens wordt de eerste zuivering, de clarificatie, gestart. Hierbij wordt de virusoogst gefilterd. Grote celresten blijven achter op het filter, de (kleinere) virussen worden doorgelaten.concentratieWederom een filtratiestap. Hier blijven echter de virussen achter terwijl water en kleine moleculen door het filter gaan. Op deze manier komen de virussen in een kleiner volume te zitten en zijn dus geconcentreerd.
kolomchromatografie op deeltjesgrootteBij kolomchromatografie is een buis gevuld met een materiaal wat voor scheiding kan zorgen. Deze scheiding is gebaseerd op een verschil in de verblijftijd in de kolom, in dit geval doordat de te scheiden deeltjes verschillen in grootte. Het materiaal in de kolom bevat poreuze korreltjes. De kleine deetjes kunnen hierin en zijn langer onderweg dan de grote deeltjes die er niet in kunnen. De overgebleven grotere celresten lopen het snelst door de kolom gevolgd door de virussen en daarna de nog kleinere deeltjes zoals bijvoorbeeld eiwitten. Door specifiek de fractie met het virus op te vangen vindt er zuivering plaats.ionenuitwisselingschromatografieIdem als bij kolomchromatografie is de scheiding is gebaseerd op de verblijftijd in de kolom. Bij deze methode worden deeltjes langer in de kolom gehouden door verschillen in lading. Het kolommateriaal is positief geladen waardoor negatief geladen deeltjes binden. Hoe sterker de deeltjes negatief geladen zijn hoe beter de binding en hoe langer ze op de kolom blijven. Poliovirus bindt niet aan de kolom terwijl de resterende vervuilingen zoals eiwitten en DNA wel binden. Door de eerste fractie met het virus op te vangen vindt er verdere zuivering plaats.
inactivatieHet gezuiverde poliovirus wordt geïnactiveerd met formaline gedurende 13 dagen. De formaline gaat een chemische reactie aan met delen van het poliovirus. Hierdoor wordt het virus gefixeerd en wordt het inactief ofwel het virus gaat dood. Het virus behoudt wel zijn D-antigene vorm die nodig is voor het opwekken van beschermende antilichamen in het lichaam.
eindformuleringBovenstaand proces wordt per poliovirus serotype uitgevoerd. Het moet dus driemaal (voor type 1, 2 en 3) gedaan worden voordat deze stap, de menging van een trivalent vaccin, kan plaats vinden. In deze stap worden, naast het mengen van de geïnactiveerde poliovirussen, ook eventuele hulpstoffen toegevoegd, die bijvoorbeeld de houdbaarheid vergroten of het immuunsysteem extra stimuleren.

Samenvatting
210
Een waardevolle dataset is verzameld op basis van de historische poliovaccin‐productie te
Bilthoven. Gegevens van meer dan 50 partijen op twee verschillende productieschalen
(700 en 1.500‐L) zijn geanalyseerd met behulp van multivariate data analyse (MVDA). Deze
statistische methode wordt aanbevolen door de ICH (Internationale Conferentie voor
Harmonisatie van Technische Voorwaarden voor de Registratie van Farmaceutica voor
Humaan Gebruik) om het wetenschappelijke begrip van productieprocessen te vergroten
en zo foutopsporing en procescontrole te verbeteren. De eerste verkennende analyse,
uitgevoerd op een enkele productie eenheid, gaf een consistente productie aan. Bekende
uitschieters (bijv. afgekeurde partijen) werden geïdentificeerd met behulp van principale
componenten analyse (PCA). Als bron van operationele variatie werd de variatie van de
input, zoals cel‐ en virus kweekmedia, aangewezen. Andere relevante procesparameters
waren onder controle en konden op basis van deze productiegegevens niet worden
gecorreleerd met de productkwaliteit. De MVDA, en de daaraan voorafgaande digitalisatie
van de beschikbare historische gegevens, heeft bijgedragen aan extra kennis van het IPV
productieproces, heeft bewezen nuttig te zijn voor het oplossen van problemen, heeft het
begrip van de beperkingen van de beschikbare gegevens vergroot en bracht
mogelijkheden voor proces verbeteringen aan het licht (Hoofdstuk 3).
Eén van de beperkingen van de productiegegevens was terug te leiden naar het
kwantificeren van het product tijdens de productie. De beschikbare test om de D‐antigeen
concentratie te bepalen in monsters, die tijdens het proces genomen worden, had een
hoge variabiliteit. Een zogenaamde snelle ELISA werd ontwikkeld en gekwalificeerd voor
de analyse van polio D‐antigeen. Het originele 20‐uur‐durende protocol werd
geoptimaliseerd door het minimaliseren van de totale incubatietijd tot 1uur. Verder werd
het signaalreagens (3,3',5,5'‐tetramethylbenzidine) vervangen door een signaalreagens
dat licht uitzendt na een chemische reactie. Dit chemiluminogene signaalreagens heeft
theoretisch een hoge signaal/ruis verhouding en heeft een hoog dynamisch meetbereik.
De snelle D‐antigeen‐ELISA bleek geschikt voor het meten van D‐antigen concentraties in
de mengsels waar het poliovirus in zit tijdens de verschillende processtappen (Hoofdstuk
4).
Om onderzoek naar procesverbeteringen voor het huidige cIPV productie proces te
kunnen doen is een up‐to‐date laboratorium schaal versie van het bestaande grootschalige
IPV productie proces opgezet. Hiervoor is de kennis die uit de multivariate data analyse is
gekomen gebruikt. Met dit zogenaamd scale‐down model kunnen experimenten in het
laboratorium gedaan worden die vervolgens direct, zonder schaalvergrotings‐
experimenten, te vertalen zijn naar de productieschaal. Als eerste zijn kleine versies van de
losse productie stappen ontwikkeld. Deze kleine productie eenheden zijn vervolgens
achter elkaar geschakeld zoals bij de grote productieschaal zodat de effecten van variaties
Samenvatting
211
in het ene productie apparaat op de rest van het productieproces in het laboratorium
bestudeerd kunnen worden.
Het ontworpen scale‐down model bleek een goede weergave van de grootschalige
werkelijkheid. Bij gebruik met de bestaande standaard instellingen bleek het scale‐down
model voor de cel en viruskweek (2,3‐L) vergelijkbaar met de tegenhanger op grote schaal.
Ook de afzonderlijke productie apparaten die gebruikt worden bij de zuivering: de
clarificatie, concentratie, chromatografie op basis van deeltjesgrootte,
ionenuitwisselingschromatografie, en inactivatie, bleken in overeenstemming met de
grote schaal. Het model kan nu gebruikt worden om procesvariaties en productkwaliteit
te bestuderen. Tenslotte is aangetoond dat de scale‐down modellen gebruikt kunnen
worden om op laboratoriumschaal een trivalent poliovaccin met vergelijkbare
eigenschappen als het product geproduceerd op productieschaal te maken (Hoofdstuk 5 ).
De opkomst van wegwerpartikelen in GMP producties (GMP of “good manufacturing
practice” is een kwaliteitsborgingssysteem voor een goede wijze van produceren van
farmaceutische producten) heeft geleid tot de studie naar alternatieven voor de
clarificatie (Hoofdstuk 5) en alternatieve Wave‐type bioreactoren (Hoofdstuk 6). Dit type
bioreactoren maakt gebruik van gesteriliseerde wegwerpzakken, die
schoonmaakprotocollen en overgangsprocedures tussen productie processen voor
verschillende producten kunnen vergemakkelijken. Wave‐type bioreactoren maken, voor
het realiseren van menging, gebruik van verticale verplaatsing die lijkt op een wipwap
beweging, of van zowel verticale als horizontale verplaatsing waardoor de vloeistof
minder klotsend beweegt. Met behulp van een design of experiments (DoE) aanpak, zijn
modellen voor de mengtijden in beide bioreactoren ontwikkeld. Voor het eerste type
bioreactoren (met alleen verticale verplaatsing) bestaat een voorschrift voor het kweken
van Vero cellen. De instellingen voor het kweken van Vero‐cellen in andere bioreactor zijn
gekozen op basis van vergelijkbare mengtijden. Vero‐cellen, die gehecht aan Cytodex 1
microcarriers groeien, vertoonden vergelijkbare groeikarakteristieken. Consumptie van
voedingsstoffen en productie van afvalstoffen waren vergelijkbaar, evenals de poliovirus‐
productie.
Gezien het streven van de WHO naar een IPV productieproces met verhoogde biologische
veiligheid is een sIPV ontwikkeld. Het cIPV proces is gebruikt als basis voor het nieuwe sIPV
proces. Kleine aanpassingen zoals verlaagde viruskweek temperatuur zijn toegepast op dit
proces. Ook is het geselecteerde (Hoofdstuk 5) wegwerpfilter voor de clarificatie gebruikt.
Om snel sIPV partijen voor klinische studies, waarbij het product op veiligheid en
werkzaamheid in mensen getest kan worden, te kunnen maken is verder geen
procesoptimalisatie en/of modernisatie gedaan. sIPV is geproduceerd op industriële schaal
gevolgd door eindformulering met en zonder aluminium als immuun‐stimulerende stof
Samenvatting
212
(Hoofdstuk 7). De eindproducten voldeden aan de kwaliteitscriteria, waren immunogeen
in ratten, lieten geen toxiciteit in konijnen zien en konden vrijgegeven worden voor testen
in de mens. Hoewel er een veilig en werkzaam product was bereid, was de
productieopbrengst erg laag, wat hogere productiekosten tot gevolg heeft. Verdere
procesontwikkeling is dus nodig om een betaalbaar sIPV te verkrijgen.
Vooral de opbrengst van Sabin poliovirus type 2 na de laatste zuiveringsstap middels
ionenuitwisselingschromatografie was laag. Om te bepalen of dit resultaat komt door een
verschil in het iso‐elektrisch punt (pI; zuurgraad waarbij het molecuul geen lading heeft)
van de poliovirussen is een methode opgezet voor de pI bepaling van levende virussen
(Hoofdstuk 8).Deze methode is gebaseerd op gesloten circuits om de biologische
veiligheid te waarborgen. Vervolgens zijn de pIs van complete intacte poliovirussen
bepaald. Zowel de poliovirussen die gebruikt worden bij cIPV – Mahoney (type 1), MEF‐1
(type 2), Saukett (type 3) – productie alsook de poliovirussen die gebruikt worden bij OPV
en sIPV – Sabin poliovirus type 1, 2 en 3 – zijn geanalyseerd. Het bleek dat de pI van Sabin
poliovirus type 2 dicht bij de pH ligt die gebruikt wordt tijdens de chromatografie,
waardoor dit poliovirus gevoelig voor zelf‐aggregatie. Deze zelf‐aggregatie is
waarschijnlijk de belangrijkste reden voor de lage productopbrengst (zoals gevonden in
Hoofdstuk 7) en het voorkomen hiervan is het voornaamste aandachtspunt voor
procesoptimalisatie.
Naast optimalisatie van de zuivering is de optimalisatie van de kweek, en met name de
virusopbrengst na cel‐ en viruskweek, bestudeerd (Hoofdstuk 9). Vero cellen, die gehecht
aan microcarriers (Cytodex 1; 3 g L‐1) groeien, zijn gekweekt op medium vrij van dierlijke
componenten in geroerde bioreactoren. Verschillende strategieën voor media verversing:
dagelijkse media vervanging (semi‐batch), continue media verversing (perfusie) en
recirculatie van media, werden vergeleken met batchkweek waarbij het medium niet
vervangen wordt. Mediaverversing zorgde voor verhoogde cel dichtheden, variërend van 1
× 106 cellen mL‐1 tijdens batchkweek tot 1,8, 2,7 en 5,0 x 10⁶ cellen mL‐1 tijdens
respectievelijk de semi‐batch, perfusie en recirculatie strategie. De effecten van deze
verschillende celkweek strategieën op de latere poliovirus productie zijn onderzocht.
Verhoogde cel dichtheden resulteerden in tot 3 keer hogere D‐antigeen niveaus in
vergelijking met die bij batchkweek. Echter, de specifieke D‐antigeen productie per cel was
lager wanneer cellen werden geïnfecteerd bij hogere cel dichtheden. Dit effect is eerder
beschreven voor andere cellijnen en virussen. De semi‐batch strategie leidde tot de
hoogste cel specifieke D‐antigeen productie. De verhoogde productopbrengsten, die
gemakkelijk te bereiken zijn met deze hogere cel dichtheid kweekmethode, toonde de
mogelijkheid voor een beter gebruik van bioreactorcapaciteit voor het bereiden van
poliovaccins. Deze toepassing kan uiteindelijk de vaccinkosten verminderen. Verder blijkt

Samenvatting
213
het gebruik van cel ‐ en viruskweekmedium vrij van dierlijke componenten mogelijk voor
de modernisering van virale vaccins voor de mens.
Om de betaalbaarheid van sIPV te beoordelen zijn de productiekosten bepaald (Hoofdstuk
10 ). De productiekosten voor sIPV, geproduceerd zoals beschreven in hoofdstuk 7, laten
de noodzaak van procesoptimalisaties zien. Een grote stap kan plaatsvinden, wanneer de
semi‐batch strategie in combinatie met dierlijke componenten vrij media wordt toegepast,
zoals beschreven in hoofdstuk 9. De productiekosten verminderen dan met tenminste een
factor 2. Verdere verlaging van de kosten kan gerealiseerd worden door optimalisatie van
de zuivering. Bij vergelijkbare productopbrengsten als die van van cIPV kunnen de
proceskosten verder verlaagd worden. Door schaalvergroting van twee 350‐L
bioreactoren naar twee 1.000‐L bioreactoren kunnen de productiekosten bijna gehalveerd
worden. Deze kostenanalyse toont de haalbaarheid van een betaalbaar sIPV aan.

The research described in this thesis was financed by the Institute for Translational
Vaccinology (part of the ministry of Health, Welfare and Sport, the Netherlands). Chapters
2, 7 and 9 were supported by the World Health Organization using funds provided by a
grant from the Bill and Melinda Gates Foundation. Chapter 6 was partially supported by NL
Agency (no. IVG091769).
Financial support from Wageningen University and the Institute for Translational
Vaccinology for printing this thesis is gratefully acknowledged.
Cover design by Cees van Dorland