“th b i y c ”“the best is yet to come”€¦ · “th b i y c ”“the best is yet to...
TRANSCRIPT
“Th B i Y C ”“The Best is Yet to Come”
J i h W O’C JJeremiah W. O’Connor, Jr.
Grant’s Interest Rate Observer2009 Fall ConferenceSeptember 22, 2009
I have three points to make:
1. The deluge of real estate debt defaults and restructurings is now in full swing.
2. Well chosen investment real estate is now a better value than stocks and bonds.
3. Sourcing compelling real estate deals is a very difficult strategy to implement.
1
Our discussion covers five topics:
1. An overview of investing conditions.2. A comparison of the 1990-92 blow up with 2007-
2010.3. An examination of the looming tsunami of debt
defaults.4 The pros and cons of investing in commercial real 4. The pros and cons of investing in commercial real
estate.5. The qualitative and quantitative metrics we use to
discern investment valuediscern investment value.
2

I Overview
1. We view the economic crisis we are living through as a secular shift in the dynamics of our economy, not merely a severe cyclical recession.cyclical recession.
2. The savings rate will go up long-term, spending down, and consumption as a % of GDP will settle close to its post war norm of 62% versus the more recent 70% This will result in norm of 62% versus the more recent 70%. This will result in substandard growth in GDP for the foreseeable future.
3. We don’t see the current real estate blow-up as analogous to the early 90s given the causes are different and the cure will the early 90s, given the causes are different and the cure will take much longer.
4. We also think the asset allocation model that has so dominated endowment strategy for so long heavy reliance on illiquid endowment strategy for so long, heavy reliance on illiquid alternative assets, is severely stressed and that many institutions will become more risk averse and solve for absolute returns that will support their operations.
3
Overview
5. With stock markets up 50% from their March lows, investment psychology has turned positive and most believe we are well past the lows: most investors talk about their concern that there may be a double dipthere may be a double dip.
6. We think we are still on the first leg down, witness the continued economic contraction, dramatic job losses, reduction in consumer spending and stagnant business reduction in consumer spending and stagnant business investment. Probably a bounce in inventories in Q3 but no sense of a sustainable uptrend.
7 At this conference in the fall of ‘05 we observed that real 7. At this conference in the fall of ‘05, we observed that real estate seemed overpriced compared to other asset classes. Then, the S&P stood at 1191 and the RMZ at 793. From that point the S&P is down only 10% and the RMZ down 25%: private markets are off more. So, not a bad call.private markets are off more. So, not a bad call.
8. The escalating dysfunction in the real estate credit markets is why we title our presentation “The best is yet to come” - It’s like watching a train wreck in slow motion where there is no
4
like watching a train wreck in slow motion where there is no manual for untangling the wreckage.

Overview
9. The debt “blow up” is not a 2017 phenomenon but is starting now with $1 trillion+ of bank loan and CMBS maturities in the next three years Future projected bank and CMBS losses on next three years. Future projected bank and CMBS losses on the $3.5 trillion of commercial real estate debt outstanding will be 10% - 15% or $350 billion - $500 billion.
10. The current crisis is by far the most serious in the post war. It f lt t i l b l d th d f ltiIts faults are systemic, global, and the end of a multi-generational debt binge that will be slow to correct – so comparisons to the early 90s are off the mark.
11. While credit spreads are down and bank liquidity up, there is p q y p,very little lending to the private sector. So, all the government programs combined get a B– at best.
5
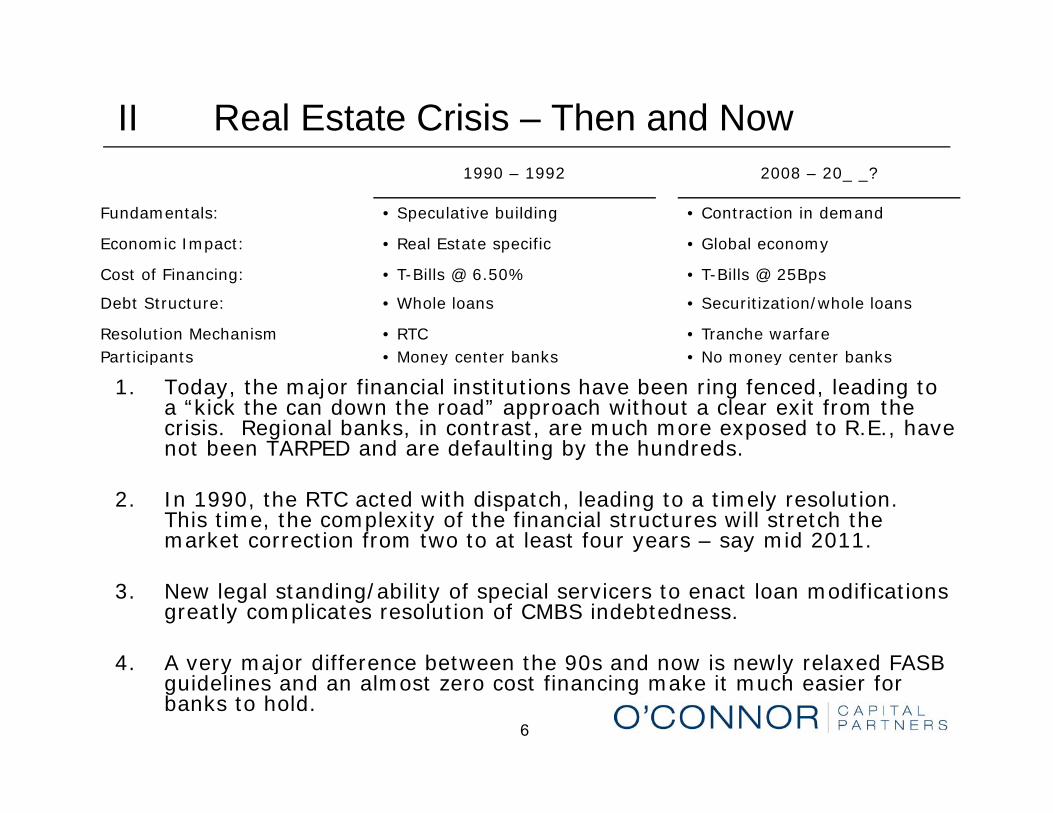
II Real Estate Crisis – Then and Now1990 – 1992 2008 – 20_ _?
Fundamentals: • Speculative building • Contraction in demand
Economic Impact: • Real Estate specific • Global economy
Cost of Financing: • T-Bills @ 6.50% • T-Bills @ 25Bps
Debt Structure: • Whole loans • Securitization/whole loans
Resolution MechanismParticipants
• RTC• Money center banks
• Tranche warfare• No money center banks
1. Today, the major financial institutions have been ring fenced, leading to a “kick the can down the road” approach without a clear exit from the crisis. Regional banks, in contrast, are much more exposed to R.E., have not been TARPED and are defaulting by the hundreds.
Participants • Money center banks • No money center banks
g y
2. In 1990, the RTC acted with dispatch, leading to a timely resolution. This time, the complexity of the financial structures will stretch the market correction from two to at least four years – say mid 2011.
3. New legal standing/ability of special servicers to enact loan modifications greatly complicates resolution of CMBS indebtedness.
4 A very major difference between the 90s and now is newly relaxed FASB
6
4. A very major difference between the 90s and now is newly relaxed FASB guidelines and an almost zero cost financing make it much easier for banks to hold.
III Credit Market Dynamics
1. Banks remain over committed to real estate, undercapitalized and there is no way to fill the refinancing gap without a return of the “ h d ” b ki k t Thi ill t k TALF ill d “shadow” banking market. This will take years. TALF will do some good. PPIP is more of a question.
2. Creditors’ rights are being trashed in bankruptcy courts and CMBS i t dit t ft l d ft d inter-creditor agreements were often poorly drafted.
3. It is difficult to become a bull on the wholesale purchase of tranches of securitized debt – what are your actionable rights and how can you get to the collateral? This is a rapidly evolving storyhow can you get to the collateral? This is a rapidly evolving story.
4. C&I Loans outstanding are down ~5% year over year. There is no net new credit for real estate: not to refinance nor to build; bank credit is contracting See Exhibit 1credit is contracting. See Exhibit 1.
5. A snapshot of commercial mortgages outstanding by holders appears on Exhibits 2 and 3.
7
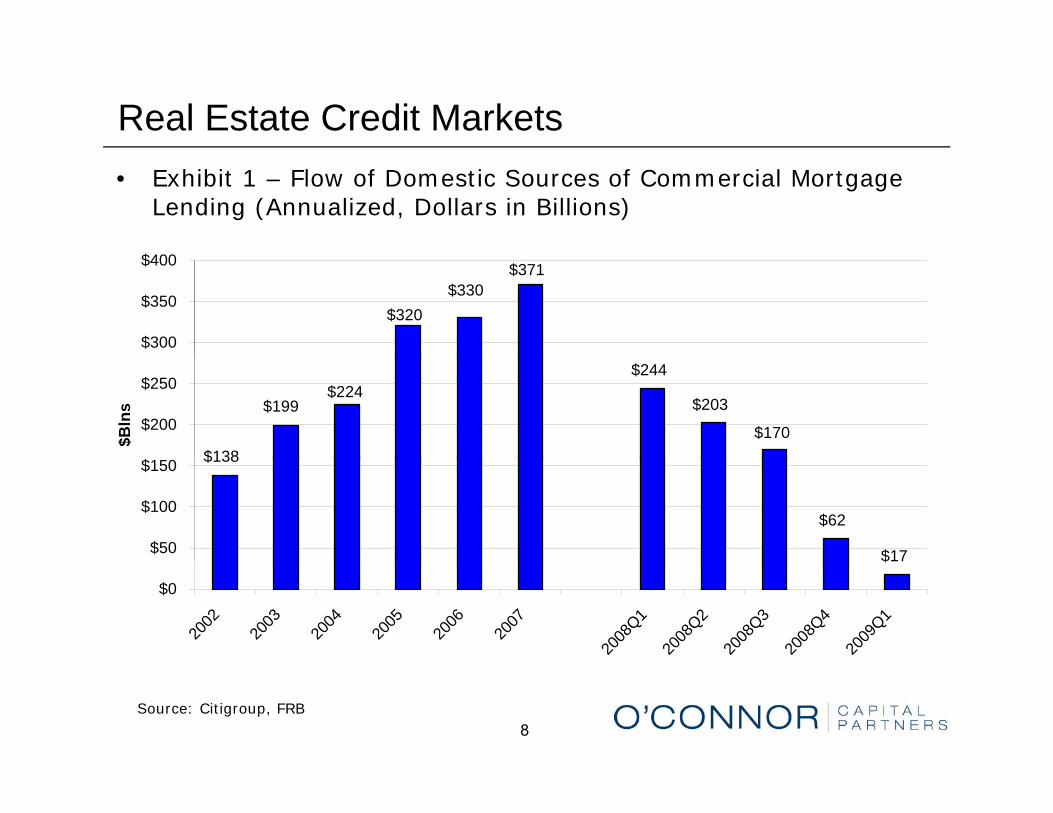
Real Estate Credit Markets• Exhibit 1 – Flow of Domestic Sources of Commercial Mortgage
Lending (Annualized, Dollars in Billions)
$371$330
$320
$300
$350
$400
$170
$203
$244$224
$199
$138
$200
$250
$Bln
s
$17
$62
$138
$50
$100
$150
$17
$0
2002
2003
2004
2005
2006
2007
2008
Q1
2008
Q2
2008
Q3
2008
Q4
2009
Q1
8Source: Citigroup, FRB
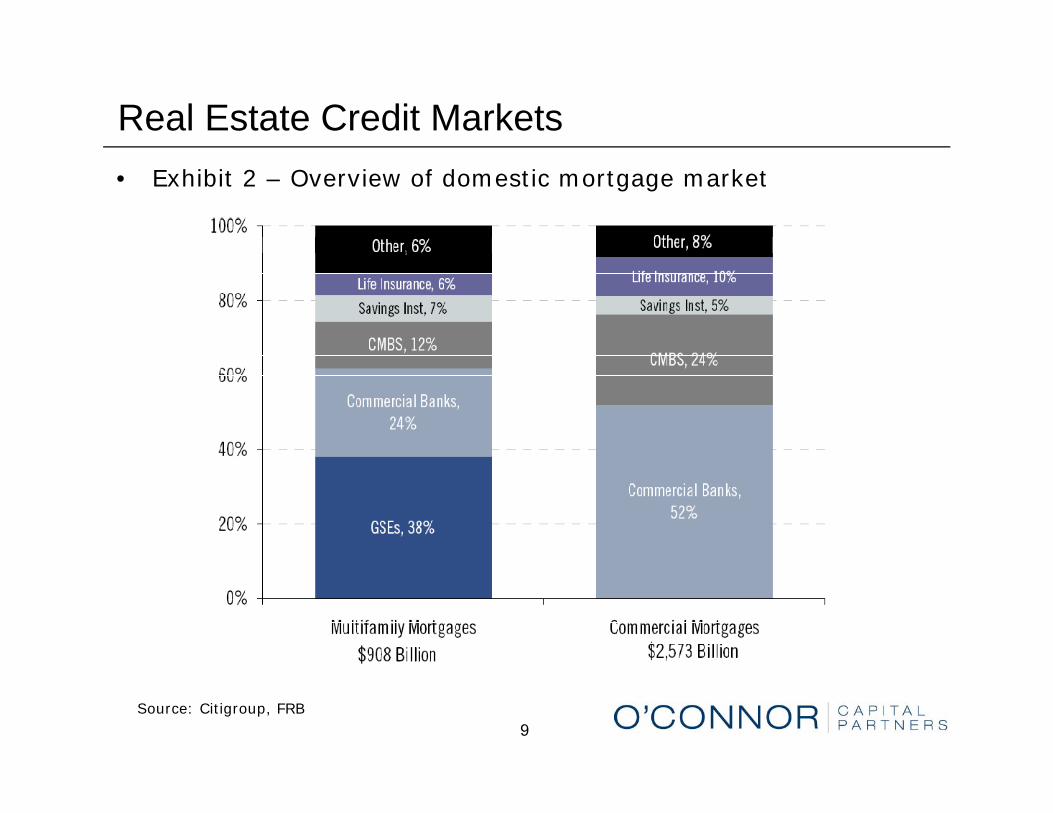
Real Estate Credit Markets• Exhibit 2 – Overview of domestic mortgage market
9Source: Citigroup, FRB

Real Estate Credit Markets• Exhibit 3 – Commercial Bank Loan Portfolio Composition
in $ Billions
10Source: Citigroup, FRB, FDIC, FFIEC, MBA

Real Estate Credit Markets• A further breakdown of loan portfolios indicates that the smaller
the bank, the greater concentration in real estate lending.
Exhibit 4 - Loan Portfolio Composition By Bank Asset Value
Bank Asset Size
p y
Group A: >$1,000 bln
Group B: $100bln - $1,000bln
Group C: $20bln - $100bln
Group D: $1bln - $20bln
11Source: Citigroup, SNL

Real Estate Credit Markets
10. While the stimulus may have averted a depression, the policy of running deficits of 13%+ of GDP is not sustainable - as gHerbert Stein once said, “what’s unsustainable will stop”. Monumental deficits and large tax increases will slow economic growth. When George W. Bush was elected government debt was $6 trillion; as Obama begins it is $12 trillion.
11. We think we are at the end of a multi-generational debt bubble. The “new normal” will look more like 1977 or even 1957 rather than 2007 with a much higher savings rate, slower growth and a roller coaster economy for the next decadegrowth and a roller coaster economy for the next decade.
12
Securitization – The “Shadow Banking” System
1. The CMBS business, now essentially defunct, is a phenomenon of the past decade the past decade.
2. With about $623 billion net outstanding, losses are now forecast to total some ~$100 billion.
3 h dd d l b k l f l3. When added to commercial bank losses of similar asset type, this raises the total to ~$500 billion.
4. Exhibit 5 shows the maturities of CMBS and distinguishes t it d f lt d t b k t l t l ti f maturity defaults due to above market loan-to-value ratios from
covenant defaults due to lower cash flows. That is to say we are facing the double whammy of rents rolling down and re-fi loan to value ratios plummeting as well. p g
13

Securitization – The “Shadow Banking” System• Exhibit 5 – CMBS Maturity Schedule with losses.
160
100
120
140
40
60
80
($bl
ns)
0
20
40
2009 2010 2011 2012 2013 2014 2015 2016 2017 2018
• Term Losses – triggered by cash flow stress
• Maturity Losses – triggered by inability to refinance
Maturities w/o Loss Term Losses Maturity Losses
14
Maturity Losses triggered by inability to refinance
Source: DB, excludes defeased loans

Securitization – The “Shadow Banking” System
5. While CMBS defaults will be very large, on a percentage basis, banks will be impacted the mostbanks will be impacted the most.
6. Banks could not compete with the spreads offered by CMBS transactions – they were forced to compete by lending to shorter-term more illiquid projects resulting in a more risky shorter term more illiquid projects… resulting in a more risky portfolio composition, given a much higher percentage of construction and transitional loans.
15

Whole Loan vs CMBS Credit Quality• Exhibit 6 – Delinquency Rates – Bank vs CMBS
4.0%
2 5%
3.0%
3.5%
Rat
e (%
)
1.5%
2.0%
2.5%
Del
inqu
ency
0 0%
0.5%
1.0%
Tota
l
0.0%2006 2007 2008 2009
Avg Bank CMBS
16Source: Deutsche Bank, Intex, SNL Financial

Securitization – The “Shadow Banking” System7. PPIP and TALF both have potential size of $1 trillion each,
• Market players estimate that the actual size will be much smaller particularly for PPIPsmaller, particularly for PPIP.
• So far, only ~$3 billion of legacy CMBS is borrowed under the TALF facility.
8 l h C h S k h f8. Earlier this year, Citi estimates the ABS market to have a face value of $8.7 trillion, with an estimated loss of $1.7 trillion.
TALF Issuance by Month TALF Issuance by Type
17
Source: Banc of America Securities – Merrill Lynch
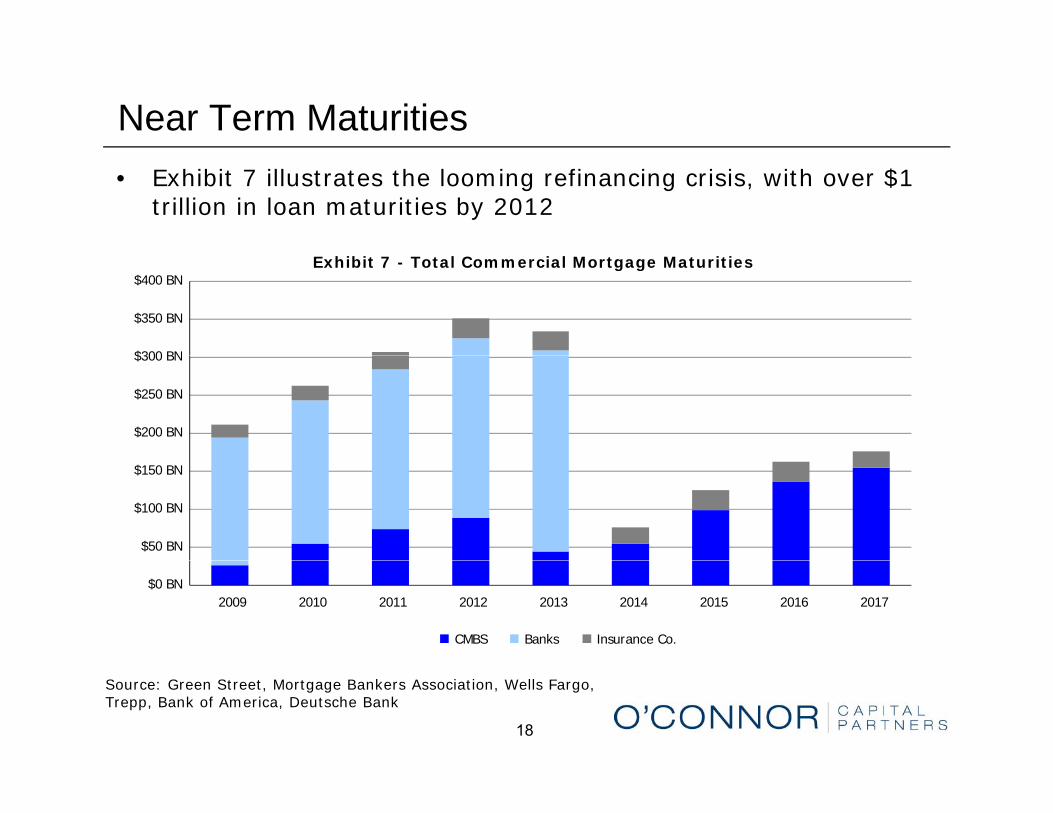
Near Term Maturities• Exhibit 7 illustrates the looming refinancing crisis, with over $1
trillion in loan maturities by 2012
Exhibit 7 - Total Commercial Mortgage Maturities
$300 BN
$350 BN
$400 BN
$200 BN
$250 BN
$300 BN
$50 BN
$100 BN
$150 BN
$0 BN2009 2010 2011 2012 2013 2014 2015 2016 2017
CMBS Banks Insurance Co.
18
Source: Green Street, Mortgage Bankers Association, Wells Fargo, Trepp, Bank of America, Deutsche Bank

Real Estate and Major Banks
9. For all FDIC insured banks, Construction and Development loans are 40% of Equity Capital – add Nonfarm Nonresidential loans are 40% of Equity Capital add Nonfarm Nonresidential loans secured by real estate and the number is 114%.
10.For major banks the picture is more systemically troublesome as CRE is a major multiple of Tangible Common Equity (“TCE”). CRE is a major multiple of Tangible Common Equity ( TCE ).
CRE as % TCE
JPM 118%JPM 118%
BAC 225%
WFC 366%Source: Citigroup
11.Non-money center banks will provide the best buying opportunities – the FDIC will sell loans ultimately clearing up the
19
pp y g psystem much like the RTC.

IV Real Estate Equity Markets1. Real estate equity markets can’t be expected to improve until we
have job growth and credit available.
2 Transactional volume is down 90%+: if you don’t have to sell 2. Transactional volume is down 90%+: if you don t have to sell, don’t: if you do and your lot size is over $50 million, you’ve got real problems.
3. The public real estate markets, represented by the Morgan 3. The public real estate markets, represented by the Morgan Stanley REIT index (RMZ) are up dramatically from their lows in March (+70%) but still half their high of two years ago.
4. Many high quality issuers have sold stock to buttress their 4. Many high quality issuers have sold stock to buttress their balance sheets.
20

Real Estate Equity Markets5. We have also seen the acceptance of large new finance REITs
like Starwood, formed to take advantage of the distress in real estate credit. Many are in line to follow including Colony, Apollo, Annaly.
6. REIT investing is a sound component of an overall real estate strategy and it may be that the public markets will play a larger
l i filli h “h l ” h i d h d i role in filling the “hole” than is now expected, as happened in the early ’90s. The yield on the RMZ today is 5.6%.
7. That said, we believe, in this cycle, it is more of a “stock pickers” k t th th b i th market rather than buying the averages.
• i.e., building specific investments where credit market dynamics will serve up some astounding values.
21

Real Estate Equity Markets• S& P 500 yield now 2.5%, 10 Year Treasury 3.5%, BAA credits 6.4%: Real Estate 7-9%
• Exhibit 8 - The unlevered return expectations for real estate spread to the BAA corporate bond yield has widened
22
Source: Green Street
The Case Against Real Estate1. Rents are declining in all major property types: The most extreme
decline in office and the least in urban housing.
2 The markets have not yet cleared and many gigantic deals done at 2. The markets have not yet cleared and many gigantic deals done at the market top have yet to be recapped for the long term (EOP-Blackstone, Hilton, Extended Stay, Archstone, Stuyvesant Town, CARR-America, EOP Austin & Chicago, etc.).
3. Can’t see stabilization of rental markets until job market improves.
4. Expect an historic adjustment to the size of the mall industry owing to the bankruptcy of many department and specialty stores and to the bankruptcy of many department and specialty stores and unsustainable rent/sales ratios.
5. Credit market conditions worst in 50+ years and no respect for creditor rights – GGP, Extended Stay.g , y
23
The Case For Real Estate1. Real estate is in the ash can: stocks and bonds are fully priced.
While very few trades, what has transacted has been at steep discounts to prices two years ago.
2. New construction of almost any type has come to a halt, capping supply.
3 The Federal Budget out of control which will lead in time to a fall in 3. The Federal Budget out of control which will lead in time to a fall in the US$ against currencies, commodities and hard assets like real estate.
4. Investor sentiment is very negative.4. Investor sentiment is very negative.
5. Lack of credit puts the buyer with cash in the driver’s seat – more so than in decades.
6 P ibl t b lit t t di t t l t t ith 6. Possible to buy quality assets at discount to replacement cost with good positive cash flow after debt service.
24

Worldwide Plaza Acquisition - NYC• 1.9mm sf Class A office building in Midtown West.
F b 2007 J l 2009Feb 2007 July 2009
Purchase Price $2.1bln $605mm
Price per sf $1,105/sf $318/sfp $ , / $ /
NOI $57.6mm $37.2mm
Debt Service ~$157.2mm $20.5mm
Cash Flow1 ~$(99.6)mm $16.7mm
1 Excludes Capital Costs
25

Qualitative and Quantitative Metrics1. Rule 1 – quality, quality, quality, location, location, location – don’t
lower your standards.
2 Rule 2 – most important – buy at discount to replacement value 2. Rule 2 most important buy at discount to replacement value, with rents adjusted to market and with resulting NOI at a good spread to the cost of finance.
3 Have conviction to buy “A” quality buildings in the following asset 3. Have conviction to buy A quality buildings in the following asset classes below replacement cost with strong tenancy.
• “A” location multifamily in supply constrained urban markets.
I fill i hb h d h i t i hi h t th • Infill neighborhood shopping center in high net worth areas with good credit tenants.
• Urban office in supply constrained markets with dynamic i d t bindustry base.
• Big Box retail with strong sales psf and credit tenancy.
26

Where Do We Go From Here: Who Knows?1. Like anyone managing a business you read a lot to try to
formulate the best direction for your firm. That said, I have never been so unsure of the road ahead or so concerned by the trends in government spending and controls.
2. I don’t see how the current policy of tripling our nation’s debt in ten years can end well. My bias would be to revert to what has
k d h l b h ) l b dworked in the past to stimulate job growth; a) lower tax burdens on business, b) investment tax credits, c) job creation credits, d) accelerated depreciation etc.
3 M ti lik t h t i h i i t di if 3. My reaction like yours, to what is happening,is to diversify more than in the past, by asset class and currency.
4. I very much hope the emerging majority opinion proves correct –th t i f l th i t ti d th t ti id that meaningful growth is starting now and that my timid pessimism won’t hold the day.
27

Where Do We Go From Here: Who Knows?
5. My prime point is that overweighting real estate (and other hard assets) compared to stocks and bonds should work whether we face a V or a W or a roller coaster in our whether we face a V or a W or a roller coaster in our economy. You solve for a 7-9% current return, pre-debt on market rents and 3% or so growth. If it is a W, cash flow covers outgoings and a low per pound cost is a hedge against a depreciating dollar. If I am wrong and we have a V, rents and occupancies will firm up much quicker, cap rates will compress, and returns will be much higher than the base casecase.
Thanks for listening.
28