thailand promotion index (tpi)-ns09feb16 · thailand promotion index (tpi) tpi is an index to...
TRANSCRIPT

hyper-trade.com – a3retail.com –hptariane.com
Jan 2016
January 16 Thailand
Promotion Index
Retail Consulting
hyper-trade.com – a3retail.com –hptariane.com Page 2
RetailConsulting
What Promotion Insights?What Promotion Data we Capture?The promotion we capture are the number of times a product appears in a brochure, the details of the brochure or Newspaper ads from retailers (date, duration and retailer) as well as the details of the product (brand, category, mechanics, price)
Why this information is important?In less than 2 years, despite the rise of digital retail and social network usage, the number of promotions published every month has more than doubled in Modern Trade, reaching 21,000 products. The frequency keeps growing.
It means that Shoppers are increasingly more exposed to brochures and what they see in the mailers or in the Newspaper ads. Consequently, it means that the opportunity to be seen for a Brand in a brochure or a newspaper has become more important, from a shopper impact perspective, than the number of days a product has been in promotion. It also means that the alignment between brochures or Newspaper promotions and in-store display is becoming critical to capture shoppers’ attention during their Path To Purchase.
From a Brand Plan, Joint Business Plan or Category Management perspective, these new metrics become critical Activity Plan to support a Brand Sales & promotion strategy as well as yearly negotiations for Retailers.The risks of ignoring these metrics are to develop a strategy that would not integrate the evolution of the messages shoppers receive.
What about Nielsen?Nielsen data propose another perspective. They link the number of days a product has been in promotion at a retailer and the impact on POS data. Nielsen data are extremely useful to measure Promotion’s effectiveness and Return on Investment.
A3 Retail data focus more on 2 other critical dimensions:• What do shopper see, where and how often: frequency, share of voice, promotion price
index, promotion mechanics• What are the levels of promotion investments from retailers or manufacturers in specific
categories and channels
hyper-trade.com – a3retail.com –hptariane.com Page 3
RetailConsulting
Executive Summary: Jan 2016☑ Thailand Promotion Index1
The Chinese New Year events impacted the number of promotions, bring the TPI at 145%.While slightly higher than December 15, it remains 5 points below last Year Promotion indexof February. Wholesalers and Hypermarkets keep on lowering their promotion activities,which seems to be a window of opportunity for CVS and Tops Superkoom.
☑ Promotion Price Index2
January Promotion Price index is increasing,. While it remains below 100% (97.5%) it is thehighest index since September ‘15. Are we seeing the end of a deflationist trend that hasbeen lasting for more than 6 month?
Big C confirms its positioning as a Value Retailer with the lowest Price Index at 99.8.
☑ Retail Promotion StrategiesTraditionally, CNY sees an important rise of Fruit & Vegetable sales as well as Non-Foodseasonal items for Offerings. Makro led the charge of F&V with a 5% share of voiceincrease, while Tesco and Tops Superkoom strongly focused on Grocery products.
☑ Top Traffic Generating Brochures3
Big C continued to have the biggest visibility with 3 out of 5 Top traffic generatingbrochures. With a total of 100 pages of promotion and more than 2,300 items onpromotions. A new comer is definitely Tops Superkoom. With 554 promotion offered inJanuary, it almost equaled Makro.
☑ Top 5 Promoted categoriesCleaning products – a seasonal trend for Chinese New Year – are the most promotedcategories. The second place achieved by carbonated drinks seem to confirm that duringconsumers consider CSD’s as an affordable treat during difficult times.
1) Thailand Retail Promotion Index (TPI) is the number of promotions monthly featured in brochures and daily newspapers by 4 LeadingRetailers in Thailand: Tesco (Hyper and extra), Big C (Hyper and extra), Tops Supermarket/Superkoom and Makro (GM and Food Service).The starting date - our base 100 is on January 2013.
2) See definition of Promotion Price Index in Glossary3) Traffic Generating Brochure is a brochure that has more promotion products than another brochure, the more promotion product the
brochure has, the more we consider it can generate traffics.
hyper-trade.com – a3retail.com –hptariane.com Page 4
RetailConsulting
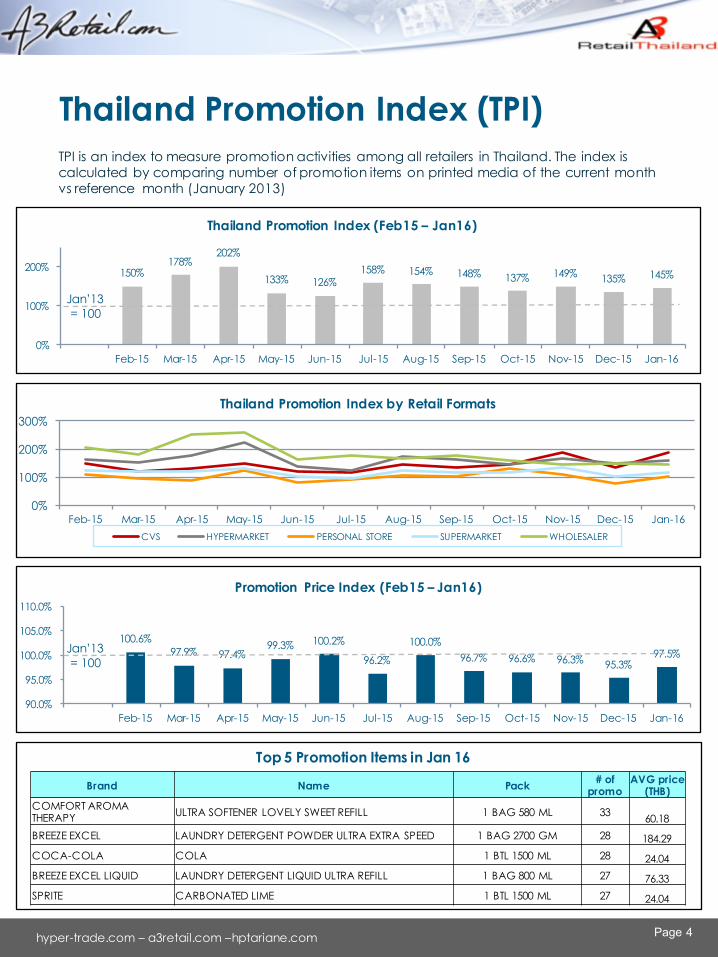
Thailand Promotion Index (TPI)TPI is an index to measure promotion activities among all retailers in Thailand. The index is calculated by comparing number of promotion items on printed media of the current month vs reference month (January 2013)
150%178%
202%
133% 126%158% 154% 148% 137% 149% 135% 145%
0%
100%
200%
Feb-15 Mar-15 Apr-15 May-15 Jun-15 Jul-15 Aug-15 Sep-15 Oct-15 Nov-15 Dec-15 Jan-16
Thailand Promotion Index (Feb15 – Jan16)
Jan’13= 100
0%
100%
200%
300%
Feb-15 Mar-15 Apr-15 May-15 Jun-15 Jul-15 Aug-15 Sep-15 Oct-15 Nov-15 Dec-15 Jan-16
Thailand Promotion Index by Retail Formats
CVS HYPERMARKET PERSONAL STORE SUPERMARKET WHOLESALER
Brand Name Pack # of promo
AVG price (THB)
COMFORT AROMA THERAPY ULTRA SOFTENER LOVELY SWEET REFILL 1 BAG 580 ML 33 60.18BREEZE EXCEL LAUNDRY DETERGENT POWDER ULTRA EXTRA SPEED 1 BAG 2700 GM 28 184.29COCA-COLA COLA 1 BTL 1500 ML 28 24.04BREEZE EXCEL LIQUID LAUNDRY DETERGENT LIQUID ULTRA REFILL 1 BAG 800 ML 27 76.33SPRITE CARBONATED LIME 1 BTL 1500 ML 27 24.04
Top 5 Promotion Items in Jan 16
100.6%97.9% 97.4%
99.3% 100.2%
96.2%
100.0%96.7% 96.6% 96.3% 95.3%
97.5%
90.0%
95.0%
100.0%
105.0%
110.0%
Feb-15 Mar-15 Apr-15 May-15 Jun-15 Jul-15 Aug-15 Sep-15 Oct-15 Nov-15 Dec-15 Jan-16
Promotion Price Index (Feb15 – Jan16)
Jan’13= 100
hyper-trade.com – a3retail.com –hptariane.com Page 5
RetailConsulting
1) Retailer Price Index is the positioning of a product [or a group of product] at a retailer compared to the average sellingprice of the same product [or group of product] in the selected retailer scope. The Promotion Price Index is calculated onproducts that are simultaneously on promotion at all retailers in the scope at least one day during a calendar month.
2) Including the rebranding of Top Supermarket to Top Superkoom3) Show the ratio percentage of number of promotion items in the selected category compared to all promotion items in all
categories for the same retailer during the same period.
Promotion strategies
Key retailers’ Share of Voice3
Top5 promoted categories
Key retailers’ promotion activities
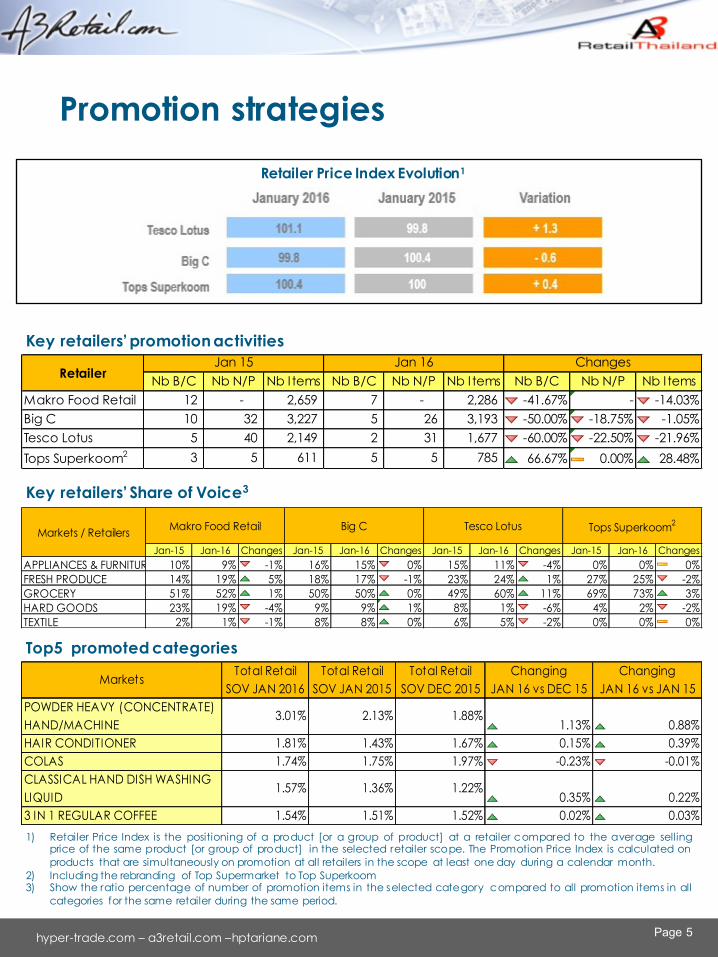
Retailer Price Index Evolution1
Nb B/C Nb N/P Nb I tems Nb B/C Nb N/P Nb I tems Nb B/C Nb N/P Nb I temsMakro Food Retail 12 - 2,659 7 - 2,286 -41.67% - -14.03%Big C 10 32 3,227 5 26 3,193 -50.00% -18.75% -1.05%Tesco Lotus 5 40 2,149 2 31 1,677 -60.00% -22.50% -21.96%Tops Superkoom2 3 5 611 5 5 785 66.67% 0.00% 28.48%
Jan 16Retailer
Jan 15 Changes
Jan-15 Jan-16 Changes Jan-15 Jan-16 Changes Jan-15 Jan-16 Changes Jan-15 Jan-16 ChangesAPPLIANCES & FURNITURE 10% 9% -1% 16% 15% 0% 15% 11% -4% 0% 0% 0%FRESH PRODUCE 14% 19% 5% 18% 17% -1% 23% 24% 1% 27% 25% -2%GROCERY 51% 52% 1% 50% 50% 0% 49% 60% 11% 69% 73% 3%HARD GOODS 23% 19% -4% 9% 9% 1% 8% 1% -6% 4% 2% -2%TEXTILE 2% 1% -1% 8% 8% 0% 6% 5% -2% 0% 0% 0%
Markets / Retailers Big C Tesco Lotus Tops Superkoom2Makro Food Retail
Total Retail Total Retail Total Retail Changing ChangingSOV JAN 2016 SOV JAN 2015 SOV DEC 2015 JAN 16 vs DEC 15 JAN 16 vs JAN 15
POWDER HEAVY (CONCENTRATE) HAND/MACHINE
3.01% 2.13% 1.88%1.13% 0.88%
HAIR CONDITIONER 1.81% 1.43% 1.67% 0.15% 0.39%COLAS 1.74% 1.75% 1.97% -0.23% -0.01%CLASSICAL HAND DISH WASHING LIQUID
1.57% 1.36% 1.22%0.35% 0.22%
3 IN 1 REGULAR COFFEE 1.54% 1.51% 1.52% 0.02% 0.03%
Markets
hyper-trade.com – a3retail.com –hptariane.com Page 6
RetailConsulting
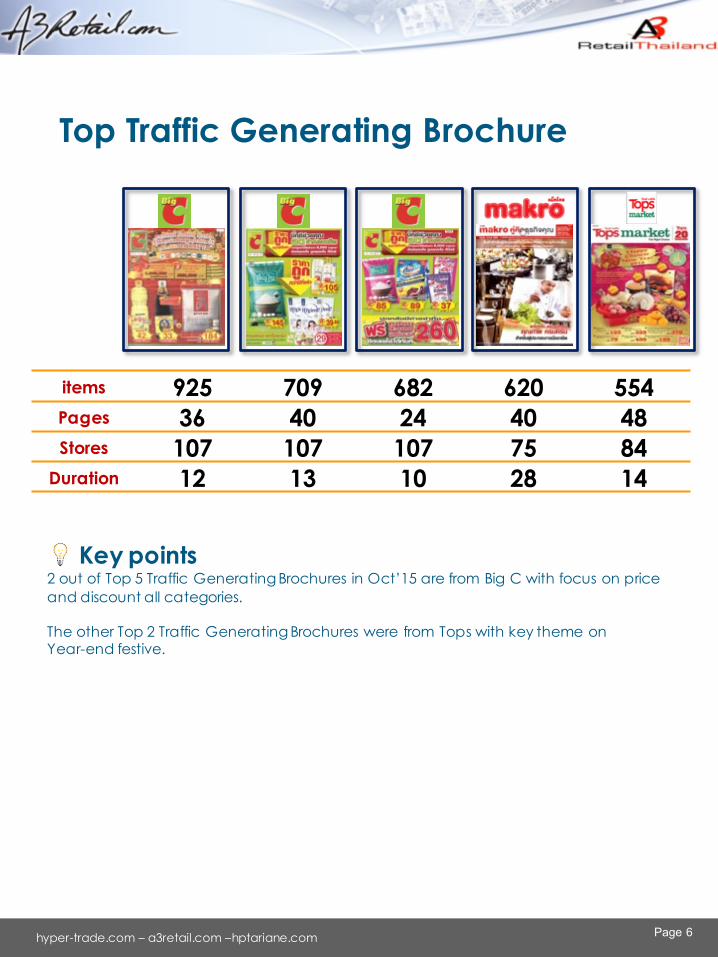
Top Traffic Generating Brochure
💡 Key points2 out of Top 5 Traffic Generating Brochures in Oct’15 are from Big C with focus on price and discount all categories.
The other Top 2 Traffic Generating Brochures were from Tops with key theme onYear-end festive.
items 925 709 682 620 554Pages 36 40 24 40 48Stores 107 107 107 75 84
Duration 12 13 10 28 14
hyper-trade.com – a3retail.com –hptariane.com Page 7
RetailConsulting
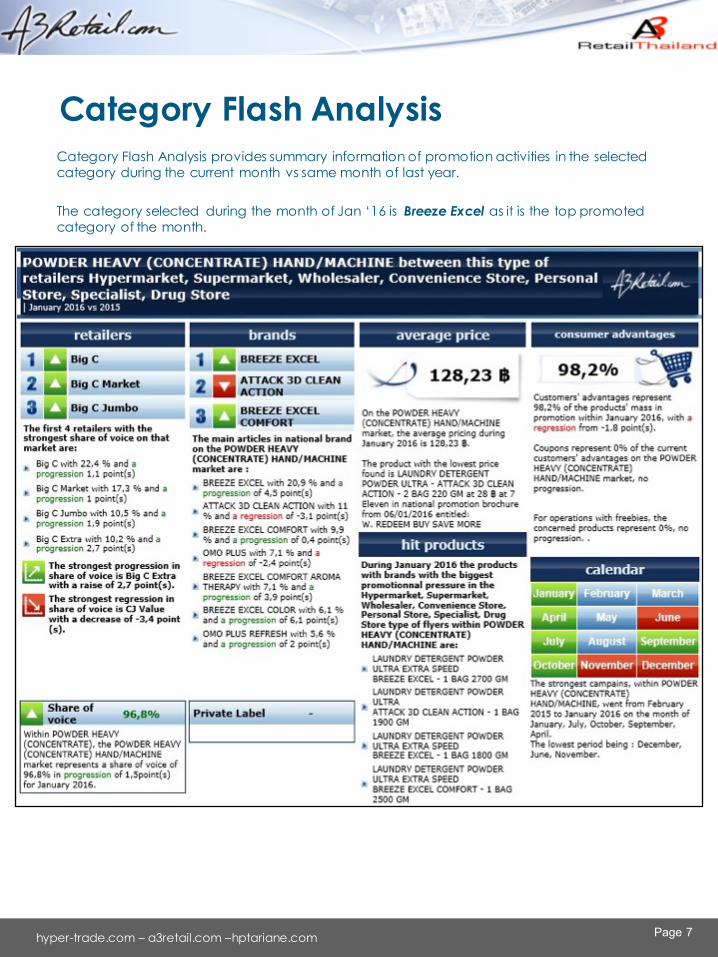
Category Flash AnalysisCategory Flash Analysis provides summary information of promotion activities in the selected category during the current month vs same month of last year.
The category selected during the month of Jan ‘16 is Breeze Excel as it is the top promoted category of the month.
hyper-trade.com – a3retail.com –hptariane.com Page 8
RetailConsulting
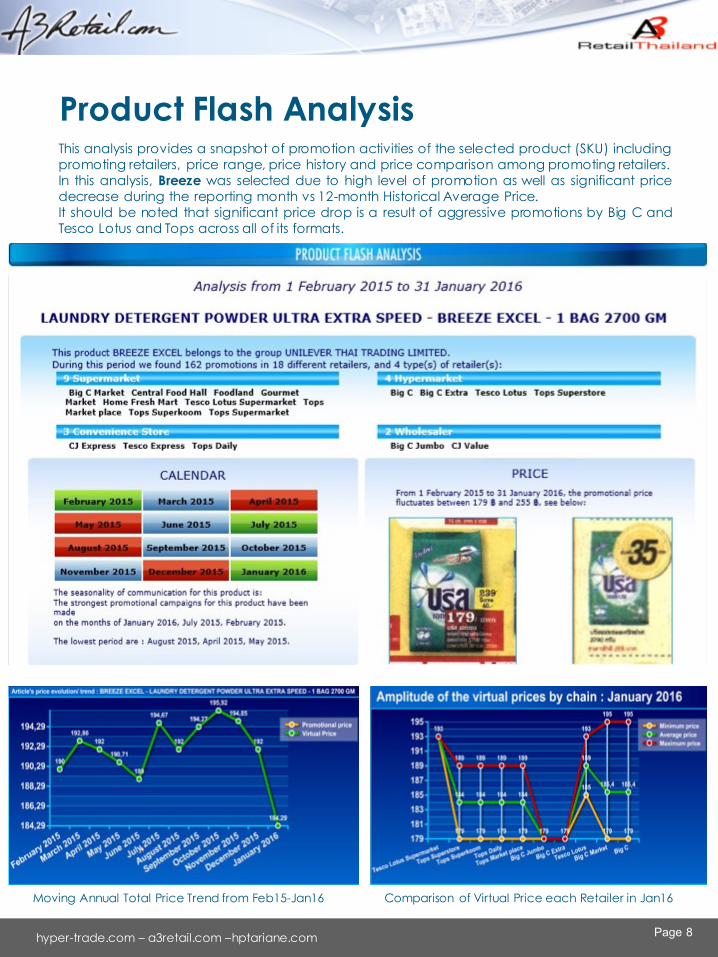
Product Flash AnalysisThis analysis provides a snapshot of promotion activities of the selected product (SKU) includingpromoting retailers, price range, price history and price comparison among promoting retailers.In this analysis, Breeze was selected due to high level of promotion as well as significant pricedecrease during the reporting month vs 12-month Historical Average Price.It should be noted that significant price drop is a result of aggressive promotions by Big C andTesco Lotus and Tops across all of its formats.
Moving Annual Total Price Trend from Feb15-Jan16 Comparison of Virtual Price each Retailer in Jan16
hyper-trade.com – a3retail.com –hptariane.com Page 9
RetailConsulting
GlossaryRetailers : Show the top 3 ret ailers that have the most promotion items in the selected category during the reportingmonth. Also show the change in term of Share of Voice of the ret ailers vis a vis Share of Voice in the same month of lastyear.
Share of Voice : Show the ratio percentage of number of promotion items in the selected category compared to allpromotion items in all categories during the same period.
Brands : Show the top 3 bran ds that h ave the most promotion items in the selected category during the reportingmonth. Also show the ch ange in term of Sh are of Voice of the brands vis a vis Share of Voice in the same month of lastyear.
Private Label : Show the ratio percentage of number of House Brand promotion items in comparison to tot al number ofpromotion items in the selected category. Also show the ch ange in term of Share of Voice of House brands vis a visShare of Voice in the same month of last year.
Average Price : Th e average promotion price in every promotion items in the selected category during the period ofreporting month from all retailers.
Promotion Price Index : Promotion Price Index is a simple (non-weighted) average price of basic commodities beingpromoted du ring the current month vs base month in hypermarket channel. The base month (where the index is 100%)is January 2013.
Commodity products included in the calculation of Promotion Price Index are as follow:• Breeze Excel 1 bag 2700 g• Dumex Dumilk 3 Complete Care 1 bag 900 g• NesCafe 3in1 Rich Aroma 1 pack 40 bags 19.4 g• Fresh pork rump 1 kg• Ovaltine 3in1 1 pack 20 bags 35 g• Bencharong Sao Hai rice 100% 1 bag 5 kg• Coca-Cola 1 pack 6 cans 325 ml• Nestle Pure Life drink water 1 pack 12 bottles 600 ml• Lactasoy 1 pack 6 brinks 250 ml• Fresh Kaew Mungkorn (Dragon fruit) 1 kg• Morakot Palm Oil 1 bottle 1,000 ml
Hit Products : Show 4 most promoted SKUs during the reporting month in the selected category du ring the period ofreporting month from all retailers.
Consumer Advantages : The ratio percent age of number of promotion items in the selected category that come withPromotion Mechanics in comparison to number of total promotion items in the same category (including promotionthat does n ot contain promotion mechanics such as “New”). Also show the change of this same figures vis a vis thefigures in the same month of last year.
Calendar : Show how frequent the items in the selected category is promoted along the last 12 months. The colorcodes in the Calendar are defined as follow;
Green The months that have more number of promotion items in comparison to the last 12 months.Blue The months that have average number of promotion items in comparison to the last 12 months.Red The months that have less number of promotion items in comparison to the last 12 months.Gray The months that have no promotion item.
hyper-trade.com – a3retail.com –hptariane.com Page 10
RetailConsulting
Collaboration CatalystsThailandHypertrade Consulting Co., LtdRetail Collaboration Platform
538 Grand Building, 3rd Floor, SoiRatchadapisek 26, Ratchadapisek Rd., Samsennok, Huaykwang, Bangkok 10310
+66 895 [email protected] (Thailand)