the 5th international symposium - supercritical co2 power
TRANSCRIPT

The 5th International Symposium - Supercritical CO2 Power Cycles – Paper #51
March 28 to 31, 2016 San Antonio, Texas
PARAMETRIC ANALYSIS OF SCO2 POWER CYCLES OPERATING AT
MODERATE TEMPERATURES
Peter D. Friedman, PhD, PE Newport News Shipbuilding, a Division of
Huntington Ingalls Industries [email protected]
Michael P. Rapp Newport News Shipbuilding, a Division of
Huntington Ingalls Industries [email protected]
Abstract
A parametric analysis of a recuperated sCO2 power cycle operating at moderate temperatures
was conducted using Engineering Equation Solver from F-Chart® Software (EES). The results indicate that
subcritical cycles and critical cycles demonstrate large changes in efficiency for slight variations in
compressor suction pressure. For example, a cycle with its compressor suction temperature equal to the
critical temperature demonstrates a maximum thermal efficiency when its compressor suction pressure
is slightly greater than the critical pressure. When pressure is reduced from this optimum, thermal
efficiency drops rapidly (about a 25% reduction for a 2% change in pressure); whereas when pressure is
increased, efficiency drops gradually. For compressor suction temperatures less than the critical
temperature, efficiency undergoes a step change reduction for pressures less than saturation and a
gradual reduction as pressure is increased. This step change can drop efficiency by more than 75%.
Compressor suction temperatures greater than the critical temperature results in a maximum that
decreases smoothly as pressure is either increased or decreased from the optimal. Parametric analysis
reveals the peak efficiency varies from about 29% to 19% as compressor suction temperature increases
from 90% to 110% of the critical temperature under the operating condition modeled. Further parametric
analyses demonstrate an increase in efficiency with cycle high temperatures, and reductions with
increasing pressure drops, decreasing component efficiencies and decreasing recuperator effectiveness.

The 5th International Symposium - Supercritical CO2 Power Cycles – Paper #51
March 28 to 31, 2016 San Antonio, Texas
Page 2 of 21
Nomenclature:
A Area
C Flow heat capacity Pmc
Pc Specific heat
D Pipe diameter
f Moody friction factor
h Enthalpy, convective heat transfer coefficient
i Irreversibility or exergy destruction per unit mass
k Fluid thermal conductivity
K Piping component head loss coefficient
ke Specific kinetic energy (2 2V , where V represents velocity)
L Length
m Mass flow rate
Nu Nusselt number hD k
P , *P Pressure, Pressure normalized by critical pressure
pe Specific potential energy ( gz , where z represents elevation)
Pr Prandtl number of the fluid q Specific heat flow
Q Rate of heat transfer
Maxq The rate heat transfer that would occur in an infinitely long counterflow heat exchanger
R Heat transfer resistance
Re Reynolds number
s Entropy
Gens Entropy generated in a process
T , *T Temperature, Temperature normalized by critical temperature
V Velocity
w Specific work
P Flow pressure drop
Recuperator Effectiveness, Piping system absolute roughness
Closed system exergy
Efficiency
Density
Flow exergy
Subscripts
o Dead state property (used in , , ,o o o oh P T s )
1,2 Component inlet and outlet, respectively
,C T Compressor and turbine, respectively
,C H Cold and hot fluids, respectively
Th Thermal efficiency (refers to energy transformations within the working fluid)
,R S Heat rejected and supplied, respectively

The 5th International Symposium - Supercritical CO2 Power Cycles – Paper #51
March 28 to 31, 2016 San Antonio, Texas
Page 3 of 21
S The state point that would be reached in an isentropic process
,I II First law (or energy) and second law or exergy) basis, respectively
I. Introduction Since the concept was first introduced by Sulzer [11], supercritical CO2, operating in a closed loop modified
Brayton/Rankine cycle, has offered great promise as a result of its availability, high density, benign nature,
wide temperature range and high thermal capacity [5]. Its energy density allows the use of smaller and
simpler turbomachinery, and it eliminates a number of support systems when compared to traditional
steam cycles. Additionally, CO2 power cycles can operate efficiently over a much wider temperature range
than steam cycles, organic Rankine cycle (ORC) systems and air bottoming cycles [5].
Although, in comparison to steam, efficiency improvements are only achieved at elevated temperatures,
in cases where physical space is at a premium, such as naval vessels, sCO2 cycles may still be advantageous,
even under moderate temperature conditions. The potential higher density thermal to mechanical energy
conversion has the potential to free up space enabling electric drive systems, and smaller components
allow for greater installed redundancy. Additionally, components of electrically driven ships have much
greater flexibility in placement, and the single phase working fluid in sCO2 plants also improves placement
flexibility and reduces manning requirements.
In this study, we model a recuperated sCO2 power cycle operating at moderate temperatures using
Engineering Equation Solver (EES) from F-Chart Software. The base case assumes a cycle high temperature
and pressure of 550K and 30MPa, respectively, a recuperator effectiveness of 92.5% and turbine and
compressor efficiencies of 90% and 85%, respectively. Component and piping system pressure drops are
based on separate analysis conducted by the authors using the models described below. The base case
cycle was optimized at varying compressor suction temperatures to determine the optimal compressor
suction pressure and associated thermal efficiency.
Results indicate that the cycle maximum efficiency is very sensitive to the compressor suction
temperature. At any given compressor suction temperature, the efficiency has the potential to drop
rapidly if compressor suction pressure deviates from a control band. Sensitivity analysis investigates the
effects of operating conditions and cycle irreversibilities.
II. Background Although sCO2 cycles have been understood to offer significant thermodynamic advantages for decades
[1], [2], recent advances in materials and other required technologies have brought this technology to the
forefront. The Department of Energy (DOE) summarizes the advantages of sCO2 as follows [3]:
Energy production, economic and environmental benefits:
•Broad applicability to variety of heat sources
•Higher plant efficiency
•Reduced fuel consumption and emissions
•Low cooling water consumption
•Compact design/footprint lowers capital cost
Public policy benefits:
•U.S. leadership in a transformative technology
•Enhanced U.S. global competitiveness

The 5th International Symposium - Supercritical CO2 Power Cycles – Paper #51
March 28 to 31, 2016 San Antonio, Texas
Page 4 of 21
•Progress towards DOE Strategic Goals and President’s Climate Action Plan
Because much of the benefit of sCO2 as a working fluid (including improved thermal efficiency) arises from
its suitability for increased temperature cycles, most of the current research interest (including the DOE’s
Supercritical Transformational Electric Power or STEP initiative [4]) focuses on elevated temperature
applications, generally considered to be greater than 700oC [4]. Nevertheless, even at more moderate
temperatures, sCO2 still offers potentially significant advantages including vastly increased power
densities – See Figure 1, which was taken from the DOE’s website.
Figure 1. Comparison of Power Densities of sCO2 and steam cycles [3].
Analysis of sCO2 cycles, although similar conceptually to other thermodynamic cycles, differs as a result of
the unique characteristics of sCO2. For example, in comparison to air and steam, the pressure ratios are
lower by 1 to 5 orders of magnitude. In comparison to steam, the working fluid mass flow rate is about
an order of magnitude higher for a similar output power, while the maximum volumetric flow rate is about
3 orders of magnitude lower as a result of the density. For sCO2 cycles, piping system pressure drops are
of a significantly greater concern, and the highly variable specific heat near the critical point requires
careful analysis in the regenerative heat exchanger. Maximizing efficiency requires a highly recuperated
cycle, but the sensitivity to pressure drops can have adverse effects in enlarged heat exchangers [6]. The
highly variable specific heats can create internal pinch points in the recuperator, which can be alleviated
with a number of techniques including recompression cycle [5][10] or bypass cycle [13]. On the flip side,
because sCO2 is a single phase working fluid with a high density, it is possible to optimize heat exchangers
in a counterflow configuration to greatly enhance heat exchanger effectiveness. Balancing these
competing effects requires a robust methodology that optimizes the cycle with consideration of all
relevant parameters independently [8].
The present study considered the basic layout, shown in Figure 2b, consisting of a single-shaft compressor
and turbine connected to an output electric generator, a compact recuperator and heat supply and heat
rejection heat exchangers. To determine sources of irreversibility, the analysis also considered the simple
un-recuperated arrangement (Figure 2a), as well as both ideal and real cycles. Inlet and outlet points of
each component are defined separately to account for component and piping system pressure drops.
Ideal cycles assume an isentropic turbine and compressor and isobaric heat exchangers and connecting
piping. The ideal recuperator is assumed to transfer the maximum heat possible in an infinitely large

The 5th International Symposium - Supercritical CO2 Power Cycles – Paper #51
March 28 to 31, 2016 San Antonio, Texas
Page 5 of 21
counterflow configuration Maxq . The methodology for calculating Maxq is discussed below. Real cycles
include component pressure drops, pressure drops in connecting piping, turbine and compressor
isentropic efficiencies less than unity and heat transfer less than Maxq .
Figure 2—Analysis cycles: a) simple cycle, b) recuperated cycle.
III. Analysis
A. Governing Relationships For the thermodynamic relationships defined in this section, the subscripts 1 and 2 denote inlet and outlet
conditions of the component, respectively. In addition to energy analysis, exergy is used to quantify
system losses. Exergy is defined as the useful work that could be extracted by reducing a thermodynamic
system to the restricted dead state ( OT and OP represent the local environmental temperature and
pressure, respectively). The restricted dead state is appropriate since the system is a non-reacting single
substance.
General equations: The energy and entropy balances for a single inlet and single outlet component
operating under steady-state conditions are [14],
2 1 2 1 2 1q w h h pe pe ke ke (1) ; 2 1Gen
qs s s
T (2)
Combining equations (1) and (2) and ignoring the potential and kinetic energy terms yields the exergy
(also called availability or available energy) balance [14],
2 1Heat w i (3)
where the exergy of the heat source and flow exergy are defined respectively as,
1 oH
H
Tq
T
(4) ; o o oh h T s s ke pe (5)
and the irreversibility or exergy destruction is defined in terms of the entropy generation [14],

The 5th International Symposium - Supercritical CO2 Power Cycles – Paper #51
March 28 to 31, 2016 San Antonio, Texas
Page 6 of 21
o Geni T s (6)
First law efficiencies and second law efficiencies (sometimes referred to as effectiveness) are defined in
terms of energy and exergy balances, respectively [14],
Energy Output
Energy SuppliedI (7) ;
Exergy Output
Exergy SuppliedII (8)
Heat Source and Heat Rejection Heat Exchangers: The intermediate heat exchanger (IHX) is assumed to
receive its heat from a heat source at temperature ST . For the IHX, energy and exergy balances simplify
to,
2 1Sq h h (9) ; 2 1H IHXi (10)
The first and second law efficiencies are,
2 1,IHX I
S
h h
q
(11) ;
2 1,IHX II
H
(12)
Because the condenser rejects all of its heat to the environment, all of the exergy removed is destroyed.
Thus for the condenser,
1 2Rq h h (13) ; 1 2Condi (14) ; , 0Cond II (15)
Turbomachinery: The energy and exergy balances for the turbine are,
1 2Tw h h (16) ; 1 2T Tw i (17)
The first law (isentropic) efficiency for the turbine compares actual work that would be realized in a
process that exits at the same pressure as the real turbine if the process is isentropic (designated as point
2s). Second law efficiency is the ratio of realized work to exergy supplied.
1 2,
1 2
T I
s
h h
h h
(18) ;
1 2,
1 2 1 2
1 TT II
h h i
(19)
The compressor (or pump) governing equations are similarly defined,
2 1Cw h h (20) ; 2 1Cw i (21)
and,
2 1,
2 1
sC I
h h
h h
(22) ;
2 1,
2 1 2 1
1 CC II
i
h h h h
(23)
Pressure drops and losses to ambient: The system undergoes pressure drops and heat losses to ambient.
Head loss in connecting piping is based on the standard equation [16]:

The 5th International Symposium - Supercritical CO2 Power Cycles – Paper #51
March 28 to 31, 2016 San Antonio, Texas
Page 7 of 21
2
2
fL VP K
D
(24)
where the empirical friction factor f follows the Colebrook-White correlation [15],
10
1 2.512
3.7Log
Df Re f
(25)
The component K values in equation (24) are cataloged from a library of correlations including Crane’s
Technical Publication Number 410 [12]. Neglecting fouling resistances, which will be very low in sCO2
systems, heat losses to ambient depend on the internal convection coefficient, pipe wall thermal
conductivity, insulation and external convective coefficient [7]. The total heat flow resistance, (defined
such thatQ T R ) can be determined from the individual resistances,
ln ln1 1 1
2 2
o i o i
Internal ExternalPipe Insulation
D D D DR
UA hA kL kL hA (26)
The internal heat transfer coefficients follow a number of correlations including Dittus-Boelter [7],
4 5 0.30.023hD
Nu Re Prk
(27)
Preliminary analysis demonstrated that the internal convective resistance and pipe wall resistance were
insignificant in comparison to the external convection and the insulation, so those terms were dropped
from the model.
Recuperator: The recuperator is assumed to be adiabatic with respect to the environment. In some
applications, such as recompression cycles, mass flow rates of the two streams may differ, but in the
present study, the mass flow rate of the hot and cold streams are equal. The resulting energy and exergy
balances for the recuperator are,
1 2 2 1H H C Ch h h h (28) ; 1 2 2 1H H C C i (29)
where the “C” and “H” subscripts refer to the hot and cold fluids and the “1” and “2” remain inlet and
outlet as previously defined. Because the recuperator loses no heat to ambient, it is 100% efficient on a
first law basis; the second law efficiency can be determined from,
2 1Re ,
1 2
C Ccup II
H H
(30)
Irreversibility occurs in piping and ductwork as a result of pressure drops. Using the full model discussed
below, we have determined that heat losses to ambient are small. As a result, for the present problem,
piping is assumed to be adiabatic yielding energy and exergy balances of,
1 2h h (31) ; 1 2 2 1oi T s s (32)

The 5th International Symposium - Supercritical CO2 Power Cycles – Paper #51
March 28 to 31, 2016 San Antonio, Texas
Page 8 of 21
In typical applications, the maximum heat transfer possible in a counterflow heat exchanger is
proportional to the difference between the inlet temperatures of the two inlet streams [7].
, ,Max Min H i C iq C T T (33)
where MinC is the minimum heat carrying capacity of the two fluid streams :
, ,,Min H P H C P CC Min m c m c (34)
These basic definitions for Maxq are applicable in cases of constant specific heats, but they can frequently
be used in cases of variable specific heats by assuming an average specific heat [7]. As a result, at Maxq
the fluid stream with the lower heat capacity exits at the inlet temperature of the other fluid stream. In
sCO2 cycles, however, the great variation in specific heats frequently results in an internal “pinch point,”
as shown in Figure 3, which limits the maximum heat transfer to a lesser value. To account for the pinch
point in the present study, Maxq is defined as the amount of heat transfer that would occur in a
counterflow heat exchanger of infinite heat transfer area. As Figure 3 shows, when an internal pinch point
is present, the maximum possible heat transfer occurs when the temperature profiles of the fluids
approach each other. For the profiles shown in the figure, heat transfer at the rate specified in equation
(33) would result in a physically impossible situation where the temperature profiles cross each other.
The procedure used to calculate Maxq is described below.
Figure 3. Typical temperature distribution in a counterflow recuperator with the maximum possible heat transfer as limited by an internal pinch point. Representative data for both fluids carbon dioxide with mass flow rates equal, low temperature fluid pressure = 30,000 kPa, high temperature fluid pressure = 6940kPa, high temperature fluid inlet temperature = 400K, low temperature fluid inlet temperature = 288K.
Heat exchanger effectiveness is defined as the heat transfer normalized by the maximum possible heat
transfer [7],
Max
q
q (35)
The thermal efficiency of the plant considers only the secondary cycle shown in Figure 2 ,
0 5 10 15 20 25 30 35280
300
320
340
360
380
400
420
Node[i] [Dim]
TC
[i],
TH
[i]

The 5th International Symposium - Supercritical CO2 Power Cycles – Paper #51
March 28 to 31, 2016 San Antonio, Texas
Page 9 of 21
1NET Rth
S S
w q
q q (36)
B. Computational Methods The analysis equations summarized above were programmed using Engineering Equation Solver (EES)
from F-Chart Software®. The completed model, which contains about 400 equations, was written to
analyze the secondary sCO2 plant along with an associated pressurized water reactor (PWR) as its heat
source and tertiary heat sink cooling system as shown in Figure 4. The bypasses, “FM3” and “FM4”, allow
flow through their associated throttle valves are inserted for controllability of the system. The
recuperator is segmented into 30 sections to determine the internal pinch point and the IHX is segmented
into 10 sections. Each motor and generator efficiency is selectable. Pressure drops are determined from
pipe flow correlations, including the tees, which depend on flow splits. The motor on the compressor shaft
can be modeled as a prime mover for the compressor, or reversed and used as a generator.
The model allows for a number of simplified calculations that are used to initialize parametric guess
values, which are critical in obtaining convergence to a solution when using EES. After initial guess values
are determined, the full analysis can be run.
For the results summarized in section IV.A, IV.B and IV.C, below, the mass flows “FM3” and “FM4” were
set to zero. In addition the efficiency of the compressor turbine and main turbine were both set to 90%
and the associated pressure drops from point 1 to points 2 and 13 are equal as listed below. The full
model has been run to establish realistic piping system pressure drops and heat losses. These results are
incorporated into the input values. Results using all of the computational abilities of the full model in
Figure 4 will be presented in the future.
The model includes two recuperator calculation options. The first option allows a fixed heat transfer
capacity (UA) to be inserted to determine the projected heat transfer. The effectiveness is an output
based on the inserted UA. The second option allows the effectiveness to be an input variable and the
required UA as an output. The recuperator Maxq is determined using an EES procedure, which divides the
recuperator into segments of equal heat transfer. The rate of heat transfer is iterated to determine the
heat transfer rate necessary to have the temperatures of the two fluid streams equal at a given internal
location. It was determined that 30 segments were sufficient to reduce error to less than 0.01% in test
cases.
The internal EES library was used for property values, with the reference point set at the Institute of
Refrigeration (IIR) reference state. For validation purposes, values from the EES library were compared
against NIST Standard Reference Database 23: Reference Fluid Thermodynamic and Transport Properties-
REFPROP, Version 9.1, National Institute of Standards and Technology, Standard Reference Data Program,
Gaithersburg, 2013. In most cases, EES library values were within 0.003% of REFPROP values. Near the
critical point errors approached 1% in enthalpy and 0.8% in entropy. (Values for thermal conductivity and
viscosity approached 15% and 20% respectively at the critical point, although these values were not used
in the current model.)

The 5th International Symposium - Supercritical CO2 Power Cycles – Paper #51
March 28 to 31, 2016 San Antonio, Texas
Page 10 of 21
Figure 4. Plant configuration used in the system model. A small modular nuclear reactor (SMR) operates in a pressureized water reactor configuration supplying heat to a secondary sCO2 cycle. The compressor, compressor turbine and main turbine have independely controllable “turbomachinery maps.” The bypasses, “FM3” and FM4”, that allow flow through associated throttle valves are inserted for controllability of the system. The recuperator is segmented into 30 sections to determine the internal pinch point and the IHX is segmented into 10 sections. Each motor and generator efficiency is selectable. Pressure drops are determined from pipe flow correlations, including the tees, which depend on flow splits. The motor on the compressor shaft can be modeled as a prime mover for the compressor or reversed and used as a generator.
IV. Results and Analysis The present study is focused primarily on sCO2 cycles receiving heat from a pressurized water nuclear
reactor operating at moderate operational temperatures. Operational conditions at the exit of the heat
source were selected as T-high = 550K and P-high = 30MPa. Cycle low temperatures, * CritT T T , were
varied from 0.9 to 1.1 ( *T = 0.9, 0.95, 0.98, 1.0, 1.02, 1.05, 1.1) to determine the optimal low pressure.
The results are organized as follows: In subsection A), the recuperated and un-recuperated ideal cycles
are briefly considered. For each of the cycle low temperatures, the cycle low pressure is varied to optimize
the thermal efficiency. In subsection B), real cycles with expected irreversibilities are considered. The
results are analyzed to determine ideal operating pressure and efficiency as a function of cycle low
temperature and associated sources of cycle irreversibility. Finally subsection C) contains a parametric
analysis of the real recuperated cycle to determine the effects of varying the operating parameters,
including cycle high temperature, cycle high pressure, pressure drops, component efficiencies and
recuperator effectiveness.
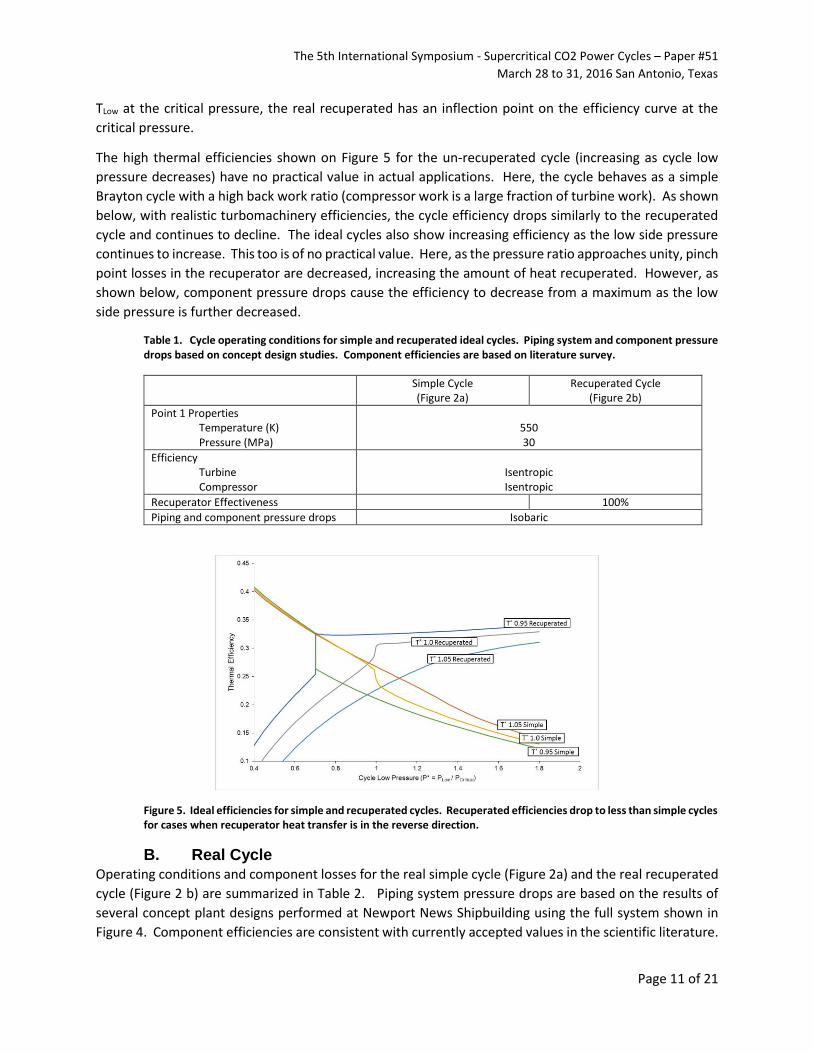
A. Ideal Cycle The thermal efficiencies for the simple and recuperated ideal cycles summarized in Table 1 are shown in
Figure 5. Recuperated cycle efficiency decreases to less than the un-recuperated cycle at the point the
recuperator transfers heat in the reverse direction. At subcritical temperatures (shown in the T* = 0.95
case), this corresponds to pressures less than the saturation pressure, and the transition is marked by a
rapid (step change) loss of efficiency. At supercritical temperatures, the efficiency curve is smooth. For
The 5th International Symposium - Supercritical CO2 Power Cycles – Paper #51
March 28 to 31, 2016 San Antonio, Texas
Page 11 of 21
TLow at the critical pressure, the real recuperated has an inflection point on the efficiency curve at the
critical pressure.
The high thermal efficiencies shown on Figure 5 for the un-recuperated cycle (increasing as cycle low
pressure decreases) have no practical value in actual applications. Here, the cycle behaves as a simple
Brayton cycle with a high back work ratio (compressor work is a large fraction of turbine work). As shown
below, with realistic turbomachinery efficiencies, the cycle efficiency drops similarly to the recuperated
cycle and continues to decline. The ideal cycles also show increasing efficiency as the low side pressure
continues to increase. This too is of no practical value. Here, as the pressure ratio approaches unity, pinch
point losses in the recuperator are decreased, increasing the amount of heat recuperated. However, as
shown below, component pressure drops cause the efficiency to decrease from a maximum as the low
side pressure is further decreased.
Table 1. Cycle operating conditions for simple and recuperated ideal cycles. Piping system and component pressure drops based on concept design studies. Component efficiencies are based on literature survey.
Simple Cycle (Figure 2a)
Recuperated Cycle (Figure 2b)
Point 1 Properties Temperature (K) Pressure (MPa)
550 30
Efficiency Turbine Compressor
Isentropic Isentropic
Recuperator Effectiveness 100%
Piping and component pressure drops Isobaric
Figure 5. Ideal efficiencies for simple and recuperated cycles. Recuperated efficiencies drop to less than simple cycles for cases when recuperator heat transfer is in the reverse direction.
B. Real Cycle Operating conditions and component losses for the real simple cycle (Figure 2a) and the real recuperated
cycle (Figure 2 b) are summarized in Table 2. Piping system pressure drops are based on the results of
several concept plant designs performed at Newport News Shipbuilding using the full system shown in
Figure 4. Component efficiencies are consistent with currently accepted values in the scientific literature.

The 5th International Symposium - Supercritical CO2 Power Cycles – Paper #51
March 28 to 31, 2016 San Antonio, Texas
Page 12 of 21
Table 2. Cycle operating conditions for simple and recuperated real cycles. Piping system and component pressure drops are based on concept design studies. Component efficiencies are based on literature survey.
Simple Cycle (Figure 2a)
Recuperated Cycle (Figure 2b)
Point 1 Properties Temperature (K) Pressure (MPa)
550 30
Efficiency Turbine Compressor
90% 85%
Recuperator Effectiveness -- 92.5%
Component pressure drops (kPa) Pre-cooler IHX Recuperator (cold) Recuperator (hot)
100 150
-- --
100 150 30 50
Piping pressure drops (kPa) Section 1-2 3-4 5-6 7-8 9-10 11-12
80 10 40
200 -- --
80 10 5
40 35
200
In contrast with the ideal cycle summarized above, the real cycle has a distinct maximum in thermal
efficiency in all cases shown in Figure 6. There is a small range where the un-recuperated cycle is more
efficient than the recuperated if pressure is allowed to drop below its optimum operating pressure;
however, at the level, the system is operating well outside of its desired operating band.
Figure 6. Efficiencies for simple and recuperated real cycles, assuming the operating conditions listed in Table 2. Recuperated efficiencies drop to less than simple cycles for cases that recuperator heat transfer is in the reverse direction. Real and ideal efficiencies are also equal when net cycle work decreases to zero.
Figure 7 shows a plot of the thermal efficiency as a function of cycle low pressure for various cycle low
temperatures. As the plot shows, for subcritical temperatures, the efficiency undergoes a steep drop if
pressure decreases below a critical value. With a low cycle temperature equal to the critical temperature,
the efficiency curve still has a distinctive steep reduction, although it does not have the vertical step
change. As temperature is further increased, the efficiency curves lose the distinct drop in efficiency,
although they maintain a maximum efficiency value.

The 5th International Symposium - Supercritical CO2 Power Cycles – Paper #51
March 28 to 31, 2016 San Antonio, Texas
Page 13 of 21
Figure 8 shows the maximum thermal efficiency (right scale) and corresponding compressor suction
pressure (left scale) for the cycle identified in Table 2 as a function of compressor suction temperature.
The figure also shows saturation conditions and pressures for thermal efficiencies equaling 98% of the
maximum. (The two 98% data sets correspond to pressures above and below the optimum thermal
efficiency.) At compressor suction temperatures below the critical temperature, cycle thermal efficiency
is maximized when compressor suction pressure equals saturation pressure. Efficiency drops dramatically
if pressure is decreased below saturation. Under these subcritical conditions, the low side 98% data is
coincident with the maximum efficiency as a result of the step reduction in efficiency at saturation and
efficiency drops smoothly as pressure increase above saturation. As temperature approaches saturation,
maximum efficiency and 98% curves diverge as a result of the behavior noted in Figure 7.
The reasonable operating curve balances efficiency, margin to adverse operating conditions and piping
stresses. Under subcritical temperatures, the operating curve provides some margin to the sharp
reduction noted at saturation but maintains efficiency greater than 98% of the maximum. As temperature
surpasses the critical temperature, the curve allows pressures less than the maximum efficiency to limit
the stress requirements on the low pressure side.
Figure 7. Thermal efficiencies for recuperated cycle specified in Table 2. Each curve represents the thermal efficiency at a specified cycle low temperature as a function of cycle low pressure.
For illustrative purposes, the energy and exergy balances of a small modular reactor (SMR) configured as
a pressurized water reactor supplying heat to an sCO2 cycle are tabulated in Table 3. The reactor analyzed
is a nominal 100MW reactor operating with an average temperature of 540K. As the exergy balance
reveals, the greatest sources of exergy destruction in the cycle are the temperature drops in the reactor
and the IHX. The secondary plant has second law efficiency of 68%. The greatest source of exergy
destruction in the secondary plant is heat rejection to the pre-cooler, although recovery of the rejected
exergy would be difficult, based on the relatively low temperature. Turbine, compressor and recuperator
losses are all relatively small (5-8% of the supplied exergy). The figures in this table depend on the
assumed temperatures for the heat source and the environment and are only intended to provide relative
magnitudes.

The 5th International Symposium - Supercritical CO2 Power Cycles – Paper #51
March 28 to 31, 2016 San Antonio, Texas
Page 14 of 21
Figure 8. Critical low side operating pressure and thermal efficiency (Right Scale) for the cycle specified in Table 2 as a function of T*Low. The reasonable operating pressure curve results in a thermal efficiency of 98% of the maximum possible. For cycle low temperatures less than the critical temperature (T*Low < 1.0), pressure is maintained at a value greater than that of the optimum efficiency to reduce the chance of the sharp reduction noted in Figure 7. For T* > 1, the pressures are less than the pressure for optimal efficiency to reduce pipe stresses.
Table 3. Energy and exergy balances of a hypothetical Small Modular Reactor (SMR) pressurized water reactor plant coupled with an sCO2 secondary plant operating at the conditions specified in Table 2 with T*Low=1.0 and PLow* = 1.13. Exergy values are based on a maximum heat source temperature of 1100K and a dead state temperature of 298K. Primary loop average temperature is 540K.
Energy Balance (MW in)
Exergy Balance (MW in)
Primary Loop Supplied by Fission Reactor Losses Primary Coolant Pump Supplied to IHX
100.00
0.00 0.23
-100.20
72.91
-28.18 0.23
-44.96
IHX Supplied from Primary Loss Supplied to sCO2
100.20
0.00 -100.20
44.96 -9.24
-35.72
sCO2 Loop Supplied from IHX Compressor Work Turbine Work Piping Losses Turbine Losses Compressor Losses Recuperator Pre-cooler
100.20
13.65 -38.08
0.00 0.00 0.00 0.00
-75.80
35.72 13.65
-38.08 -0.24 -2.96 -1.82 -1.83
--4.44
C. Parametric Analysis A parametric analysis considered the effects of varying operating parameters on three separate base
cases. The three base cases include a subcritical low temperature, (T*=0.95), low temperature at the
critical point and a supercritical low temperature, (T*=1.05).

The 5th International Symposium - Supercritical CO2 Power Cycles – Paper #51
March 28 to 31, 2016 San Antonio, Texas
Page 15 of 21
The parametric analyses considered are summarized in Table 4. In each case, only the indicated
parameters were varied from the base case. In cases 1, 2 and 4, only the single parameter was varied. In
cases 3 and 5, each of the components was varied simultaneously, in a proportional manner. For example,
in case 3, compressor efficiency of 70% corresponded to a turbine efficiency of 80% and compressor
efficiency of 92.5% corresponded to a turbine efficiency of 95%. In case 5, the ratio of pressure drops is
constant.
Table 4. Parametric sensitivity analysis. In the analysis, only the indicated parameters were varied from the base case. In cases 1, 2 and 4, only the single parameter was varied. In cases 3 and 5, each of the components was varied simultaneously, maintaining a constant loss ratio of each. For example, in case 3, the compressor losses are always 150% of the turbine losses (a turbine efficiency of 80% is matched with a compressor efficiency of 70%).
Sensitivity Analysis Cases
Base Case
1 TH (T1)
2 PH (T9)
3 Component
Efficiency
4 Recuperator Effectiveness
5 Pressure
Drops
Point 1 Temperature (K) 550 450 - 700
Point 1 Pressure (MPa) 30 25 - 40
Efficiency Turbine Compressor
90% 85%
80% - 95%
70% - 92.5%
Recuperator Effectiveness 92.5% 85% - 100%
Component pressure drops (kPa) Pre-cooler IHX Recuperator (cold) Recuperator (hot)
Piping pressure drops (kPa) Section 1-2 3-4 5-6 7-8 9-10 11-12
100 150 30 50 --- 80 10 5
40 35
200
-------
-------
-------
-------
50-200 75-300 15-60
25-100 ----
40-160 5-20
2.5-10 20-80
17.5-70 100-400
As expected Figure 9 shows that the thermal efficiency is highly dependent on the cycle high temperature
(T1) as well as cycle low temperature (T7). In order to limit the variation to a single parameter, the three
curves shown in the figure use a cycle low pressure that optimizes the thermal efficiency when T1 = 550K.
A separate optimization demonstrated that efficiency could be improved by simultaneously varying cycle
low pressure as T1 is varied, but the maximum improvement observed was 0.19%. The curves shown are
smooth and follow the same general shape as the Carnot efficiency. However, at low cycle temperature,
the real cycle values achieve a lower fraction of the Carnot efficiency than they do at higher temperatures.
For example, at 450K real cycles are about 41% to 47% of their respective Carnot efficiencies, while at
700K the values range from 57% to 61%. The divergence from Carnot also increases as cycle low
temperature increases.
Figure 10 shows the effect of system pressure drops. The overall behavior of the curves remains
unchanged and as expected, increasing pressure drops lower thermal efficiency. The insert amplifies the
effect in the parametric range of interest.

The 5th International Symposium - Supercritical CO2 Power Cycles – Paper #51
March 28 to 31, 2016 San Antonio, Texas
Page 16 of 21
Figure 9. Effect of cycle high temperature on cycle efficiency.
Figure 10. Effect of pressure drops on cycle efficiency. The series of curves represent base case pressure drops multiplied by a factor ranging from 0.5 to 2.0.
In Figure 11, plant thermal efficiency is significantly degraded by turbomachinery performance. In this
analysis, the turbine and compressor were degraded together in a manner that the divergence from
isentropic was consistent. Specifically, the base case is 0.9T and 0.85C . When the turbine
efficiency was lowered to 0.8T compressor efficiency was lowered to 0.70C , and when turbine
efficiency was raised to 0.95T compressor efficiency was raised to 0.925C . Figure 11A shows
the effect on thermal efficiency. Figure 11B shows the corresponding component irreversibilities.

The 5th International Symposium - Supercritical CO2 Power Cycles – Paper #51
March 28 to 31, 2016 San Antonio, Texas
Page 17 of 21
Figure 11. Effect of Turbomachinery efficiency on system behavior. The compressor efficiency is varied such that difference from 100% is always 150% of that of the turbine. A) Plant Efficiency and B) Component and Turbine Irreversibility
Figure 12 details the effect of recuperator effectiveness. As subfigure A demonstrates, the required heat
exchanger area increases as the desired effectiveness increases. The main part of this figure is roughly
linear on a logarithmic plot (exponential), but then tapers as unity is approached. The insert, plotted on a
linear plot shows that at around 98% effectiveness, the required area increases greatly. The
corresponding efficiency is shown in subfigure B. The recuperator, overall, raises the efficiency from
about 16% to 26% (a 63% improvement). However combining the results of subfigures A and B, the
marginal gain in efficiency diminishes as the area increases. In this study, we used a 92.5% effective
recuperator as a base case, which provides a great efficiency enhancement, but avoids the steep part of
the increased area shown in sub figure A. Sub figure D shows that the recuperator irreversibility increases
as area increases, since the level of heat transfer increases until it reaches a point where the decreased
temperature difference overrides the heat transfer effect. Even where the recuperator irreversibility
increases, the total irreversibility decreases because recuperation decreases irreversibility in the IHX and
pre-cooler. The analysis here did not add a penalty for increase pressure drop as area increases. (Pressure
drops were held constant.) Had pressure drops been increased, the thermal efficiency curve would have
achieve a maximum and then started to decrease at an effectiveness that is close to unity.
The effect of cycle high pressure is shown in Figure 13. In each of the cases shown (T*Low ranging from
0.95 to 1.05), the efficiency is greatest at the 30 MPa in the region near the desired operating conditions,
although the variation is not strong. Operating between 25 MPa and 30 MPa allows a relatively wide
operational band and reasonable piping stresses. As the figures show, increasing to 35MPa and even 40
MPa is detrimental on efficiency and also increases piping stresses.

The 5th International Symposium - Supercritical CO2 Power Cycles – Paper #51
March 28 to 31, 2016 San Antonio, Texas
Page 18 of 21
Figure 12 Effect of Recuperator Effectiveness. A) The recuperator area (represented as UA in MW/K) required for the
designated effectiveness B) Cycle efficiency for the given effectiveness, C) Marginal gain in efficiency (Dh/DUA) as a
function of effectiveness. As the curve demonstrates, increasing UA has a diminishing return on investment. D) Recuperator irreversibility and E) Total cycle irreversibility.

The 5th International Symposium - Supercritical CO2 Power Cycles – Paper #51
March 28 to 31, 2016 San Antonio, Texas
Page 19 of 21
Figure 13. Effect of cycle high pressure on thermal efficiency. Selected curves from Figure 7 are re-plotted here along with additional curves at differing cycle high pressures.

The 5th International Symposium - Supercritical CO2 Power Cycles – Paper #51
March 28 to 31, 2016 San Antonio, Texas
Page 20 of 21
V. Conclusions In this paper, we have investigated the thermal efficiencies and losses in simple and recuperated sCO2
power cycles operating at moderate peak cycle temperatures (450K to 700K). The following conclusions
are supported by the data summarized above:
1. For a given cycle high temperature and pressure, ideal recuperated cycles (isentropic
turbomachinery, ideal recuperation and isobaric heat exchangers) have a thermal efficiency that
continues to increase as the cycle low pressure is increased. This relationship results from the
elimination of the recuperator pinch point as the cycle high and low pressures approach each
other. Un-recuperated ideal cycles have thermal efficiencies that increase as the cycle low
pressure is decreased. These ideal cycles have little practical value since in real cycles the trends
are reversed as a result of irreversibilities.
2. Over the parametric range tested, the thermal efficiency of real recuperated cycles is strongly
dependent on the cycle high and low temperatures.
a. Efficiency of the cycle increases as the compressor suction temperature is decreased.
b. The efficiency increases smoothly as turbine inlet temperature increases. The increase
shows that the efficiency roughly doubles as the turbine inlet temperature increases from
450K to 700K.
3. Thermal efficiency is strongly dependent on cycle low pressure.
a. For subcritical cycle low temperatures, maximum efficiency occurs when the cycle low
pressure equals the saturation pressure. Efficiency drops in a step change if the pressure
drops below the saturation pressure as a result of greatly increased pumping losses along
with recuperator heat transfer going in the reverse direction. Efficiency drops gradually
and smoothly if cycle low pressure is increased above saturation pressure.
b. For cycles operating above the critical temperature, efficiency decreases smoothly and
gradually if pressure deviates from the ideal.
c. A suitable suction low pressure provides a reasonable safety margin with less than a 2%
reduction in efficiency. The recommended curve achieves 98% of the maximum efficiency
at subcritical temperatures (by maintaining pressure slightly above saturation) and limits
mechanical stresses at supercritical temperatures (by operating at pressures below the
maximum efficiency).
4. Cycle irreversibilities reduce the thermal efficiency as expected.
a. System pressure drops over the range of parameters tested have a relatively small
influence on cycle efficiency.
b. Because of the magnitude of the back work, turbomachinery efficiencies have a large
influence on cycle efficiencies.
5. Increasing recuperator area increases efficiency but at a diminishing rate as area increases.
References
[1] Angelino G., “Carbon Dioxide Condensation Cycles for Power Production”, ASME Paper No. 68-
GT-23, (1968).
[2] Angelino G., “Real Gas Effects in Carbon Dioxide Cycles”, ASME Paper No. 69-GT- 103, (1969).
[3] Department of Energy sCO2 Team. http://energy.gov/supercritical-co2-tech-team

The 5th International Symposium - Supercritical CO2 Power Cycles – Paper #51
March 28 to 31, 2016 San Antonio, Texas
Page 21 of 21
[4] DOE solicitation DE-SOL-0007963 https://www.fedconnect.net/fedconnect/?doc=DE-SOL-
0007963&agency=DOE
[5] Dostal,Y ; Driscoll,M.J. and Hejzlar, P., “A Supercritical Carbon Dioxide Cycle for Next Generation
Nuclear Reactors,” Available at: http://web.mit.edu/course/22/22.33/www/dostal.pdf
[6] Fourspring, Patrick and Nehrbauer, Joseph, “Heat Exchanger Testing for Closed Brayton Cycles Using
Supercritical CO2 as the Working Fluid,” The 3rd International Symposium - Supercritical CO2 Power
Cycles May 24-25, 2011, Boulder, Colorado. Available at:
https://drive.google.com/file/d/19JUuH6BiVmE4zvBAtksYco02FNroMdQlqcUigkrVEpAAq9oijOFsDJo
YWn7A/view?pli=1
[7] Incropera, Frank P and Dewitt, David P., Introduction to Heat Transfer, 4th Ed, John Wiley and Sons,
2002.
[8] Mohagheghi, Mahmood and Kapat, Jayanta, “Thermodynamic Optimization of Recuperated s-CO2
Brayton Cycles for Waste Heat Recovery Applications,” The 4th International Symposium -
Supercritical CO2 Power Cycles September 9-10, 2014, Pittsburgh, Pennsylvania. Available at:
http://www.swri.org/4org/d18/sCO2/papers2014/systemModelingControl/43-Mohagheghi.pdf
[9] Morosuk, Tatiana and Tsatsaronis, George, ADVANCED EXERGETIC ANALYSIS AS A TOOL FOR THE
THERMODYNAMIC EVALUATION OF SUPERCRITICAL CO2 POWER CYCLES, The 4th International
Symposium - Supercritical CO2 Power Cycles September 9-10, 2014, Pittsburgh, Pennsylvania.
Available at: http://www.swri.org/4org/d18/sCO2/papers2014/systemModelingControl/49-
Tsatsaronis.pdf
[10] Sarkar, Jahar, “Second law analysis of supercritical CO2 recompression Brayton cycle,” Energy, Vol
34, Sep 2009, pp. 1172-1178.
[11] Sulzer, G., Verfahren zur Erzeugung von Arbeit aus Warme, Swiss Patent CH 269-599, 1950. [12] Technical Publication Number 410, Crane Company, Joliet, IL, 1991.
[13] Vaclav, Dostal and Jan, Dostal, “Supercritical CO2 Regeneration Bypass Cycle – Comparison to
Traditional Layouts,” The 3rd International Symposium - Supercritical CO2 Power Cycles May 24-25,
2011, Boulder, Colorado. Available at: https://drive.google.com/file/d/1Ga_q6P_vOmORidiRtJNM-
YrhrRXgAQP86ze5srVR43_yKa33iyRzkhNMiQQ2/view?pli=1.
[14] Wark, Kenneth M., Advanced Thermodynamics for Engineers, McGraw-Hill, Inc., 1995.
[15] White, Frank M., Hess, John L., and Gibson, Carl H., “Equations of Fluid Static and Dynamics,”
Fundamentals of Fluid Mechanics, Schetz, Joseph and Fuhs, Allen E. (Eds), John Wiley and Sons, 1999
[16] Young, Donald F., Munson, Bruce R., and Okiishi, Theodore, H., Brief Introduction to Fluid
Mechanics, John, Wiley and Sons, 1997.