the affordable care act, healthcare reform and economic risk · wasteful spending in the health...
TRANSCRIPT

The Affordable Care Act, Healthcare Reform and
Economic Risk
Michael Longacre Director
Global Reimbursement and Payment Policy BD
Washington, DC [email protected]

THE LONG-TERM MEDICARE/MEDICAID CRISIS

The Long Term Outlook For Healthcare Spending

Utilization vs Outcomes Utilization Based Payment • Disease Care • Promotes > Utilization • Utilization > Costs • Procedure Based
Outcome Based Payment • Health Care • Promotes > Wellness • Wellness < Costs • Episode Based

The Unintended Consequences of Utilization Based Reimbursement
Prominent experts have estimated that 30% of US healthcare spending represents waste or pays for poor-quality care that doesn’t benefit patients. Reid PP, Compton WD, Grossman JH, Fanjiang G, eds. Building a better delivery system: a new engineering/health care partnership. Washington, DC: National Academies Press, 2005
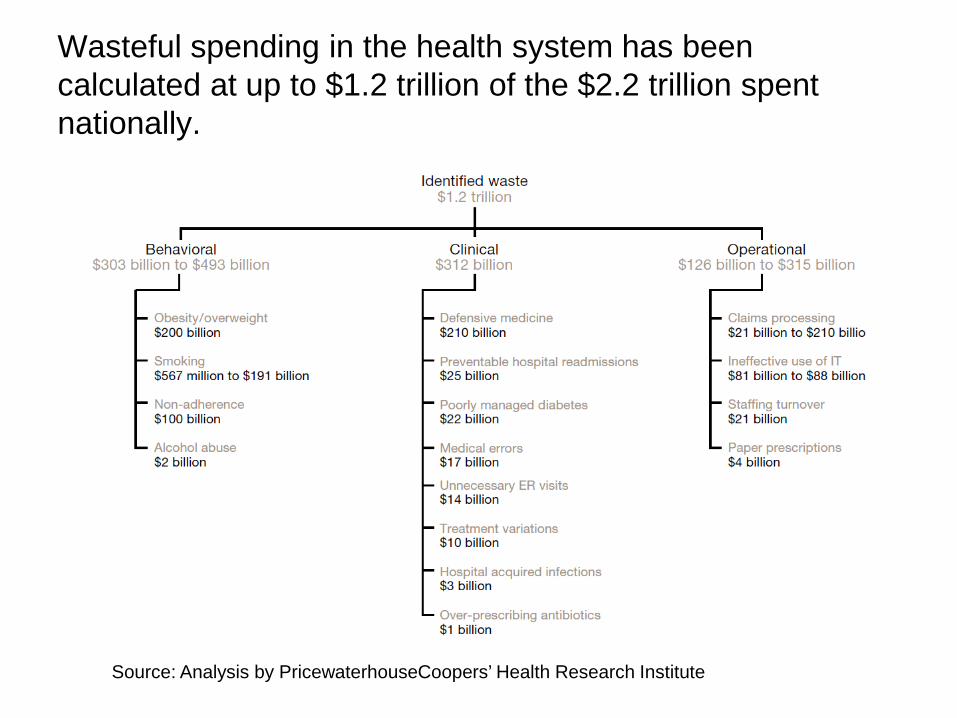
Wasteful spending in the health system has been calculated at up to $1.2 trillion of the $2.2 trillion spent nationally.
Source: Analysis by PricewaterhouseCoopers’ Health Research Institute
CMS’s “Triple Aim” Solution
Better Care
Better Health
At Lower Cost

Financial Solution Utilization ($) Outcomes ($/$)

Hospital Payment Reform Incentives
Pay for Reporting
• Hospital Inpatient Quality Reporting – 2% Penalty to Annual Percentage Update
(APU) for not reporting ($)
• Hospital Outpatient Quality Reporting – 2% penalty to Annual Percentage Update
(APU) for not reporting ($)

Quality Reporting - Metrics
www.QualityNet.Org • Hospital – Inpatient • Hospital – Outpatient • Physicians Offices • Nursing Homes • ESRD • Quality Improvement

Quality Reporting - Facilities
http://www.medicare.gov/quality-care-finder/
• Hospital Compare • Nursing Home Compare • Home Health Compare • Dialysis Facility Compare • Physician Compare • Medicare Plan Finder
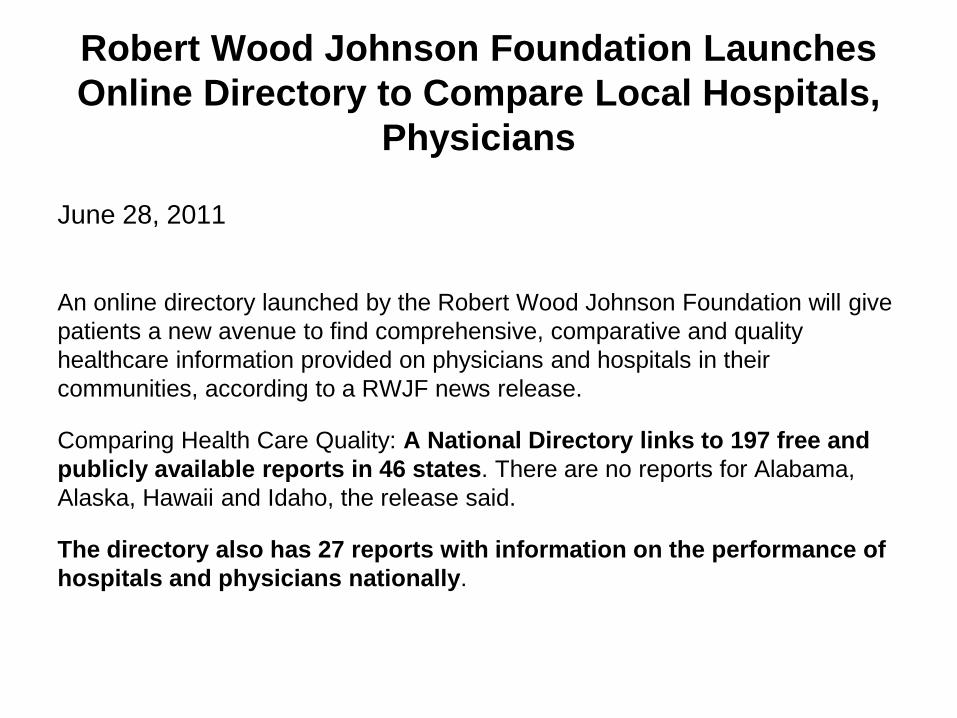
Robert Wood Johnson Foundation Launches Online Directory to Compare Local Hospitals,
Physicians June 28, 2011 An online directory launched by the Robert Wood Johnson Foundation will give patients a new avenue to find comprehensive, comparative and quality healthcare information provided on physicians and hospitals in their communities, according to a RWJF news release.
Comparing Health Care Quality: A National Directory links to 197 free and publicly available reports in 46 states. There are no reports for Alabama, Alaska, Hawaii and Idaho, the release said.
The directory also has 27 reports with information on the performance of hospitals and physicians nationally.
Public Reporting of Quality Data Most Americans say they would look for a hospital rating, although less than half are "very likely" to do so. But if their hospital receives a bad rating, nearly 75% say they would change hospitals rather than stay put. If specialty care is needed, slightly more than half would seek out the best-rated facility rather than go to their community hospital. If a serious illness is involved, nearly 60% would rely on ratings rather than community location in seeking care. The Thomson Reuters 2010 PULSE™ Healthcare Survey November 14, 2011

Achievement Thresholds and Benchmarks that apply to the FY 2013 Hospital VBP Measures – Clinical
Process of Care Measures

Hospital Payment Reform Incentives
Pay for Performance
• Hospital Value-Based Purchasing ($/$) – 1%(+/-) FY2013 to 2% (+/-) FY2017
• Readmissions Program ($)
– Minus up to 1% FY2013 to minus up to 3% FY2015
• Hospital Acquired Conditions Low Quartile ($) – Minus 1% FY2015

Affordable Care Act Economic Risk
Worst Case Scenario
“For the typical hospital, being on the bottom quartile in terms of quality could mean millions of dollars lost annually. For instance, for a 300 bed community hospital with $50 million in Medicare inpatient net revenue, failure to improve on hospital Readmissions (a loss of about $96,780), failure with HVBP (a loss of $750,000), and ending up in the lowest quartile for HAC ($500,000), would create a drop of $1.35 million in income.” PriceWaterhouseCoopers’ Health Research Institute Health Reform- Prospering in a post-reform world May 2010
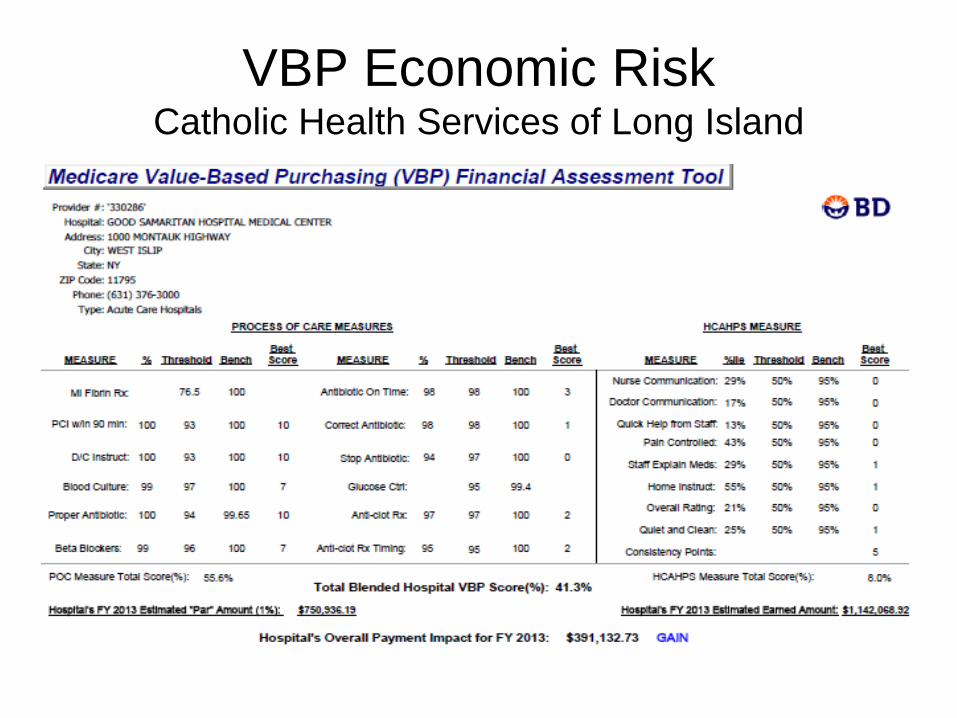
VBP Economic Risk Catholic Health Services of Long Island

VBP Economic Risk Catholic Health Services of Long Island

Economic Risk Catholic Health Services of Long Island

Economic Risk Catholic Health Services of Long Island

And now for something truly different…..
Accountable Care Organizations Bundled Payments

Accountable Care Organizations
What makes ACOs different? • We’ve been focused on a hospitals
performance relative to specific metrics. This is still important to an ACO but…….
• The primary focus of an ACO is lowering the total cost of care for a population. This includes all costs including inpatient, outpatient, office visits, ASCs, SNF, etc.

Fragmented Health Care System

ACO Financial Solution Utilization ($) Shared Savings for a population($/$)
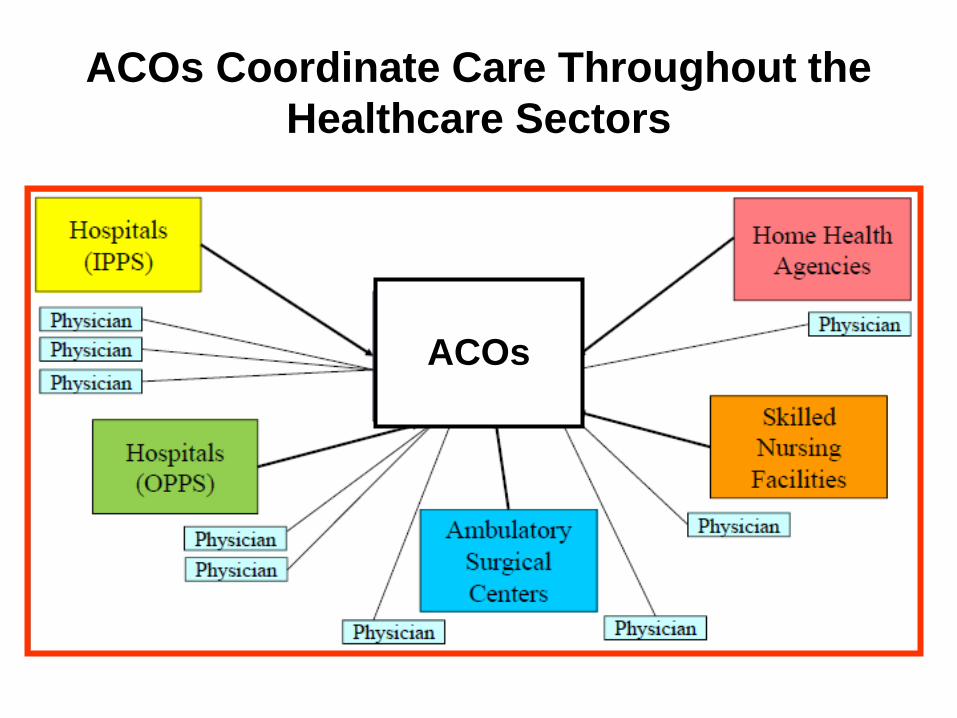
ACOs Coordinate Care Throughout the Healthcare Sectors
ACOs

Three ACO Models

One Sided Model Assume ACO Medicare enrollment 10,000 Medicare patients Assume “Benchmark” $8,000 per patient Assume actual spending $7,500 Savings $500.00 per patient (0.0625%) Gross Savings ( 10,000 X $500) $5,000,000 2% Threshold $1,600,000 Savings above threshold $3,400,000 Uncapped Shared Savings $1,785,000 (Up to 52.5% of savings above min. threshold)

Quality Performance Measure Scoring
As required by the Affordable Care Act, before an ACO can share in any savings created, it must demonstrate that it met the quality performance standard for that year. CMS will measure quality of care using nationally recognized measures in four key domains:▪
• Patient/caregiver experience (7 measures)
• Care coordination/patient safety (6 measures)
• Preventive health (8 measures)
• At-risk population:
– Diabetes (6 measures) – Hypertension (1 measure) – Ischemic Vascular Disease (2 measures) – Heart Failure (1 measure) – Coronary Artery Disease (2 measures)

ACO Financial Incentive
“Shared Savings”-- if below cost targets
and meet quality standards they financially share in the savings with CMS
• Controlling Cost Growth • Improving Quality/Outcomes • Changing Incentives • Coordinating Care

ACO Financial Incentive Market Share Increased market share allows for better
management of assigned risk Better Data from CMS “Can’t manage what you don’t measure” Shared Savings Pays for infrastructure Decreases over time

Top 25 Diagnoses for Pioneer
ACOs 1. Supplementary classifications — 2,150,629
2. Disease of the circulatory system — 1,271,469 3. Females with deliveries — 947,421 4. Heart disease — 816,933 5. Disease of the digestive system — 811,833 6. Diseases of the respiratory system — 797,652 7. Injury and poisoning — 689,136 8. Disease of the musculoskeletal system and connective tissue — 510,330 9. Disease of the genitourinary system — 457,144 10. Mental disorders — 454,974 The following information pertains to the first 32 CMS Pioneer Accountable Care Organizations in 2011. Data was provided by Stratasan and published in a Jarrard
Phillips Cate & Hancock blog post.
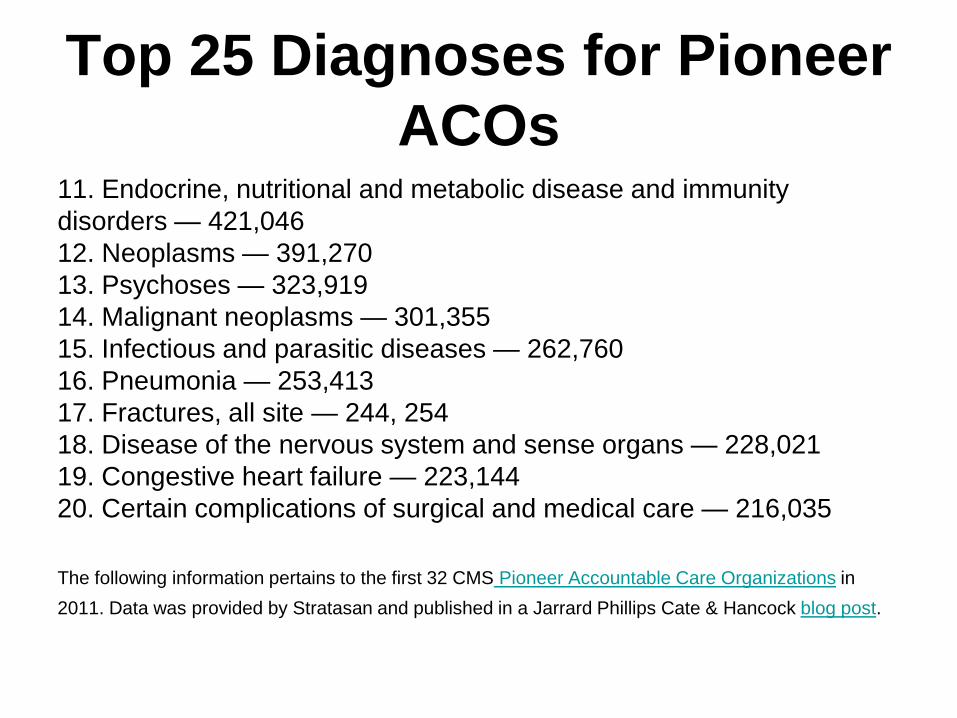
Top 25 Diagnoses for Pioneer
ACOs 11. Endocrine, nutritional and metabolic disease and immunity
disorders — 421,046 12. Neoplasms — 391,270 13. Psychoses — 323,919 14. Malignant neoplasms — 301,355 15. Infectious and parasitic diseases — 262,760 16. Pneumonia — 253,413 17. Fractures, all site — 244, 254 18. Disease of the nervous system and sense organs — 228,021 19. Congestive heart failure — 223,144 20. Certain complications of surgical and medical care — 216,035 The following information pertains to the first 32 CMS Pioneer Accountable Care Organizations in 2011. Data was provided by Stratasan and published in a Jarrard Phillips Cate & Hancock blog post.
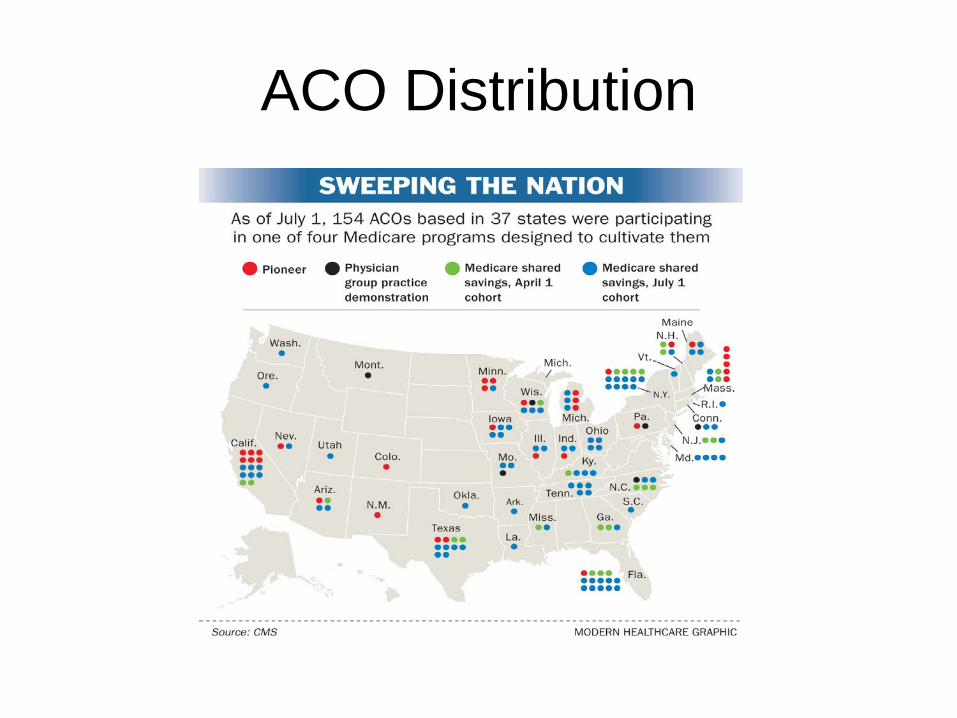
ACO Distribution
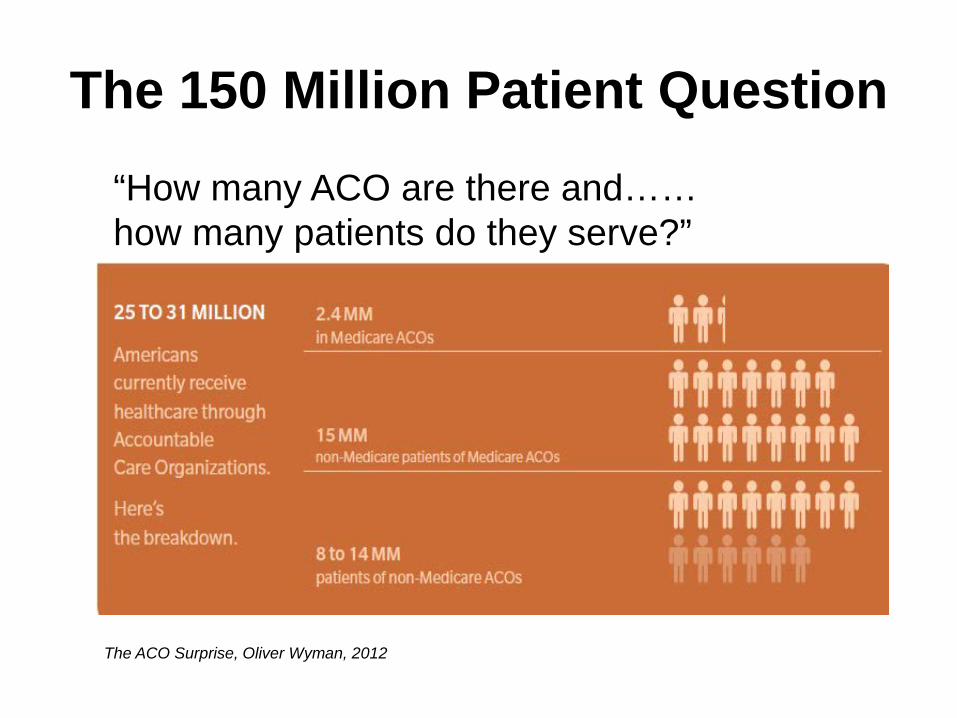
The 150 Million Patient Question
“How many ACO are there and…… how many patients do they serve?”
The ACO Surprise, Oliver Wyman, 2012

Bundled Payments
Under episode-based bundled payment systems, a provider contacting organization is paid a fixed amount for all care required by patients who meets the definition of the episode. Since no definition of episodes results in a totally homogeneous group of patients, cost of individual patients vary, and therefore the contacting organization is subject to random variations in its average per-patient cost depending on which patients are included in its episodes.

Bundled Payments As bundled payment models evolve, two different methods of managing these types of variations appear to have emerged: • Under the Medicare Bundled Payment for Care
Improvement episodes were based on DRGs, all variations of a base DRG were required to be included (without complications, with complications, etc.). Because Medicare patients comprise a large portion of most hospitals’ patient populations, this definition resulted in a relatively large number of patients be included in the episodes. Therefore, the risk mitigation strategy was based on large population sizes.

Bundled Payments As bundled payment models evolve, two different methods of managing these types of variations appear to have emerged: •Under many commercial bundled payment contracts, however, the strategy appears to be different. In these contracts, episodes are defined using ICD-9 diagnosis and procedure codes, rather than DRGs. Since diagnosis codes are more granular, this results in a smaller number of patients in each episode. Therefore, the risk mitigation strategies employed in these contracts appear to be to tightly define the episodes, and to exclude patients with unrelated conditions, expecting that this will compensate for the smaller population sizes.

Show me the money!
Pay for Reporting ($) •Inpatient QRP •Outpatient QRP
Value-Based Purchasing ($/$) Utilization Payment ($)
Readmissions ($)
HAC Low-Quartile ($)
Published Metrics/Performance ($/$)
Accountable Care Organization
Bundled Payments

October 1 – January 1, 2013 Here is what we know about the financial impact of October 1, 2012: • Value-Based Purchasing (VBP)
– CMS has predicted that $850 million will change hands among inpatient acute care hospitals. • Readmissions
– Hospitals will be assessed a penalty of up to 1% to the extent they exceed expected readmissions for pneumonia, heart failure and acute myocardial infarct. BD’s Reimbursement team has calculated a net loss, in aggregate, of $330.8 million. Once again, fortunately for BD, we can model how each hospital in the US will fare under the readmission program. CMS states $280 million in savings
• Hospital Acquired Conditions / Present On Admission (HAC/POA) – CMS has predicted a net savings of $24 million under the HAC program for FY13.
• Payment Reform (Accountable Care Organizations, Bundled Payments, etc.) – Most facilities appreciate there will be an intermittent loss in revenue as they transition from a
fee-for-service model to payment models that encourage better coordinated care, resulting in reduced utilization.
Here is what we know about the financial impact of January 1, 2013 • Sequestration (The Budget Control Act 2011) To make matters even worse, at the end of the first
quarter of FY13, hospitals may lose an additional 2% of their revenue on January 1, 2013 under Sequestration. What is Sequestration? This is the program that was ultimately adopted when Congress could not resolve the budget deficient issue.
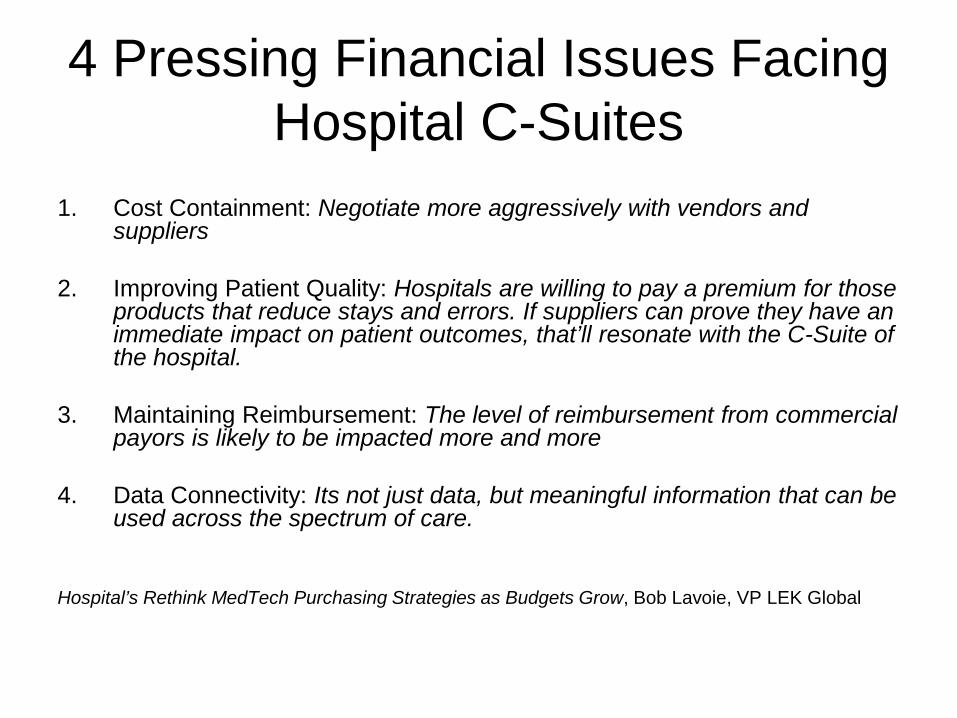
4 Pressing Financial Issues Facing Hospital C-Suites
1. Cost Containment: Negotiate more aggressively with vendors and
suppliers
2. Improving Patient Quality: Hospitals are willing to pay a premium for those products that reduce stays and errors. If suppliers can prove they have an immediate impact on patient outcomes, that’ll resonate with the C-Suite of the hospital.
3. Maintaining Reimbursement: The level of reimbursement from commercial
payors is likely to be impacted more and more 4. Data Connectivity: Its not just data, but meaningful information that can be
used across the spectrum of care.
Hospital’s Rethink MedTech Purchasing Strategies as Budgets Grow, Bob Lavoie, VP LEK Global

Process Improvements Vital to Cost Containment
Health Leaders Magazine In our annual Industry Survey, healthcare
leaders place cost control and process improvement as their third-highest priority for the next three years (behind patient experience and satisfaction, and clinical quality and safety).
John Commins, for HealthLeaders Media , June 11, 2012

Drill Down Benchmarking Process improvement methodology must include
meaningful measures of performance that can be easily reported to employees and staff.
For example, for years we told nurses to shorten length of stay, but what does that mean to them? Once we drilled down to the specific ways they could impact LOS, we started seeing improvement.
How can nurses impact LOS? They can make sure orders are inputted in a timely manner; they can make sure test results are delivered to physicians quickly; the list goes on. A Culture of Continuous Improvement is Necessary for Success Under Value-Based Care, Imran Andrabi, Sr VP and CPO Mercy

Unintended Consequences of Reducing Labor Costs
• The transition to ACOs and the fiscal impact of the Affordable Care Act (ACA) provisions will result in reduced revenues for hospitals over the next three to five years.
• As a result, hospitals are striving to reduce costs by 5% for every 1% reduction in revenue
• About two-thirds of every dollar spent by hospitals goes to wages and benefits for qualified, trained nurses, physicians, caregivers and other staff. Growth in labor cost accounts for about 35% of overall growth and more than half of the growth in the costs of purchased goods and services.
• If the rate of mass layoffs in hospitals remains steady, the industry is slated to have a similar number of mass layoffs in 2012 as it did in 2011, according to an American Medical News report. The first nine months of 2012 brought 93 layoff incidents that left 6,529 people claiming unemployment benefits. A total of 124 mass layoffs are projected for the year, if this rate continues, affecting roughly 8,700 people. The year 2011 brought 121 mass layoffs in hospitals, resulting in job loss for 8,098 people.

Unintended Consequences of Reducing Labor Costs
• Burned-out nurses linked to more infections in patients. For every extra patient added to a nurse’s workload, there was roughly one additional hospital-acquired infection logged per 1,000 patients, according to researchers from the Center for Health Outcomes and Policy Research at the University of Pennsylvania School of Nursing. For each 10 percent jump in the proportion of nurses who logged high levels of burnout, there was roughly one additional catheter-associated urinary tract infection per 1,000 patients and almost extra two surgical site infection per 1,000 patients according to a study published in the American Journal of Infection Control.
• Medical Errors with the largest measurable costs: #2 Post-Operative Infection Total Cost of Error; $3,676 million
• Healthcare-associated positive clinical culture results may be associated with a significantly shorter time to hospital readmission. The researchers identified 4,737 patients with positive clinical cultures for MRSA, VRE or C. difficile after more than 48 hours following hospital admission. These patients were 40 percent more likely to readmitted to the hospital within a year and 60 percent more likely to be readmitted within 30 days than patients with negative or no clinical cultures.
• 2,211 hospitals stand to forfeit an estimated $280 million in Medicare funds beginning October 1, as year one of Medicare readmissions penalties take effect in October 1st.

Health Care Reform What It Is…Why It’s Necessary… How It Works Jonathon Gruber Amazon.com $7.50

Thank You!

Percentage of Hospitalizations, by Expected Payment Source*

Three ACO Models • Mandated ACO/Shared Savings Program
– One-sided Model: Share in savings, no penalty for loses – Two-sided Model; Share in savings AND losses
• Related Initiatives thru ‘Innovation” Center (CMMI)
– Pioneer Model • Faster pathway for “mature” ACOs • Exisiting organizations structured to provide coordination, integrated
care – Advanced payment Model
• For organizations that need additional access to captial to become an ACO
• Funding based on expected future savings

Final IPPS Rule Has Three New Value-Based
Purchasing Measures, Finalizes Readmissions Factors • The new measures that will be included for the 2015 value-based
purchasing program include two new outcomes measures – – a central line-associated blood stream infection – a patient safety indicator composite measure – – plus a Medicare spending per beneficiary efficiency measure.
• The final rule also finalizes the methodology and payment adjustment factors
to account for excess hospital readmissions for three conditions: – heart attack, – heart failure – and pneumonia.
CMS estimates that the readmissions program will result in an approximately $280
million decrease -- .3 percent -- in overall hospital payments.

Healthcare Facility HAI Reporting to CMS via NHSN –
Current and Proposed Requirements
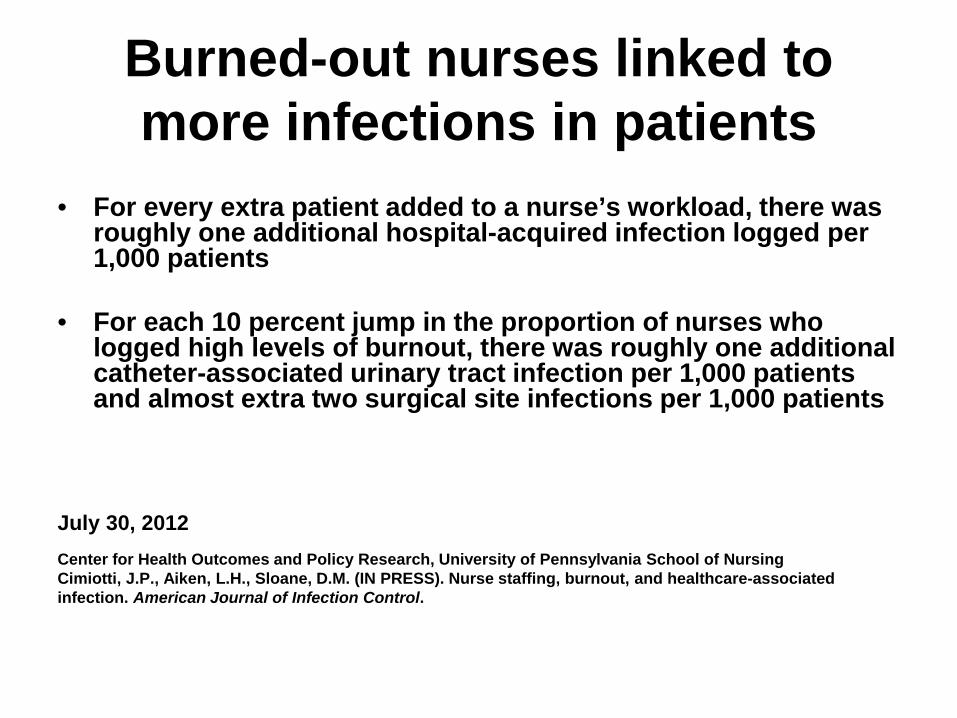
Burned-out nurses linked to more infections in patients
• For every extra patient added to a nurse’s workload, there was
roughly one additional hospital-acquired infection logged per 1,000 patients
• For each 10 percent jump in the proportion of nurses who logged high levels of burnout, there was roughly one additional catheter-associated urinary tract infection per 1,000 patients and almost extra two surgical site infections per 1,000 patients
July 30, 2012 Center for Health Outcomes and Policy Research, University of Pennsylvania School of Nursing Cimiotti, J.P., Aiken, L.H., Sloane, D.M. (IN PRESS). Nurse staffing, burnout, and healthcare-associated infection. American Journal of Infection Control.