the alba field: improved reservoir … alba field: improved reservoir characterisation using 4d...
TRANSCRIPT

© Chevron 2005
Elaine CampbellOliver HermannSteve DobbsAndrew WarnockJohn Hampson
The Alba Field: Improved Reservoir Characterisation using 4D Seismic Data

© Chevron 2005 2
Alba Field Location
Block 16/26, UK Central North Sea
130 miles NE of Aberdeen
Discovered 1984
1st Oil January 1994
Equity:
Chevron 23% (operator)
ConocoPhillips 23%
StatoilHydro 17%
BP 13%
Total 13%
Cieco 8%
Endeavour 2%

© Chevron 2005 3
Alba Geology
Eocene, high density turbidite
Amalgamated channelised sands deposited in a preexisting scour
Massive, homogeneous unconsolidated sandstone & intrareservoir shales
Sand remobilisation, causing injectites and “wing” structures
High porosity (35%) & perms (2.54 D)
High vertical permeability
Reservoir thickness ~ 250 ft
G EN E R A L ISED A LB AST R A T I G R APH Y
LATE
EO
CENE
MID
DLE
EOCE
NE
AGE
ALBA
FO
RMAT
ION IV
III
II
I
O L IG O C E N E
UNIT FM.
Figure 2.2.1
Alba Schematic G eological C ross Section
Main Reservoir
WingsWings
Alba Schematic G eological C ross Section
Main Reservoir
WingsWings
Surlyk et al. 2007
© Chevron 2005 4
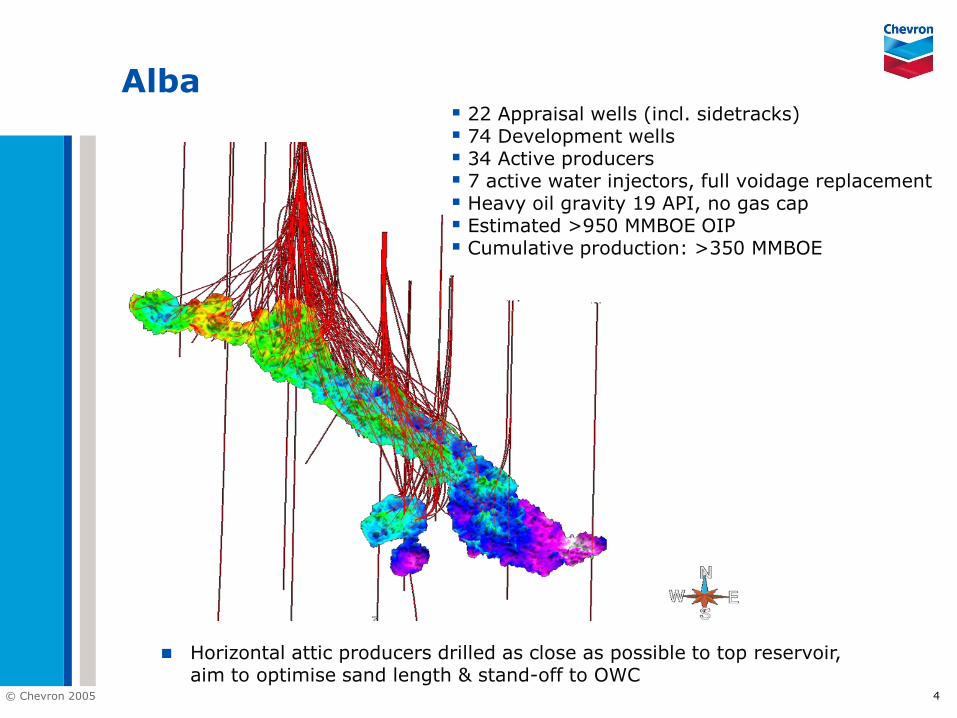
Alba
Horizontal attic producers drilled as close as possible to top reservoir, aim to optimise sand length & standoff to OWC
22 Appraisal wells (incl. sidetracks) 74 Development wells 34 Active producers 7 active water injectors, full voidage replacement Heavy oil gravity 19 API, no gas cap Estimated >950 MMBOE OIP Cumulative production: >350 MMBOE

© Chevron 2005 5
Chronology of Seismic Surveys
1989 Acquired Alba streamer survey
1991 Acquired Britannia streamer survey
1994 Production started
1998 Acquired Alba OBC survey; not designed for 4D
2002 Veritas Q15 Spec streamer survey acquired; not designed for 4D, but similar orientation as Britannia 1991
July 2008 Acquired dedicated Alba 4D designed to repeat Vertitas 2002 streamer survey
Oct 2008 Delivery of fast track coprocessing of 2002 and 2008 surveys
Jan 2009 Delivery of full coprocessed 1991, 2002 and 2008 surveys

© Chevron 2005
6
PWave versus SWave Seismic Surveys
SW NE
PP91 Data
Line 2285
12 Area
Alba Extreme South
SW NELine 2285
Si99 Data Shear Impedance Inversion of S‐Wave (for Lithology)
PWave (PP) Seismic Data shows strong fluid effect but no clear image of the reservoir
SWave (PS) Seismic Data shows lithological changes, injected sands & large intra shale geobodies

© Chevron 2005 7
Key Geological Uncertainties
Rugose/injected character of the top reservoir
Nature of field edges, Alba “wings”
Scale & location of intrareservoir shale geobodies
Orientation & nature of fault networks
Understanding fluid transmissibility across faults has become increasingly important over time
15 AREANORTH AREA
12 AREA
CENTRALAREA
EXTREAME SOUTH
© Chevron 2005 8
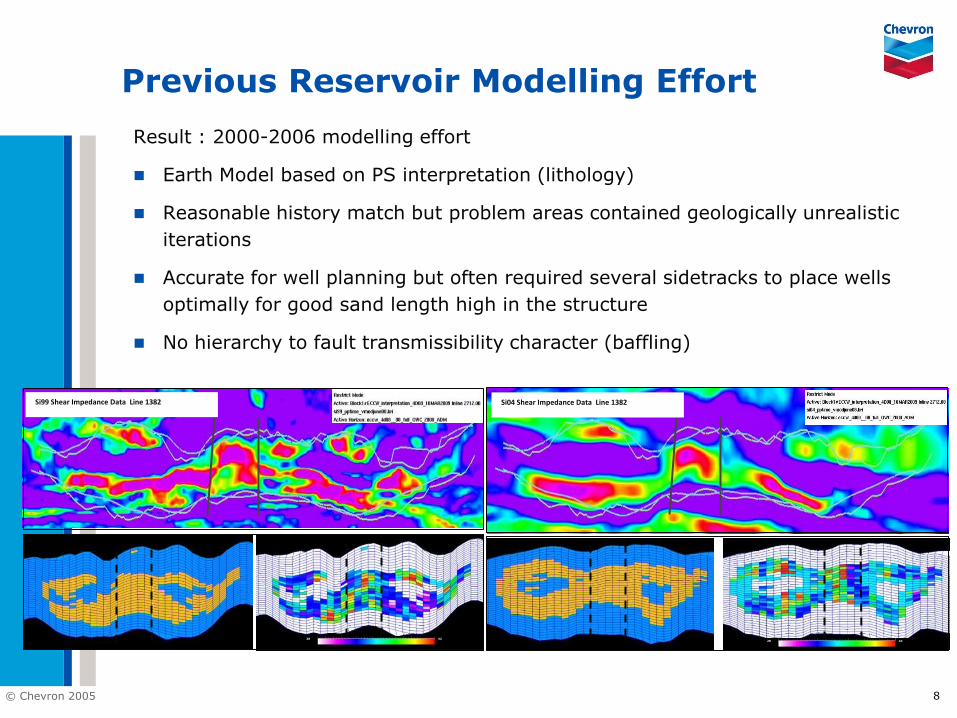
Result : 20002006 modelling effort
Earth Model based on PS interpretation (lithology)
Reasonable history match but problem areas contained geologically unrealistic iterations
Accurate for well planning but often required several sidetracks to place wells optimally for good sand length high in the structure
No hierarchy to fault transmissibility character (baffling)
Previous Reservoir Modelling Effort
28 42
Si99 Shear Impedance Data Line 1382
42
Si04 Shear Impedance Data Line 1382
28 42

© Chevron 2005 9
2008 Reservoir Modelling Effort
Reinterpret the 1991, 2002 & newly acquired 2008 PP Seismic & build a new Earth Model which encompassed the optimal learnings from the PS & PP interpretations
Early & continuous collaborative work between the earth scientist & reservoir engineer to validate static & dynamic options
Dynamic simulations to validate the preferred static grid design
Static guidance on fault transmissibility multipliers & pore volume multipliers
Achieve a history match that maintains geological integrity of the Earth model
Customised workflowbased modelling, iterative aspect of the modelling project required the ability to rapidly update the static Earth model
© Chevron 2005 10
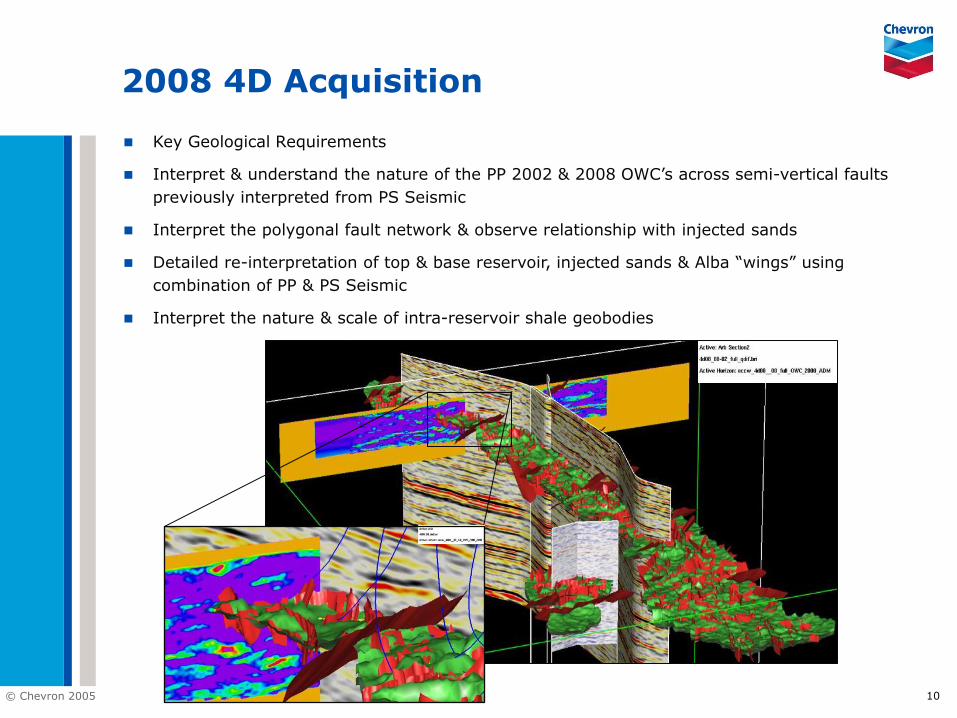
2008 4D Acquisition
Key Geological Requirements
Interpret & understand the nature of the PP 2002 & 2008 OWC’s across semivertical faults previously interpreted from PS Seismic
Interpret the polygonal fault network & observe relationship with injected sands
Detailed reinterpretation of top & base reservoir, injected sands & Alba “wings” using combination of PP & PS Seismic
Interpret the nature & scale of intrareservoir shale geobodies

© Chevron 200511
N
Time display, vertical exaggeration 2:1
Interpretation Polygonal Fault Network
Results: Polygonal Faults
Mainly visible on PP datasets
Cut the top of the reservoir interval & delineate
Commonly seen at the field edges
Generation mechanism dewatering of shale packages
PP08

© Chevron 2005 12
Results: Vertical Faults
More visible on PS data, dominantly at reservoir level
Pronounced topographical feature in the central main field
Fault trend offsetting reservoir, downthrown on the eastern flank
Generation mechanism unknown most likely associated with compaction & sand remobilisation
Impact on sand & fluid distribution recognised
PP08PS99
Interpretation Vertical Fault Network
© Chevron 2005 13
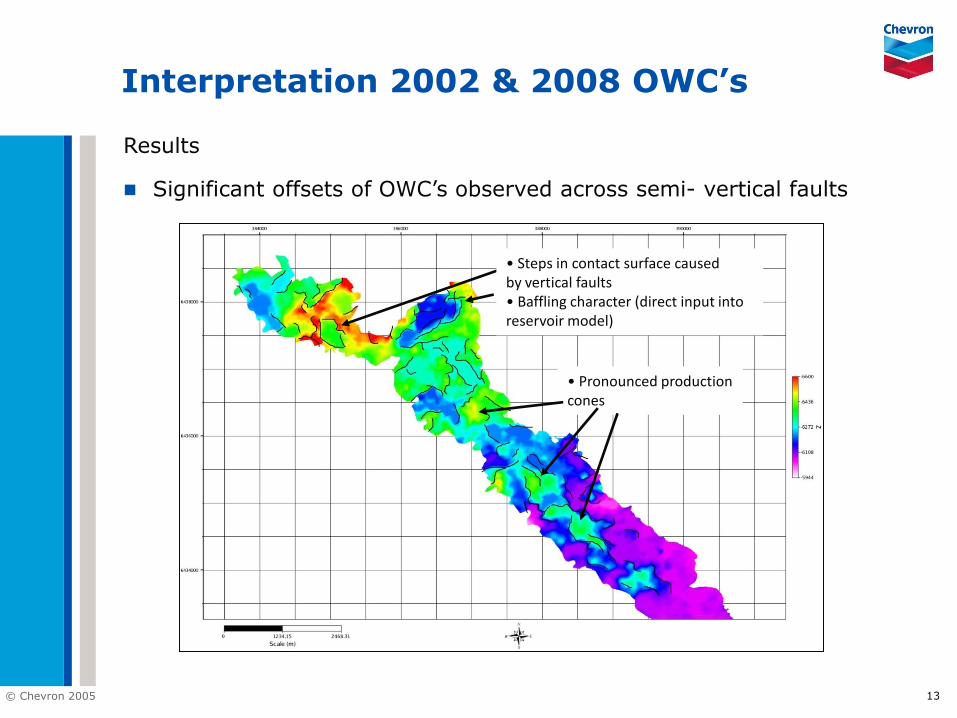
Interpretation 2002 & 2008 OWC’s
Results
Significant offsets of OWC’s observed across semi vertical faults
• Steps in contact surface causedby vertical faults• Baffling character (direct input into reservoir model)
• Pronounced production cones
© Chevron 2005 14
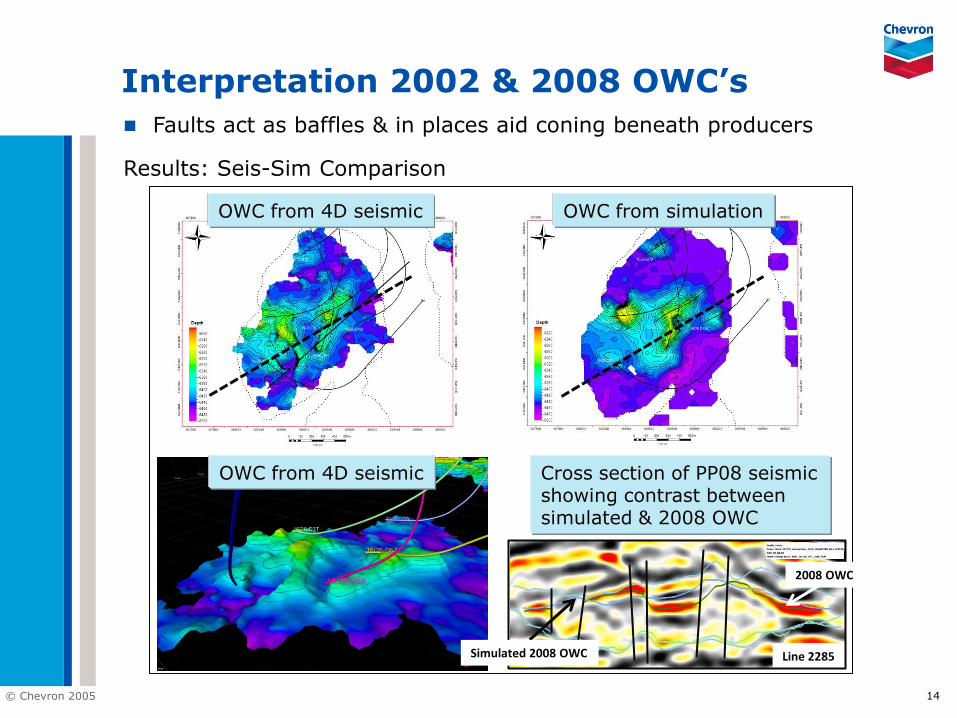
Interpretation 2002 & 2008 OWC’s
OWC from 4D seismic OWC from simulation
OWC from 4D seismic Cross section of PP08 seismic showing contrast between simulated & 2008 OWC
Faults act as baffles & in places aid coning beneath producers
Results: SeisSim Comparison
Line 2285
2008 OWC
Simulated 2008 OWC

© Chevron 2005 15
Interpretation 2002 & 2008 OWC’s
Results: SeisSim Comparison
Away from fault zones coning under wells was steeper & sharper than simulated saturation surfaces
Line 2468
40% Swsurfaces 2008 extracted from PSmodel
2008 OWC shows sharp cone development under A23Z producer
© Chevron 2005 16
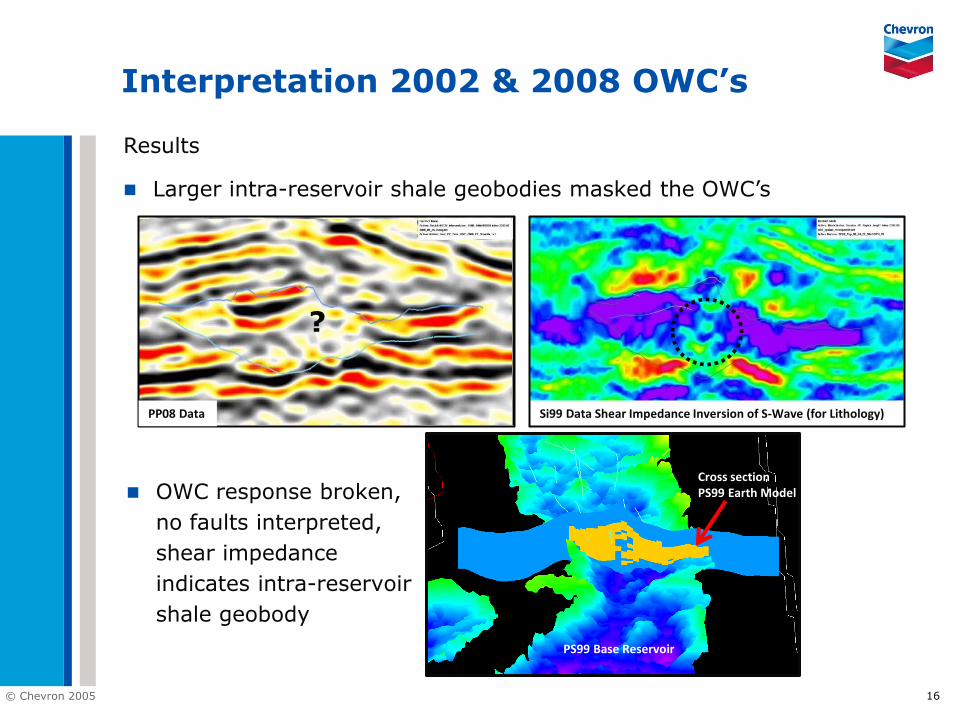
Interpretation 2002 & 2008 OWC’s
Results
Larger intrareservoir shale geobodies masked the OWC’s
Si99 Data Shear Impedance Inversion of S‐Wave (for Lithology)
PS99 Base Reservoir
Cross section PS99 Earth Model OWC response broken,
no faults interpreted, shear impedance indicates intrareservoir shale geobody
PP08 Data
?
© Chevron 2005 17
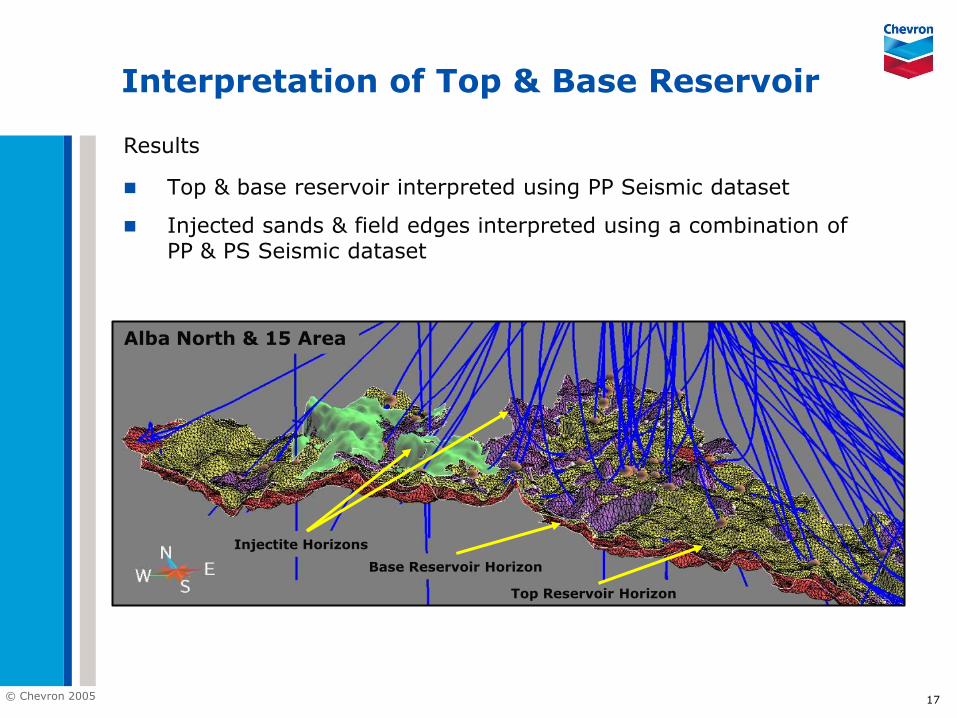
Interpretation of Top & Base Reservoir
Results
Top & base reservoir interpreted using PP Seismic dataset
Injected sands & field edges interpreted using a combination of PP & PS Seismic dataset
Injectite Horizons
Top Reservoir Horizon
Base Reservoir Horizon
Alba North & 15 Area

© Chevron 2005 18
Interpretation of Top & Base Reservoir
Results
Injectites difficult to interpret on PP data
PS Shear Impedance is the best guide
si99Si99 Data Shear Impedance Inversion S‐Wave (for Lithology) Line 1382
Alba North & 15 Area
PS Top Injectite
Line 1382PP08 Data

© Chevron 2005 19
Ways to evaluate the 4D signal
2008
1991
© Chevron 2005 20
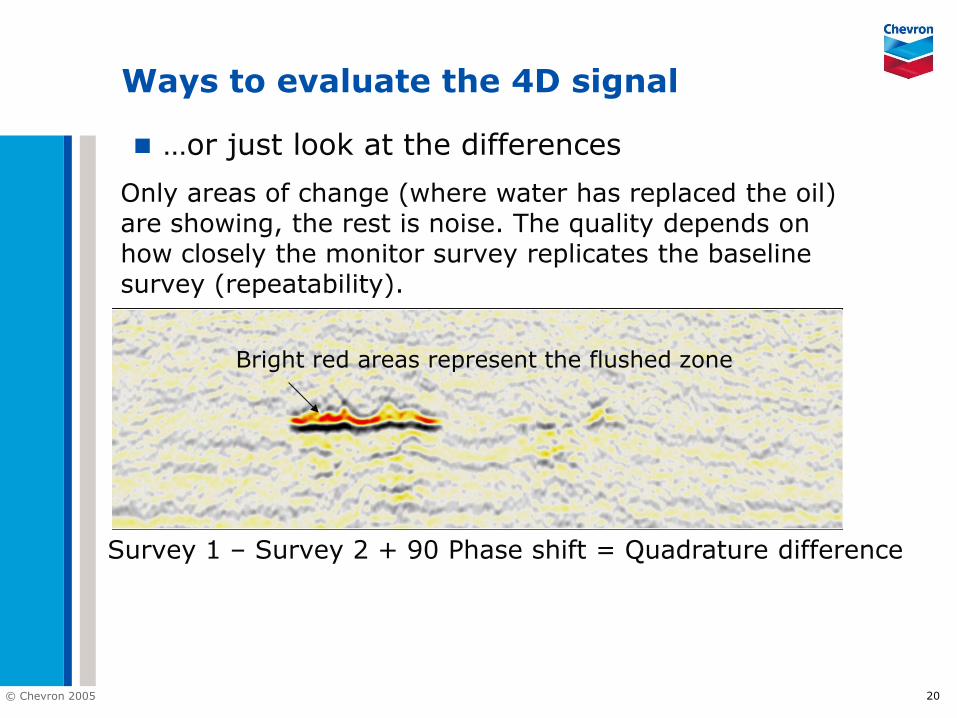
Ways to evaluate the 4D signal
…or just look at the differences
Survey 1 – Survey 2 + 90 Phase shift = Quadrature difference
Only areas of change (where water has replaced the oil)are showing, the rest is noise. The quality depends onhow closely the monitor survey replicates the baseline survey (repeatability).
Bright red areas represent the flushed zone
© Chevron 2005 21
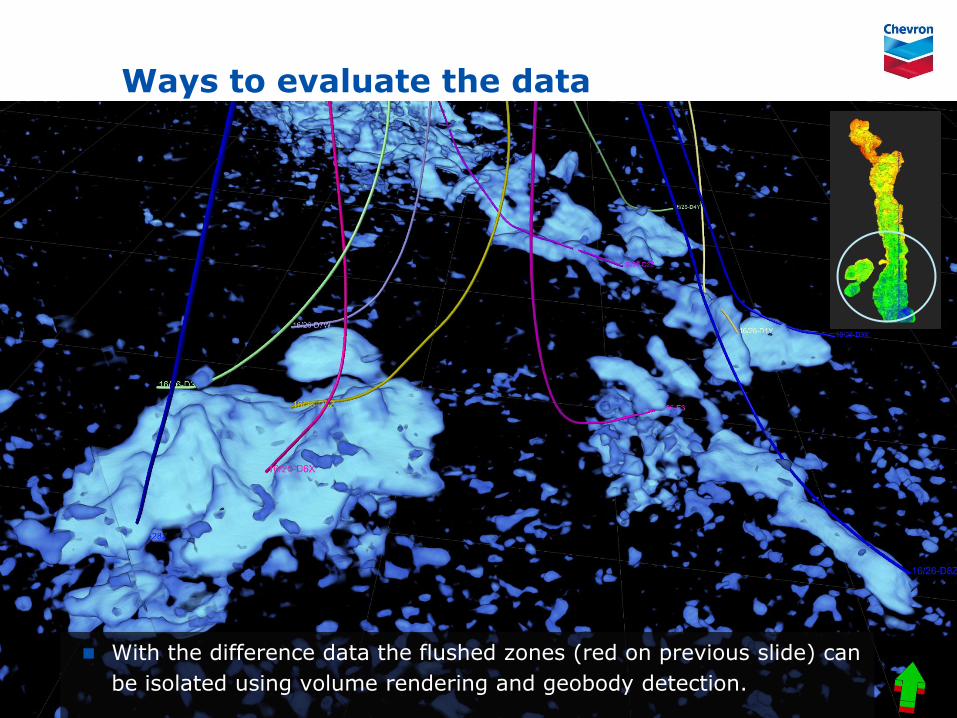
Ways to evaluate the data
With the difference data the flushed zones (red on previous slide) can be isolated using volume rendering and geobody detection.

© Chevron 2005 22
Current Earth Model
Results:
Reservoir model is considered a realistic representation of the subsurface
Increased team confidence to optimise placement of future wells & better predict well performance
Significant timesaving benefit due to continuous collaboration between the earth scientist and the reservoir engineer & use of workflowbased modelling tools
PP08 Data Line 1382
Si99 Shear Impedance Data Line 1382
PP08 PP08
28 42
PS99 PS99
© Chevron 2005 23
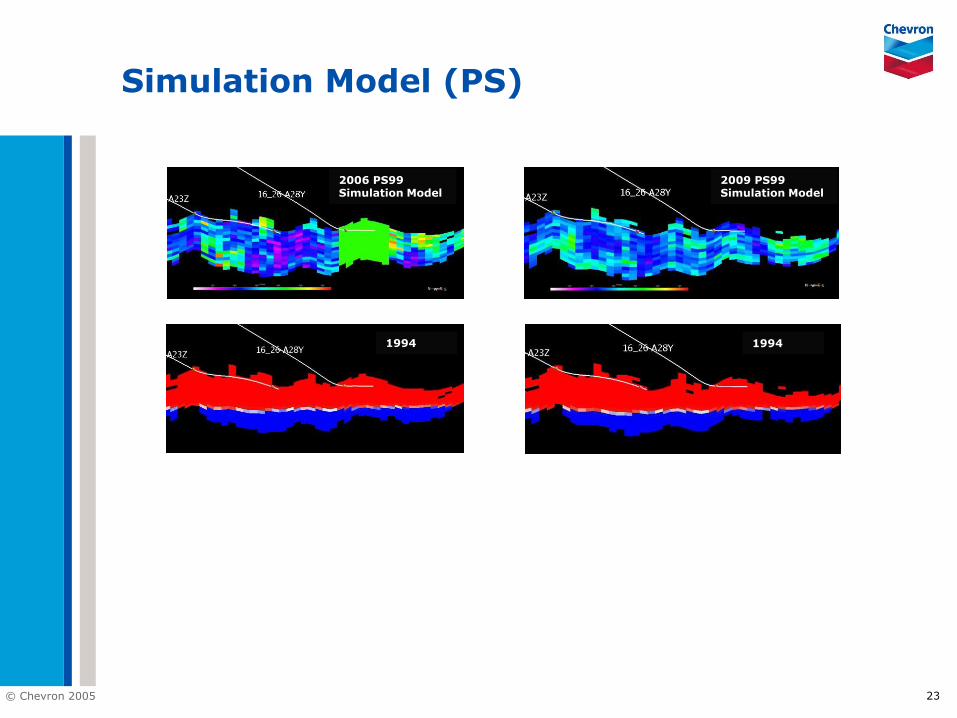
Simulation Model (PS)
2006 PS99 Simulation Model
2009 PS99 Simulation Model
1994 1994
© Chevron 2005 24
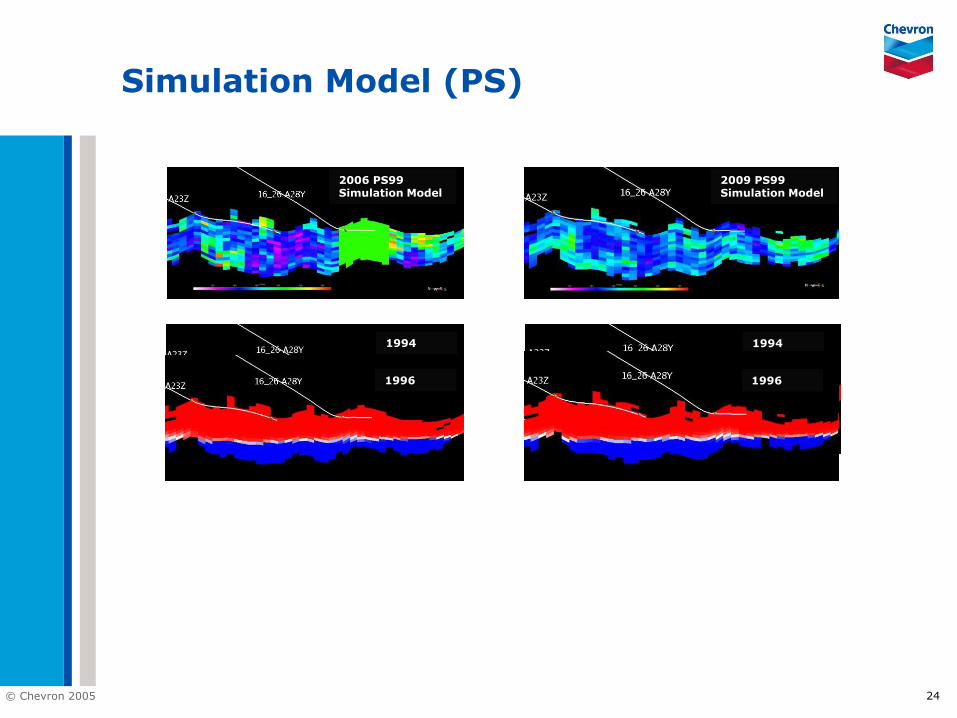
Simulation Model (PS)
2006 PS99 Simulation Model
2009 PS99 Simulation Model
1994 1994
1996 1996
© Chevron 2005 25
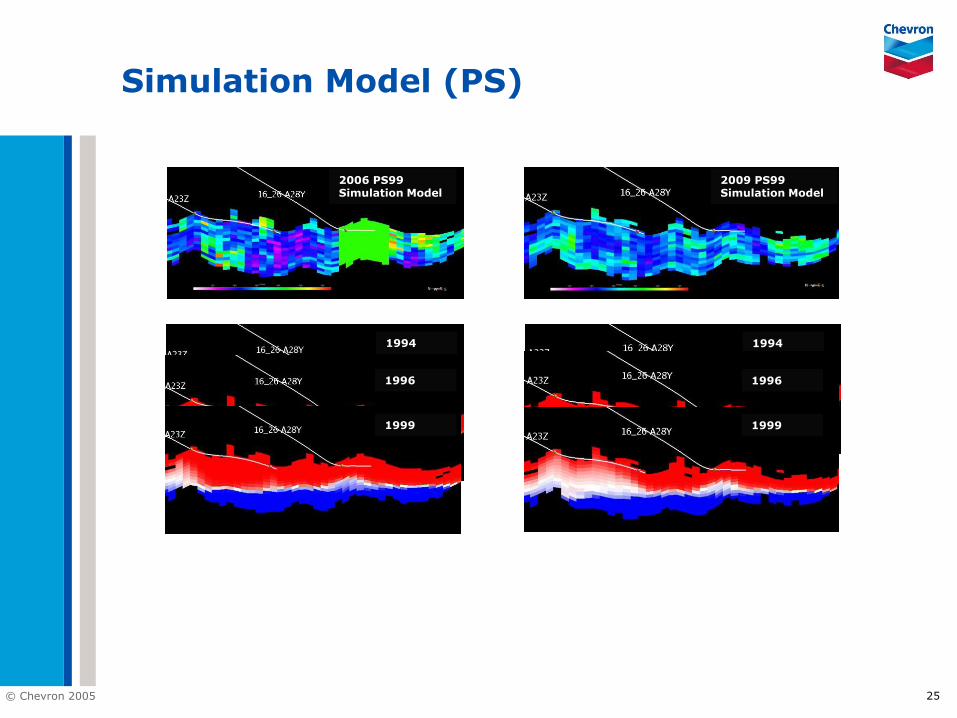
Simulation Model (PS)
2006 PS99 Simulation Model
2009 PS99 Simulation Model
1994 1994
1996 1996
1999 1999

© Chevron 2005 26
Simulation Model (PS)
2006 PS99 Simulation Model
2009 PS99 Simulation Model
1994 1994
1996 1996
1999 1999
2002 2002

© Chevron 2005 27
Simulation Model (PS)
2006 PS99 Simulation Model
2009 PS99 Simulation Model
1994 1994
1996 1996
1999 1999
2002 2002
2003 2003

© Chevron 2005 28
Simulation Model (PS)
2006 PS99 Simulation Model
2009 PS99 Simulation Model
1994 1994
1996 1996
1999 1999
2002 2002
2003 2003
2008 2008

© Chevron 2005
Questions