the alberta hail suppression program – an operational update
TRANSCRIPT

Daniel B. Gilbert CHIEF METEOROLOGIST
Weather Modification, Inc.
Fargo, North Dakota USA
Terry W. Krauss PROJECT DIRECTOR
Alberta Hail Suppression Project
Alberta Severe Weather Management Society
Alberta CANADA
Bruce A. Boe DIRECTOR OF METEOROLOGY
Weather Modification, Inc.
WMI Photograph by Andreas Bertoni
Weather Modification Annual Meeting Desert Research Institute Reno, Nevada 23-25 April 2014

AHSP Project Area

AHSP Project Area

AHSP Project Area
SEEDING BUFFER ZONE
PROTECTED AREA
Approximately 11,100 mi2
(28,800 km2)
Cities and towns, not agriculture
RADAR & OPS CENTER

Quick History
• Alberta Research Program 1956-1986
• 1991 Calgary storm
• The Alberta Severe Weather Management Society (ASWMS)
• Rebirth of AHSP in 1996

Hail frequency in Canada

Hail frequency in Canada

Population Density
2011 Census

Canadian Natural Disasters(IBC, PCS)
-
500,000
1,000,000
1,500,000
2,000,000
2,500,000
1983
1985
1987
1989
1991
1993
1995
1997
1999
2001
2003
2005
2007
2009
2011
Year
Th
ou
san
ds o
f D
ollars
CA
D
Canada Disasters Alberta Storms
7 Sep 1991
Calgary Hailstorm
1996 Quebec
Flooding
1998 Quebec
Ice Storm
2005 Ontario
Wind/Rain storm
2011 Slave Lake
Alberta Fire
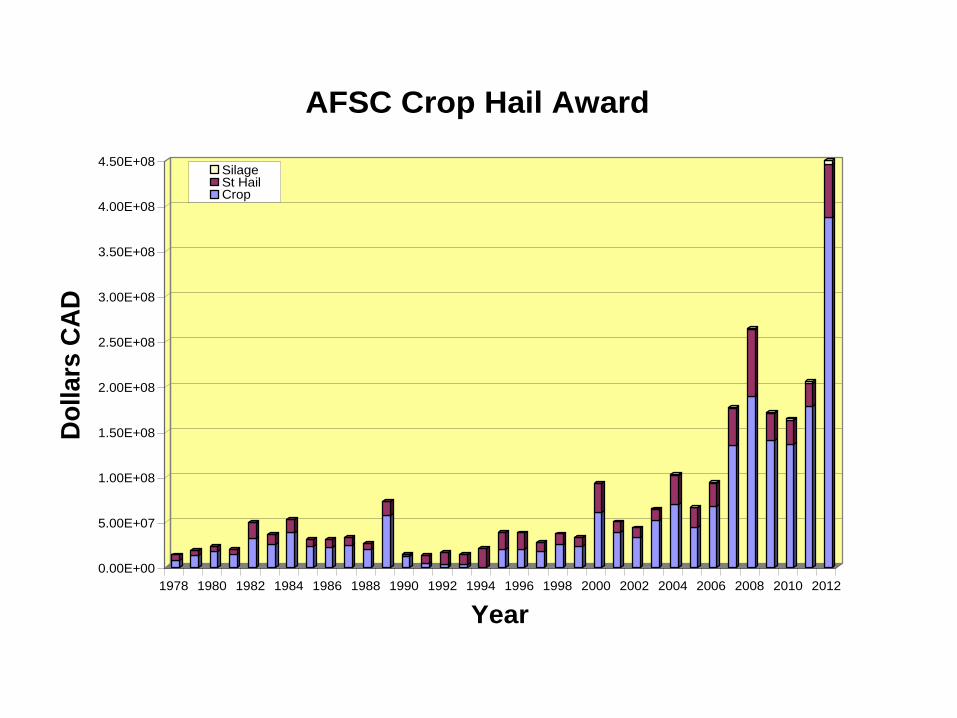
0.00E+00
5.00E+07
1.00E+08
1.50E+08
2.00E+08
2.50E+08
3.00E+08
3.50E+08
4.00E+08
4.50E+08
Do
llars
CA
D
1978 1980 1982 1984 1986 1988 1990 1992 1994 1996 1998 2000 2002 2004 2006 2008 2010 2012
Year
AFSC Crop Hail Award
SilageSt HailCrop

Concepts

Seeding Concepts Illustration from Canadian Geographic, based
on WMO schematic, 1995

Targeting
• Potential hailers headed for or developing over urban areas are targeted.
• Simultaneous seeding at cloud top and at cloud base.
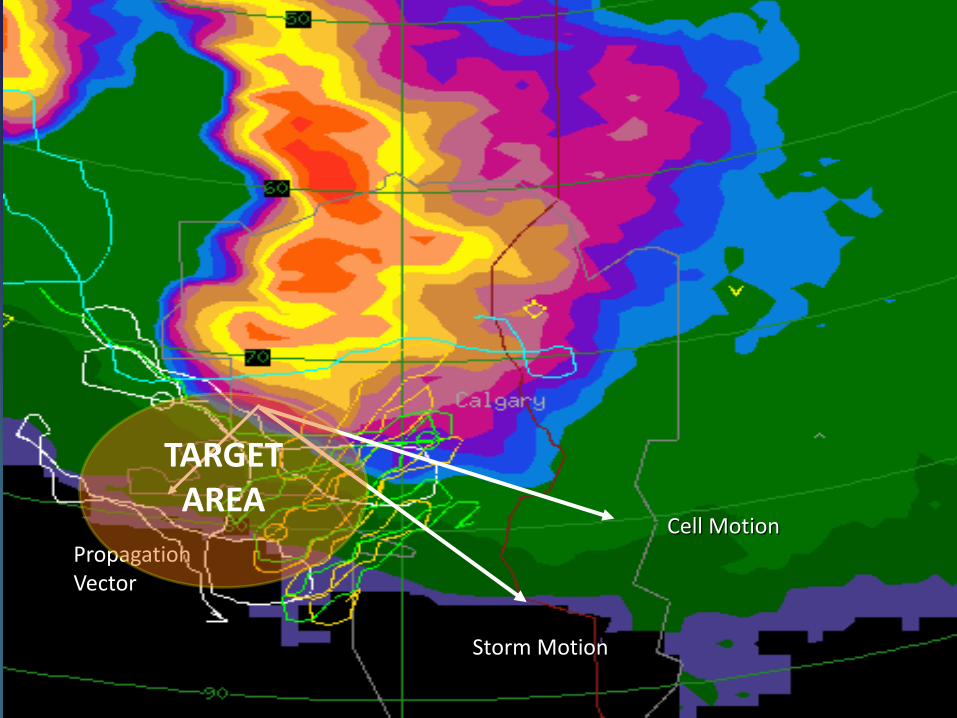
Propagation Vector
Cell Motion
Storm Motion
TARGET AREA

15
16

Operations Design
• Five Aircraft: three Beechcraft C90 King Airs,
two Cessna 340As.
• Two aircraft bases, one in the south, west of
Calgary, the other up north just SW of Red
Deer.
• Operations are all directed from central
operations area about halfway between Calgary
and Red Deer.

Cessna 340A • 310 HP per side
• 1,650 fpm climb rate
• 244 kts max speed
• 29.8 kft service ceiling
• 24-30 BIPs, 102 EJs
2 wingtip generators
Two Cessna 340A aircraft are employed in the AHSP. Hailstop 2 is based in Springbank, west of Calgary, and Hailstop 4 is based at the Red Deer Regional Airport, immediately SW of Red Deer.

King Air C90 • 550 HP per side
• 2,137 fpm climb rate
• 230 knots max cruise
• 30 kft service ceiling
• 48 BIPs and 306 EJs Three King Air C90 aircraft are deployed in the AHSP. Hailstop 1 and 5 are based in Springbank, west of Calgary, and Hailstop 3 is based at the Red Deer Regional Airport, immediately SW of Red Deer.

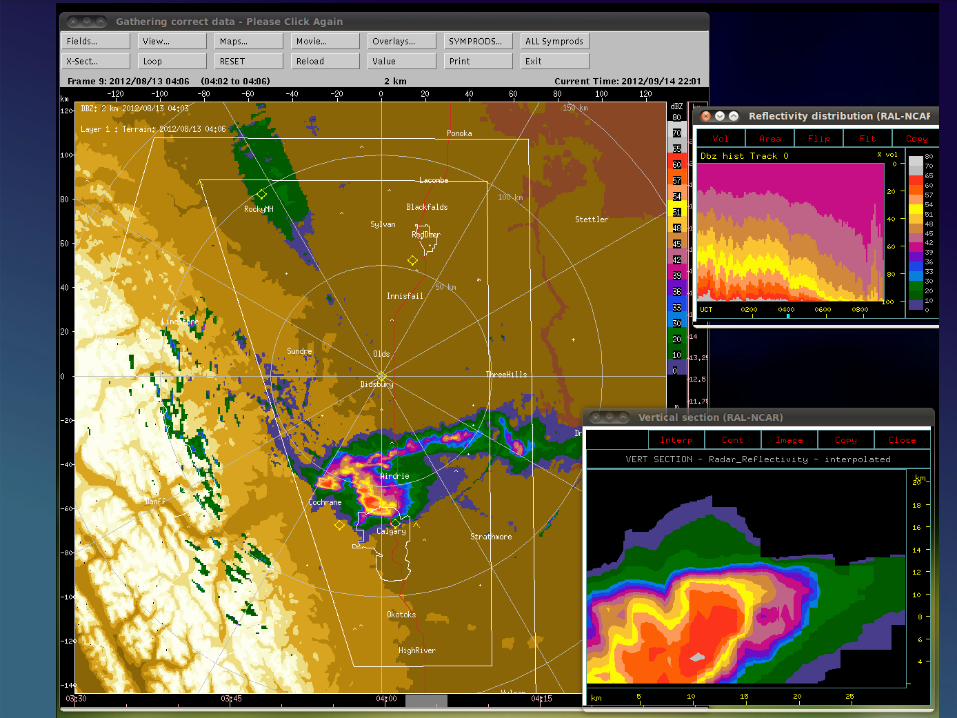
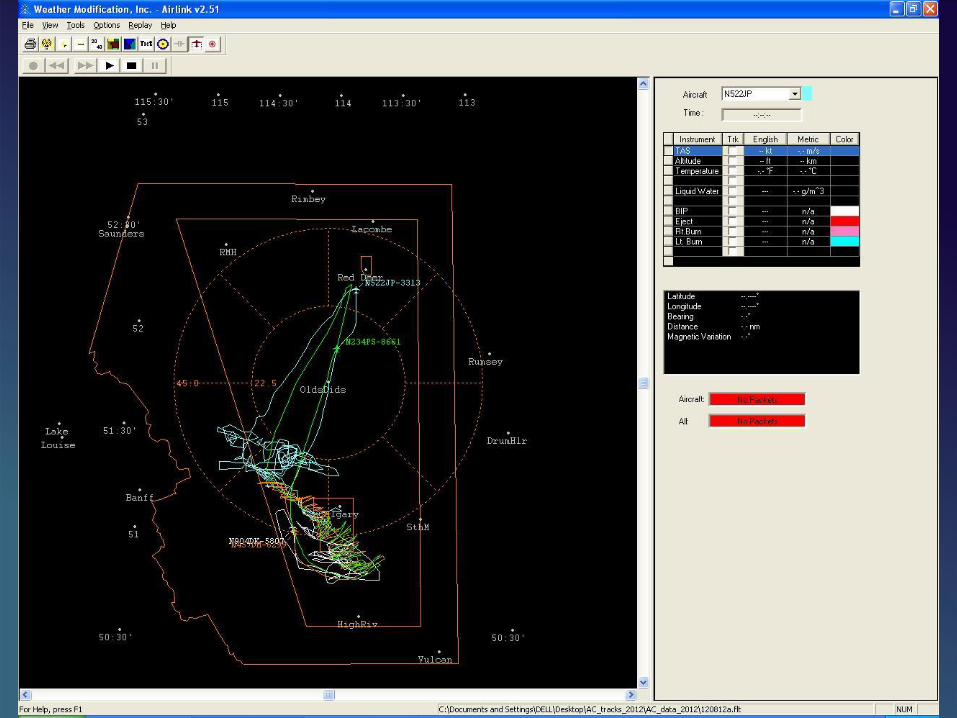
AHSP Infrastructure

The War Room
Shown here, the Operations Room contains, TITAN, CIDD, AirLink, VHF radio, radar log, etc.


The Key Personnel
• Alberta Severe Weather Manager Society
– Chairman: Todd Klapak
– Project Director: T.W. Krauss
• Weather Modification, Inc.
– On-Site Project Manager: J.M. Fischer
– Chief Met./Operations Director: D.Bz. Gilbert
Configuring TITAN parameters prior to the 2012 season. (Gilbert and Krauss, front to back.)
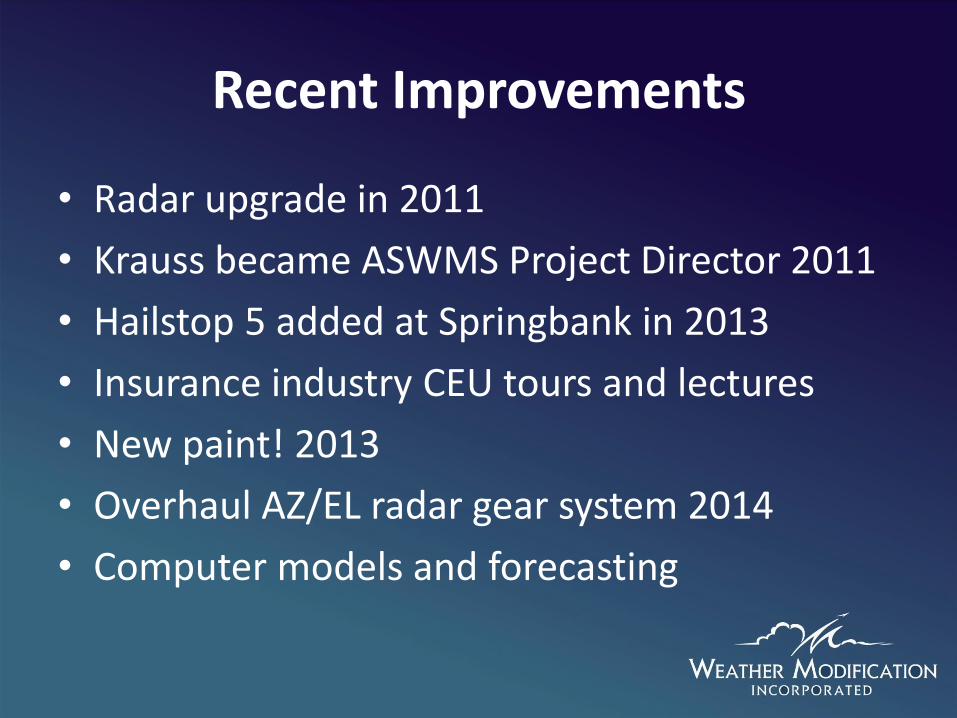
Recent Improvements
• Radar upgrade in 2011
• Krauss became ASWMS Project Director 2011
• Hailstop 5 added at Springbank in 2013
• Insurance industry CEU tours and lectures
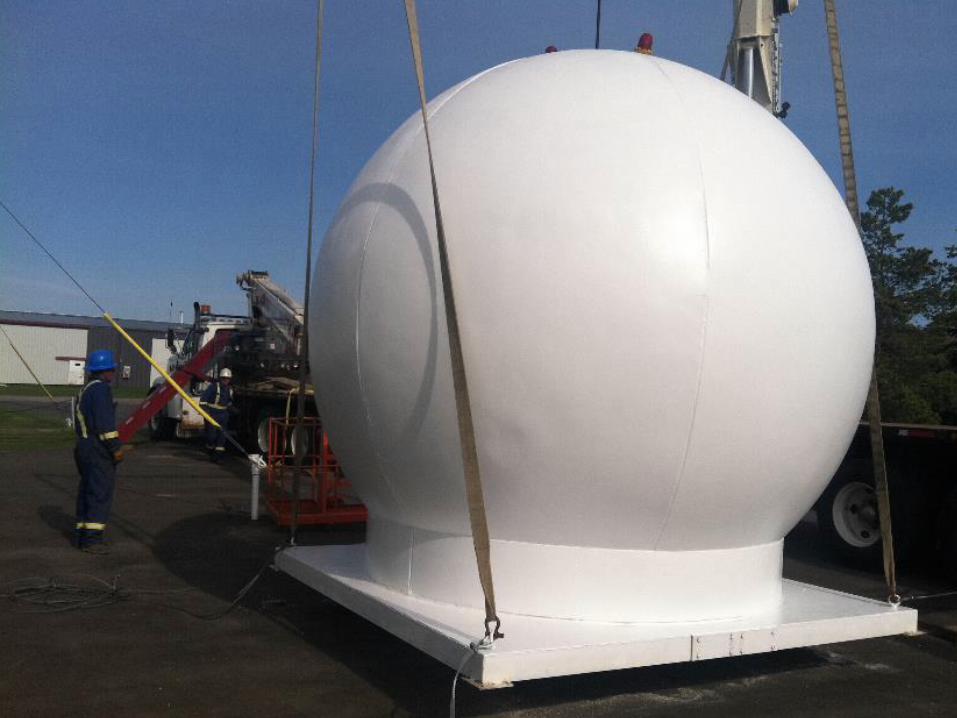
• New paint! 2013
• Overhaul AZ/EL radar gear system 2014
• Computer models and forecasting

Recent Improvements - Radar • HiQ digital receiver
with Doppler
• New transmitter (modulator and power supply) now Pulse Systems solid state
• Latest TITAN version
• Ubuntu Operating System


CDC Strategy Description
-3 No Seed Clear skies, fair weather cumulus, or stratus (with no rain). No deep convection.
-2 No Seed Towering cumulus, altocumulus, alto-stratus, or nimbostratus producing rain for several hours or weak echoes (e.g. virga).
-1 No Seed Scattered convective rain showers but no threat of hail. No reports of lightning.
0 Patrol flights and potential seeding
Thunderstorms (at least one) but no hail. VIL < 20 kg/m2 within the project area or buffer zones on north, east, and south sides.
+1 Seed Thunderstorms with pea or shot sized hail (0.5 to 1.2 cm diameter). 20 kg/m2 < VIL < 30 kg/m2
+2 Seed Thunderstorms with grape sized hail (1.3 to 2.0 cm diameter). 30 kg/m2 < VIL < 70 kg/m2
+3 Seed Thunderstorms with walnut sized hail (2.1 to 3.2 cm diameter). 70 kg/m2 < VIL < 100 kg/m2
+4 Seed Thunderstorms with golf ball sized hail (3.3 to 5.2 cm diameter). VIL > 100 kg/m2
+5 Seed Thunderstorms with greater than golf ball sized hail (>5.2 cm diameter).
Recent Improvements - Forecasting

Forecast vs. Observed CDC Daily Values - 2013
Green - The forecast and observed CDCs were the same (perfect forecasts).
Yellow - The observed CDC was greater than those forecast (underforecasts).
Blue - The observed CDCs were less than those forecast (overforecasts).
Observed Convective Day Category (CDC)
-3 -2 -1 0 1 2 3 4 5 Days
-3 10 10
-2 2 1 1 1 1 6
Fore
cast
CD
C
-1 3 2 1 6
0 2 1 4 1 8
1 1 1 3 3 4 11 1 24
2 3 4 17 4 28
3 1 1 1 3 5 7 18
4 1 1 3 2 7
5 0 0
Days 17 7 6 12 9 34 10 10 2 107
Percent correct exact CDC category = 45/107 = 42% (38% in 2012)
Percent correct within one CDC category = 85/107 = 79% (76% in 2012)
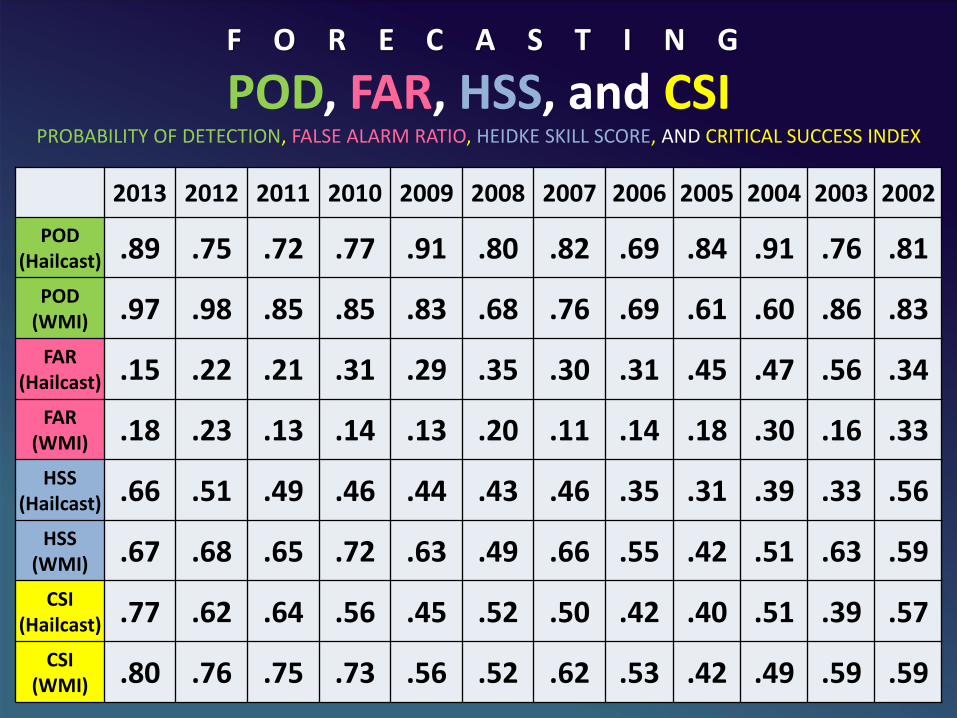
F O R E C A S T I N G
POD, FAR, HSS, and CSI PROBABILITY OF DETECTION, FALSE ALARM RATIO, HEIDKE SKILL SCORE, AND CRITICAL SUCCESS INDEX
2013 2012 2011 2010 2009 2008 2007 2006 2005 2004 2003 2002
POD (Hailcast) .89 .75 .72 .77 .91 .80 .82 .69 .84 .91 .76 .81
POD (WMI) .97 .98 .85 .85 .83 .68 .76 .69 .61 .60 .86 .83
FAR (Hailcast) .15 .22 .21 .31 .29 .35 .30 .31 .45 .47 .56 .34
FAR (WMI) .18 .23 .13 .14 .13 .20 .11 .14 .18 .30 .16 .33
HSS (Hailcast) .66 .51 .49 .46 .44 .43 .46 .35 .31 .39 .33 .56
HSS (WMI) .67 .68 .65 .72 .63 .49 .66 .55 .42 .51 .63 .59
CSI (Hailcast) .77 .62 .64 .56 .45 .52 .50 .42 .40 .51 .39 .57
CSI (WMI) .80 .76 .75 .73 .56 .52 .62 .53 .42 .49 .59 .59

Operational Statistics
Season Se
ed
ed
Sto
rm
Day
s
Air
craf
t M
issi
on
s
Tota
l Flig
ht
Tim
e
(ho
urs
)
Sto
rms
See
de
d
AgI
Pe
r St
orm
(kg
)
Eje
ctab
le
Fla
res
BIP
Fla
res
See
din
g So
luti
on
(g
allo
ns)
Sea
son
Act
ivit
y R
an
k
Mean 31.2 101.2 209.0 91.9 2.24 4705 620 153.3
2013 26 103 229.6 70 3.33 6311 636 131.7 9
2012 37 143 300.1 116 2.70 7717 914 260.3 2
2011 48 158 383.0 134 3.00 10779 1020 350.2 1
2010 42 115 271.8 118 2.20 5837 851 227.5 5
2009 20 38 109.3 30 1.60 451 237 56.5 18
2008 26 112 194.7 56 2.20 1648 548 113.5 13
2007 19 76 115.3 41 2.40 1622 413 77 17
2006 28 92 190.2 65 3.30 4929 703 145.4 10
2005 27 80 157.9 70 2.30 3770 515 94.2 14
2004 29 105 227.5 90 3.00 6513 877 132.7 6
2003 26 92 163.6 79 2.20 4465 518 92.6 12
2002 27 92 157.4 54 2.30 3108 377 80.3 16
2001 36 109 208.3 98 2.00 5225 533 140.8 7
2000 33 130 265.2 136 2.50 9653 940 141.3 3
1999 39 118 251.3 162 1.30 4439 690 297.5 4
1998 31 96 189.9 153 0.70 2023 496 193.8 8
1997* 38 92 188.1 108 1.00 2376 356 144.3 11
1996* 29 71 159.1 75 2.20 3817 542 80.5 15 *The 1996 and 1997 seasons began on June 15, not June 1, which has been the norm ever since.
Past four seasons have all ranked in top 10 most active Two busiest seasons were 2011 and 2012 AgI per storm highest in 2013 likely due to addition of fifth aircraft
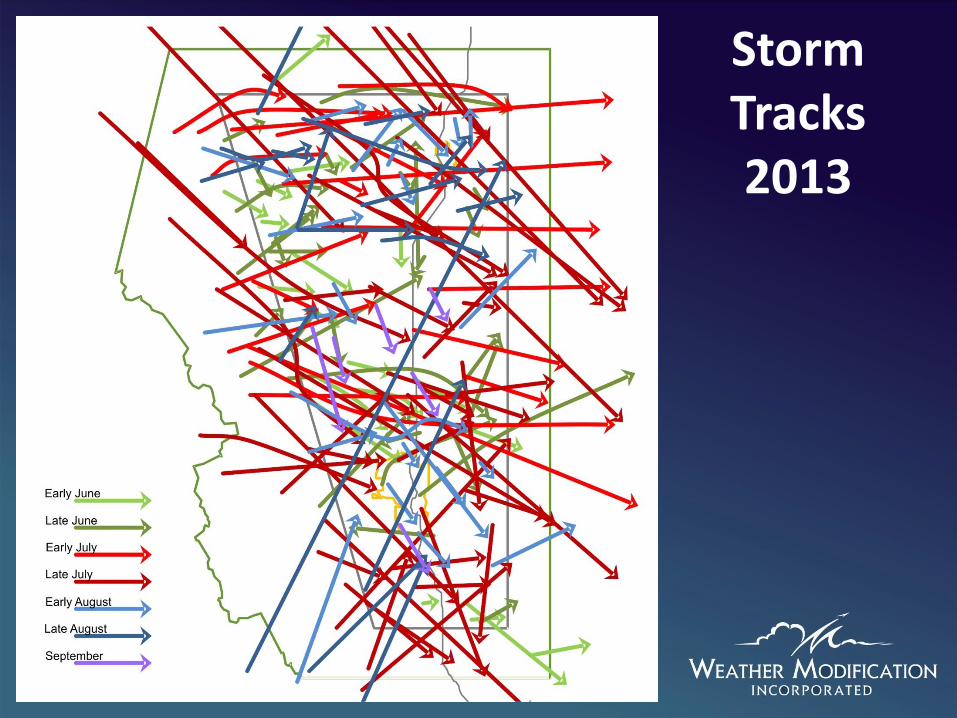
Storm Tracks 2013

12 August 2012 4 Seed Flights
12.8 hrs flight time 584 Ejectable flares 90 End-Burner flares
14.8 Gallons of Acetone 26.5 kg of seed agent
12 August 2012 “The Bad & Ugly”

South of Water Valley received a report of loonie sized hail. Hail was intermittent and heavy rain lasted about half an hour.
A closer look at 12 August 2012
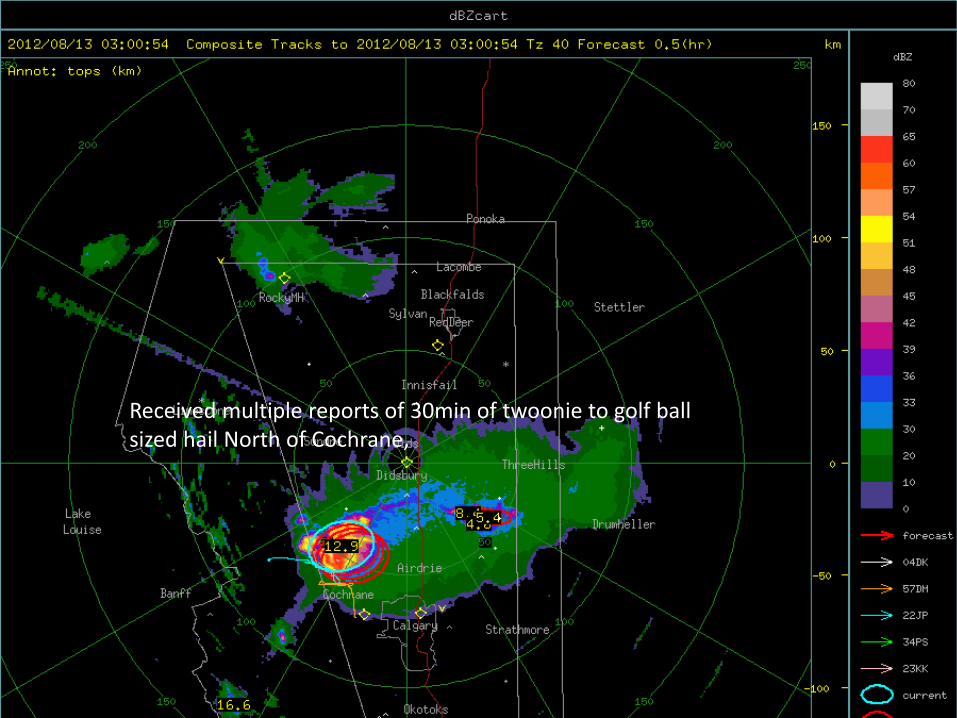
Received multiple reports of 30min of twoonie to golf ball sized hail North of Cochrane,

From Twitter #ABStorm hail bigger than a golf ball. Picture had golf ball with hail for reference.
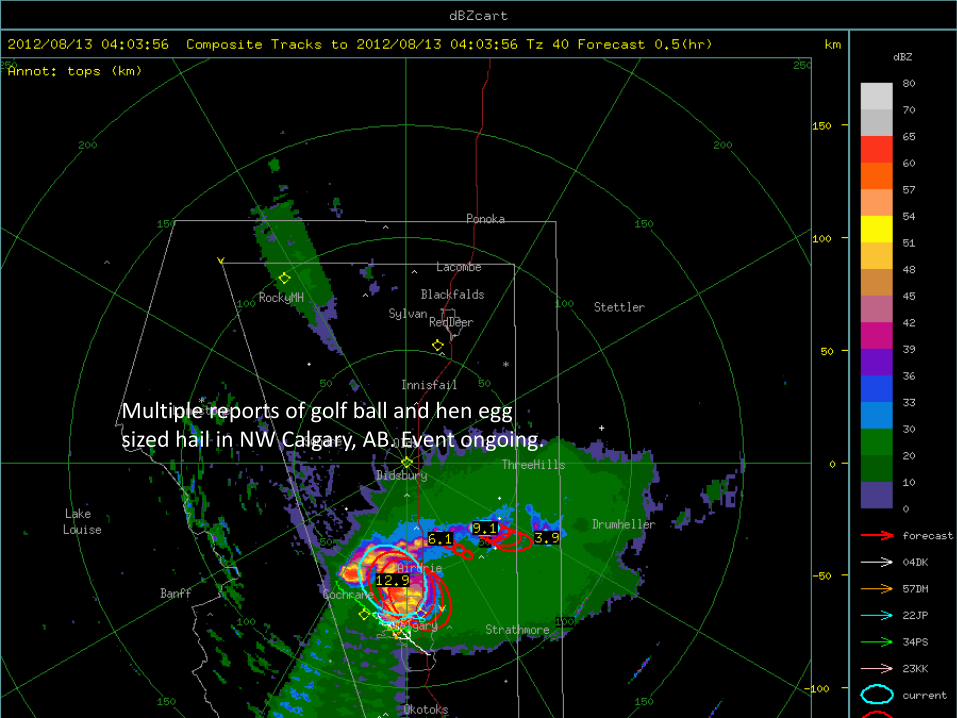
Multiple reports of golf ball and hen egg sized hail in NW Calgary, AB. Event ongoing.

Received at least 25 reports of golf ball or bigger sized hail in NW, NE and SE Calgary, AB. Some reports of broken windows in homes and hail accumulations on the level. Smaller hail (~nickel) accumulating inches deep in various regions of the city. Event ongoing.

Received multiple reports of accumulating nickel to quarter sized hail in the NW area of Calgary, AB.


Storm Track & Intensity
Max VIL Track
Reduced VIL After Seeding

Reduced VIL after seeding
time
Vil
fro
m m
axZ (
kg
/m
2)
6543210-1
200
150
100
50
0
Seeding
S2
S3
S4
N
S1
Scatterplot of Vil from maxZ (kg/m2) vs time
Storm enters Calgary
Before Seeding
Seeding

VIL of Seeded storm < Natural storm VIL
Vil from maxZ (kg/m2)
Pe
rce
nt
10010
99
95
90
80
70
60
50
40
30
20
10
5
1
Loc
0.158
4.625 0.4280 49 1.413 <0.005
Scale N AD P
4.947 0.1791 40 0.538
SeedT
B
S
Probability Plot of Vil from maxZ (kg/m2)Lognormal - 90% CI
Seeded
Not Seeded


Lethbridge
Med Hat
Brooks
Foremost
Taber
Cardston
Questions?
Photograph
by B. Waller,
20120731