the american attitude toward foreign language education...
TRANSCRIPT
i
THE AMERICAN ATTITUDE TOWARD FOREIGN LANGUAGE EDUCATION FROM
THE 1700’S TO 2006
by
Nancy Vieira Sterniak
B.S. in Education, University of Southern Indiana, 1995
Majors in Spanish, mathematics; endorsement in computers
Certificate in Teaching English as a Second Language, Juniata College, 2007 Certificate in Latin American Studies University of Pittsburgh, 2006
M.A. in Spanish, University of Pittsburgh, 2004 Ed.S. in Curriculum, Instruction, and Media Technology, Indiana State University, 1999
M.S. in Spanish, Indiana State University, 1997
Submitted to the Graduate Faculty of
Education in partial fulfillment
of the requirements for the degree of
Doctor of Philosophy
University of Pittsburgh
2008
ii
UNIVERSITY OF PITTSBURGH
SCHOOL OF EDUCATION
This dissertation was presented
by
Nancy Vieira Sterniak
It was defended on
April 26, 2008
and approved by
Dr. Donald Goldstein, Professor, Graduate School of Public and International Affairs
Dr. Gordon Jackson, Senior Researcher, Defense Language Institute
Dr. John Weidman, Professor, School of Education
Dr. Bonnie Youngs, Professor of French, Carnegie Mellon University
Dissertation Advisor: Dr. William Bickel

iii
Copyright © by Nancy Vieira Sterniak
2008
THE AMERICAN ATTITUDE TOWARD FOREIGN LANGUAGE EDUCATION FROM
THE 1700’S TO 2006
Nancy Vieira Sterniak, PhD candidate
University of Pittsburgh, 2008
The purpose of this study is to explore the American attitude toward foreign language
education in the United States. The author wished to explore events that may have shaped
foreign language education from the 1700’s until today.
iv
TABLE OF CONTENTS
LIST OF TABLES......................................................................................................................... X
LIST OF FIGURES………………………….……………………......………………….….....XIII
ACNOWLEDGEMENTS........................................................................................................XVIII
NOMEMCLATURE ….............................................................................................................XIX
1.0 INTRODUCTION ............................................................................................................. .1
1.0.1 Foreign Language Status in the United States………………………………………1
1.0.2 The Author’s Intent with the Study…………………………………………………2
1.1 ORGANIZATION OF THE STUDY ………………………….………………………...4
1.1.1 Overview of each Section…………………………..…………………….……….5
1.2 CONCEPTUAL FRAMEWORK……………….………………………………………..7
1.2.1 Research Question.………………………….………………………………………8
1.3 STUDY LIMITATIONS……………………….…………………………..………..9
2.0 LITERATURE REVIEW - INTRODUTION……………………………………………10
2.1 EXPLORATION OF THE THREE AREAS BEING STUDIED IN THIS
CHAPTER…………………………………………………………..……………..….12
2.1.1 Foreign Language Instruction……....……………………...………………..…..12
2.1.1.1 Definition of the term foreign language………..…………………..…..12
v
2.1.1.2 Advantages and disadvantages of being a native speaker of English…...14
2.1.1.3 Foreign Language Education…………………………..………………..15
2.1.1.4 Lack of foreign language competence impacts American businesses…..17
2.1.1.5 The global language became the English language………..……………18
2.1.1.6 Not all business meetings are conducted in the English language……...19
2.1.1.7 Lack of foreign language competence impacts national security………..20
2.1.1.8 Modern day endorsement of foreign language education……………….26
2.1.2 Federal Funding for Foreign Language Instruction ....………………….….28
2.1.2.1 Funding for foreign language education resulting from the Cold
War……………………………………………………………………...28
2.1.2.2 Funding for foreign language education in the 1990’s………..………..29
2.1.2.3 Funding for foreign language education in the 2000’s……..…………..30
2.1.2.4 Funding for languages other the three mostly commonly taught……....36
2.1.3 Foreign language course enrollment ……………….……………………….43
2.1.3.1 Immigration trends between 1900 and 2006…………..………………..43
2.1.3.2 Overall foreign language course enrollment in grades 9 to 12 between the
1948 and 2000……………………………………….………………….47
2.1.3.3 Foreign language course enrollment between the 1950’s and the
1960’s…………………………………………………………….…….49
2.1.3.4 Foreign language course enrollment between the 1980’s and the
1990’s…………………………………………………………………..49
2.1.3.5 Foreign language course enrollment in tertiary institutions between 1960
and 2002………………………………………..……………………….50
vi
3.0 RESEARCH METHOD - INTRODUCTION......…………………..……………..….….55
3.1 CATEGORIZATION OF RESEARCH AREAS.……………...……………………......56
3.2 BASIC RESEARCH APPROACH …………….…………………………..………...….57
3.3 RESEARCH PROCEDURE……………………….……………………………………..58
3.4 INSTRUMENTATION…………………………………………..……………………….59
3.5 ANALYSIS OF DATA……………………….…………………………………………..60
3.5.1 Data Analysis on Immigration Patterns…………………………………….……….60
3.5.2 Data Analysis on Federal Funding for Foreign Language Instruction………...……62
3.5.3 Data Analysis on Foreign Language Course Enrollment………………….……..…63
4.0 FINDINGS - INTRODUCTION……...…………………….…….………………….....66
4.1 AMERICAN ATTITUDE TOWARD FOREING LANGUAGE EDUCATION IN THE
1700’s…………………………………..……..…………….…………………....……..68
4.1.1 U.S. immigration in the 1700’s …………………….……………………………68
4.1.2 Foreign language instruction in the 1700’s ……………..………………………69
4.1.3 Federal funding for foreign language instruction in the 1700’s …………………71
4.1.4 Foreign language course enrollment in the 1700’s ……………..………………71
4.1.5 Summary of the 1700’s………………………………………………………72
4.2 AMERICAN ATTITUDE TOWARD FOREING LANGUAGE EDUCATION IN THE
1800’s……………………………….………………………………...……………..…..73
4.2.1 U.S. immigration in the 1800’s ………………………....………………………73
4.2.2 Foreign language instruction in the 1800’s ……………………..………………77
4.2.3 Federal funding for foreign language instruction in the 1800’s …………………79
4.2.4 Foreign language course enrollment in the 1800’s ……..………………………80
vii
4.2.5 Summary of the 1800’s………………………………………..………………….82
4.3 AMERICAN ATTITUDE TOWARD FOREING LANGUAGE EDUCATION IN THE
1900’s……………………………….…………………………………….……...……..83
4.3.1 U.S. immigration in the 1900’s ……………………..…………………..………83
4.3.2 Foreign language instruction in the 1900’s ………………………..……………88
4.3.3 Federal funding for foreign language instruction in the 1900’s …………………91
4.3.4 Foreign language course enrollment in the 1900’s ………..……………………92
4.3.5 Summary of the 1900’s…………………………………..……………………….95
4.4 AMERICAN ATTITUDE TOWARD FOREING LANGUAGE EDUCATION IN THE
2000’s……………………………….…………………………………..………...……..97
4.4.1 U.S. immigration in the 2000’s …………………..……..………………………97
4.4.2 Foreign language instruction in the 2000’s ……………………………………102
4.4.3 Federal funding for foreign language instruction in the 2000’s …….…………107
4.4.4 Foreign language course enrollment in the 2000’s …………………….………110
4.4.5 Summary of the 2000’s……………………………………….………………….116
5.0 DISCUSSION - INTRODUCTION……………….…………………………...………118
5.1 DISCUSSION POINTS ABOUT U.S IMMIGRATION FROM THE 1700'S TO
2006…………………………………………….………………..……………………..119
5.2 DISCUSSION POINTS ABOUT FOREIGN LANGUAGE INSTRUCTION IN THE U.S.
FROM THE 1700’S TO 2006………………………………….………………………120
5.3 DISCUSSION POINTS ABOUT U.S. FUNDING FOR FOREIGN LANGUAGE
INSTRUCTION FROM THE 1700’S TO 2006…………………………….………….123
viii
5.4 DISCUSSION POINTS ABOUT FOREIGN LANGUAGE COURSE ENROLLMENT
FROM THE 1700’S TO 2006………………………………………………………….124
5.5 OVERALL STUDY DISCUSSION…………………………………………………….126
6.0 EPILOGUE …………………………………………………...………………..……...127
APPENDIX A: University of Pittsburgh’s Institutional Review Board Completion of Module
and Approval Form……………………………………………….….…….129
APPENDIX B: Immigration record between 1900 and 1929 ………………………….…...131
APPENDIX C: Immigration record between 1940 and 2006 ………..……………….…….140
APPENDIX D: Pattern of foreign language course enrollment in United States’ public
secondary schools and institutions of higher education between 1948 and
2002 …………………………………………..…………………………….149
BIBLIOGRAPHY .................................................................................................................... .157
ix
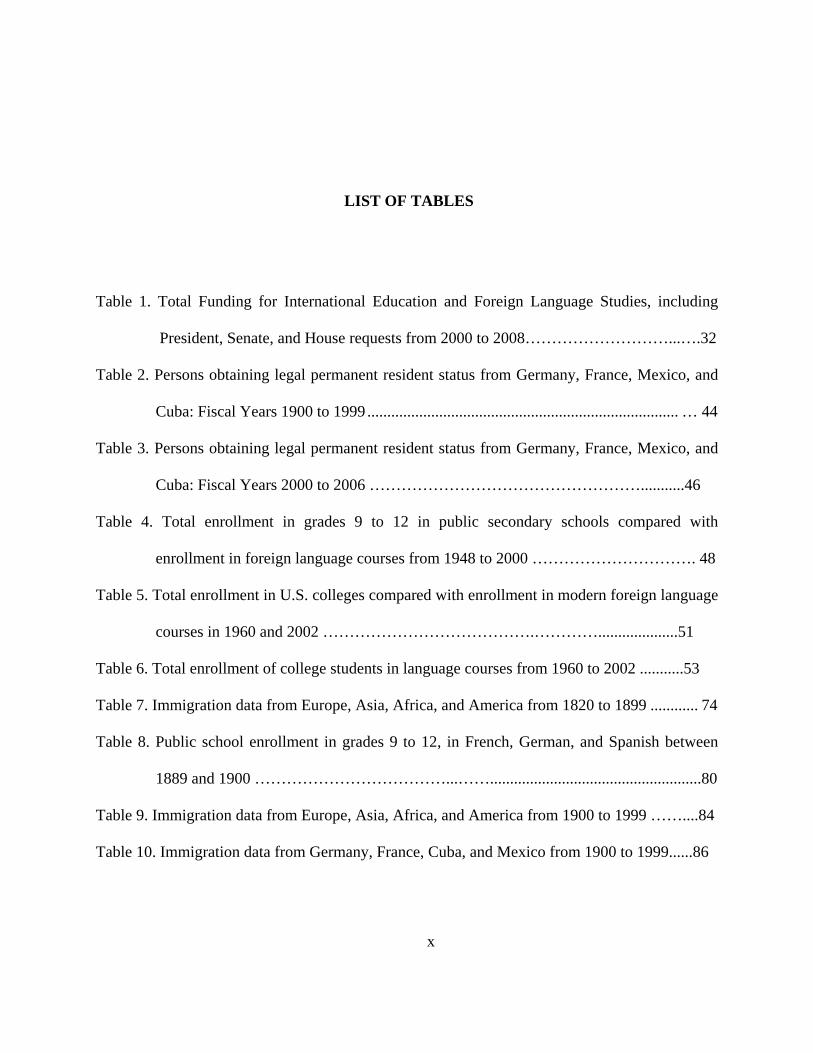
LIST OF TABLES
Table 1. Total Funding for International Education and Foreign Language Studies, including
President, Senate, and House requests from 2000 to 2008………………………...….32
Table 2. Persons obtaining legal permanent resident status from Germany, France, Mexico, and
Cuba: Fiscal Years 1900 to 1999 .............................................................................. … 44
Table 3. Persons obtaining legal permanent resident status from Germany, France, Mexico, and
Cuba: Fiscal Years 2000 to 2006 ……………………………………………...........46
Table 4. Total enrollment in grades 9 to 12 in public secondary schools compared with
enrollment in foreign language courses from 1948 to 2000 …………………………. 48
Table 5. Total enrollment in U.S. colleges compared with enrollment in modern foreign language
courses in 1960 and 2002 ………………………………….…………....................51
Table 6. Total enrollment of college students in language courses from 1960 to 2002 ...........53
Table 7. Immigration data from Europe, Asia, Africa, and America from 1820 to 1899 ............ 74
Table 8. Public school enrollment in grades 9 to 12, in French, German, and Spanish between
1889 and 1900 ………………………………...…….....................................................80
Table 9. Immigration data from Europe, Asia, Africa, and America from 1900 to 1999 ……....84
Table 10. Immigration data from Germany, France, Cuba, and Mexico from 1900 to 1999......86
x
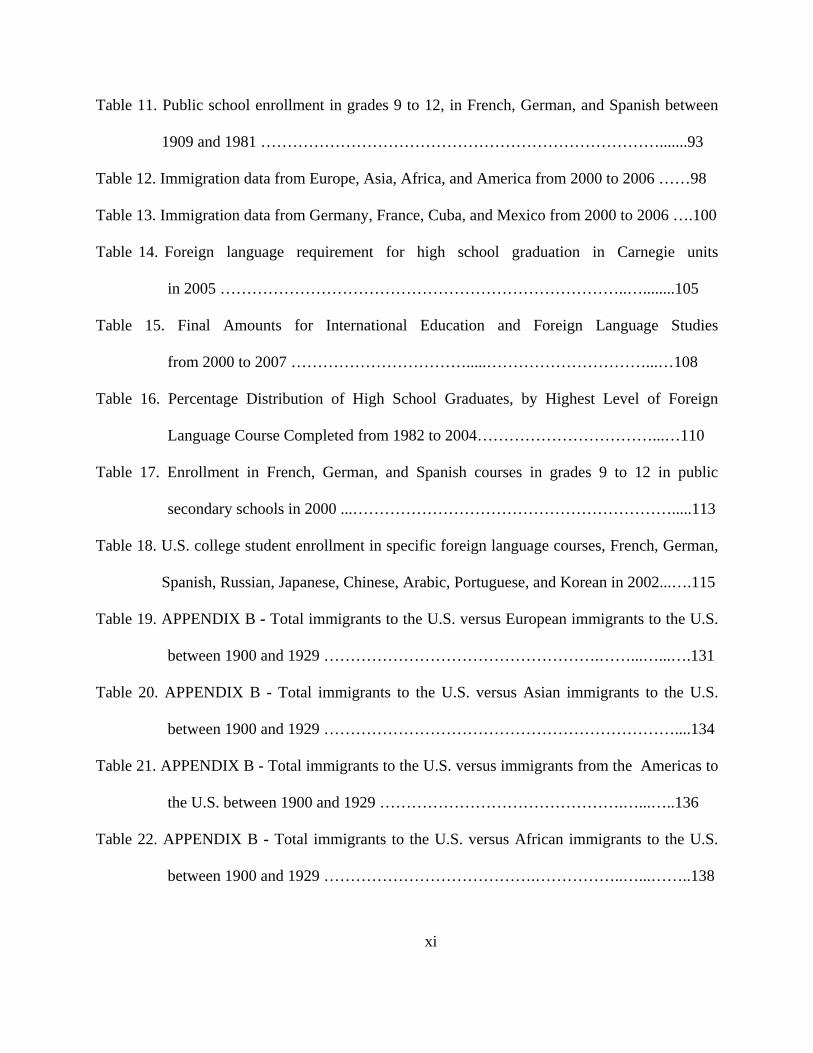
Table 11. Public school enrollment in grades 9 to 12, in French, German, and Spanish between
1909 and 1981 ………………………………………………………………….......93
Table 12. Immigration data from Europe, Asia, Africa, and America from 2000 to 2006 ……98
Table 13. Immigration data from Germany, France, Cuba, and Mexico from 2000 to 2006 ….100
Table 14. Foreign language requirement for high school graduation in Carnegie units
in 2005 …………………………………………………………………..…........105
Table 15. Final Amounts for International Education and Foreign Language Studies
from 2000 to 2007 …………………………….....…………………………...…108
Table 16. Percentage Distribution of High School Graduates, by Highest Level of Foreign
Language Course Completed from 1982 to 2004……………………………...…110
Table 17. Enrollment in French, German, and Spanish courses in grades 9 to 12 in public
secondary schools in 2000 ...…………………………………………………….....113
Table 18. U.S. college student enrollment in specific foreign language courses, French, German,
Spanish, Russian, Japanese, Chinese, Arabic, Portuguese, and Korean in 2002...….115
Table 19. APPENDIX B - Total immigrants to the U.S. versus European immigrants to the U.S.
between 1900 and 1929 …………………………………………….……...…...….131
Table 20. APPENDIX B - Total immigrants to the U.S. versus Asian immigrants to the U.S.
between 1900 and 1929 …………………………………………………………....134
Table 21. APPENDIX B - Total immigrants to the U.S. versus immigrants from the Americas to
the U.S. between 1900 and 1929 ……………………………………….…...…..136
Table 22. APPENDIX B - Total immigrants to the U.S. versus African immigrants to the U.S.
between 1900 and 1929 ………………………………….……………..…...……..138
xi
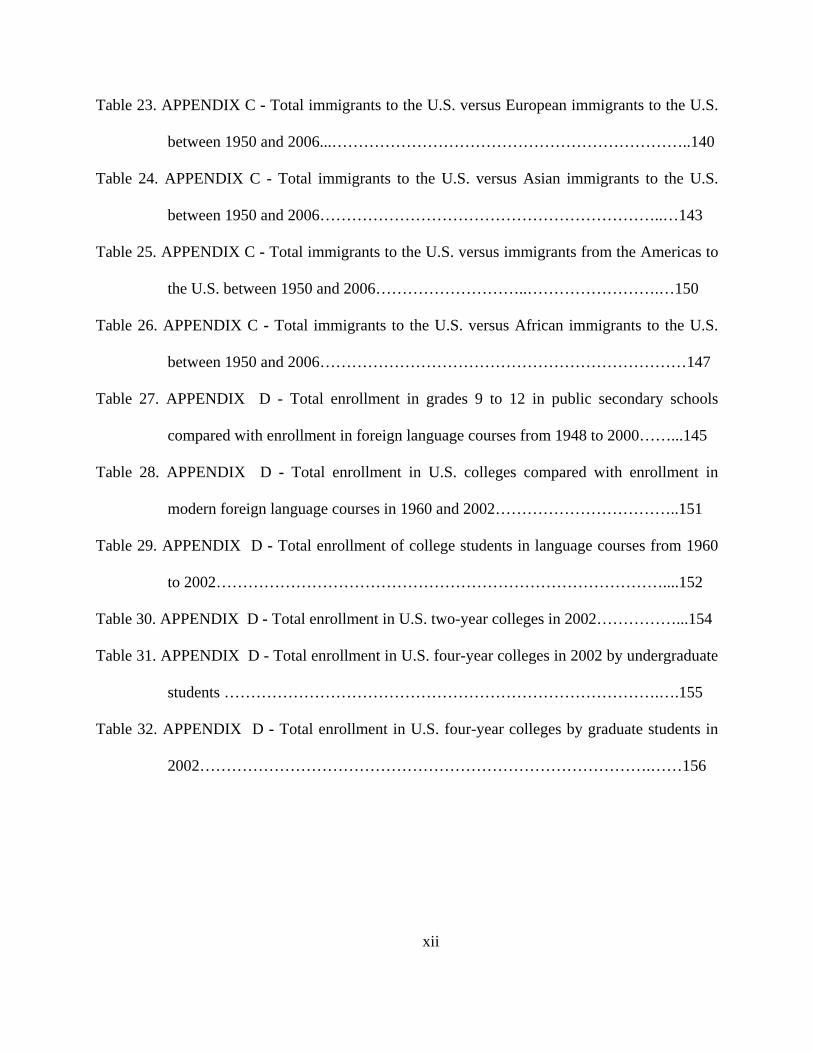
Table 23. APPENDIX C - Total immigrants to the U.S. versus European immigrants to the U.S.
between 1950 and 2006...…………………………………………………………..140
Table 24. APPENDIX C - Total immigrants to the U.S. versus Asian immigrants to the U.S.
between 1950 and 2006………………………………………………………..…143
Table 25. APPENDIX C - Total immigrants to the U.S. versus immigrants from the Americas to
the U.S. between 1950 and 2006………………………..…………………….…150
Table 26. APPENDIX C - Total immigrants to the U.S. versus African immigrants to the U.S.
between 1950 and 2006……………………………………………………………147
Table 27. APPENDIX D - Total enrollment in grades 9 to 12 in public secondary schools
compared with enrollment in foreign language courses from 1948 to 2000……...145
Table 28. APPENDIX D - Total enrollment in U.S. colleges compared with enrollment in
modern foreign language courses in 1960 and 2002……………………………..151
Table 29. APPENDIX D - Total enrollment of college students in language courses from 1960
to 2002…………………………………………………………………………....152
Table 30. APPENDIX D - Total enrollment in U.S. two-year colleges in 2002……………...154
Table 31. APPENDIX D - Total enrollment in U.S. four-year colleges in 2002 by undergraduate
students ……………………………………………………………………….….155
Table 32. APPENDIX D - Total enrollment in U.S. four-year colleges by graduate students in
2002………………………………………………………………………….……156
xii
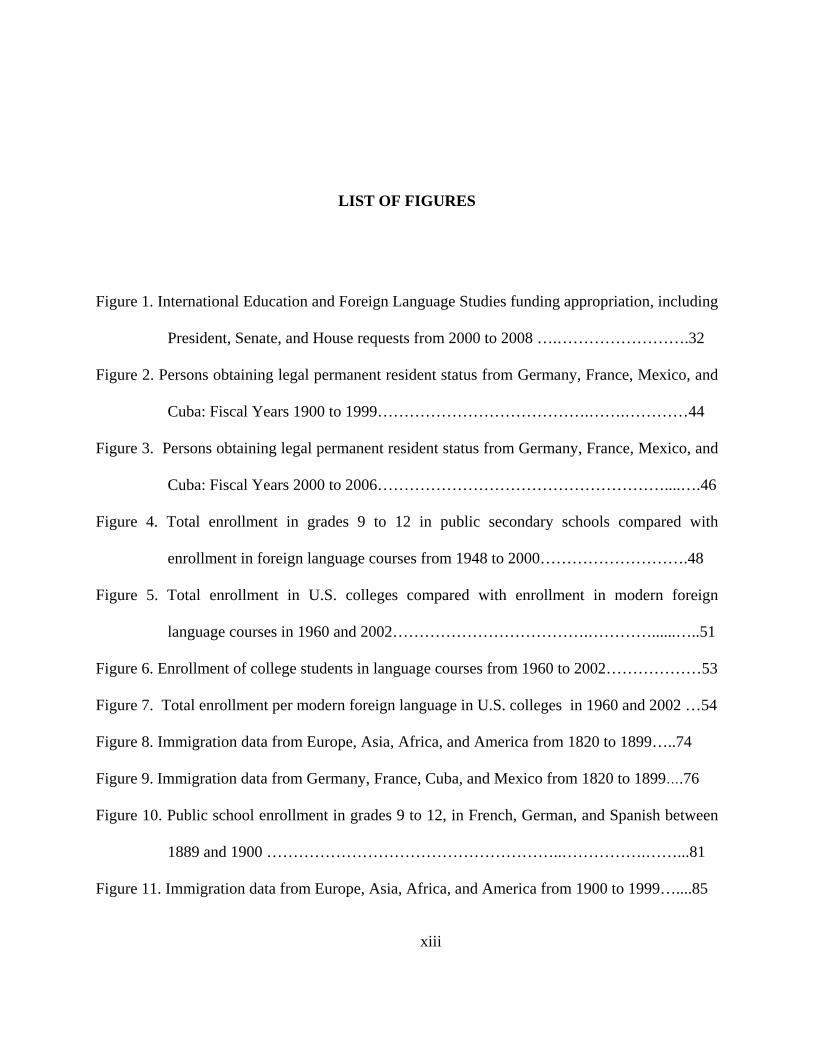
LIST OF FIGURES
Figure 1. International Education and Foreign Language Studies funding appropriation, including
President, Senate, and House requests from 2000 to 2008 ….…………………….32
Figure 2. Persons obtaining legal permanent resident status from Germany, France, Mexico, and
Cuba: Fiscal Years 1900 to 1999………………………………….…….…………44
Figure 3. Persons obtaining legal permanent resident status from Germany, France, Mexico, and
Cuba: Fiscal Years 2000 to 2006………………………………………………....….46
Figure 4. Total enrollment in grades 9 to 12 in public secondary schools compared with
enrollment in foreign language courses from 1948 to 2000……………………….48
Figure 5. Total enrollment in U.S. colleges compared with enrollment in modern foreign
language courses in 1960 and 2002……………………………….…………......…..51
Figure 6. Enrollment of college students in language courses from 1960 to 2002………………53
Figure 7. Total enrollment per modern foreign language in U.S. colleges in 1960 and 2002 …54
Figure 8. Immigration data from Europe, Asia, Africa, and America from 1820 to 1899…..74
Figure 9. Immigration data from Germany, France, Cuba, and Mexico from 1820 to 1899….76
Figure 10. Public school enrollment in grades 9 to 12, in French, German, and Spanish between
1889 and 1900 ………………………………………………..…………….……...81
Figure 11. Immigration data from Europe, Asia, Africa, and America from 1900 to 1999…....85
xiii
Figure 12. Immigration data from Germany, France, Cuba, and Mexico from 1900 to 1999......86
Figure 13. Public school enrollment in grades 9 to 12, in French, German, and Spanish between
1909 and 1981.………………………………………………………………….....94
Figure 14. Immigration data from Europe, Asia, Africa, and America from 2000 to 2006….....99
Figure 15. Immigration data from Germany, France, Cuba, and Mexico from 2000 to 2006..100
Figure 16. Foreign language requirement for high school graduation in Carnegie units
in 2005 …………………………….………………………………..……………106
Figure 17. Final Amounts for International Education and Foreign Language Studies
from 2000 to 2007 …..…………………………………….………….....…......108
Figure 18. Percentage Distribution of High School Graduates, by Highest Level of Foreign
Language Course Completed from 1982 to 2004..…………………….……….111
Figure 19. Enrollment in French, German, and Spanish courses in grades 9 to 12 in public
secondary schools in 2000 …………………………………………..…………..113
Figure 20. U.S. college student enrollment in specific foreign language courses, French, German,
Spanish, Russian, Japanese, Chinese, Arabic, Portuguese, and Korean in 2002…...115
Figure 21. APPENDIX A - University of Pittsburgh’s Institutional Review Board Completion of
Module and Approval Form …………………………………………………..…..129
Figure 22. APPENDIX A - Memorandum from the University Pittsburgh’s Institutional
Review Board informing that the approval was based on no involvement of
human subjects …………………………………………………………………....130
Figure 23. APPENDIX B - Total immigrants to the U.S. versus European immigrants to the U.S.
between 1900 and 1929 ……..............…………………………………………......132
xiv
Figure 24. APPENDIX B - Total European immigrants to the U.S. between 1900 and
1929…………………………………………………………………………..…..133
Figure 25. APPENDIX B - Total immigrants to the U.S. versus Asian immigrants to the U.S.
between 1900 and 1929 ..............................................................................134
Figure 26. APPENDIX B - Total Asian immigrants to the U.S. between 1900 and 1929..........135
Figure 27. APPENDIX B - Total immigrants to the U.S. versus immigrants from the Americas to
the U.S. between 1900 and 1929 ..............................................................................137
Figure 28. APPENDIX B - Total immigrants from the Americas to the U.S. between 1900 and
1929…………………………………………………….………………….……..137
Figure 29. APPENDIX B - Total immigrants to the U.S. versus African immigrants to the U.S.
between 1900 and 1929 ……….……………………………………………….…..138
Figure 30. APPENDIX B - Total African immigrants from (other Africa) to the U.S. between
1900 and 1929 …………………………………………………………….....…...139
Figure 31. APPENDIX C - Total immigrants to the U.S. versus European immigrants to the U.S.
between 1950 and 2006 ………………………………………….…………...……141
Figure 32. APPENDIX C - Total European immigrants to the U.S. between 1950 and
2006 ……….........................................................................................................…142
Figure 33. APPENDIX C - Total European immigrants to the U.S. between 1950 and 2006....142
Figure 34. APPENDIX C - Total immigrants to the U.S. versus Asian immigrants to the U.S.
between 1950 and 2006 …………………………………………………………....143
Figure 35. APPENDIX C - Total Asian immigrants to the U.S. between 1950 and
2006……………………………………………………………………………....144
xv
Figure 36. APPENDIX C - Total immigrants to the U.S. versus immigrants from the Americas to
the U.S. between 1950 and 2006 ………………………..……………………...146
Figure 37. APPENDIX C - Total immigrants from the Americas to the U.S. between 1950 and
2006 …………………………………………………………………….………...146
Figure 38. APPENDIX C - Total immigrants from the Americas to the U.S. between 1950 and
2006 …………………………………………………………….………………..147
Figure 39. APPENDIX C - Total immigrants to the U.S. versus African immigrants to the U.S.
between 1950 and 2006 ……………………………………………………………148
Figure 40. APPENDIX C - Total African immigrants to the U.S. between 1950 and
2006 ….………………………………………………………………………..….148
Figure 41. APPENDIX D- Total immigrants to the U.S. versus immigrants from Oceania to the
U.S. between 1950 and 2006 ……...................................................................….150
Figure 42. APPENDIX D - Total enrollment in U.S. colleges compared with enrollment in
modern foreign language courses in 1960 and 2002…………………………….151
Figure 43. APPENDIX D - Enrollment of college students in language courses from 1960 to
2002…………………………………………………………………………..…152
Figure 44. APPENDIX D - Total enrollment per modern foreign language in U.S. colleges in
1960 and 2002………………………………………………….……………..…153
Figure 45. APPENDIX D - Total enrollment per year of foreign language in U.S. colleges in
1960 and 2002………………………………………………………………………153
Figure 46. APPENDIX D - Total enrollment per foreign language in U.S. two-year colleges in
2002…………………………………………….…………………………………154
xvi
Figure 47. APPENDIX D - Total enrollment per foreign language in U.S. four-year colleges in
2002 by undergraduate students …………………………………………………..155
Figure 48. APPENDIX D - Total enrollment per foreign language in U.S. four-year colleges by
graduate students in 2002………………………………………………………....156
xvii
ACKNOWLEDGMENTS
I thank my dissertation advisor, Dr. William Bickel, for patiently working with me
throughout this process. The same appreciation I extend to all of the committee members, Dr.
Donald Goldstein, Dr. Gordon Jackson, Dr. John Weidman, and Dr. Bonnie Youngs, who were
willing to serve on this committee and for also taking the time to meet at the end of the 2007 fall
semester. I offer a special thanks to Dr. Jackson for being an active reader of my work
whenever I asked, and for also sending me tips on related material on the web. My appreciation
also goes to Dr. Youngs for contacting one of her colleagues, who provided me with
governmental data. I also extend my gratitude to one of my mathematics professors from the
University of Evansville, Indiana, Dr. Clark Kimberling, for reading the literature review.
I am also grateful to my husband, Ron, for patiently reading my work, constantly
checking the flow, and I thank God for my dog, Beethoven, who patiently sat by my feet, while I
wrote for extended periods.
Special thanks also I give to professionals who kindly guided me in acquiring data. They
are: Ashley Lenker, Joint National Committee for Languages and the National Council for
Languages and International Studies, JNCL-NCLIS; Steve Fienberg, Carnegie Mellon
University, CMU; Eugene Owen and two of his colleagues, Stephen Provasnik and Tom Snyder,
xviii

National Center for Education Statistics, NCES. Finally I thank Brea Ludwigson for reviewing
my paper.
NOMENCLATURE
APA – American Protective Association
CAL – Center for Applied Linguistics
CLRC – Civilian Linguistic Reserve Corps
DLI – Defense Language Institute
ESEA – Elementary and Secondary Education Act
FIE – Fund for the Improvement of Education
FLAP – Foreign Language Assistance Program
FLIP – Foreign Language Incentive Program
HEA - Higher Education Act
IHE - Institutions of higher education
I.Q. – Intelligence Quotient
JNCL-NCLIS - Joint National Committee for Languages and the National Council for
Languages and International Studies
LEA – Local Education Agency
LEP – Limited English Proficiency
xix
xx
MiWLA – Michigan World Language Association
NCES – National Center for Education Statistics
NSEP – National Security Education Program
NCLB – No Child Left Behind
NDEA – National Defense Education Act
NSLI – National Security Language Initiative
OELA – Office of English Language Acquisition
SEA – State Education Agency
UN – United Nations
UNESCO – United Nations Educational, Scientific, and Cultural Organization
.
1
1.0 INTRODUCTION
1.0.1 Foreign Language Status in the United States
In a Report to the President of the United States in 1979, the President’s Commission on
Foreign Language and International Studies declared that the lack of foreign language
competence diminishes the capabilities of the United States in diplomacy, in foreign trade, and in
individual comprehension of the world in which we live and compete (Lange, 1987, Autumn).
This lack of foreign language competence needs to be overcome if the United States is going to
have a voice in the rapidly changing world order. According to Brecht & Walton (1994, March,
p. 190), the united States will need to develop a national capacity for dealing with languages and
cultures beyond those of Western Europe1 as it is public knowledge that Spanish, French, and
German are the most commonly taught foreign languages in the United States. For more details
regarding foreign language course enrollment see Appendix D.
1 Countries of Western Europe are: Andorra, Austria, Belgium, Denmark, Finland France, Germany,
Gibraltar, Greece, Iceland, Italy, Ireland, Liechtenstein, Luxembourg, Malta, Monaco, Norway, Netherlands,
Portugal, San Marino, Spain, Sweden, Switzerland, and the United Kingdom.
1.0.2 The Author’s Intent with the Study
As a foreign language observer, the author became increasingly interested in language
education in American society. The United States has been home to several non-English
languages; nonetheless, there seems to be a lack of choices when it comes to a career that
involving foreign language. The choices, based on foreign language course enrollment,
consistently seem to be Spanish, French, and German, regardless of the focus of the nation’s
global participation.
As a basis for this study, the author decided to explore the American attitude, between the
1700’s and 2006, that has fostered the current state of foreign language education in the United
States. To accomplish this task, the author surveyed government initiatives, both primary and
secondary sources. The former include government data reports on immigration figures,
language enrollment, and budget appropriations. The latter include books and journals that have
been written by language educators and policy-makers who specialize in reporting and
discussing proposed language education policies.
The author presents an argument based on contextual factors which are likely to have
affected foreign language education in the United States. The factors explored in this work are:
• immigration,
• foreign language instruction,
• federal funding for foreign language instruction,
2
• foreign language course enrollment
The above factors were studied to look for a possible relationship between the various
immigrant groups and foreign language education in the United States.
3
1.1 ORGANIZATION OF THE STUDY
In this section the author discusses the organization of this study. This work is composed
of six chapters:
• Chapter 1 – organization
• Chapter 2 – literature review
• Chapter 3 – research method
• Chapter 4 – findings
• Chapter 5 – discussion
• Chapter 6 – epilogue
In addition to the six chapters, there are four appendices:
• Appendix A – Review Board approval
• Appendix B and C - immigration records
• Appendix D – enrollment in foreign languages
The last section of this work is the study’s bibliography.
An overview of each section follows.
4
1.1.1 Overview of Each Section
In chapter one, the author discusses the objective of this study, which is to explore the
American attitude toward foreign language education from the 1750’s to today (section 1.0). In
section 1.1, the author provides an overview of the organization of the study. Section 1.2
describes the conceptual framework, and presents the research question. Section 1.3 describes
the study limitations caused by a lack of primary government records.
In chapter two, the author explores literature related to three areas, foreign language
instruction (section 2.1.1), federal funding for foreign language instruction (section 2.1.2), and
foreign language course enrollment (section 2.1.3).
In chapter three, the author discusses the research method in section 3.0. Section 3.1
categorizes the research into instruction, funding, and course enrollment; section 3.2 describes an
historical methodology, which is the research approach followed; section 3.3 discusses the
historical research procedure; section 3.4 explains the instrument used in this study, which is
government reports and literature pieces, and lastly, section 3.5 addresses the analysis of data.
In chapter four, the author presents the findings that emerged from a review of literature. The
introduction, section 4.0, is followed by four sections organized around the American attitude
toward foreign language education in the 1700’s, 1800’s, 1900’s and 2000’s.
In chapter five, the author discusses the four study topics separately in an historical context.
The rationale for organizing the discussion in this fashion was to attain a flow for each of the
topics. For example, immigration can be projected from the 1700’s to 2006 in one section,
unlike the way it was presented in chapter four, where each of the topics was studied in a single
time frame. The last part of chapter five, the author presents an overall discussion.
5
In chapter six, the author presents an epilogue on the concept framework that foreign
language education in the United States is impacted by the attitudes of American citizens, who
act based on the dynamics of the population of which they are part.
The appendices are arranged in the following order:
Appendix A - forms approved by the university’s Review Board.
Appendix B - immigration records between 1900 and 1929.
Appendix C - immigration records between 1950 and 2006.
Appendix D - enrollment figures in foreign language courses.
Finally, in the last section, the author lists the bibliographic references that have been used in
this study.
6
1.2 CONCEPTUAL FRAMEWORK
A person or group’s attitude can be defined by its beliefs, feelings, values, and the
disposition to act in certain ways. As a foundation for this research, the author believes that the
attitudes of American citizens have impacted the development of foreign language education in
the United States. An example can be found in the event that led to the National Defense
Education Act, NDEA, passed in 1958.2 The American attitude was shaped by a success that the
Soviet Union achieved in outer space. The United States felt threatened by the Soviet Union’s
launch of Sputnik and the potential that this event would have on the spread of communism
around the globe (Brecht & Rivers, 2000, p. 3). As a result, foreign language education was
considered a priority, for in addition to the realization that the U.S. was falling behind the
Russians in mathematics and science, the country was also declared to be lacking in foreign
language competence (http://www.nsf.gov/pubs/stis1994/nsf8816/nsf8816.txt). Consequently,
the American attitude toward foreign language education was shaped by an international event.
Members of the U.S. government then passed an act with the intent to strengthen the nation’s
educational institutions, and thus, the nation’s population.
Today the argument that foreign language education in the United States is necessary for
international relations prevails in the views of some; Brecht and Rivers (2000) stated, “The
language needs of the U.S. federal government, and particularly those of the armed forces, are of
unprecedented scope and complexity” (p. xi). In contrast to 1958 when the need for foreign
2 For more information about the National Defense Education Act, see: U.S. Department of Education
http://www.ed.gov/about/overview/fed/role.html
7
language education was related to technological advances, today the need has broadened to
include the economy. Brecht and Rivers (2000) wrote that the current need in the realm of the
economy encompasses software, communications, and financial services. According to them,
American companies are unable to penetrate foreign markets because of a shortage of language
expertise.
This study will investigate the interrelationship between immigration patterns and the
attitude of the American people between the 1700’s and 2006 and draw conclusions on how
these variables have impacted federal funding and the development of foreign language
education in the United States.
1.2.1 Research Question
The following question and time frame were chosen as the basis for this study:
Research Question: What has the American attitude toward foreign language education
been from the 1700’s to 2006?
As previously mentioned, the author chose to explore four factors in this study; three of
these are presented in chapter 2; they are:
• foreign language instruction,
• federal funding for foreign language instruction,
• foreign language course enrollment
8
The literature studied to answer the research question mentioned above will be discussed in the
next chapter.
1.3 STUDY LIMITATIONS
This study was partially hampered by the lack of primary government source information
particularly during the 1700’s and 1800’s. For example, immigration records were only
available after 1820. Language education information was not available during the 1700’s.
Funding data was not available until the start of the 2000’s. In the last decade of the 1900’s,
governmental records only listed French and German course enrollment, excluding Spanish.
The author believes that it is necessary to include information from the 1700’s in this
study because this is when the nation was born and attitudes were first being shaped. To make
up for the lack of government records, secondary literature sources were used to fill the
information gap.
9
2.0 LITERATURE REVIEW - INTRODUCTION
In this chapter the author explores foreign language instruction, federal funding for
foreign language instruction, and foreign language course enrollment. The sections are presented
as follows:
2.1.1 Foreign language instruction
2.1.2 Federal funding for foreign language instruction
2.1.3 Foreign language course enrollment
These three factors will serve as a basis to answer the research question:
What has the American attitude toward foreign language education been from the 1700’s
to 2006?
The author believes that through the exploration of literature, she will attain a better
understanding of the factors that have shaped foreign language education in the United States.
The sources of information for answering the proposed research question will be:
• books and academic journals
• government records
10

The books and academic journals cited in this study have been written by professionals who
specialize in foreign language education. Government records will include immigration and
foreign language course enrollment data in addition to funding appropriations.
11
2.1 EXPLORATION OF THE THREE AREAS BEING STUDIED IN THIS
CHAPTER
In this chapter, foreign language instruction, federal funding for foreign language instruction,
and foreign language course enrollment are explored.
2.1.1 Foreign Language Instruction
Prior to exploring the area of foreign language instruction, the author believes that it is necessary
to define the term foreign language.
2.1.1.1 Definition of the term foreign language
Carol Klee stated in Rosenthal (2000, p. 49) that foreign languages were originally defined in
relationship to the classical languages, for modern languages were not perceived as being worthy
of study. The National Center for Education Statistics, NCES, defines foreign languages as:
A group of instructional programs that describes the structure and use of language that is
common [in foreign nations] or indigenous to individuals of the same community or
nation, the same geographical area, or the same cultural traditions. Programs cover such
12
features as sound, literature, syntax, phonology, semantics, sentences, prose, and verse, as
well as the development of skills and attitudes used in communicating and evaluating
thoughts and feelings through oral and written language.3
Based on the definition offered by the NCES, Latin would no longer be viewed as a foreign
language, for it lacks the oral component since it is no longer a spoken language. According to
Cindy Kendall, website manager for the Michigan World Language Association, MiWLA,4
many organizations throughout the United States have renamed the term “foreign languages” to
“world languages.” There has been a movement over the past 8 to 10 years to move from the
term “foreign” due to its negative connotation regarding “aliens.” The shift from “foreign
language” to “world language” is apparent in local, state, and national organizations and policies,
and in other areas, such as business. Sandrock (2002) explains that the move to “world
languages” emphasizes that “languages connect us rather than keep us separated, that languages
help us understand the world and participate in multilingual communities. Many people in the
United States use in the home or community the languages taught in our schools, so there is
nothing foreign about it” (p. x).
One may argue that this last comment refers specifically to the U.S., for the comment is
based on the concept that foreign languages are no longer foreign as a result of these languages
being spoken in American homes. Looking from a language learner’s perspective though,
3 For more information on the definition of “foreign languages” by the National Center for Education
Statistics see (nces.ed.gov/programs/coe/glossary/f.asp)
4 For more information about the Michigan World Language Association see http://www.miwla.org/
13
foreign language is still foreign language when one engages in communication in a language that
is not known by the learner, such as English-speaking students who learn a non-English language
and non-English-speaking students who learn the English language.
Although the change from “foreign” to “world” has been embraced by members of the
foreign language education community, in this work the author takes the liberty of using “world
language” and “foreign language” interchangeably.
2.1.1.2 Advantages and disadvantages of being a native speaker of English
Sandrock (2002, p. x) stated that there are many people in the U.S. who use the languages
taught in the nation’s schools in their homes; nonetheless, Americans are said to be part of a
monolingual society (Lambert, 1987, p.10). Dlabay & Scott (2001) wrote about being a native
speaker of English:
Being a native speaker of English is both an advantage and a disadvantage. It is an
advantage because you already know the major language of international business. It is a
disadvantage because you may decide wrongly that there is little need to learn another
language. (p. 69)
14
Because of the status of the English language in a global society, Americans face the risk of not
bothering to educate themselves in other languages.
2.1.1.3 Foreign Language Education
During the 1750’s, American schools were providing education in various foreign
languages; private schools in Philadelphia offered instruction in German, French, Spanish,
Italian, Portuguese, Latin, Greek, Hebrew, and Arabic (Crawford, 1992a, p. 36).
Thomas Jefferson, in 1787, argued that American students up to sixteen years of age
should learn Latin, Greek, French, Spanish (Simon, 1980, p. 77). He encouraged his son-in-law,
T. M. Randolph Jr.5 to learn French and Spanish because “our [the United States] connection
with Spanish is [was] already important, and will [would] become daily more so. Besides this,
the ancient part of American history is written chiefly in Spanish” (Schmid, 2001, p. 16).
However, during that time, foreign language knowledge was not restricted to the elite of the
United States. Based on newspaper advertisements, bilingualism and even trilingualism6 were
not uncommon even within the lower social strata. Crawford (1992a) wrote, “Run away . . .
5 Thomas Mann Randolph, Jr. (1768-1828), son-in-law of Thomas Jefferson, Governor of Virginia and
U.S. Congressman. See The Papers of Thomas Jefferson Volume 29: 1 March 1796 to 31 December 1797
(Princeton University Press, 2002), 81-3
6 Bilingualism is the ability to use two languages; trilingualism is the ability to use three languages, in both
cases, especially with equal or nearly equal fluency. See http://www.thefreedictionary.com/
15
from John Orr, near Skuylkill, Philadelphia, a Servant Man named James Mitchell. . . . He was
being a Traveller, and can talk Dutch [German], Spanish and Irish, [Pennsylvania Gazette,
November 5-12, 1749]” (p. 36). Despite this, even in the 1950’s, multilingual7 skills were not
recognized as a trait of a well-educated person as noted by Conant (1959), “At no time in the
educational history of this country has mastery of a modern foreign language come to be
recognized as the hallmark of a well-educated man or woman” (p. 4).
Since the end of World War I, demographers and sociolinguists have charted a steady
pattern of linguistic assimilation of immigrants to English (Schmidt, Sr., 2000, p. 121). An
example of such a trend was reported in 1919 when Ohio governor, James Cox, proposed a law
to abolish all instruction in German in the state (Schmid, 2001, p. 136).
This process of assimilation to the English language started an anti-assimilation
movement, of which a guiding principle was that the study of foreign languages should be
encouraged and the rights of individuals and groups to use other languages must be respected
(Crawford, 1992b, p. 129). Catherine Snow and Kenji Hakuta say that schools are depriving
children of bilingual skills that the country could use; in addition, Crawford (1992b, p. 316)
noted that Americans complain about the dismal state of foreign language teaching and that
American schools are notoriously poor in the field of foreign language instruction. Similarly,
Spalding (1980) reported from the 1979 President’s Commission regarding foreign language
knowledge in the nation, “Americans incompetence in foreign languages is nothing short of
scandalous, and it is becoming worse” (p. 178). The lack of foreign language competence is an
element that negatively impacts American businesses.
7 Multilingualism is the ability to use several languages. See http://www.thefreedictionary.com/-
multilingualism
16
2.1.1.4 Lack of foreign language competence impacts American businesses
American multinational businesses are severely hampered by the low number of
Americans who are competent in languages other than English. To remediate the lack of foreign
language competence, Intel Corporation is training its workforce in other languages and cultures.
Present languages that are part of a cultural-training curriculum for Intel employees are
Mandarin, Japanese, and Spanish (Workforce Management, 2004, Oct.). Business leaders in the
United States have been at the forefront in promoting linguistic and cultural efficiency. “English
may be the international language of business, but the ability to speak more than one language is
critical to succeed in business in Europe, Asia/Pacific and Latin America” (Marshal & Heffes,
2005, Apr.). “There is a significant competitive advantage for executives to be multilingual and
in 10 years, it will be more important than ever for executives to be at least bilingual”
(Expansion Management, 2005, Apr.).
Building knowledge in language and culture will optimize the economic foundation of
the United States, for “International trade, especially exports, which constituted a small fraction
of the U.S. economy in the early 1960s, now represents a major driving force.” From 1985 to
1994, exports rose from 7.2 percent to 10.2 percent of the nation’s gross domestic product.
Trade specialists argue that foreign growth stimulates the United States economy (Brecht &
Walton, 2003). This trend in trading has been emphasized by American business firms, and
“more than 60,000 jobs where language was required were reported by these companies”
(Arnett, 1976, May).
17
2.1.1.5 The global language became the English language
Burn & Perkins (1980, May) explain how English became the global language:
After World War II we [the United States] were the ostensible scientific leader of the
world. The countries that had competed with us, France and Britain, were exhausted; a
good part of their youth had been killed. The Russians, Germans, and Japanese had lost
tens of millions of people and many of their factories and laboratories were destroyed.
The United States dominated science, which incidentally led to English becoming the
monopoly world language because everybody wanted to plug into our science. (p. 19)
As a result of this historical consequence, the United States may have become the source of a
monopolistic world language and “devoutly monolingual” (Lambert, 1987, p. 10); English has
been recognized as the “lingua franca” of the business world. Schmidt, Sr. (2000) defined the
term language status as deriving “from the fact that linguistic change includes the birth and death
of languages as well as their spread, growth, and decline” (p. 39). As a consequence of the
spread of the English language after WWII, there is a belief in the nation that Americans do not
need to learn a foreign language, for the rest of the world speaks English (Baron, 1990, p. 1).
18
2.1.1.6 Not all business meetings are conducted in the English language
Peterson (2002), states that the English language is no longer necessarily the official
language of business; at Airbus executive meetings, “if a majority speaks Spanish, French, or
German, the meeting is held in that language.”
Although half of all business deals in Europe are conducted in English (McCrum,
MacNeil, & Cran, 2002, p. 10), Dlabay & Scott (2001) believe that “learning any language will
help to understand the culture of those who speak it” (p. 70), a skill much needed in business.
Simon (1980) reported on the comments made by Dr. Carl Zimmer regarding American language
problems when conducting business:
There are language problems; many American managers, who have been stationed abroad
with a subsidiary of a U.S. corporation, fail to speak the host country’s language even
after living in the country for many years. When a major American bank acquired
majority interest in a European bank, the manager sent there by the U.S. bank demanded
that his colleagues and employees conducted all business in English . . . U.S. corporations
that are profitable and are well respected by the public have hired host-country managers
to run their operations, or they employ Americans who make an effort to become familiar
with their new environment. (p. 36)
19
Lee Nehrt, chairman of The Business and International Education organization,8 in 1977 “called
upon the American Council on Education to help reverse the present trends, to ‘encourage
universities to examine existing foreign language requirements, to improve language sequences
for non-majors’ and to encourage or even to require all students to study a foreign language”
(Simon, 1980, p. 38).
The inadequacy of foreign language education in the United States hinders not only the
American economy; but also American national security.
2.1.1.7 Lack of foreign language competence impacts national security
The recognition that the lack of foreign language instruction was putting American
security at risk had already been reported in the 1940’s: “It has been pointed out, and with
justification, that languages are the weakest point in our national armor” (Kroff, 1943, p. 236).
At that time, “Under-Secretary of State, Summer Welles, Vice President Wallace, Ambassador
Grew all have insisted publicly on the value and importance of learning French, Spanish,
German” (Kroff, 1943, p. 236), with French and German being critical for the post-war
reconstruction period (Kroff, 1943, p. 237). At the time the “purpose and objectives of foreign-
8 Some companies that represented the Business and International Education in 1977 were General Electric,
IBM, First National City Bank, Arthur Anderson and Company, B. B. Goodrich, Sunkist Growers, Carnation, and
ALCOA.
20
language teaching have [had] undergone vast changes . . . We no longer are [were] teachers of
French but of France, not only of German, but Germany” (Kroff, 1943, p. 237).
As stated above, the teaching of German and French was necessary for post-war
reconstruction. Learning French, Spanish, and classical languages had been stressed in the
1700’s (Simon, 1980, p. 77). Today a national security challenge requires the creation of
language capacity in Middle Eastern languages as described by Friel (2001):
After Sep. 11, the FBI put out a plea for translators fluent in Arabic, Pashto and Farsi.
But skilled translators in those languages are in short supply. Of an American Translator
Association’s 8,200 members, only one is qualified to translate Pashto.
It is apparent that the U.S. Department of Defense is suffering as a result of the lack of foreign
language instruction. Each year millions of dollars are spent in training foreign-service and
military personnel (Crawford, 1992b, p. 386). The position taken by Americans that the rest of
the world speaks English, and consequently that Americans have no need to learn foreign
languages (Lambert, 1987, p.10) has had a harmful effect on the development of culture and
language capacity in the United States. As a result, the U.S. as a nation faces a national security
challenge, as has been pointed out by Rep. Anna Eshoo (D-CA):
As a nation, I think we’ve not sufficiently valued and embraced foreign languages. So
we have to do everything we can to improve our capabilities because the security of our
nation and the safety, certainly of our dedicated men and women serving abroad, really
depends on it. (Tare, 2006)
21
In a report submitted to the House of Representatives and to the Senate by the Joint Inquiry on
the terrorist attacks of September 11, 20019 – the House Permanent Select Committee on
Intelligence and the Senate Select Committee on Intelligence expose the linguistic inadequacy
that engulfs the United States:
Finding: Prior to September 11, the Intelligence Community was not prepared to handle
the challenge it faced in translating the volumes of foreign language counterterrorism
intelligence it collected. Agencies within the Intelligence Community experienced
backlogs in material awaiting translation, a shortage of language specialists and
language-qualified field officers, and a readiness level of only 30% in the most critical
terrorism-related languages used by terrorists. (Systematic Finding 6, page xvi)
The Association of American Universities (January, 2006) recognizes that not only the nation,
but also its allies face enemies in the form of hostile governments and stateless groups:
In the area of national security, America and its allies face enemies – both hostile
governments and a stateless enemy organized across geopolitical borders – that not only
threaten us with traditional warfare but also seek the ability to undertake biological,
chemical, and nuclear attacks.
9 S. Rep. No. 107-351. 107th Congress, 2D Session. H. Rep. No. 107-792. (Dec. 2002).
22
This threat is rooted in ideological and cultural differences. Yet our nation lacks
the level of language and cultural knowledge needed to confront successfully those who
threaten us. (p. 7)
Condoleezza Rice, U.S. Secretary of State, also recognizes that inadequate language capacity
poses a threat in the 21st century, at a time when the global environment requires much more
from any given society; her comments have been recorded by the Association of American
Universities (January, 2006):
As the global center of gravity shifts from West to East ... American students must be at
the forefront of our engagement with countries like China and India, Iraq, and
Afghanistan. To prepare young Americans to understand the peoples who will help
define the 21st century, nothing is more important than our ability to converse in their
native tongues. (p. 16)
The view that foreign language education is related to the security of the United States is
described in Title VI/Fulbright-Hays (Title VI/F-H)10 cited by Brecht & Rivers (2001):
The security, stability, and economic vitality of the United States in a complex global era
depend on American experts in and citizens knowledgeable about world regions, foreign
10 Higher Education Act, as amended, Title VI – International Education Programs. Part A, Sec. 601:
Findings and Purposes, 20 USC § 1121.
23
languages, and international affairs, as well as on a strong research base in those areas.
(p.1)
The need for education in the languages and cultures of others has been recognized also by
political leaders. For example, President George W. Bush said, “Learning somebody else’s
language is a kind gesture, because it suggests ‘I care about you’” (Macery, 2006, Jan 26).
Another political leader, Representative Rush Holt (D-NJ),11 proposed a Bill to encourage
foreign language instruction:
[The Bill] amends the Higher Education Act of 1965 (HEA) to establish programs to
encourage early foreign language instruction, including grants to: (1) partnerships of
institutions of higher education (IHEs) and local educational agencies (LEAs) for
activities relating to foreign language instruction at elementary or secondary schools,
with priorities for high-need LEAs and less-commonly taught foreign languages; (2)
IHEs that develop innovative programs for the teaching of foreign languages, with
priorities for combining foreign languages with science and technology and for less-
commonly taught foreign languages.
11 H. R. 3676 – National Security Language Act (Dec. 8, 2003). Referred to the House Subcommittee on
Select Education.
24
In order to overcome this national security challenge, the federal government has to train the
nation’s linguists. “The Defense Language Institute12 in Monterey, California, teaches 13% of
all college-level language instruction in the United States” (Edwards, 2000).
The capacity building that is provided by the DLI is, undoubtedly, a model for any
language program. DLI prepares military linguists13 for a diverse set of jobs, including intensive
listening, reading, and speaking in functional situations (as native speakers use their languages).
Each instructional program is based on meaningful discourse in real-world contexts. These
linguists participate in basic language programs that last 26 to 64 weeks, depending on the
difficulty of the language. Classroom instruction takes at least six hours per day, five days per
week, with an additional 2-3 hours of homework each night (DLI Brochure, 2003). The
extensive amount of time expended to learn a foreign language has been explained by Maceri
(2006, Jan. 25) who testifies to the fact that learning a foreign language is a complex process,
especially languages with a non-Roman alphabet:
It takes a long time for an English speaker to become fluent in an “easy” Western
European language. When the language is virtually unrelated to English, as it is the case
with Arabic, Chinese, Korean, etc., it takes much longer.
12 The Defense Language Institute was established in 1941 as a secret school on the Presidio of San
Francisco to teach Japanese language to American soldiers of Japanese descent (Nisei). For more information see
http://www.dli.army.mil
13 The term “Military linguists” does not include graduates of college and university programs in the field
of Linguistics. The term is used in the armed forces to refer to language specialists.
25
Although the level of commitment of DLI is not easily transferred to the traditional language
education in American institutions, government leaders have stressed the need for foreign
language instruction. This point of view can be verified in the recommendation described in the
No Child Left Behind Act:14
• Increase the number of Americans mastering critical need languages and start at a younger age
• Increase the number of advanced-level speakers of foreign languages, with an emphasis
on critical need languages
• Increase the number of teachers of critical need languages and resources for them
2.1.1.8 Modern day endorsement of foreign language education
The complexity in learning foreign languages should not halt the education of American
students. This view has been stated by peace seekers. In a panel report on language to the
United States National Commission for UNESCO,15 there was a loud cry for the importance of
language and the need for “fostering interest in the study of foreign languages and cultures as a
contribution to international understanding and peace” (Doyle et al. August, 1948). In addition,
14 Information obtained from the U.S. Department of Education website; document titled: Teaching
Language for National Security and American Competitiveness, January 2006.
15UNESCO, United Nations Educational, Scientific and Cultural Organization, is a specialized agency of
the United Nations. It was founded in 1946 and has headquarters in Paris. The World Book Encyclopedia. (1993).
Vol. 20, p. 24.
26
the Panel recommended that a meeting of language experts, previously scheduled but not held,
be rescheduled:
This Panel urgently recommends that the United States National Commission, and
UNESCO, give greater recognition to the fact that inability to communicate readily
through the medium of language is a major barrier to international understanding and
peace.
This Panel greatly regrets to note that the general international conference of
language experts, proposed by the United States National Commission at its meeting
September 11-13, 1947, has not been held; and strongly recommends that such a meeting
be held in 1949. (p. 318)
In addition to the Panel’s endorsement of the proposition by the United States National
Commission, members of the panel also provided the Commission with an action program;
according to Doyle et al. (August, 1948), the Panel requested:
That the United States National Commission recommend to school-systems and
administrators increased and improved teaching of foreign languages in the grade schools
of the United States; and that provision be made for pupils who have successfully begun
the study of foreign language in grade school to continue it in secondary school without
interruption. (p. 319)
27
Today there is a push for education in languages that are viewed as critical. These languages,
according to The Washington Post, are Arabic, Chinese, Russian, Hindi, and Farsi; there are only
15 public schools in the nation where Arabic is being taught at the moment (2006, Jan.8).
In this section the author explored topics that relate to foreign language education. The
literature studied in this section suggests that the ability to communicate in English and other
languages can further enhance the American economy, international diplomacy, and national
security (Crawford, 1992b, p. 152).
2.1.2 Federal Funding for Foreign Language Instruction
In this section the author explores literature related to funding appropriations for foreign
language education.
2.1.2.1 Funding for foreign language education resulting from the Cold War
As a result of the Cold War between the United States and Russia, allocation of funding for
education rose significantly. “After the Soviet Union beat the United States into space with the
28
launch of the Sputnik satellite” (Friel, 2001), foreign language was among the perceived critical
needs of U.S. education at the time when the National Defense Education Act was passed:16
Sputnik raised questions about the ability of the nation's education system to compete.
Congress responded with the National Defense Education Act of 1958. It emphasized
science education and became a significant part of the country's science policy. The act
provided a student loan program, aid to elementary and secondary school instruction in
science, mathematics and foreign languages, and graduate student fellowships.
In fiscal year 1958, the year before Sputnik, according to government records, the National
Science Foundation's appropriation had leveled at $40 million. In fiscal year 1959, it more than
tripled at $134 million; and by 1968 the Foundation budget stood at nearly $500 million; funding
increased by about 12 times in the decade between 1958 and 1968.
2.1.2.2 Funding for foreign language education in the 1990’s
In 1991, during the presidency of George H. W. Bush, “the Senate Intelligence
Committee was so dubious about the recruiting pool for American spies that it established a
$150 million National Security Educational Fund to improve college programs in foreign
16 For more information about the National Defense Education Act passed in 1958 see http://www.nsf.gov/-
pubs/stis1994/nsf8816/nsf8816.txt
29
languages and international studies” (Crawford, 192a, p. 253). President Clinton concurred with
former President Bush concerning the necessity to invest in foreign language education. In a
remark prepared for delivery by U.S. Secretary of Education Richard Riley (2000, Sep. 19),
President Clinton was mentioned as a proponent of foreign language education:
I would like to emphasize that President Clinton and his staff [members] have been
leaders in the effort to improve foreign language acquisition. At the beginning of the
Administration, we made competency in foreign languages part of the Goals 2000:
Educate America Act. In 1993, we provided funding to four national language
organizations to develop national standards in foreign language. These standards were
issued in 1996, and they have given us a strong foundation for improving foreign
language acquisition.
At the end of President Clinton’s term, about $69.7 million was appropriated to fund
International Education and Foreign Language Studies.
2.1.2.3 Funding for foreign language education in the 2000’s
Rush Holt, New Jersey Representative, introduced the National Security Language Act17
in 2003 on the basis that “we [Americans] can no longer keep our nation safe if we do not
17 For more information about the National Security Language Act introduced by Representative Rush Holt
see http://www.fas.org/irp/congress/2003_cr/hr3676.html#txt
30
commit ourselves to learning the languages and cultures of critical areas around the world.”
Representative Holt explained that the need for language education goes far beyond what has
been accomplished in the U.S. traditional educational system regarding language education:
Al Qaeda operates in over 75 countries, where hundreds of languages and dialects are
spoken. However, 99 percent of American high school, college and university
programs concentrate on a dozen (mostly European) languages. In fact, more college
students currently study Ancient Greek (20,858) than Arabic (10,596), Korean (5,211),
Persian (1,117), and Pashto (14) put together. We need to do more to make sure that
America has the language professionals necessary to defend our national security. This
cannot be done overnight. We are already years overdue.
The necessity to build capacity in languages other than the three most commonly taught in the
United States (Spanish, French, and German) has been also pointed out by Friel (2001), when
wrote that out of 8,200 members of an American Translator Association, only one was qualified
to translate Pashto.
Funding for foreign language education is continuing during the presidency of George W.
Bush. The appropriation funds from 2000 to 2008 are shown in the table and graph below.18
18 Figures on International Education and Foreign Language Studies were acquired from the Joint National
Committee for Languages and the National Council for Languages and International Studies, JNCL-NCLIS. For
more information see http://www.languagepolicy.org
31
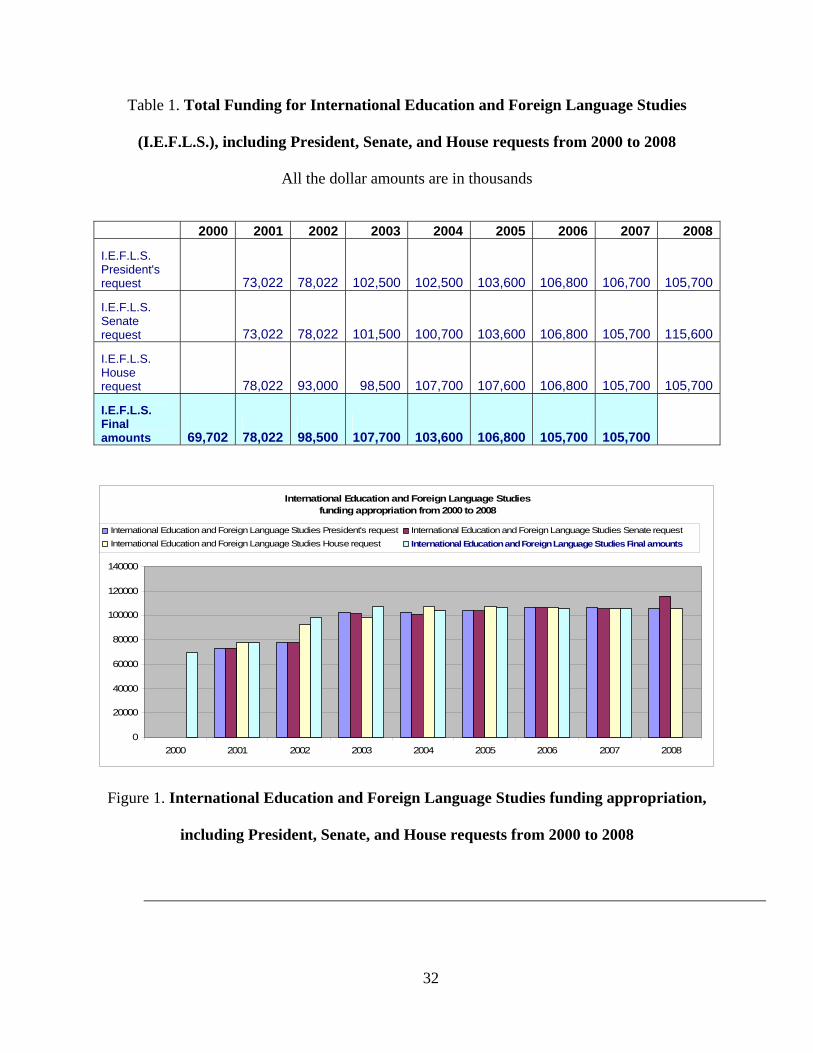
Table 1. Total Funding for International Education and Foreign Language Studies
(I.E.F.L.S.), including President, Senate, and House requests from 2000 to 2008
All the dollar amounts are in thousands
2000 2001 2002 2003 2004 2005 2006 2007 2008
I.E.F.L.S. President's request
73,022
78,022
102,500
102,500
103,600
106,800 106,700 105,700
I.E.F.L.S. Senate request
73,022
78,022
101,500
100,700
103,600
106,800 105,700 115,600
I.E.F.L.S. House request
78,022
93,000
98,500
107,700
107,600
106,800 105,700 105,700
I.E.F.L.S. Final amounts
69,702
78,022
98,500
107,700
103,600
106,800
105,700 105,700
International Education and Foreign Language Studiesfunding appropriation from 2000 to 2008
0
20000
40000
60000
80000
100000
120000
140000
2000 2001 2002 2003 2004 2005 2006 2007 2008
International Education and Foreign Language Studies President's request International Education and Foreign Language Studies Senate requestInternational Education and Foreign Language Studies House request International Education and Foreign Language Studies Final amounts
Figure 1. International Education and Foreign Language Studies funding appropriation,
including President, Senate, and House requests from 2000 to 2008
32
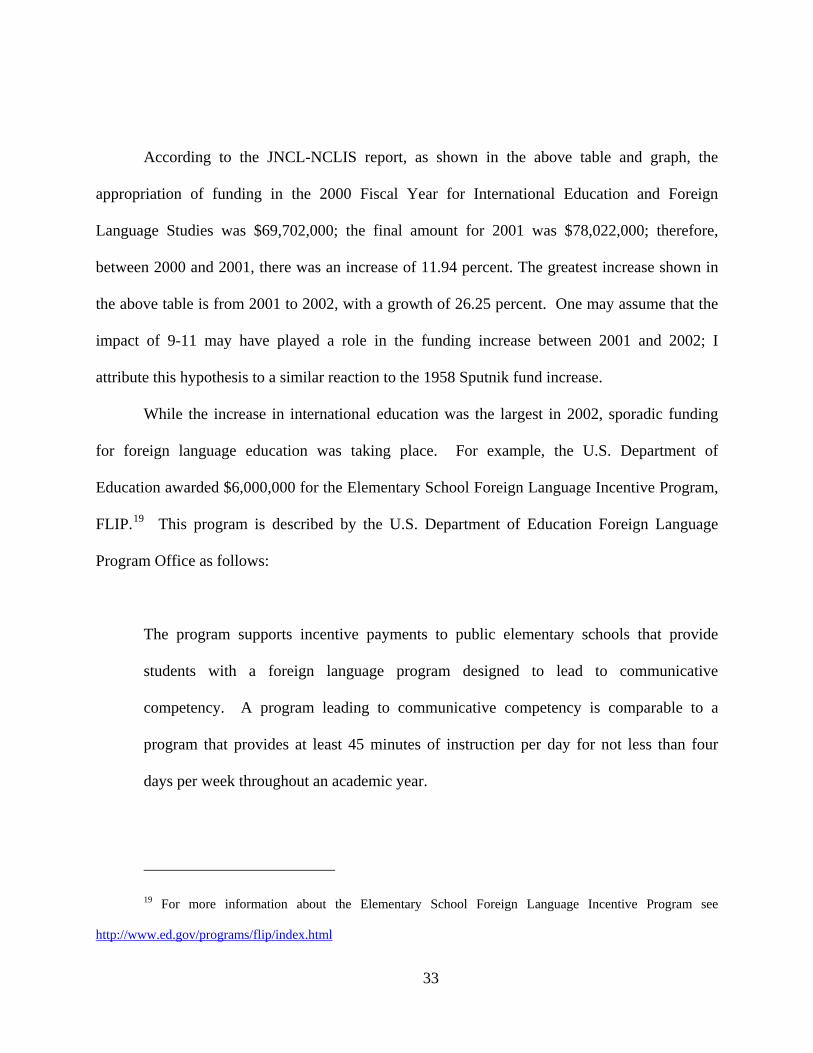
According to the JNCL-NCLIS report, as shown in the above table and graph, the
appropriation of funding in the 2000 Fiscal Year for International Education and Foreign
Language Studies was $69,702,000; the final amount for 2001 was $78,022,000; therefore,
between 2000 and 2001, there was an increase of 11.94 percent. The greatest increase shown in
the above table is from 2001 to 2002, with a growth of 26.25 percent. One may assume that the
impact of 9-11 may have played a role in the funding increase between 2001 and 2002; I
attribute this hypothesis to a similar reaction to the 1958 Sputnik fund increase.
While the increase in international education was the largest in 2002, sporadic funding
for foreign language education was taking place. For example, the U.S. Department of
Education awarded $6,000,000 for the Elementary School Foreign Language Incentive Program,
FLIP.19 This program is described by the U.S. Department of Education Foreign Language
Program Office as follows:
The program supports incentive payments to public elementary schools that provide
students with a foreign language program designed to lead to communicative
competency. A program leading to communicative competency is comparable to a
program that provides at least 45 minutes of instruction per day for not less than four
days per week throughout an academic year.
19 For more information about the Elementary School Foreign Language Incentive Program see
http://www.ed.gov/programs/flip/index.html
33
According to the U.S. Department of Education Foreign Language Program Office, funding
appropriations for the fiscal years 2000 to 2006 were respectively, $0; $0; $6,116,985; $0; $0;
$2,022,000; and $2,586,573. The funding appropriation for FLIP, similar to funding for
International Education and Foreign Language Studies, reached the highest level in 2002, with
an amount of $6,116,985. The 2002 funding is accentuated when it is compared to the amount
appropriated for 2001 and 2003; which were both $0.
Funding for foreign language education can be justified under the current federal No
Child Left Behind Act, NCLB, in which foreign language was declared as a “core academic
subject.” This declaration can be found in Title IX, Part A, Section 9101, Number 11. One such
funding came from the Foreign Language Assistance Act, FLAP20 of 2001 (http://www.ed.gov/-
legislation/FedRegister/finrule/2006-2/051906d.html), which is described as one of the largest
sources of funding for foreign language education:
[FLAP] is one of the largest federal sources of funding for foreign language programs in
U.S. schools. The projects are funded on both the Local and State Education Agency
(LEA and SEA) levels. According to the Department of Education, the LEA program
“provides grants to establish, improve, or expand innovative foreign language programs
for elementary and secondary school students. In awarding grants under this program,
20 For more information about the Foreign Language Assistance Program see http://www.ed.gov/-
programs/flapsea/index.html and the National Clearinghouse for English Language Acquisiton, NCELA
http://www.ncela.gwu.edu/oela/OELAprograms/4_FLAP.htm
34
the secretary of education supports projects that: (a) show the promise of being continued
beyond their project period and (b) demonstrate approaches that can be disseminated and
duplicated by other LEAs.” Similarly, the SEA program “provides grants to establish,
improve, or expand innovative foreign language programs for elementary and secondary
school students. In awarding grants under this program, the secretary of education
supports projects that promote systemic approaches to improving foreign language
learning in the state.”
The funding appropriation for FLAP resulted from a Reauthorization of the Elementary and
Secondary Education Act, ESEA, which was actually signed in 1965 as the centerpiece of
President Lyndon Johnson's War on Poverty: 21
The House/Senate Education Conference Committee approved the final version of
the education bill, H.R. 1, Leave No Child Behind on December 11, 2001. H.R.1
provides for sweeping reforms in elementary and secondary education. That is good
news for the foreign language and international education community. FLAP is included
in the final Conference Report. FLAP is now a part of Title V – Promoting Informed
Parental Choice and Innovative Programs, Section D – Fund for the Improvement of
Education, FIE. FLAP is no longer included with Bilingual Education, which is now
consolidated into one block grant.
21 For more information about the Reauthorization of the Elementary and Secondary Education Act see
http://languagepolicy.org/grants/FLAP/all_about_flap.html
35
There is an addition to the FLAP program, the Foreign Language Incentive
Program, FLIP. FLIP was a part of FLAP in the early 1990's but was not included the
last time ESEA was reauthorized. Under this program:
The Secretary shall make an incentive payment for each fiscal year to each public
elementary school that provides to students attending such school a program designed to
lead to communicative competency in a foreign language.
Through FLIP, foreign language education is encouraged to take place at the elementary level.
And also through such a program, one may assume that appropriation funds for foreign
languages continue to be part of the national budget.
2.1.2.4 Funding for languages other the three mostly commonly taught
The need to educate Americans in languages other than the three most commonly
taught was declared by Rush Holt at the time when the National Security Language Act was
passed. Holt stated that his bill proposed a financial incentive for college students who major in
current critical need languages:
The National Security Language Act would expand federal investment in education in
foreign languages of critical need, such as Arabic, Persian, Korean, Pashto, and Chinese.
Specifically, my bill would provide loan forgiveness of up to $10,000 for university
36
students who major in a critical need foreign language and then take a job either in the
federal workforce or as a language teacher.22
According to the National Center for Education Statistics,23 the U.S. institutions of higher
education showed an increase of 18 times in enrollment in Arabic from 1960 to 2002, rising from
641 to 10,584. Enrollment in Korean rose 31 times from 168 in 1960 to 5,211 in 2002;
enrollment in Chinese rose 18 times from 1,844 in 1960 to 34,153 in 2002. Enrollment in
Persian or Pashto was not reported. Assuming that each of these college students enrolled in
Arabic, Korean, and Chinese would have received a $10,000 grant, the grant appropriation for
these three languages in 2002 would total $ 500 million.
Below are some of the funding appropriations in chronological order, which were
reported by Digest of Education Statistics, 2006. These funds relate to Chapter 4 federal
programs for language education and related activities:24
22 For more information about this funding see http://www.fas.org/irp/congress/2003_cr/hr3676.html
23 For more information on enrollment in foreign language courses in United States’ institutions of higher
education see http://nces.ed.gov/programs/projections/tables/table_11.asp.
24 For more information about Chapter 4 federal programs for language education and related activities see
http://nces.ed.gov/pubs2007/2007017_4.pdf.
37
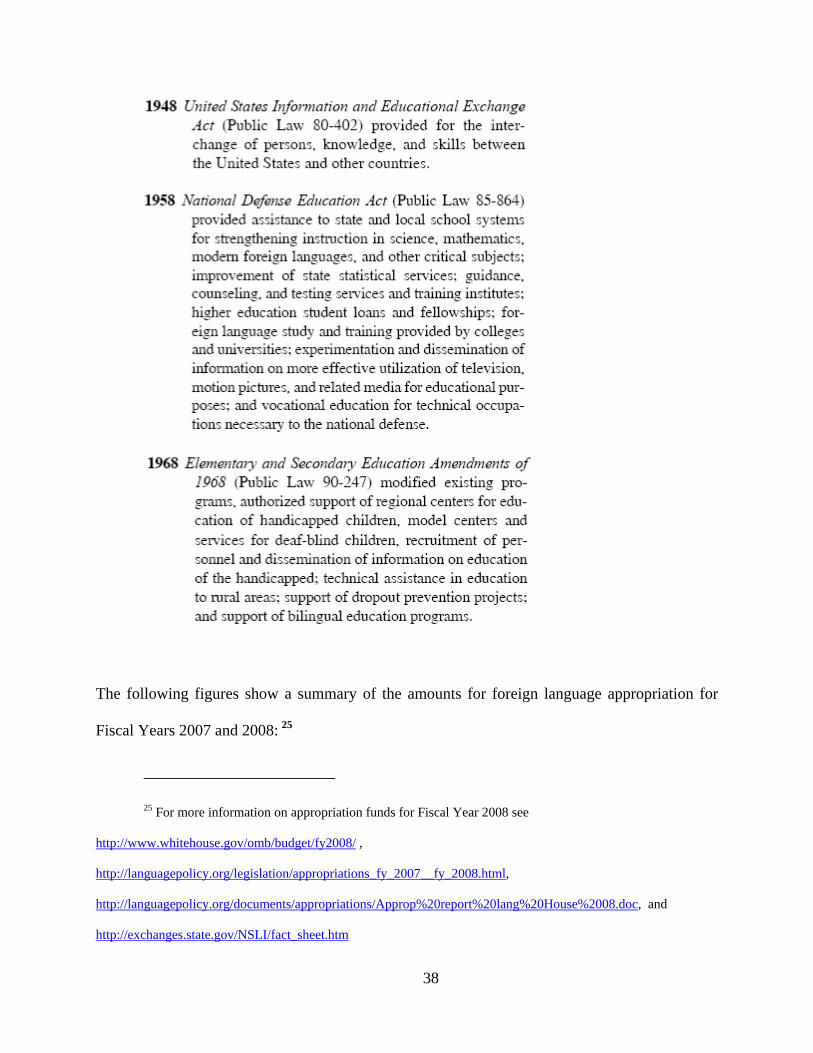
The following figures show a summary of the amounts for foreign language appropriation for
Fiscal Years 2007 and 2008: 25
25 For more information on appropriation funds for Fiscal Year 2008 see
http://www.whitehouse.gov/omb/budget/fy2008/ ,
http://languagepolicy.org/legislation/appropriations_fy_2007__fy_2008.html,
http://languagepolicy.org/documents/appropriations/Approp%20report%20lang%20House%2008.doc, and
http://exchanges.state.gov/NSLI/fact_sheet.htm
38
Appropriations FY 2007
The budget passed by Congress for fiscal year 2007 followed the same funding patterns
as FY 2006 and funded the various government agencies (except for Defense and
Homeland Security where appropriation bills were passed) at the same levels as the prior
year, i.e. International Education and Foreign Language Studies at $105.8 million, the
Foreign Language Assistance Program at $21.7 million, Civic Education at $29.1 million,
the National Endowment for the Humanities at $140.9 million, and Education and
Cultural Exchange (State Dept.) at $437.1 million.
Foreign Language Assistance Program (FLAP)
For the first time in his Administration, President Bush did not eliminate FLAP. The
President requested a $2 million increase to $23.7 million for FY 2007. As a part of
NSLI, FLAP was re-focused to create incentives to teach and study critical languages
including Arabic, Chinese, Japanese, and Korean along with other languages the
Administration deemed to fall under this heading.
Title VI and Fulbright-Hays
The budget proposes level funding for Title VI and Fulbright-Hays, except for a $1
million increase for Title VI domestic programs. The increase was to establish a
nationwide distance education E-learning Clearinghouse to deliver foreign language
education resources to teachers and students across the country. The new E-learning
39
Clearinghouse is a part of the President's NSLI. In addition, the Overseas
Programs/Fulbright-Hays Institute for International Public Policy received $1.6 million
(FY 06 funding was $1.6 million).
Advancing America through Foreign Language Partnerships
As a part of NSLI, this is a program of competitive grants to establish fully articulated
language programs of study in languages critical to US national security. Twenty-four
grants of $1 million each would be made to institutions of higher education for
partnerships with school districts for language learning from kindergarten through high
school and into advanced language learning at the postsecondary level. The goal is to
“produce significant numbers of graduates with advanced levels of proficiency in
languages critical to national security, many of whom would be candidates for
employment with agencies and offices of the Federal Government, across a wide range of
disciplines.” The funding level request for this program is $24 million. New legislation
authorizing the creation of this program is needed.
Language Teacher Corps
This program was funded under the Fund for the Improvement of Education. The
Administration requested $5 million that will provide training to college graduates with
critical language skills who are interested in becoming foreign language teachers. This
program is also a part of NSLI.
40
Teacher-to-Teacher Initiative
This is another NSLI program; it funded intensive summer training sessions for foreign
language teachers, especially those of critical languages. Three million dollars was
requested to fund this initiative.
National Security Education Program
There was an additional $19.2 million requested for NSEP. Of this increase the Flagship
programs received $10.2 million and the Civilian Linguistic Reserve Corps, CLRC, was
to receive $9.0 million. The total budget request for NSEP was $27.2 million. This
program is intended to provide and maintain a readily available civilian corps of certified
expertise in languages determined to be important to the security of the nation.
Appropriations for FY 2008
The President's budget proposal for fiscal year 2008, the Senate Committee
recommendations, and the House Committee recommendations have been released. The
budget proposal allots $56 billion for education, with almost half of that going toward
President Bush's No Child Left Behind Act. Of importance for foreign languages would
be the $2 million increase in FLAP funding ($24 million).
Senate Recommendations
The Labor, Health and Human Services, Education and Related Agencies Appropriations
Act for FY 2008 has strong report language regarding the Foreign Language Assistance
Program (FLAP):
41
The Committee intends for funding available under this program to promote the
goal of well-articulated, long-sequence language programs that lead to
demonstrable results for all students. The Committee directs the Department not
to make grants to schools that are replacing current traditional language programs
with critical needs language instruction. ... At least 75 percent of the appropriation
must be used to expand foreign language education in the elementary grades...
The Committee is concerned that this program ... is unavailable to the poorest schools
because grant recipients must provide a 50 percent match from non-Federal sources. The
Committee, therefore, strongly urges the Secretary to use her ability to waive the
matching requirement ...
House Recommendations
Among other things, the House Committee increases the Foreign Language Assistance
Program (FLAP) by $3 million; in higher education, International Education and Foreign
Language Studies receives a $9.9 million increase.
Like the Senate Committee, the House Committee has some strong views on a number of
these programs, such as International Education and Foreign Language Studies, where
they urge greater coordination and improved data gathering and reporting.
In this section the author explored literature related to funding that has been allocated to foreign
language education. There seems to be a relationship between funding and critical events such
as the Sputnik and 9/11.
42
2.1.3 Foreign language course enrollment
In this chapter the author explores foreign language enrollment in United States
educational institutions. Enrollment records to be explored relate to secondary and tertiary
levels. In order to explore the attitudes that impact foreign language course enrollment, the
author chose to explore the composition of the population. To accomplish this task, immigration
patterns were studied.
2.1.3.1 Immigration trends between 1900 and 2006
The author believes that attitudes toward foreign language education may be related to
the population composition. Based on this belief, the author chose to explore immigration
patterns between 1900 and 2006. Based on the author’s professional experience with foreign
language education in the U.S., the author chose to focus on immigration that relates to countries
of the most commonly studied foreign languages in the U.S., which are French, German, and
Spanish. Regarding the Spanish language, the author chose to study the immigration pattern
from Mexico and Cuba because of their proximity to the United States; regarding the German
and French languages, the author chose to explore the immigration patterns from Germany and
France.
The following table and graph show immigration pattern from 1900 to 1999.
43
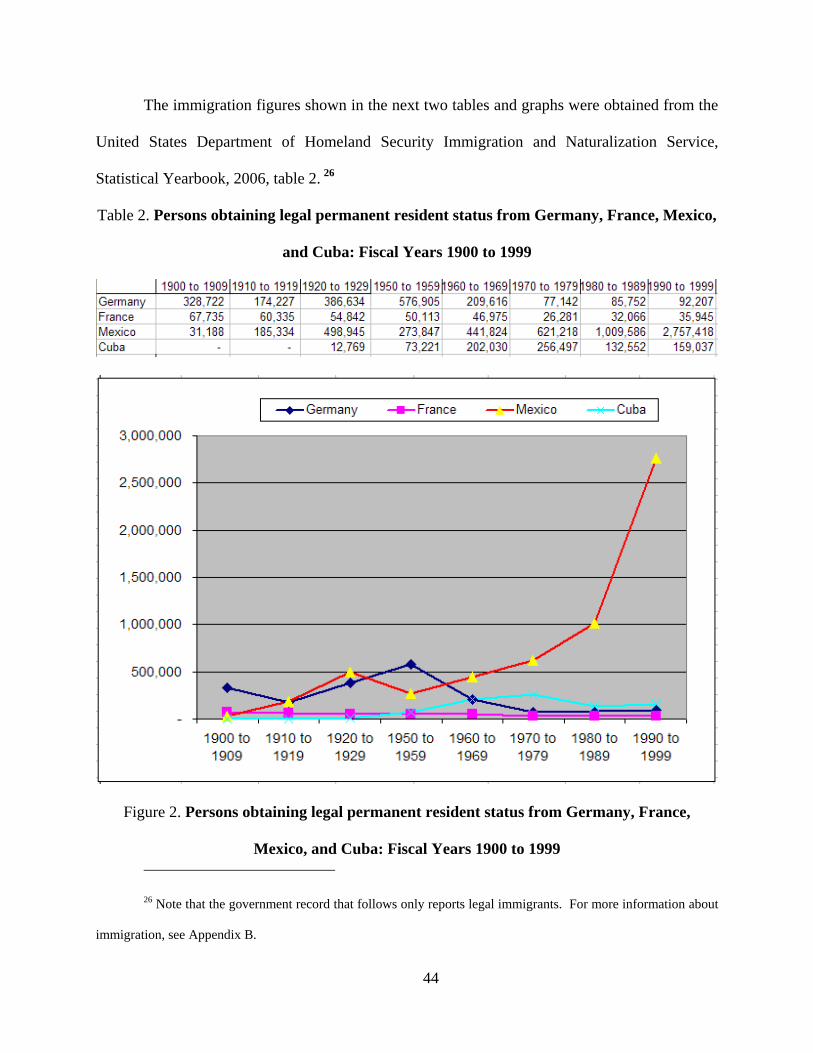
The immigration figures shown in the next two tables and graphs were obtained from the
United States Department of Homeland Security Immigration and Naturalization Service,
Statistical Yearbook, 2006, table 2. 26
Table 2. Persons obtaining legal permanent resident status from Germany, France, Mexico,
and Cuba: Fiscal Years 1900 to 1999
Figure 2. Persons obtaining legal permanent resident status from Germany, France,
Mexico, and Cuba: Fiscal Years 1900 to 1999
26 Note that the government record that follows only reports legal immigrants. For more information about
immigration, see Appendix B.
44
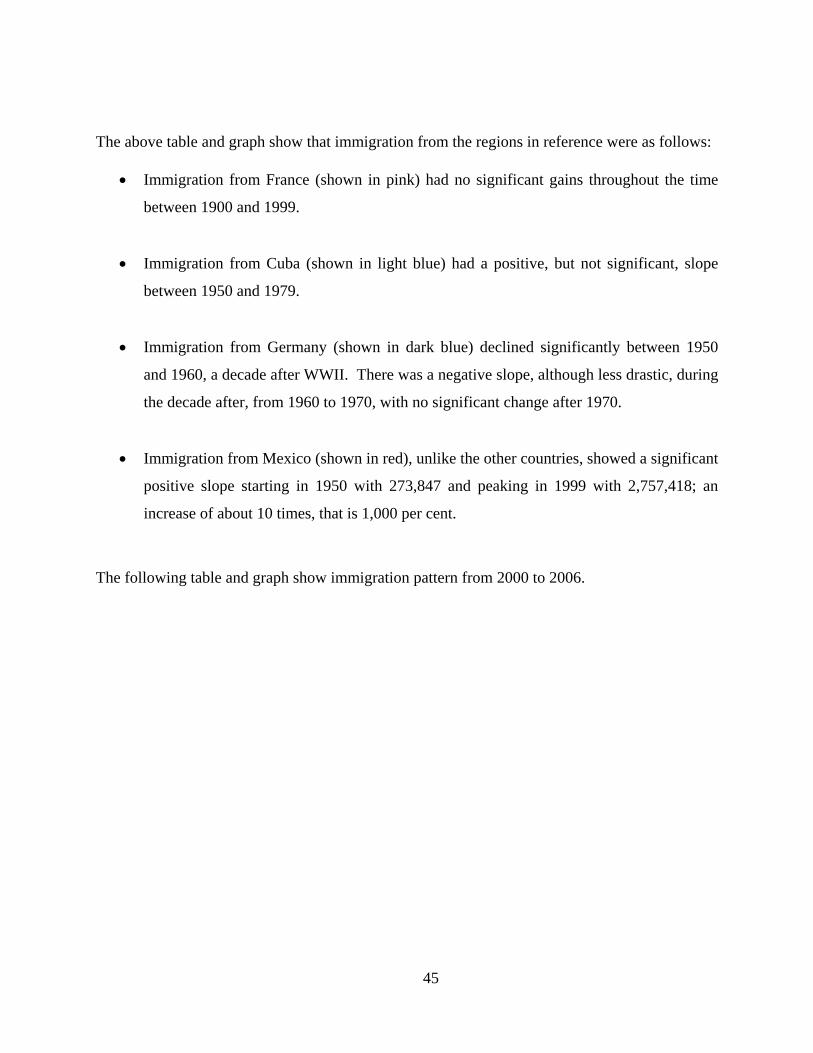
The above table and graph show that immigration from the regions in reference were as follows:
• Immigration from France (shown in pink) had no significant gains throughout the time
between 1900 and 1999.
• Immigration from Cuba (shown in light blue) had a positive, but not significant, slope
between 1950 and 1979.
• Immigration from Germany (shown in dark blue) declined significantly between 1950
and 1960, a decade after WWII. There was a negative slope, although less drastic, during
the decade after, from 1960 to 1970, with no significant change after 1970.
• Immigration from Mexico (shown in red), unlike the other countries, showed a significant
positive slope starting in 1950 with 273,847 and peaking in 1999 with 2,757,418; an
increase of about 10 times, that is 1,000 per cent.
The following table and graph show immigration pattern from 2000 to 2006.
45
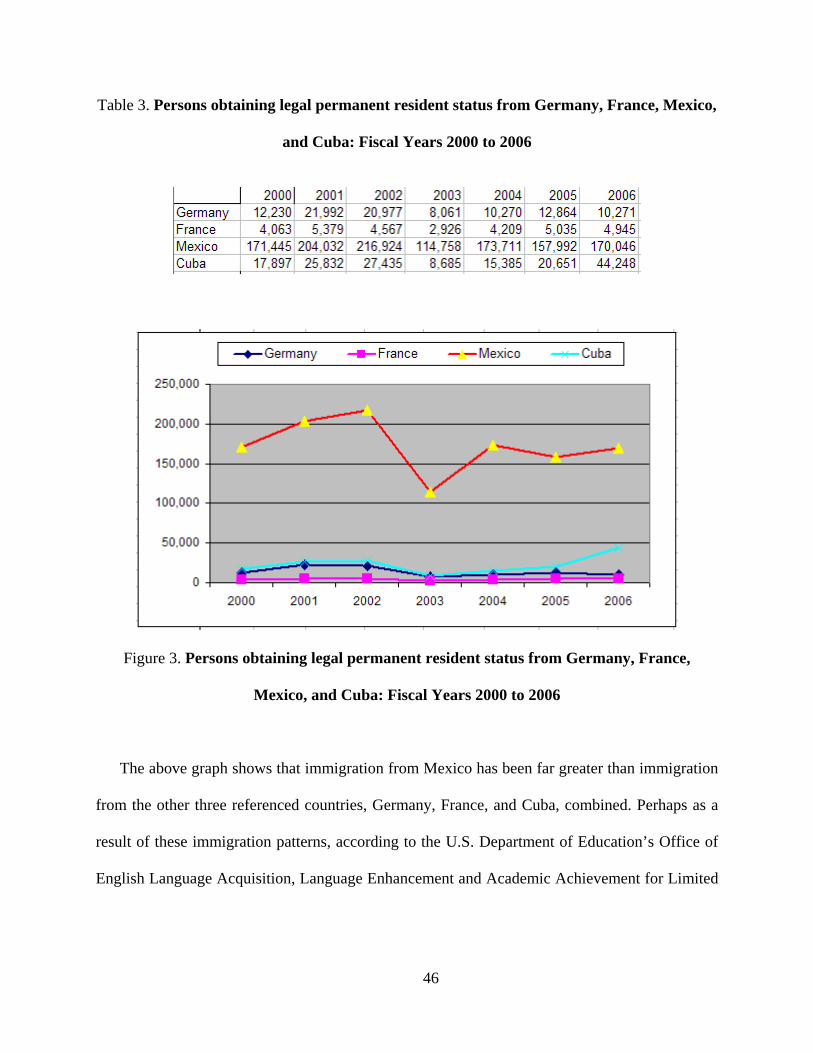
Table 3. Persons obtaining legal permanent resident status from Germany, France, Mexico,
and Cuba: Fiscal Years 2000 to 2006
Figure 3. Persons obtaining legal permanent resident status from Germany, France,
Mexico, and Cuba: Fiscal Years 2000 to 2006
The above graph shows that immigration from Mexico has been far greater than immigration
from the other three referenced countries, Germany, France, and Cuba, combined. Perhaps as a
result of these immigration patterns, according to the U.S. Department of Education’s Office of
English Language Acquisition, Language Enhancement and Academic Achievement for Limited
46
English Proficient Students (OELA), between 1990 and 2000, students with limited English
proficiency were mainly composed of two groups:
• Spanish students, grew by 57 percent from 1,636,874 in 1990 to 2,584,684 in 2000, and
• Asian/Pacific Island students, grew 18 percent from 360,251 to 426,555 during the same time period.
This population composition may be related to the choice of foreign language courses, in
which Spanish seems to have been the language chosen by students in most U. S. educational
institutions.
2.1.3.2 Overall foreign language course enrollment in grades 9 to 12 between the 1948 and
2000
The tables and graph that follow depict the trend of enrollment in foreign language
courses. The first set shows the enrollment of students in grades 9 through 12 from 1948 to
2000. The data reported were collected from the National Center for Education Statistics,
NCES, Table 55, 2005 and The American Council on the Teaching of Foreign Languages,
ACTFL.
47
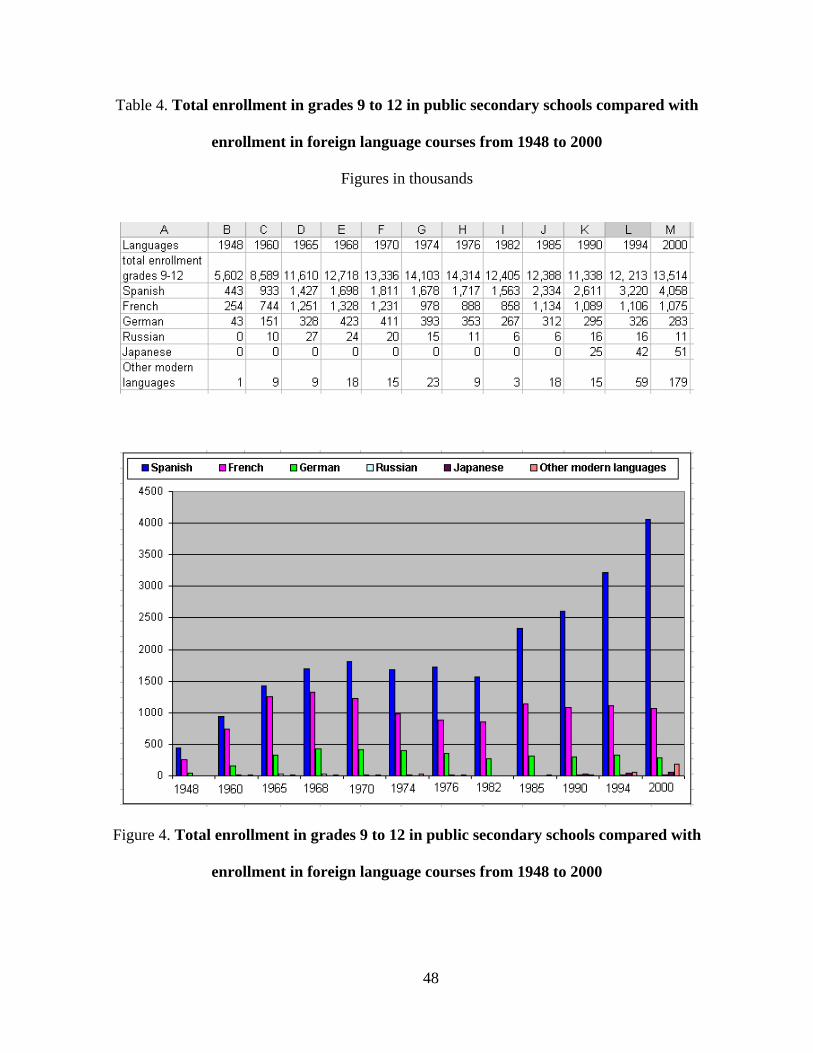
Table 4. Total enrollment in grades 9 to 12 in public secondary schools compared with
enrollment in foreign language courses from 1948 to 2000
Figures in thousands
Figure 4. Total enrollment in grades 9 to 12 in public secondary schools compared with
enrollment in foreign language courses from 1948 to 2000
48
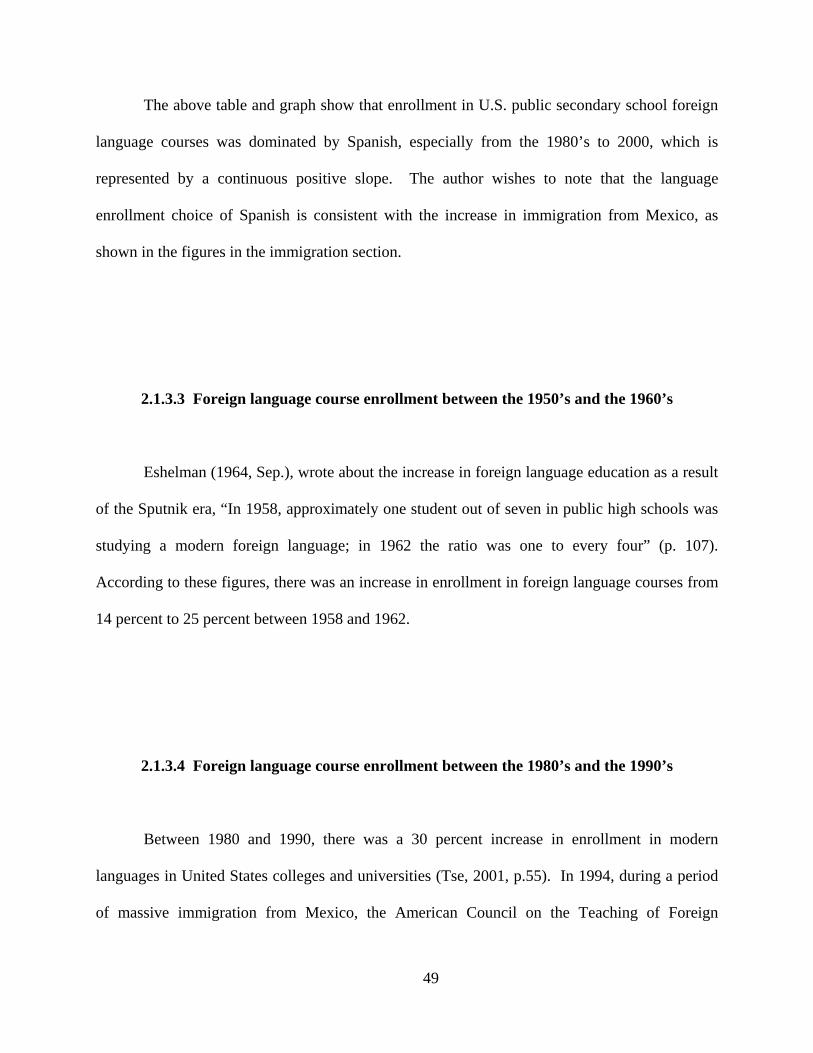
The above table and graph show that enrollment in U.S. public secondary school foreign
language courses was dominated by Spanish, especially from the 1980’s to 2000, which is
represented by a continuous positive slope. The author wishes to note that the language
enrollment choice of Spanish is consistent with the increase in immigration from Mexico, as
shown in the figures in the immigration section.
2.1.3.3 Foreign language course enrollment between the 1950’s and the 1960’s
Eshelman (1964, Sep.), wrote about the increase in foreign language education as a result
of the Sputnik era, “In 1958, approximately one student out of seven in public high schools was
studying a modern foreign language; in 1962 the ratio was one to every four” (p. 107).
According to these figures, there was an increase in enrollment in foreign language courses from
14 percent to 25 percent between 1958 and 1962.
2.1.3.4 Foreign language course enrollment between the 1980’s and the 1990’s
Between 1980 and 1990, there was a 30 percent increase in enrollment in modern
languages in United States colleges and universities (Tse, 2001, p.55). In 1994, during a period
of massive immigration from Mexico, the American Council on the Teaching of Foreign
49
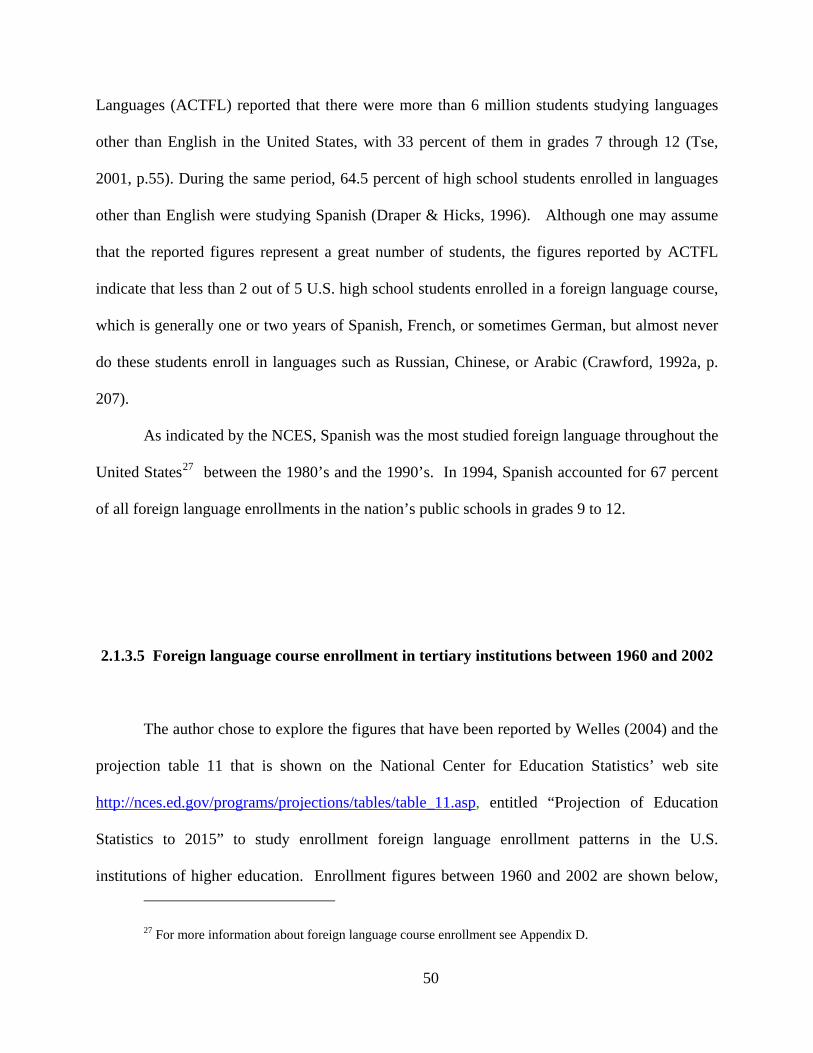
Languages (ACTFL) reported that there were more than 6 million students studying languages
other than English in the United States, with 33 percent of them in grades 7 through 12 (Tse,
2001, p.55). During the same period, 64.5 percent of high school students enrolled in languages
other than English were studying Spanish (Draper & Hicks, 1996). Although one may assume
that the reported figures represent a great number of students, the figures reported by ACTFL
indicate that less than 2 out of 5 U.S. high school students enrolled in a foreign language course,
which is generally one or two years of Spanish, French, or sometimes German, but almost never
do these students enroll in languages such as Russian, Chinese, or Arabic (Crawford, 1992a, p.
207).
As indicated by the NCES, Spanish was the most studied foreign language throughout the
United States27 between the 1980’s and the 1990’s. In 1994, Spanish accounted for 67 percent
of all foreign language enrollments in the nation’s public schools in grades 9 to 12.
2.1.3.5 Foreign language course enrollment in tertiary institutions between 1960 and 2002
The author chose to explore the figures that have been reported by Welles (2004) and the
projection table 11 that is shown on the National Center for Education Statistics’ web site
http://nces.ed.gov/programs/projections/tables/table_11.asp, entitled “Projection of Education
Statistics to 2015” to study enrollment foreign language enrollment patterns in the U.S.
institutions of higher education. Enrollment figures between 1960 and 2002 are shown below,
27 For more information about foreign language course enrollment see Appendix D.
50
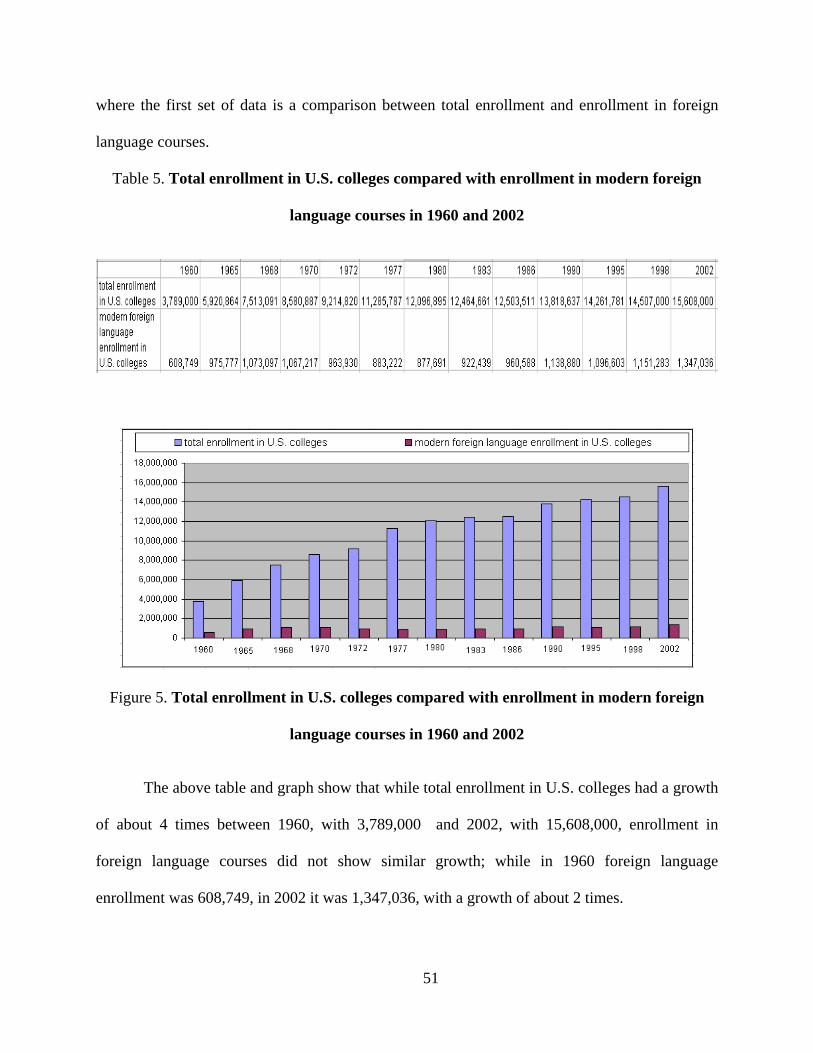
where the first set of data is a comparison between total enrollment and enrollment in foreign
language courses.
Table 5. Total enrollment in U.S. colleges compared with enrollment in modern foreign
language courses in 1960 and 2002
Figure 5. Total enrollment in U.S. colleges compared with enrollment in modern foreign
language courses in 1960 and 2002
The above table and graph show that while total enrollment in U.S. colleges had a growth
of about 4 times between 1960, with 3,789,000 and 2002, with 15,608,000, enrollment in
foreign language courses did not show similar growth; while in 1960 foreign language
enrollment was 608,749, in 2002 it was 1,347,036, with a growth of about 2 times.
51
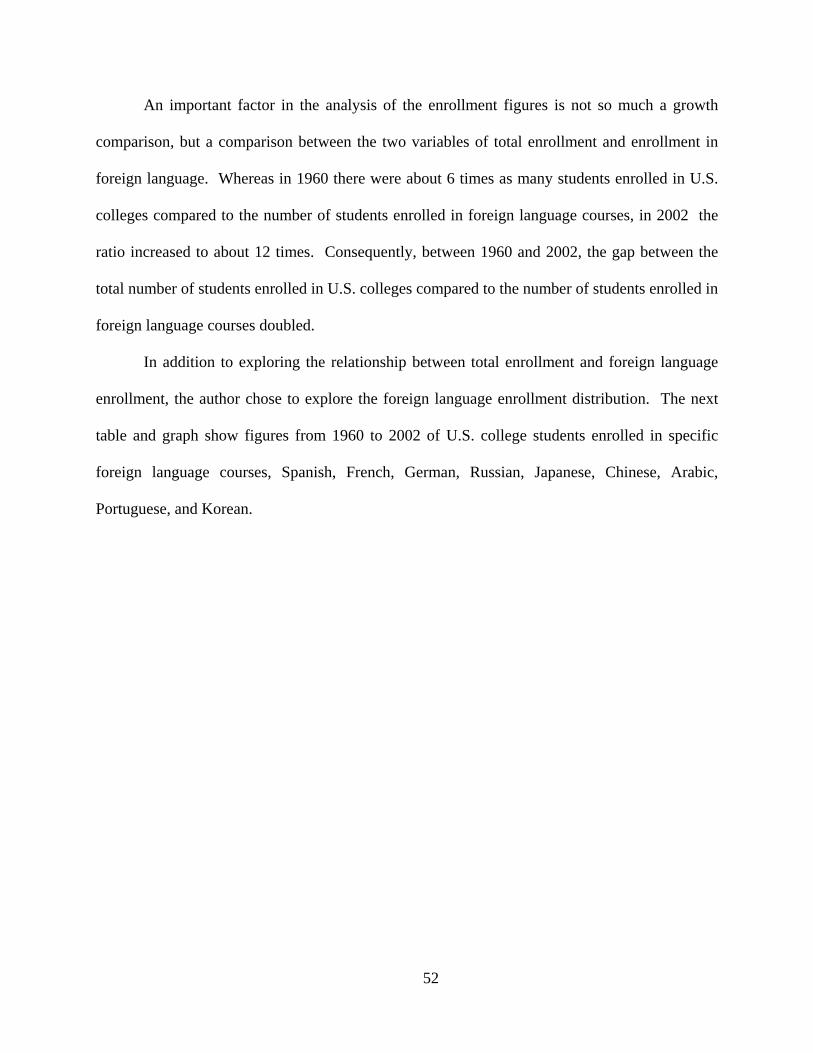
An important factor in the analysis of the enrollment figures is not so much a growth
comparison, but a comparison between the two variables of total enrollment and enrollment in
foreign language. Whereas in 1960 there were about 6 times as many students enrolled in U.S.
colleges compared to the number of students enrolled in foreign language courses, in 2002 the
ratio increased to about 12 times. Consequently, between 1960 and 2002, the gap between the
total number of students enrolled in U.S. colleges compared to the number of students enrolled in
foreign language courses doubled.
In addition to exploring the relationship between total enrollment and foreign language
enrollment, the author chose to explore the foreign language enrollment distribution. The next
table and graph show figures from 1960 to 2002 of U.S. college students enrolled in specific
foreign language courses, Spanish, French, German, Russian, Japanese, Chinese, Arabic,
Portuguese, and Korean.
52
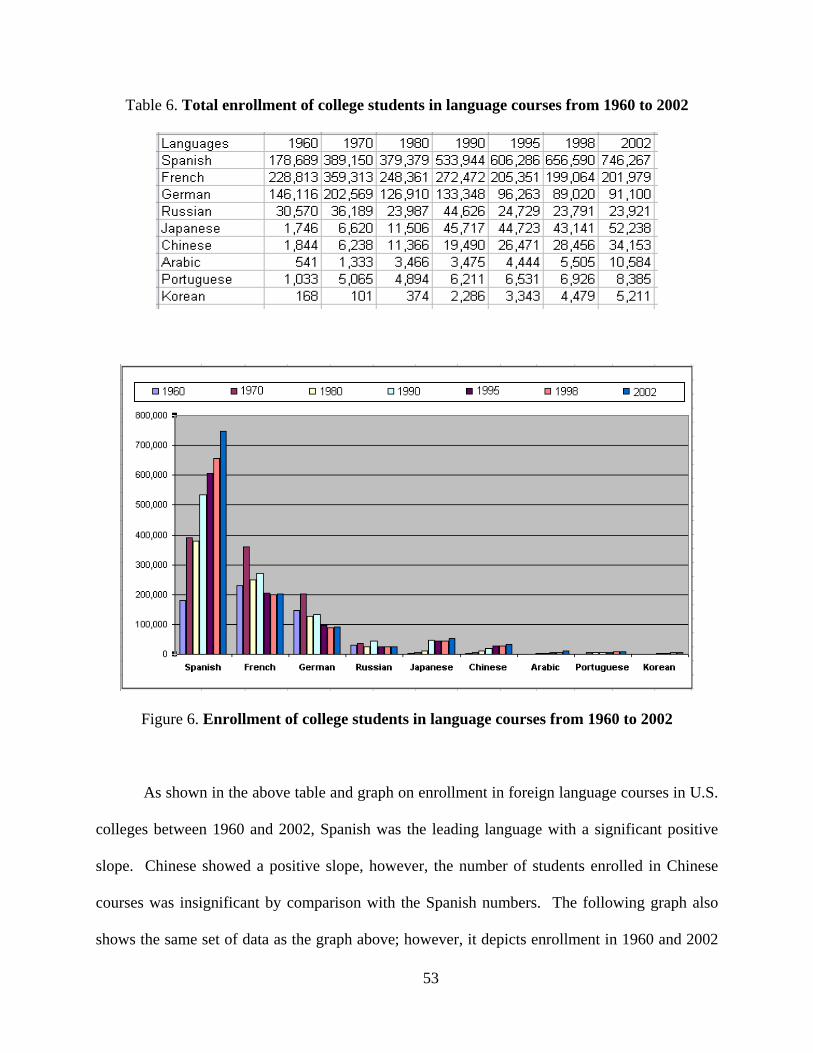
Table 6. Total enrollment of college students in language courses from 1960 to 2002
Figure 6. Enrollment of college students in language courses from 1960 to 2002
As shown in the above table and graph on enrollment in foreign language courses in U.S.
colleges between 1960 and 2002, Spanish was the leading language with a significant positive
slope. Chinese showed a positive slope, however, the number of students enrolled in Chinese
courses was insignificant by comparison with the Spanish numbers. The following graph also
shows the same set of data as the graph above; however, it depicts enrollment in 1960 and 2002
53
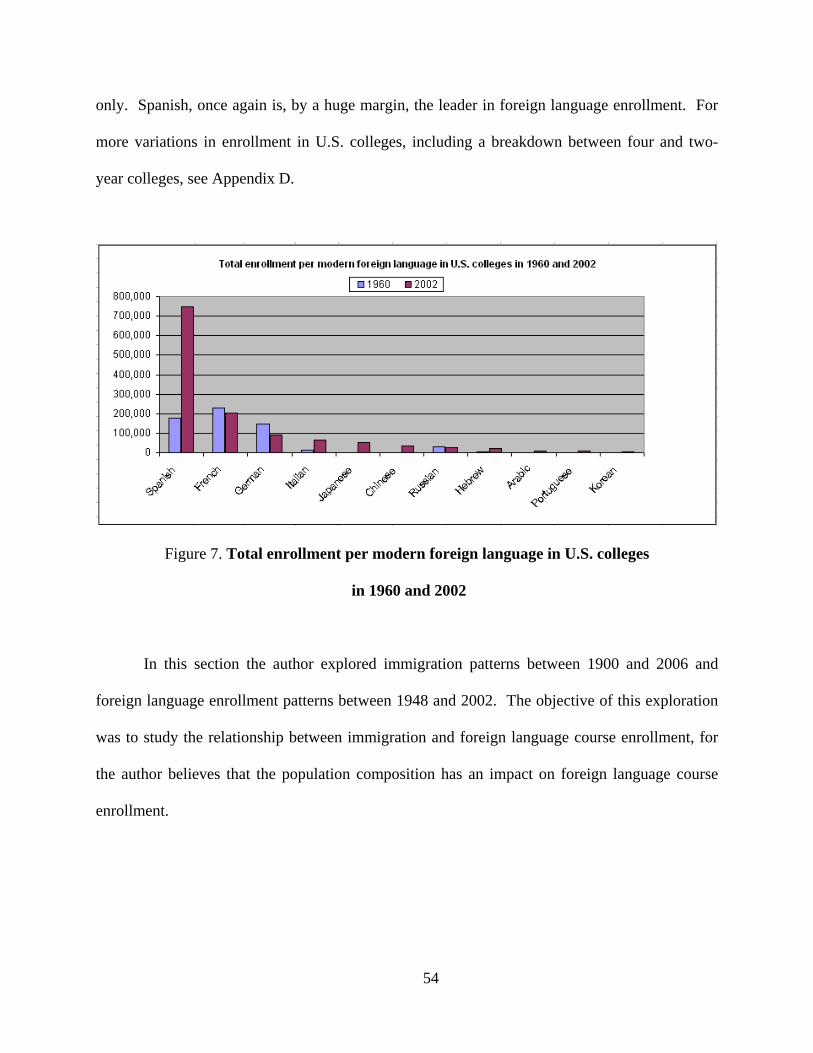
only. Spanish, once again is, by a huge margin, the leader in foreign language enrollment. For
more variations in enrollment in U.S. colleges, including a breakdown between four and two-
year colleges, see Appendix D.
Figure 7. Total enrollment per modern foreign language in U.S. colleges
in 1960 and 2002
In this section the author explored immigration patterns between 1900 and 2006 and
foreign language enrollment patterns between 1948 and 2002. The objective of this exploration
was to study the relationship between immigration and foreign language course enrollment, for
the author believes that the population composition has an impact on foreign language course
enrollment.
54
3.0 RESEARCH METHOD – INTRODUCTION
The author’s intention in conducting this study was to explore the American attitude
toward foreign language education in the United States from the 1700’s until today. The author
found this topic increasingly appealing because of the country’s diverse immigration
composition. The author’s perspective is based on the concept that this composition results in
varying attitudes that shape the nation’s foreign language education system.
The author chose to explore data from U.S. government agencies like the U.S.
Department of Education, including the National Center for Education Statistics (NCES); U.S.
Department of State; U.S. Department of Defense; and Office of the Director of National
Intelligence, in addition to data on immigration from the U. S. Department of Homeland Security
Immigration and Naturalization Service. Other data were collected from organizations that
specialize in foreign language education in the United States; three of these organizations are the
Joint National Committee for Languages and the National Council for Languages and
International Studies, JNCL-NCLIS, the American Council on the Teaching of Foreign
Languages, ACTFL, and the Center for Applied Linguistics (CAL).
55
3.1 CATEGORIZATION OF RESEARCH AREAS
As a means to guide this study, the author engaged in the exploration of three topics; they
are foreign language instruction, federal funding for language instruction, and foreign language
course enrollment.
The author believes that these three topics are related. The ethnic composition of the
country’s population influences foreign language course enrollment due to the attitudes of the
nation’s stakeholders. Based on this belief, an exploration of immigration patterns is also
included in this study. Increased interest in a particular foreign language results in greater
funding allocations. The author accepts the idea that funding allocations are decided by political
leaders who are voted into office by the people whom they serve. The interaction among
American citizens then results in mandated requirements: type of language, length of study, and
so forth.
56
3.2 BASIC RESEARCH APPROACH
A historical methodology was used in this study. This chapter delineates the reasoning
for the choice and provides an overview of the data collection and analysis techniques.
Krathwohl (1993) wrote that historical method consists of the discovery, selection, organization,
and interpretation of evidence to describe a situation or to answer a question about past events (p.
501). In this work, the author tried to discover what the attitude of Americans concerning
foreign language education is. The author explored U.S. government records, in addition to
records that have been compiled by other organizations and authors that specialize in foreign
language education in the United States.
According to Krathwohl (1993), historical researchers are free to choose and interpret
their data; however, they are judged by the intelligence and honesty they bring to the task;
consequently, the match of a strongly developed rationale with carefully selected and organized
data to show their congruence is always partly an art. The author believes that the scope of this
study afforded her with an honesty component based on the type of explored data: governmental
records, and records compiled by other organizations and authors that specialize in foreign
language education in the United States. The latter are reputable authors because they write
using government data; the author believes that these authors too report with honesty
(Krathwohl, 1993).
57
3.3 RESEARCH PROCEDURE
The author explored the literature to learn about the American attitude toward foreign
language education from the 1700’s to today. The author chose to accomplish this task with a
historical perspective (Krathwohl, 1993) because she found that the study based on a
chronological order would be appropriate. The rationale for this approach is that there is a
relationship between the attitudes of the country’s citizens, and attitudes may change over time
based on historical occurrences.
The outcome goal of this exploration is to learn about the American attitude toward
foreign language education within the study time frame.
58
3.4 INSTRUMENTATION
To fulfill the doctoral program’s requirements, the author sought the approval of the
University of Pittsburgh’s Institutional Review Board, IRB, to conduct this research. The
request was based on the fact that the study did not include the use of human subjects. The
means for data collection were focused on government reports and literature pieces. Permission
was granted as shown in Appendix A.
The study’s data on immigration from 1900 to 1929 were acquired from the U. S.
Department of Homeland Security Immigration and Naturalization Service, Statistical Yearbook,
2006, table 2; immigration figures are shown in Appendix B. Also acquired from the U. S.
Department of Homeland Security Immigration and Naturalization Service, Statistical Yearbook,
2006, table 2 were data related to immigration from 1950 to 2006, shown in Appendix C.
Another set of data was acquired from the National Center for Education Statistics, Table
55, 2005 and The American Council on the Teaching of Foreign Languages, ACTFL. These
data refer to the foreign language course enrollment in the United States’ public secondary
schools and institutions of higher education between 1948 and 2002. These figures are shown in
Appendix D.
59
3.5 ANALYSIS OF DATA
The author chose to explore governmental records that relate to the three topics
mentioned in this work, immigration, federal funding for foreign language instruction, and
foreign language course enrollment.
3.5.1 Data Analysis on Immigration Patterns
The data sets that the author will be using to explore immigration patterns originated
from the U. S. Department of Homeland Security Immigration and Naturalization Service,
Statistical Yearbook, published in 2006.28 Immigration content data will be discussed
throughout this work, and will also be shown in Appendix B. Secondary sources from writings
composed by professionals who specialize in foreign language education are also referenced
throughout this work.
Although this work’s time frame starts in the 1700’s, governmental records on
immigration only started in 1820; consequently, prior to 1820, the author relied on secondary
sources. To make use of the available government data the time periods shown on tables and
graphs are from 1820 to 1899, 1900 to 1999, and 2000 to 2006.
28 For more information about data on immigration between 1820 and 2006, see the 2006 Yearbook of
Immigration Statistics at http://www.dhs.gov/xlibrary/assets/statistics/yearbook/2006/OIS_2006_Yearbook.pdf.
60
The author analyzed trends in immigration from the 1700’s to 2006 from various world
regions as a basis for reference. These regions are Europe, Asia, Africa, and the Americas.
Although immigration from these four world regions was explored, the author focused on
immigration from regions that have a relationship to the most taught languages in the U.S.,
which are Europe (Germany and France), and Latin America and the Caribbean (Mexico and
Cuba). The rationale for studying patterns of immigration from Germany and France was
because French and German are two of the most commonly taught languages; governmental
records and secondary sources point out that Germans composed the greatest number of
immigrants in the 1700’s and in the early part of the 1800’s. French is also one of the most
commonly taught languages; in addition, the author wished to explore the role France played in
the U.S. at the time surrounding the Louisiana purchase in the beginning of the 1800’s.
Immigration from Mexico was explored because the author wished to study if there was a
change in the number of Mexican immigrants between the 1700’s and 2006, especially
considering that the current foreign language mostly studied in the U.S. is Spanish. The choice
to explore immigration from Cuba was based on the fact that Cuba is not geographically far from
the United States; in addition, the author wished to investigate if immigration from Cuba peaked
during the decade of the 1960’s when Fidel Castro became the Cuban leader.
61
3.5.2 Data Analysis on Federal Funding for Foreign Language Instruction
The data sets that the author will be using to explore federal funding for foreign language
instruction originated from the National Defense Education Act,29 from the National Security
Language Act,30 from the Joint National Committee for Languages and the National Council
for Languages and International Studies, JNCL-NCLIS, 31 and from the National Center for
Education and Statistics. 32 Secondary sources related to funding for foreign language
instruction originated from writings composed by professionals who specialize in foreign
language education; these sources have been referenced throughout this work.
Although this work’s time frame starts in the 1700’s, governmental records on federal
funding for foreign language instruction were only provided in the 2000’s; therefore, prior to
2000, the author relied on secondary sources.
The author’s objective was to analyze the trends in federal funding for foreign language
instruction to explore immigration patterns or world occurrences, such as the Cold War and the
September 11 attack. The author came to the study with the conception that if federal funding
for foreign language instruction were to empower American citizens, and consequently, the
29 For more information about the National Defense Education Act passed in 1958 see http://www.nsf.gov/-
pubs/stis1994/nsf8816/nsf8816.txt.
30 For more information about the National Security Language Act introduced by Representative Rush Holt
see http://www.fas.org/irp/congress/2003_cr/hr3676.html#txt.
31 For more information about the Joint National Committee for Languages and the National Council for
Languages and International Studies, JNCL-NCLIS see http://www.languagepolicy.org.
32 For more information about the National Center for Education and Statistics, see
http://nces.ed.gov/pubs2007/2007017_4.pdf.
62
nation, to participate in a changing world, funding would be managed to provide various
language choices in the nation’s academic institutions and to promote life-long learning. This
promotion would encompass the use of native languages from generation to generation and a
strong graduation and entrance requirement in the secondary and college institutions,
respectively.
The author also came to the study with the assumption that if federal funding were
allocated simply based on the nation’s critical times, such as the Cold War or the September 11
attack, funding allocation would happen in an uneven, lump payment format. That is,
considerable funding would be allocated immediately after a particular crisis toward a few
institutions, but not as a continuous, nationwide focus.
In order to fulfill the author’s preconceptions, foreign language enrollment data were
analyzed, for the author believed that enrollment would show if funding for foreign language
instruction was allocated to empower American citizens on a continuous basis or simply during
critical times.
3.5.2 Data Analysis on Foreign Language Course Enrollment
The data sets that the author will be using to explore foreign language course enrollment
originated mainly from the National Center for Education Statistics, NCES.33 Secondary sources
33 For more information about the National Center for Education and Statistics, see
http://nces.ed.gov/pubs2007/2007017_4.pdf.
63
on funding for foreign language instruction originated from writings composed by professionals
who specialize in foreign language education; these sources have been referenced throughout this
work.
Although this work’s time frame starts in the 1700’s, governmental records on
immigration were not available prior to the last decade of the 1800’s; consequently, prior to
1889, the author was limited to secondary sources.
The author’s objective was to learn the extent to which the United States as a nation was
committed to a comprehensive foreign language education plan. The author was coming from a
perspective that language learning is a continuous process. Consequently, one of the goals was
to explore this learning bridged from elementary to secondary to tertiary levels. Unfortunately,
federal data only started to be recorded in the last decade of the 1800’s, and, in addition, data
reporting a substantial enrollment in foreign language courses at the elementary level were not
available. Therefore the bulk of this work in relation to foreign language enrollment explores
enrollment in American public high schools from 1948 to 2000 and institutions of higher
education, including two and four-year colleges, from 1960 to 2002. Some of these data tables
and graphs are shown in Appendix D.
The author came with the perception that language learning starts at a late phase
assuming the secondary level as a starting point; in addition, the author had a preconceived view
that language courses offered were confined between the three mainly taught languages, French,
German, and Spanish. The exploration of foreign language course enrollment would serve as a
means to confirm or refute the author’s preconception.
64
The author will explore immigration patterns, the attitude of the American people
regarding foreign language instruction, federal funding for foreign language instruction, and
foreign language course enrollment within four time frames, 1700’s, 1800’s, 1900’s, and 2000’s.
The author believes that after this exploration, she will better understand the attitude of
the American people toward foreign language education.
In this section the author provided an introduction to the research method with a
categorization of the areas being studied. In addition, the author wrote about the research
approach and procedure, and lastly, research instrumentation and intended analysis of data.
65
4.0 FINDINGS - INTRODUCTION
In this chapter, the author reports what she learned about the American attitude toward
foreign language education from the 1750’s to today through the exploration of literature. This
chapter is divided into four main sections, each with four subsections, as shown below:
Section 4.1 – 1700’s
• Section 4.1.1 immigration
• Section 4.1.2 foreign language instruction
• Section 4.1.3 federal funding for foreign language instruction
• Section 4.1.4 foreign language course enrollment
Section 4.2 – 1800’s
• Section 4.2.1 immigration
• Section 4.2.2 foreign language instruction
• Section 4.2.3 federal funding for foreign language instruction
• Section 4.2.4 foreign language course enrollment
66
Section 4.3 – 1900’s
• Section 4.3.1 immigration
• Section 4.3.2 foreign language instruction
• Section 4.3.3 federal funding for foreign language instruction
• Section 4.3.4 foreign language course enrollment
Section 4.4 – 2000’s
• Section 4.4.1 immigration
• Section 4.4.2 foreign language instruction
• Section 4.4.3 federal funding for foreign language instruction
• Section 4.4.4 foreign language course enrollment
67
4.1 AMERICAN ATTITUDE TOWARD FOREIGN LANGUAGE EDUCATION IN
THE 1700’S
The 1700’s was the period when the United States was born as a nation. It was in this
century that the nation obtained its independent status. Consequently, during this period the
attitudes of the “American people” who were members of this new nation started to be shaped.
The population composition of the 1700’s was diverse due to the immigration trends. Many
people from other nations were migrating to America, where the term “immigration” was coined
in 1789 (McCrum, MacNeil, & Cran, 2002, p. 289).
4.1.1 U.S. immigration in the 1700’s
The author was informed that governmental records for immigration into the United
States started in 1820. This was validated by the sources sent to her by Steve Fienberg per a
request from Bonnie Youngs, a member of the dissertation committee, and by John Simanski of
the Office of Immigration Statistics. Based on secondary sources, Kloss (1998, p. 9) wrote that
in the 1700’s the Germans composed the largest immigrant group of the U.S., and Crawford &
Schmid wrote that the number of German immigrants entering the United States during the
1750’s was about 7,000 per year (Crawford, 2000, p. 11; Schmid, 2001, p. 15).
68
4.1.2 Foreign language instruction in the 1700’s
In the 1750’s foreign language knowledge seemed to be taken for granted, for it appeared
to be commonplace within society. In some instances being multilingual34 was not just a
trademark of the elite members. Such an example could be read in a newspaper advertisement
as was written by Crawford (1992a):
Run away . . . from John Orr, near Skuylkill, Philadelphia, a Servant Man named James
Mitchell. . . . He was being a Traveller, and can talk Dutch [German], Spanish and Irish,
[Pennsylvania Gazette, November 5-12, 1749] (p. 36).
At the time American schools were providing education in various foreign languages; private
schools in Philadelphia offered instruction in German, French, Spanish, Italian, Portuguese,
Latin, Greek, Hebrew, and Arabic (Crawford, 1992a, p. 36). During this time period, American
students had the choice of the languages they wished to learn in addition to the languages chosen
by their parents. Education in the German language was offered when parents requested
(Crawford, 2000, p. 20; Kloss, 1998, p. 31). Many American settlers during the time ran non-
English schools; Crawford (2000, p. 20), stated that settlers rarely were subjected to language
restrictions.
Perhaps because foreign languages were ingrained in American lives in the early years of
the nation, there are no explicit rules that refer to foreign language in the two foundation U.S.
34 Bilingualism is the ability to use two languages; trilingualism is the ability to use three languages, in both
cases, especially with equal or nearly equal fluency. See http://www.thefreedictionary.com/
69
documents, the Declaration of Independence (1776) and the United States Constitution (1789).35
Thomas Jefferson, who headed a committee of five in preparing the Declaration of
Independence, considered foreign language education to be a valuable cause. In 1787, he argued
that American students up to sixteen years of age should learn Latin, Greek, French, and Spanish
(Simon, 1980, p. 77). He encouraged his son-in-law, T. M. Randolph Jr.36 to learn French and
Spanish because “our [the United States] connection with Spanish is [was] already important,
and will [would] become daily more so. Besides this, the ancient part of American history is
written chiefly in Spanish” (Schmid, 2001, p. 16).
Jefferson was not the only political leader involved in the United States foundational
documents who displayed an attitude toward foreign language. Benjamin Franklin also
displayed one. His attitude, however, was different from Jefferson’s. Franklin feared that the
English language would be overtaken by the German language; he wrote, “In My opinion be able
to preserve our language, and even our Government will become precarious” (Crawford, 1992, p.
17). Franklin was referring to the English language when he mentioned “our language.” As a
result of his attitude, Franklin proposed to force English education upon the German immigrants.
He helped to establish a network of English-language schools (Crawford, 2000, p. 11).
35 For more information on the Declaration of Independence (1776) or the United States Constitution
(1789) regarding foreign languages see http://www.ncela.gwu.edu/pubs/resource/foreign.htm#SEC2
36 Thomas Mann Randolph, Jr. (1768-1828), son-in-law of Thomas Jefferson, Governor of Virginia and
U.S. Congressman. See The Papers of Thomas Jefferson Volume 29: 1 March 1796 to 31 December 1797
(Princeton University Press, 2002), 81-3
70
4.1.3 Federal funding for foreign language instruction in the 1700’s
During the 1700’s many settlers were educated in their own language (Crawford, 2000, p.
20); they not only had the freedom to choose their language of instruction but they were afforded
with funding to satisfy their interests. Such an example happened in 1785, when Benjamin
Rush37 with help from Benjamin Franklin advocated a publicly funded experiment in bilingual
higher education. The school was “dedicated in 1787 at Lancaster, the hub of Pennsylvania
Dutch country; it is known today as Franklin and Marshal College” (Crawford, 1992a, p. 39;
Crawford, 2000, p. 12; Schmid, 2001, p. 16).
4.1.4 Foreign language course enrollment in the 1700’s
The author was informed by Eugene Owen of the National Center for Education Statistics
that foreign language enrollment data is “a new phenomenon.” Data on foreign language
enrollment only appeared in the 20th century.
37 Benjamin Rush (1745-1813) was an American statesman and one of the most influential physicians in
the early history of the United States. See http://encarta.msn.com
71

4.1.5 Summary of the 1700’s
The author learned that immigration records and foreign language enrollment records
were not available for this early time period. However, she learned that American citizens were
not bound by their languages. They were afforded the opportunity to obtain an education in their
own languages. She also learned that the knowledge of foreign languages was not restricted to
the elite class. Finally, she learned that while immigrant parents favored educating their children
in their own languages, some political leaders were not against this approach. Such leaders were
Thomas Jefferson, Benjamin Rush, and Benjamin Franklin. Franklin, however, seemed to have
fluctuated in his attitude toward foreign language education; sometimes he favored it, at other
times, he opposed it.
72
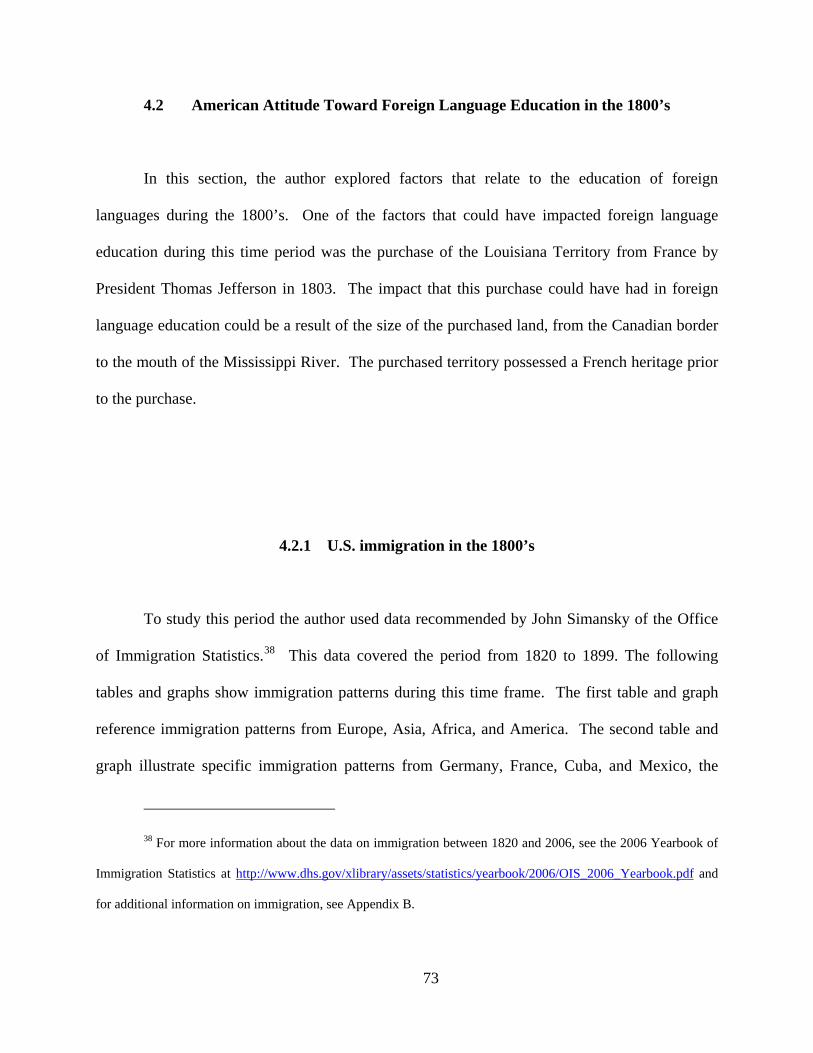
4.2 American Attitude Toward Foreign Language Education in the 1800’s
In this section, the author explored factors that relate to the education of foreign
languages during the 1800’s. One of the factors that could have impacted foreign language
education during this time period was the purchase of the Louisiana Territory from France by
President Thomas Jefferson in 1803. The impact that this purchase could have had in foreign
language education could be a result of the size of the purchased land, from the Canadian border
to the mouth of the Mississippi River. The purchased territory possessed a French heritage prior
to the purchase.
4.2.1 U.S. immigration in the 1800’s
To study this period the author used data recommended by John Simansky of the Office
of Immigration Statistics.38 This data covered the period from 1820 to 1899. The following
tables and graphs show immigration patterns during this time frame. The first table and graph
reference immigration patterns from Europe, Asia, Africa, and America. The second table and
graph illustrate specific immigration patterns from Germany, France, Cuba, and Mexico, the
38 For more information about the data on immigration between 1820 and 2006, see the 2006 Yearbook of
Immigration Statistics at http://www.dhs.gov/xlibrary/assets/statistics/yearbook/2006/OIS_2006_Yearbook.pdf and
for additional information on immigration, see Appendix B.
73
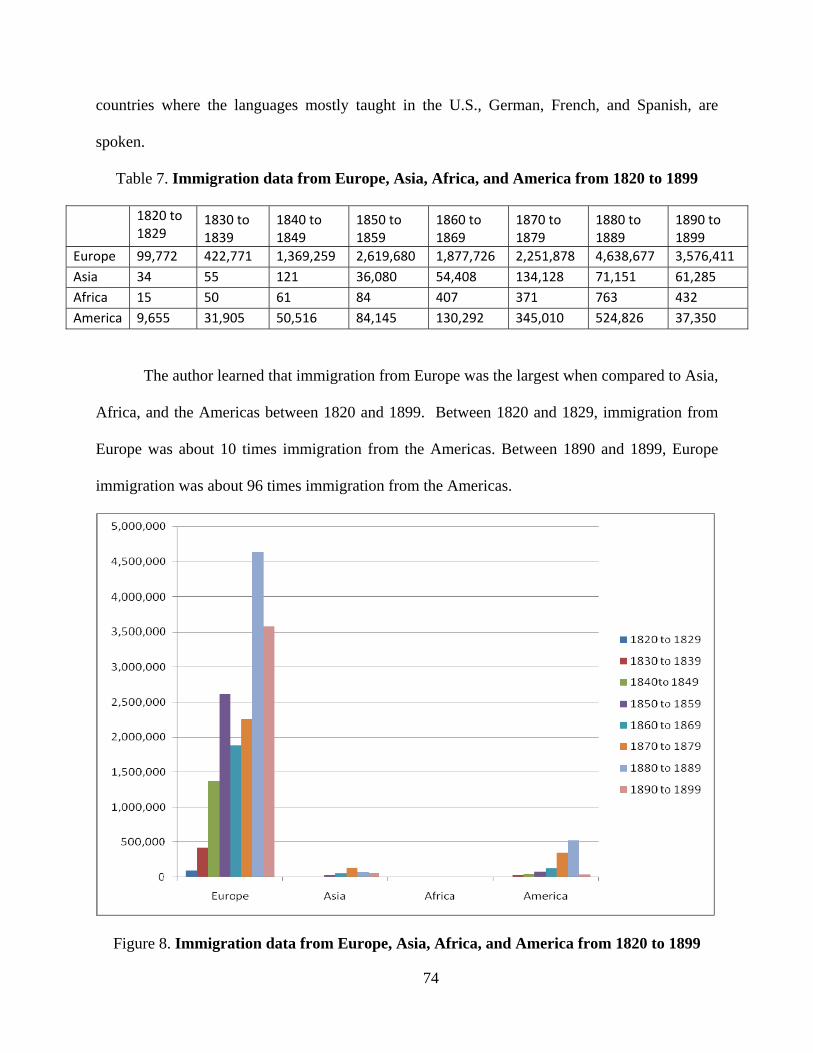
countries where the languages mostly taught in the U.S., German, French, and Spanish, are
spoken.
Table 7. Immigration data from Europe, Asia, Africa, and America from 1820 to 1899
1820 to 1829
1830 to 1839
1840 to 1849
1850 to 1859
1860 to 1869
1870 to 1879
1880 to 1889
1890 to 1899
Europe 99,772 422,771 1,369,259 2,619,680 1,877,726 2,251,878 4,638,677 3,576,411 Asia 34 55 121 36,080 54,408 134,128 71,151 61,285 Africa 15 50 61 84 407 371 763 432 America 9,655 31,905 50,516 84,145 130,292 345,010 524,826 37,350
The author learned that immigration from Europe was the largest when compared to Asia,
Africa, and the Americas between 1820 and 1899. Between 1820 and 1829, immigration from
Europe was about 10 times immigration from the Americas. Between 1890 and 1899, Europe
immigration was about 96 times immigration from the Americas.
Figure 8. Immigration data from Europe, Asia, Africa, and America from 1820 to 1899
74
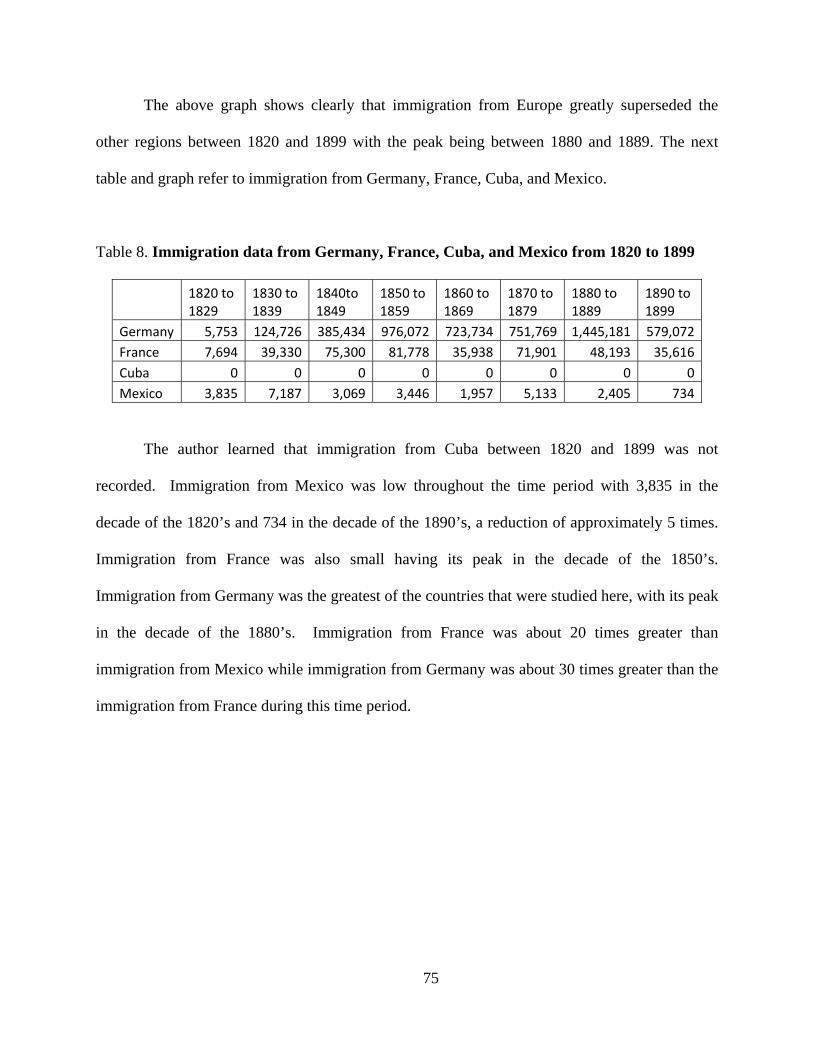
The above graph shows clearly that immigration from Europe greatly superseded the
other regions between 1820 and 1899 with the peak being between 1880 and 1889. The next
table and graph refer to immigration from Germany, France, Cuba, and Mexico.
Table 8. Immigration data from Germany, France, Cuba, and Mexico from 1820 to 1899
1820 to 1829
1830 to 1839
1840to 1849
1850 to 1859
1860 to 1869
1870 to 1879
1880 to 1889
1890 to 1899
Germany 5,753 124,726 385,434 976,072 723,734 751,769 1,445,181 579,072France 7,694 39,330 75,300 81,778 35,938 71,901 48,193 35,616Cuba 0 0 0 0 0 0 0 0Mexico 3,835 7,187 3,069 3,446 1,957 5,133 2,405 734
The author learned that immigration from Cuba between 1820 and 1899 was not
recorded. Immigration from Mexico was low throughout the time period with 3,835 in the
decade of the 1820’s and 734 in the decade of the 1890’s, a reduction of approximately 5 times.
Immigration from France was also small having its peak in the decade of the 1850’s.
Immigration from Germany was the greatest of the countries that were studied here, with its peak
in the decade of the 1880’s. Immigration from France was about 20 times greater than
immigration from Mexico while immigration from Germany was about 30 times greater than the
immigration from France during this time period.
75
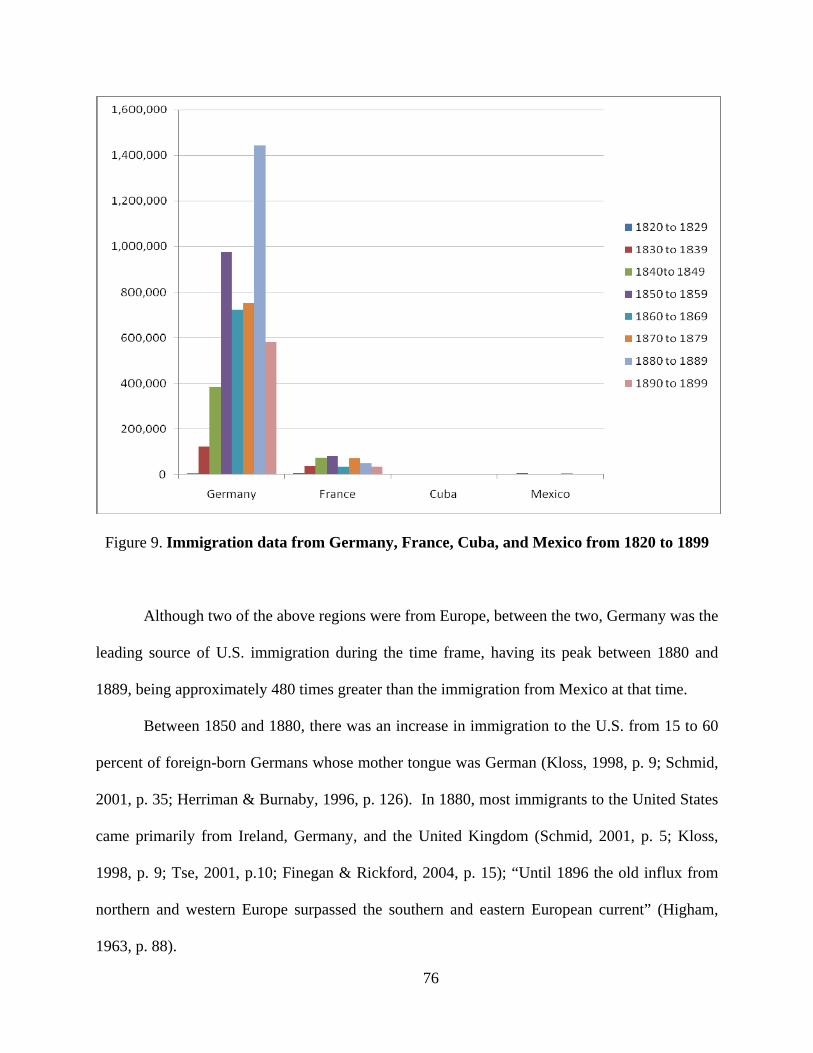
Figure 9. Immigration data from Germany, France, Cuba, and Mexico from 1820 to 1899
Although two of the above regions were from Europe, between the two, Germany was the
leading source of U.S. immigration during the time frame, having its peak between 1880 and
1889, being approximately 480 times greater than the immigration from Mexico at that time.
Between 1850 and 1880, there was an increase in immigration to the U.S. from 15 to 60
percent of foreign-born Germans whose mother tongue was German (Kloss, 1998, p. 9; Schmid,
2001, p. 35; Herriman & Burnaby, 1996, p. 126). In 1880, most immigrants to the United States
came primarily from Ireland, Germany, and the United Kingdom (Schmid, 2001, p. 5; Kloss,
1998, p. 9; Tse, 2001, p.10; Finegan & Rickford, 2004, p. 15); “Until 1896 the old influx from
northern and western Europe surpassed the southern and eastern European current” (Higham,
1963, p. 88).
76
By this time, at the end of the 1800’s, some Americans were attempting to halt
immigration. An outcome from this effort can be seen in 1887, when an English-speaking
requirement was imposed on coal miners in the state of Pennsylvania (Crawford, 2000, p. 20);
and when only three years later, in 1890, William A. Stone, a Congressman from Pennsylvania,
lobbied for a $20 tax on all immigrants (Higham, 1963, p. 101). Finally, at the end of the
century, in 1897 Henry Cabot Lodge attempted to cut down immigration by reintroducing the
Immigration Restriction League’s literacy bill (Higham, 1963, p. 106), which required
immigrants to be able to read and write in their own native language.
4.2.2 Foreign language instruction in the 1800’s
Education in the German language was supported by some U.S. politicians in 1839.
President Van Buren and the governors of Ohio and Pennsylvania made financial contributions
to the establishment of a teacher’s seminary. This contribution was a response to a request made
by the general school commissioner of the Germans in the United States (Kloss, 1998, p. 31). At
the same time Ohio became the first state to pass laws authorizing education in German and
English, when parents requested it (Crawford, 2000, p. 20; Kloss, 1998, p. 31).
In the 1840’s the German language was gaining momentum. Article 132 of the 1845
U.S. Constitution read that the constitution of Louisiana was to be promulgated in English and
French (Kloss, 1998, p. 140). Nonetheless, in 1847, a new Louisiana law to educate in German
77
instead of French was put into place; the “law that simply substituted ‘French’ for ‘German’”
(Crawford, 2000, p. 20; Kloss, 1998, p. 140).
Between 1850 and 1880, some Americans organized to halt education in the German
language. Such an organization was the American Protective Association, APA. This
organization was born in 1887, in Clinton, Iowa, as a result of efforts by Henry F. Bowers, the
director of the largest manufacturing center in the state of Iowa. The APA helped end the
teaching of German throughout the country (Herriman & Burnaby, 1996, p. 133; Schmid, 2001,
p. 36).
In 1896, the Commissioner of the Common Schools of New York expressed his irritation
toward foreigners (Simon, 1980):
I consider it the paramount duty of public schools, apart from the educational knowledge
to be instilled into our pupils, to form American citizens of them . . . obliterating from the
very earliest moment of all distinguishing foreign characteristics and traits, which the
beginners may bring with them, as obstructive, warring, and irritating elements. (p. 11)
One may not ignore that the languages spoken by the immigrant population is inherently one of
their traits. The attitude expressed by the Commissioner of the Common Schools of New York
toward foreign language education was also shared by immigrant families, as noted by Simon
(1980):
. . . Italian, German, Armenian, Japanese, Nigerian, and other immigrants to be
“American” in their attitude, culture, and citizenship. A heavily accented English, or
78
strange clothing, or habits that did not fit completely into this new world were
“deficiencies” they wanted their children to avoid. Their children went to school to
become Americans. To promote this transition, the parents sometimes refused to speak
their native tongue around their children; and the children were sometimes embarrassed if
they did, and demanded that they speak in English. The last thing most of these parents
wanted their children to learn in school was a foreign language. If someone asks the son
of Italian immigrants if he speaks Italian, he will often deny it. (p. 12)
The literature points out that whereas in the beginning of the 1800’s foreign language education
was well accepted by American citizens, this acceptance changed at the end of the century.
4.2.3 Federal funding for foreign language instruction in the 1800’s
In 1839, President Van Buren and the governors of Ohio and Pennsylvania contributed to
the funding of a German’s teacher’s seminary (Kloss, 1998, p. 31).
Although the author could not find any government records related to funding
appropriation for foreign language education during the 1800’s, she took the liberty to state that
foreign language education was being funded, since education in the German language was
offered when parents requested it (Crawford, 2000, p. 20; Kloss, 1998, p. 31).
79
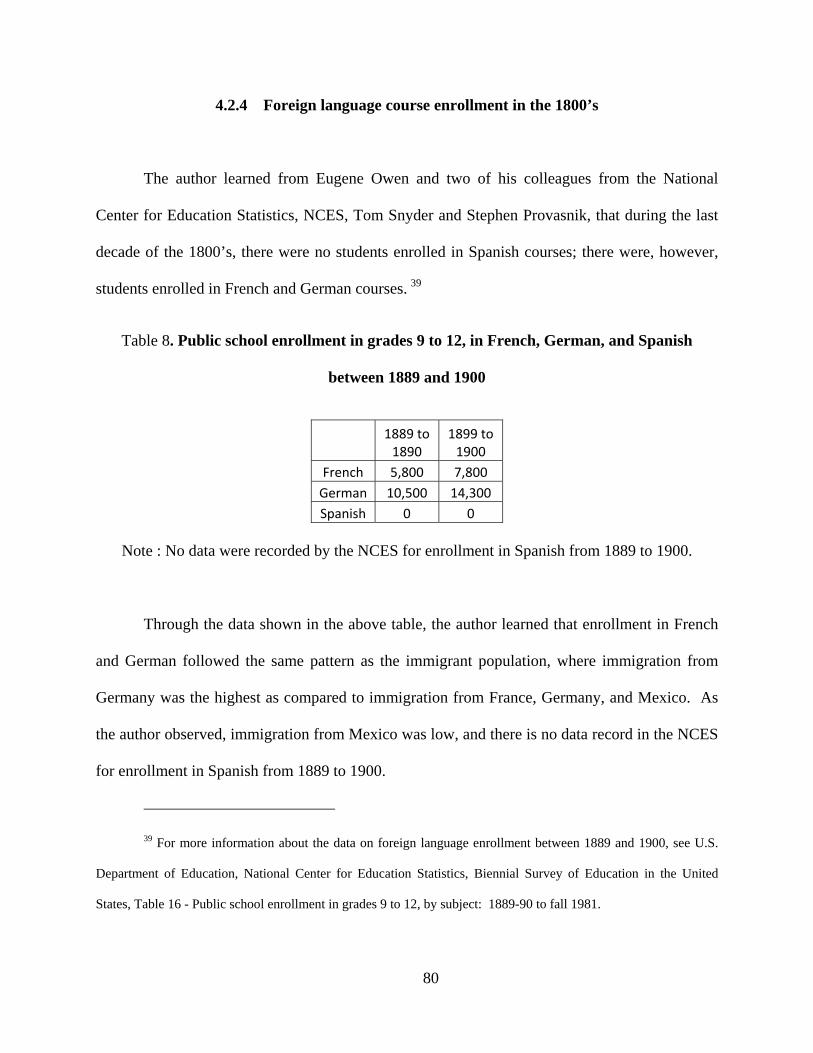
4.2.4 Foreign language course enrollment in the 1800’s
The author learned from Eugene Owen and two of his colleagues from the National
Center for Education Statistics, NCES, Tom Snyder and Stephen Provasnik, that during the last
decade of the 1800’s, there were no students enrolled in Spanish courses; there were, however,
students enrolled in French and German courses. 39
Table 8. Public school enrollment in grades 9 to 12, in French, German, and Spanish
between 1889 and 1900
1889 to 1890
1899 to 1900
French 5,800 7,800 German 10,500 14,300 Spanish 0 0
Note : No data were recorded by the NCES for enrollment in Spanish from 1889 to 1900.
Through the data shown in the above table, the author learned that enrollment in French
and German followed the same pattern as the immigrant population, where immigration from
Germany was the highest as compared to immigration from France, Germany, and Mexico. As
the author observed, immigration from Mexico was low, and there is no data record in the NCES
for enrollment in Spanish from 1889 to 1900.
39 For more information about the data on foreign language enrollment between 1889 and 1900, see U.S.
Department of Education, National Center for Education Statistics, Biennial Survey of Education in the United
States, Table 16 - Public school enrollment in grades 9 to 12, by subject: 1889-90 to fall 1981.
80
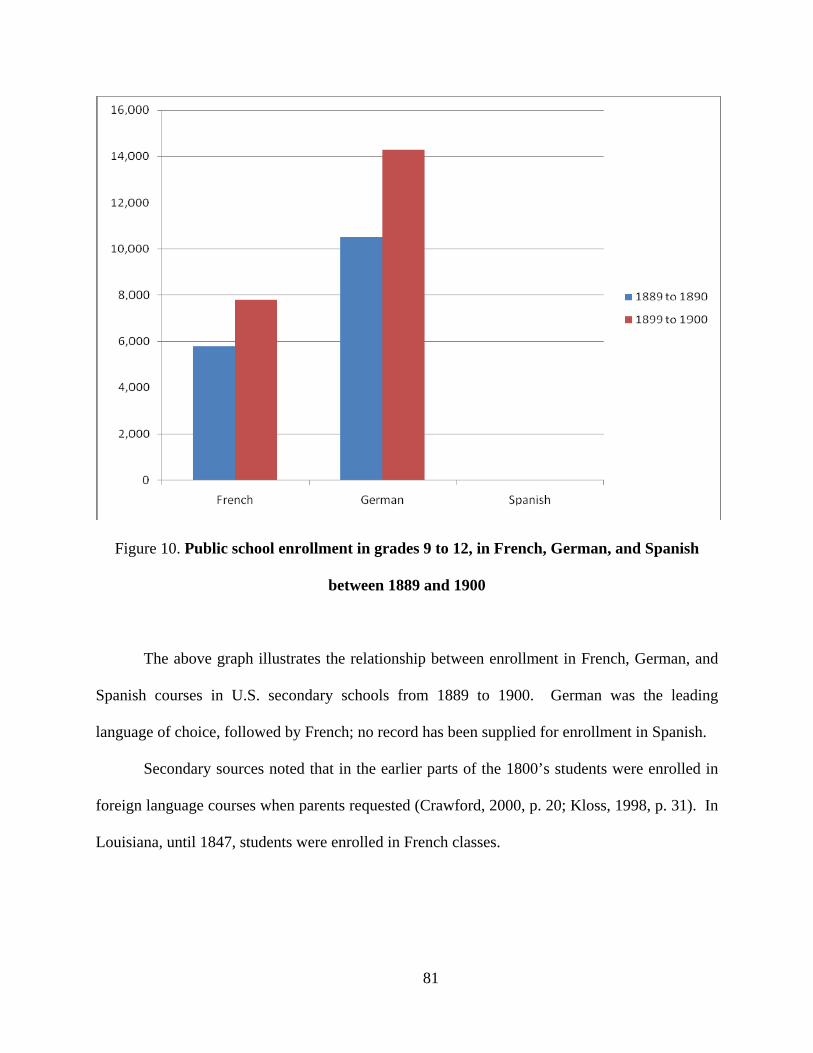
Figure 10. Public school enrollment in grades 9 to 12, in French, German, and Spanish
between 1889 and 1900
The above graph illustrates the relationship between enrollment in French, German, and
Spanish courses in U.S. secondary schools from 1889 to 1900. German was the leading
language of choice, followed by French; no record has been supplied for enrollment in Spanish.
Secondary sources noted that in the earlier parts of the 1800’s students were enrolled in
foreign language courses when parents requested (Crawford, 2000, p. 20; Kloss, 1998, p. 31). In
Louisiana, until 1847, students were enrolled in French classes.
81
Simon (1980, p. 14), wrote that at the end of the century, there were students enrolled in
foreign language classes. In 1895, three thousand students enrolled in French courses and
twenty-three thousand students enrolled in German courses at the elementary level.
4.2.5 Summary of the 1800’s
The author learned that immigration records existed in 1820 but foreign language
enrollment records were not available until 1889, according to the NCES. Concerning
immigration distribution, the author learned that among Europe, Asia, Africa, and the Americas,
the greatest number of immigrants during the 1800’s were from Europe. The author also learned
that among Germany, France, Cuba, and Mexico, German was as the highest source of
immigrants into the U.S., with approximately 480 times the number of immigration from Mexico
between 1880 and 1889.
The author learned that education in the language of the immigrant community was not
uncommon. She also learned that by the end of the century, the Commissioner of the Common
Schools of New York was irritated by the traits exhibited by the foreign population (Simon,
1980, p. 11). This view was frequently shared by parents who guided their children to abandon
their language of origin.
82
4.3 American Attitude Toward Foreign Language Education in the 1900’s
In this section, the author explored factors that related to foreign language education
during the 1900’s. The 20th century experienced many global conflicts, such as WWI (1914) and
WWII (1941). To counter these wars, two organizations were created, the League of Nations
(1918-1940) and the United Nations, UN (1945). Another conflict that impacted the United
States during this time period was the launch of Sputnik by the Soviet Union, which resulted in
the U.S. Congress implementing the National Defense Education Act, NDEA, in 1958. 40
4.3.1 U.S. immigration in the 1900’s
The author chose to use data from the Office of Immigration Statistics41 in this section, to
give continuity to the previous section, which discussed immigration data in the 1800’s.
The first table and graph refer to U.S. immigration data from four world regions, Europe,
Asia, Africa, and the Americas. The time frame is from 1900 to 1999, divided into 10 decades.
40 For more information about the National Defense Education Act passed in 1958 see http://www.nsf.gov-
/pubs/stis1994/nsf8816/nsf8816.txt
41 For more information about the data on immigration between 1820 and 2006, see the 2006 Yearbook of
Immigration Statistics at http://www.dhs.gov/xlibrary/assets/statistics/yearbook/2006/OIS_2006_Yearbook.pdf and
for additional information on immigration, see Appendix B.
83
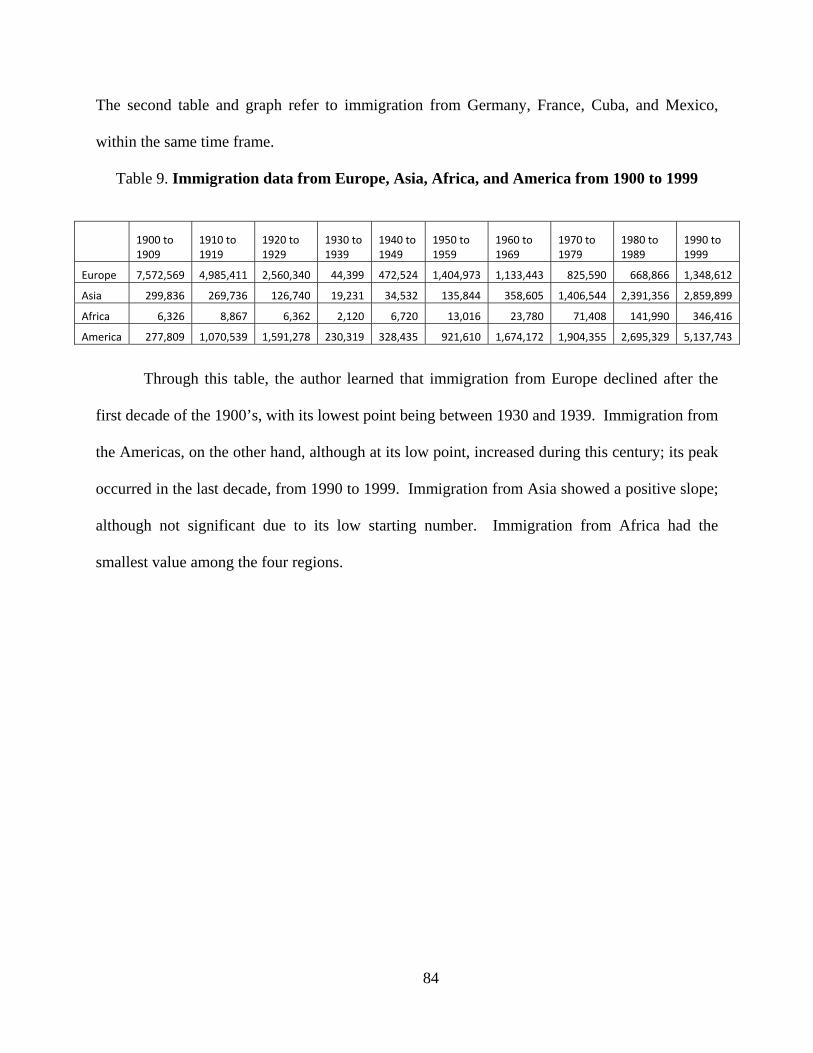
The second table and graph refer to immigration from Germany, France, Cuba, and Mexico,
within the same time frame.
Table 9. Immigration data from Europe, Asia, Africa, and America from 1900 to 1999
1900 to 1909
1910 to 1919
1920 to 1929
1930 to 1939
1940 to 1949
1950 to 1959
1960 to 1969
1970 to 1979
1980 to 1989
1990 to 1999
Europe 7,572,569 4,985,411 2,560,340 44,399 472,524 1,404,973 1,133,443 825,590 668,866 1,348,612
Asia 299,836 269,736 126,740 19,231 34,532 135,844 358,605 1,406,544 2,391,356 2,859,899
Africa 6,326 8,867 6,362 2,120 6,720 13,016 23,780 71,408 141,990 346,416
America 277,809 1,070,539 1,591,278 230,319 328,435 921,610 1,674,172 1,904,355 2,695,329 5,137,743
Through this table, the author learned that immigration from Europe declined after the
first decade of the 1900’s, with its lowest point being between 1930 and 1939. Immigration from
the Americas, on the other hand, although at its low point, increased during this century; its peak
occurred in the last decade, from 1990 to 1999. Immigration from Asia showed a positive slope;
although not significant due to its low starting number. Immigration from Africa had the
smallest value among the four regions.
84
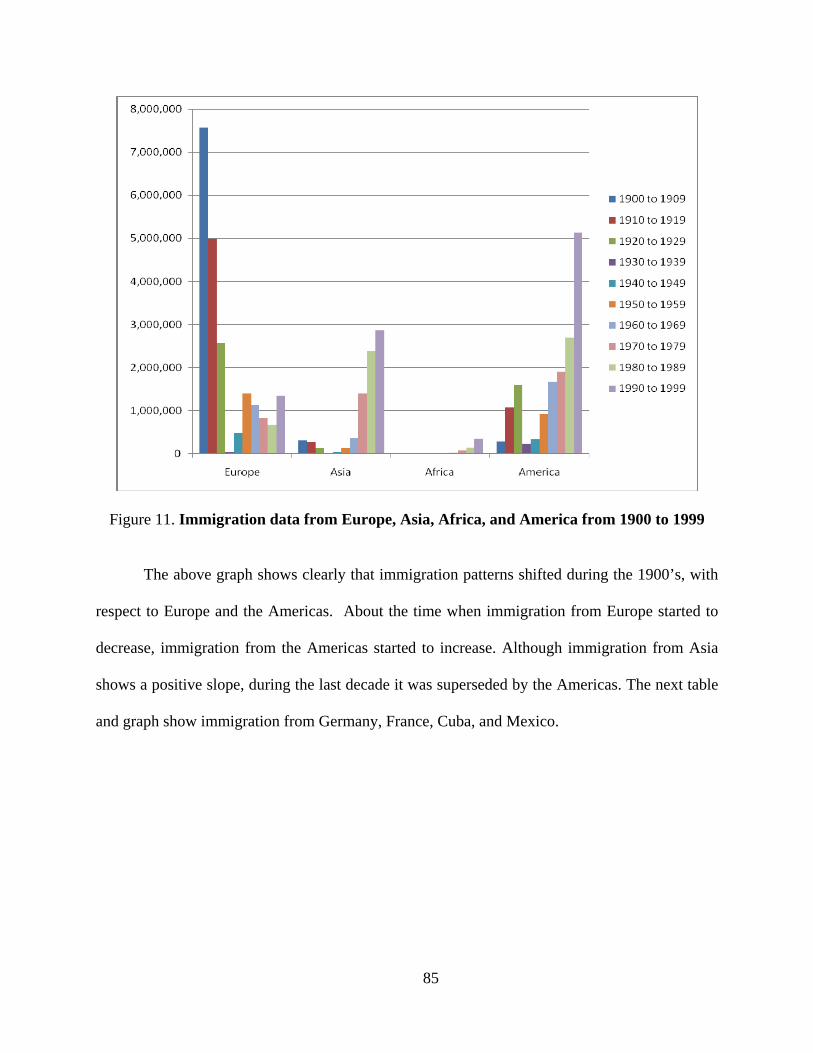
Figure 11. Immigration data from Europe, Asia, Africa, and America from 1900 to 1999
The above graph shows clearly that immigration patterns shifted during the 1900’s, with
respect to Europe and the Americas. About the time when immigration from Europe started to
decrease, immigration from the Americas started to increase. Although immigration from Asia
shows a positive slope, during the last decade it was superseded by the Americas. The next table
and graph show immigration from Germany, France, Cuba, and Mexico.
85
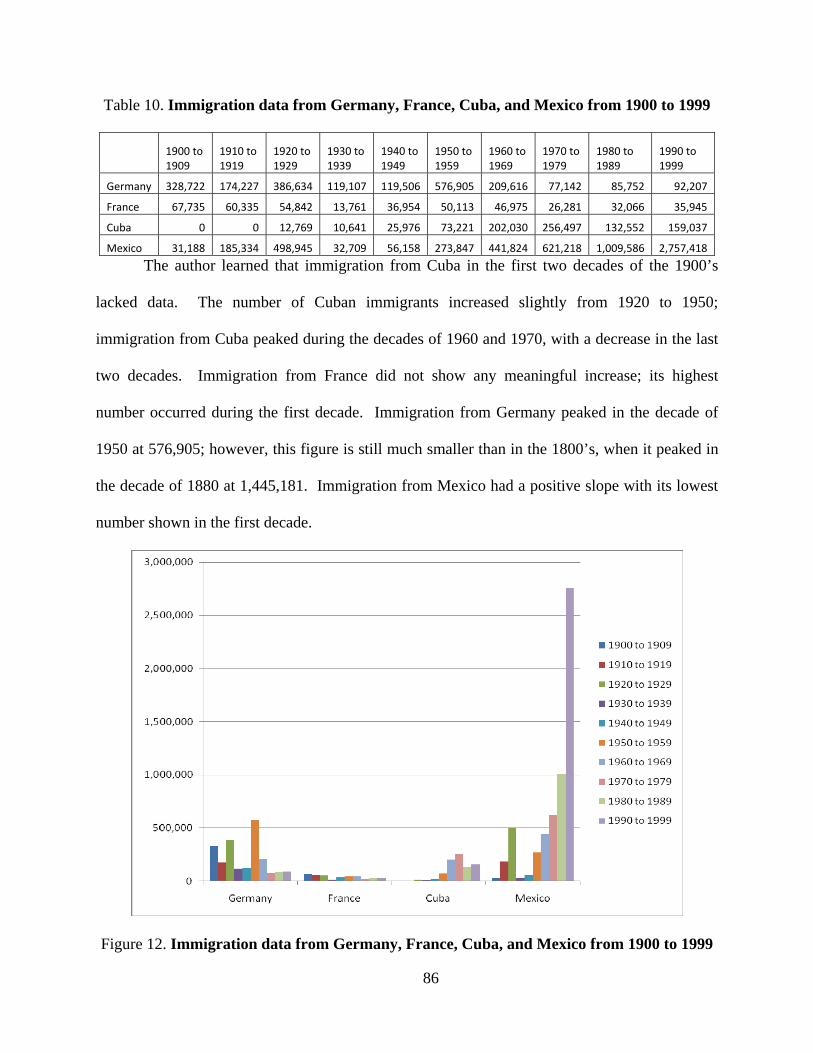
Table 10. Immigration data from Germany, France, Cuba, and Mexico from 1900 to 1999
1900 to 1909
1910 to 1919
1920 to 1929
1930 to 1939
1940 to 1949
1950 to 1959
1960 to 1969
1970 to 1979
1980 to 1989
1990 to 1999
Germany 328,722 174,227 386,634 119,107 119,506 576,905 209,616 77,142 85,752 92,207
France 67,735 60,335 54,842 13,761 36,954 50,113 46,975 26,281 32,066 35,945
Cuba 0 0 12,769 10,641 25,976 73,221 202,030 256,497 132,552 159,037
Mexico 31,188 185,334 498,945 32,709 56,158 273,847 441,824 621,218 1,009,586 2,757,418
The author learned that immigration from Cuba in the first two decades of the 1900’s
lacked data. The number of Cuban immigrants increased slightly from 1920 to 1950;
immigration from Cuba peaked during the decades of 1960 and 1970, with a decrease in the last
two decades. Immigration from France did not show any meaningful increase; its highest
number occurred during the first decade. Immigration from Germany peaked in the decade of
1950 at 576,905; however, this figure is still much smaller than in the 1800’s, when it peaked in
the decade of 1880 at 1,445,181. Immigration from Mexico had a positive slope with its lowest
number shown in the first decade.
Figure 12. Immigration data from Germany, France, Cuba, and Mexico from 1900 to 1999
86
Immigration from Germany in the 1900’s was reduced drastically compared to
immigration in the 1800’s. Immigration from France also declined. Immigration from Cuba
rose slightly in the decades of 1960 and 1970, after the Cuban crisis. Immigration from Mexico
peaked dramatically in the last decade, 1990 to 1999. It grew about 88 times from 1900 to 1999.
Based on secondary sources, the author learned that during the 1900’s there was a
movement to reduce immigration into the United States. This movement continued from the late
1800’s. Such an example happened in 1905, when Edward W. Bemis recommended to the U.S.
Commission on Naturalization that all immigrants had to be able to sign their names and to speak
English to the satisfaction of a naturalization examiner. Bemis recommendation was included in
the Naturalization Act of 1906 (Crawford, 1992b, p. 106).
During the second decade of the 1900’s, immigration reduction was being organized by
means of taxation and language imposition. In 1918, an economic imposition was forced on
nonresident aliens, who had their income tax rates doubled under the Revenue Act (Schmid,
2001, p. 35; Higham, 1963, p. 249). In 1919, the city council of Findlay, Ohio imposed a tax of
$25 for speaking German in the streets (Schmid, 2001, p. 36; Kloss, 1998, p. 61), while in 1920,
California law mandated that all foreigners pay a special poll tax of $10.20 (Higham, 1963, p.
260; Schmid, 2001, p. 35).
In 1924 the Johnson-Laird Immigration Act, following a period of large-scale
immigration, prompted an interest in the then developed I.Q. testing. The objective of this Act
was to establish national origin quotas, which “was to restrict the number and racial distribution
of immigrants” until 1965 when the quota system was abandoned (Herriman & Burnaby, 1996,
p. 136).
87
Immigration into the U.S. from Cuba rose in the late 1950’s when Cuban went through a
political crisis; it may be assumed that the choice to migrate to the U.S. was based on its
proximity to Cuba. The crisis induced an influx of Cuban refugees, who intended to return to
their country of origin when the crisis passed (Finegan & Rickford, 2004, p. 342). This Cuban
political crisis was felt in the United States in the early 1960’s when thousands of refugees fled
Cuba after Fidel Castro’s revolution in 1959. These refugees ended up in Florida.
4.3.2 Foreign language instruction in the 1900’s
The author learned that in the 1900’s, many U.S. states were dealing with the issue of
language. Inequities existed among states when it came to choosing English-only or English
plus another language. For instance, in 1912, New Mexico had two official languages, English
and Spanish; in 1919, English was the official language of Nebraska; in 1978, English and
Native Hawaiian were the official languages of Hawaii; in 1988, English was the official
language of Colorado and Florida. In 1919, Ohio governor, James Cox, proposed a law to
abolish all instruction in German in the state (Schmid, 2001). Ohio was not the only state where
instruction in foreign language was prohibited at the time.
In 1915, most immigrants urged their children to master both English and to retain their
home language as well (Schmidt, Sr., 2000, p.1); 36 percent of American high school students
88
were studying a modern foreign language (Simon, 1980, p. 2). In the same year, 85 percent of
the nation’s colleges required that students pass a competency test in a foreign language before
they were accepted into the institution (Simon, 1980, p. 3).
In 1919, Nebraska was declared to be an English-only state. Due to its status, education
in other languages was forbidden, based on the Nebraska statute that claimed that no person,
individually or as a teacher, shall, in any private denominational, parochial, or public school
teach any subject to any person in any language other than the English language (Higham, 1963,
p. 260; Crawford, 1992b, p. 89; Kloss, 1998, p. 62). This position taken in the state of Nebraska,
in which education in a foreign language was forbidden, resulted in a lawsuit that went all the
way to the United States Supreme Court in 1923. Meyer v. Nebraska42 overturned the 1919
Nebraska statute that forbade education in a language other than English, “The Court might have
ruled differently had German not been singled out as a restricted language” (Herriman &
Burnaby, 1996, p. 134). Two Supreme Court Justices, Holmes and Sutherland concluded
(Leibowitz, 1971):
We all agree, I take it, that it is desirable that all the citizens of the United States should
speak a common tongue, and therefore, that the end aimed at by the statute is a lawful
and proper one . . . I cannot bring my mind to believe that in some circumstances . . . the
42 MEYER v. STATE OF NEBRASKA, 262 U.S. 390, No. 325, was argued Feb. 23, 1923, and was
decided June 4, 1923. for more information see http://caselaw.lp.findlaw.com/scripts/getcase.pl?-
court=US=262&invol=390
89
statute might not be regarded as a reasonable or even necessary method of reaching the
desired result. (p. 10)
Through Meyer v. Nebraska, the Supreme Court ruled that the state’s ability to prohibit
education in a foreign language was in violation of the Fourteenth Amendment to the U.S.
Constitution and overstepped the state’s authority (Schmidt Sr., 2000, p. 147; Schmid, 2001, p.
59; Crawford, 2000, p. 98; Kloss, 1998, p. 89).
While Conant (1959, p. 42) was recommending that foreign language education be
moved to the lower grades, Florida was facing a major problem with educating students in a
foreign language. In the early 1960’s, Dade County faced the problem of educating Spanish-
monolingual children of Cuban refugees. Texas was faced with the same problem during the
next decade. In the 1970’s, the Spanish-speaking student population was greatest of the non-
English-speaking student groups. Simon (1980, p. 156) reported that in Texas, there were
247,000 high school students, who spoke fifty-one dialects and languages. Of that total, 240,000
spoke Spanish, while only 7,000 did not.
In 1978, American students, that is, English-speaking students, were afforded the
opportunity to learn a foreign language by means of bilingual education, through which students
would learn content in two languages, English and a foreign language43 (San Miguel, Jr., 2004,
p. 30).
By the end of the 1900’s, Brecht & Walton (Mar., 1994), suggested, “A rapidly changing
world order has prompted renewed interest in providing a national capacity for dealing with
43 For more information about the two-way bilingual education program see http://www.ncela.gwu.edu/-
pubs/ncrcdsll/epr12/index.htm
90
languages and cultures beyond those of Western Europe” (p. 190). In particular, much recent
attention has been directed toward strengthening instruction in the less commonly taught
languages. Some of these languages, according to the National Security Language Initiative, as
reported by ACTFL, are Arabic, Chinese, Russian, Hindi, and Farsi. 44
4.3.3 Federal funding for foreign language instruction in the 1900’s
The author learned from Ashley Lenker, program associate of the Joint National
Committee for Languages and the National Council for Languages and International Studies,
JNCL-NCLIS, that there were no governmental records of funding for foreign language in the
1900’s. Therefore, the author relied on some secondary sources to address this topic.
One major fund for foreign language education during the 1900’s has been addressed by
Friel (2001); the National Defense Education Act of 1958, which declared foreign language as
one of the critical subjects. Funding for education tripled in the fiscal year 1959.
44 For more information about the Less Commonly Taught Languages see the American Council on the
Teaching of Foreign Languages http://www.actfl.org
91
Another source of funding was proposed by Representative Rush Holt (D-NJ), with an
amendment to the Higher Education Act of 1965 (HEA). 45 This bill included grants for foreign
language education at all levels of education, elementary to college.
In 1991, the Senate Intelligence Committee established a $150 million National Security
Educational Fund to improve college programs in foreign languages and international studies
(Crawford, 192a, p. 253). In 1993, President Clinton’s administration provided funding to four
national language organizations to develop national standards in foreign language. These
standards were issued in 1996. At the end of President Clinton’s term, about $69.7 million was
appropriated to fund International Education and Foreign Language Studies.
4.3.4 Foreign language course enrollment in the 1900’s
The author chose to use data from the Office of Immigration Statistics46 in this section, to
give continuity to the previous section, which discussed immigration data in the 1800’s. The
table and graph below show that enrollment in U.S. public secondary school foreign language
45 H. R. 3676 – National Security Language Act (Dec. 8, 2003). Referred to the House Subcommittee on
Select Education.
46 For more information about the data on immigration between 1820 and 2006, see the 2006 Yearbook of
Immigration Statistics at http://www.dhs.gov/xlibrary/assets/statistics/yearbook/2006/OIS_2006_Yearbook.pdf and
for additional information on immigration, see Appendix B.
92
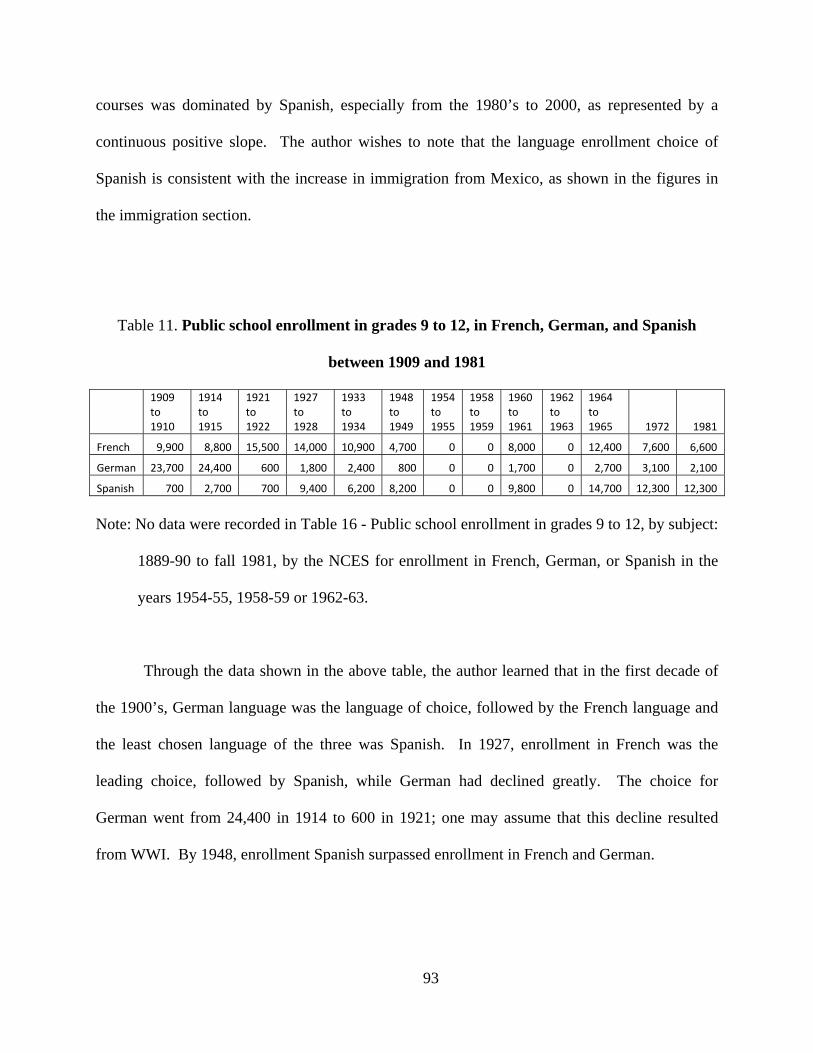
courses was dominated by Spanish, especially from the 1980’s to 2000, as represented by a
continuous positive slope. The author wishes to note that the language enrollment choice of
Spanish is consistent with the increase in immigration from Mexico, as shown in the figures in
the immigration section.
Table 11. Public school enrollment in grades 9 to 12, in French, German, and Spanish
between 1909 and 1981
1909 to 1910
1914 to 1915
1921 to 1922
1927 to 1928
1933 to 1934
1948 to 1949
1954 to 1955
1958 to 1959
1960 to 1961
1962 to 1963
1964 to 1965 1972 1981
French 9,900 8,800 15,500 14,000 10,900 4,700 0 0 8,000 0 12,400 7,600 6,600
German 23,700 24,400 600 1,800 2,400 800 0 0 1,700 0 2,700 3,100 2,100
Spanish 700 2,700 700 9,400 6,200 8,200 0 0 9,800 0 14,700 12,300 12,300
Note: No data were recorded in Table 16 - Public school enrollment in grades 9 to 12, by subject:
1889-90 to fall 1981, by the NCES for enrollment in French, German, or Spanish in the
years 1954-55, 1958-59 or 1962-63.
Through the data shown in the above table, the author learned that in the first decade of
the 1900’s, German language was the language of choice, followed by the French language and
the least chosen language of the three was Spanish. In 1927, enrollment in French was the
leading choice, followed by Spanish, while German had declined greatly. The choice for
German went from 24,400 in 1914 to 600 in 1921; one may assume that this decline resulted
from WWI. By 1948, enrollment Spanish surpassed enrollment in French and German.
93
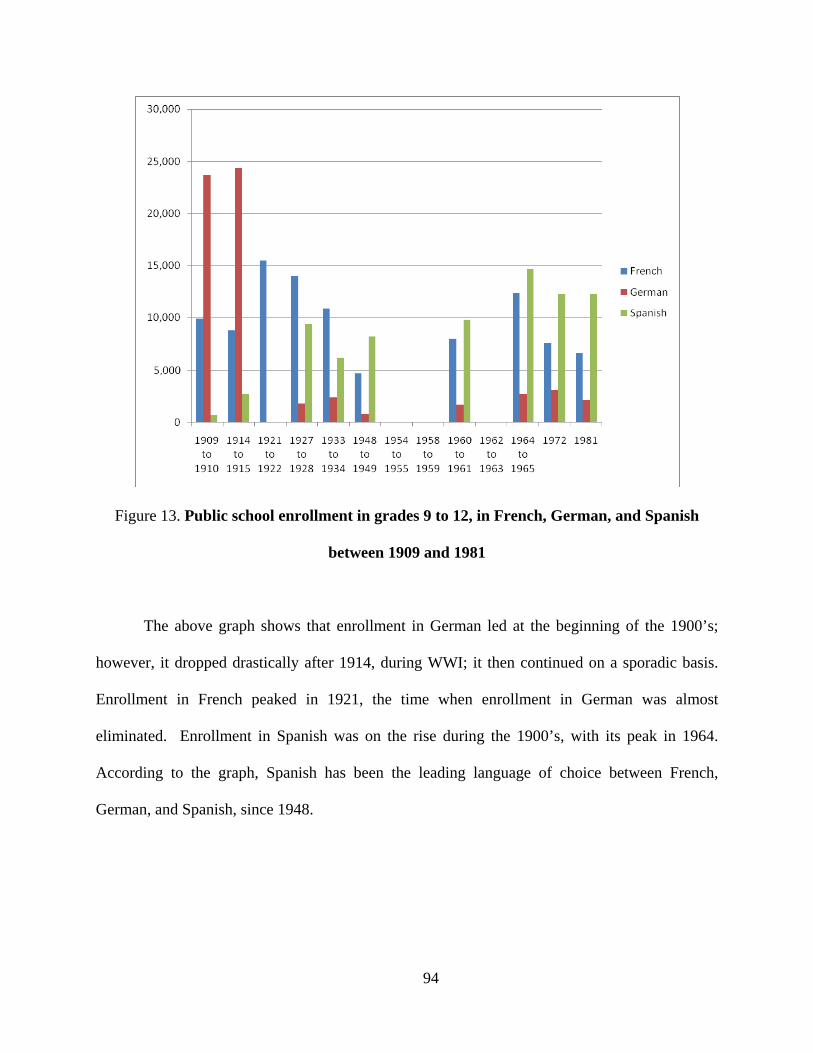
Figure 13. Public school enrollment in grades 9 to 12, in French, German, and Spanish
between 1909 and 1981
The above graph shows that enrollment in German led at the beginning of the 1900’s;
however, it dropped drastically after 1914, during WWI; it then continued on a sporadic basis.
Enrollment in French peaked in 1921, the time when enrollment in German was almost
eliminated. Enrollment in Spanish was on the rise during the 1900’s, with its peak in 1964.
According to the graph, Spanish has been the leading language of choice between French,
German, and Spanish, since 1948.
94
4.3.5 Summary of the 1900’s
The author learned that immigration records show a drastic reduction in the number of
immigrants from Europe, especially from Germany. Immigration from Cuba rose slightly in the
decades of 1960 and 1970, after the period of the Cuban crisis. Immigration from Mexico
peaked dramatically in the last decade, 1990 to 1999.
The author learned that foreign language course enrollment seemed to have followed
immigration patterns in the 1900’s. The choice for the German language was the highest until
1914, almost disappearing after WWI, when French became the leading choice. In 1948,
however, Spanish gained and maintained the lead until 1981, based on the data shown by the
NCES Table 16 - Public school enrollment in grades 9 to 12, by subject: 1889-90 to fall 1981.
Based on the data shown in the NCES Table 55, 2005 and on the data provided by the
American Council on the Teaching of Foreign Languages, ACTFL (see Appendix D), Spanish
has been the leading foreign language of choice in grades 9 through 12 from 1948 to 2000,
French being the second and German the last choice among the three. According to the NCES
Table 11 and Welles (2004) (see Appendix D), the same trend is shown at the college level, with
Spanish not only being the leading choice, but with an increasing gap between the second and
third choices, French and German.
The author also learned that during the 1900’s, while foreigners were being oppressed by
means of taxation based on immigrant status, there was a movement to push for English-only
instruction, which ended-up reaching the United States Supreme Court in 1923, Meyer v.
Nebraska, with a resolution in favor of the immigrants, based on usage of the German language
for instruction.
95

The author also learned that by the end of the 1900’s a movement in education in the less
commonly taught languages started to emerge. Some of these languages are Arabic, Chinese,
Russian, Hindi, and Farsi.
96
4.4 American Attitude Toward Foreign Language Education in the 2000’s
In this section, the author explored factors that relate to foreign language education
during the 2000’s. Although the time period for this study is less than one full decade, it is the
decade within which the United States suffered one of the most horrific events of its existence,
the 9/11 attack. As a result of this attack inside U.S. borders in 2001, some lobbyists for foreign
language education are suggesting that the nation’s educational institutions need to address
education in the languages that are critical to U.S. national security (Friel, 2001), such as Arabic,
Chinese, Russian, Hindi, and Farsi, according to ACTFL 47
4.4.1 U.S. immigration in the 2000’s
The author chose to use data from the Office of Immigration Statistics48 in this section, to
give continuity to the previous section, which discussed immigration data in the 1900’s. The next
table and graph refer to immigration from Europe, Asia, Africa, and the Americas from 2000 to
2006.
47 For more information about the Less Commonly Taught Languages see the American Council on the
Teaching of Foreign Languages http://www.actfl.org
48 For more information about the data on immigration between 1820 and 2006, see the 2006 Yearbook of
Immigration Statistics at http://www.dhs.gov/xlibrary/assets/statistics/yearbook/2006/OIS_2006_Yearbook.pdf and
for additional information on immigration, see Appendix B.
97
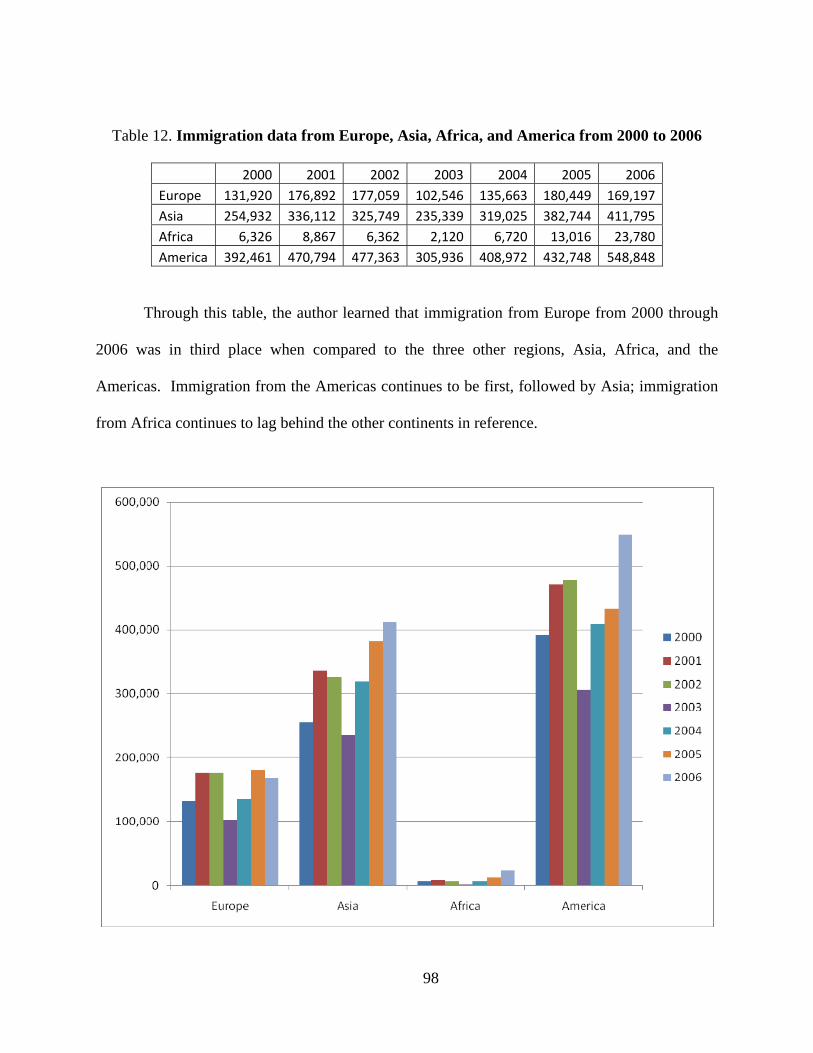
Table 12. Immigration data from Europe, Asia, Africa, and America from 2000 to 2006
2000 2001 2002 2003 2004 2005 2006Europe 131,920 176,892 177,059 102,546 135,663 180,449 169,197Asia 254,932 336,112 325,749 235,339 319,025 382,744 411,795Africa 6,326 8,867 6,362 2,120 6,720 13,016 23,780America 392,461 470,794 477,363 305,936 408,972 432,748 548,848
Through this table, the author learned that immigration from Europe from 2000 through
2006 was in third place when compared to the three other regions, Asia, Africa, and the
Americas. Immigration from the Americas continues to be first, followed by Asia; immigration
from Africa continues to lag behind the other continents in reference.
98
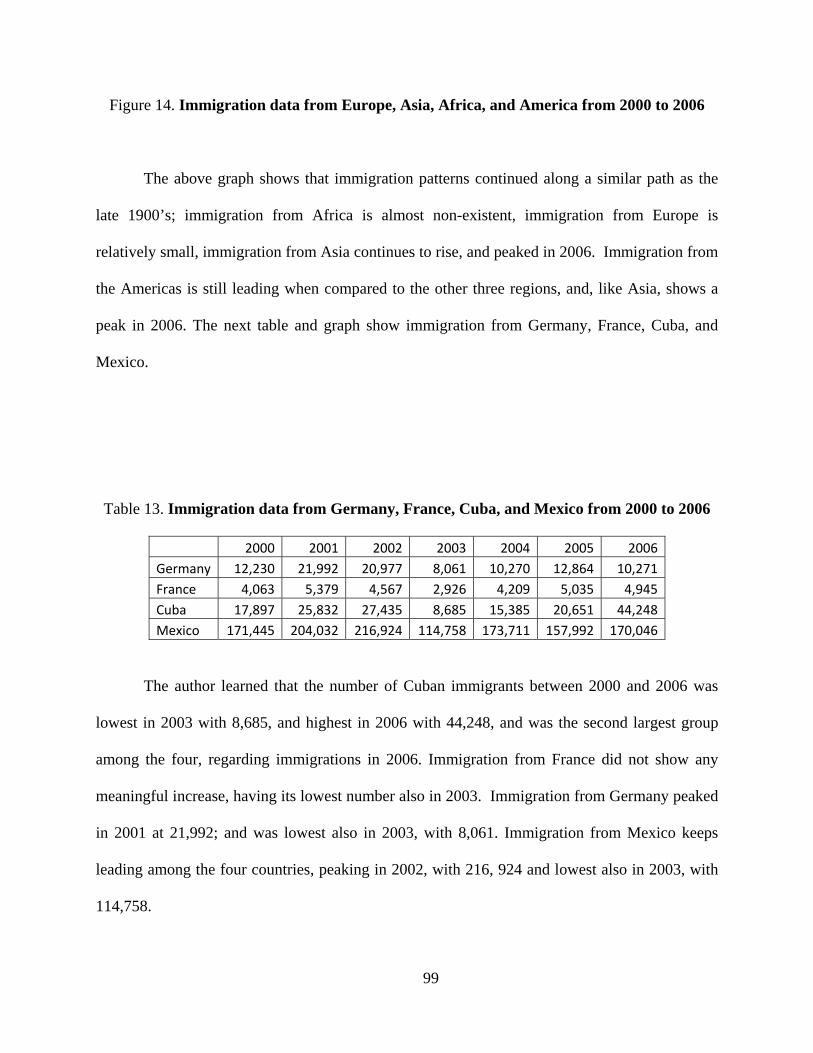
Figure 14. Immigration data from Europe, Asia, Africa, and America from 2000 to 2006
The above graph shows that immigration patterns continued along a similar path as the
late 1900’s; immigration from Africa is almost non-existent, immigration from Europe is
relatively small, immigration from Asia continues to rise, and peaked in 2006. Immigration from
the Americas is still leading when compared to the other three regions, and, like Asia, shows a
peak in 2006. The next table and graph show immigration from Germany, France, Cuba, and
Mexico.
Table 13. Immigration data from Germany, France, Cuba, and Mexico from 2000 to 2006
2000 2001 2002 2003 2004 2005 2006Germany 12,230 21,992 20,977 8,061 10,270 12,864 10,271France 4,063 5,379 4,567 2,926 4,209 5,035 4,945Cuba 17,897 25,832 27,435 8,685 15,385 20,651 44,248Mexico 171,445 204,032 216,924 114,758 173,711 157,992 170,046
The author learned that the number of Cuban immigrants between 2000 and 2006 was
lowest in 2003 with 8,685, and highest in 2006 with 44,248, and was the second largest group
among the four, regarding immigrations in 2006. Immigration from France did not show any
meaningful increase, having its lowest number also in 2003. Immigration from Germany peaked
in 2001 at 21,992; and was lowest also in 2003, with 8,061. Immigration from Mexico keeps
leading among the four countries, peaking in 2002, with 216, 924 and lowest also in 2003, with
114,758.
99
Figure 15. Immigration data from Germany, France, Cuba, and Mexico from 2000 to 2006
Immigration from Mexico continues to lead in immigration levels, as it did in the 1900’s,
when compared with the three other countries between 2000 and 2006. The two leading
immigrant countries in 2006 are countries that represent the Spanish language. Immigration in
the 2000’s from Germany and France are almost unnoticeable when compared to immigration
from Mexico.
Based on secondary sources, the author learned that in addition to the figures noted in
governmental data discussed in this work, there are also undocumented immigrants in the United
States, mostly from Spanish-speaking countries. Fox News Associated Press (March 27, 2007)
reported that the number of undocumented immigrants has been estimated at between 11.5
100
million and 12 million.49 Chris Casacchia stated in an article in The Business Journal (October 8,
2007) that there is a great inconsistency between federal reporting agencies and policy groups on
the number of undocumented immigrants:50
Immigration counts differ greatly from federal reporting agencies and policy groups.
Bear Stearns' research indicates that the illegal immigrant population is underreported by
the U.S. Census by as much as one-half. The Census Bureau estimates 8.7 million
illegals; the Urban Institute, 9.3 million; and a Center for Immigration Studies report
suggests an illegal population of 10 million. The Pew Hispanic Center estimates 12
million undocumented immigrants live in the U.S.
Based on the author’s research framework, she believes that population distribution impacts the
choice of foreign language instruction.
49 The Fox News report on illegal immigration was entitled 600,000 illegal immigrants still in U.S. despite
orders to leave see http://www.foxnews.com/story/0,2933,261541,00.html for more information.
50 For more information about The Business Journal report on the discrepancy in the report of the number
of illegal immigration see http://www.bizjournals.com/phoenix/stories/2007/10/08/daily9.html.
101
4.4.2 Foreign language instruction in the 2000’s
The author learned that in the 2000’s the recommendation advocating foreign language
education continues. Some recommendation sources are language educators, such as Brecht &
Rivers (2001) who suggested that the “security, stability, and economic vitality in the United
States” require experts in foreign languages (p. 1); others are political leaders, such as President
Bush, who suggested that “learning a language -- somebody else's language is a kind gesture. It's
a gesture of interest” (2006, Jan.6). 51 Condoleezza Rice, U.S. Secretary of State, said at the
summit of the Association of American Universities in January, 2006 that there is a need to
prepare young Americans to converse in other people’s language in the 21st century (p.16).
Although there appears to be an understanding about the broader scope of foreign
language needs, some stress that the nation’s schools, colleges, and universities continue to focus
primarily on three foreign languages, French, German, and Spanish (Welles, winter, spring,
2004). This lack of foreign language options has been recognized by some as the fact that the
nation [America] does not sufficiently value and embrace foreign languages. This comment,
reported by Tare (2006), was made by Representative Anna Eshoo (D-CA). The lack of valuing
foreign language education is also demonstrated by another comment made by Representative
Eshoo, who reports that only one out of 8,200 translators is qualified to translate Pashto (Friel,
2001).
Foreign language education is also provided by some American companies. The Intel
Corporation is training its workforce in Mandarin, Japanese, and Spanish (Workforce
51 For more information about President Bush’s comment see U.S. University Presidents Summit on
International Education http://exchanges.state.gov/universitysummit/
102
Management, 2004, Oct.). Some governmental agencies continue to provide foreign language
education, such an example is the U.S. Department of Defense (Crawford, 1992b, p. 386).
The Washington Post wrote that there is a need to offer instruction in the Arabic,
Chinese, Russian, Hindi, and Farsi languages; however, there are only 15 public schools in the
nation where Arabic is being taught at the moment (2006, Jan.8). Some of the current funding
for foreign language education is specifically for critical languages, including Arabic, Chinese,
Japanese, and Korean. 52
The author also learned that in 2005 the requirement for high school graduation in
Carnegie units53 ranges from 0 to 2, zero being required by the majority of the U.S. states. Data
shown below: 54 The following table and graph shows the requirement distribution among
reported states.
52 For more information on appropriation funds for Fiscal Year 2008 see
http://www.whitehouse.gov/omb/budget/fy2008/ ,
http://languagepolicy.org/legislation/appropriations_fy_2007__fy_2008.html,
http://languagepolicy.org/documents/appropriations/Approp%20report%20lang%20House%2008.doc, and
http://exchanges.state.gov/NSLI/fact_sheet.htm
53 Carnegie units or Carnegie hours are the number of hours per unit in which a course is taught. They are
always calculated on an 18-week semester format, regardless of the length of course term. For more information see
http://www.lavc.edu/vccc/documents/carnegieunits.html
54 For more information high school graduation requirement in 2005 see NCES Table 1
http://nces.ed.gov/programs/coe/2007/analysis/sa_table.asp?tableID=851
103
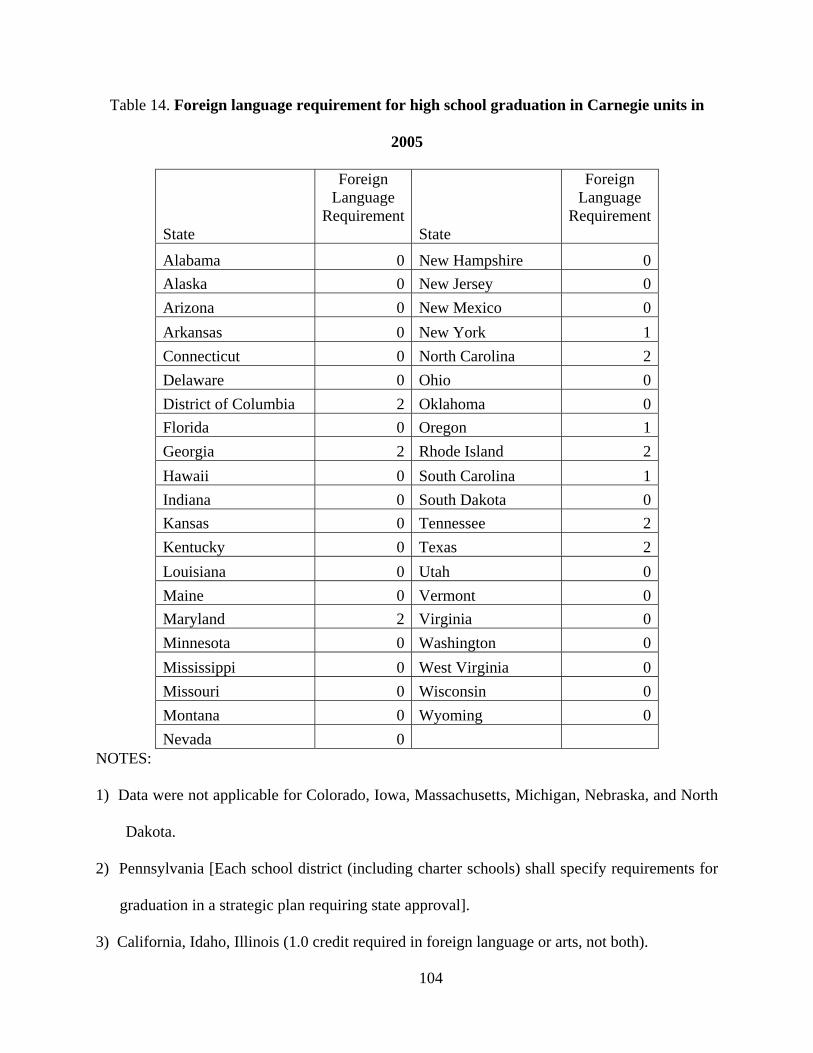
Table 14. Foreign language requirement for high school graduation in Carnegie units in
2005
State
Foreign Language
Requirement State
Foreign Language
Requirement
Alabama 0 New Hampshire 0 Alaska 0 New Jersey 0 Arizona 0 New Mexico 0 Arkansas 0 New York 1 Connecticut 0 North Carolina 2 Delaware 0 Ohio 0 District of Columbia 2 Oklahoma 0 Florida 0 Oregon 1 Georgia 2 Rhode Island 2 Hawaii 0 South Carolina 1 Indiana 0 South Dakota 0 Kansas 0 Tennessee 2 Kentucky 0 Texas 2 Louisiana 0 Utah 0 Maine 0 Vermont 0 Maryland 2 Virginia 0 Minnesota 0 Washington 0 Mississippi 0 West Virginia 0 Missouri 0 Wisconsin 0 Montana 0 Wyoming 0 Nevada 0
NOTES:
1) Data were not applicable for Colorado, Iowa, Massachusetts, Michigan, Nebraska, and North
Dakota.
2) Pennsylvania [Each school district (including charter schools) shall specify requirements for
graduation in a strategic plan requiring state approval].
3) California, Idaho, Illinois (1.0 credit required in foreign language or arts, not both).
104
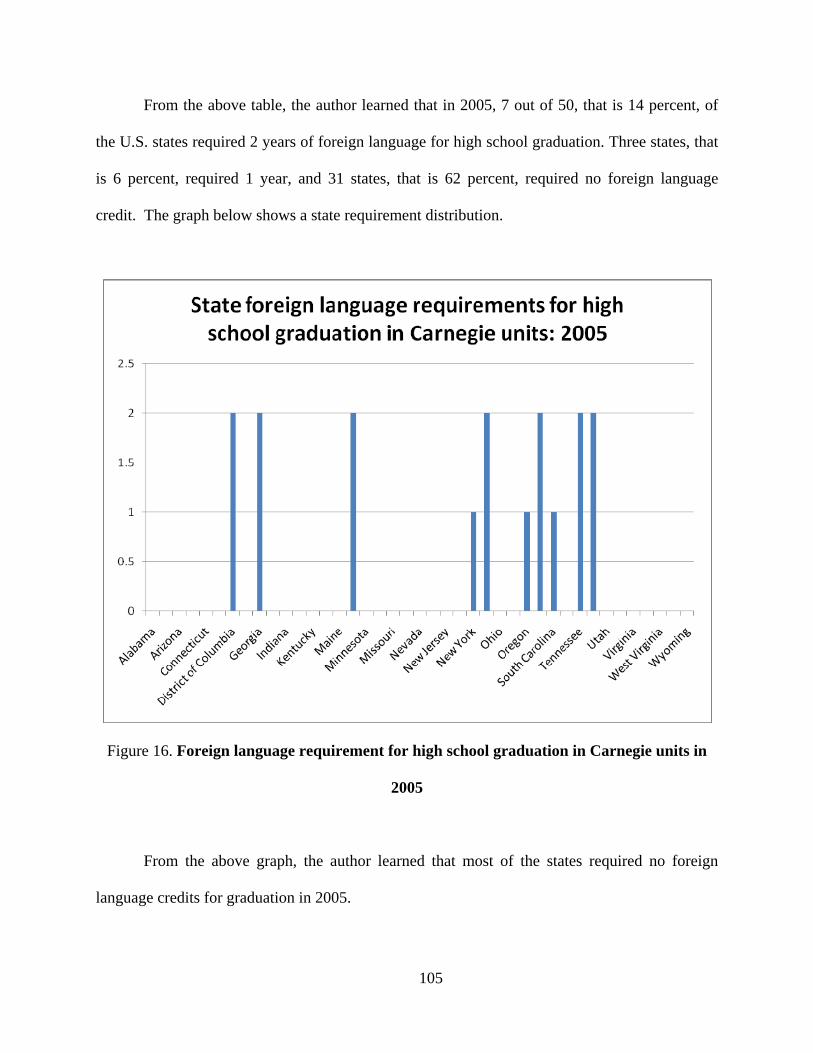
From the above table, the author learned that in 2005, 7 out of 50, that is 14 percent, of
the U.S. states required 2 years of foreign language for high school graduation. Three states, that
is 6 percent, required 1 year, and 31 states, that is 62 percent, required no foreign language
credit. The graph below shows a state requirement distribution.
Figure 16. Foreign language requirement for high school graduation in Carnegie units in
2005
From the above graph, the author learned that most of the states required no foreign
language credits for graduation in 2005.
105
4.4.3 Federal funding for foreign language instruction in the 2000’s
Through this study the author learned that funding for international education and foreign
language studies has been on the rise from 2000 to 2003 and then leveled off in the following
years through 2007. 55 The following table and graph depict this pattern.
55 Figures on International Education and Foreign Language Studies were acquired from the Joint National
Committee for Languages and the National Council for Languages and International Studies, JNCL-NCLIS. For
more information see http://www.languagepolicy.org
106
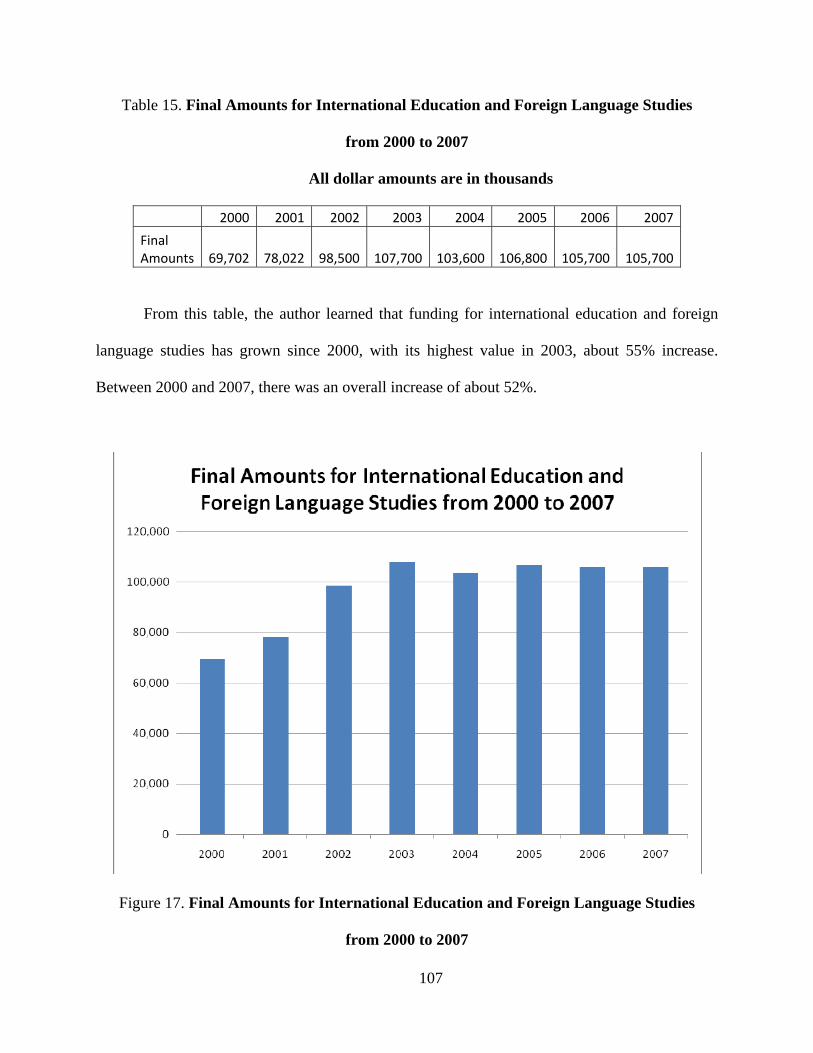
Table 15. Final Amounts for International Education and Foreign Language Studies
from 2000 to 2007
All dollar amounts are in thousands
2000 2001 2002 2003 2004 2005 2006 2007
Final Amounts 69,702 78,022 98,500 107,700 103,600 106,800 105,700 105,700
From this table, the author learned that funding for international education and foreign
language studies has grown since 2000, with its highest value in 2003, about 55% increase.
Between 2000 and 2007, there was an overall increase of about 52%.
Figure 17. Final Amounts for International Education and Foreign Language Studies
from 2000 to 2007
107
The above graph shows that funding for international education and foreign language
studies has increased since 2000. In 2001, Foreign Language Assistance Act, FLAP,56 which
received $21.7 million in 2006, was issued. In 2007, the president’s request increased the
funding by $2 million to $23.7 million.
In 2007 another source of funding was Advancing America through Foreign Language
Partnerships, through which twenty-four institutions of higher level education were awarded $1
million for partnerships with school districts for language learning from kindergarten through
high school and into advanced language learning at the postsecondary level. The goal of this
grant is to produce graduates with advanced levels of proficiency in languages critical to national
security. Another such program is the Language Teacher Corps, which proposed a request for $5
million with a goal to provide training to college graduates who wish to become teachers of
critical languages. Yet another similar program is the Teacher-to-Teacher Initiative, which funds
intensive summer sessions, especially in those of critical languages.
Some of the funding recommendations for the FY2008 are: FLAP with an increase of $3
million and International Education and Foreign Language Studies with an increase of $9.9
million.
56 For more information about the Foreign Language Assistance Program see http://www.ed.gov/-
programs/flapsea/index.html and the National Clearinghouse for English Language Acquisiton, NCELA
http://www.ncela.gwu.edu/oela/OELAprograms/4_FLAP.htm
108
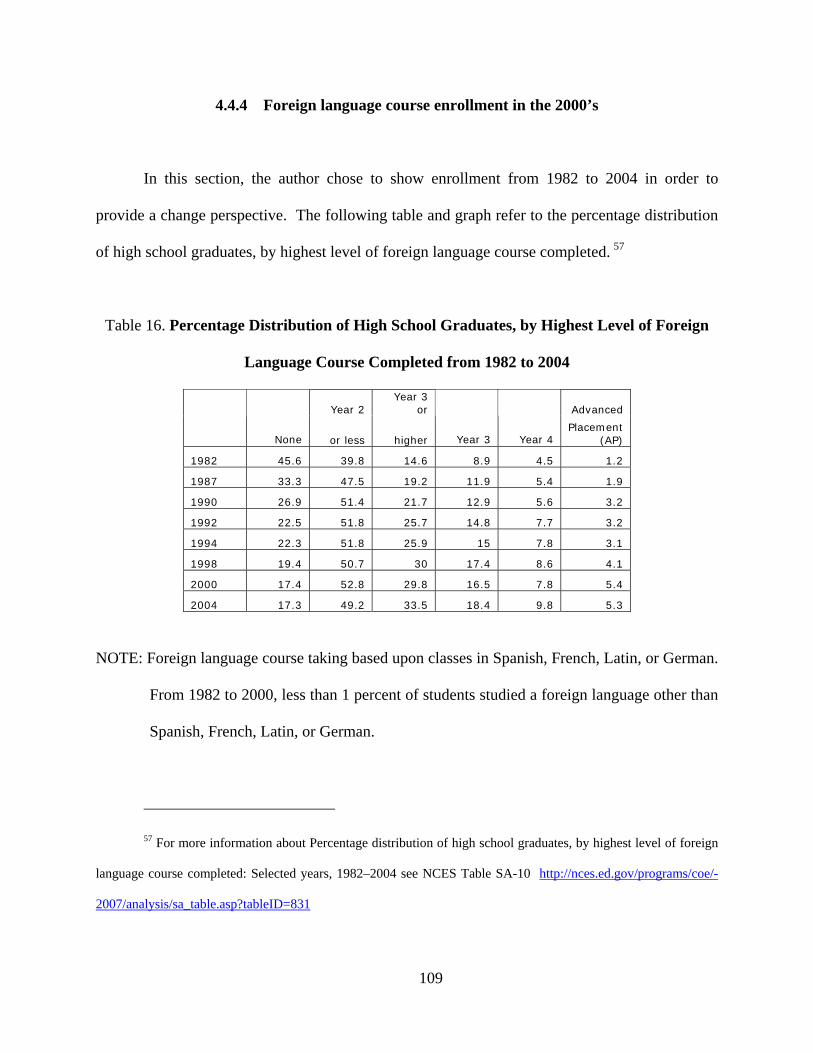
4.4.4 Foreign language course enrollment in the 2000’s
In this section, the author chose to show enrollment from 1982 to 2004 in order to
provide a change perspective. The following table and graph refer to the percentage distribution
of high school graduates, by highest level of foreign language course completed. 57
Table 16. Percentage Distribution of High School Graduates, by Highest Level of Foreign
Language Course Completed from 1982 to 2004
Year 2 Year 3
or Advanced
None or less higher Year 3 Year 4 Placement
(AP)
1982 45.6 39.8 14.6 8.9 4.5 1.2
1987 33.3 47.5 19.2 11.9 5.4 1.9
1990 26.9 51.4 21.7 12.9 5.6 3.2
1992 22.5 51.8 25.7 14.8 7.7 3.2
1994 22.3 51.8 25.9 15 7.8 3.1
1998 19.4 50.7 30 17.4 8.6 4.1
2000 17.4 52.8 29.8 16.5 7.8 5.4
2004 17.3 49.2 33.5 18.4 9.8 5.3
NOTE: Foreign language course taking based upon classes in Spanish, French, Latin, or German.
From 1982 to 2000, less than 1 percent of students studied a foreign language other than
Spanish, French, Latin, or German.
57 For more information about Percentage distribution of high school graduates, by highest level of foreign
language course completed: Selected years, 1982–2004 see NCES Table SA-10 http://nces.ed.gov/programs/coe/-
2007/analysis/sa_table.asp?tableID=831
109
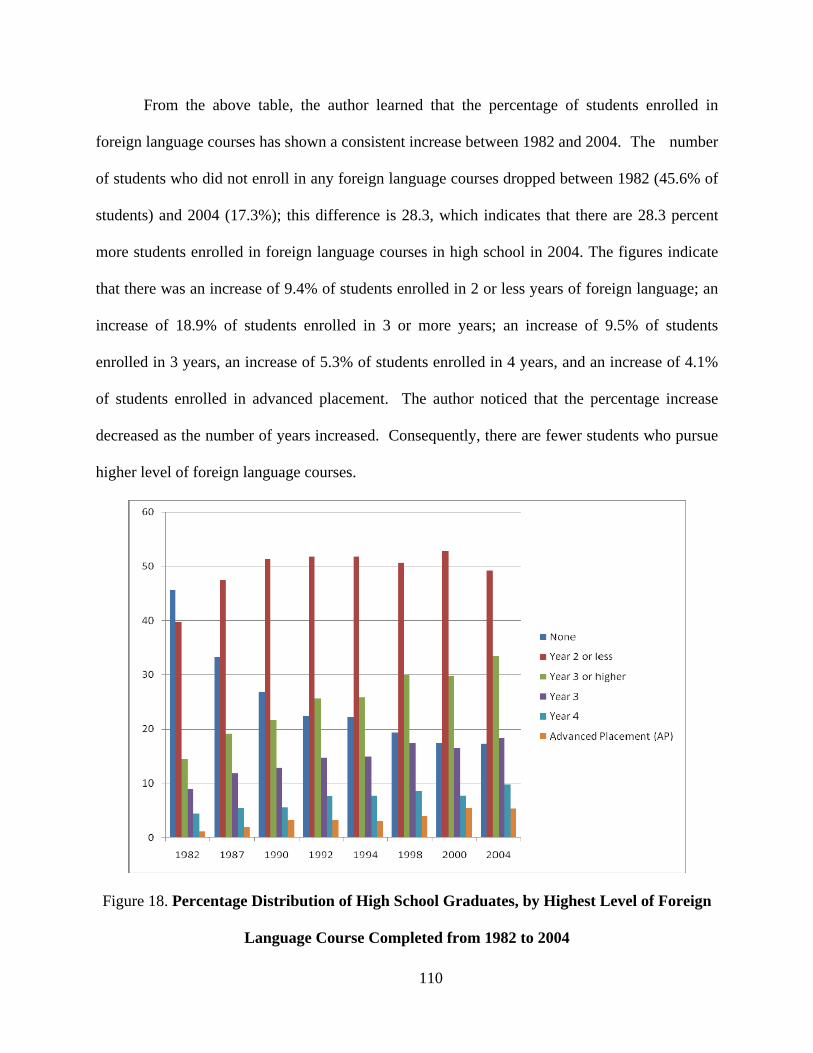
From the above table, the author learned that the percentage of students enrolled in
foreign language courses has shown a consistent increase between 1982 and 2004. The number
of students who did not enroll in any foreign language courses dropped between 1982 (45.6% of
students) and 2004 (17.3%); this difference is 28.3, which indicates that there are 28.3 percent
more students enrolled in foreign language courses in high school in 2004. The figures indicate
that there was an increase of 9.4% of students enrolled in 2 or less years of foreign language; an
increase of 18.9% of students enrolled in 3 or more years; an increase of 9.5% of students
enrolled in 3 years, an increase of 5.3% of students enrolled in 4 years, and an increase of 4.1%
of students enrolled in advanced placement. The author noticed that the percentage increase
decreased as the number of years increased. Consequently, there are fewer students who pursue
higher level of foreign language courses.
Figure 18. Percentage Distribution of High School Graduates, by Highest Level of Foreign
Language Course Completed from 1982 to 2004
110
Through the above graph, the author learned that the percentage of students who were not
enrolled in foreign language courses was the highest in 1982. The graph also shows that the
highest percent overall relates to students enrolled in 2 or less years of foreign language. The
percentage of students enrolled in 3 years or higher shows a slight positive slope, with its peak in
2004. On the converse, enrollment in 4 years and AP courses are the lowest then.
The next table and graph show enrollment in French, German, and Spanish in grades 9
through 12, in U.S. public schools in 2000. 58
58 For more information about public high school enrollment in French, German, and Spanish in 2000 see
NCES Table 55, 2005 http://nces.ed.gov/
111

Table 17. Enrollment in French, German, and Spanish courses in grades 9 to 12
in public secondary schools in 2000
Numbers are in thousands
2000French 1,075German 283Spanish 4,058
The author learned from the above table that enrollment in the three most-taught
languages in the U.S. followed the same pattern from 1948, with Spanish leading, French being
the second, and German being the least studied of the three languages. For more detail on these
data, see Appendix D.
Figure 19. Enrollment in French, German, and Spanish courses in grades 9 to 12
in public secondary schools in 2000
112
The above table and graph show that Spanish was the leading foreign language course in
the U.S. public secondary schools in 2000.
Another NCES data record, disclosed in Table 11, entitled “Projection of Education
Statistics to 2015,” has been reported by Welles (2004), shows that in 2002, 1,347,036 out of
15,608,000 college students were enrolled in modern foreign language courses. Therefore, only
about 8.6 percent of college students were enrolled in modern foreign language courses in 2002.
For more detail on these data, see Appendix D.
The next table and graph show figures for 2002 of U.S. college student enrollment in
specific foreign language courses, French, German, Spanish, Russian, Japanese, Chinese, Arabic,
Portuguese, and Korean.
113
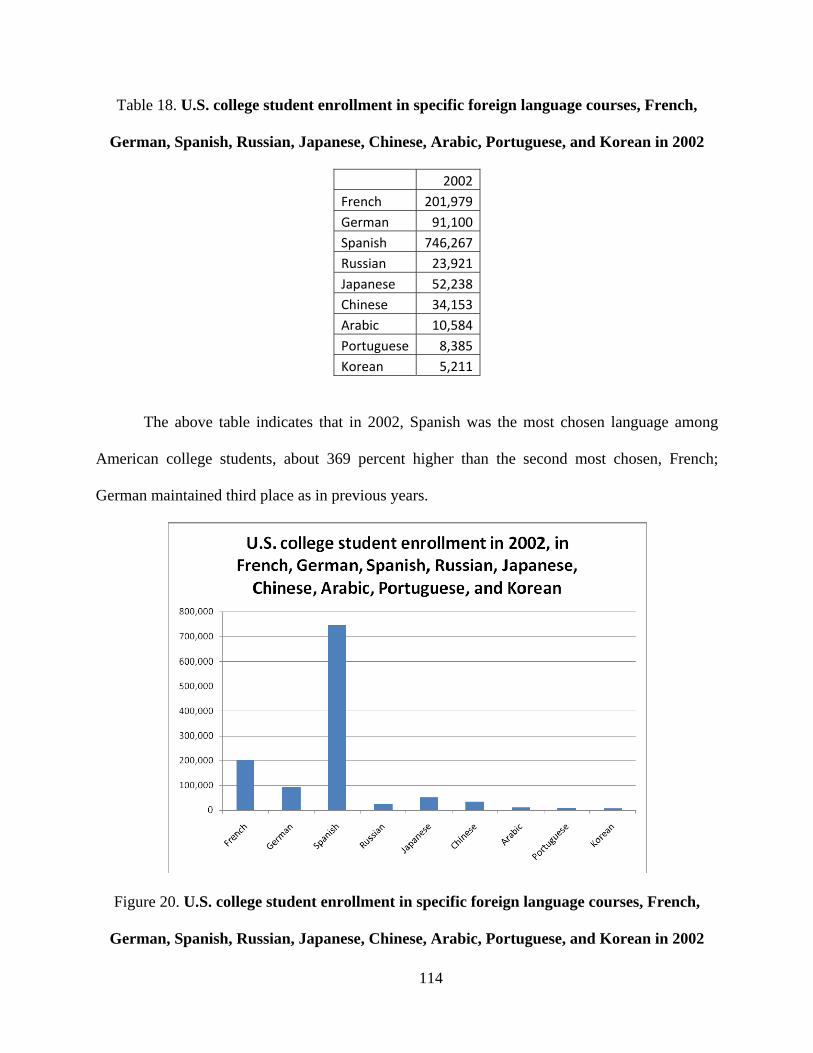
Table 18. U.S. college student enrollment in specific foreign language courses, French,
German, Spanish, Russian, Japanese, Chinese, Arabic, Portuguese, and Korean in 2002
2002French 201,979German 91,100Spanish 746,267Russian 23,921Japanese 52,238Chinese 34,153Arabic 10,584Portuguese 8,385Korean 5,211
The above table indicates that in 2002, Spanish was the most chosen language among
American college students, about 369 percent higher than the second most chosen, French;
German maintained third place as in previous years.
Figure 20. U.S. college student enrollment in specific foreign language courses, French,
German, Spanish, Russian, Japanese, Chinese, Arabic, Portuguese, and Korean in 2002
114
The above graph shows that Spanish was overwhelmingly the language of choice among
U.S. college students in 2002. It maintained its leading position among the three most studied
languages, including French and German. In fact, it superseded enrollment in the other
referenced languages combined.
4.4.5 Summary of the 2000’s
The author learned that immigration records show that in the 2000’s, Europe continues to
be low compared with immigration from the Americas. Immigration from Africa continues to be
almost non-existent. Immigration from Asia rose slightly. Of the four countries chosen for this
study, Germany, France, Cuba, and Mexico, the country leading in immigration to the U.S.
continues to be Mexico.
The author also learned that foreign language enrollment records show that Spanish
continues to be overwhelmingly the language of choice at the secondary and tertiary levels.
Concerning funding and foreign language education recommendations, there seems to be
an increase in interest in languages other than French, German, and Spanish. Some language
educators and political leaders are recommending foreign language education in languages that
are viewed as critical for the nation’s economy and national security. These languages,
115
according to the American Council on the Teaching of Foreign Languages, are Arabic, Chinese,
Russian, Hindi, and Farsi.
The author also noted that as of 2005, there were minimal or no requirements to learn a
foreign language in high school.
116
5.0 DISCUSSION – INTRODUCTION
In this section, the author discusses the overall findings about the attitude Americans
have toward foreign language education from the 1700’s to 2006. Through the literature search,
the author was able to build a general understanding of the path of education in and of languages
other than English.
Although the author believes that all topics that have been addressed in this work are
related at some level, before discussing the overall work, she chose to review each topic
separately to develop a more organized means for a final discussion. Therefore, in section 5.1,
the author discusses immigration, in section 5.2, foreign language instruction, in section 5.3,
federal funding for foreign language instruction, in section 5.4, foreign language course
enrollment, and lastly, an overall discussion is provided in section 5.5.
117
5.1 DISCUSSION POINTS ABOUT U.S. IMMIGRATION
FROM THE 1700’S TO 2006
The author looked at immigration starting in the 1700’s because the United States of
America was born as an independent nation during that century. The author believes that the
attitude of a people is influenced by the composition of that population. Perhaps because the
U.S. was not established as an independent nation until 1776, there are no available immigration
data prior to 1820 (Steve Fienberg, from the Carnegie Mellon University). However it has been
reported by secondary sources that German immigrants composed the greatest number of
immigrants during the 1700’s (Kloss, 1998, p. 9).
During the 1800’s, with the exception of 1820 when immigration from France was
greater than immigration from Germany, immigration from Germany was the largest throughout
the century, with its peak in the decade of the 1880’s. There was no record of immigration from
Cuba during this time period, and immigration from Mexico was very low. Some attempts were
made to halt immigration by the end of the 1800’s, by means of taxation (Crawford, 2000, p. 20;
Higham, 1963, p. 101) or by language restriction (Higham, 1963, p. 106).
The 1990’s saw a shift in immigration patterns, in which immigration from Europe was
reduced greatly after the first decade, while immigration from the Americas started to increase,
especially immigration from Mexico after 1948. Just as during the 1800’s, actions were taken
against immigrants in the form of taxation (Schmid, 2001, p. 35; Higham, 1963, pp. 249 & 260)
and language discrimination against speaking German in the streets and teaching in the German
language (Schmid, 2001, p. 36; Kloss, 1998, p. 61). Another form of language discrimination
was by the implementation of the I.Q. test under the Johnson-Laird Immigration Act, which was
118
used with the intention to restrict the racial distribution of immigrants (Herriman & Burnaby,
1996, p. 136).
Immigration from Cuba increased in the beginning of the 1960’s due to the Cuban crisis
when Fidel Castro acquired control of the country; however, immigration from Cuba in general
did not compare with immigration from Mexico, the leading source of immigration since 1948.
In the 2000’s immigration from the Americas continued to be the largest among Europe,
Asia, and Africa, with Asia being the second largest. Among the four countries being studied,
Mexico is overwhelmingly the leading immigration source. In addition the record of
documented immigrants is incomplete; some sources estimate that there are about 12 million
undocumented immigrants in the United States (The Business Journal, October 8, 2007).
5.2 DISCUSSION POINTS ABOUT FOREIGN LANGUAGE INSTRUCTION IN
THE U.S. FROM THE 1700’S TO 2006
During the 1750’s foreign language knowledge was a skill possessed by people from
various social strata, including slaves (Crawford, 1992a, p. 36). It was a common practice for
U.S. educational institutions to offer instruction in many languages, such as German, French,
Spanish, Italian, Portuguese, Latin, Greek, Hebrew, and Arabic (Crawford, 1992a, p. 36).
Education in non-English languages was offered when parents requested (Crawford, 2000, p. 20;
Kloss, 1998, p. 31). Thomas Jefferson recommended that American students up to sixteen years
119
of age should learn Latin, Greek, French, and Spanish (Simon, 1980, p. 77). Benjamin Franklin,
on the other hand, recommended that education in the English language should be imposed on
the immigrants from Germany.
During the 1800’s some political leaders supported education in languages other than
English, such as President Van Buren and the governors of Ohio and Pennsylvania (Kloss, 1998,
p. 31). In 1839, Ohio became the first state to legalize education in the German language.
Perhaps due to the French roots of Louisiana, education in that state until 1803 was given in both
English and French (Kloss, 1998, p. 140); however, in 1847 a state law declared that German
would be the language of instruction (Crawford, 2000, p. 20; Kloss, 1998, p. 140).
By the 1880’s education in the German language was being terminated throughout the
nation with the help of the APA (Herriman & Burnaby, 1996, p. 133; Schmid, 2001, p. 36). The
same attitude against education in the German language was conveyed by the Commissioner of
the Common Schools of New York, who labeled foreign traits as irritating elements (Simon,
1980, p. 11), and by immigrant parents, who viewed their own foreign traits as deficiencies
(Simon, 1980, p. 12).
By the 1900’s some states were urging education in English-only or English plus another
language instead of education in a foreign language, such as German (Higham, 1963, p. 209;
Schmid, 2001, p. 36). In 1915, immigrant parents were encouraging their children to learn other
languages while retaining their own (Schmidt, Sr., 2000, p.1); 36 percent of American high
school students were studying a modern foreign language (Simon, 1980, p. 2) and 85 percent of
these students were required to pass a competency test in a foreign language before they were
accepted into a college (Simon, 1980, p. 3).
120
In 1919, Nebraska was declared an English-only state and prohibited education in any
language other than English (Higham, 1963, p. 260; Crawford, 1992b, p. 89; Kloss, 1998, p. 62).
The stand taken by the state of Nebraska led to the Supreme Court case, Meyer v. Nebraska, in
1923, which favored the language minority party (Leibowitz, 1971, p. 10).
Right after Fidel Castro took control of Cuba in 1959, Dade County, Florida, faced a
language crisis regarding the education of children of refugees (Finegan & Rickford, 2004, p.
342). Just a decade later, in the 1970’s, Texas faced the same dilemma in educating 240,000
Mexican immigrants (Schmidt, Sr., 2000, p. 131; Simon, 1980, p. 156). At the end of the
1970’s, English-speaking students were allowed by law to learn foreign language by entering
bilingual programs (San Miguel, Jr., 2004, p. 30).
By the end of the 1900’s some language advocates urged education in languages other
than the three most commonly taught in the U.S., described by ACTFL as Arabic, Chinese,
Russian, Hindi, and Farsi. This same trend has continued during the 2000’s. Some of these
languages are being taught by American corporations such as Intel (Workforce Management,
2004, Oct.).
The need for foreign language education was recognized by two current political leaders,
George Bush and Condoleezza Rice, in addition to Representative Anna Eshoo (D-CA) (Welles,
winter, spring, 2004; Tare, 2006; Friel, 2001). However, despite the recognition of need, there
are only 15 public schools in the nation where Arabic is being taught at the moment (2006,
Jan.8), and in 2005 the requirement for high school graduation in Carnegie units ranged from 0
to 2, zero being the requirement at the majority of the states (NCES Table 1).
121
5.3 DISCUSSION POINTS ABOUT U.S. FUNDING FOR FOREIGN LANGUAGE
INSTRUCTION FROM THE 1700’S TO 2006
In the 1700’s funding for foreign language was available based on the fact that many
settlers were educated in their own language (Crawford, 2000, p. 20). Another source for foreign
language education during this time period came through the funding of a bilingual college in
Pennsylvania by Benjamin Rush and Benjamin Franklin (Crawford, 1992a, p. 39; Crawford,
2000, p. 12; Schmid, 2001, p. 16).
The funding of foreign language education was also sponsored by another politician in
1839, when President Van Buren and the governors of Ohio and Pennsylvania contributed to the
funding of a German’s teacher’s seminary (Kloss, 1998, p. 31). At the K-12 levels, funding for
foreign language education still took place, for education in German was offered when parents
requested (Crawford, 2000, p. 20; Kloss, 1998, p. 31).
The National Defense Education Act of 1958 was a source of federal funding for foreign
language education as a result of the Sputnik crisis; funding for education tripled in 1959 (Friel,
2001). The Higher Education Act of 1965 provided grants for foreign language from elementary
to college level. During the 1990’s funding for foreign language education was provided
through the Senate Intelligence Committee (Crawford, 192a, p. 253) as well as through
International Education and Foreign Language Studies during President Clinton’s terms.
According to the JNCL-NCLIS, the funding for International Education and Foreign Language
Studies continues to grow in the 2000’s; from 2000 to 2007, it increased about 34 percent. Other
funding for foreign language education in the 2000’s has been especially categorized for
education in critical languages as described by ACTFL. Such funds are Advancing America
122
through Foreign Language Partnerships and Foreign Language Assistance Program, according to
the JNCL-NCLIS.
5.4 DISCUSSION POINTS ABOUT FOREIGN LANGUAGE COURSE
ENROLLMENT FROM THE 1700’S TO 2006
There are no governmental records that show enrollment data during the 1700’s;
however, since it is known that children of immigrant parents were being educated in their native
languages whenever their parents requested (Crawford, 2000, p. 20; Kloss, 1998, p. 31), one can
assume that students were enrolled in courses in languages other than English during that time.
In addition it is known that U.S. educational institutions offered education in German, French,
Spanish, Italian, Portuguese, Latin, Greek, Hebrew, and Arabic (Crawford, 1992a, p. 36).
According to the NCES, German was the leading language of choice in grades 9 to 12
between 1889 and 1900, French was second, and there was no record for enrollment in Spanish
for this time period. In 1895, foreign language courses were offered in the elementary level,
with twenty-three thousand students enrolled in German courses, and three thousand students
enrolled in French courses (Simon, 1980, p. 14). These figures show once again that the
language of choice at that time was German.
The choice of German as a foreign language course continued until 1915, during WWI,
after which, enrollment in German courses at the secondary level was reduced by about 98
123
percent, according to the NCES. In 1921, French became the leading foreign language of choice,
with an increase of about 43 percent. French maintained its enrollment leadership until 1948,
when Spanish took the leading position.
The year 1982, according to the NCES, was the year when the fewest high school
students enrolled in foreign language courses, between 1982 and 2004. After 1982, the number
of students enrolled in foreign language courses for two years increased; however the number of
students enrolled in more than two years of instruction decreased as the number of years of
language courses increased. This enrollment follows the trends of graduation requirements;
more than 60 percent of the U.S. high schools had no requirement in the year 2005.
Enrollment trends continued from the mid 1900’s to 2002. Spanish language enrollment
continues to maintain its leading position over French, German, and other languages that are
viewed as critical to the United States.
124
5.5 OVERALL STUDY DISCUSSION
This work is based on the concept that the attitudes of American citizens impact the
development of foreign language education in the United States. The author notes that American
citizenship has been composed of different ethnic groups from the time of the nation’s birth in
the 1700’s. During that time up to the 1800’s, German citizens composed the largest immigrant
group entering the United States. Education in the German language was a common practice in
those days. Funding to English-German colleges by American political leaders was reported.
No explicit language for instruction had been prescribed in the U.S. Constitution. Being
multilingual was a common trait in the nation from the educated elite, as recommended by
Thomas Jefferson, to the common slave population. Many public schools in the nation offered
courses in several languages. As the 1800’s approached its end, the attitude of some Americans,
including political leaders, changed due to the fact that the number of German immigrants was
increasing. Immigrants were taxed at times based on immigration status and at other times based
on language issues. A movement toward English-only started to take place.
After World War I, German immigration as well as German language education almost
disappeared; French became the language of choice. Shortly thereafter, overall immigration
from Europe was reduced greatly while immigration from the Americas increased, especially
from Mexico. In 1948, Spanish became the language of choice. This choice continues among
all other languages, including the ones that are viewed as critical.
The author learned through this research that there is a relationship between the attitudes
of a people, its population composition, and the language of choice.
125
6.0 EPILOGUE
The author believes that foreign language education in the United States is impacted by
the attitudes of American citizens. This belief has not changed at the conclusion of this work.
This conclusion rests on the fact that foreign language enrollment data have followed along-side
with immigration trends. In the 1700 and 1800’s, German was the leading immigrant group and
it was the leading language of education. As immigration trends switched from Europe, most
specifically, Germany, to the Americas, most specifically, Mexico, from 1948 to today, the
leading foreign language of choice has been Spanish.
The author wishes to emphasize that, personally, she is not against the teaching of
Spanish as a foreign language; however, she sees a problem that can occur with this narrow
choice; while the leading immigrant group is being catered to, funding and requirements for
foreign language are being put aside. As a result the United States education system is
restricting American citizens, and consequently the nation, from fully engaging in today’s world.
Through this study, the author confirmed that foreign language instruction is directly
related to immigration trends. Conversely, the need to expand the spectrum of foreign language
instruction has been pointed out by language professionals during crisis situations; however,
foreign language course enrollment and requirements show that the outcome of such calls tend to
vanish as time passes; this confirmation can be validated based on the available enrollment data.
As a conclusion, it seems that the only question remaining is:
126
What is the next historical crisis that will serve as a basis for recommendation from the
nation’s language professionals while education in the leading immigrant group’s language
continues to grow?
127
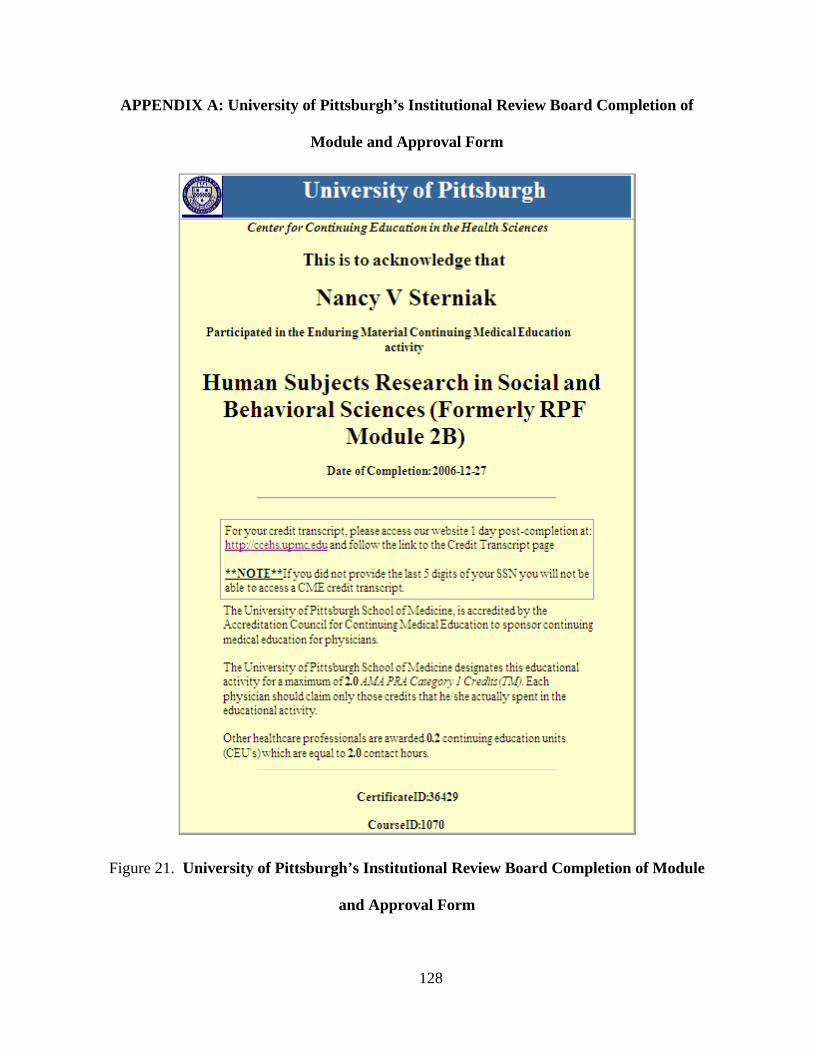
APPENDIX A: University of Pittsburgh’s Institutional Review Board Completion of
Module and Approval Form
Figure 21. University of Pittsburgh’s Institutional Review Board Completion of Module
and Approval Form
128
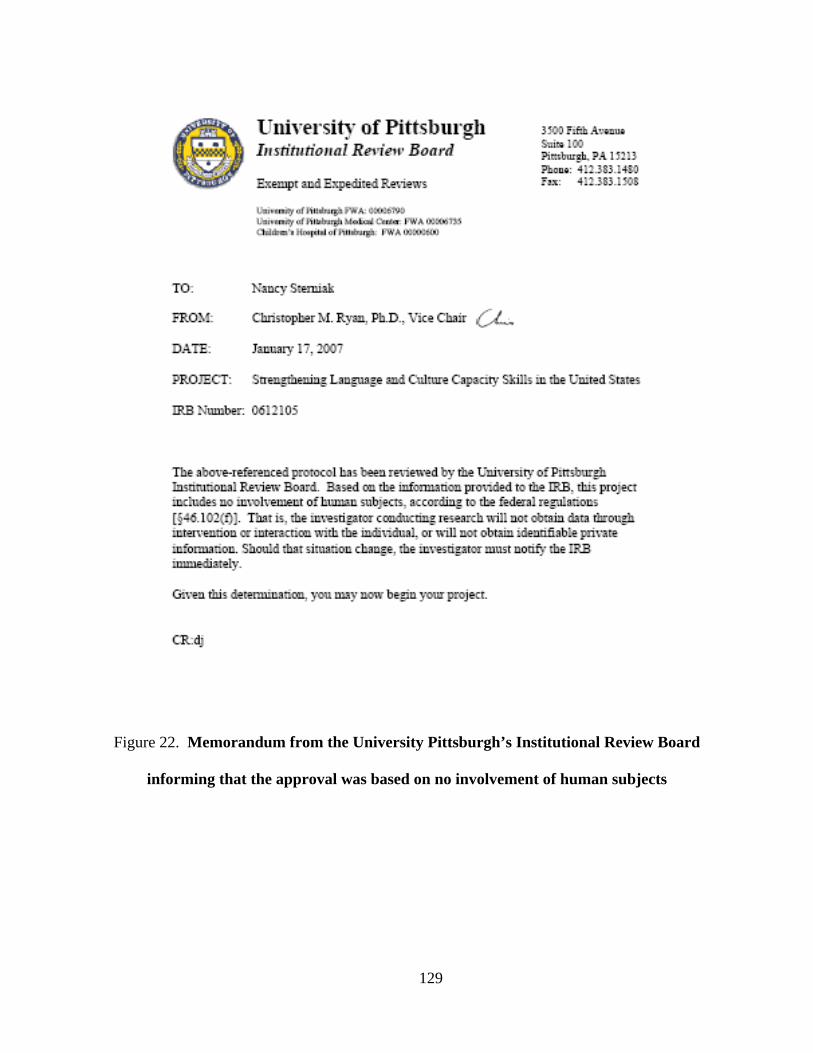
Figure 22. Memorandum from the University Pittsburgh’s Institutional Review Board
informing that the approval was based on no involvement of human subjects
129
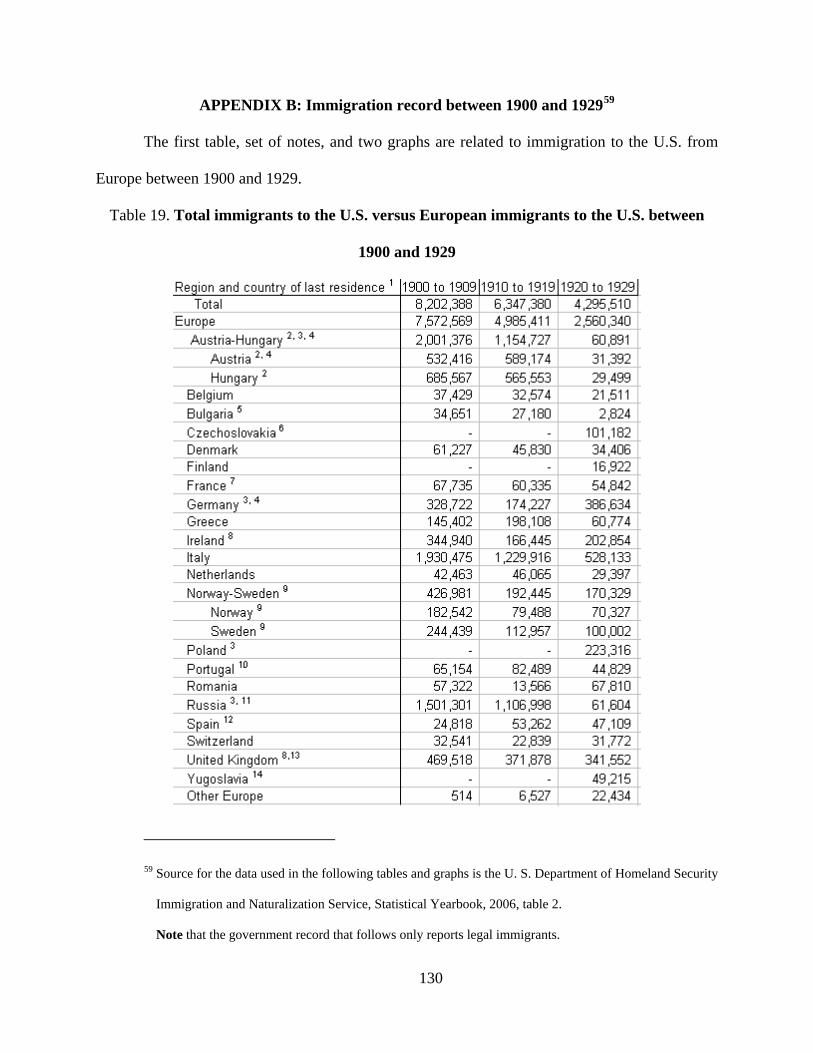
APPENDIX B: Immigration record between 1900 and 192959
The first table, set of notes, and two graphs are related to immigration to the U.S. from
Europe between 1900 and 1929.
Table 19. Total immigrants to the U.S. versus European immigrants to the U.S. between
1900 and 1929
59 Source for the data used in the following tables and graphs is the U. S. Department of Homeland Security
Immigration and Naturalization Service, Statistical Yearbook, 2006, table 2.
Note that the government record that follows only reports legal immigrants.
130
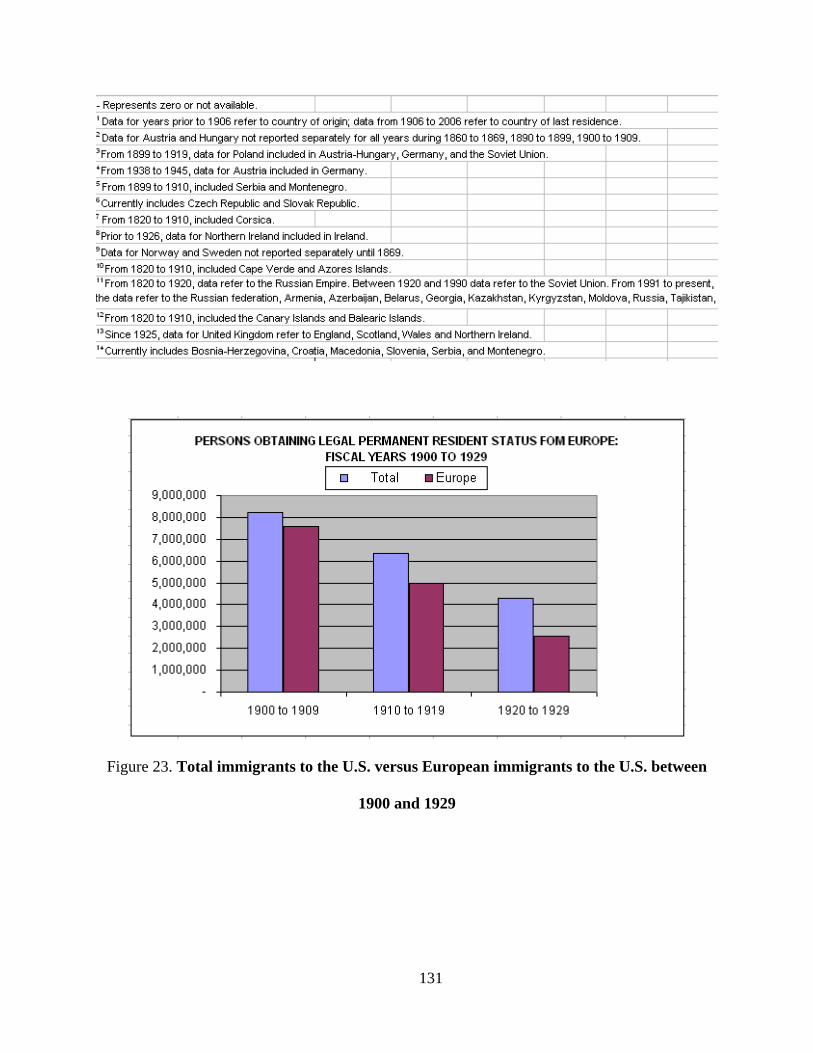
Figure 23. Total immigrants to the U.S. versus European immigrants to the U.S. between
1900 and 1929
131
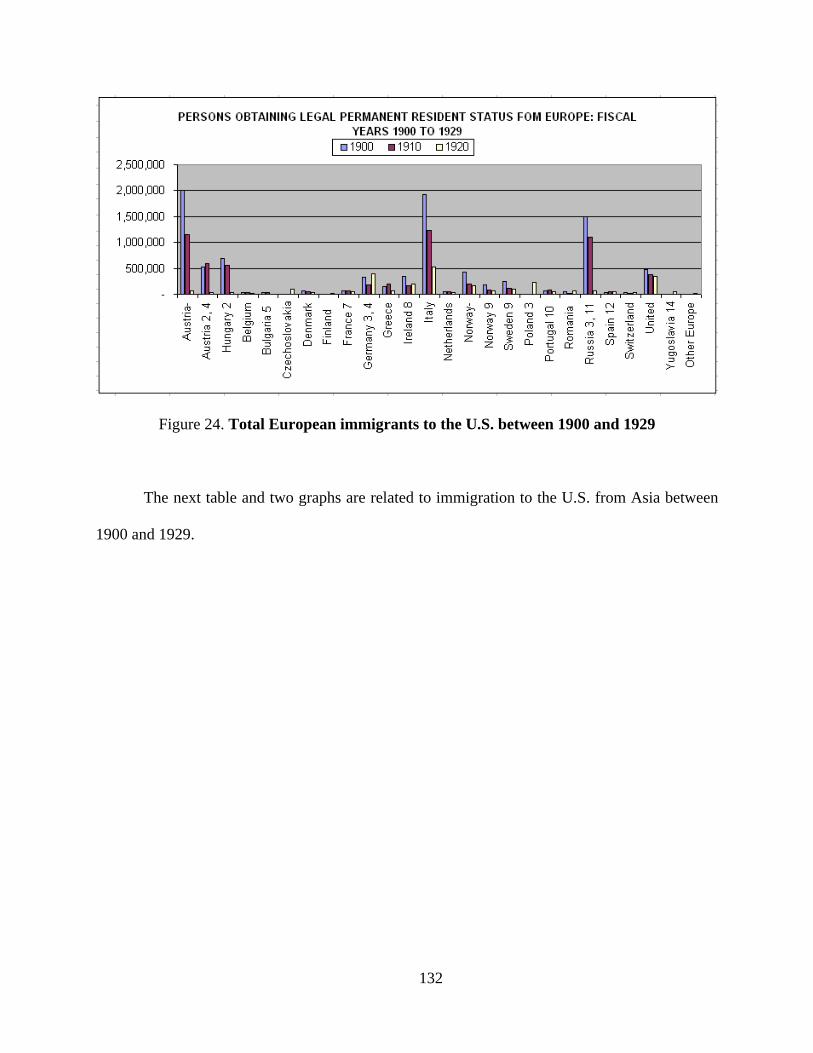
Figure 24. Total European immigrants to the U.S. between 1900 and 1929
The next table and two graphs are related to immigration to the U.S. from Asia between
1900 and 1929.
132
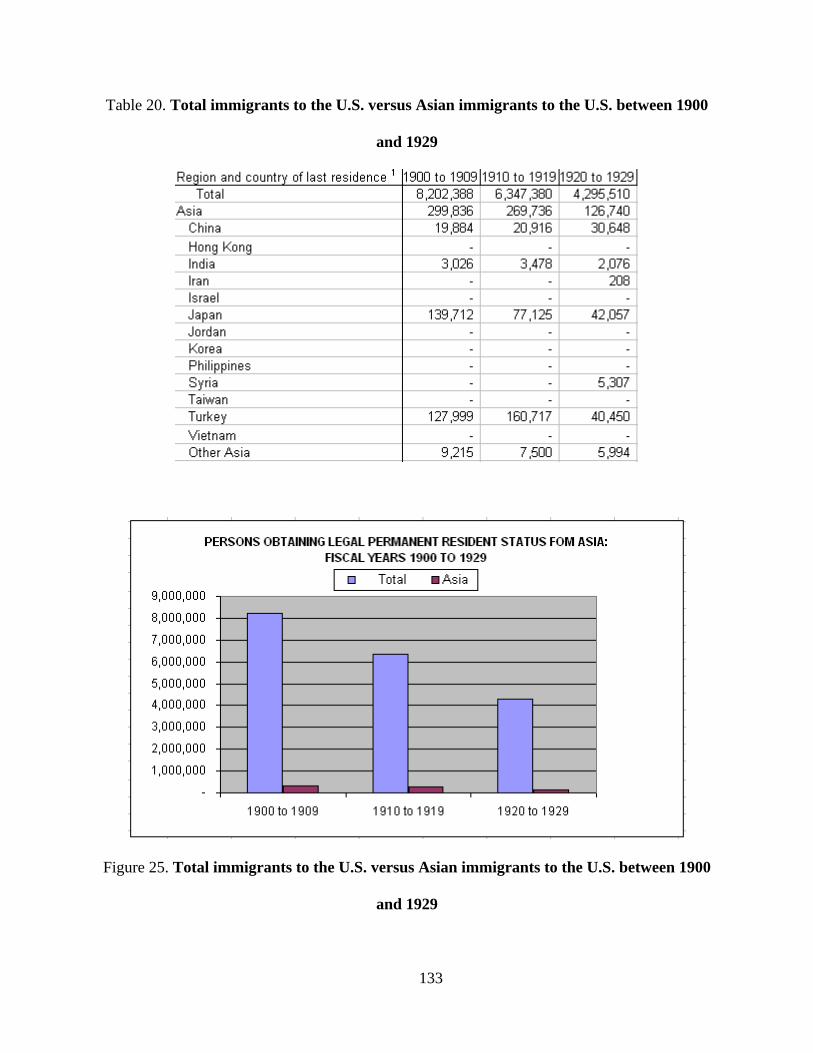
Table 20. Total immigrants to the U.S. versus Asian immigrants to the U.S. between 1900
and 1929
Figure 25. Total immigrants to the U.S. versus Asian immigrants to the U.S. between 1900
and 1929
133
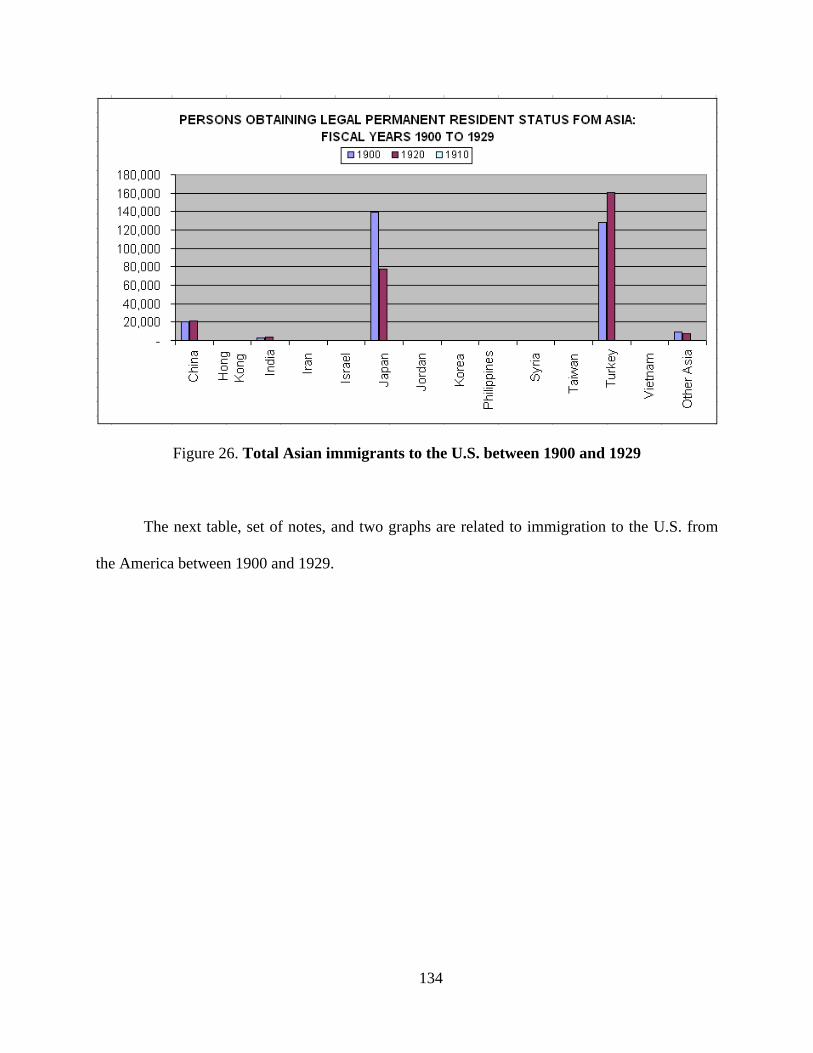
Figure 26. Total Asian immigrants to the U.S. between 1900 and 1929
The next table, set of notes, and two graphs are related to immigration to the U.S. from
the America between 1900 and 1929.
134
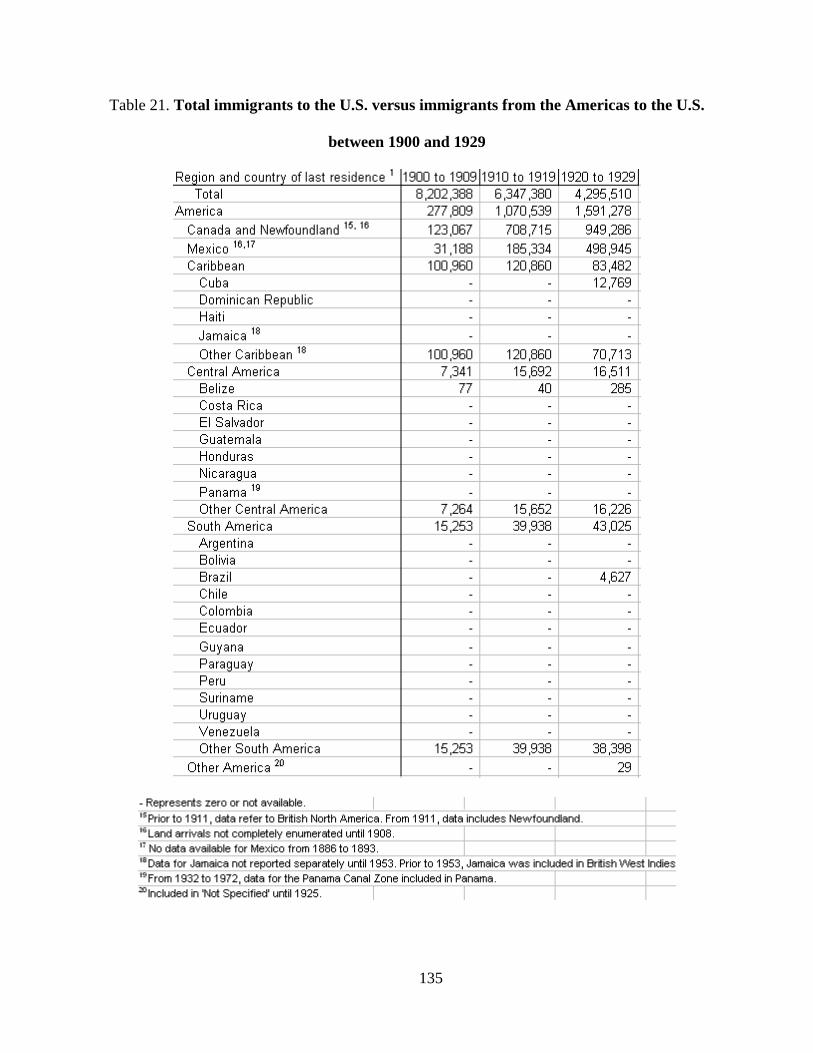
Table 21. Total immigrants to the U.S. versus immigrants from the Americas to the U.S.
between 1900 and 1929
135
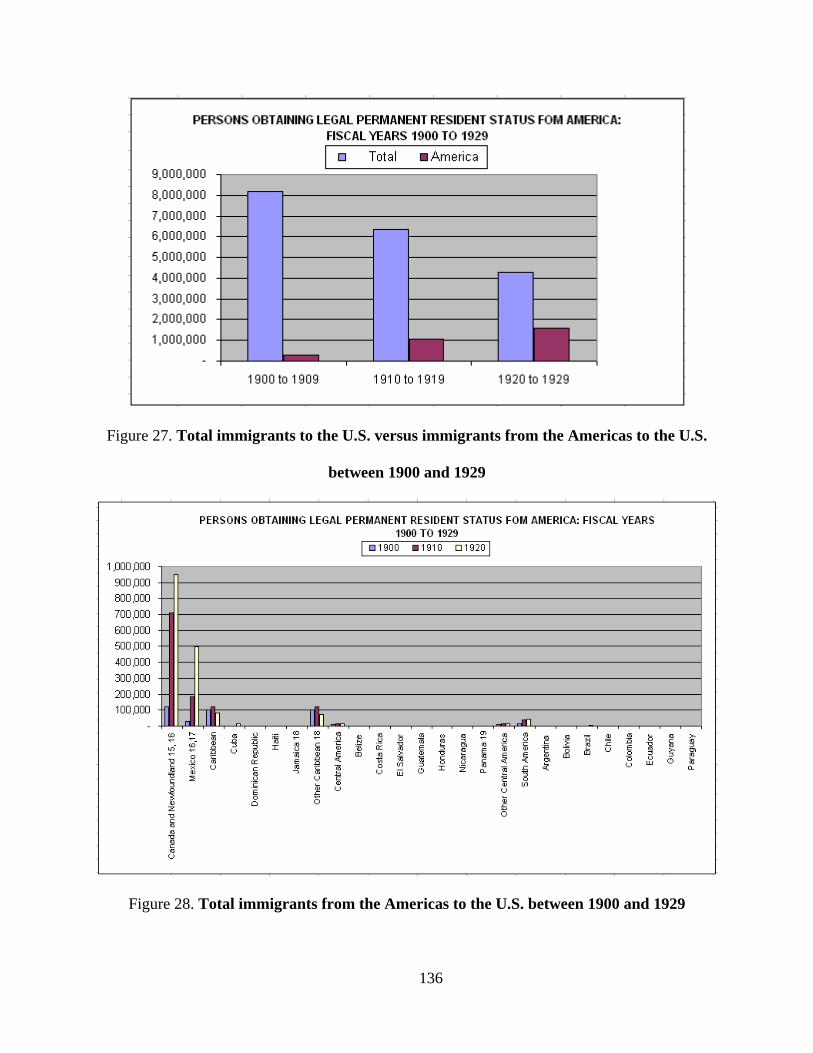
Figure 27. Total immigrants to the U.S. versus immigrants from the Americas to the U.S.
between 1900 and 1929
Figure 28. Total immigrants from the Americas to the U.S. between 1900 and 1929
136
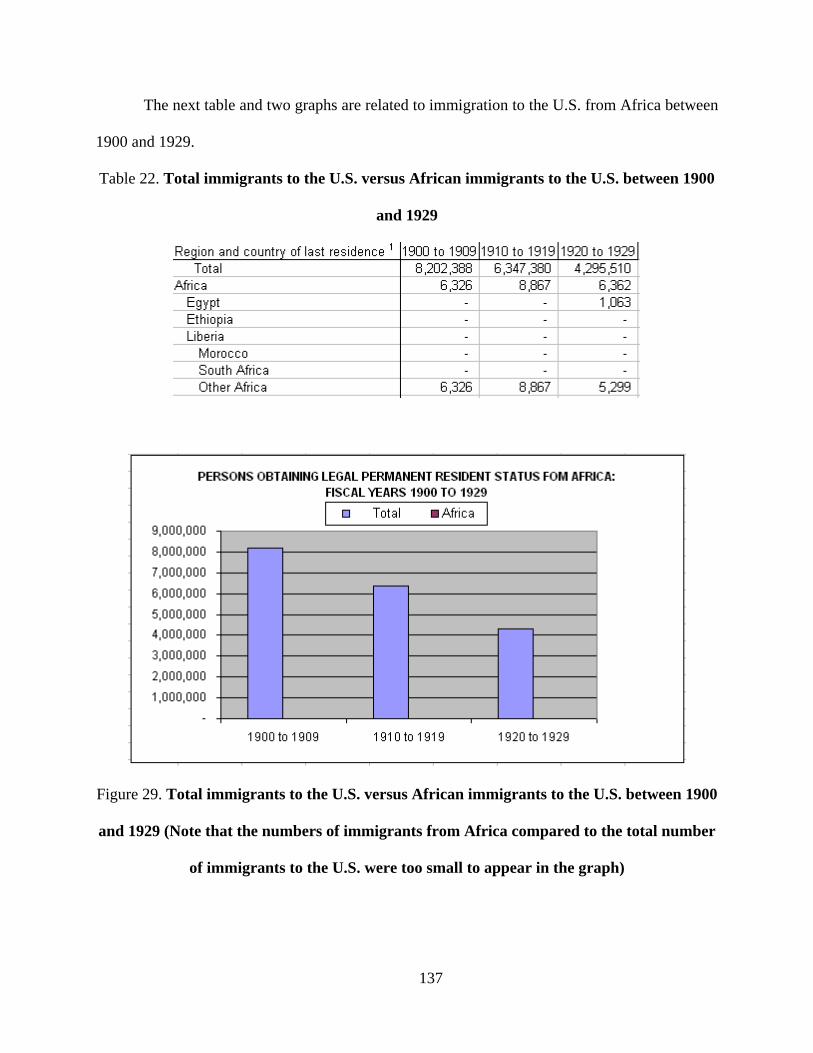
The next table and two graphs are related to immigration to the U.S. from Africa between
1900 and 1929.
Table 22. Total immigrants to the U.S. versus African immigrants to the U.S. between 1900
and 1929
Figure 29. Total immigrants to the U.S. versus African immigrants to the U.S. between 1900
and 1929 (Note that the numbers of immigrants from Africa compared to the total number
of immigrants to the U.S. were too small to appear in the graph)
137
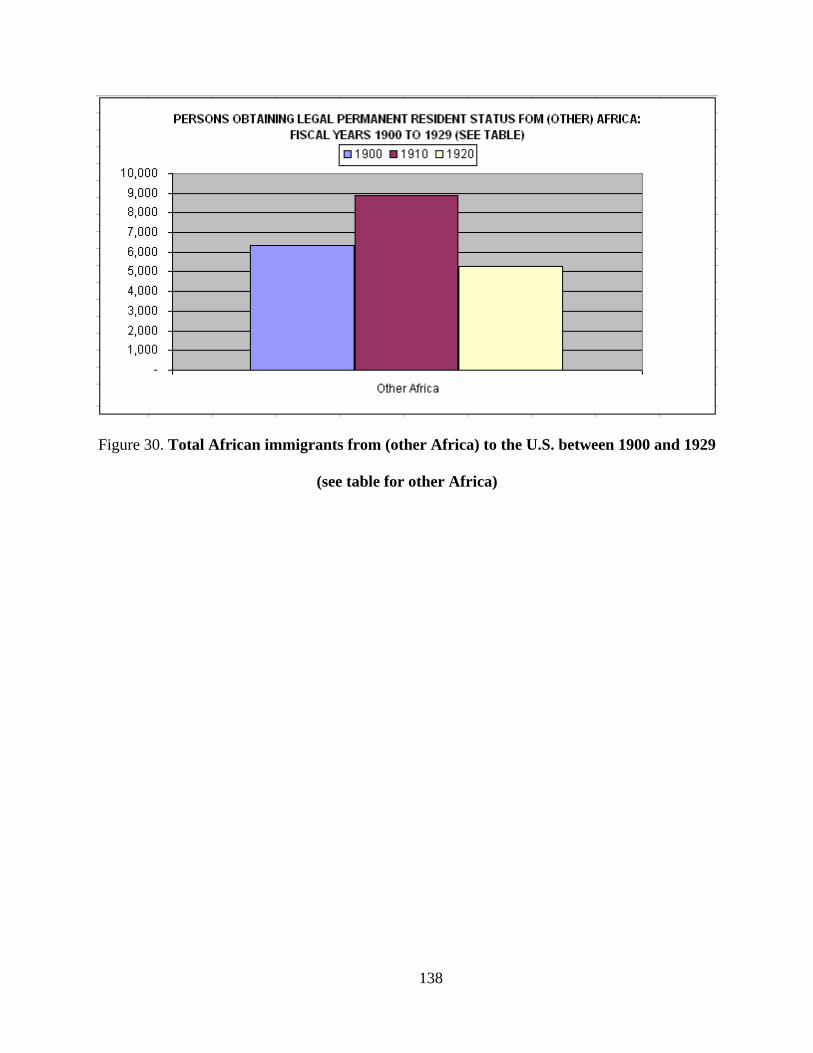
Figure 30. Total African immigrants from (other Africa) to the U.S. between 1900 and 1929
(see table for other Africa)
138
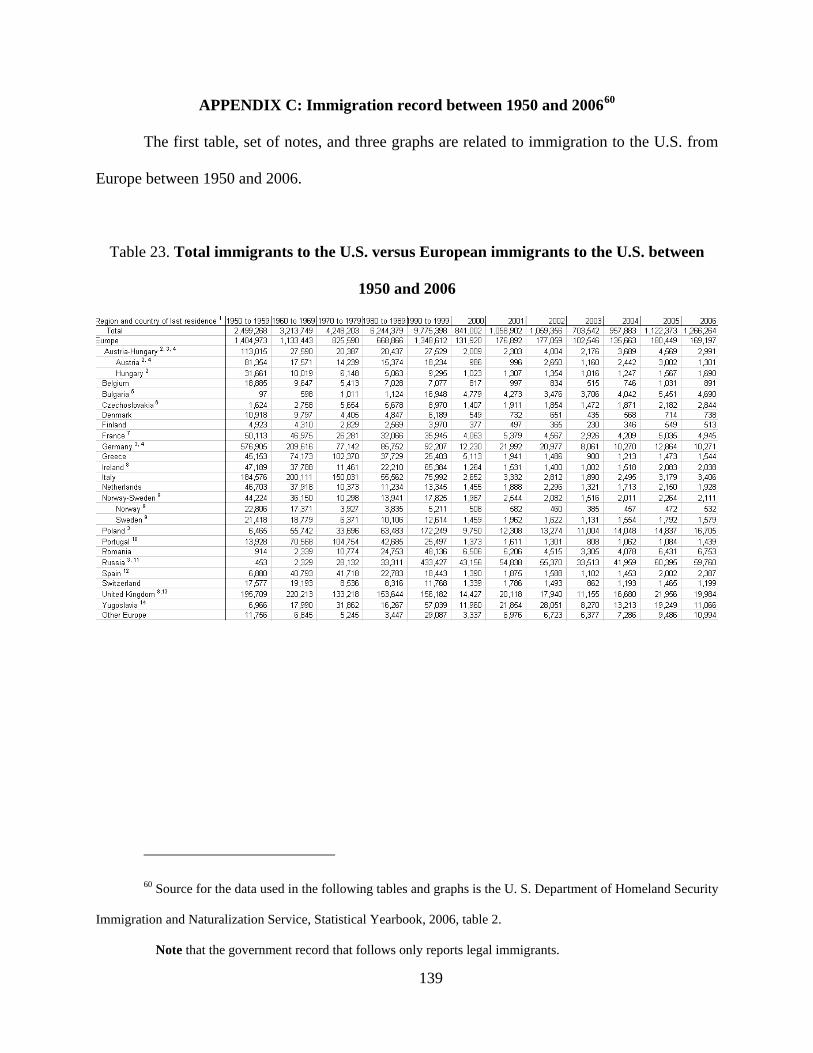
APPENDIX C: Immigration record between 1950 and 200660
The first table, set of notes, and three graphs are related to immigration to the U.S. from
Europe between 1950 and 2006.
Table 23. Total immigrants to the U.S. versus European immigrants to the U.S. between
1950 and 2006
60 Source for the data used in the following tables and graphs is the U. S. Department of Homeland Security
Immigration and Naturalization Service, Statistical Yearbook, 2006, table 2.
Note that the government record that follows only reports legal immigrants.
139
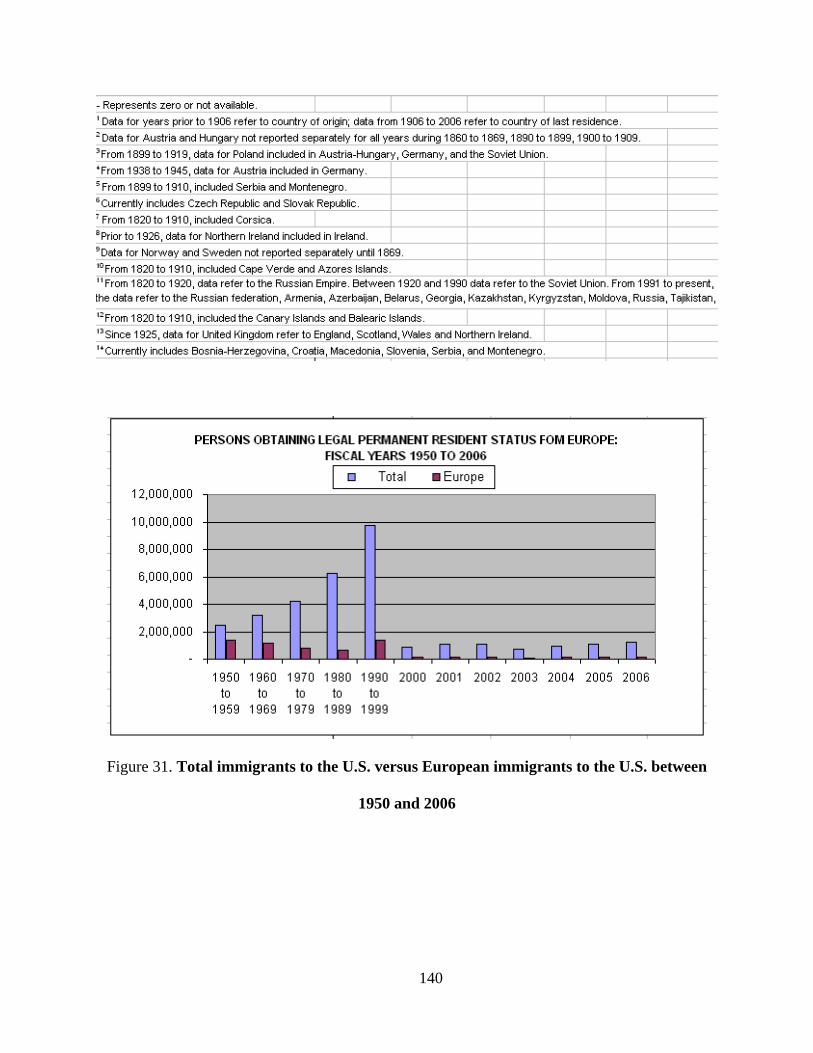
Figure 31. Total immigrants to the U.S. versus European immigrants to the U.S. between
1950 and 2006
140

Figure 32. Total European immigrants to the U.S. between 1950 and 2006
Figure 33. Total European immigrants to the U.S. between 1950 and 2006
141
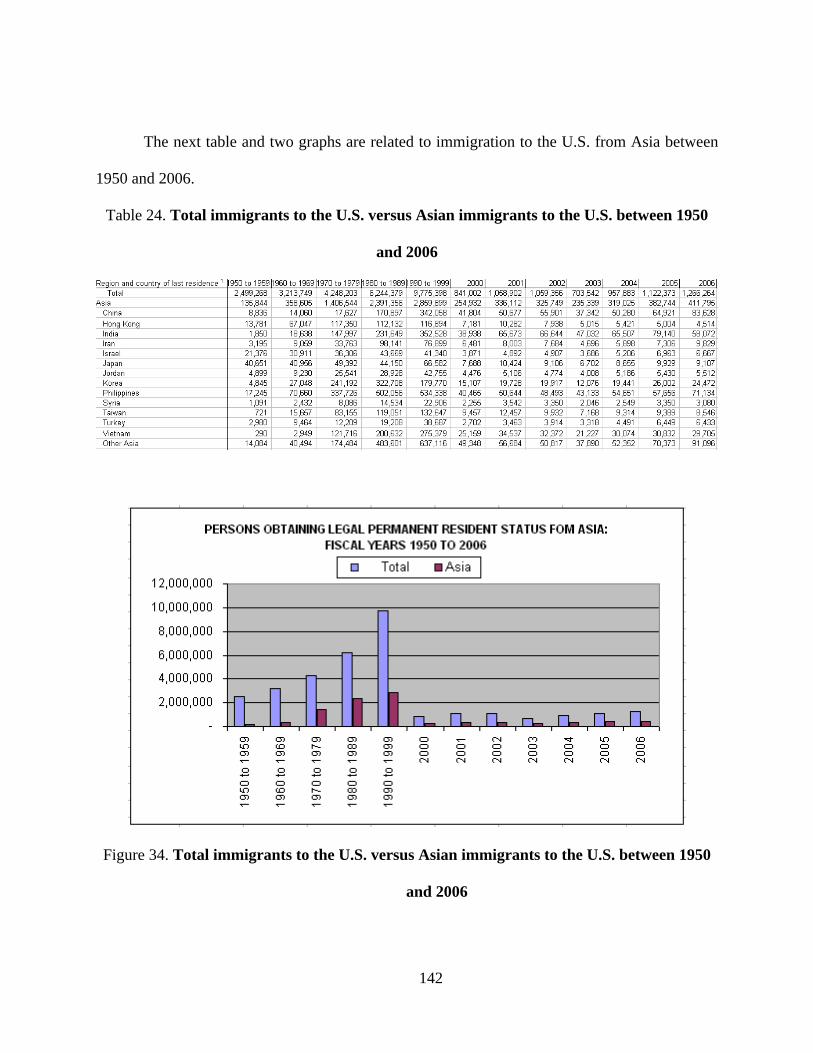
The next table and two graphs are related to immigration to the U.S. from Asia between
1950 and 2006.
Table 24. Total immigrants to the U.S. versus Asian immigrants to the U.S. between 1950
and 2006
Figure 34. Total immigrants to the U.S. versus Asian immigrants to the U.S. between 1950
and 2006
142
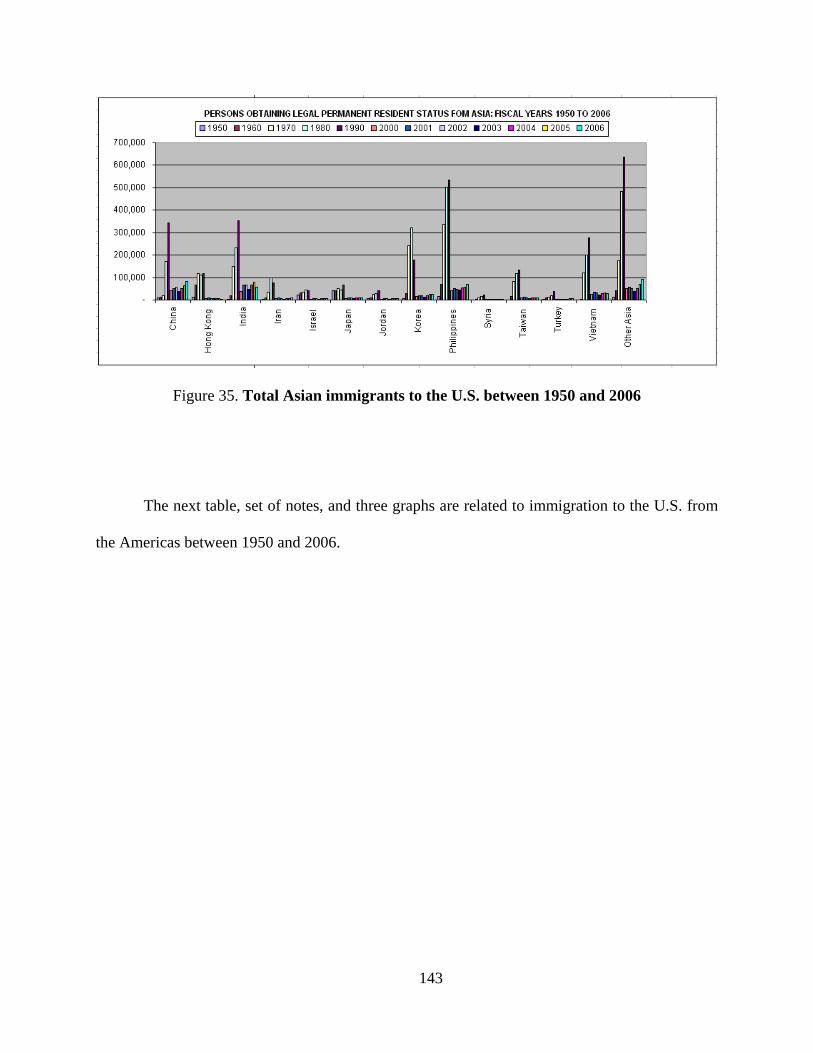
Figure 35. Total Asian immigrants to the U.S. between 1950 and 2006
The next table, set of notes, and three graphs are related to immigration to the U.S. from
the Americas between 1950 and 2006.
143
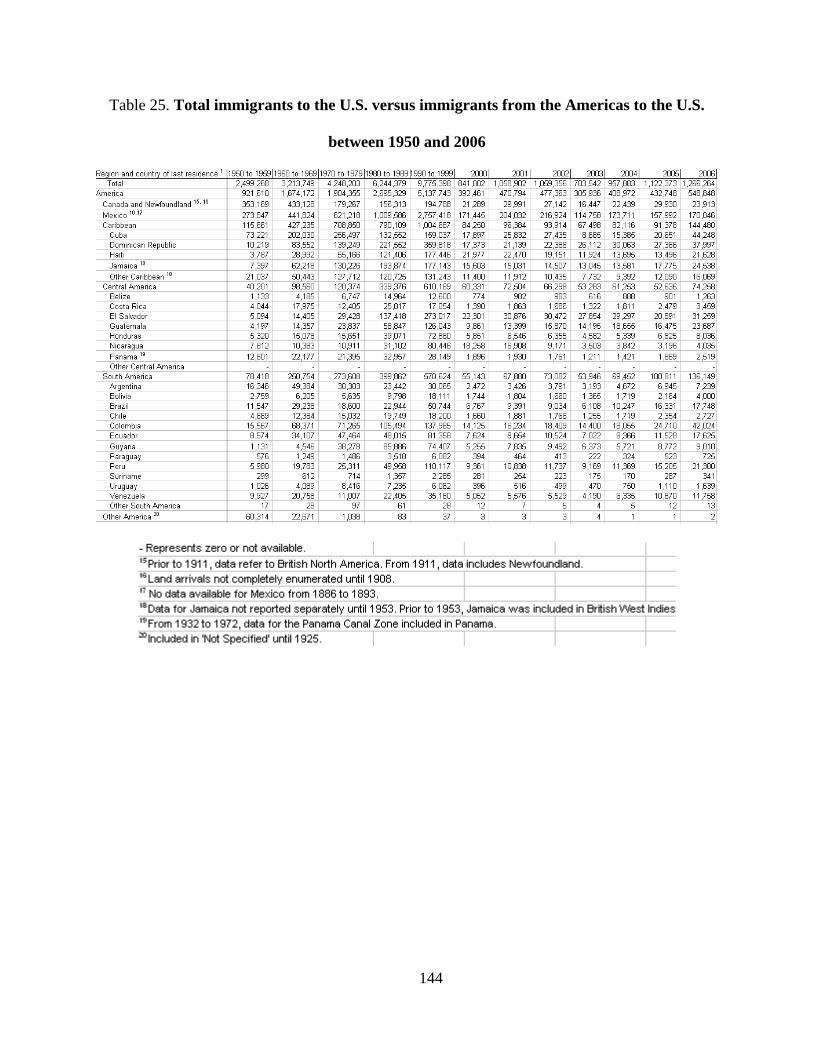
Table 25. Total immigrants to the U.S. versus immigrants from the Americas to the U.S.
between 1950 and 2006
144
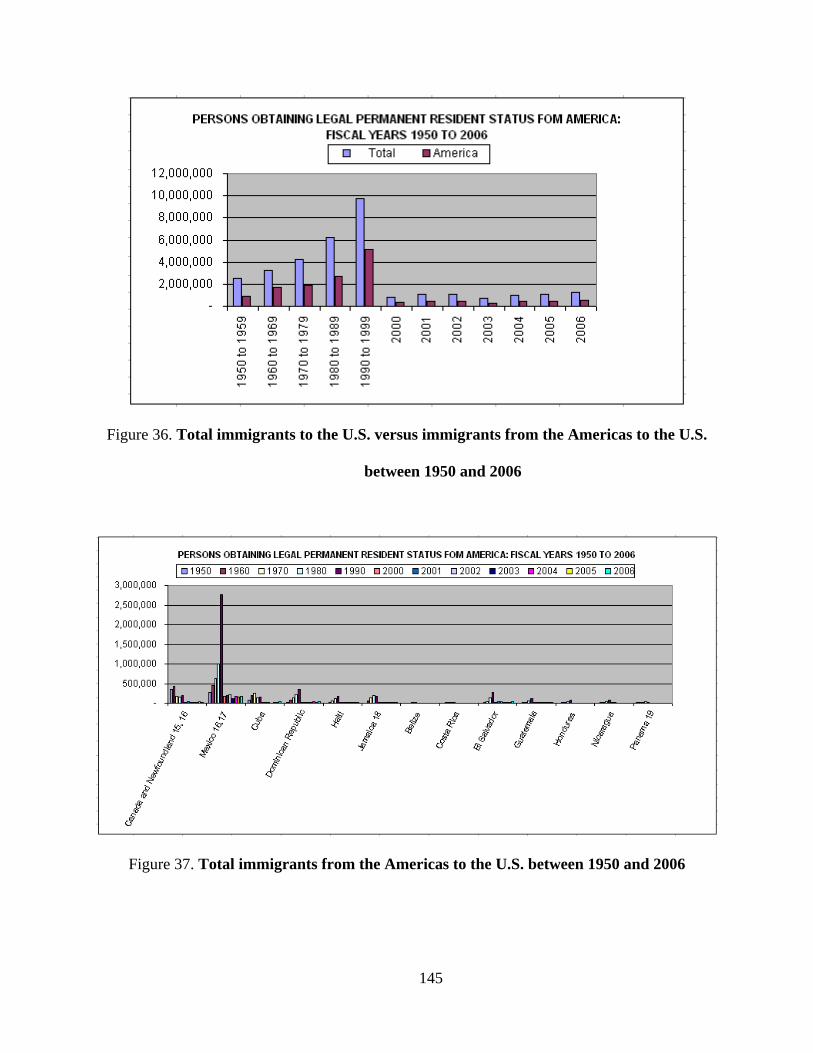
Figure 36. Total immigrants to the U.S. versus immigrants from the Americas to the U.S.
between 1950 and 2006
Figure 37. Total immigrants from the Americas to the U.S. between 1950 and 2006
145
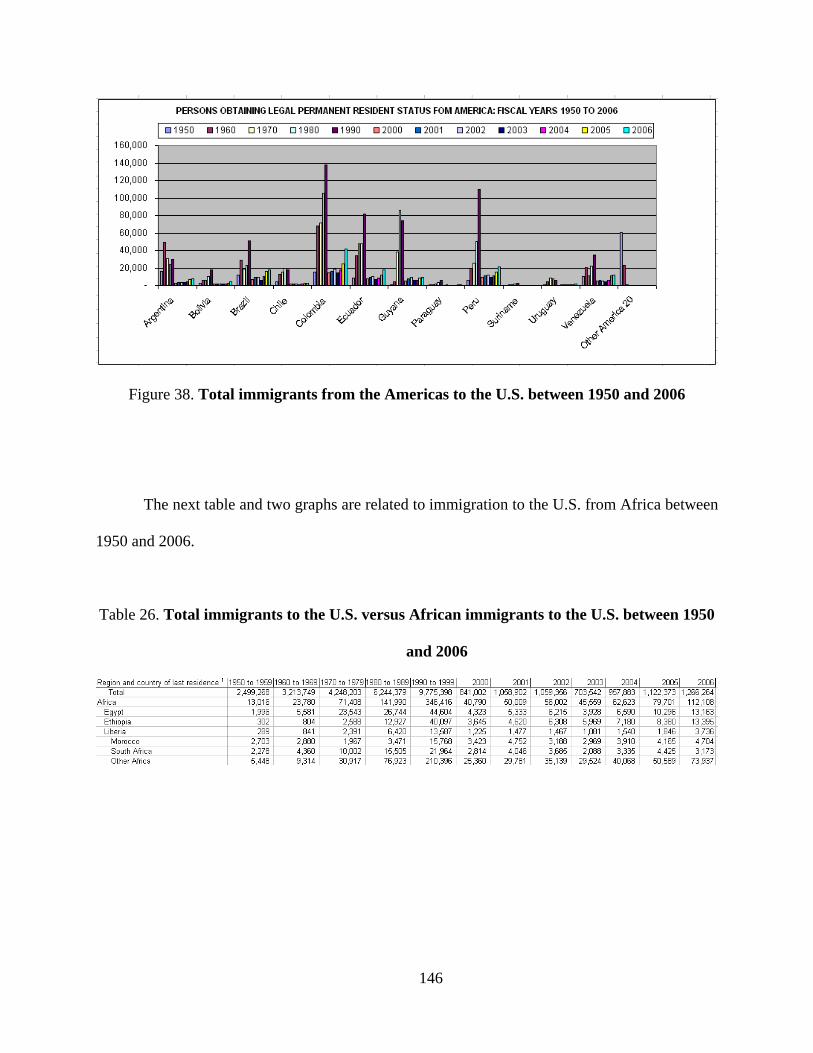
Figure 38. Total immigrants from the Americas to the U.S. between 1950 and 2006
The next table and two graphs are related to immigration to the U.S. from Africa between
1950 and 2006.
Table 26. Total immigrants to the U.S. versus African immigrants to the U.S. between 1950
and 2006
146
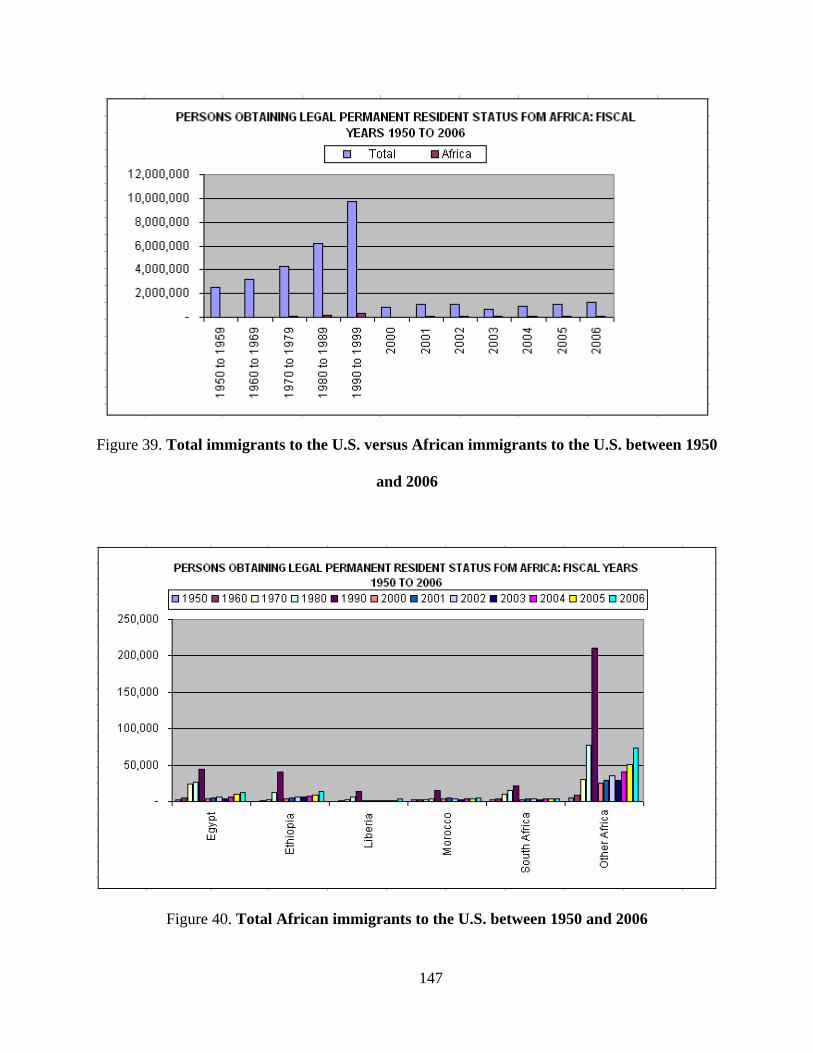
Figure 39. Total immigrants to the U.S. versus African immigrants to the U.S. between 1950
and 2006
Figure 40. Total African immigrants to the U.S. between 1950 and 2006
147
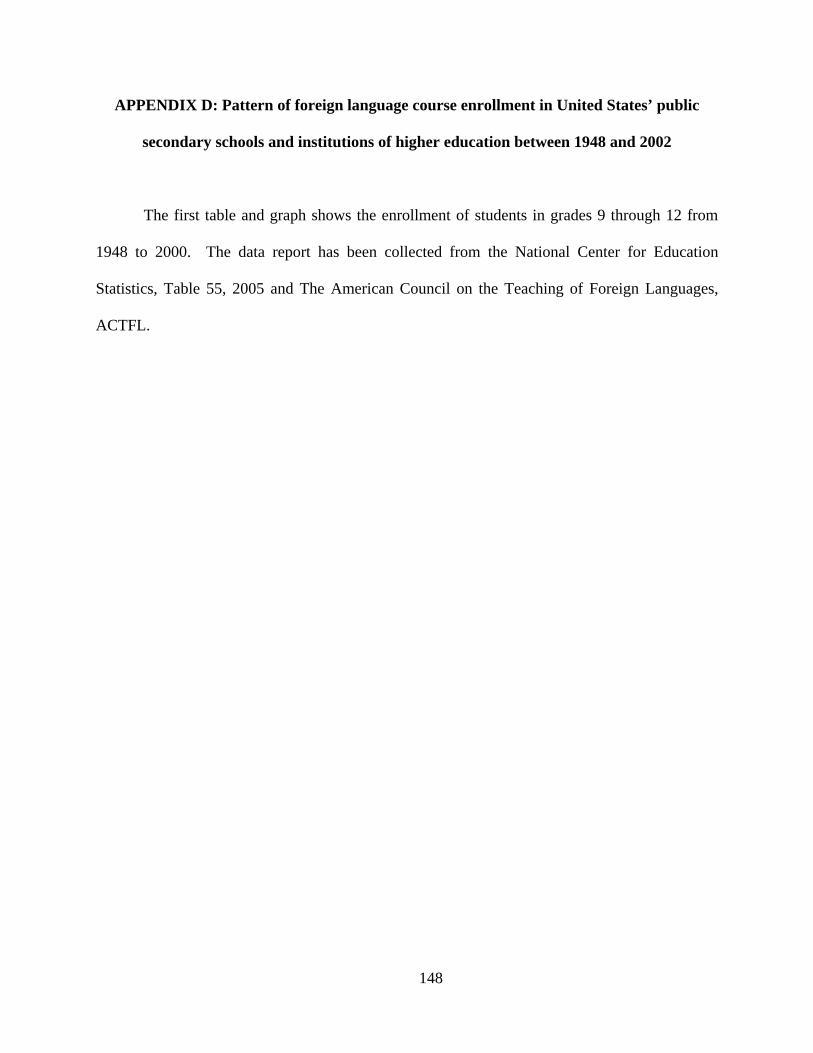
APPENDIX D: Pattern of foreign language course enrollment in United States’ public
secondary schools and institutions of higher education between 1948 and 2002
The first table and graph shows the enrollment of students in grades 9 through 12 from
1948 to 2000. The data report has been collected from the National Center for Education
Statistics, Table 55, 2005 and The American Council on the Teaching of Foreign Languages,
ACTFL.
148
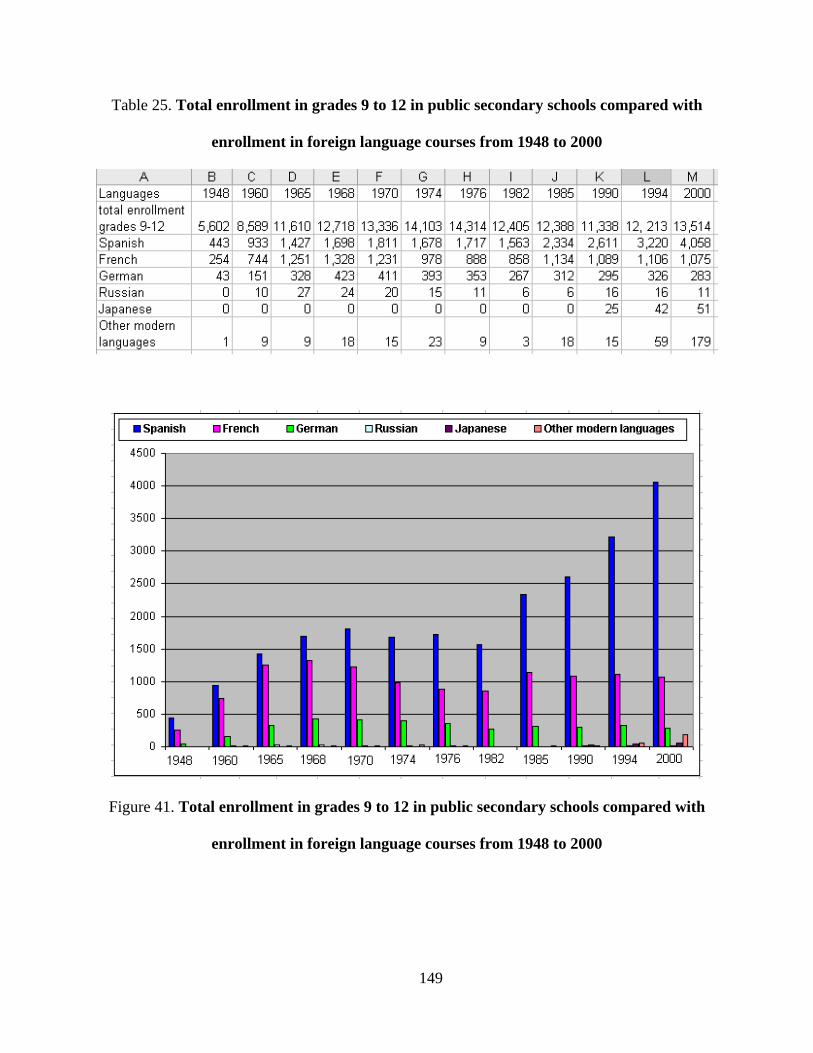
Table 25. Total enrollment in grades 9 to 12 in public secondary schools compared with
enrollment in foreign language courses from 1948 to 2000
Figure 41. Total enrollment in grades 9 to 12 in public secondary schools compared with
enrollment in foreign language courses from 1948 to 2000
149
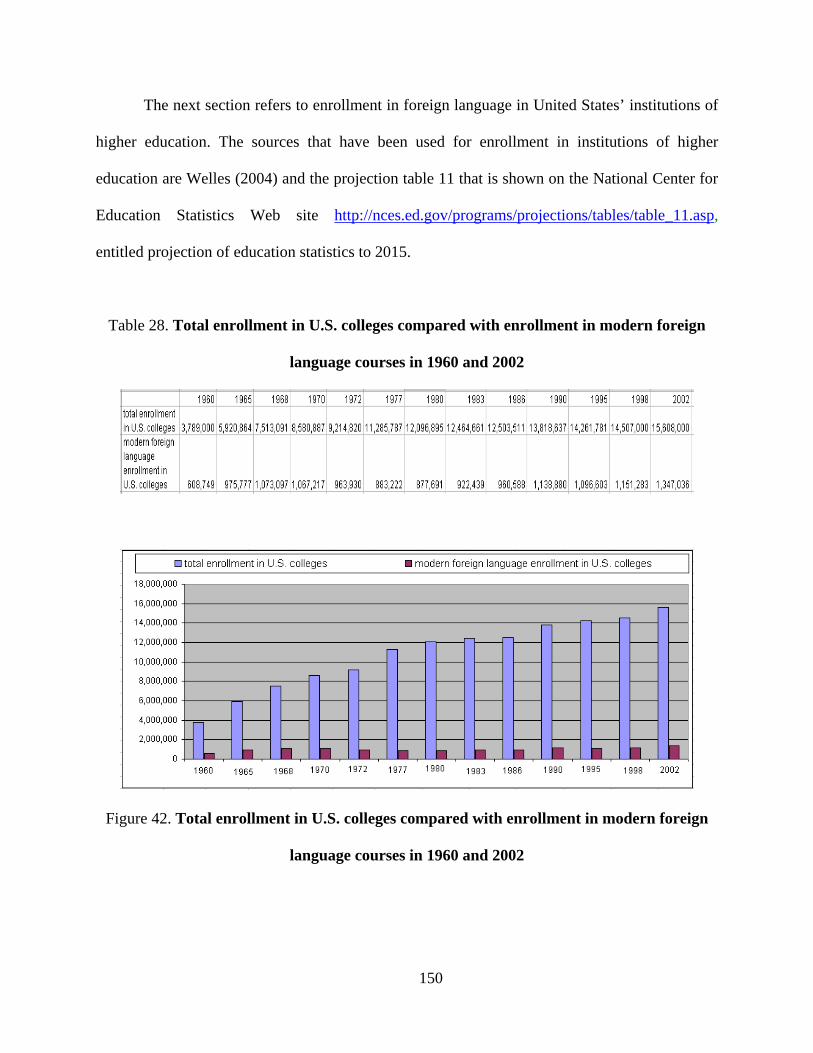
The next section refers to enrollment in foreign language in United States’ institutions of
higher education. The sources that have been used for enrollment in institutions of higher
education are Welles (2004) and the projection table 11 that is shown on the National Center for
Education Statistics Web site http://nces.ed.gov/programs/projections/tables/table_11.asp,
entitled projection of education statistics to 2015.
Table 28. Total enrollment in U.S. colleges compared with enrollment in modern foreign
language courses in 1960 and 2002
Figure 42. Total enrollment in U.S. colleges compared with enrollment in modern foreign
language courses in 1960 and 2002
150
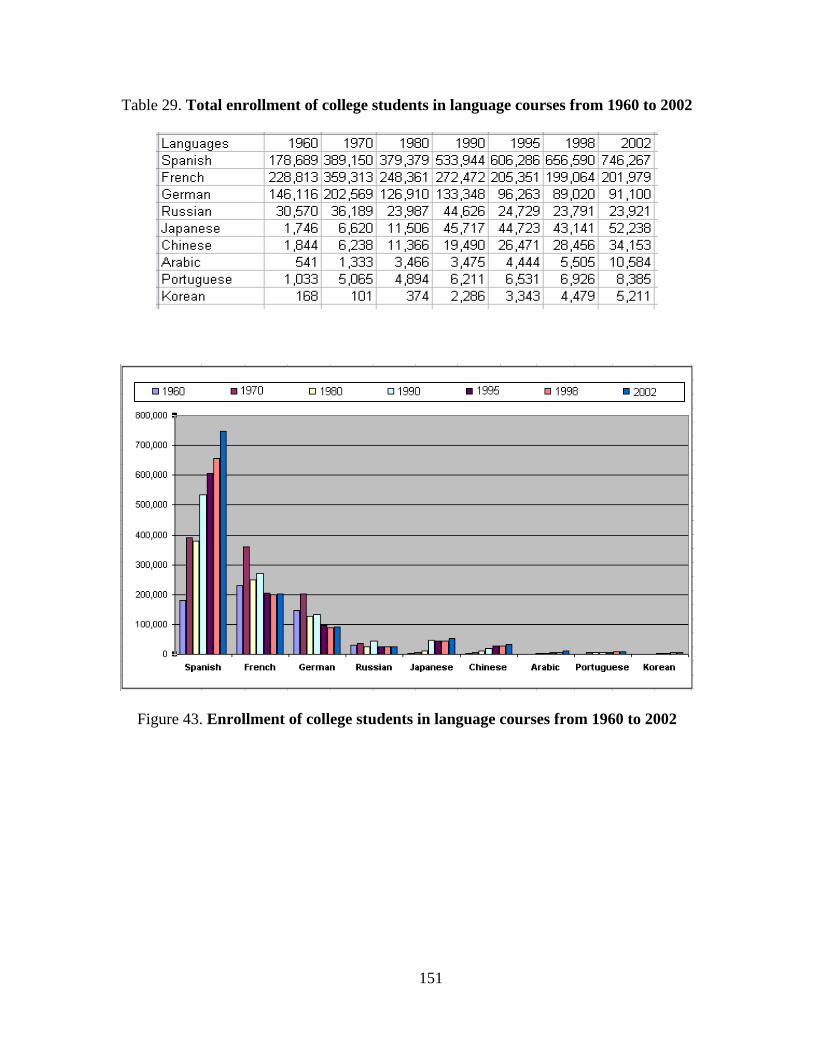
Table 29. Total enrollment of college students in language courses from 1960 to 2002
Figure 43. Enrollment of college students in language courses from 1960 to 2002
151
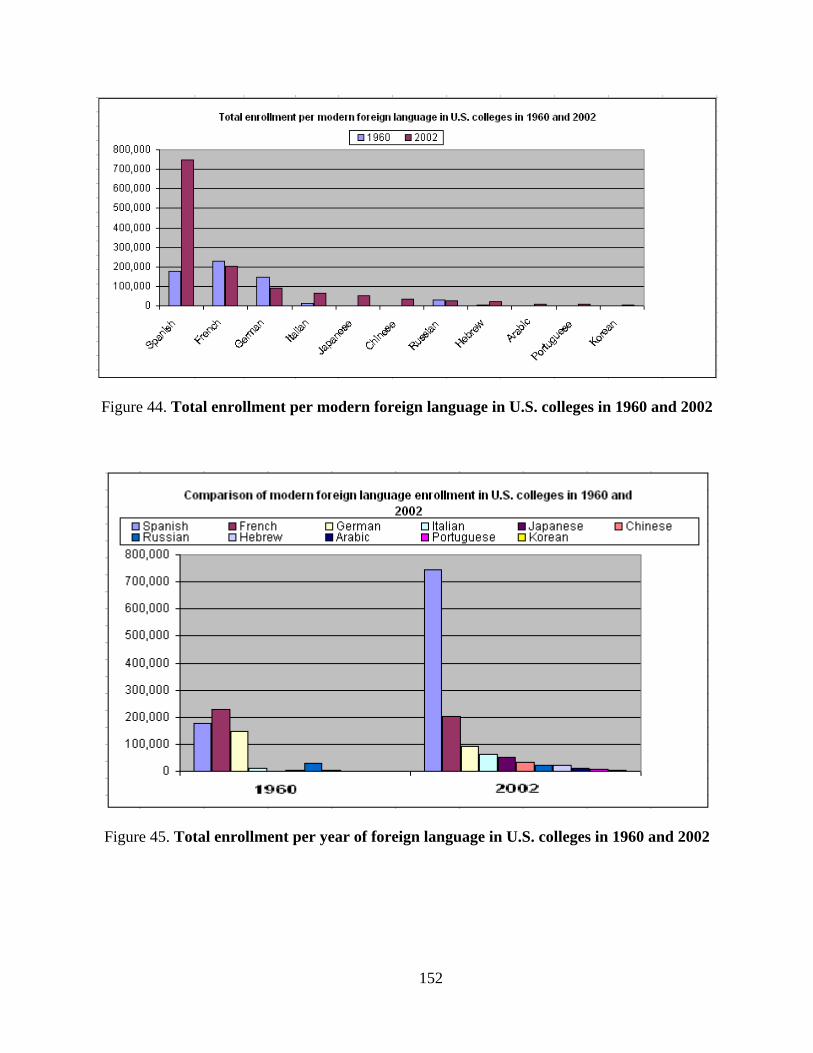
Figure 44. Total enrollment per modern foreign language in U.S. colleges in 1960 and 2002
Figure 45. Total enrollment per year of foreign language in U.S. colleges in 1960 and 2002
152
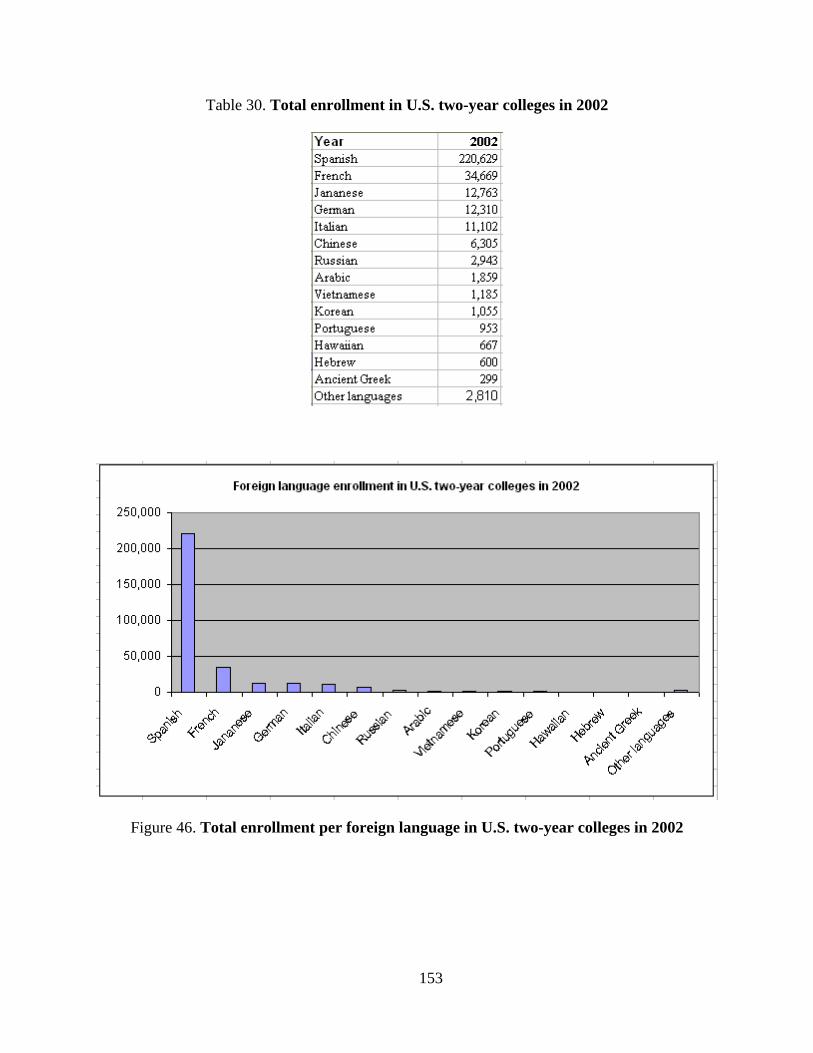
Table 30. Total enrollment in U.S. two-year colleges in 2002
Figure 46. Total enrollment per foreign language in U.S. two-year colleges in 2002
153
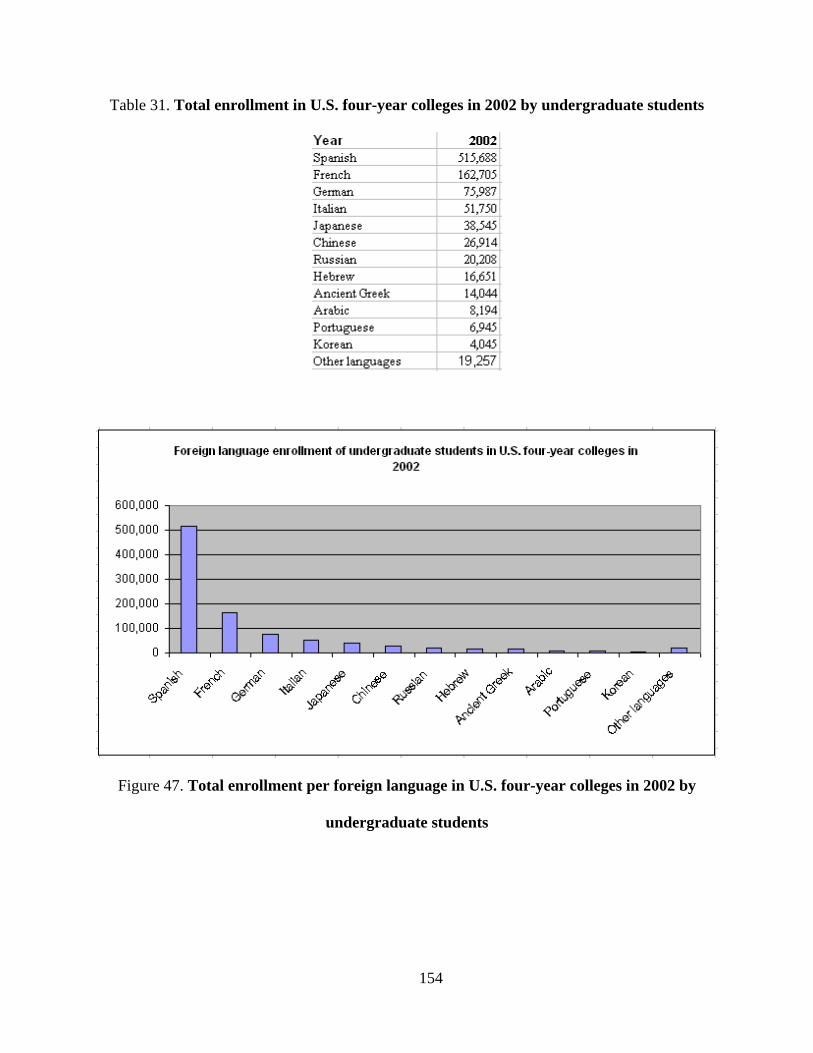
Table 31. Total enrollment in U.S. four-year colleges in 2002 by undergraduate students
Figure 47. Total enrollment per foreign language in U.S. four-year colleges in 2002 by
undergraduate students
154
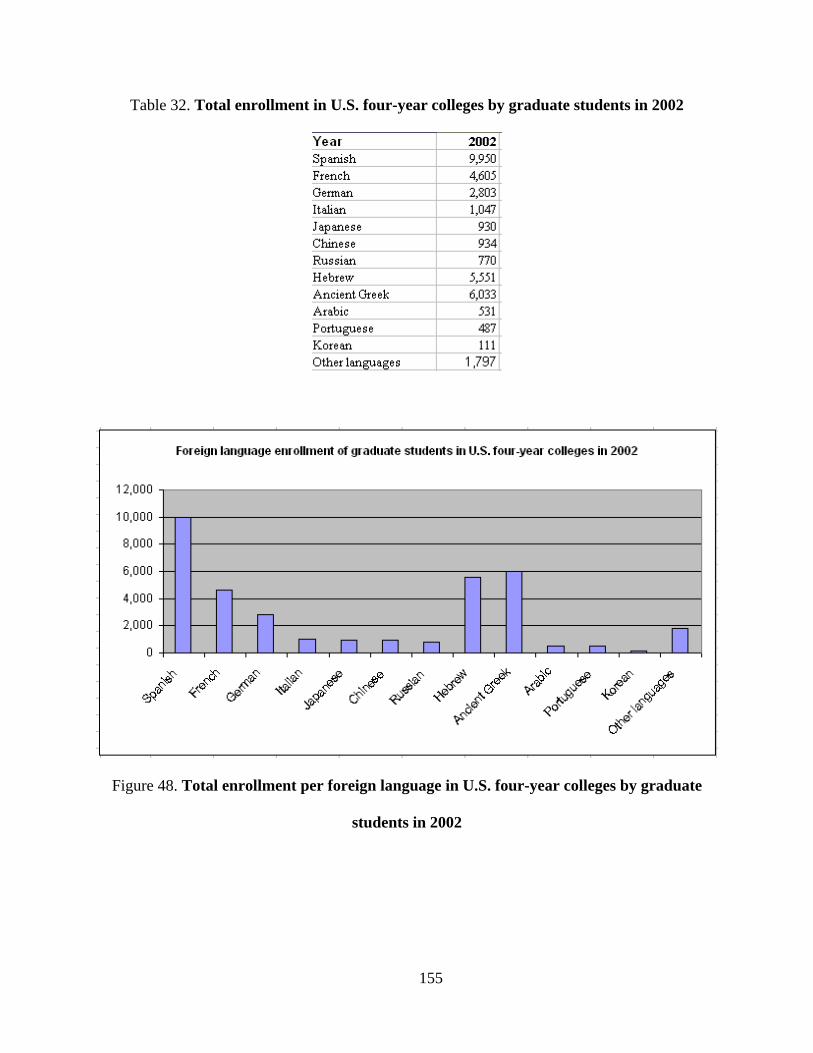
Table 32. Total enrollment in U.S. four-year colleges by graduate students in 2002
Figure 48. Total enrollment per foreign language in U.S. four-year colleges by graduate
students in 2002
155
BIBLIOGRAPHY
Baron, D. (1990). The English-only question: An official language for Americans? Binghamton, NY: Yale University.
Brecht, R. D. & Rivers, W. P. (2000). Language and National Security in the 21st Century: The Role of Title VI/Fulbright-Hays in Supporting National Language Capacity. Dubuque, IA: Kendall/Hunt Publishing Company.
Brecht, R. D. & Rivers, W. P. (2001). Language and national security. Maryland, The National Foreign Language Center at the University of Maryland.
Brecht, R. D. & Walton, R. (Mar., 1994). National strategic planning in the less commonly taught languages. American Academy of Political & Social Science, 532(1), pp. 190-212.
Brecht, R. D. & Walton, R. (2003). National language needs and capacities: A recommendation for action. Abstract The federal government, through Title VI of the Higher Education Act.
Burn, B. B. & Perkins, J. (1980, May). International education in a troubled world. Annals of the American Academy of Political and Social Science, vol. 449, 17-30.
Conant, J. B., (1959). The American high school today. NY: McGraw-Hill Book Company, Inc.
Crawford, J. (1992a). Hold your tongue: Bilingualism and the politics of ‘English only.’ Reading, MA: Addison-Wesley.
Crawford, J. (Ed.). (1992b). Language loyalties: A source book on the official language controversy. Chicago: University of Chicago Press, Ltd.
Crawford, J. (2000). At war with diversity US language policy in an age of anxiety. Great Britain: Cromwell Press Ltd.
Dlabay, L. R. & Scott, J. C. (2001). International Business (2nd ed.). Cincinnati, OH: Thomson Learning, Inc.
Doyle, H. G., Cowan, M. J., Fenton, W. N., Fife, H, R. Freeman, A. S., Graves, M, et al. (Aug., 1948). United States National Commission for the United Nations Educational,
156
Scientific and Cultural Organization: Report of the Panel of Language to the United States National Commission for UNESCO. Hispania, 31(3), 318-320.
Draper, J. B. & Hicks, J. H. (1996). Foreign language enrollments in public secondary schools, fall 1994. Foreign Language Annals, 29(3), 304-306.
Eshelman, J. N. (1964, Sep.). Secondary school foreign-language enrollment and offerings, 1958-62. Modern Language Association, 79(4), 107-112.
Finegan, E. & Rickford, J. R. (2004). Language in the USA: Themes for the twenty-first century. United Kingdom: Cambridge University Press.
Friel, B. (2001, Dec. 3). Bill pushes loans, tuition reimbursement for national security. Govexec.com. Retrieved June 17, 2006, from http://www.govexec.com/
Herriman, M. & Burnaby, B. (1996). Language policies in English-dominant countries. Great Britain: WBC Book Manufacturers Ltd.
Higham, J. (1963). Strangers in the land: Patterns of American nativism 1860-1925. New York: Atheneum.
Kloss, H. (1998). American bilingual tradition. Illinois: Center for Applied Linguistics and Delta Systems Co., Inc.
Krathwohl, D. R. (1993). Methods of educational and social science research: An integrated
approach white plains. New York: Longman. Kroff, A. Y. (1943, Apr.). Education for the peace through the foreign languages. Modern
Language Journal. 27(4), pp. 236-239. Maceri, D. (2006, Jan 25). Foreign language skills can help Americans fight terror. The Japan
Times. Marshal, J. & Heffes, E. M. (2005, Apr.). Financial Executive. Retrieved September 9, 2007,
from http://goliath.ecnext.com/coms2/browse_R_F030. McCrum, R., MacNeil, R., & Cran, W. (2002). The story of English (3rd ed.). New York, NY:
Penguin Group. Nehrt, L. C. (1977). Business and International Education: A report submitted by the Task Force
on business and international education. Washington: American Council on Education. Peterson, T. (2002, Sep. 6). The importance of being multilingual. Business Week Online.
Rosenthal, J. W. (2000). Handbook of undergraduate second language education. Mahwah, N.J.: Lawrence Erlbaum Associates, Publishers.
157
158
Sandrock, P. (2002). Planning Curriculum for Learning World Languages. Wisconsin Department of Education).
San Miguel, Jr., G. (2004). Contested policy: The rise and fall of federal bilingual education in
the United States 1960-2001. Denton, Texas: University of North Texas Press.
Schmid, C. L. (2001). The politics of language: Conflict, identity, and cultural pluralism in comparative perspective. Oxford: University Press.
Schmidt, Sr., R. (2000). Language policy and identity politics in the United States. Philadelphia: Temple University.
Simon, P. (1980). The tongue-tied American. New York: The Continuum Publishing Corporation.
Tare, M. (2006). Assessing the foreign language needs of the Department of Homeland Security: A government-wide effort. Journal of Homeland Security and Emergency Management. 3(1).
Tse, L. (2001). Why don’t they learn English? Separating fact from fallacy in the U.S. language debate. New York, NY: Teachers College Press.
Welles, E. B. (winter, spring, 2004). Foreign language enrollments in United States institutions of higher education, fall 2002. Association of Departments of Foreign Languages, 35(2-3).