the amount of bubble injection on the concentrations of n...
TRANSCRIPT

The amount of bubble injection
on the concentrations of N2 and Ar
in the western North Pacific
Shinichi S. Tanaka
Yutaka W. Watanabe
Graduate School of Environmental Earth Science
Hokkaido University, Japan

Outline
• Using N2 and Ar
• Key word : Preformed sea surface state
• Target : Subsurface water mass
• Amount of bubble injection (B)
Index of preformed wind speed
• Saturation state (A)
Index of preformed barometric pressure
• Climate change will affect value of B and A
• Preformed O2 and CFCs by using B and A

Highlight Dissolved Gases
High Latitudes, Winter
Preformed
Background : Preformed

Highlight Dissolved Gases
High Latitudes, Winter
Preformed
Background : Preformed
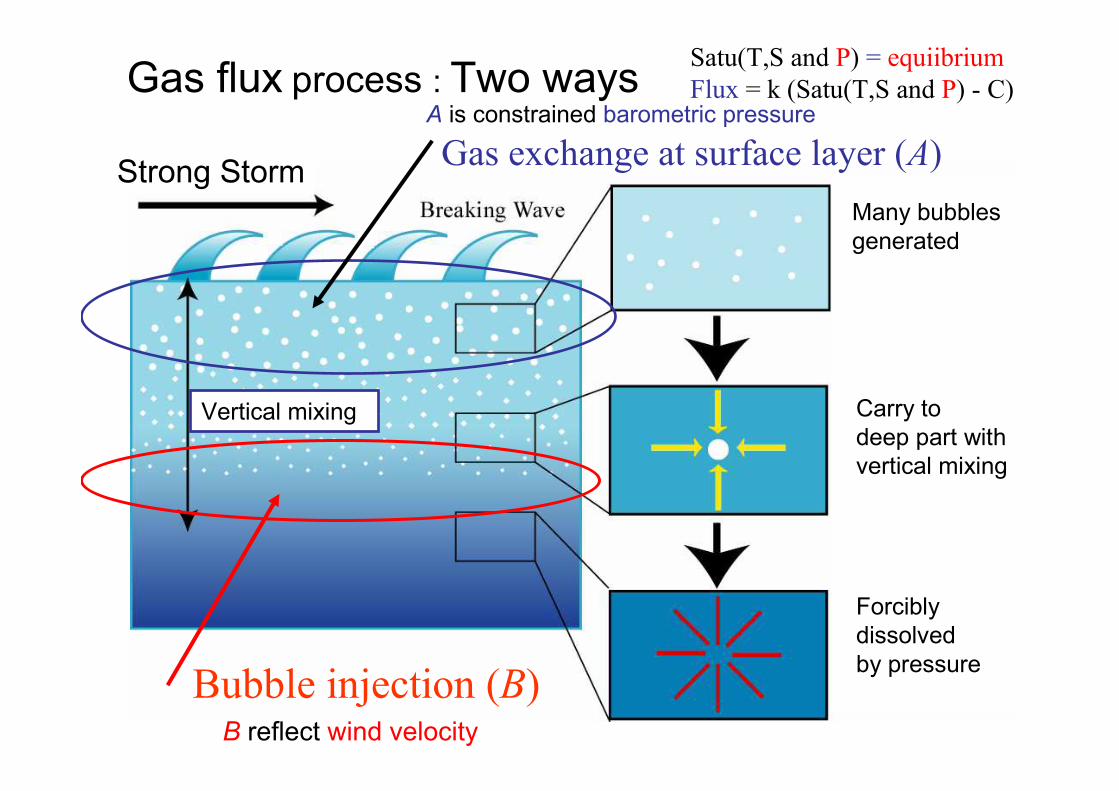
Gas exchange at surface layer (A)
Bubble injection (B)
Many bubbles
generated
Carry to
deep part with
vertical mixing
Forcibly
dissolved
by pressure
Gas flux process : Two ways
Vertical mixing
Strong Storm
A is constrained barometric pressure
B reflect wind velocity
Satu(T,S and P) = equiibrium
Flux = k (Satu(T,S and P) - C)

N2 : Ar = 0.7980 : 0.0090 ~88.7 : Constant
Atmosphere
Solubility N2 : Ar = 1:2
Saturation conc. (winter)
N2 : Ar = 605 : 16.5 ~36.7
+ Bubble injection
Shift ~ 36.7 to ~88.7
N2 and Ar
Conservative contents in subsurface
(Denitrification is very little in water column)

High precision analytical method
(Tanaka and Watanabe, 2007)
Precision < 0.1 %
Thus, concentration of N2 and Ar
in subsurface depend on
preformed surface state !!

N2 obs = A × N2 sat + 0.7809×B ------ (1)
Ar obs = EAr ⋅ A ×Ar sat + 0.0093×B ------ (2)
N2sat, Arsat : Saturation state using by T, S (1 atm., µmol/kg)EAr corrected difference between gas exchange rate of N2 and Ar
Error of B : ±~4 µmol/kg, A± ~0.06
Conc. Surface Gas Exchange Bubble injection
Estimates of A and B by N2 and Ar

Sampling areaHokkaido, Japan
Northern Western
North Pacific
A-line
R/V Hokko-Maru
A4,7,11 and 17
1 station 23 layers
10 ~ 3000m
Sampling
Analytical method
Tanaka and Watanabe,
2007
05 / 2007

Results, θ, S, N2 and Ar conc.
θ
Salinity
N2 (µmol/kg)
Ar (µmol/kg)
A4 A17 A4 A17
A4 A17A4 A17
3000
2000
1000
0
3000
2000
1000
0

Results : A and BA
B (µmol/kg)
0.94
1.00
0
40
High Pre.
Low Pre.
High W. V.
Low W. V.

B vs A on Sigmaθ
B (µmol/kg)
0
40
1.00 0.94
20
AHigh Pressure
and/or long stayLow Pressureand/or short stay, ice cover etcI
Low
wind velocity
High
wind velocity
A7_2000,2500m
1500~2500m 27.75
25.75

B vs A on Sigmaθ
B (µmol/kg)
0
40
1.00 0.94
20
AHigh Pressure
and/or long stayLow Pressureand/or short stay, ice cover etcI
Low
wind velocity
High
wind velocity
A7_2000,2500m
1500~2500m 27.75
25.75
As each water mass had a significantly different value of B and A,
it is possible that we can use B and A
as an index of the preformed sea surface state
and as a water mass indicator.

Saturation state of Preformed Other Gases
SpreZ = (EZ x A x Zsatu + Z Air Conc. ×B) / Zsatu
SpreO296~100%AOU~14 µmol/kg
Over estimated
It is necessary to re-estimate the oceanic uptake
of anthropogenic CO2 by using PreO2

SpreCFC-12
93~98%CFC age
~7 year gap
It is necessary to re-estimate the pCFCs age
by using PreCFCs
Saturation state of Preformed Other Gases
SpreZ = (EZ x A x Zsatu + Z Air Conc. ×B) / Zsatu

Conclusion• Each water mass has characteristic A and B .
• It is possible that we can use B and A as an index of the preformed sea surface state and as a water mass indicator.
• Preformed other gases can be estimated by Aand B. It is necessary to re-estimate the various estimates.
Future Plan• Time series observation
(Climate change, e.g., NPIW)
• Spatial distribution of N2 and Ar
• Correlation between surface condition (P, T, Wind speed) and A, B by time series observation during winter on the sea surface.

Thank you!!