the analysis of convective storms
DESCRIPTION
The Analysis of Convective Storms. Thermodynamic Diagrams. There are three desirable characteristics of atmospheric thermodynamic diagrams: The area enclosed by any cyclic process should be proportional to energy or work. The more straight lines the better. - PowerPoint PPT PresentationTRANSCRIPT

The Analysis of Convective Storms

Thermodynamic Diagrams
There are three desirable characteristics of atmospheric thermodynamic diagrams:
• The area enclosed by any cyclic process should be proportional to energy or work.
• The more straight lines the better.
• The angle between isotherms and dry adiabats should be as large as possible.

• Emagram—Abscissa is T, ordinate is proportional to ln
p. (From energy/mass).• Tephigram—Abscissa is T, ordinate is logarithm of
potential temperature, sometimes diagram is rotated (From T-phi)
• Stuve—Abscissa is T, ordinate is Area is not proportional to energy.
• Skew T-ln p—Similar to emagram, but temperature lines are skewed to increase the angle with dry adiabats.
/ pR cp

Convection Parameters
• Lifted Condensation Level (LCL) – level at which a parcel lifted from the surface will saturate
• Convective Condensation Level (CCL) –level at which a parcel from the surface heating to its convective temperature will saturate
• Convective Temperature – the temperature that the surface layer would need to be heated to to convect

Convection Condensation Level (CCL)
• The convection condensation level is the height to which a parcel of air, if heated from below, will rise to until it’s just saturated. It represents the height of the base of cumulus clouds created by surface heating.
• To determine the CCL, follow the saturation mixing ratio line upward from the surface dewpoint and find the intersection with the T curve.
• The convective temperature can be found by following a dry adiabat downward from the CCL. It represents the temperature that must be reached for the formation of convective clouds.

Lifted Condensation Level
• The lifted condensation level (LCL) is the height at which a parcel becomes saturated when lifted dry adiabatically. It is found by finding the intersection of the saturation mixing ratio line through the surface dewpoint and a dry adiabat through the surface temperature. It’s actually often more realistic to use an average dewpoint for the area near the surface.
Level of Free Convection
• Level of Free Convection (LFC) – level at which a lifted parcel becomes warmer than its surroundings due to the release of latent heat, and hence buoyant. It is found by starting at the LCL and proceeding upward along a moist adiabat until the temperature of the parcel is greater than its surroundings, that is, it crosses the T curve.

Convection Parameters (cont.)
• Level of Free Convection (LFC) – level at which a lifted parcel becomes warmer than its surroundings, and hence buoyant.
• Equilibrium Level (EL) – level at which a previously buoyant parcel’s temperature again equals the environmental temperature. This is an approximate height for thunderstorm anvils.

Convection Parameter (cont.)• Convective Inhibition (CIN) – the
“negative” energy area below a parcel’s level of free convection.
• Convective Available Potential Energy (CAPE) – The “positive” energy area where a parcel is accelerating upward.
• Equilibrium Level (EL) – level at which a previously buoyant parcel’s temperature again equals the environmental temperature. This is an approximate height for thunderstorm anvils.

max
3
down
( ) (ln( ))
2
3 10
2
f
i
p
d p e
p
MaxHail
CAPE R T T d p
V CAPE
D CAPE
V DCAPE

Stability ParametersAll indices are useful diagnostics but should
not be used blindly
• Lifted index (LI)
• Showalter index (SI)
• Total totals (TT)
• Severe Weather Threat Index (SWEAT)
• Bulk Richardson Number
• Storm Relative Helicity
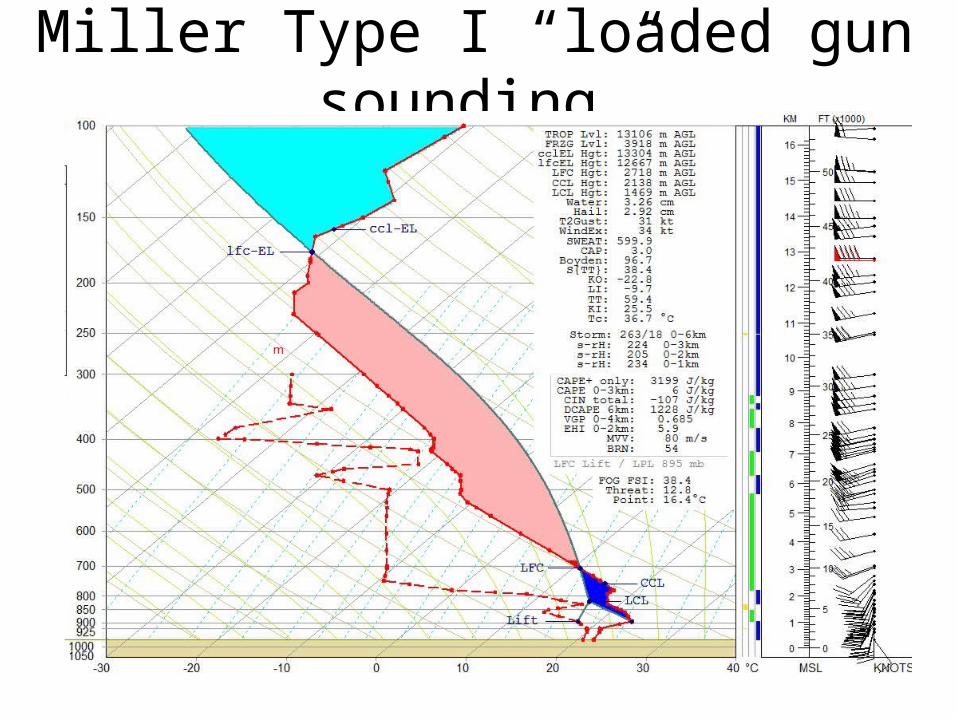
Miller Type I “loaded gun sounding”

Firing gun sounding?

Miller Type IV “Inverted V sounding

Miller Type II (tropical sounding)

Miller Type III Sounding

Thunderstorm Types
• Single cell (pulse)—can be strong, but no severe
• Multicell—can be severe, but don’t generate strong tornadoes
• Supercell—rotating updraft, most severe storms

Single Cell Thunderstorm

Multicell Thunderstorm


Supercell Thunderstorm


Conversion of Horizontal Vorticity to Vertical Vorticity

Storm Splitting


Tornado probability from Storm Prediction Center
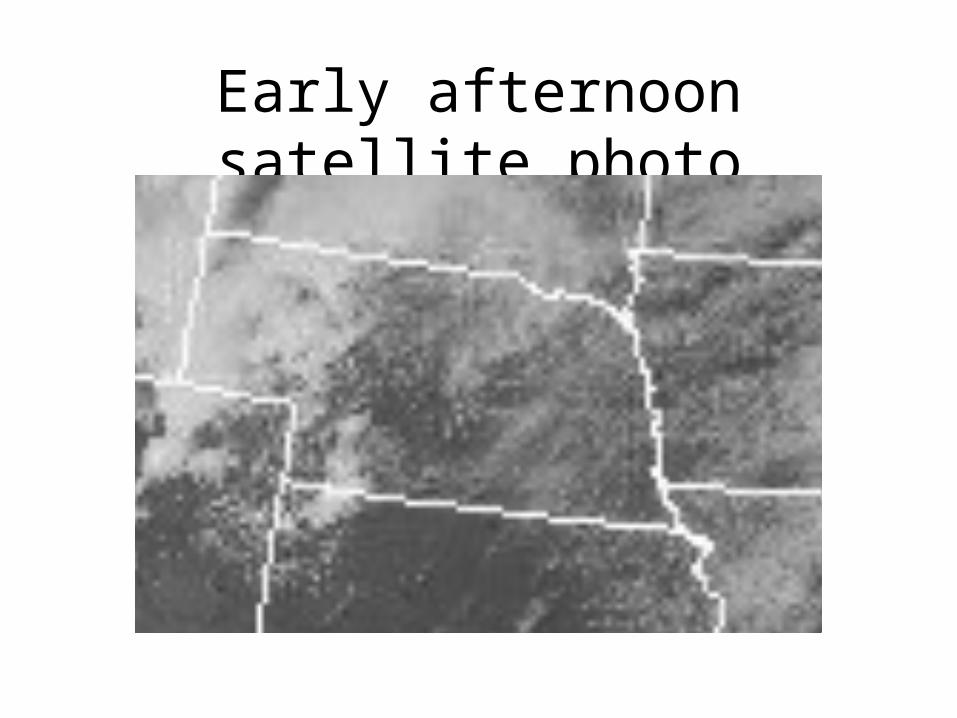
Early afternoon satellite photo
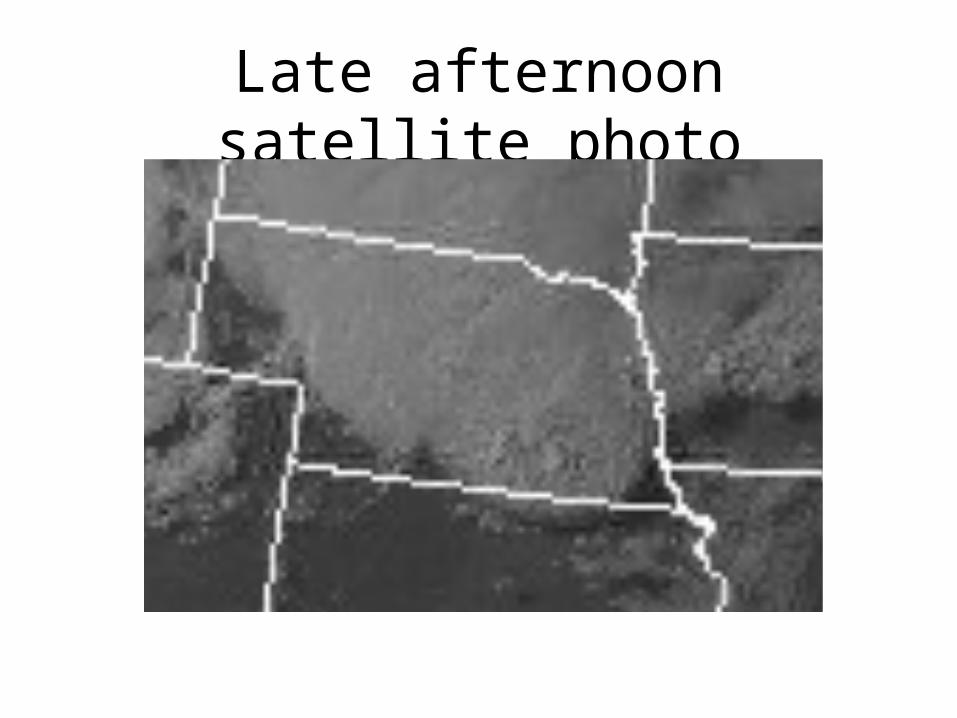
Late afternoon satellite photo