the analytics opportunity in healthcare
TRANSCRIPT
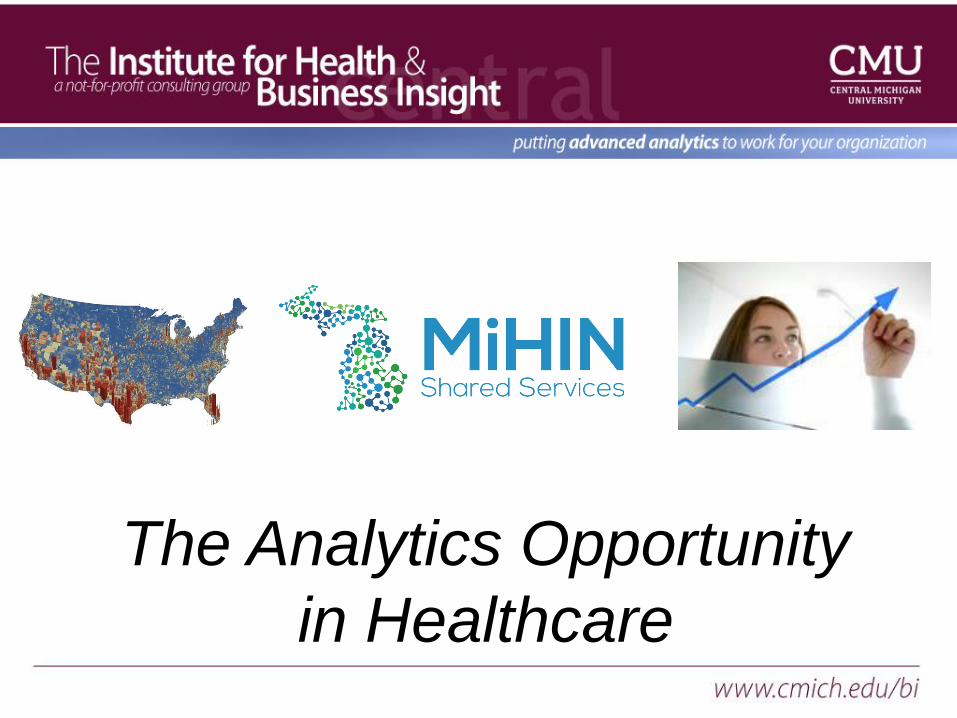
The Analytics Opportunity
in Healthcare
Agenda
• Brief IHBI overview
• Value of Analytics
• Share best/worst project
• Brief MiHIN introduction
• ADT example
• Adding intelligence to the network
2
IHBI@CMU: Snapshot
Founded in 2001 as a center of excellence specializing in data mining and predictive
analytics.
Purpose
• Promote the application of predictive analytics to solve social, economic and
business challenges
• Build bridges between the public and private sector
• Train the next generation of data scientists
2010
• Moved under the auspices of the Herbert H. and Grace A. Dow College of Health
Professions
• Specifically charged to develop a focus on healthcare
Team
• PhD and MS in physics, statistics, economics, computer science, geography, etc.
3
Customers and Partners
Health and Healthcare
• Central Michigan District Health Dept.
• College of Health Professions, CMU
• College of Medicine, CMU
• Eli Lilly
• Henry Ford Health System
• Michigan Health Information Alliance
• Michigan Health Information Network
• Partners Healthcare (Boston)
• Spectrum Health System
• Synergy Medical
Manufacturing
• The Dow Chemical Company
• The Dow Corning Corporation
• Ford Motor Company
• General Motors
• Harley-Davidson
• Monsanto
• Steelcase
• Whirlpool Corporation
Technology
• IBM
• SAS Institute
• Hewlett-Packard (EDS)
• Greenplum Pivotal
Banking, Finance, Insurance
• Auto-Owners Insurance
• Comerica Bank
Other
• Proctor and Gamble
• DTE Energy
• Domino's Pizza
• Gordon Food Service
• State of Michigan
4

Data Science & Big Data
Reporting
Queries/drill down
Alerts
Statistical Analysis
Forecasting
Predictive Modeling
Optimization
What happened?
Where is the problem?
What action are needed?
Why is this happening?
What if these trends continue?
What will happen next?
What is the best that can happen?
An
aly
tica
lly im
pa
ired
Adapted from Competing on Analytics: The New Science of Winning (Davenport, 2007).
5
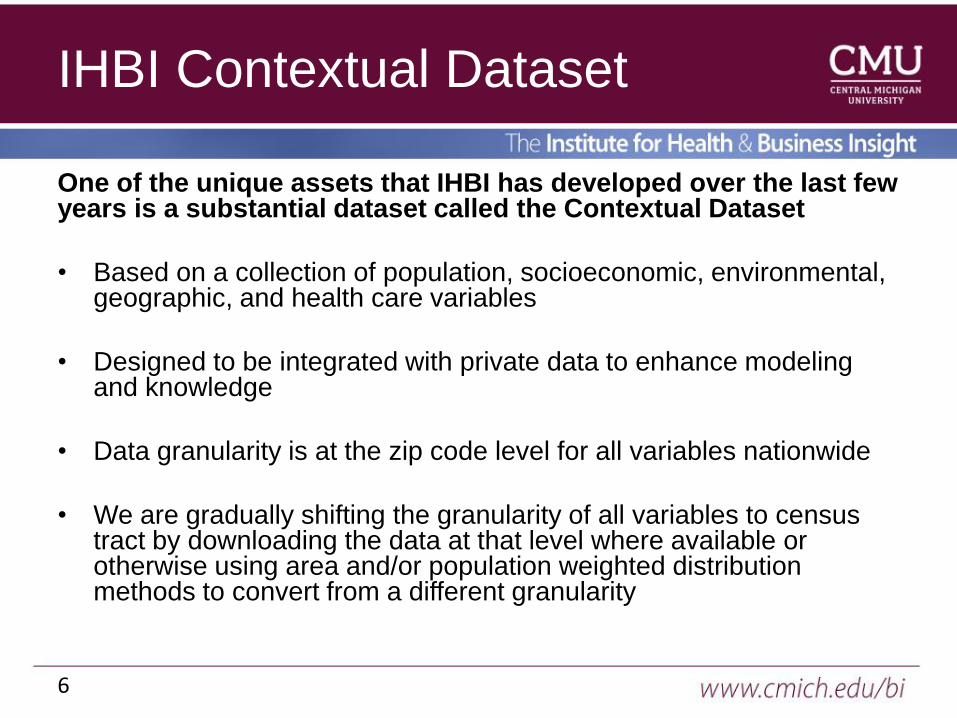
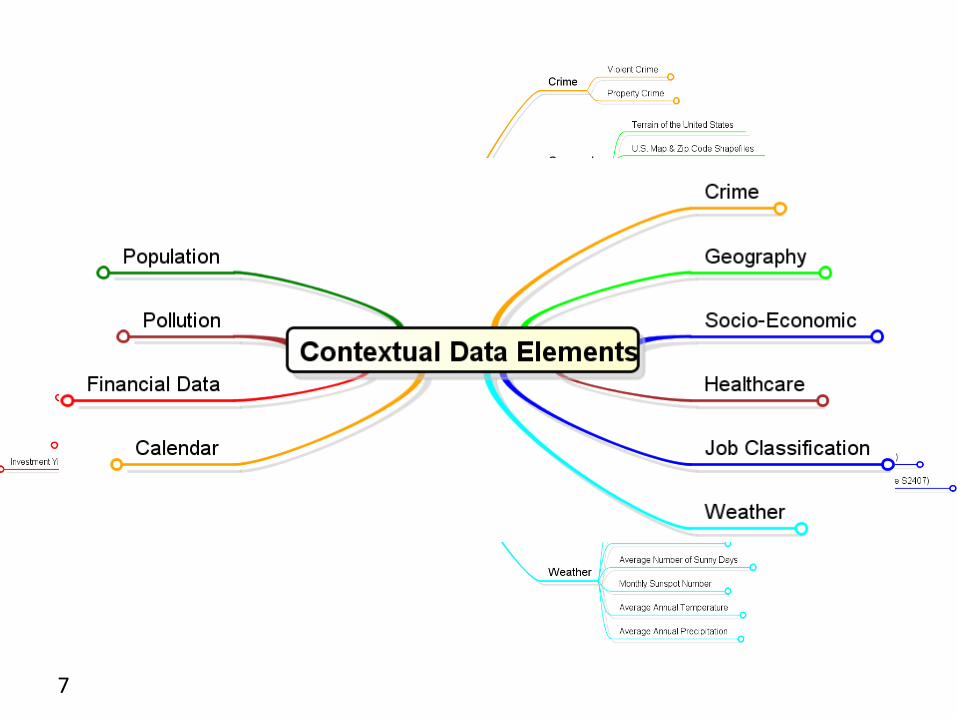
IHBI Contextual Dataset
One of the unique assets that IHBI has developed over the last few years is a substantial dataset called the Contextual Dataset
• Based on a collection of population, socioeconomic, environmental, geographic, and health care variables
• Designed to be integrated with private data to enhance modeling and knowledge
• Data granularity is at the zip code level for all variables nationwide
• We are gradually shifting the granularity of all variables to census tract by downloading the data at that level where available or otherwise using area and/or population weighted distribution methods to convert from a different granularity
6
7
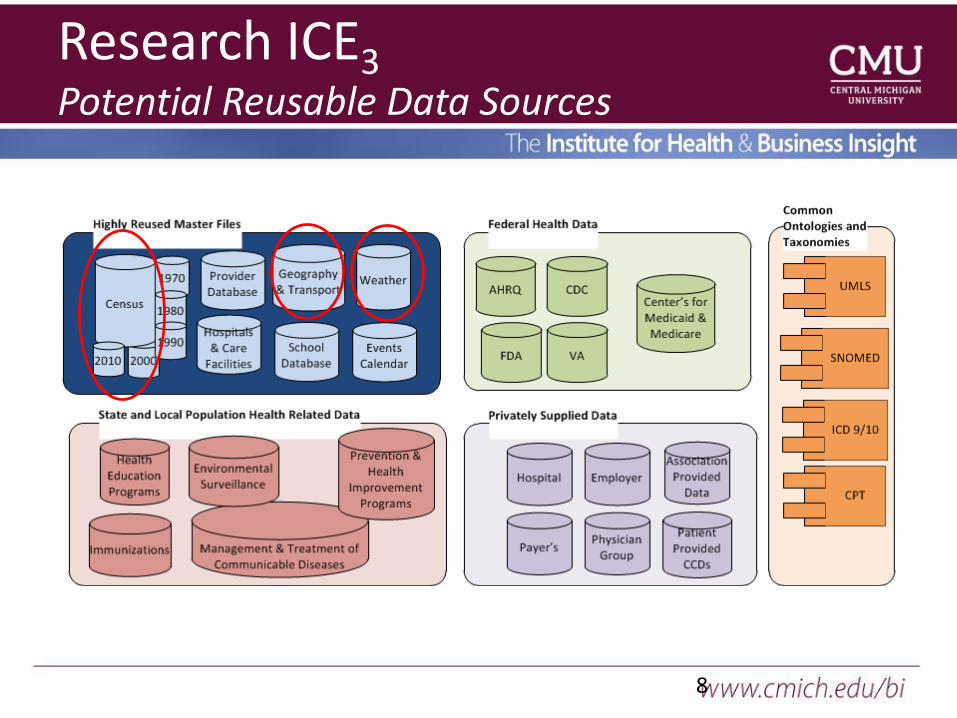
Research ICE3Potential Reusable Data Sources
8
9
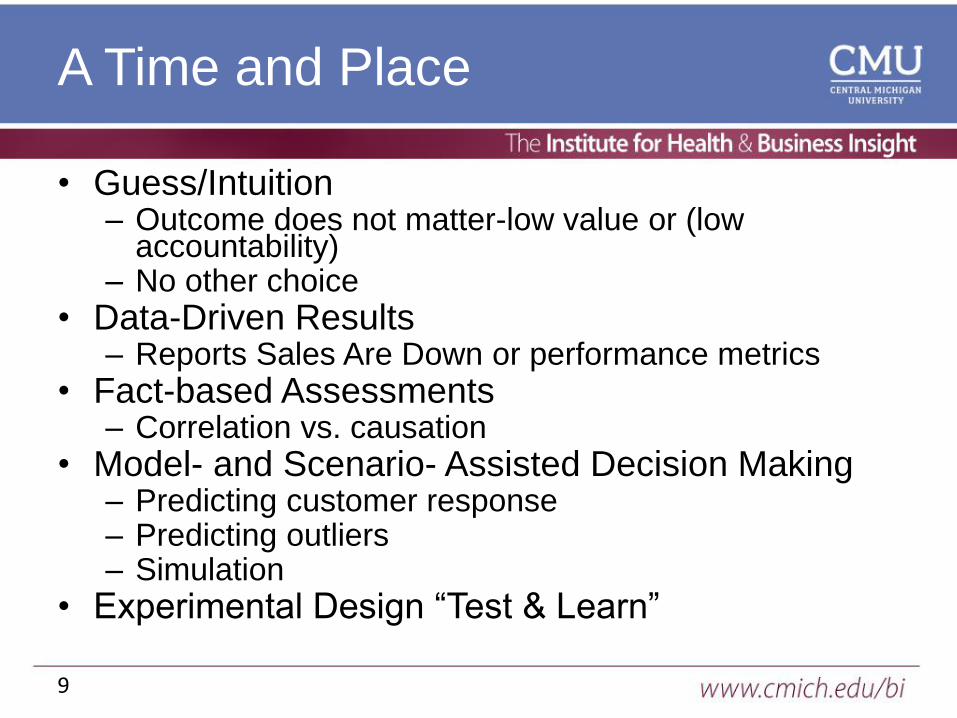
A Time and Place
• Guess/Intuition– Outcome does not matter-low value or (low
accountability)– No other choice
• Data-Driven Results– Reports Sales Are Down or performance metrics
• Fact-based Assessments– Correlation vs. causation
• Model- and Scenario- Assisted Decision Making– Predicting customer response– Predicting outliers– Simulation
• Experimental Design “Test & Learn”
10
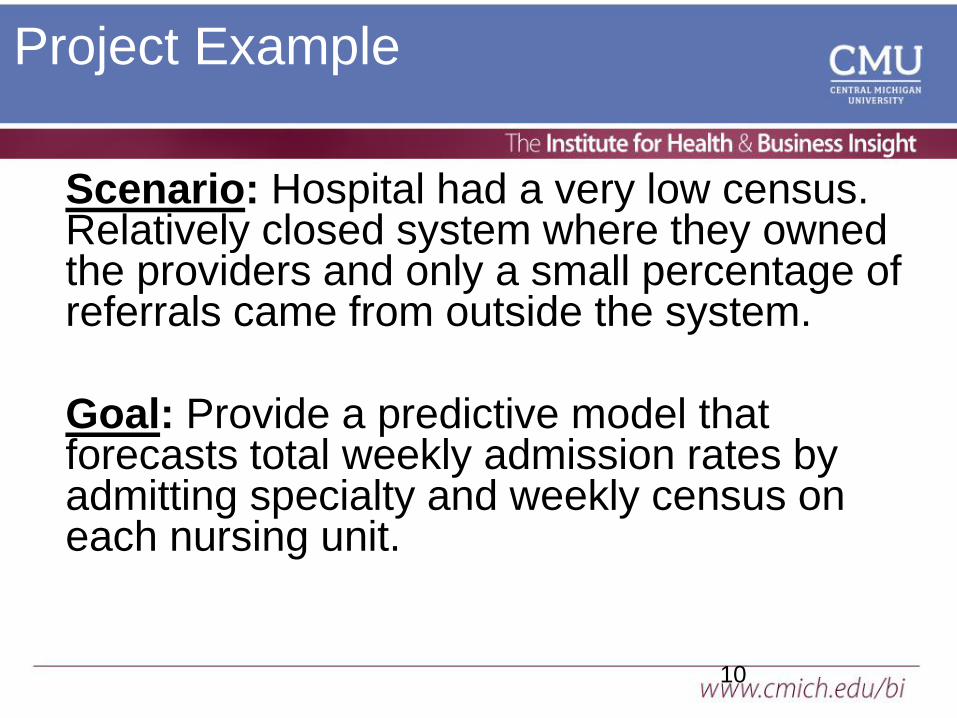
Project Example
Scenario: Hospital had a very low census. Relatively closed system where they owned the providers and only a small percentage of referrals came from outside the system.
Goal: Provide a predictive model that forecasts total weekly admission rates by admitting specialty and weekly census on each nursing unit.

11
Roadmap
Patient
Encounters
PEMSMedical
Records
Classify records:
a=I wi. E or O
b= no I
c=I w/o E or O
a b c
External
referrals
Map weekly
admits to
day-of-week
Seq
Rules
Recent
E/R &
Outpt
Internal
referrals
Admits
by week by
DR_SPEC
Map DR_SPEC
to LOS &
NUR_UNIT
Forecast
integration
DEMAND
beds per
NUR_UNIT
Major
Deliverable
To Capacity &
resource planning
List of
unusual
events
12
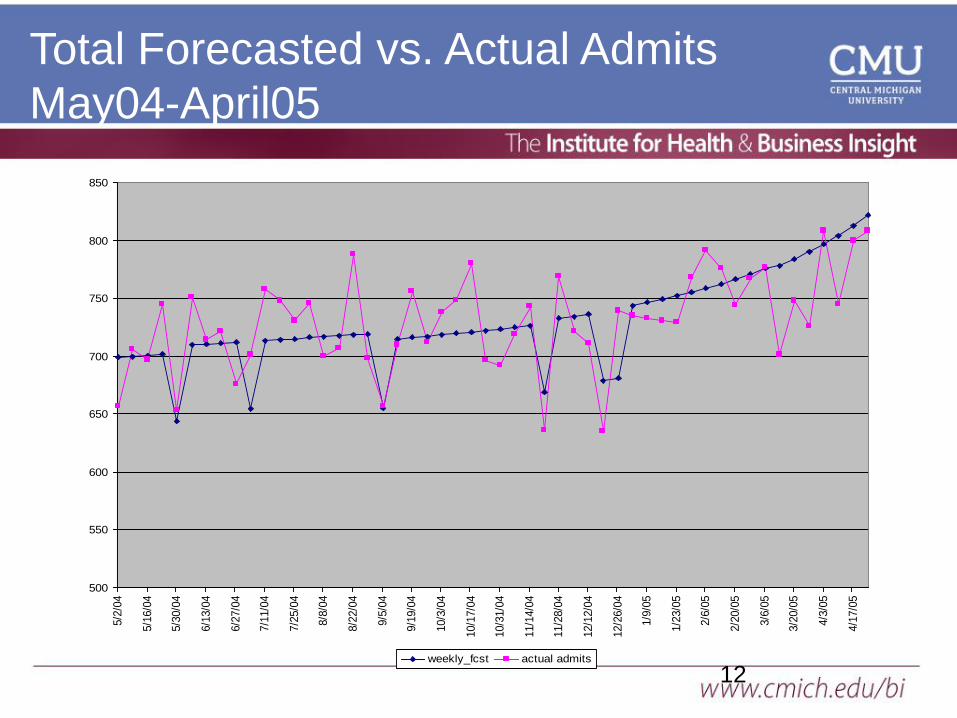
Total Forecasted vs. Actual Admits
May04-April05
500
550
600
650
700
750
800
850
5/2
/04
5/1
6/0
4
5/3
0/0
4
6/1
3/0
4
6/2
7/0
4
7/1
1/0
4
7/2
5/0
4
8/8
/04
8/2
2/0
4
9/5
/04
9/1
9/0
4
10/3
/04
10/1
7/0
4
10/3
1/0
4
11/1
4/0
4
11/2
8/0
4
12/1
2/0
4
12/2
6/0
4
1/9
/05
1/2
3/0
5
2/6
/05
2/2
0/0
5
3/6
/05
3/2
0/0
5
4/3
/05
4/1
7/0
5
weekly_fcst actual admits
13
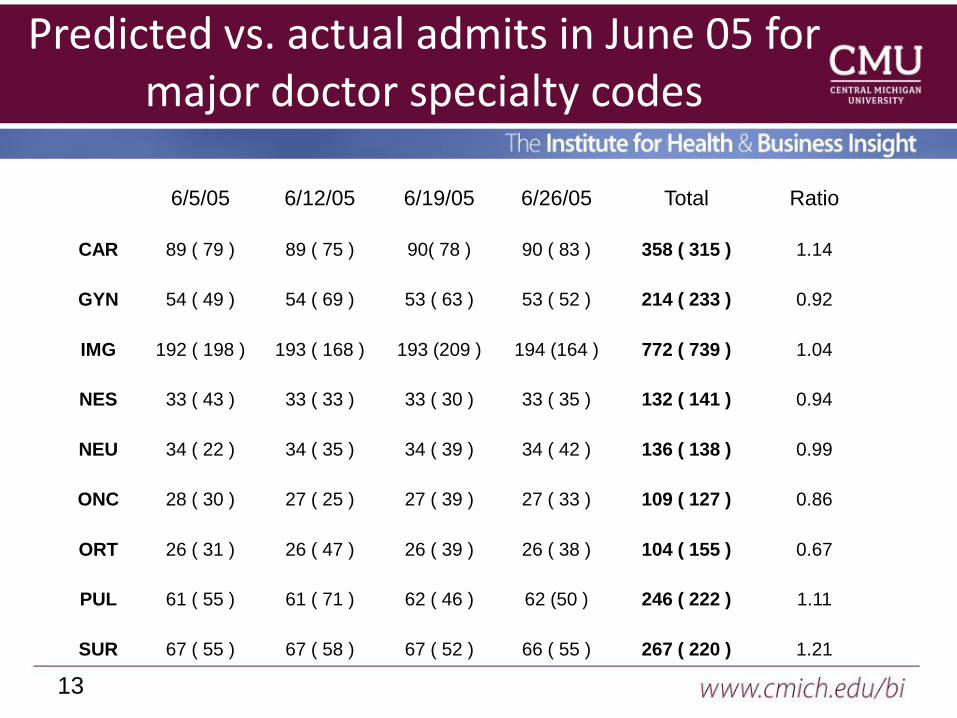
Predicted vs. actual admits in June 05 for major doctor specialty codes
6/5/05 6/12/05 6/19/05 6/26/05 Total Ratio
CAR 89 ( 79 ) 89 ( 75 ) 90( 78 ) 90 ( 83 ) 358 ( 315 ) 1.14
GYN 54 ( 49 ) 54 ( 69 ) 53 ( 63 ) 53 ( 52 ) 214 ( 233 ) 0.92
IMG 192 ( 198 ) 193 ( 168 ) 193 (209 ) 194 (164 ) 772 ( 739 ) 1.04
NES 33 ( 43 ) 33 ( 33 ) 33 ( 30 ) 33 ( 35 ) 132 ( 141 ) 0.94
NEU 34 ( 22 ) 34 ( 35 ) 34 ( 39 ) 34 ( 42 ) 136 ( 138 ) 0.99
ONC 28 ( 30 ) 27 ( 25 ) 27 ( 39 ) 27 ( 33 ) 109 ( 127 ) 0.86
ORT 26 ( 31 ) 26 ( 47 ) 26 ( 39 ) 26 ( 38 ) 104 ( 155 ) 0.67
PUL 61 ( 55 ) 61 ( 71 ) 62 ( 46 ) 62 (50 ) 246 ( 222 ) 1.11
SUR 67 ( 55 ) 67 ( 58 ) 67 ( 52 ) 66 ( 55 ) 267 ( 220 ) 1.21
14
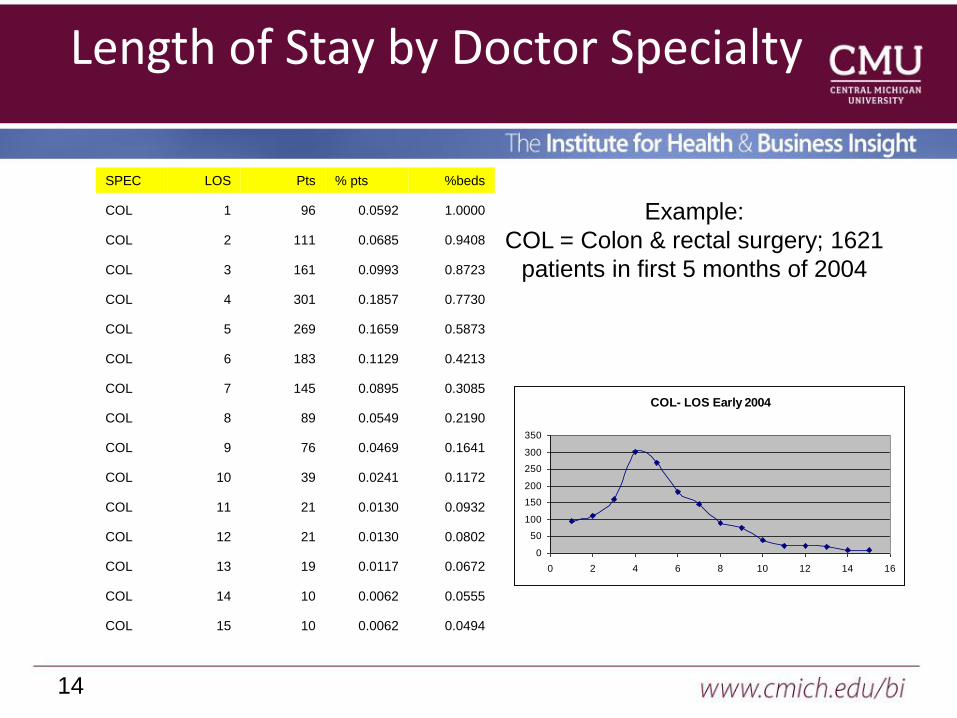
Length of Stay by Doctor Specialty
SPEC LOS Pts % pts %beds
COL 1 96 0.0592 1.0000
COL 2 111 0.0685 0.9408
COL 3 161 0.0993 0.8723
COL 4 301 0.1857 0.7730
COL 5 269 0.1659 0.5873
COL 6 183 0.1129 0.4213
COL 7 145 0.0895 0.3085
COL 8 89 0.0549 0.2190
COL 9 76 0.0469 0.1641
COL 10 39 0.0241 0.1172
COL 11 21 0.0130 0.0932
COL 12 21 0.0130 0.0802
COL 13 19 0.0117 0.0672
COL 14 10 0.0062 0.0555
COL 15 10 0.0062 0.0494
Example:
COL = Colon & rectal surgery; 1621
patients in first 5 months of 2004
COL- LOS Early 2004
0
50
100
150
200
250
300
350
0 2 4 6 8 10 12 14 16
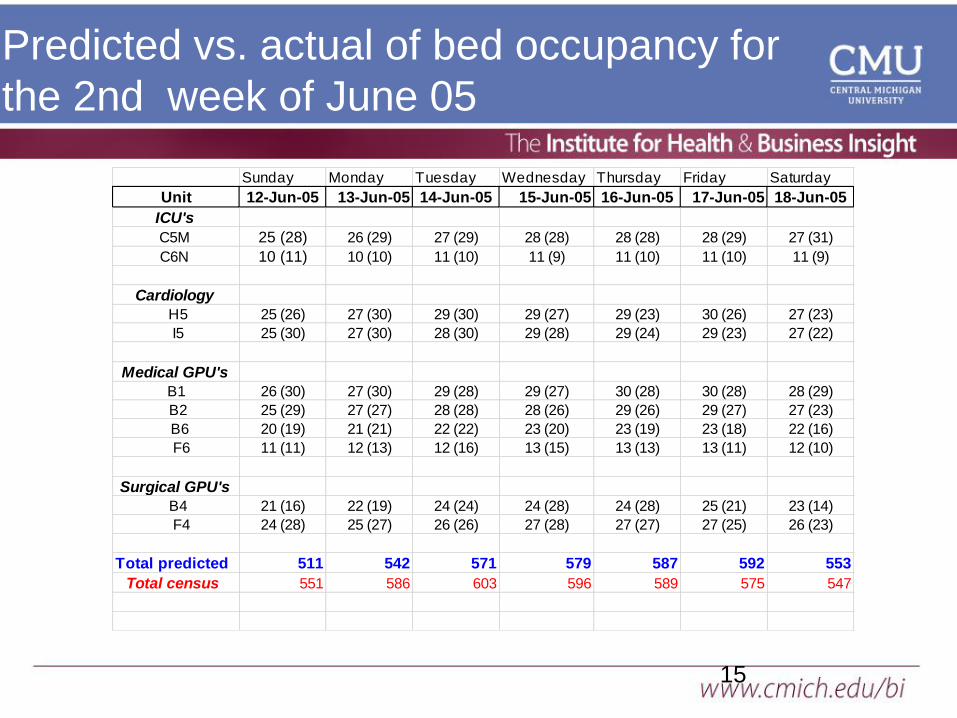
15
Predicted vs. actual of bed occupancy for
the 2nd week of June 05
Sunday Monday Tuesday Wednesday Thursday Friday Saturday
Unit 12-Jun-05 13-Jun-05 14-Jun-05 15-Jun-05 16-Jun-05 17-Jun-05 18-Jun-05
ICU's
C5M 25 (28) 26 (29) 27 (29) 28 (28) 28 (28) 28 (29) 27 (31)
C6N 10 (11) 10 (10) 11 (10) 11 (9) 11 (10) 11 (10) 11 (9)
Cardiology
H5 25 (26) 27 (30) 29 (30) 29 (27) 29 (23) 30 (26) 27 (23)
I5 25 (30) 27 (30) 28 (30) 29 (28) 29 (24) 29 (23) 27 (22)
Medical GPU's
B1 26 (30) 27 (30) 29 (28) 29 (27) 30 (28) 30 (28) 28 (29)
B2 25 (29) 27 (27) 28 (28) 28 (26) 29 (26) 29 (27) 27 (23)
B6 20 (19) 21 (21) 22 (22) 23 (20) 23 (19) 23 (18) 22 (16)
F6 11 (11) 12 (13) 12 (16) 13 (15) 13 (13) 13 (11) 12 (10)
Surgical GPU's
B4 21 (16) 22 (19) 24 (24) 24 (28) 24 (28) 25 (21) 23 (14)
F4 24 (28) 25 (27) 26 (26) 27 (28) 27 (27) 27 (25) 26 (23)
Total predicted 511 542 571 579 587 592 553
Total census 551 586 603 596 589 575 547

16
Patient History
DATE Type SITE DR SPEC CD
03/19/2001 O 20 GAS
03/30/2001 O 20 GAS
04/30/2001 O 20 GAS
06/18/2001 O 20 GAS
06/20/2001 O 20 GAS
06/26/2001 O 20 GAS
07/19/2001 O 20 GAS
08/21/2001 O 20 GAS
09/27/2001 O 20 GAS
11/27/2001 O 20 GAS
01/10/2002 O 20 GAS
01/15/2002 O 20 GAS
05/23/2002 O 20 GAS
08/19/2002 O 20 GAS
09/25/2002 I 20 SUR
MRN=5213569
Visits:
O.GAS.20
Leads to:
I.SUR.20
17
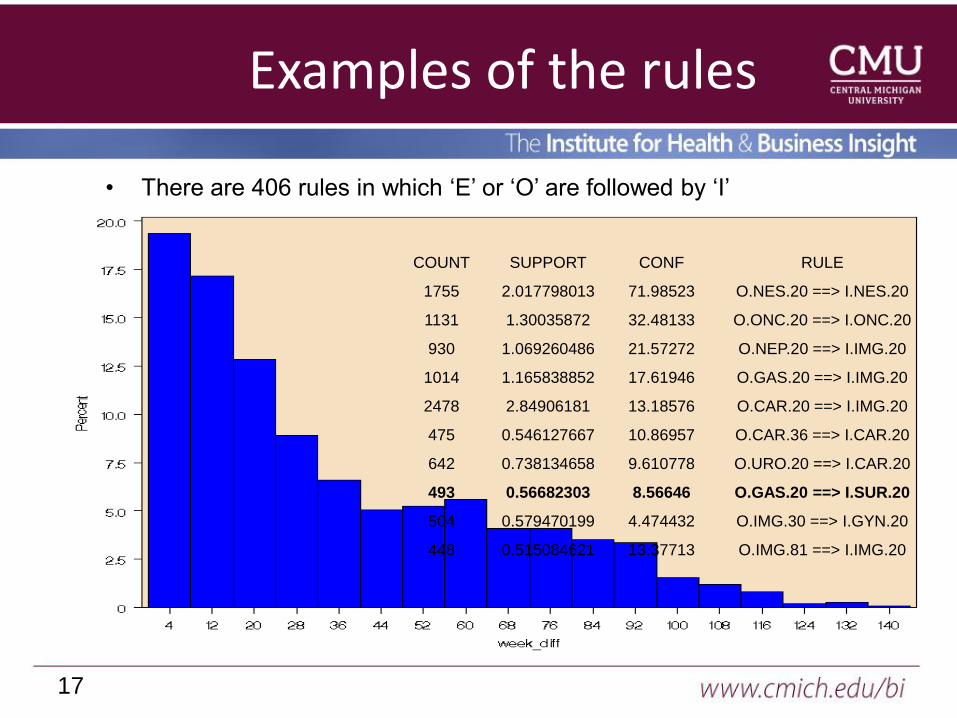
Examples of the rules
• There are 406 rules in which ‘E’ or ‘O’ are followed by ‘I’
COUNT SUPPORT CONF RULE
1755 2.017798013 71.98523 O.NES.20 ==> I.NES.20
1131 1.30035872 32.48133 O.ONC.20 ==> I.ONC.20
930 1.069260486 21.57272 O.NEP.20 ==> I.IMG.20
1014 1.165838852 17.61946 O.GAS.20 ==> I.IMG.20
2478 2.84906181 13.18576 O.CAR.20 ==> I.IMG.20
475 0.546127667 10.86957 O.CAR.36 ==> I.CAR.20
642 0.738134658 9.610778 O.URO.20 ==> I.CAR.20
493 0.56682303 8.56646 O.GAS.20 ==> I.SUR.20
504 0.579470199 4.474432 O.IMG.30 ==> I.GYN.20
448 0.515084621 13.37713 O.IMG.81 ==> I.IMG.20

18
Distribution of Time Lags for one rule
19
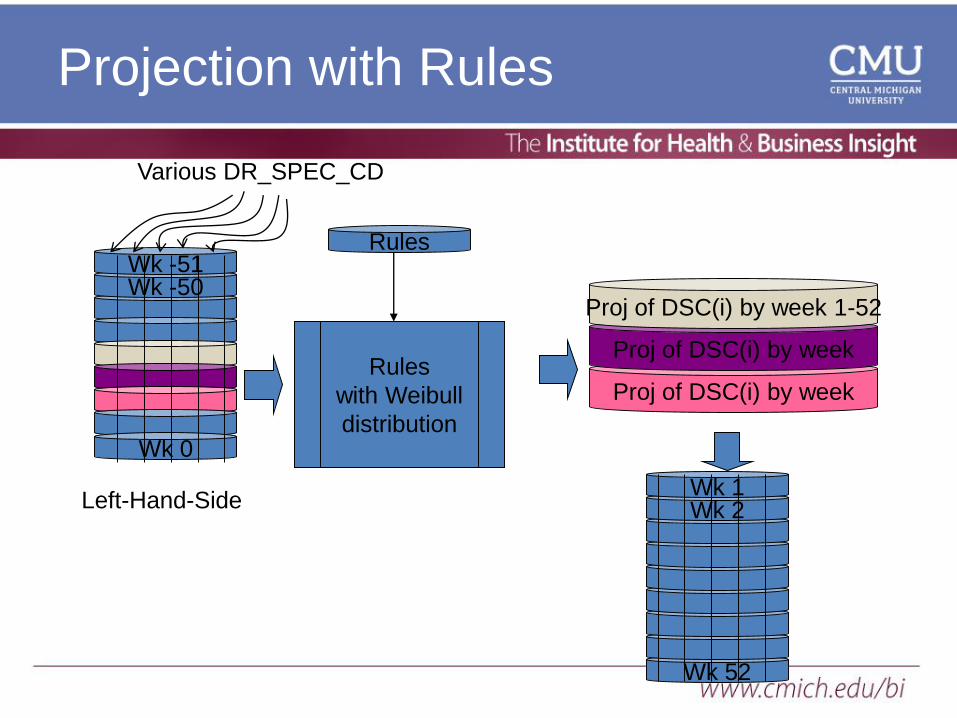
Proj of DSC(i) by week
Proj of DSC(i) by week
Projection with Rules
Various DR_SPEC_CD
Proj of DSC(i) by week 1-52
Wk 52
Wk -50Wk -51
Wk 0
Rules
with Weibull
distribution
Rules
Left-Hand-Side Wk 2Wk 1
MiHIN Role
• Manage statewide legal trust fabric for data sharing
• Maintain statewide “master data” in Active Care
Relationship Service, Health Provider Directory, Trusted
Identities, Consumer Preferences
• Connect HIEs, Payers, Pharmacies, DCH, Federal
Government, others
• Align incentives or regulations to fairly share data and
promote data standardization (via Use Cases)
• Convene groups to identify data sharing barriers, reduce
provider burdens, engage consumers, & enable
population health
Copyright 2015 Michigan Health Information Network Shared
Service20
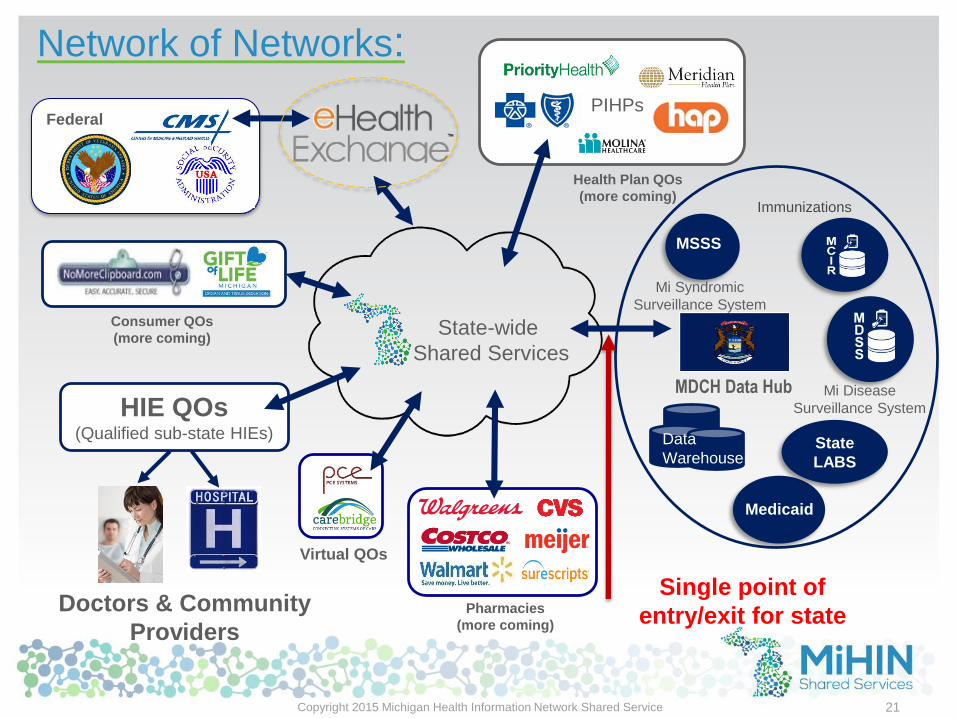
State-wide
Shared Services
MDCH Data Hub
Medicaid
MSSS
State
LABS
Doctors & Community
Providers
HIE QOs(Qualified sub-state HIEs)
Network of Networks:
Data
Warehouse
21
Health Plan QOs
(more coming)
Single point of
entry/exit for state
Virtual QOs
Pharmacies
(more coming)
Immunizations
Mi Syndromic
Surveillance System
Mi Disease
Surveillance System
Consumer QOs
(more coming)
Federal
Copyright 2015 Michigan Health Information Network Shared Service
PIHPs

Transitional care management
Medicare & BCBSM fees Jan 2013
Payer Code Non-Facility Facility Locality
Medicare 99495 $120.39 $99.38 Detroit
Medicare 99496 $169.65 $145.70 Detroit
BCBSM 99496 $329.33 $281.38 All
22
99495 -
• Communication (direct contact,
telephone, electronic) with the patient
and/or caregiver within 2 business days
of discharge
• Medical decision making of at least
moderate complexity during the service
period
• Face-to-face visit, within 14 calendar
days of discharge
99496 -
• Communication (direct contact, telephone,
electronic) with the patient and/or
caregiver within 2 business days of
discharge
• Medical decision making of high
complexity during the service period
• Face-to-face visit, within 7 calendar days
of discharge
Copyright 2015 Michigan Health Information Network Shared Services
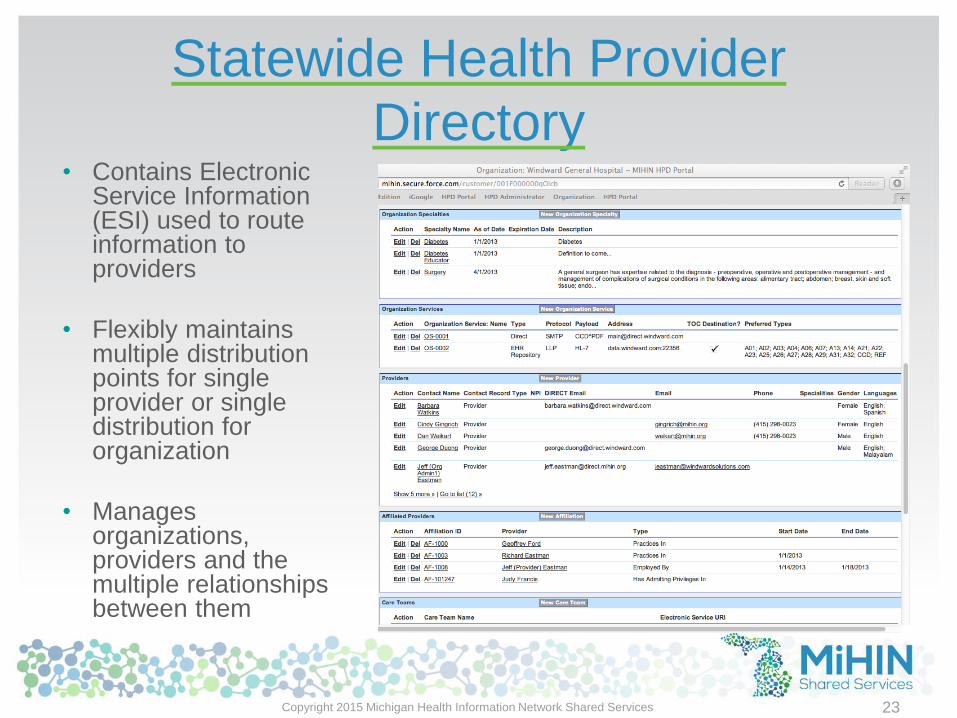
Statewide Health Provider
Directory
23
• Contains Electronic Service Information (ESI) used to route information to providers
• Flexibly maintains multiple distribution points for single provider or single distribution for organization
• Manages organizations, providers and the multiple relationships between them
Copyright 2015 Michigan Health Information Network Shared Services

Patient Provider Attribution Service
(in Michigan we call this ACRS™)
• Enables providers to declare active care relationships with patients –this attributes to a patient the active members of their care team
• Accurately routes information (e.g. Admit-Discharge-Transfer messages, medication reconciliations)
• Improves care coordination
• Reduces readmissions
• Allows better outcomes
• Enables alerts to providers in active care relationships with patients
• Coordinates entire care team with changes to patient status in real time
• Allows searches by authorized persons or organizations:
• Health systems and provider/physician organizations
• Care coordinators
• Health plans
• Consumers (who can dispute asserted relationships)
24Copyright 2015 Michigan Health Information Network Shared Services

Active Care Relationship Service
(ACRS™)
25
Patient InformationSource Patient ID
First Name
Middle Initial
Last Name
Suffix
Date of Birth
Gender
SSN – Last 4 digits
Address 1 & Address 2
City, State, Zip
Home & Mobile Phones
Physician InformationNPI
First Name
Last Name
Practice Unit ID
Practice Unit Name
Physician Organization ID
Physician Org Name
Physician DIRECT Address
DIRECT Preferences
Copyright 2015 Michigan Health Information Network Shared Services
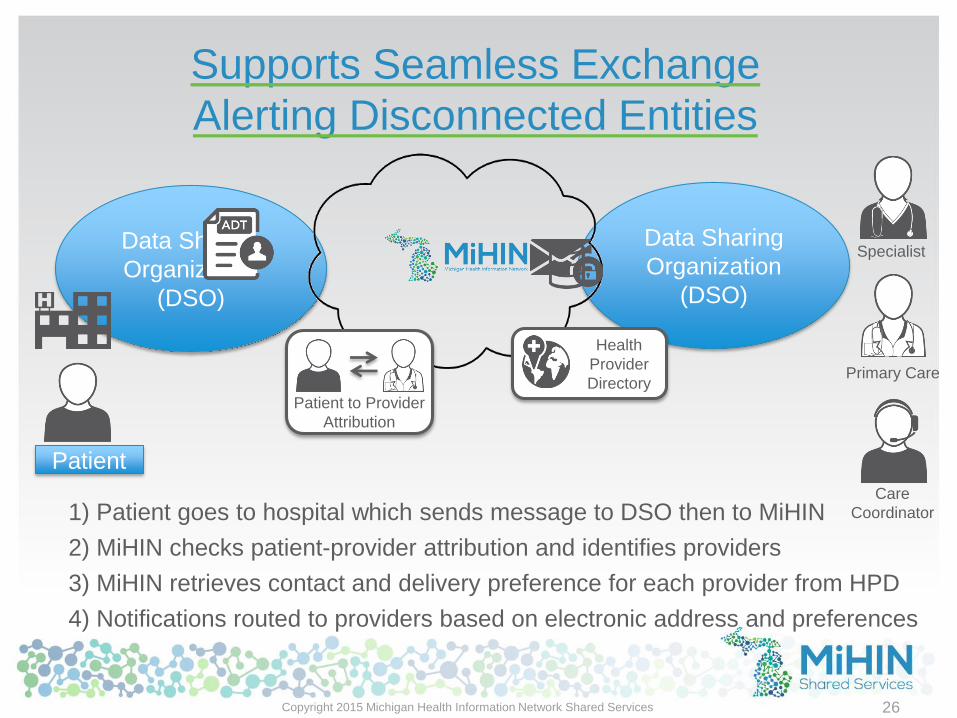
Data Sharing
Organization
(DSO)
Data Sharing
Organization
(DSO)
Supports Seamless Exchange
Alerting Disconnected Entities
Patient to Provider
Attribution
Health
Provider
Directory
1) Patient goes to hospital which sends message to DSO then to MiHIN
2) MiHIN checks patient-provider attribution and identifies providers
3) MiHIN retrieves contact and delivery preference for each provider from HPD
4) Notifications routed to providers based on electronic address and preferences
Primary Care
Specialist
Care
Coordinator
26
Patient
Copyright 2015 Michigan Health Information Network Shared Services
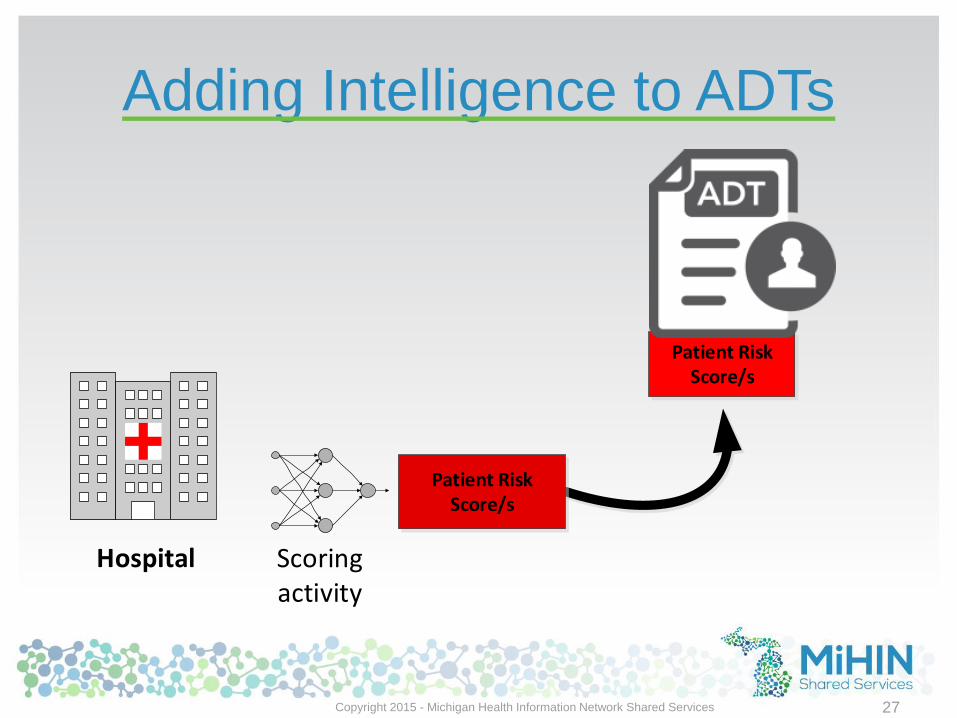
Adding Intelligence to ADTs
Copyright 2015 - Michigan Health Information Network Shared Services 27
Scoring activity
Patient Risk Score/s
Hospital
Patient Risk Score/s
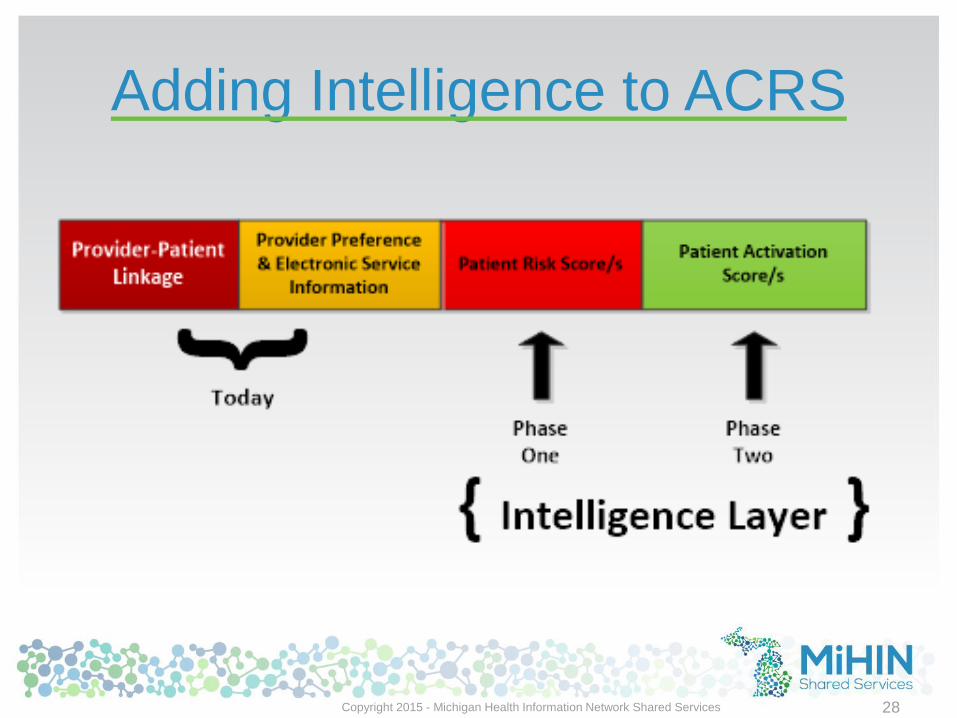
Adding Intelligence to ACRS
Copyright 2015 - Michigan Health Information Network Shared Services 28
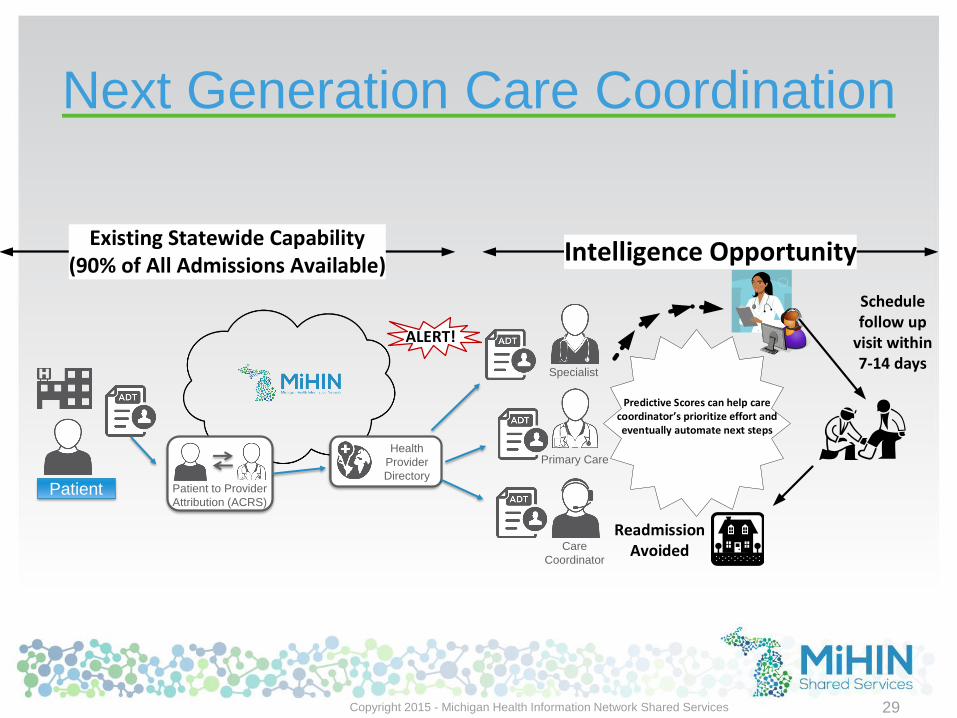
Next Generation Care Coordination
Predictive Scores can help care coordinator s prioritize effort and eventually automate next steps
ALERT!
Readmission Avoided
Schedulefollow up
visit within7-14 days
Primary Care
Specialist
Care
Coordinator
Existing Statewide Capability (90% of All Admissions Available)
Intelligence Opportunity
Patient to Provider
Attribution (ACRS)
Health
Provider
Directory
Patient
Copyright 2015 - Michigan Health Information Network Shared Services 29
Thank You & Contact Info
Tim Pletcher, DHA
Director
Institute for Health & Business
Insight
989.621.7221
http://www.youtube.com/watch?v=elHjESwQ8_o&feature=youtu.be
30
Tim Pletcher, DHA
Executive Director
Michigan Health Information Network
989.621.7221