the application of mechanistic oral absorption model in ... · the application of mechanistic oral...
TRANSCRIPT

1
The Application of Mechanistic Oral Absorption Model in Biopharmaceutics Review
John Z. Duan, Ph.D. Division of Biopharmaceutics /ONDP/OPQ/CDER/FDA

2
Presentation Outline
• Patient first initiative in drug development
• Biopharmaceutics Team growth
• Predictions help decision making
• Current practice • Dissolution spec setting
• Set clinically relevant product specs
• Risk assessment
• Meet the challenge
• Information in regulatory submission
• Product life cycle management
1. An Overview
2. Current Status
3. PBPK Future App
Patient-Centric Quality

AN OVERVIEW BIOPHARMACEUTICS ROLES IN
PATIENT CENTRIC QUALITY CONTROL CRS: CLINICALLY RELEVANT SPECIFICATION
3

4
Quality Control Paradigm Shift
Control Strategy Design Space Risk Assessment
Lifecycle Solutions
Patient Needs Product Life Cycle
From the traditional specification compliance model to CRS paradigm.

5
Summary • In vivo performance is the ultimate goal
and primary consideration for product quality.
• Risk assessment using biopharmaceutics is a powerful tool to reach the goal.
One Voice: For the Patients Mission:
To assure that quality medicines are available for the American public. .

6
Decades of FDA Biopharmaceutics
2015
b
2008
• OPQ stand up • DB established • Focus on CRS
2015
2016
• Biopharmaceutics team formed
• Keep growing • Deeper, more
comprehensive
2014
• Prepare for the stand up of OPQ
• 3 teams formed
Before 2008 • Mixed with clinical
pharmacology

Cornell university
Biopharmaceutics Biopharmaceutics: a Bridge The study of the physical and chemical properties of drugs and their proper dosage as related to the onset, duration, and intensity of drug action. Construct solid biopharmaceutics discipline.
Understanding mechanisms of in vitro release as well as physiology in relation to drug absorption, and in silico models that mimic in vivo release characteristics - potential biopharmaceutics tools to facilitate the shift
Translating in vitro to in vivo
Mechanistic Absorption Model Integrate anatomical and physiological parameters, physicochemical properties of drug substances, and formulation properties of drug product to predict in vivo performance quantitatively in a mechanistic platform

CURRENT STATUS
8
Dis M
ethod
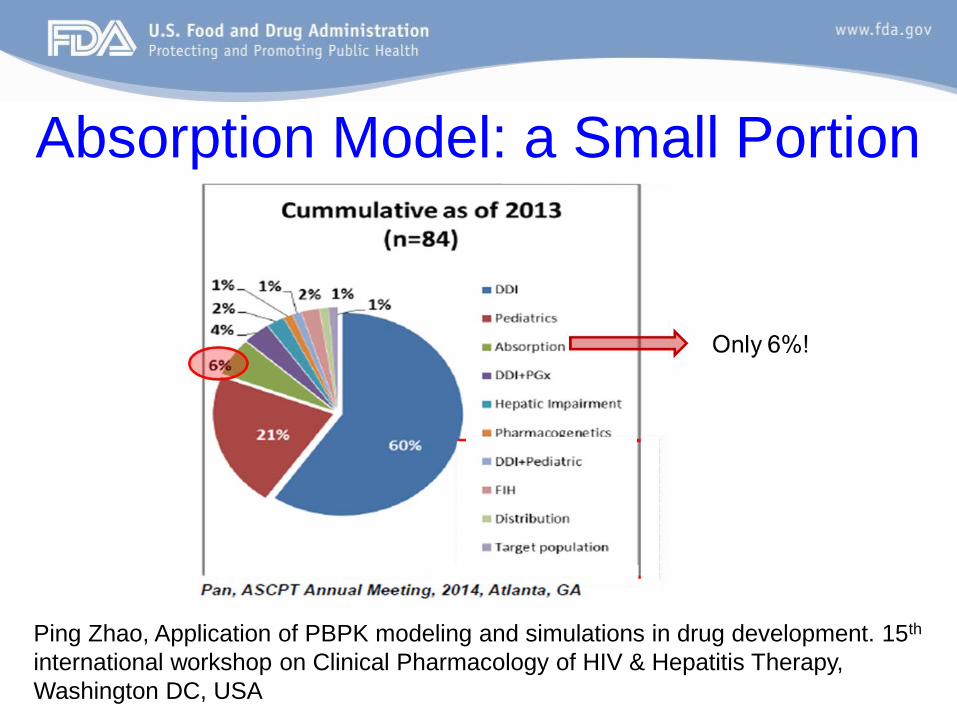
Absorption Model: a Small Portion
Ping Zhao, Application of PBPK modeling and simulations in drug development. 15th international workshop on Clinical Pharmacology of HIV & Hepatitis Therapy, Washington DC, USA

10
Current Status (2008-2016) Potential Applications Current Status
Dissolution Method and Acceptance Criteria
Justify/support bio-predictive dissolution method
• Use the verified PBPK/absorption model combined with bioequivalence clinical study and dissolution profiles generated to show that the proposed dissolution method can reject non-BE (bioequivalence) batch
Set clinically relevant dissolution acceptance criteria
• Allow dissolution acceptance criteria to go beyond target ±10% range
• Additional evidence (data) needed to validate model and confirm predictive performance
Set clinically relevant drug product specifications for CMAs and CPPs
CMAs (particle size, polymorphic form)
• Predict particle size distribution (PSD) limits which would result in similar in vivo performance to the target (clinical batch)
• Predict the effect of polymorphic form on in vivo performance of drug product
CPPs (milling method, pressure force/hardness)
• Predict the effect of milling method on the bioequivalence of drug product (e.g. pre- and post-change of milling method)
• Used to justify specification range of compression force based on the predicted in vivo performance
Risk assessment Evaluation of the risk • Quantitative assessment

11
Case Example 1 Clinically Meaningful Diss Method
• Differences between target and aberrant formulation in different pH’s
• PBPK simulation: the two formulations are not BE and dissolution testing in pH 2 is able to differentiate the two (Q=80% at 30 min) pH = 2 pH = 6.8

Case Example 2 Overview: •In silico absorption model accounting for differences of dosage form transit, dissolution, local pH in the GI tract and fluid volumes available for dissolution can predict the PK of non-BE batch. •Dissolution specification is justified by simulation of the performance of batches with different quality. •Finding the edge of dissolution by simulating a virtual batch •Predict API particle size distribution (PSD) at the proposed dissolution specification.

Dissolution Data in the Model Option 1: Use of in vitro dissolution data to fit particle size distribution
(Dosage form: DR enteric coated tablet) Option 2: Use of in vitro dissolution data to fit Weibull function Option 3: Use of in vitro dissolution data to fit the Z-factor model
(Dosage form: DR enteric coated tablet)
Option 1 verification using non BE (test) batch
Predicted Cmax and AUC ratios were comparable to observed clinical data for test and reference batch
Virtual BE study simulated lower Cmax and AUC for non BE batch as compared to reference batch
Option 1 was selected

Model Setup
Theoretical PSD
Dose
Solubility
Volume
Medium composition
Fitted to observed in vitro data
Translational parameter for input into PBPK software
ACAT + Compartmental model Rate constants and total clearance calculated Gastric emptying patterns and Peff : individually fitted , disposition parameters:
constant Total clearance was used to calculate hepatic and renal clearance Dosage form transit – delayed release enteric coated tablet

Model Applications To set dissolution specification
• Batch X (bioequivalent to reference batch), reference batch and non BE batch was used
• Virtual particle size distribution generated in excel – input for GastroPlus model
• Batch X and reference batch - (Q≥80%) at 30 min Test batch - (Q ~ 60% at 30 min) • Virtual BE trials were performed between batch X, reference
batch and test batch
Predicted Cmax geometric mean
ratio 90% CI
Predicted AUC geometric mean ratio
90% CI
Test vs reference 0.805 (0.796, 0.814) 0.876 (0.869, 0.883) Batch X vs reference 0.987 (0.977, 0.998) 1.000 (0.990, 1.01)
• Able to reject batches which have reduced exposures in vivo and pass batches that have suitable clinical performance
• Virtual batch A : Q = 70% at 30 min was bioequivalent to reference • Proposed dissolution specification is justified (Q = 80% at 30 min)

To predict the in vivo performance using the proposed particle size distribution
• Proposed PSD (test batch: virtual) D(v, 0.5) NMT 70 µm D(v, 0.9) NMT 159 µm • Observed measured PSD (reference batch) (D(v, 0.5) 23.2, D (v, 0.9) 45.9) • Q = 80% at 30 minutes • PSD was used as an input in GastroPlus using option A to calculate in vivo
dissolution
Conclusion • No appreciable difference was observed between Cmax and AUC for test and
reference batch • Proposed specification limits for particle size distribution are acceptable
Geometric mean ratio (Cmax) Geometric mean ratio (AUC)
Test vs reference 0.998 1.000
Test vs reference
Model Applications

Case Example 3 Motivation and overview: • When dealing with absorption model, inevitably several parameters are
from in silicon prediction or optimization. • The outcome of these uncertainties, especially the interplay among the
uncertain parameters requires a good approach to monitor.
• 4*4*6*6*6*4 = 13824 unique combinations
Parameters Starting Value (x) Levels No
API particle radius 2.5 1, 2.5, 6, 10, 20, 40 6
Effective permeability 1.25 0.1x, 0.2x, x, 2x 4
Precipitation time 900 0.1x, x, 10x, 100x 4
Reference solubility 0.011 0.1x, 0.2x, 0.5x, x, 2x, 10x 6
Radius of precipitate 1 0.1, 0.5, 1, 2, 5, 10 6 Rbp 1.02 0.55, 0.8, x, 2x 4
Parameter of interest

Precipitation time (sec)
Precipitation radius (µm)
90
900
9,000
90,000
0.1
0.5
1
2
5
10
API particle size (µm)
Cm
ax (n
g/m
l)
API solubility (mg/ml) Dose No>1 for all
Effective permeability (10-4 cm/sec)
Multidimensional Sensitivity Analysis

Understanding the Model Results Interpretation Possible regulatory impact
Multi-dimensional sensitivity analysis allows tracking the interplay among uncertain and/or of interest parameters
Require further justification for the effect of uncertain parameters, when absorption modeling is used to set the product specification (e.g., particle size)
Survey of parameter values from multiple submissions allows more accurate parameter estimation and more confidence on model prediction
The reliability of the model prediction is likely to improve when the information is gathered from multiple drug applications
For low solubility drug, the accuracy of equilibrium solubility can have dramatic impact on model prediction
Sponsor may provide solubility in buffer at various pH and in bio-relevant solution (i.e. SGF, FaSSIF, FeSSIF) under 37 °C

20
Regulatory Implications • Initial risk evaluation per available info • Evaluate product quality based on clinical relevance • Setting clinically relevant specifications • Analyses Cross study and cross formulation
– More knowledge and data are available, which are used for model validation. This increases confidence for improving the quality of the drug including setting of product specs.
• Combine several software to extend the ability. – Make full use of available information – Identify CQAs – Control the CMAs and CPPs – Justify the specs for quality control

21
Common Limitations in Submission • Model exercises done, not used. Especially those
successfully developed in the early stage not fully utilized in regulatory submissions for justification
• Detailed information not provided • Model not fully validated • Model files not provided • Rationale not clear • Justifications not reasonable

MEETING THE CHALLENGE GOING FORWARD
22

23
The Challenges • Selection of reasonable model • Standardization of model practice • Model validation • The quantitative criteria for accepting the model for
different objectives • Adequate evaluation of the sensitivity • Population analyses, mean, SD, bound and
distributions • Risk based justifications • Inclusion of CMA & CPP beyond dissolution • Software improvement

24
Providing PBPK Information in Regulatory Submissions
• Model Information – Input parameters – Optimized parameters – Software type and
version – Logical description of
model building & validation process
– Executable model files – Simulation conditions
• Justifications – Input parameter
sources & selection – Justification for
Optimized parameter – Raw data to support
the model validation & correlations
– Rationale to support the request for regulatory actions
Early communication strongly encouraged

25
Product Lifecycle Management • Regulatory context may be different from that for
discovery and development – Much more knowledge and data are available, which are
used for model validation. This provides more confidence for improving the quality of the drug including setting of product specs.
– Clinical relevance of the quality control
• The knowledge gained from R&D is applicable to regulatory submission – Make full use of available information – Identify CQAs – Control the CMAs and CPPs – Justify the specs for quality control

26
Summary • In vivo performance is ultimate goal and primary
consideration for product quality. • Mechanistic oral absorption modeling is a powerful tool. • Models support decisions on product quality specification
and risk assessment • Model predictive performance needs to be demonstrated

27
Acknowledgments • Reviewers:
– Hopi Lin – Fang Wu – Sandra Suarez Sharp
• Fellows:
– Meng Wang – Heta Shah
• Management: – Paul Seo – Support from ONDP
Office