the approach of the german pesticide risk indicator synops ... · the approach of the german...
TRANSCRIPT

The approach of the German pesticide risk indicator SYNOPS in
frame of the National Action Plan for Sustainable Use of Pesticides
JÖRN STRASSEMEYER, VOLKMAR GUTSCHE
JKI - FEDERAL RESEARCH CENTRE FOR CULTIVATED PLANTS,
KLEINMACHNOW, GERMANY


Executive Summary
A set of pressure, state, impact and response indicators has been suggested to measure the progress in reaching the targets of the German National Action Plan (NAP) on the Sustainable Use of Plant Protection Products released 2008. Among them the risk indicator model SYNOPS is used to assess trend of the terrestrial and aquatic risks of pesticide use in agriculture. The indicator is applied on different levels of aggregation:
• To assure the tracking of the risk trends and risk development on national level, SYNOPS is used on yearly basis with annual sales or ‐ if available ‐ use data of pesticides assuming realistic worst case scenarios for the environmental conditions (SYNOPS‐Trend).
• For regional risk analysis and the provisional detection of hot spots SYNOPS is used together with field based surveys on pesticide use and extended GIS based datasets on land use, slope, soil types and climate (SYNOPS‐GIS).
The aim of the German NAP is a further reduction of risks associated with the use of agricultural pesticides by 25 % until 2020 in relation to the risks calculated for a reference period from 1996 to 2005. To characterize the status quo, SYNOPS evaluated the risks of the pesticides sold in the crop years 2006, 2007, and 2008 in relation to the average risk of the reference period. Within the three considered years, a reduction of the terrestrial (δRIter) and aquatic risk (δRIaqua) according to the goal of the NAP (25 %) was already assessed for herbicides (δRIter=32% and δRIaqua=34%) and insecticides (δRIter=61% and δRIaqua=44%) whereas the risk reduction for fungicides (δRIter=24% and δRIaqua=17%) was still below this goal. These results indicate a promising progress in risk reduction and show that the measures taken within the NAP to reduce the environmental risk are going into the right direction. For the future it has to be evaluated, if this trend remains.
A more detailed analysis of risks on regional level is accomplished with the GIS based version of SYNOPS. It relies on a GIS database, which integrates all necessary environmental parameters on field level to estimate the exposure. The database was established by merging information from an extended geographical dataset on land use (ATKIS), a digital soil map, a digital elevation model and a set of 430 climate stations (DWD). Regional data on pesticide use for the main crops are available from field based surveys.
In a study SYNOPS‐GIS was applied to analyse pesticide risk trends in German orchard growing regions. The risks were calculated for all orchards within the regions. These results are expressed in risk maps and are the basis of identifying regions with higher risks. The impact of pesticide specific buffer zones and drift mitigation measures on the environmental risk is shown on regional scale. In combination with repetitively conducted pesticide use surveys for orchards in 2001, 2004 and 2007 the trend of regional risks was analysed. Based on these assessment conclusion were made about the impact of product based drift mitigation measure on the environmental risk.

Introduction and background
In 2008 the German National Action Plan (NAP) on the Sustainable Use of Pesticides was established to further reduce risks that may arise from the use of plant protection products (BMELV, 2008).
The measures of the NAP focus on promoting innovation in plant protection and the develop‐ment of methods of integrated crop protection. They will be complemented by appropriate measu‐res implemented and borne by the Federal Government and the Länder. The measures are intended
• to reduce the risks that chemical pesticides pose for human health, animals and the natural balance, and to minimize the intensity of the use of these pesticides,
• to further reduce residues of pesticides in domestic and imported agricultural products, thus representing a major advance in preventive consumer protection, and
• to improve the economic situation of farms by avoiding the costs incurred by unnecessary use of plant protection products.
In Germany, the implementation of plant protection measures and especially the registration, approval and use of plant protection products has a broad legal basis and is regulated to provide a high degree of protection for humans, animals, groundwater and the natural environment. Basic guidelines have been published on good plant protection practice (Bundesanzeiger 57 and 58a, 2005). Good plant protection practice includes giving consideration to the principles of integrated plant protection (PflSchG, 1998; Bundesgesetzblatt I pp. 971, 1527, 3512). Comprehensive plant protection legislation has among other reasons been enacted to protect crops from harmful organisms and to prevent the risks that plant protection product use or other plant protection activities may pose to humans, animals and the natural environment.
Following the broad dialogue on plant protection policy in Germany, the Plant Protection Product Reduction Programme was devised and published in 2004. Structured as an ongoing, dynamic programme with no expiry date, the programme is subject to further development according to the progress made. The National Action Plan builds on the Plant Protection Product Reduction Programme and reflects the experience gained in implementing that programme and current trends in national and international debate on plant protection. For example, the OECD has given a great deal of attention to the contents of national strategies to minimise the risks arising from the use of plant protection products and has published a wide range of information on this issue (OECD, 1997). Recently, the OECD has targeted in its Strategic Approach in Pesticide Risk Reduction national action plans or programmes to accelerate IPM implementation as the leading instrument to reduce risks arising from pesticides (OECD, 2009).
Integrated plant protection is the globally accepted model for sustainable plant protection in conventional agriculture. The FAO Code of Conduct on the Distribution and Use of Plant Protection Products (FAO, 2002) adopted in 1985 cites integrated plant protection as a key component of sustainable plant protection. Germany’s Plant Protection Act (PflSchG, 1986) has referred to it since 1986. In 1991, Council Directive 91/414/EEC Concerning the Placing of Plant Protection Products on the Market provided a standardised definition of the term for uniform application in all EU Member States. In 2009, with the Directive 2009/128/EC OF THE EUROPEAN PARLIAMENT AND OF THE COUNCIL of 21 October 2009 establishing a framework for Community action to achieve the sustainable use of pesticides this definition has been revised marginally1.
1) ‘integrated pest management’ means careful consideration of all available plant protection methods and subsequent
integration of appropriate measures that discourage the development of populations of harmful organisms and keep the use of plant protection products and other forms of intervention to levels that are economically and ecologically justified and reduce or minimise risks to human health and the environment. ‘Integrated pest management’ emphasises the growth of a healthy crop with the least possible disruption to agro‐ecosystems and encourages natural pest control mechanisms;
Integrated plant protection constitutes a holistic, long‐term on‐farm plant protection strategy aimed at achieving a balance between environmental, economic and social needs by reducing the use of chemical plant protection products to the necessary minimum and using non‐chemical plant protection methods instead. It requires careful consideration and weighing of relevant issues in all decision making processes and places high expectations as regards the availability and use of specialist information. Longitudinal studies show that the practice of integrated plant protection not only results in lower quantities of plant protection products being used, but also lessens the overall risk to humans, animals and the natural environment arising from the use of chemical plant protection products.
This is why the National Action Plan focuses on risk reduction rather than setting specific quantity reduction targets. Across‐the‐board reductions in the quantities of plant protection pro‐ducts sold fail to account for the characteristics of the substances involved and the potential risks arising from their use. For example, with a quantity‐based approach, the use of a high‐risk plant protection product which is effective in small quantities would be more positively assessed than use of a lower‐risk product that must be used in greater quantities to achieve the desired result.
A set of pressure, state, impact and response indictors has been suggested to measure the progress in reaching the targets of the German National Action Plan (NAP). Among them the risk indicator model SYNOPS is used to assess the terrestrial and aquatic risks of pesticide use in agriculture.
Since it was first published in 1997 (Gutsche and Rossberg) the model SYNOPS for synoptic assessment of risk potential of chemical plant protection products has been used and further developed within national (Gutsche and Rossberg, 2000, De Mol et al., 2002) and European projects (Reus et al., 1999; Reus et al., 2002; Delbaere and Seradilla, 2004). Essential ideas and functionalities of SYNOPS have be adopted in the harmonised European indicator model HAIR (HAIR, 2007; Luttik, 2004) and OECD indicators (OECD, 2000). Further international applications of SYNOPS are conducted in frame of the European Network of excellence ENDURE (2006), where it is applied for different European case study regions as indicator to assess the impact of innovative plant protection strategies in the context of the landscape.
To assure the tracking of the risk trends and risk development on national level, SYNOPS is used on yearly basis with annual sales or ‐ if available ‐ use data of pesticides assuming realistic worst case scenarios for the environmental conditions. Risk index analyses with SYNOPS for the past 20 years show that Germany’s plant protection policies and use of new innovations have been reduced by as much as 60 percent (Gutsche and Strassemeyer 2007). In these evaluations the year 1987 was used as the reference year for the calculations, as that was the year in which significant legislative changes were introduced with the enactment of a completely revised Plant Protection Act.
The NAP is designed to build on this approach and provide incentives for further risk reduction with the overall goal to reduce the risk potential by 25 % until the year 2020 in relation to the risk potentials calculated for a reference period from 1996 to 2005. To characterize the status quo, SYNOPS is used to evaluate the risks of the pesticides sold in the crop years 2006, 2007, and 2008 in relation to the average risk of the reference period.
Additional to the trend analysis the indicator model SYNOPS is used within the National Action Plan for the analysis and detection of hot pots. Temporally and spatially defined fields of action with increased risk (hot spots) associated with plant protection products can occur due to specific environmental conditions (e.g. high water body density, high soil porosity), due to wide‐spread and frequent use of a few plant protection products or due to high‐frequency, crop and pests‐related use of a specific plant protection product over a single area in connection with other conditions, such as frequent rainfall.
For regional risk analysis and the provisional detection of such hot spots the indicator model SYNOPS is used together with field based surveys on pesticide use and extended GIS based datasets on land use, slope, soil types and climate. Effective hot spot management plays a key role in

achieving the objectives set out in the National Action Plan on Sustainable Use of Plant Protection Products because it identifies and either reduces or prevents the potential risks to consumers and the environment.
As an example for regional risk assessment and hot spot detection SYNOPS has been applied to the German orchard regions using the results of three field based surveys on pesticide use in orchards (NEPTUN), which were conducted in the years 2001, 2004 and 2007. Based on these assessment conclusion were made about the impact of product based drift mitigation measure on the environmental risk.
Method ‐ Environmental risk assessment with SYNOPS
SYNOPS evaluates the risk potential for terrestrial (soil and edge‐biotopes) and aquatic (surface water) organisms. It combines use data of pesticides with their application conditions and their inherent properties. The exposure of organisms is calculated by more or less sophisticated sub‐models. Within the National Action Plan SYNOPS is applied on different levels of spatial aggregation.
On the one hand SYNOPS is applied on national level to assure the tracking of the risk trends and risk development in Germany. In this case SYNOPS is used on yearly basis with annual sales data of pesticides assuming realistic worst case scenarios for the environmental conditions. This application will be referred as SYNOPS‐Trend. On the other hand SYNOPS‐GIS is used for regional risk analysis and the detection of hot spots. This implementation of SYNOPS requires more detailed input datasets like field based surveys on pesticide use and extended GIS based datasets on land use, slope, soil types and climate.
Both versions of SYNOPS are based on the same functionalities and procedures to assess the environmental risk on field level. SYNOPS calculates the predicted environmental concentration on daily basis for soil, surface waters and non target plants. It considers the interception on the crop and the exposure pathways spray drift, surface run‐off and drainage and temperature dependent degradation in water and soil. From the daily environmental concentrations the short‐term and long‐term exposure are derived and the risk potentials are calculated as the ratio of exposure to toxicity (ETR) for three reference species (daphnia, fish and algae) in aquatic systems and two species (earthworm and bee) for terrestrial systems (figure 1).
Figure 1: Exposition pathways considered in SYNOPS
SYNOPS‐Trend to track national risk tends
SYNOPS‐Trend calculates the environmental risk on the basis of sales data. The sales data of active ingredients are available on annual basis and allow only indirect conclusions about the actual usage of the active ingredients. These conclusions are made according to comprehensive assessment procedure developed by Rossberg and Gutsche (1999).
All active ingredients with sold volumes above 5 t for herbicides and fungicides and 1 t for insecticides were accounted for. For each of the sold active ingredients all registered uses were considered. A registered use of an active ingredient is defined for a specific crop and specific target with a specific application rate and application time span. The potential environmental risk for each use is calculated by SYNOPS‐Trend based on the same realistic worst case scenario. As worst case scenario a loamy sand soil with 1.5 % carbon content, a slope of 3 % and a minimal distance from the field edge to surface water of 1 m for field crops and 3 m for permanent crops is assumed. Further we assumed surface water dimensions according to the standard ditch with a width of 1 m and a depth of 0.3 m. For precipitation a rain event of 30 mm was assumed to appear 3 days after application of the active ingredient. Drift mitigation measures were not considered in the assessment.
According to the estimated application area for each use a weighting factor is calculated. The detailed procedure of estimating the application area and the weighting factor for each use is described in Gutsche and Strassemeyer (2007) and in Rossberg and Gutsche (1999). The assessed risk potentials of the uses were then aggregated by calculating the weighted mean for herbicides, fungicides and insecticides. This procedure was repeated for the crop years 1996, 1998, 1999, 2002, 2002 and since 2004 on yearly basis.
Finally the risk potentials were then expressed relatively by relating the absolute values to a reference value corresponding to the average of a ten‐year period from 1996 to 2005. The reference period was defined as a ten‐year period just before the National Action Plan was launched in 2006.
SYNOPS‐GIS for regional risk assessment and hot spot detection
SYNOPS‐GIS was developed to assess the environmental risk potential of plant protection strategies on landscape level using GIS functionalities by linking it to geo‐referenced databases for land use, soil conditions and climate data and to a dataset of regionalised surveys of pesticide application. The GIS databases were established by integrating all environmental information on field level which is necessary to estimate the environmental exposure by drift, run‐off and drainage.
The underlying data models for the integration of environmental and field related input data for SYNOPS are an extended geographical dataset on land use (ATKIS, AdV 2001), a digital soil map (BÜK1000, BGR 1995), a digital elevation model (BKG, 2005) and a set of 430 climate stations of the German weather service (DWD).
ATKIS is a project of the German Surveying Authorities which is performed uniformly at the Federal level. It provides digital topographic base data suitable for computer‐assisted digital processing. ATKIS describes the topographic features of a landscape in vector format and suits the scale range 1:10.000 to 30.000. Using GIS procedures the exact location of all orchards, vineyards, hope plantations and arable fields and their connectivity to surface waters and other landscape objects was extracted. The outputs of these procedures are the minimal distance from the edge of the field to the edge of the surface water and the mean width of the field margins.
The slope for each field was calculated by linking the ATKIS dataset to a digital elevation model (DGM‐d). According to a digital soil map (BÜK1000) the main soil types for the region were identified and linked to the fields. The relevant biophysical parameters like the organic carbon content, the hydrological soil class or the texture of the soil are linked to the main soil types. Data

on precipitation and temperature were available from stations of the German Weather Service. For each field the closest climate station was determined.
The information on the cultivated crops is not included in the ATKIS dataset. ATKIS differentiates only between permanent crops like vineyards, orchards and hops and arable crops. So for arable crops and orchards information on the crop or fruit cultivated on field level was achieved by random distribution of the crop types on community level, according to the cop statistics.
The pesticide use data are available from field based surveys, which were conducted on regional level (NEPTUN, Rossberg 2005). The application strategies of the pesticide use dataset were also distributed randomly to the fields according to the crop related to the field and according to the related region to the pesticide use survey (e.g. orchard region).
This high level of data availability enables us to accomplish a detailed risk analysis on field level for all regions in Germany. Figure 2 illustrates an overview of the GIS‐ related input data and the risk analysis with SYNOPS.
Figure 2: Overview on GIS‐ related input data and risk analysis with SYNOPS
Results of indicator application
National risk trends
As mentioned before, one important approach of SYNOPS is the tracing of annual trends and the development of the environmental risk on national level. Among other indicators the risk trends are an important tool to prove and evaluate the success of the National Action Plan and to verify the goal to reduce the environmental risk by 25 % until 2020.
In figure 3 the evaluated trends for the three product groups, fungicides, herbicides and insecticides are summarised. The left side of figure 3 shows the development of the risk for the single aquatic (daphnia, fish, algae) and terrestrial (bee, earthworm) reference organism. On the right side the aggregated aquatic and terrestrial risk indices are shown together with the absolute and relative sold active ingredient volume.
The observed fluctuation of the mean value of risk indices especially for the single reference organisms is provoked by a shift of sales of the different active ingredients. The shift of sales leads to a shift of weighting factors for the uses. Therefore uses with high individual risk indices might get a lower weighting factor over time if the corresponding sales decrease.
When interpreting the trends it has to be considered, that all calculated risk potentials are related to the average risk potential of the period between 1995 and 2005. This explains very high relative risk indices with values above 100 % in the first years of the reference period. In the years following the reference period (2006‐2008) a significant reduction of the overall risk indices can be evaluated for all three product groups (table 1). In the following sections the result will be depicted for each product group in detail.
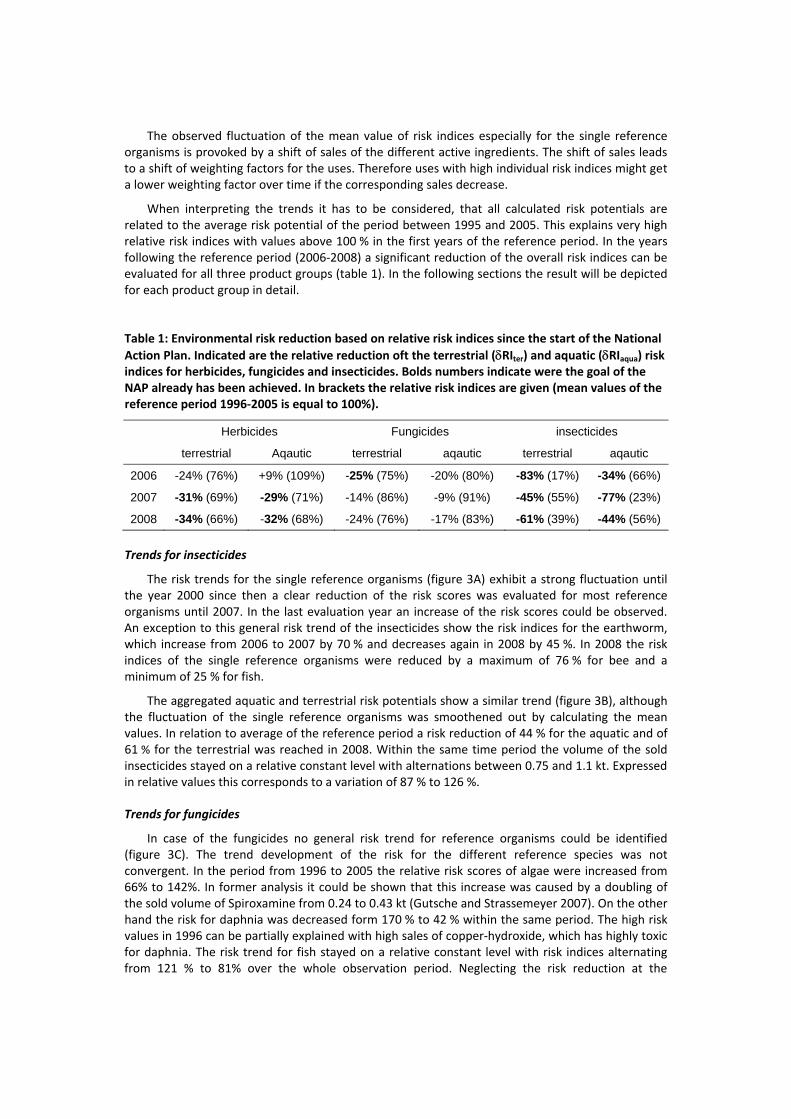
Table 1: Environmental risk reduction based on relative risk indices since the start of the National Action Plan. Indicated are the relative reduction oft the terrestrial (δRIter) and aquatic (δRIaqua) risk indices for herbicides, fungicides and insecticides. Bolds numbers indicate were the goal of the NAP already has been achieved. In brackets the relative risk indices are given (mean values of the reference period 1996‐2005 is equal to 100%).
Herbicides Fungicides insecticides
terrestrial Aqautic terrestrial aqautic terrestrial aqautic
2006 -24% (76%) +9% (109%) -25% (75%) -20% (80%) -83% (17%) -34% (66%)
2007 -31% (69%) -29% (71%) -14% (86%) -9% (91%) -45% (55%) -77% (23%)
2008 -34% (66%) -32% (68%) -24% (76%) -17% (83%) -61% (39%) -44% (56%)
Trends for insecticides
The risk trends for the single reference organisms (figure 3A) exhibit a strong fluctuation until the year 2000 since then a clear reduction of the risk scores was evaluated for most reference organisms until 2007. In the last evaluation year an increase of the risk scores could be observed. An exception to this general risk trend of the insecticides show the risk indices for the earthworm, which increase from 2006 to 2007 by 70 % and decreases again in 2008 by 45 %. In 2008 the risk indices of the single reference organisms were reduced by a maximum of 76 % for bee and a minimum of 25 % for fish.
The aggregated aquatic and terrestrial risk potentials show a similar trend (figure 3B), although the fluctuation of the single reference organisms was smoothened out by calculating the mean values. In relation to average of the reference period a risk reduction of 44 % for the aquatic and of 61 % for the terrestrial was reached in 2008. Within the same time period the volume of the sold insecticides stayed on a relative constant level with alternations between 0.75 and 1.1 kt. Expressed in relative values this corresponds to a variation of 87 % to 126 %.
Trends for fungicides
In case of the fungicides no general risk trend for reference organisms could be identified (figure 3C). The trend development of the risk for the different reference species was not convergent. In the period from 1996 to 2005 the relative risk scores of algae were increased from 66% to 142%. In former analysis it could be shown that this increase was caused by a doubling of the sold volume of Spiroxamine from 0.24 to 0.43 kt (Gutsche and Strassemeyer 2007). On the other hand the risk for daphnia was decreased form 170 % to 42 % within the same period. The high risk values in 1996 can be partially explained with high sales of copper‐hydroxide, which has highly toxic for daphnia. The risk trend for fish stayed on a relative constant level with risk indices alternating from 121 % to 81% over the whole observation period. Neglecting the risk reduction at the

beginning of the observation period (1996‐1998) a similar constant course of the risk trend could be evaluated for the bee ranging between 110 % and 77 %
Insecticides A B
Fungicides C D
Herbicides E F
Figure 3: Relative risk trends for insecticides, fungicides and herbicides. All evaluated risk values were related to the average of a 10 year period (1996‐2006). The left side of the figure (A, C, E) illustrates the risk scores for the single reference species. The right side shows the terrestrial and aquatic risk trends together with the trend of the sold product volumes (B, D, F)

By evaluating the aggregated indices for the terrestrial and aquatic risk we obtain two almost parallel courses of the risk trend (figure 3D). In the first years of the reference period (1996‐1999) a reduction of 38 % could be observed for the terrestrial and of 31 % for the aquatic risk. This is followed by a period with relative stable risk indices form 1999 to 2004. From 2004 to 2006 both risk indices deceased again by 20 % to reach the final relative indices of 76 % for terrestrial and 83 % for the aquatic risk. The risk reduction since 2004 was achieved despite the observed increase of the sold volume of fungicides form 8.176 kt to 11.501 kt. This increment of sold insecticides corresponds to a relative increase of 30 %, whereas the terrestrial risk deceased by 17 % and the aquatic risk by 14 %.
Trends for herbicides
The risk induced by the application of herbicide continuously declined until the crop year 2006 for the reference species earthworm, algae and bee (table 3E). After 2006 the risk for these tree species remained on a reduce level until 2008. A different trend was evaluated for daphnia and fish. Both species reveal an almost parallel trend course with a risk reduction until 1999, a phase of risk increase from 1996 until 2006, followed again by a risk reduction to reach relative risk scores of 95 % (fish) and 74 % (daphnia) in 2008.
The terrestrial risk follows the trend as described above for the species bee and earthworm. The aquatic risk is driven by the two reference species daphnia and fish and reveals two peaks of risk increase in 2002 and 2006. The volume of sold herbicides increased in the last four year by 25% from 14.69 kt to 18.68 kt. Despite this increase in herbicide sales both risk indices dropped the end of the evaluation period in 2008 to values of 68 % for the aquatic and 66 % terrestrial organisms.
Risk assessment on landscape level
GIS based risk assessement for German orchard regions
Plant protection in fruit growing is practised on a high level of intensity. In the years 2001, 2004 and 2007 extended field based surveys on pesticide use have been conducted in all major orchard regions in Germany (Rossberg 2003, 2006 and 2008) for the main fruits apple, pear, cherry, and plums. These studies revealed average treatment frequency indices ranging between 31.6 and 5.8 depending on the fruit and orchard region
Applying the GIS‐based version of SYNOPS the surveyed application calendars were used to assess the terrestrial and aquatic risk potentials for these orchard regions on field level according to the methods described above. The evaluation of this study will focus on the aquatic risk. In this section all results were calculated assuming that fruit growers are following the labelled drift mitigation requirements like buffer zone requirements and drift reducing equipment. In case the application of a product requires a buffer zone of 20 meter, SYNOPS assumes a minimum distance of 20 meters to the next surface water, even if the orchard is directly adjacent to a ditch or creek. In the next section the influence of the drift mitigation requirements on the aquatic risk potential in the orchard regions is analysed.
As an example of a regional risk analysis the results of the year 2007 are illustrated in figure 4 for the orchard region Lake Constance (Bodensee). In this region the environmental input parameters for 4540 orchards were available and merged with a set of 81 application calendars. The calculated aquatic risk potentials are shown as single field values in figure 4a. From the 4540 orchards 193 orchards were above the negligible risk level of ETR>1. The level of negligible risk is defined as ETR=1 since below this level the no effect concentration (NOEC) is larger than the predicted environmental concentration (PEC).
The field based risk potentials calculated with SYNOPS were in the next step aggregated in space by calculating the 90th percentile or the fraction of orchard area above the level of negligible risk (ETR=1) in relation to the total crop area. The dimensions of the spatial extend for the

aggregation can be chosen freely. In figure 4B the aquatic risk potentials were aggregated on community level and the 90th percentile values are illustrated according to the categorisation in the legend. In three communities the 90th percentile obtained values which were above the negligible risk level. This means that more than 10% of the orchards in these communities reach aquatic risk potentials above ETR=1.
A
B
Figure4: Overview on GIS‐ related input data and risk analysis with SYNOPS. A) Field based aquatic risk indices calculated with SYNOPS‐GIS. B) Risk potentials have been aggregated on community level. Illustrate are the 90th percentiles of the aquatic risk potential.
The regional risk assessment was implemented for the 3 years in which NEPTUN survey have been conducted. In figure 5 the evaluations for the three NEPTUN years are summarised. In this case the statistical valuation has been accomplished for the complete orchard region of Lake Constance. Figure 5A illustrates the 90th percentiles of the aquatic risk and figure 5B the fraction of orchard area above the negligible risk level. The aquatic risk is defined as the maximum of the calculated risk potentials of the three aquatic reference organisms (fish, algae and daphnia). In addition to the aggregated aquatic risk the risk values of the three reference organisms are presented in figure 5. Both, the 90th percentile of the aquatic risk and the fraction of the area with ETR>1 significantly declined within the period from 2001 to 2007. The 90th percentile of the aquatic risk was reduced by 61% and the fraction of the area with ETR>1 was reduced by 43 %. The largest

risk reduction could be observed for daphnia, whereas for algae an increase of the risk potential could be observed in 2004.
The regional evaluation of the aquatic risk calculated with SYNOPS‐GIS as demonstrated above, was conducted for all main orchard regions in Germany. Because of the limited amount of space only the summarised results of the evaluation for Germany are presented in this publication. The aggregated aquatic risk potential was evaluated as the 90th percentile for each orchard region and for each year in which NEPTUN surveys have been conducted (table 2). The results are presented in figure 6, showing that for all regions a reduction of the aquatic risk was observed, ranging from 41 % in the Mid‐German orchard region (Mitteldeutsches Obstanbaugebiet) to 70 % in the Rhine valley (Rheinebene). In 2007 we evaluated in four regions a 90th percentile of the aquatic risk, which was below the negligible risk level. In one region (Mid‐German orchard region) the 90th percentile of the aquatic risk was just above this level with ETR =1.039
Figure 5: Results of regional risk assessment with SYNOPS‐GIS for the orchard region Lake Constance (Bodensee). Assessments were accomplished for the years, in which field based surveys on pesticide use (NEPTUN) were available. Shown are A) the 90th percentile of the aquatic risk potentials and B) the fraction of agricultural area with ETR>1.
Table 2: Results of regional risk assessment with SYNOPS‐GIS for the main orchard regions in Germany. Listed are 90th percentiles of the aquatic risk potentials.
orchard regions 2001 2004 2007 risk reduction in 2007
related to 2001 Bodensee (Lake Constance) 0.790 0.539 0.304 61% Rheinebene (Rhine Valley) 2.711 2.124 0.806 70% Franken/Neckartal 0.916 0.833 0.392 57% Sachsen (Saxony) 0.803 0.635 0.279 65% Rheinhessen/Pfalz 1.189 0.606 0.357 70% Niederelbe 5.730 4.987 3.336 42% Brandenburg 4.153 3.924 1.419 66% mitteldeutschesObstanbaugebiet (Mid‐German orchard region)
1.833 2.211 1.039 43%
In two regions the calculated aquatic risk was clearly above the negligible risk level. The orchard region Niederelbe is characterised by its high water body density. In this region the portion of
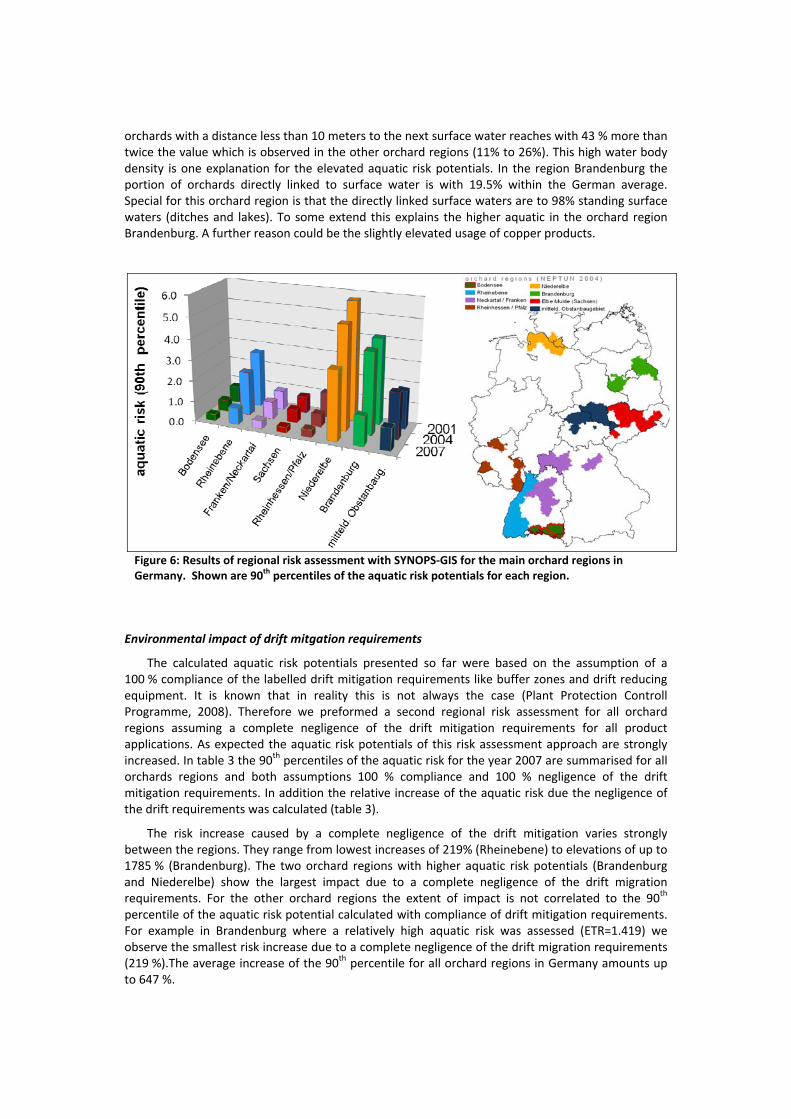
orchards with a distance less than 10 meters to the next surface water reaches with 43 % more than twice the value which is observed in the other orchard regions (11% to 26%). This high water body density is one explanation for the elevated aquatic risk potentials. In the region Brandenburg the portion of orchards directly linked to surface water is with 19.5% within the German average. Special for this orchard region is that the directly linked surface waters are to 98% standing surface waters (ditches and lakes). To some extend this explains the higher aquatic in the orchard region Brandenburg. A further reason could be the slightly elevated usage of copper products.
Figure 6: Results of regional risk assessment with SYNOPS‐GIS for the main orchard regions in Germany. Shown are 90th percentiles of the aquatic risk potentials for each region.
Environmental impact of drift mitgation requirements
The calculated aquatic risk potentials presented so far were based on the assumption of a 100 % compliance of the labelled drift mitigation requirements like buffer zones and drift reducing equipment. It is known that in reality this is not always the case (Plant Protection Controll Programme, 2008). Therefore we preformed a second regional risk assessment for all orchard regions assuming a complete negligence of the drift mitigation requirements for all product applications. As expected the aquatic risk potentials of this risk assessment approach are strongly increased. In table 3 the 90th percentiles of the aquatic risk for the year 2007 are summarised for all orchards regions and both assumptions 100 % compliance and 100 % negligence of the drift mitigation requirements. In addition the relative increase of the aquatic risk due the negligence of the drift requirements was calculated (table 3).
The risk increase caused by a complete negligence of the drift mitigation varies strongly between the regions. They range from lowest increases of 219% (Rheinebene) to elevations of up to 1785 % (Brandenburg). The two orchard regions with higher aquatic risk potentials (Brandenburg and Niederelbe) show the largest impact due to a complete negligence of the drift migration requirements. For the other orchard regions the extent of impact is not correlated to the 90th percentile of the aquatic risk potential calculated with compliance of drift mitigation requirements. For example in Brandenburg where a relatively high aquatic risk was assessed (ETR=1.419) we observe the smallest risk increase due to a complete negligence of the drift migration requirements (219 %).The average increase of the 90th percentile for all orchard regions in Germany amounts up to 647 %.
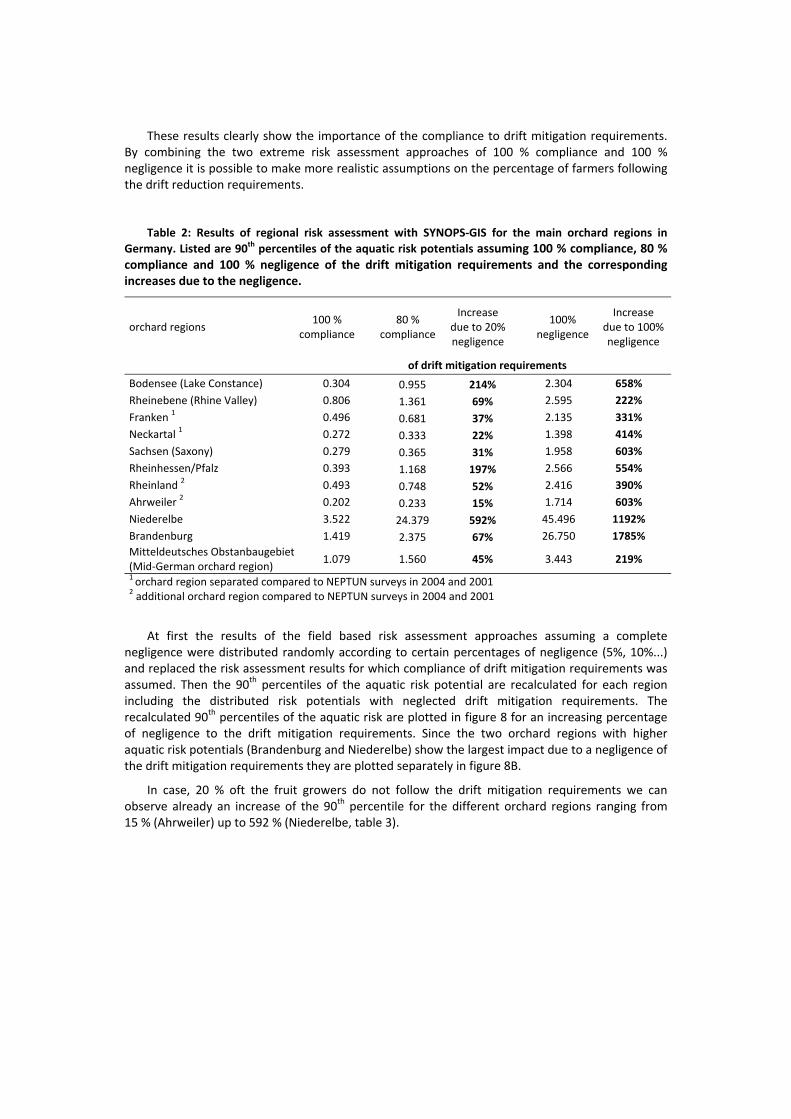
These results clearly show the importance of the compliance to drift mitigation requirements. By combining the two extreme risk assessment approaches of 100 % compliance and 100 % negligence it is possible to make more realistic assumptions on the percentage of farmers following the drift reduction requirements.
Table 2: Results of regional risk assessment with SYNOPS‐GIS for the main orchard regions in Germany. Listed are 90th percentiles of the aquatic risk potentials assuming 100 % compliance, 80 % compliance and 100 % negligence of the drift mitigation requirements and the corresponding increases due to the negligence.
orchard regions 100 %
compliance80 %
compliance
Increase due to 20% negligence
100%
negligence
Increase due to 100% negligence
of drift mitigation requirements
Bodensee (Lake Constance) 0.304 0.955 214% 2.304 658% Rheinebene (Rhine Valley) 0.806 1.361 69% 2.595 222% Franken 1 0.496 0.681 37% 2.135 331% Neckartal 1 0.272 0.333 22% 1.398 414% Sachsen (Saxony) 0.279 0.365 31% 1.958 603% Rheinhessen/Pfalz 0.393 1.168 197% 2.566 554% Rheinland 2 0.493 0.748 52% 2.416 390% Ahrweiler 2 0.202 0.233 15% 1.714 603% Niederelbe 3.522 24.379 592% 45.496 1192% Brandenburg 1.419 2.375 67% 26.750 1785% Mitteldeutsches Obstanbaugebiet (Mid‐German orchard region)
1.079 1.560 45% 3.443 219% 1 orchard region separated compared to NEPTUN surveys in 2004 and 2001 2 additional orchard region compared to NEPTUN surveys in 2004 and 2001
At first the results of the field based risk assessment approaches assuming a complete negligence were distributed randomly according to certain percentages of negligence (5%, 10%...) and replaced the risk assessment results for which compliance of drift mitigation requirements was assumed. Then the 90th percentiles of the aquatic risk potential are recalculated for each region including the distributed risk potentials with neglected drift mitigation requirements. The recalculated 90th percentiles of the aquatic risk are plotted in figure 8 for an increasing percentage of negligence to the drift mitigation requirements. Since the two orchard regions with higher aquatic risk potentials (Brandenburg and Niederelbe) show the largest impact due to a negligence of the drift mitigation requirements they are plotted separately in figure 8B.
In case, 20 % oft the fruit growers do not follow the drift mitigation requirements we can observe already an increase of the 90th percentile for the different orchard regions ranging from 15 % (Ahrweiler) up to 592 % (Niederelbe, table 3).

A
B
Figure 8: Results of regional risk assessment with SYNOPS‐GIS for the main orchard regions in Germany. Shown are 90th percentiles of the aquatic risk potentials for each region assuming a deceasing compliance to drift mitigation requirements.
Discussion and conclusions
The indicator model SYNOPS represents a tool which can be applied on different levels of aggregation using the same functionalities and sub modules for trend assessments and detailed regional risk analysis. Besides other impact indicators (e.g human health) or state and response indicators, SYNOPS has been chosen to measure the progress in reaching the targets of the German National Action Plan (NAP) on the Sustainable Use of Plant Protection Products. This is achieved by applying the two approaches SYNOPS‐Trend to assure the tracing of national risk trends using sales data and SYNOPs‐GIS for detailed regional risk assessment and hot spot detection using pesticide use data from field based surveys.
Since the first risk reduction programme was launched in 2006 the environmental risk assessed with SYNOPS‐Trend was significantly reduced. Within the three considered years, a reduction of the terrestrial (δRIter) and aquatic risk (δRIaqua) according to the goal of the second risk reduction programme named NAP (25 % until 2020) was already assessed for herbicides (δRIter=32% and δRIaqua=34%) and insecticides (δRIter=61% and δRIaqua=44%) whereas the risk reduction for fungicides (δRIter=24% and δRIaqua=17%) was still below this goal. The observed environmental risk reductions were achieved despite an increase of the sold active ingredients in this period.
These results indicate a promising progress in risk reduction and show that the measures taken within the National Action Plan to reduce the environmental risk are going into the right direction. For the future it has to be evaluated, if this trend remains.
The results further confirm the decision to focuses on risk reduction within then NAP rather than setting specific quantity reduction targets. With the risk‐based approach, the use of a high‐risk plant protection product could be reduced without affecting the quantity of sold pesticides.
The results of the GIS‐based regional risk assessment, applied as a sample study to the main German orchard regions, points into the same direction. They demonstrate a significant reduction of the aquatic risk since 2001. Depending on the orchard region, the extent of the risk reduction was ranging from 41% to 70%.

The reductions evaluated with GIS‐based approach are in a similar dimension as the result achieved with SYNOPS‐Trend. Comparing the results it has to be considered though, that for the GIS‐based approach only one reference year (2001) was available and not a period of 10 years. Furthermore only pesticide use for orchards was considered with the GIS based approach. To complete the picture similar environmental risk analysis are in preparation or have already been conducted for hops, vineyards and field vegetables. For these corps also successively conducted field based surveys are available in Germany.
Analysing the regional variation of the 90th percentiles of the aquatic risk, two regions could be identified which revealed higher aquatic risk potentials than the other regions. In these two regions the calculated aquatic risk was clearly above the negligible risk level. This could be to some extent explained with a higher water body density or with a higher potion of standing surface waters directly linked to orchards. Such regions are candidates for the implementation of specific hot spot management which poses an important aspect of the National Action Plan.
The application of SYNOPS‐GIS under the assumption that to certain percentage the labelled drift mitigation requirements are not followed by fruit growers, reveals high increases of region specific the 90th percentile of the aquatic risk. Already a realistic assumption of a 20% negligence of the drift mitigation requirements increases the aquatic risk ranging from 15% up to 592 % depending on the orchard. This large variation is certainly to some extent caused by differences in the water body density of regions like Niederelbe but also by the variations in the spectrum of the used products. In a region where a large portion of products is used with high drift mitigation requirements the impact of negligence will be larger than in regions where a small portion of such products is used. A detailed analysis on the influence and differences in the product and active ingredient spectrum between the orchard regions will be conducted in future.
Orchard regions with a high impact of negligence to drift mitigation requirements on the aquatic risk should be in the focus, when specific measures on control aspects are implemented within the National Action Plan.
Bibliography
AdV. (2002), ATKIS Amtliches Topographisch ‐ Kartographisches Informationssystem, Objektartenkatalog Basis‐DLM, Arbeitsgemeinschaft der Vermessungsverwaltungen, http://www.atkis.de
Agritox, (2008), www.dive.afssa.fr/agritox
BGR (1995), Bodenübersichtskarte der Bundesrepublik Deutschland 1:1.000.000 (BÜK 1000), http://www.bgr.bund.de/cln_092/nn_325378/DE/Themen/Boden/Produkte/Karten/
BKG (2005), DGM‐Deutschland / Digitales Geländemodell Bundesrepublik Deutschland 25 x 25, http://www.bkg.bund.de/
Bundesanzeiger (2005), Gute fachliche Praxis im Pflanzenschutz, Bundesanzeiger 57 and 58a
Delbaere, B. u. A. Nieto Seradilla (2004), Environmental risks from agriculture in Europe: Locating environmental risk zones in Europe using agr‐environmemtal indicators. Tilburg, 2004, ECNC‐European Centre for Nature Conservation, 184 p
ENDURE (2006), Europen Network for Durable Exploitation of crop protection strategies (FP6‐2005‐FOOD‐4‐A), http://www.endure‐network.eu.
FAO (2002), The FAO Code of Conduct on the Distribution and Use of Plant Protection Products, http://www.fao.org/agriculture/crops/core‐themes/theme/pests/pm/code/en/

Gutsche, V. und Rossberg, D. (1997a): SYNOPS 1.1: a model to assess and to compare the environmental risk potential of active ingredients in plant products. Agriculture, Ecosystems & Environment 64., 1997, 181‐188
Gutsche, V. und Rossberg, D. (1997b), Die Anwendung des Modells SYNOPS 1.2 zur synoptischen Bewertung des Risikopotentials von Pflanzenschutzmittelwirkstoffgruppen für den Naturhaushalt. Nachrichtenbl. Deut. Pflanzenschutzd. 49.(11), 1997, 173‐285
Gutsche, V. und Rossberg, D. (1999), A proposal for estimating the quantity of pesticide active ingredients applied by crop based on national sales data. Report of the OECD Project in Pesticide Aquatic Risk Indicators – Report of Phase 1, Annex 1, OECD, Paris, 1999, 44‐49.
Gutsche, V.(2004), Pflanzenschutzindikatoren in Deutschland, Tagungsbericht Nachhaltigkeit‐ und Agrarumweltindikatoren, Bonn, 25.‐26. März 2004, Bundesministerium f. Ernährung u. Landwirtschaft, S. 83‐99.
Gutsche, V.(2004), Pflanzenschutzindikatoren in Deutschland, Tagungsbericht Nachhaltigkeit‐ und Agrarumweltindikatoren, Bonn, 25.‐26. März 2004, Bundesministerium f. Ernährung u. Landwirtschaft, S. 83‐99.
Gutsche, V., Roßberg, D. (2000), Bewertung von Pflanzenschutz – Strategien mittels Risikoindikatoren. Mitt. Biol. Bundesanst. Land‐Forstwirtsch. 371 (2000), 68‐83.
Gutsche, V., Strassemeyer, J. (2007), SYNOPS ‐ ein Modell zur Bewertung des Umwelt‐Risikopotentials von chemischen Pflanzenschutzmitteln, Institut für Folgenabschätzung im Pflanzenschutz, Biologische Bundesanstalt für Land‐ und Forstwirtschaft.
HAIR(2007), Final report, http://www.rivm.nl/rvs/risbeoor/Modellen/ Results_of_HAIR_project.jsp
Luttik, R. (ed.) (2004), Report of the Workshop on Pesticide Risk Indicators for Man and the Environment: Noordwijkerhout, The Netherlands, May 2004
OECD (1997), Report of the 1st OECD Workshop on Pesticide Risk Indicators: Copenhagen, April 1997
OECD (2000), Report of the OECD Pesticide Aquatic Risk Indicator Expert Group. OECD Paris April 2000, 56 p
OECD (2009), Strategic Approach in Pesticide Risk Reduction. OECD Environment, Health and Safety Publications. Series on Pesticides No. 48
PflSchG (1986), Gesetz zum Schutz der Kulturpflanzen (Pflanzenschutzgesetz ‐ PflSchG), http://www.gesetze‐im‐internet.de/bundesrecht/pflschg_1986/gesamt.pdf
PflSchG (1998), Gesetz zum Schutz der Kulturpflanzen (Pflanzenschutzgesetz – PflSchG, Section 2a, http://www.gesetze‐im‐internet.de/pflschg_1986/__2a.html
Plant Protection Controll Programme (2008), Annual report 2008, www.bvl.bund.de
Reus, J., Leendertse, P., Bockstaller, C., Fomsgaard, I., Gutsche, V., Lewis, K., Nilson, C., Pussemeier, L., Trevisan, M., van der Werf, H., Alfarroba, F., Blümel, S., Isart, J., McGrath, D., Seppälä, T..(1999), Comparing Environmental Risk Indicators for Pesticides. Results of the European CAPER Project. Centre for Agriculture and Environment Utrecht, CLM 426, 1999, ISBN 90‐5634‐106‐5), 184 pp
Reus, J., Leendertse, P., Bockstaller, C., Fomsgaard, I., Gutsche, V., Lewis, K., Nilson, C., Pussemeier, L., Trevisan, M., van der Werf, H., Alfarroba, F., Blümel, S., Isart, J., McGrath, D., Seppälä, T. (2002): Comparison and evaluation of eigth pesticide environmental risk indicators development in Europe and recommendations for future use. Agriculture Ecosystems & Environment 90, 177 ‐ 187.

Rossberg, D. (2003), NEPTUN 2001‐ Erhebung von Daten zum tatsächlichen Einsatz chemischer Pflanzenschutzmittel im Obstbau, im Hopfen und in Erdbeeren. Reports from the Federal Biological Research Centre for Agriculture and Forestry. 122 (2003), 64 S.
Rossberg, D. (2006), NEPTUN 2004 – Survey into application of chemical pesticides in agricultural practice of fruit crops. Reports from the Federal Biological Research Centre for Agriculture and Forestry, 129 (2006), 29 S.
Rossberg, D. (2008), NEPTUN 2007 Obstbau. Reports from the Julius Kühn‐Institute, 147 (2009), 29 S.
Rossberg, D., H. Eckert, and U. Gernand, (2005), Farm assessment regarding the environmental sustainability. Part: quantitative assessment of the intensity of applications of plant protection products. Nachrichtenblatt des Deutschen Pflanzenschutzdienstes, 57(6), p. 121‐125