the april 2006 anchorage sales tax proposal: fairness...
TRANSCRIPT

PADM 628
“Administration of Financial Resources” Spring 2006
Dr. Greg Protasel
The April 2006 Anchorage Sales Tax Proposal: Fairness, Equity, and
Distributional Consequences
A research paper by
Jed Crabb Kimberly Gialopsos
Michelle Peters Rebekah Smith

Special thanks to
Eric Larson, Senior Staff Accountant, Municipality of Anchorage Finance Department for his assistance and support in completion of this project;
and
Dick Tremaine, E3 Consulting Services, for the contribution of his model and his
patience in explaining it.

TABLE OF CONTENTS
Introduction 1
What makes a good tax system? 2
Why are Fairness and Equity Important in Evaluating the Sales Tax Proposal? 4
The Representative Taxpayer Model 6
Building Representative Taxpayer Profiles 7
Private Taxpayers 12
Calculation Results 14
Discussion 16
Commercial Taxpayers 18
Property and Sales Tax Impact on Business 19
Alaska’s Business Tax Climate 20
Local Sales Tax in Alaska 22
Impact of Property Tax Relief 22
Impact of Sales Tax Burden 25
Conclusion 28
References
Appendices

1
Introduction
Amid growing discontent with increasing home value assessments and concurrent
higher property taxes, Anchorage voters once again were faced with a sales tax
proposition. A sales tax proposal appears on the ballot every few years in response to
perceived impending municipal fiscal duress, yet, the sales tax has never been approved
by Anchorage voters. The debate is similar in every instance; the same issues, much of
the same information, even some of the same faces. It is the aim of this paper to add a
new dimension to this debate and perhaps shed light on the refusal of sales taxes by
Anchorage voters – a refusal reconfirmed by the vote April 4th, 2006, in which the most
recent proposal was rejected.
Anchorage policy makers and voters have been lacking a serious discussion on
the principle of “fairness and equity” and how it relates to sales tax propositions. In
evaluating the 2006 proposed sales tax in relation the principle of fairness and equity, this
paper offers Anchorage voters a new take on an old idea. The positive and negative
aspects of the 2006 sales tax proposal are discussed in relation to a principle that most
Anchorage voters would seem to agree is an important one to consider before a new
proposal is offered at the polls again.
To better understand the potential effects of the proposed 2006 sales tax voters
may or may not have considered at the polls this April, there needs to be a shared
knowledge foundation that can support this paper’s evaluation. This paper will lay a
foundation by providing a brief overview of the different principles by which to judge a
good tax system. Second, this paper will provide a distributional analysis using a
representative taxpayer model to show the effects of the sales tax on Anchorage voters.
2
Finally, this paper will discuss the possible equity issues in the Anchorage business
community.
What Makes a Good Tax System?
The answer to this question is dependant on whom you ask. The differences in
deciding on a good tax system are differences in values relating to the role of
government, businesses, and the individual. In spite of these differences, economists and
policy makers generally agree on a set of five basic principles, effectively summarized by
David Brunori (2001), with which to evaluate a good tax system. Although all are of
equal importance, it is a value judgment that placed the principle of “fairness and equity”
at the foremost of this paper’s discussion. Anchorage has not yet had a serious discussion
on the matter of fairness and equity in evaluating our tax system. Considering that most
Anchorage voters would agree that fairness and equity is an important principle, we will
use this principle as a yardstick in evaluating the proposed sales tax.
To facilitate the evaluation of the 2006 sales tax proposal it is important to
provide a common set of standards. As stated above, there are five almost unanimously
accepted principles that economists and academics use to determine whether or not a tax
system is good.
The first principle for evaluation is whether or not the tax system raises enough
revenues to fund public expenditures. There are several significant questions Anchorage
voters face in relation to this first principle. The main concern is that a sales tax will not
generate enough revenue to meet the revenue generated from property taxes; leaving
Anchorage homeowners with both a property tax as well as a sales tax. The other main

3
concern is that in contrast to the stability of the amount of revenue generated by property
taxes, a sales tax is tied to unpredictable public spending and therefore will yield
unpredictable revenues.
The second principle used to evaluate whether or not a tax system is good is the
principle of neutrality. Neutrality refers to whether or not the tax affects people’s or
business’s choices in the market. A good tax system will affect the market very little; that
is, people will continue their normal market activities with their normal purchasing power
unimpeded by the tax. There are several questions Anchorage voters face here; the main
one being where they will choose to spend their money. Loss of sales tax revenue to the
Valley over large tickets items and loss from internet sales have been significant in other
states and could be for Anchorage as well.
The third standard that needs to be met if a tax system is to be considered good is
if the tax system is easy and economical to administer. The current estimate is that it will
take about $3 million and 31 new municipal employees to administer the sales tax, and
the cost that businesses will incur and pass on to consumers is unknown.
The fourth principle is accountability, or the ability to make sure that people and
businesses comply with the new sales tax. Since the municipality is unable to enforce a
use tax except on large ticket items requiring licensing, the accountability of the tax is
undetermined.
Finally, the principle of fairness and equity is used to judge whether or not a tax
system is good, and is the most important principle in this discussion. Although people’s
differences of opinion rest on differences in values, most economists and policy makers
agree that there are two types of equity important to maintaining a good tax system. The

4
first type is whether or not the tax system is horizontally equitable. Simply put, this
means that people and businesses that are similar pay similar taxes. The second concept
within the principle of fairness and equity is the concept of vertical equity. Again, simply
put, this is the idea that the tax system should be based at least partially on the person’s or
business’s ability to pay. There are many differing opinions on vertical equity, ranging
from the idea that taxes should be flat, to the preference they be highly progressive. It is
generally agreed upon by experts though that a tax system should not be overly
regressive.
Why are Fairness and Equity Important in Evaluating the Sales Tax Proposal?
The principle of fairness and equity is a concept that has not been adequately
discussed in Anchorage politics. Most people would seem to agree however, that the
concept is an important aspect to consider when judging whether or not a tax system is a
good tax system. The record of defeated sales tax proposals may point to Anchorage
voters taking this principle into account.
If a tax system does not follow the concept of horizontal equity, people begin to
distrust the system for being partial and discriminatory. A lack of horizontal equity in a
tax system also leads to a tax base that is too small, where only some people or
businesses are paying the tax while many others are not. For Anchorage homeowners
who feel unduly burdened by increasing property taxes this is a particularly relevant
discussion. For many ordinary people who observe large private faith-based groups that
are exempt from taxes, it seems unfair. For businesses that observe a lack of horizontal
equity it may seem unfair, but it may also seem like a potential tax haven.

5
Just as there are social and economic impacts in failing to make a tax system
horizontally equitable, there are negative consequences to having a tax system that lacks
vertical equity. What makes a tax system fair is different for everyone, but it is generally
agreed that the people with the ability to pay taxes should pay, and that the people that
lack the ability to pay taxes should not (a good example are elderly people on a fixed
income). A tax system that places undue tax burden on people who are unable to pay
creates ramifications like an over-reliance on public services, such as food stamps, and
other such programs.
In a model of a good tax system every person and business would be treated
equally and taxed equally according to their respective ability to pay, satisfying both
horizontal and vertical equity principles. This overly simplified version of a good tax
system is easy to understand and most people would agree is a good tax system. No
person or business wants to pay more taxes than other persons or businesses in similar
situations and most people would agree that it is unfair in our modern society to place an
undue tax burden on the people least able to afford to pay. Unfortunately we do not live
with this type of simple tax system but, we can still use this simple model as an ideal of
what a good tax system should accomplish.
Fairness and equity dictate that the system should be fair and equal, principles that
find their roots deep in the American political tradition. The problems with codifying into
tax law this principle are problems in definitions of what fairness and equality ought to
be. There is no getting around the fact that this principle is highly normative. The old
adage that “you can’t define justice” applies to this principle in that everyone has their
own definition of what is equal and what is fair.

6
Part of the problem that Anchorage voters face in evaluating the new sales tax
proposal is the lack of a true discussion of the principle of equity and fairness combined
with the perception that the current tax system is in some way noncompliant with this
principle.
The Representative Taxpayer Model
The aim of the authors is to present the effects of the proposed sales tax as
factually as possible within the concept of fairness and equity. We will examine the
proposed sales tax in light of who will be paying the majority of tax revenue, who will
receive the most property tax relief, and who ultimately are the “winners and losers”.
Very few states and fewer local governments have attempted to study how changes in tax
laws affect the amount of taxes paid by different income groups and how total tax
obligations are distributed across different income groups (Mazerov, 2002). This
distributional analysis is critical in evaluating whether or not a tax system is fair and
equitable. This paper presents a representative taxpayer model to determine what groups
of private people will benefit or lose from the effects of the proposed sales tax, and will
explore the effects on businesses, as well. There are limitations to the discussion, for
instance, it is a simplified version of the distribution of tax liabilities and cannot
adequately measure the full impact on the changes to business taxes. It is also limited in
that any small change to a “typical” person or business can have a significant impact on
the model’s output. However, the representative taxpayer model offers a very good
picture of the distributional affects of the sales tax proposal and is very easy for everyone
to understand. The representative taxpayer model will give policy makers information

7
they need to determine if the proposed tax law will have the effects on tax burdens that
they intend as opposed to unintended results. This information will also help policy
makers to determine if the affects of the new tax burden follow spending priorities and
societal goals. Above all, the representative taxpayer model will help Anchorage voters to
make those same decisions for themselves and decide whether or not a sales tax proposal
such as the one recently rejected will benefit or harm their own tax burden as well as give
them information about the tax burden of other members of our community. With this
representative taxpayer model policy makers and Anchorage citizens can determine if the
April 2006 sales tax proposal followed their principles of fairness and equity, and
evaluate future proposals.
Building Representative Taxpayer Profiles
The Government of the District of Columbia, Office of the Chief Financial
Officer, Office of Research and Analysis publishes an annual study comparing tax
burdens in the largest city in each state with the District of Columbia. The District has
been conducting this study since 1997, and uses a representative taxpayer model. Given
this level of expertise, the District’s methodology seemed an appropriate template. The
discussion below is based on the District’s 2004 study, released in August 2005.
Income, Homeowner status and Household Size: Income levels used by the
District ($25,000, $50,000, $75,000, $100,000 and $150,000) were adopted directly. The
median income of the profiles, $75,000, is close to the median family income in
Anchorage of $73,840. The District profiles are based on a married two wage earner
family with two children, assumed to own and occupy a single family home. Because

8
Anchorage’s average household size of an owner-occupied unit is 2.8 and the average
family size is 3.37, a household size of 3 was chosen for all profiles other than seniors.
In addition, profiles assume the family is not a senior household. Anchorage data is
based on the U.S. Census Bureau 2004 American Community Survey.
Property values: Again following the District study’s method, property values
were calculated as follows:
1. The median value of an owner-occupied housing unit is compared to the
median family income to get a housing/income ratio. Using 2004 Community
Survey data, the median value of an owner-occupied housing unit in Anchorage is
$206, 746, and the median family income is $73,840, resulting in a
housing/income ratio of 2.80 (rounded).
2. The housing value for the $50,000 and $75,000 income levels are derived by
multiplying the above ratio by the income level:
$50,000 x 2.8 = $140,000 $75,000 x 2.8 = $210,000 3. The housing ratio is adjusted for the $25,000 income level as the cost of
housing is assumed to be a greater proportion of income than the housing/income
ratio. Based on data from the U.S. Census, the ratio is increased by 5 percent:
$25,000 x 2.8 x 1.05 = $73,500
4. The housing ratio is also adjusted for the two highest income levels, as housing
costs are assumed to be a lower percentage of income than the ratio. Again, based

9
on U.S. Census data, the ratio is reduced by 5 % at the $100,000 level and 10 % at
the $150,000:
$100,000 x 2.8 x .95 = $266,000 $150,000 x 2.8 x .90 = $378,000
Expenditures and Sales Tax: Except for the senior profiles, the sales tax burdens
are based on information from the 2003-2004 Bureau of Labor Statistics Consumer
Expenditure Survey (CES) Table 38, expenditures for a consumer unit of 3. The District
study adjusts expenditures in a similar fashion to the calculations for property values.
The total average amount purchase is divided by the total average income, and that
percentage is multiplied by each of the representative taxpayer income levels. As with
property value calculations, the $25,000 income level is increased by 5 %, and the
$100,000 and $150,000 levels are decreased by 5 and 10 %, respectively. Expenditure
figures used in this model deviate slightly from the District’s methodology. Rather than
deriving the percentage by dividing the total average amount purchase by total average
income, the average amount purchase was divided by average income within the income
ranges of the CES tables corresponding to the profiles’ income levels. This method
maintained the much higher spending as a percent of income found at the $25,000
income level. Because CES Table 38 stops at an income level of >$70,000, this spending
level was used for the highest two incomes, adjusted by a decrease of 5 and 10 %.
Non-taxable expenditures were subtracted from the total expenditures, giving a
total of taxable expenditures, which were then used to calculate the percentage of income
spent on taxable goods. Because the CES Table 24 shows average Anchorage spending
on taxable goods is 2 % less than the average spending in the U.S.West, the percentage of

10
income spent on taxable goods was reduced by 2 % at each income level. Finally, the
amount of expected sales tax was calculated by multiplying .03 by the appropriate
percentage and income level. Complete tables of expenditures can be found in Appendix
A.
Seniors: The current proposal is being put forth as property tax relief, yet seniors
are exempt from the property tax up to $170,000 in property value. Seniors owning
homes at or below this amount will not receive property tax savings, but will still pay a
sales tax. Because the regressive nature of a sales tax has a greater effect on low and
fixed income individuals, such as seniors, and because seniors have a higher housing–to-
income ratio, separate profiles were constructed for this group. The methodology
described above was repeated, however expenditures are based on the CES Table 30,
expenditures for person age 65 and older, and the housing-to-income ratio is 4.42
(rounded). The senior expenditures tables are included in Appendix A. The housing-to-
income ratio is based on the Municipality of Anchorage median assessed value of
properties that received a senior exemption in 2005, $215,200, (E. Larsen, personal
communication, April 12, 2006) and the 2004 Community Survey median income of a
householder 65 years of age and over for Anchorage, $48,709. Because seniors are more
likely to supplement their income with savings, a higher housing-to-income ratio is to be
expected. Senior profiles assume home ownership, with a household size of 2.
The Calculator: A model sales tax calculator was provided by Richard Tremaine,
an Economist with E3 Consulting Services (R. Tremaine, personal communication,
March 13, 2006). Figure 1 shows the entries that go into the tax calculations, using the

11
$25,000 income level as an example. Entries for the area in blue are explained by the
calculator outline.
Figure 1
Sales Tax Calculator Will a sales tax with reduction in property taxes really save you money? Gross Income $25,000 Are you a renter? (Y/N) n Assessed value of property (for property owners) $73,500 Senior? (Y/N) n Number of dependants including you. 3 Itemized federal deductions? (Y/N) y Marginal tax rate (15%, 25%, 28%) 15 % Property tax reduction $218 Actual total reduction in taxes - including revised Schedule A $233 Expected sales tax you will pay: $383 Expected total tax savings -$149
Property tax reduction is calculated as follows:
(Property value – 20,000 ) x 0.01659 x .25
The 20,000 reduction in property value reflects the Municipality’s residential
exemption. For seniors, the calculator adjusts the exemption to $170,000. An average
mill rate of .01629 is based on the 2005 Municipal tax revenues (excluding Anchorage
School District) divided by 2005 assessed value, plus the 2005 school district mil levy.
Finally, the result is multiplied by the Municipality’s estimated 25 % reduction in
property taxes. Obviously, for renters, the property tax reduction is zero.
“Actual total reduction in taxes” includes the reduction in federal tax deduction
from the lower property tax plus the federal tax deduction allowed for local sales tax

12
according to IRS Schedule A. This amount is multiplied by .01 to adjust for tax burden
rate being entered in the calculator as a whole number.
“Expected sales tax you will pay” is calculated by multiplying a 3 % tax rate by
gross income and then multiplying this amount by the percentage of taxable expenditures
to income. This percentage is from the expenditures tables described above.
Finally, “expected total tax savings” is simply the difference between the “actual
reduction in taxes” and “expected sales tax you will pay.” A negative number illustrates
a net loss, whereas a positive number is a net gain. Expenditure and tax burden figures
used in the original model can be found in Appendix B.
Private Taxpayers
The calculators used to create the profiles operate as described above, however, as
the original model was designed for general use, expenditures and the resulting sales tax
expectations were based on the CES average expenditures table rather than the
expenditures table for specific household size. In addition, because the original
calculator was intended to cover a range of incomes, no adjustments were made to the
expenditures table to reflect expenditures for specific incomes. Adjustments made by
this project include corrections to the federal sales tax deduction calculation, use of CES
expenditures tables specific to a household size of 3 and seniors, adjusting expenditures
to specific income levels as described above and changes to the calculations to meet the
specific needs of various profiles. The latter is described below.
Three separate calculations were done for the Family of Three profiles.
Calculations for the first two profile tables, “Family of Three, Itemized Deductions,

13
Homeowners” and “Family of Three, Itemized Deductions, Renters” required no
adjustments other than to expenditures data as described above. The calculator used for
these calculations can be found on the enclosed disk under the tab labeled “Calculator1.”
Calculations were made using the marginal tax rates for both Head of Household and
Married Filing Jointly, and are noted where different. Although renters are less likely to
itemize deductions, all profile groups were considered to itemize in order to keep
constant as many variables as possible, and to show the best case savings scenario, which
requires the federal sales tax deduction. A final “Family of Three” profile eliminates the
federal deduction of local sales tax from the “actual total reduction in taxes” calculation.
The calculator used for these calculations can be found on the enclosed disk under the tab
labeled “Calculator2.” This profile table was included as the federal deduction of local
sales tax is not currently allowed beyond the 2005 tax year.
As mentioned above, a separate profile was developed for seniors. Property
values at each income level are higher than the other profiles because of the difference in
the housing/income ratio. The percentage of taxable expenditures to income also differs
from the other profiles. Adjustments were made to the “expected sales tax you will pay”
formula accordingly. The calculator used for these calculations can be found on the
enclosed disk under the tab labeled “CalculatorSenior.

14
Calculation Results
Tables 1 and 2 show tax savings or costs for a family of 3 at the various income
levels, which itemizes deductions and owns a home. Total tax savings in Table 1
assumes that Congress will make the federal deduction of local sales tax option
permanent. Table 2 shows results if the sales tax deduction simply sunsets. The sales
tax burden as a percent of income shows the regressivity of the sales tax.
Table 1 Family of Three*, Itemize Deductions, Homeowners Income level $25,000 $50,000 $75,000 $100,000 $150,000 Property value $73,500 $140,000 $210,000 $266,000 $378,000 Property tax reduction $218 $489 $774 $1,002 $1,458 Actual total reduction in taxes $233 $487 $721 $922 $1,273 Expected sales tax paid $383 $540 $630 $780 $1,125 Total tax savings -$149 -$53 $91 $142 $148 Sales Tax burden as % of income 1.53% 1.08% 0.84% 0.78% 0.75%
Table 2
Family of Three*, Itemize Deductions, Homeowners No Sales Tax Deduction
Income level $25,000 $50,000 $75,000 $100,000 $150,000 Property value $73,500 $140,000 $210,000 $266,000 $378,000 Property tax reduction $218 $489 $774 $1,002 $1,458 Actual total reduction in taxes $185 $415 $580 $751 $1,050 Expected sales tax paid $383 $540 $630 $780 $1,125 Total tax savings -$197 -$125 -$50 -$29 -$75Sales Tax Burden as % of Income 1.53% 1.08% 0.84% 0.78% 0.75%

15
Although the sales tax burden as a percent of income is the same for renters,
Table 3 illustrates a much greater effect of the sales tax on this group, as it is not offset by
any savings in property tax.
Table 3 Family of Three*, Itemize Deductions, Renters Income level $25,000 $50,000 $75,000 $100,000 $150,000 Property value N/A N/A N/A N/A N/AProperty tax reduction N/A N/A N/A N/A N/AActual total reduction in taxes $48 72 ($120) $140 $170 $223 Expected sales tax paid $383 $540 $630 $780 $1,125 Total tax savings -$334 -$468 (-$420) -$490 -$610 -$902Sales Tax Burden as % of Income 1.53% 1.08% 0.84% 0.78% 0.75%
Finally, Table 4 shows the effect of the sales tax on seniors. As with the Family
profiles, a net gain in tax savings is not reached until the $75,000 income level. The
calculations below assume the federal deduction for local sales tax. Without this, a net
savings, $13, is not reached until the $100,000 income level. Because seniors already
enjoy substantial property tax relief in the form of a higher exemption, the net tax loss is
much greater at the lower income levels than it is for non-senior households. In addition,
while the sales tax burden as a percent of income is less than that of non-senior families
at incomes of $75,000 and higher, it is greater than that of non-senior households at the
lower income levels.
Table 4 Senior Household of 2, Itemize Deductions, Homeowners Income level $25,000 $50,000 $75,000 $100,000 $150,000 Property value $116,025 $221,000 $331,500 $419,900 $596,700 Property tax reduction $0 $208 $658 $1,018 $1,738 Actual total reduction in taxes $43 $241 $620 $917 $1,454 Expected sales tax paid $420 $555 $585 $750 $1,035 Total tax savings -$377 -$314 $35 $167 $419Sales Tax Burden as % of Income 1.68% 1.11% 0.78% 0.75% 0.69%

16
Discussion
The Municipality estimates sales tax revenues of approximately $90 million
annually, of which Anchorage residents are estimated to pay $60 million. The $90
million raised through sales tax translates into about a 25 % reduction in property tax
collections. Anchorage homeowners are expected to receive about $57.5 million in
residential property tax relief. Using the average residential property assessment for
2005 of $241,800, the Municipality projects the average Anchorage homeowner will
come out about $300 ahead each year, paying about $600 in sales tax. That is, the
amount saved in property tax will be about $300 greater than the amount paid in sales tax
(L. Persily internal memo, Municipality of Anchorage, August 4, 2005).
What these projections failed to consider is that while property tax can be
deducted dollar for dollar from federal income taxes, sales tax cannot. The difference in
overall tax savings is substantial. Using the above average Anchorage property value in
the calculator and adjusting the income to $71,500 in order to arrive at around $600 paid
in sales tax, the estimated $300 net savings shrinks to $217. If the federal deduction for
local sales tax is removed, net savings go down even further, to $77.
Under the best case scenario of Table 1, taxpayer profiles do not show any net
savings until the $75,000 income level. Using 2.8 as the housing-to-income ratio, the
break-even point for homeowners under this scenario falls around an income of $70,000,
with a property value of $196,000. If residential property owners came out ahead at all
income levels, this would still be only 64.1 % of the Anchorage population. But they
don’t. Between 25 % and 47 % of residential properties are valued at less than the break
even point, (U.S.Census Bureau, 2004). It is clear that the benefits of the sales tax will

17
come at the expense of renters and lower-income households, with low-income seniors
hit particularly hard.
It is important to note the results above are for a specific point in time. Given the
dramatic increase in Anchorage property values over the past couple of years, there is no
question that property tax savings are underestimated. Calculations done for seniors,
while still a point in time, are based on 2005 data and do reflect the increase in property
values. The average assessed value of a single family home in 2004 was $218,500. The
current estimated average assessed value is about $258,000 (E. Larsen, personal
communication, March 31, 2006), an increase of about 18 %. If income remained
entirely stable, applying this increase to the 2004 median property value would result in a
much higher housing-to-income ratio of 3.30 (rounded). With the higher property value,
net tax savings are first seen at the $50,000 income level (with the federal deduction of
sales tax,) in the amount of $34. Incomes of $75,000 and higher would see savings even
without the federal deduction of sales tax, ranging from $65 to $268.
The model also does not account for the $200 tax limit affecting purchases over
$6,666. Tax savings on such items can be substantial. For example, the purchase of a
$20,000 vehicle would show a tax bill of $600 in the profiles, rather than the $200 under
the tax limit. However, it is the higher income individuals that are most likely to
purchase high ticket items, increasing the regressivity of the sales tax by providing an
additional tax break to wealthy consumers. Those at the lower income levels are less
likely to benefit, as they are less likely to be able to afford such expenditures.
The District of Columbia study includes a “progressivity index” in their results.
The progressivity index is measured by dividing the percentage tax burden at the $25,000

18
income level by the percentage tax burden at the $150,000 income level. A value less
than 1.000 indicates a progressive tax system, while an index greater than 1.000 indicates
a regressive tax system. Although Anchorage ranks 23rd in property tax burden among
the largest cities in each state, Anchorage’s progressivity index is 1.227, ranking 46th ,
one of the least progressive cities in the study (Government of the District of Columbia,
2005). Applying this method to the figures in Tables 1 and 4 gives a sales tax
progressivity index of 2.04 for a non-senior household and 2.43 for seniors. While this
number does not consider the overall tax burden, it is a clear indication of the increasing
regressivity that results from reliance on sales tax revenues.
Commercial Taxpayers
Anchorage Assembly predictions foresee that of the $90 million shift in tax
revenues, about $15 to $18 million of sales tax revenues will be paid by businesses, while
about $32.5 million in property tax relief will be paid to them. Some of this shift will be
offset by additional revenues of about $15 million in sales tax revenues projected to be
paid by visitors to Anchorage, but clearly, for business overall the shift will be more
advantageous than for private persons. Of course, many economists argue that a better
environment for business will result in economic growth that benefits the entire
community in the long run. But the question at hand is: how will these direct benefits to
business be distributed among Anchorage businesses?
Examining the impact of sales and property tax changes for commercial taxpayers
is far more complex than for private persons. The difficulty lies in that - unlike for private
persons, for whom the amount of property tax relief and the amount of sales tax burden

19
are fairly easily calculable due to the link between income, property value, and
expenditures on items falling under the sales tax - for businesses, there is not necessarily
a direct relation between revenues, property value, and expenditures on applicable items.
Because of a lack of data, it is impossible to use the representative taxpayer model and
calculations used for private taxpayers to assess the impact on commercial taxpayers. In
exploring the fairness and equitability of the Anchorage sales tax voted on in the April 4th
election to commercial taxpayers, this section will discuss
1. Impact of sales and property taxes on business generally
2. How the Alaska state tax climate, specifically related to property and sales tax,
compares to that of other states
3. How the proposed Anchorage sales tax compares to those of other localities in
Alaska
4. The impact of property tax relief on Anchorage businesses
5. The impact of sales tax on Anchorage businesses, including impact on business
purchases, business sales (absorption of tax), and impact through administrative
costs.
Property and Sales Tax Impact on Business
Property tax and sales tax both have significant impact on business. While the Tax
Foundation, in its State Business Tax Climate Index (Dubay & Hodge, 2006), ranks sales
tax as the second most important factor and “wealth tax” (which is primarily property
tax) in fourth place, economic studies have found that they are both very important.
Mark, McGuire, and Papke (2000) find that specifically personal property and sales taxes

20
have economically large negative effects on the annual growth. Bartik (1989) provides
strong evidence that taxes negatively impact business start-ups. Bartik finds that this
effect hits small businesses hardest, explaining that the particularly strong negative effect
of property taxes occurs because they are paid regardless of profits, and many small
businesses are not profitable in their first few years. This means high property taxes
would be more influential than profit-based taxes (such as sales tax) on the start-up
decision.
On the other hand, “tax pyramiding” causes sales tax to also impact small
business greatly. “Tax pyramiding,” or charging sales tax on purchases by businesses,
under the current proposal, would not happen in all cases, as “the resale of goods not sold
to the end user of the goods” is exempted from sales tax, but would still be a problem
with equipment purchases. However, the sales tax cap of $200 will help at least those
businesses that require expensive equipment purchases.
So, the interesting question that arises is: who will benefit more from the current
sales tax proposal? Small businesses or large corporations? Certain industries? Assessing
the potential impact of the sales tax proposal on Anchorage’s commercial taxpayers is a
complex task that cannot be completed satisfactorily with data currently available;
however, it is possible to make some statements about the general tax climate, how it
would change, and in what ways the proposed sales tax and resulting property tax relief
could affect different businesses.
Alaska’s Business Tax Climate

21
There is little data available on how the Anchorage tax climate for businesses
compares to that of other similar cities. However, according to the SBTCI of 2006
(Dubay & Hodge, 2006), Alaska has a very business-friendly tax climate, ranking third in
the nation after Wyoming and South Dakota. The Tax Foundation tells us that “a state
with lower tax costs will be more attractive to business investments.” Admittedly, Alaska
is special in many regards as industries linked to natural resources don’t have as much
flexibility in choosing their location as, for example, telecommunications or banking
companies. However, even in Alaska, low taxes for businesses will encourage growth
and investment.
The SBTCI focuses not only on the amount of taxes, but also the way in which
taxes are collected. “Good state tax systems levy low, flat rates on the broadest bases
possible, and they treat all taxpayers the same.” The index considers five different taxes,
only two of which apply to our discussion: sales taxes and taxes on wealth and assets,
mostly property. The other three are individual income, major business, and
unemployment insurance taxes. Alaska has, according to the Foundation, a particularly
burdensome corporate income tax (ranking 48th of all states) but no tax on individual
income or general sales (Dubay & Hodge, 2006). Not having a state sales tax played a
major part in Alaska’s high ranking, putting it in one of 5 first places in that category;
while property/wealth taxes were also not particularly burdensome compared to other
states: Alaska ranks 18th. With a reduction in Anchorage property taxes, Alaska could
rise even higher on the SBTCI – presuming the increase in the other category caused by
the Anchorage sales tax doesn’t negate that benefit.

22
Local Sales Tax in Alaska
One aspect that makes Alaska difficult to compare with other states is that it is the
only state that, while not levying a state sales tax, does allow local governments to collect
sales and use taxes. Four other states also have no state sales taxe, but these four have no
local taxes, either. In Alaska, 89 municipalities collect a local sales tax, with a range of
between 1 % and 7 %, with typical sales tax rates at 3 to 5 %. The average sales tax for
Alaska is then 0.81 %. If the 3 % Anchorage sales tax were added, that number would
increase to about 2.2 %.
In comparison with other nearby municipalities, Sitka has a 5/6 % sales tax;
Wasilla’s is 2.5 %. The Kenai Peninsula Borough charges 3 %, and Juneau charges 5 %.
Impact of Property Tax Relief
The closest link to business size can be seen in property tax relief – most larger,
high-income businesses and corporations will have substantially larger and therefore
more valuable property. The dollar amount of their property tax relief will therefore be
significantly higher than that of smaller businesses with smaller, less valuable properties.
However, even in this category, it’s difficult to find clear correlations, for example,
between industries. As the following list clearly shows, the 15 highest-value properties
are all large businesses – however, the types vary significantly:

23
Property Owner 2005 Tax 25% savings
ConocoPhillips Building WEC 2000A-Alaska LLC $1,330,214 $332,553
BP Building BP Exploration (Alaska) $978,534 $244,633
Hilton Anchorage Hotel Hilton MD Finance Co. $824,354 $206,088
Hotel Captain Cook Hickel Investment Co. $731,241 $182,810
Alaska Regional Hospital Galen Hospital Alaska Inc. $651,648 $162,912
Dimond Center Mall Dimond Center LLC $638,605 $159,651
Frontier Building West Gate Inc. $637,748 $159, 437
Arctic Slope Regional Corp. Centerpoint I LLC $569,209 $142,302
Marriott Hotel (7th Ave) Colombia Properties $547,684 $136,912
Providence Medical Center Sisters of Providence $525,979 $131,494 (Net of charitable purpose deduction of $128.9 million from $161.2 million assessment)
Sheraton Hotel MIP Anchorage LLC $375,051 $93,762
FedEx Airport Facility Federal Express Corp. $373,927 $93,481
Denali Tower North Alaska Electrical Pension $341,711 $85,427
Centerpoint Office Bldg. Centerpoint II LLC $340,299 $83,684
Millenium Hotel RHM Anchorage LLC $334,593 $83,648
Source: L. Persily internal memo, Municipality of Anchorage, August 29, 2005
By comparison, here are a few randomly selected small businesses in Anchorage:
Property Owner 2005 Tax 25% savings
Alaska Fur Gallery $3176.55 $794.14
Mountain View Auto Repair $2753.01 $688.26
Arctic Mini Mart $8664.21 $2166.06
Of course, the numbers alone do not say much. The impact of property tax relief
to businesses in Alaska through the sales tax will be affected by much more than the

24
monetary amount. What percentage of sales/profits is the relief? Certainly a tax reduction
of $1000 on a $100,000 operating budget has less impact than a $100 reduction on a
budget of $5,000. Is the impact of the property tax relief on large businesses going to be
more than the impact of it on small businesses, when we consider their operating
budgets? Certainly the monetary amounts are substantially different – but the percentage
of relief is the same.
However, there is not necessarily a clear correlation between the wealth of a
business and its property tax. Obviously, a mom and pop grocery store pays much less
property tax than BP. But certain businesses, such as retail businesses, must invest
heavily in property, while other businesses, such as janitorial services, require little more
than a warehouse or storage building somewhere. Some small service businesses (whose
customers would usually not be required to pay sales tax and which would usually not
have to maintain records) may operate without any physical location at all. But even
within retail businesses, the difference in required property can be huge. For example, a
small clothing boutique would need to be located in a high-prestige and therefore
expensive location. A small grocery store can be successful in almost any part of town.
How do we account for the differences that are related to industry type rather than size of
business?
Another problem is that there is no available data on the number of businesses
that rent or lease space rather than own it. Alaska has 72,000 active business licenses,
presumably, at least half of those are for Anchorage. But we don’t know how many of
these businesses own property and pay property tax. As identified in the section above,
private renters will most likely not receive any tax relief at all. The same applies to

25
businesses renting space. While there is no hard data to confirm this, it can be assumed
that those businesses more likely to rent space rather than purchase it are small
businesses. Therefore, the impact of property tax relief could disproportionately benefit
large corporations owning their own physical space.
Complicating matters even more, the municipality’s calculations foresee that the
property tax relief, while at about 25 % for the first year, will eventually level off as
overall taxes rise significantly faster than sales tax revenues (L. Persily internal memo,
Municipality of Anchorage, August 4, 2005). That means that even those businesses that
will at first enjoy some property tax relief will eventually again be faced with increasing
property tax.
Impact of Sales Tax Burden
The sales tax will place a burden on businesses in three ways: 1) they will have to
pay tax on some of their own purchases; 2) they may face lower sales as the items they
sell increase in cost to their customers; 3) they may have to bear part of the additional
administrative costs related to the sales tax. It’s important to note that these three areas
will not affect all businesses: As the sales tax excludes items such as prescription drugs,
groceries, and all services, there are numerous businesses that may be affected only by
the first – if the items they sell are not subject to the sales tax, or if they provide only
services, which are tax-exempt. There are also some businesses that provide a mixture of
goods that may or may not be affected by the sales tax, and/or services. For example,
Fred Meyer sells groceries and prescription drugs, but also toiletries and clothing, and it
provides services such as photo development.

26
Business Purchases: “The resale of goods not sold to the end user of the goods”
(Anchorage Ordinance No. 2005-125 (S)) is exempt from the sales tax. This means that
businesses won’t have to pay sales tax on products that they add value to before the sale –
for example, a bakery can buy flour without paying a sales tax. However, businesses also
purchase items for which they are the end user. The cost of office supplies to a business,
for example, will increase with the implementation of the sales tax. Equipment purchases
will be subject to the sales and/or use tax, as well. The cost of taxable goods purchased
by a business varies mainly with the nature of the business, rather than its size. What
proportion of total operating cost will consist of items now taxed? It’s also important to
note how the tax cap will affect this. Companies purchasing large expensive equipment,
for example, will be more likely to benefit from the tax cap in decreasing the total tax
burden in this area. Businesses relying heavily on everyday items such as pens and paper,
even computers and other smaller technology, will likely not gain much from the tax cap.
Business Sales and Cost Absorption: The ordinance states that “a seller shall not
absorb, fail to add, or refund the sales or use tax or any part of it” (Anchorage Ordinance
No. 2005-125 (S)). While it would certainly be a more neutral tax if this were possible,
economics tells us that every product – goods and services alike – has a certain price
elasticity. Some goods, such as gasoline, are fairly price inelastic. The cost can change
quite radically before it begins to affect consumption. Other products are very price
elastic, especially those for which cheaper substitutes are available. Luxury spending is a
good example. If a woman has a certain amount she wishes to splurge, an increase in the
cost of shoes may mean she decides to go get a massage and a facial instead. While the
size of a business may impact the ability of a business to pass on the tax, especially as

27
related to the amount of competition in town, the biggest impact will be based on the
price elasticity of the products a business sells.
One other area that will serve to impact business sales is the problem of leakage,
which occurs when people choose to travel to another location to buy certain items, or,
more commonly, purchase items on the Internet. The shipping costs of buying certain
items through the Internet may be offset by the cost of sales tax, prompting more people
to turn to the Web for their shopping. Especially in Alaska, where we are already
accustomed to having to purchase many items unavailable here online, the impact may be
even greater than in some other states, where loss of sales through Internet leakage has
been estimated at up to 10 %. (Dubay & Hodge 2006)
Administrative Costs: Under the proposed sales tax, businesses could retain 4 %
of all taxes collected, up to a maximum of $5000 annually, to pay for administrative
costs. As Alaska is the only state without a sales tax that permits local sales taxes, and as
Anchorage is the only city of its size in Alaska, there is no good standard to compare this
too. Compared to other localities in Alaska, the administrative cost allowance ranks fairly
high: The Kenai Peninsula Borough allows businesses to retain 5 %, but caps the
allowance at $1000; Sitka allows 3 %, up to $100, and Juneau allows 1 %, up to $100.
Then again, the ordinance specifies that this amount is “for purposes of offsetting a
portion of the costs incurred by the seller in collecting the tax for the municipality.”
(emphasis added) (Anchorage Ordinance No. 2005-125 (S)). But how much are the total
administrative costs? This data is unavailable. Clearly, though, small local businesses will
bear a much larger burden in this area, because “many large and/or national retailers’ data
systems are already designed to capture sales tax data” (Anchorage Municipal Budget

28
Advisory Commission, internal memo, Anchorage Municipality, August 15, 2005),
considering they operate in other areas where sales taxes are already collected. It’s also
important to consider that there are fixed and variable costs for businesses to administer
the sales tax – and while the variable costs will generally correspond to the size of the
business, the fixed (or almost) fixed costs will hit small local businesses hardest, just as
the start-up costs will. Small businesses with less freedom in their cash flow will also be
more likely to have difficulty providing the required guarantee, or deposit, to obtain a
license.
All of these factors confirm that there is simply not enough data available to
assess the actual impact of the sales tax proposal on Anchorage business. However,
consideration of the issues related to both property tax relief and sales tax burdens
implies that, overall, small business will likely bear more of the burden and feel less of
the relief, if any at all.
Conclusion
There is significant data missing to predict the true effects of a sales tax in
Anchorage with any accuracy. This is especially true when considering the impact on
business. Despite the limitations, this paper has identified some clear trends.
The private taxpayer profiles illustrate how the sales tax liability will be
distributed at different income levels, providing a means to assess vertical equity. The
profiles show a larger tax burden as a percent of income for renters, low-income
households, and especially low-income seniors. The benefits of replacing property tax
with a sales tax to the overwhelming majority of residents are minimal, at best.

29
The proposed sales tax will hit businesses small and large alike, depending mostly
on the industry. The property tax relief it includes will benefit those businesses with the
largest and most expensive property holdings – an indication that big business is more
likely, overall, to benefit.
Although the intent of this paper was to examine issues of equity, the
representative tax payer model also shows this proposal will not accomplish what it is
intended to do. The Anchorage sales tax is being promoted as tax relief for property
owners. Yet while property owners will see a reduction in their property taxes, whether a
sales tax will bring an overall reduction in their tax burden is questionable. For the
majority of property owners, net tax savings comes only with the ability to deduct the
sales tax from their federal income tax, and that will require an act of Congress.
Although there is both a House bill and Senate resolution in support of making the
federal deduction for local sales tax permanent, both were referred to committee in 2005,
with no further action to date (H.R. 519, 2005, S. Res. 294, 2005).
Further, there is no reason to expect any tax savings that do exist at any given
time will continue indefinitely, and in fact, the initial 25% property tax relief will
gradually diminish. The tax cap is currently indexed to the consumer price index (CPI).
The proposed sales tax is only on goods, which rise in price more slowly than the overall
CPI. As the tax cap rises faster than the price of goods, sales tax revenues will fall
further below the tax cap and property taxes will fill the gap. The 25% property tax relief
cannot be maintained without increasing the sales tax rate.
Anchorage voters, on April 4th, rejected the proposal discussed in this paper by a
tremendous margin of almost 70 % to 30 % of votes. The link between a sales tax and

30
property tax relief is attractive. However, despite the prior lack of discussion on fairness
and equity, it seems that many Anchorage votes were able to instinctively guess what this
paper shows that:
1. the sales tax proposal was regressive, benefiting wealthy and larger businesses
disproportionately, while increasing the tax burden for lower-income residents,
renters, and most likely small business;
2. the loss of the federal deduction of property tax combined with the cost of
paying sales tax is greater than the amount of property tax relief; and
3. even for those who do initially benefit, the relief would not be permanent.

References
Anchorage Ordinance No. 2005-125 (S). Prepared by Dan Coffey, Assembly Vice Chair, for reading October 11, 2005. Bartik, Timothy. Who Benefits from State and Local Economic Development Policies? Kalamazoo, MIS: W.E. Upjohn Institute for Employment Research, 1991. Brunori, David. State Tax Policy: A Political Perspective. Washington, D.C.: The Urban Institute Press, 2001. Dubay, Curtis & Hodge, Scott. State Business Tax Climate Index. Tax Foundation Background Paper, February 2006, Number 51. Government of the District of Columbia, Office of the Chief Financial Officer, Office of Research and Analysis. (2005). Tax rates and tax burdens in the District of Columbia – A Nationwide comparison, 2004. Retrieved March 24, 2006 from Washington District of Columbia, Office of the Chief Financial Officer Web site: http://cfo.washingtondc.gov/cfo/frames.asp?doc=/cfo/lib/cfo/services/studies/City04STUDY.pdf Mark, Stephen; McGuire, Therese; & Papke, Leslie. The Influence of Taxes on Employment and Population Growth: Evidence from the Washington, D.C. Metropolitan Area. National Tax Journal, Volume 53, pp. 105-123, March 2000. Mazerov, M. (2002). Developing the capacity to analyze the distributional impact of state and local taxes: Issues and options for states. Retrieved March 2, 2006 from Center on Budget and Policy Priorities Web site: http://www.cbpp.org/1-15-02sfp2.pdf Permanent Sales Tax Deduction Act of 2005, H.R. 519, 109th Cong., 1st Sess. (2005). Retrieved April 17, 2006 from http://thomas.loc.gov/ S. Res. 294, 109th Cong., 1st Sess. (2005). Retrieved April 17, 2006 from http://thomas.loc.gov/ U.S. Census Bureau (2004) American Community Survey. Retrieved March 24, 2006 from U.S.Census Bureau, American Factfinder Web site: http://factfinder.census.gov/servlet/ADPTable?_bm=y&-context=adp&-ds_name=ACS_2004_EST_G00_&-tree_id=304&-all_geo_types=N&-_caller=geoselect&-geo_id=38000US0380&-format=&-_lang=en U.S. Department of Labor, Bureau of Labor Statistics (2004). Consumer Expenditure Survey, Table 24. Retrieved March 25, 2006 from U.S. Department of Labor, Bureau of Labor Statistics Web site: http://www.bls.gov/cex/2004/msas/west.pdf
U.S. Department of Labor, Bureau of Labor Statistics (2004). Consumer Expenditure Survey, Table 30. Retrieved March 25, 2006 from U.S. Department of Labor, Bureau of Labor Statistics Web site: http://www.stats.bls.gov/cex/2004/CrossTabs/agebyinc/x65orup.PDF U.S. Department of Labor, Bureau of Labor Statistics (2004). Consumer Expenditure Survey, Table 38. Retrieved March 25, 2006 from U.S. Department of Labor, Bureau of Labor Statistics Web site: http://www.stats.bls.gov/cex/2004/CrossTabs/sizbyinc/xtwoorup.PDF

Appendix A
Expenditures Tables
Expenditures, 3 Person Household………………………………………. A1
Expenditures, 3 Person Household, Adjusted to Profiles………………... A2
Expenditures, Senior Household…………………………………………. A3
Expenditures, Senior Household, Adjusted to Profiles…………………… A4

Expenditures - 3 Person Household
<
$20,000 $20-$29,999 $30-$39,000 $40-$49,000 $50-$69,000 >
$70,000 Number of people 3 3 3 3 3 3 Average annual household income $17,524 $24,947 $34,801 $44,745 $59,223 $117,631 Average annual expenditures $25,043 $29,621 $35,360 $40,523 $48,730 $76,663 Total non-taxable expenditures $14,016 $16,299 $19,250 $21,521 $26,166 $41,465 Food at home $3,284 $3,295 $3,595 $3,480 $3,949 $4,556 Alcohol $167 $210 $371 $319 $429 $739 Non-taxed housing $5,706 $6,342 $6,921 $7,533 $8,734 $12,969 Non-taxed transportation $821 $1,091 $1,304 $1,521 $1,785 $2,320 Health care $1,250 $1,831 $2,269 $2,656 $2,931 $3,760 Personal care $329 $365 $457 $532 $600 $968 Education $394 $294 $398 $395 $689 $1,982 Tobacco $474 $385 $403 $420 $403 $310 Cash contributions $367 $602 $607 $917 $1,215 $2,390 Insurance $1,224 $1,884 $2,925 $3,748 $5,431 $11,471 Total taxable expenditures $11,027 $13,322 $16,110 $19,002 $22,564 $35,198 Percentage taxable to income 63% 53% 46% 42% 38% 30% Sales tax paid at 3% rate $331 $400 $483 $570 $677 $1,056 Adjustment to Anchorage = 2% 61% 51% 44% 40% 36% 28% Source: US Bureau of Labor Statistics, Consumer Expenditure Survey, 2004 US Bureau of Labor Statistics, Distribution of expenditures, Consumer Expenditure Survey, 2001-2002
<
$20,000 $20-$30,000 $30-$40,000 $40-$50,000 $50-$70,000 >
$70,000 Total housing $9,268 $10,334 $11,419 $13,002 $15,220 $23,344 Maint, repair, etc $347 $402 $489 $746 $908 $1,831 Utilities, not telephone $1,539 $1,756 $1,910 $2,151 $2,244 $2,695 Household operations $443 $469 $604 $648 $901 $1,735 House supplies $397 $411 $536 $769 $711 $922 Household things $836 $954 $959 $1,155 $1,722 $3,192 Total housing taxed $3,562 $3,992 $4,498 $5,469 $6,486 $10,375 Total housing not taxed $5,706 $6,342 $6,921 $7,533 $8,734 $12,969

Expenditures - 3 Person Household, Adjusted to Profiles
25000 50000 75000 100000 150000
<
$20,000 $20-
$30,000 $30-
$40,000 $40-
$50,000 $50-
$70,000 >
$70,000 >
$70,000 > $70,000 Number of people 3 3 3 3 3 3 3 3 Average annual household income $17,524 $24,947 $34,801 $44,745 $59,223 $117,631 Average annual expenditures $25,043 $29,684 $35,360 $40,523 $41,141 $48,879 $61,914 $87,983 Total non-taxable expenditures $8,310 $16,334 $12,329 $13,988 $22,091 $26,438 $33,488 $47,588 Food at home $3,284 $3,302 $3,595 $3,480 $3,334 $2,905 $3,679 $5,229 Alcohol $167 $210 $371 $319 $362 $471 $597 $848 Non-taxed housing $0 $6,355 $0 $0 $7,374 $8,269 $10,474 $14,884 Non-taxed transportation $821 $1,093 $1,304 $1,521 $1,507 $1,479 $1,874 $2,663 Health care $1,250 $1,835 $2,269 $2,656 $2,475 $2,397 $3,037 $4,315 Personal care $329 $366 $457 $532 $507 $617 $782 $1,111 Education $394 $295 $398 $395 $582 $1,264 $1,601 $2,275 Tobacco $474 $386 $403 $420 $340 $198 $250 $356 Cash contributions $367 $603 $607 $917 $1,026 $1,524 $1,930 $2,743 Insurance $1,224 $1,888 $2,925 $3,748 $4,585 $7,314 $9,264 $13,165 Total taxable expenditures $16,733 $13,350 $23,031 $26,535 $19,050 $22,442 $28,426 $40,395 Percentage taxable to income 95% 53% 66% 59% 38% 30% 28% 27% Sales tax paid at 3% rate $502 $401 $691 $796 $572 $673 $853 $1,212 Adjustment to Anchorage = 2% 93% 51% 64% 57% 36% 28% 26% 25% Source: US Bureau of Labor Statistics, Consumer Expenditure Survey, 2004 US Bureau of Labor Statistics, Distribution of expenditures, Consumer Expenditure Survey, 2001-2002

Expenditures - Senior
<
$20,000 $20-$30,000 $30-$40,000 $40-$50,000 $50-$70,000 >
$70,000 Number of people 1.6 1.7 1.9 2 2.2 2.5 Average annual household income $17,520 $24,536 $34,777 $44,601 $58,930 $119,223 Average annual expenditures $22,998 $28,496 $33,876 $39,366 $47,378 $74,885 Total non-taxable expenditures $12,743 $15,039 $17,227 $20,101 $24,199 $41,435 Food at home $2,291 $2,560 $2,980 $3,411 $3,825 $4,502 Alcohol $116 $214 $218 $247 $427 $867 Non-taxed housing $3,847 $4,391 $4,473 $5,091 $6,646 $9,478 Non-taxed transportation $627 $827 $1,004 $1,167 $1,298 $1,592 Health care $3,530 $4,211 $4,687 $4,448 $5,233 $6,016 Personal care $406 $449 $521 $573 $757 $906 Education $42 $109 $133 $130 $511 $1,145 Tobacco $138 $166 $191 $187 $208 $231 Cash contributions $1,167 $1,434 $1,769 $2,932 $2,249 $9,045 Insurance $579 $678 $1,251 $1,915 $3,045 $7,653 Total taxable expenditures $10,255 $13,457 $16,649 $19,265 $23,179 $33,450 Percentage taxable to income 59% 55% 48% 43% 39% 28% Sales tax paid at 3% rate $308 $404 $499 $578 $695 $1,004 Adjustment to Anchorage = 2% 57% 53% 46% 41% 37% 26% Source: US Bureau of Labor Statistics, Consumer Expenditure Survey, 2004 US Bureau of Labor Statistics, Distribution of expenditures, Consumer Expenditure Survey, 2001-2002
<
$20,000 $20-$30,000 $30-$40,000 $40-$50,000 $50-$70,000 >
$70,000 Total housing $8,292 $9,565 $10,677 $11,990 $13,975 $20,928 Maint, repair, etc $1,193 $1,148 $1,602 $1,637 $1,648 $2,864 Utilities, not telephone $1,683 $1,884 $2,075 $2,195 $2,285 $2,913 Household operations $521 $682 $600 $578 $921 $1,695 House supplies $435 $461 $588 $787 $741 $970 Household things $613 $999 $1,339 $1,702 $1,734 $3,008 Total housing taxed $4,445 $5,174 $6,204 $6,899 $7,329 $11,450 Total housing not taxed $3,847 $4,391 $4,473 $5,091 $6,646 $9,478

Expenditures - Senior, Adjusted to Profiles
25,000 50,000 75,000 100000 150000
<
$20,000 $20-
$30,000 $30-
$40,000 $40-
$50,000 $40-
$70,000 >
$70,000 >
$70,000 > $70,000 Number of people 1.6 1.7 1.9 2 2.2 2.5 3 3 Average annual household income $17,520 $24,536 $34,777 $44,601 $58,930 $119,223 $119,223 $119,223 Average annual expenditures $22,998 $30,487 $33,876 $39,366 $40,199 $47,108 $59,670 $84,795 Total non-taxable expenditures $8,896 $16,090 $12,754 $15,010 $20,532 $26,066 $33,016 $46,918 Food at home $2,291 $2,739 $2,980 $3,411 $3,245 $2,832 $3,587 $5,098 Alcohol $116 $229 $218 $247 $362 $545 $691 $982 Non-taxed housing $0 $4,698 $0 $0 $5,639 $5,962 $7,552 $10,732 Non-taxed transportation $627 $885 $1,004 $1,167 $1,101 $1,001 $1,269 $1,803 Health care $3,530 $4,505 $4,687 $4,448 $4,440 $3,785 $4,794 $6,812 Personal care $406 $480 $521 $573 $642 $570 $722 $1,026 Education $42 $117 $133 $130 $434 $720 $912 $1,297 Tobacco $138 $178 $191 $187 $176 $145 $184 $262 Cash contributions $1,167 $1,534 $1,769 $2,932 $1,908 $5,690 $7,207 $10,242 Insurance $579 $725 $1,251 $1,915 $2,584 $4,814 $6,098 $8,666 Total taxable expenditures $14,102 $14,397 $21,122 $24,356 $19,667 $21,043 $26,654 $37,877 Percentage taxable to income 80% 58% 61% 55% 39% 28% 27% 25% Sales tax paid at 3% rate $423 $432 $634 $731 $590 $631 $800 $1,136 Adjustment to Anchorage = 2% 78% 56% 59% 53% 37% 26% 25% 23% Source: US Bureau of Labor Statistics, Consumer Expenditure Survey, 2004 US Bureau of Labor Statistics, Distribution of expenditures, Consumer Expenditure Survey, 2001-2002

Appendix B
Original Calculator Model
Expenditures……………………………………………………………….. B1
Tax Burden………………………………………………………………… B2
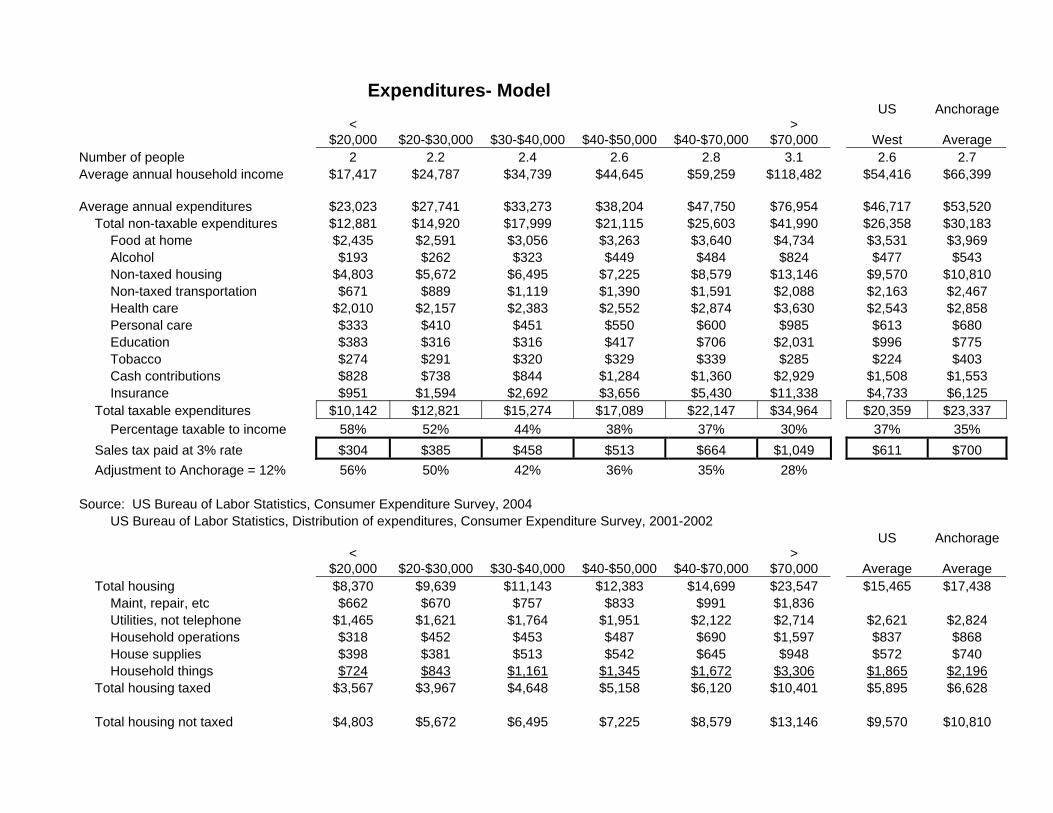
Expenditures- Model US Anchorage
<
$20,000 $20-$30,000 $30-$40,000 $40-$50,000 $40-$70,000 >
$70,000 West Average Number of people 2 2.2 2.4 2.6 2.8 3.1 2.6 2.7 Average annual household income $17,417 $24,787 $34,739 $44,645 $59,259 $118,482 $54,416 $66,399 Average annual expenditures $23,023 $27,741 $33,273 $38,204 $47,750 $76,954 $46,717 $53,520 Total non-taxable expenditures $12,881 $14,920 $17,999 $21,115 $25,603 $41,990 $26,358 $30,183 Food at home $2,435 $2,591 $3,056 $3,263 $3,640 $4,734 $3,531 $3,969 Alcohol $193 $262 $323 $449 $484 $824 $477 $543 Non-taxed housing $4,803 $5,672 $6,495 $7,225 $8,579 $13,146 $9,570 $10,810 Non-taxed transportation $671 $889 $1,119 $1,390 $1,591 $2,088 $2,163 $2,467 Health care $2,010 $2,157 $2,383 $2,552 $2,874 $3,630 $2,543 $2,858 Personal care $333 $410 $451 $550 $600 $985 $613 $680 Education $383 $316 $316 $417 $706 $2,031 $996 $775 Tobacco $274 $291 $320 $329 $339 $285 $224 $403 Cash contributions $828 $738 $844 $1,284 $1,360 $2,929 $1,508 $1,553 Insurance $951 $1,594 $2,692 $3,656 $5,430 $11,338 $4,733 $6,125 Total taxable expenditures $10,142 $12,821 $15,274 $17,089 $22,147 $34,964 $20,359 $23,337 Percentage taxable to income 58% 52% 44% 38% 37% 30% 37% 35% Sales tax paid at 3% rate $304 $385 $458 $513 $664 $1,049 $611 $700 Adjustment to Anchorage = 12% 56% 50% 42% 36% 35% 28% Source: US Bureau of Labor Statistics, Consumer Expenditure Survey, 2004 US Bureau of Labor Statistics, Distribution of expenditures, Consumer Expenditure Survey, 2001-2002 US Anchorage
<
$20,000 $20-$30,000 $30-$40,000 $40-$50,000 $40-$70,000 >
$70,000 Average Average Total housing $8,370 $9,639 $11,143 $12,383 $14,699 $23,547 $15,465 $17,438 Maint, repair, etc $662 $670 $757 $833 $991 $1,836 Utilities, not telephone $1,465 $1,621 $1,764 $1,951 $2,122 $2,714 $2,621 $2,824 Household operations $318 $452 $453 $487 $690 $1,597 $837 $868 House supplies $398 $381 $513 $542 $645 $948 $572 $740 Household things $724 $843 $1,161 $1,345 $1,672 $3,306 $1,865 $2,196 Total housing taxed $3,567 $3,967 $4,648 $5,158 $6,120 $10,401 $5,895 $6,628 Total housing not taxed $4,803 $5,672 $6,495 $7,225 $8,579 $13,146 $9,570 $10,810

Information used to determine the average Anchorage tax burden. 2005 Anchorage population (I) 278,241 Persons per household (2004) (iv) 2.7 2005 Municipal tax revenues (non-ASD) (ii) $201,732,922 9.00413 2005 Assessed Value (iii) $22,404,488,758 2005 School District mill levy (ii) 7.2600 mills Calculated School District taxes $162,656,588 2005 PFD check, per person (v) $846 Calculated number of households 103,052 2005 tax year School District tax revenues Sources:
(i) Alaska Dept. Labor Population Place Estimates 2000-2005
(ii) Municipality of Anchorage 2005 Budget
(iii)
Municipality of Anchorage Tax Notice, 2005
(iv) Municipality of Anchorage Neighborhood Source Book
(v) Alaska Permenant Fund Corporation