the arsenic biosand filter (abf) project: design of an
TRANSCRIPT

THE ARSENIC BIOSAND FILTER (ABF) PROJECT: DESIGN OF AN APPROPRIATE HOUSEHOLD DRINKING WATER FILTER FOR RURAL NEPAL
Final Report July 2003 Prepared for Rural Water Supply and Sanitation Support Programme Butwal, Nepal and Environment and Public Health Organization Kathmandu, Nepal By Tommy Ngai, Massachusetts Institute of Technology Sophie Walewijk, Stanford University 2003 Tommy Ngai. All Rights Reserved

i
ACKNOWLEDGEMENTS
Tommy Ngai would like to thank the Lemelson Foundation, and MIT IDEAS
Competition for funding my project; RWSSSP and FINNIDA for their field support,
comfortable accommodation, transportation, and friendship; ENPHO for their research
assistance; and IBS for their hospitality.
Tommy Ngai would like to thank his supervisor and friend, Susan Murcott, for her
inspiration and guidance to motivate him to pursuit this project. Her meticulous review
of this report is greatly appreciated.
Sincere thanks are given to the MIT Department of Civil and Environmental Engineering,
and all members of the MIT Nepal Water Project. The development of the Arsenic
Biosand Filter would not be possible without the years of research contribution and bright
ideas by these members.
Finally, Tommy Ngai would like to thank Ms. The Best Employee Ever for her good
company and her dedication to the project. Tremendous level of synergy and excitement
was experienced as a result of highly effective teamwork.
Sophie Walewijk would like to thank Mr. Super Nice Boss for his good friendship and
for the opportunity he gave her to continue working on an arsenic removal solution
appropriate for developing countries.
Sophie Walewijk would also like to thank Professor Leckie for his support on the project,
and her Ph.D. Principal Investigator, Dr. Reinhard, for allowing her to devote a good
chunk of her time on this project.

ii
THE ARSENIC BIOSAND FILTER (ABF) PROJECT: DESIGN OF AN APPROPRIATE HOUSEHOLD DRINKING WATER FILTER FOR RURAL NEPAL
by
Tommy Ngai, Massachusetts Institute of Technology Sophie Walewijk, Stanford University
ABSTRACT A household-level drinking water filter (Arsenic Biosand Filter, ABF), appropriate for
rural Nepal, was developed at Massachusetts Institute of Technology to simultaneously
remove arsenic and pathogens from tubewell water. The ABF can be entirely constructed
by trained local labor using locally available materials. A laboratory study and a three-
months pilot study were conducted in Nepal from September 2002 to January 2003 to
evaluate the performance of the filter under various setups, to investigate long-term
removal efficiencies, to improve the filter design, and to implement the filter in arsenic-
affected villages.
The Arsenic Biosand Filter was found to be effective in removing arsenic (range = 87 to
96%, mean = 93%), total coliform (range = 0 to >99%, mean = 58%), E. Coli (range = 0
to >99%, mean = 64%), and iron (range = >90 to >97%, mean = >93%). The users liked
the high flowrate (range = 4 to 23 L/hr, mean = 14 L/hr), simple operation, minimal
maintenance, as well as the clean-looking and good-tasting water coming out of the
filters. They think the filter is a durable, permanent solution to their drinking water
problems. On-going research at MIT and Stanford will seek to further enhance filter
performance, and user-friendliness.
Implementation schemes and cost recovery issues were discussed with local partners,
including the Rural Water Supply and Sanitation Support Programme (RWSSSP) and
Environment and Public Health Organization (ENPHO). These agencies will proceed
with implementation plans.

iii
TABLE OF CONTENTS
ACKNOWLEDGEMENTS .......................................................................................................................... I ABSTRACT ................................................................................................................................................. II TABLE OF CONTENTS...........................................................................................................................III LIST OF FIGURES......................................................................................................................................V LIST OF TABLES.................................................................................................................................... VII 1. PROJECT BACKGROUND ................................................................................................................... 1 2. PROJECT MOTIVATION AND GOALS............................................................................................. 3 3. DRINKING WATER SITUATION IN NEPAL.................................................................................... 4
3.1 ARSENIC CONTAMINATION .......................................................................................................... 4 3.2 PATHOGENS CONTAMINATION ..................................................................................................... 5
4. ARSENIC BIOSAND FILTER (ABF) THEORY ................................................................................. 6 4.1 ABF DESIGN................................................................................................................................ 7 4.2 ARSENIC REMOVAL...................................................................................................................... 8 4.3 PATHOGEN REMOVAL .................................................................................................................. 9 4.4 ABF MANUFACTURING AND INSTALLATION PROCEDURE.......................................................... 11
4.4.1 Manufacturing ...................................................................................................................... 11 4.4.2 Installation Procedure.......................................................................................................... 12
4.5 ABF OPERATION PROCEDURE ................................................................................................... 14 4.6 ABF CLEANING PROCEDURE ..................................................................................................... 15 4.7 ENPHO’S ARSENIC BIOSAND FILTER SETUP ............................................................................. 16 4.8 RWSSSP’S 3-KOLSHI FILTERS SETUP ....................................................................................... 16
5. ANALYTICAL METHODS.................................................................................................................. 17 5.1 ARSENIC..................................................................................................................................... 18
5.1.1 Industrial Test Systems Inc. Arsenic CheckTM Field Test Kit................................................ 18 5.1.2 Perkin-Elmer Graphite Furnace Atomic Absorption Spectrometry (GFAAS)...................... 21 5.1.3 ENPHO New Arsenic Field Test Kit..................................................................................... 22 5.1.4 SOLAAR 969 Hydride Generation Atomic Absorption Spectrometer (HGAAS) .................. 23
5.2 TOTAL IRON ............................................................................................................................... 24 5.2.1 HACH Portable Iron Test Kit Model IR-18.......................................................................... 24
5.3 BACTERIA .................................................................................................................................. 25 5.3.1 Millipore M-Coliblue24 Broth, Membrane Filtration and Incubation ................................. 26 5.3.2 ENPHO Presence/Absence H2S Bacteria Test Vials ............................................................ 29
5.4 FLOW RATE................................................................................................................................ 30 6. LABORATORY EXPERIMENTS AT RWSSSP................................................................................ 31

iv
6.1 LABORATORY EXPERIMENTS OVERVIEW ................................................................................... 31 6.1.1 Filter Arrangements ............................................................................................................. 31 6.1.2 Main Experiment .................................................................................................................. 35 6.1.3 Additional Experiments ........................................................................................................ 36
6.2 RESULTS AND DISCUSSIONS ....................................................................................................... 38 6.2.1 Main Experiment .................................................................................................................. 38 6.2.2 Additional Experiments ........................................................................................................ 44
7. PILOT STUDY IN SARAWAL AND DEVDAHA VILLAGE DEVELOPMENT COMMITTEES
(VDCS) – SEPTEMBER 2002 TO JANUARY 2003 ............................................................................... 48 7.1 PILOT STUDY OVERVIEW ........................................................................................................... 48
7.1.1 Installation............................................................................................................................ 48 7.1.2 Monitoring by RWSSSP ........................................................................................................ 52 7.1.3 Monitoring by Tommy Ngai and Sophie Walewijk ............................................................... 53 7.1.4 ABF Modifications and New Design .................................................................................... 56 7.1.5 Education Workshop............................................................................................................. 57
7.2 RESULTS AND DISCUSSION......................................................................................................... 59 7.2.1 Installation............................................................................................................................ 59 7.2.2 Monitoring Results by RWSSSP............................................................................................ 59 7.2.3 Monitoring Results by Tommy Ngai and Sophie Walewijk................................................... 67 7.2.4 ABF Modification and New Design ...................................................................................... 82 7.2.5 Education Workshop Observations ...................................................................................... 84 7.2.6 Summary of the Pilot Study Results ...................................................................................... 85
8. CONCLUSIONS..................................................................................................................................... 87 9. FUTURE WORK AND RECOMMENDATIONS .............................................................................. 88 10. TEAM MEMBERS BIOGRAPHY..................................................................................................... 91 APPENDIX A - DESCRIPTION OF PARTNER ORGANIZATIONS................................................. 93 APPENDIX B - MASTER DATA SET OF ALL PILOT STUDY ARSENIC BIOSAND FILTERS . 95 APPENDIX C - MAP SHOWING PROJECT DISTRICTS OF NEPAL ........................................... 131 APPENDIX D1 - ARSENIC BIOSAND FILTER OPERATING PROCEDURE IN NEPALI......... 132 APPENDIX D2 - ARSENIC BIOSAND FILTER CLEANING PROCEDURE IN NEPALI............ 133 APPENDIX E - ARSENIC BIOSAND FILTER MANUFACTURING PROCEDURE .................... 134 APPENDIX F - ENPHO ARSENIC BIOSAND FILTER SETUP AND PILOT STUDY................. 144 APPENDIX G - RWSSSP 3-KOLSHI FILTER SETUP AND PILOT STUDY ................................. 146 APPENDIX H - COMPARISON BETWEEN ANALYTICAL ARSENIC TEST METHODS ........ 149 APPENDIX I - ETHICS OF EXPERIMENTAL WORK WITH HUMAN SUBJECTS.................. 152 REFERENCES ......................................................................................................................................... 154

v
LIST OF FIGURES
Figure 1 - Concrete Arsenic Biosand Filter ................................................................................................... 6 Figure 2 - Plastic BioSand Filter ................................................................................................................... 6 Figure 3 - Cross-Section of the Arsenic Biosand Filter Design (Jan 2003)................................................... 7 Figure 4 - A Simplified Illustration of the Arsenic Removal Mechanisms...................................................... 8 Figure 5 - A Simplified Illustration of the Pathogen Removal Mechanisms................................................. 10 Figure 6 - Newly made ABFs at IBS............................................................................................................. 12 Figure 7 - A Metal Workshop in Kathmandu ............................................................................................... 12 Figure 8 - A newly made Metal Diffuser Box from the Metal Workshop ..................................................... 12 Figure 9 - Washing ABFs at RWSSSP Laboratory....................................................................................... 14 Figure 10 - Piyush Disinfecting Solution ..................................................................................................... 14 Figure 11 - A Local Sand Crushing Operation by a Riverside near Butwal ................................................ 14 Figure 12 - Filling up Bags of Crushed Sand............................................................................................... 14 Figure 13 - Industrial Test Systems Arsenic CheckTM Field Test Kit ........................................................... 20 Figure 14 - Bottle Used to Collect Arsenic and Iron Samples ..................................................................... 20 Figure 15 - HACH Portable Iron Test Kit Model IR-18............................................................................... 24 Figure 16 - Whirlpack Bag Used to Collect Bacterial Samples ................................................................... 28 Figure 17 - Membrane Filter Unit ............................................................................................................... 28 Figure 18 - Example of a Plate .................................................................................................................... 28 Figure 19 - Microbial Test Performed at a Makeshift Laboratory at the RWSSSP Guesthouse .................. 30 Figure 20 - P/A H2S Bacteria Test Showing Uncontaminated Sample (left) and Contaminated Sample
(right) ........................................................................................................................................................... 30 Figure 21 - RWSSSP Laboratory Showing Five ABFs ................................................................................. 32 Figure 22 - Metal Diffusers Boxes with Polyester Cloth.............................................................................. 32 Figure 23 - ENPHO’s Black Coagulation Powder Added to 20 L of Water ................................................ 34 Figure 24 - A Diffuser Box Full of High Quality Shoe Tack Iron Nails ....................................................... 34 Figure 25 - Diagram of the Two Diffuser Buckets ....................................................................................... 35 Figure 26 - Diffuser Bucket Replacing the Metal Box in the ABF ............................................................... 35 Figure 27 - Collecting Water from Devdaha................................................................................................ 36 Figure 28 - Laboratory Experiments in Progress ........................................................................................ 36 Figure 29 - Location of Post-diffuser Sample Collection............................................................................. 37 Figure 30 - Flow Rate as a Function of Volume of Water Treated .............................................................. 41 Figure 31 - Iron Rust Deposit on Top of the Fine Sand Layer ..................................................................... 43 Figure 32 - Unloading New ABFs in Sarawal.............................................................................................. 50 Figure 33 - Filter Maintenance Demonstration at Harinarayan Chaudhary’s House................................. 50

vi
Figure 34 - Gathering Material to Install an ABF ....................................................................................... 50 Figure 35 - Shivsagar Yadav’s Tubewell, ABF, and House ......................................................................... 50 Figure 36 - Tommy Ngai and Sophie Walewijk Collecting a Tubewell Water Sample at Phagu N.
Chaudhary’s Tubewell in Tilakpur VDC...................................................................................................... 54 Figure 37 - Sophie Walewijk Measuring Flow Rate at Tek Bahadur Hamal’s ABF in Devdaha VDC........ 54 Figure 38 - Analyzing Samples at the RWSSSP Guesthouse at Night .......................................................... 54 Figure 39 - Tommy Ngai Explaining How to Operate the ABF ................................................................... 58 Figure 40 - Umesh Sharma Translating Sophie Walewijk’s Explanations on How to Clean the ABF ........ 58 Figure 41 - Arsenic Removal Efficiencies for Different ABF Setups............................................................ 69 Figure 42 - Dispersed Iron Nails ................................................................................................................. 70 Figure 43 - Comparing Total Coliform and E. Coli Average % Removal for ABFs in Different VDCs ...... 76 Figure 44 - Cross-Section of a Concrete BioSand Filter ........................................................................... 134 Figure 45 - PVC pipe dimensions (not to scale)......................................................................................... 135 Figure 46 - Cross-Section of Inner and Outer Molds................................................................................. 136 Figure 47 - Unassembled Steel Mold – Inner Mold (left) and Outer Mold (right)..................................... 137 Figure 48 - Steel Mold for Concrete BSF Shell (assembled)...................................................................... 137 Figure 49 - Concrete Mixing I.................................................................................................................... 138 Figure 50 - Concrete Mixing II .................................................................................................................. 138 Figure 51 - Tamping the Concrete Mixture with a Wooden Rod................................................................ 139 Figure 52 - A 3-Kolshi Filter Installed in a household in Barkalpur VDC of Kapilvastu District............. 146 Figure 53 - RWSSSP 3-Kolshi Filter Cross-Section................................................................................... 147

vii
LIST OF TABLES
Table 1 - Analytical Methods used by Tommy Ngai’s Team, RWSSSP, and ENPHO .................................. 17 Table 2 - Summary Description of RWSSSP Lab Experiments Filter Arrangements ................................... 38 Table 3 - Arsenic Test Results in mg/L for Lab Experiments at RWSSSP .................................................... 38 Table 4 - Arsenic Test Results in % Arsenic Removal for Lab Experiments at RWSSSP ............................. 38 Table 5 - Iron Test Results in mg/L for Lab Experiments at RWSSSP.......................................................... 40 Table 6 - Iron Test Results in % Iron Removal for Lab Experiment at RWSSSP ......................................... 40 Table 7 - Flow Rate Results for the Lab Experiments at RWSSSP............................................................... 41 Table 8 - % Change in Flow Rate over the Duration of the Experiments .................................................... 41 Table 9 - Additional Experiment 1 Results ................................................................................................... 44 Table 10 - Additional Experiment 2 Results ................................................................................................. 45 Table 11 - Additional Experiment 3 Results ................................................................................................. 46 Table 12 - Summary of the Lab Experiments at RWSSSP ............................................................................ 47 Table 13 - Five Stages of the ABF Pilot Study ............................................................................................. 48 Table 14 - Sarawal: Selected Households and Their ABF Setup ................................................................. 51 Table 15 - Devdaha: Selected Households and Their ABF Setup ................................................................ 52 Table 16 - ABF Households Visited by Tommy Ngai and Sophie Walewijk................................................. 55 Table 17 - 3-Kolshi Filters Visited by Tommy Ngai and Sophie Walewijk................................................... 55 Table 18 - Two ABFs Selected for Arsenic Analysis after Having Added More Nails ................................. 57 Table 19 - Arsenic Analysis for the three Re-installed ABFs. ...................................................................... 57 Table 20 - Sarawal Tubewell Test Results, and Quantity of Iron Nails........................................................ 59 Table 21 - Devdaha Tubewell Test Results, and Quantity of Iron Nails ...................................................... 59 Table 22 - Monitoring Results for Nirahi Chaudhary, Iron Nails = 1.25 kg................................................ 60 Table 23 - Monitoring Results for Harinarayan Chaudhary, Iron Nails = 1.25 kg. .................................... 60 Table 24 - Monitoring Results for Chintamani Chaudhary, Iron Nails = 0 kg ............................................ 60 Table 25 - Monitoring Results for Ramashankar Yadav, Iron Nails = 2.5 kg.............................................. 61 Table 26 - Monitoring Results for Harilal Yadav, Iron Nails = 0 kg ........................................................... 61 Table 27 - Monitoring Results for Ramashankar Yadav, Iron Nails = 1.25 kg............................................ 61 Table 28 - Monitoring Results for Nir Bir Gurung, Iron Nails = 1.25 kg .................................................... 62 Table 29 - Monitoring Results for Durga Kumari, Iron Nails = 1.25 kg ..................................................... 62 Table 30 - Monitoring Results for Tek B. Hamal, Iron Nails = 1.25 kg....................................................... 62 Table 31 - Summary of RWSSSP Monitoring Results for Arsenic ................................................................ 63 Table 32 - Summary of RWSSSP Monitoring Results for P/A H2S bacteria................................................. 66 Table 33 - Arsenic Results from Tommy Ngai and Sophie Walewijk Monitoring......................................... 68 Table 34 - Arsenic Removal Efficiencies for Different ABF Setups ............................................................. 69

viii
Table 35 - Iron Results from Tommy Ngai and Sophie Walewijk Monitoring.............................................. 72 Table 36 - E. Coli and Total Coliforms Results from Tommy Ngai and Sophie Walewijk Monitoring ........ 74 Table 37 - Comparing Total Coliform and E. Coli Average % Removal for ABFs in Different VDCs........ 76 Table 38 - Comparing Iron Nails Quantity to Total Coliform and E. Coli % Removal ............................... 77 Table 39 - Estimated Maximum Flow Rate for Each Filter.......................................................................... 78 Table 40 - Arsenic, Iron, and Flow Rate Results for 3-Kolshi Filters from Tommy Ngai and Sophie
Walewijk Monitoring .................................................................................................................................... 81 Table 41 - Arsenic Removal Improvement from Pre-upgraded to Upgraded Design .................................. 83 Table 42 - Arsenic Removal Improvement after Re-installation................................................................... 83 Table 43 - Summary Technical Performance of ABF Pilot Study ................................................................ 87 Table 44 - BSF/ABF Design Parameters.................................................................................................... 135 Table 45 - Summary of the ENPHO ABF Pilot Study................................................................................. 144 Table 46 - ENPHO Pilot Study Monitoring Results for Arsenic (early December 2002) .......................... 145 Table 47 - Three RWSSSP 3-Kolshi Filters Visited by Tommy Ngai’s Team ............................................. 148 Table 48 - A Comparison of Arsenic Split-Sample Results Analyzed at MIT Laboratory vs. ENPHO
Laboratory.................................................................................................................................................. 150 Table 49 - A Comparison of Arsenic Split-Sample Results Analyzed at MIT Laboratory vs. Industrial Test
Systems Arsenic CheckTM Field Test Kit..................................................................................................... 151

The Arsenic Biosand Filter Project Section 1: Project Background
1
1. PROJECT BACKGROUND
The Massachusetts Institute of Technology (MIT) Nepal Water Project is a program
intended to increase awareness of water quality problems in Nepal, and to provide
assistance in solving these problems. Since 1999, about 30 Master of Engineering
students at the MIT Civil and Environmental Engineering Department have traveled to
Nepal to study various water quality and household/community level water treatment
issues. Tommy Ngai was a member of the 2001-2002 research team. He investigated
arsenic speciation in tubewell water, and evaluated the performance of an activated
alumina based arsenic treatment technology in the Rupandehi and Nawalparasi Districts.
Details of his research can be found in his 2001 Master of Engineering thesis1.
After observing and learning about the socio-economic conditions at numerous arsenic-
affected villages, Tommy Ngai was determined to develop a better household level water
treatment technology, appropriate for rural Nepal. Based on previous work by MIT
lecturer Susan Murcott, and other members of the MIT Nepal Water Project, Tommy
Ngai invented the Arsenic Biosand Filter (ABF). The ABF effectively and
simultaneously remove arsenic and pathogens.
Tommy Ngai entered the MIT IDEAS Competition, a campus-wide competition intended
to promote students’ innovation in solving real work problems. His invention was
awarded the Lemelson International Technology Prize. As a result, the IDEAS
committee and the Lemelson Foundation funded Tommy Ngai’s team to further develop
and implement his design.
Tommy Ngai initiated the Arsenic Biosand Filter (ABF) Project in May 2002. Since that
time, Tommy Ngai traveled twice to Nepal: September-October 2002 and December
2002-January 2003. While in Nepal, he worked closely with local agencies including
Rural Water Supply and Sanitation Support Programme (RWSSSP) in Butwal, the
Environment and Public Health Organization (ENPHO in Kathmandu and Panchanagar,

The Arsenic Biosand Filter Project Section 1: Project Background
2
and the International Buddhist Society (IBS) in Lumbini. (Refer to Appendix A for more
information about these organizations.) Two team members, Debu Sen (inactive
member, now dismissed) and Sophie Walewijk (active member) also accompanied
Tommy Ngai to Nepal to complete the ABF project.

The Arsenic Biosand Filter Project Section 2: Project Motivation and Goal
3
2. PROJECT MOTIVATION AND GOALS
Nepal is a developing country in south central Asia landlocked between China to the
north and India to the south. The land area is 140 000 km2 and the year 2000 population
is 23 millions, of which 20 millions is rural2. Nepal is one of the world’s poorest and
least developed countries. The average annual income per capita is $210 US3. About
42% of the people live below the national poverty line4. Due to the poor economic
conditions and ineffective government institutional programs, proper water and sanitation
services are often lacking, resulting in serious health concerns. The severity of water
problems is even more prominent in remote rural villages. The infant mortality rate is
very high at 74/1000 live births, compared with 5/1000 in the U.S. The under-five
mortality is even higher at 105/1000 births5. 54% of the children suffer from moderate to
severe stunting on account of water-borne diseases6. Diarrheal diseases kill 44000
children annually. The average life expectancy is only 58, compared with 77 in the U.S.7.
These serious health concerns are the main motivation for this project.
Arsenic and pathogens are two of the most significant drinking water contaminants in
Nepal. However, much of the current research effort by the scientific community focuses
on independent treatments for arsenic or pathogens. In addition, many of these treatment
systems are inappropriate in a number of ways. As a result, people have no choice but to
continue to drink contaminated water, leading to horrible health consequences.
As an extension to the MIT Nepal Water Project, the goals of the ABF project are:
• To research and develop a simple arsenic & pathogen removal technology that is
appropriate for rural Nepal.
• To conduct laboratory and field experiments to assess the filter performance
under various alternative filter setups.
• To initiate and monitor a pilot study on the filter performance.
• To collaborate with local non-government organizations (NGOs) and water
supply agencies to implement the filter.

The Arsenic Biosand Filter Project Section 3: Drinking Water Situation
4
3. DRINKING WATER SITUATION IN NEPAL
3.1 Arsenic Contamination
The Nepal Terai is the flat plain in the southern part of the country, and it is a part of the
Gangetic watershed. A handful groups became concerned about arsenic as a potential
problem in Nepali drinking water due to Nepal’s proximity to Bangladesh and West
Bengal. In 1999, the Department of Water Supply and Sewerage (DWSS) received
financial support from the World Health Organization (WHO) and UNICEF to initiate
various arsenic monitoring programmes8. Monitoring was conducted on the groundwater
of southern Nepal by a number of national and international organizations. The 1999
study by DWSS in the districts of Jhapa, Morang, and Sunsari in eastern Nepal found that
9% of the 268 tubewell water samples contained arsenic above the WHO guideline of 10
µg/L. The highest concentration was found to be 75 µg/L9. In January 2000, a study by
Halsey of the MIT Nepal Water Project 1999-2000 showed that 18% of 172 tested tube
wells of the Terai region were contaminated with arsenic at concentrations above the
WHO guideline, with the highest detected at 111 µg/L10. In 2001, the NRCS conducted a
study in eight other districts of the Terai region including Rautahat, Bara, Parsa,
Nawalparasi, Rupandehi, Kapilvastu, Banke, and Bardiya. It was found that 22% of the
investigated tubewells had arsenic level exceeding the WHO guideline, and the maximum
level of contamination was found to be 165 µg/L11. Also in 2001, the Rural Water
Supply and Sanitation Support Program (RWSSSP) found that 9.8% of 1508 samples in
the districts of Rupandehi, Nawalparasi, and Palpa had over 10 µg/L of arsenic 12. The
highest concentrations were measured in the village development community (VDC) of
Devdaha of Rupandehi district where two wells had over 2000 µg/L of arsenic13. From
these studies, it is clear that arsenic is a problem in the groundwater of the Nepal Terai
region. It can potentially escalate into a serious health issue if the problem is not
addressed properly.

The Arsenic Biosand Filter Project Section 3: Drinking Water Situation
5
Health Effects
Arsenic has long been long known as a poison. Exposure to arsenic via drinking water
initially causes skin diseases such as pigmentation (dark and light spots on the skin) and
arsenicosis (hardening of skin on hands and feet). Later, cancer of the skin, lungs,
bladder, and kidney may occur14. Both the World Health Organization (WHO) and the
U.S. Environmental Protection Agency (USEPA) have classified arsenic as carcinogenic.
Unfortunately, there is no cure for these diseases. In many parts of Bangladesh, West
Bengal, as well as isolated pockets in Nepal, the arsenic level in the groundwater can be
over 100 times higher than the WHO and EPA guidelines15 of 10 µg/L. For more details
on arsenic origins and health effects, refer to Ngai’s thesis16.
3.2 Pathogens Contamination
Pathogens, such as bacteria, viruses, protozoa and helminthes, are the most common
water-related problem in developing countries, including Nepal. A study in the Lumbini
Zone of Nepal (including Nawalparasi and Rupandehi Districts, which are part of the
present study area) by Gao in 2002 showed that about 50% of 45 tubewell samples were
contaminated17.
Health Effects
These pathogens can cause diarrhea, trachoma, schistosomiasis, cholera, amebiasis,
giardiasis, stunting and other diseases18. At any given time, about half of the population
in Nepal is suffering from these diseases. Modern medication and health services are
usually too costly to be widely available in the rural areas.

The Arsenic Biosand Filter Project Section 4: ABF Theory
6
4. ARSENIC BIOSAND FILTER (ABF) THEORY
The Arsenic Biosand Filter (ABF, Figure 1) is a version of the BioSand Filter (BSF)
modified to include arsenic removal capability. The original BioSand Filter (BSF,
Figure 2) is a household-scale sand filter developed by Dr. David Manz of the
University of Calgary, Canada. The BSF has been tested by several governments,
research and health institutions, and NGOs in Canada, Vietnam, Brazil, Nicaragua,
Bangladesh19 and other countries. Section 4.1 shows the design of the ABF; Sections 4.2
and 4.3 explain how the ABF removes arsenic and pathogens from drinking water; and
finally, Sections 4.4, 4.5 and 4.6 describe the manufacture and installation procedures, the
operation procedure and the cleaning procedure.
Figure 1 - Concrete Arsenic Biosand Filter
Figure 2 - Plastic BioSand Filter

The Arsenic Biosand Filter Project Section 4: ABF Theory
7
4.1 ABF Design
The design of the Arsenic Biosand Filter has evolved throughout the course of the ABF
project to reflect design improvements. The latest design of the ABF is shown in Figure
3. The ABF is an integration of two removal units: the arsenic removal unit, and the
pathogen removal unit. The arsenic removal unit consists of the metal diffuser box, iron
nails, and a polyester cloth. The pathogen removal unit consists of sand and gravel
layers. The Nepali version of the cross-sectional diagram, distributed in Sarawal during
the education workshop on January 5, 2003 (will be described in Section 7.1.5 and 7.2.5)
can be found in Appendix D.
Figure 3 - Cross-Section of the Arsenic Biosand Filter Design (Jan 2003)
Gravel diameter 6.0-15 mm
Fine Sand diameter < 1.0 mm
90 cm
Coarse Sand diameter 1.0-6.0 mm
30 cm
5 cm
46 cm
5 cm
5 cm
Iron Nails 5 kg
Polyester Cloth
Water
Metal Diffuser Box
Lid
Arsenic Removal Unit
Pathogen Removal Unit

The Arsenic Biosand Filter Project Section 4: ABF Theory
8
4.2 Arsenic Removal
Numerous studies have shown that ferric hydroxide (iron rust) is an excellent adsorbent
for arsenic20,21,22,23,24,25,26,27. A surface complexation reaction occurs when aqueous
arsenic species come into contact with ferric hydroxide. Both species of arsenic found in
water (arsenite and arsenate) are effectively and tightly bound to the ferric hydroxide28,29.
A simplified explanation of these processes is discussed below, as applied to an ABF.
In the ABF, iron nails are exposed to air and water, and rust very quickly, producing
ferric hydroxide particles. When arsenic-contaminated water is poured into the ABF, the
arsenic is rapidly adsorbed onto the surface of the ferric hydroxide particles. Some of
these arsenic-loaded ferric hydroxide particles are trapped by the polyester cloth, but
most of the particles are flushed past the polyester cloth, onto the underlying fine sand
layer. Because of the very small pore space of the fine sand layer, almost all ferric
hydroxide particles and ferric-hydroxide-arsenic-particles will settle on top of the fine
sand layer (Figure 4). Since most of the arsenic in the water is already adsorbed onto the
ferric hydroxide, and almost all ferric hydroxide is trapped on top of the fine sand layer,
as a result, arsenic is effectively removed from the water.
Figure 4 - A Simplified Illustration of the Arsenic Removal Mechanisms
SAND
Water
The arsenic particles are bound onto ferric hydroxide, and the resulting molecules are filtered by the top layer of the fine sand. The faces represent arsenic, while the
nails represent ferric hydroxide particles.

The Arsenic Biosand Filter Project Section 4: ABF Theory
9
4.3 Pathogen Removal
The processes of pathogens removal in microbially contaminated source water are not yet
well understood. It is currently believed that pathogens in an ABF can be removed
primarily by two mechanisms: physical-chemical, and biological30, 31, 32. A simplified
explanation of these processes is discussed below, as applied to an ABF. Details on the
pathogen removal mechanisms are beyond the scope of this study. Readers are referred
to research by Lukacs33, Lee34, and Buzunis35. See Figure 5 for a simplified illustration
of the physical-chemical and biological removal mechanisms.
Physical-Chemical Mechanisms
Of the many physical-chemical processes associated with filtration, surface straining and
inter-particle attraction (or attachment) are probably the most important processes
responsible for pathogen removal in an ABF. Surface straining refers to the trapping of
foreign particles on top of the filter bed because the particles are too large to pass through
the bed. A tightly packed bed of sand grains can capture particles about 5% of the grain
diameter. For example, sand with a diameter of 0.1 mm will strain out particles that are 5
µm or larger36. This is substantially larger than many particles to be removed from
surface water such as cysts (1-20 µm) and bacteria (0.1 to 10 µm)37. Viruses are much
less than 1µm and must, therefore, be removed by other means38, such as biological
mechanisms.
Interparticle attraction refers to the process with which the foreign particles are adsorbed
to the filter medium (i.e. sand). This process is affected by a variety of chemical
interactions between microbial cells and porous media including hydrophobicity (i.e.
polarity) and surface charge39,40.
Biological Mechanisms
Following the installation of an ABF, foreign particles such as dust, dirt, organic
substances, and iron particles will begin to settle on top of the fine sand layer as a filter

The Arsenic Biosand Filter Project Section 4: ABF Theory
10
cake. As water is poured into the ABF, dissolved organic carbon, dissolved oxygen, and
nutrients present in the influent water will support elevated biological populations within
the filter cake and in the top few centimeters of the fine sand41. This diverse biological
population is known as the biofilm. It is consists of algae, bacteria, protozoa, and small
invertebrates42.
The ABF is designed in such a way that there is always about 5 cm of standing water
above the fine sand layer. The 5 cm height was reportedly to be the optimum height for
pathogen removal. If the water level is too shallow, the biofilm layer can be easily
disturbed and subsequently damaged by the force of the incoming water. On the other
hand, if the water level is too deep, an insufficient amount of oxygen diffuses to the
biofilm, resulting in suffocation of the microorganisms in the biofilm layer43. In addition
to the 5 cm protective water layer, the diffuser box above the fine sand layer serves an
important purpose to reduce the force of input water from disturbing the top layer of
sand44.
When microbially contaminated water is poured into the ABF, predator organisms that
reside in the biofilm layer will consume the incoming pathogens45. Recent studies and
experiments conclude that this process can be a significant cause of bacterial removal in
slow sand filters46.
Figure 5 - A Simplified Illustration of the Pathogen Removal Mechanisms
We’re stuck!
Top SAND layer (B)
(A) Water
Physical removal by surface straining is illustrated in (A). Bacteria are too large to pass through the sand layer.
Biological removal by predation is illustrated in (B). The microorganisms living in the biofilm consume incoming bacteria.

The Arsenic Biosand Filter Project Section 4: ABF Theory
11
Biofilm Ripening
When an ABF is newly installed, or when the biofilm layer is damaged (e.g. during the
filter cleaning), time is needed for the biofilm to grow to maturity. This is called the
ripening period. The ripening period can be as short as a day and can go up to several
weeks, depending on the water temperature and chemistry47,48. For example, high
concentration of organic substances in the influent water may encourage biofilm
growth49. During the ripening period, the filter does not remove bacteria effectively
because only physical-chemical mechanisms are at work to remove bacteria. A study by
Bellamy et al. concluded that a new sand bed could remove 85% of the coliform bacteria
in the influent. As the sand bed matures biologically, the percent removal improves to
more than 99% for coliform bacteria50. Current research is underway at MIT by Pincus
to determine the ripening time and E. Coli removal efficiency for newly installed biosand
filters51.
4.4 ABF Manufacturing and Installation Procedure
4.4.1 Manufacturing
The ABF can be entirely constructed with locally available materials, and with local
labor. Concrete ABF were made by the International Buddhist Society (IBS), which
contracted out the actual construction work to a local mason, Durga Ale. (Refer to
Appendix E for a thorough explanation on filter construction52.) Figure 6 shows newly
made ABFs at the IBS. The metal diffuser boxes were manufactured in a metal shop in
Kathmandu (Figure 7 and Figure 8).

The Arsenic Biosand Filter Project Section 4: ABF Theory
12
Figure 6 - Newly made ABFs at IBS
Figure 7 - A Metal Workshop in Kathmandu
Figure 8 - A newly made Metal Diffuser Box from the Metal Workshop
4.4.2 Installation Procedure
. The materials needed for installation are:
• A concrete bio-sand arsenic filter (including a metal box and a lid)
• 2 bottles of Piyush*
* Piyush is a locally manufactured calcium hypochlorite solution

The Arsenic Biosand Filter Project Section 4: ABF Theory
13
• 2.5 L gravel (above 6.0 - 15 mm grain size)
• 2.5 L coarse sand (1.0 - 6.0 mm grain size)
• About 30 L of fine sand (less than 1.0 mm grain size)
• 1 piece of polyester cloth (30 X 30 cm)
• 5 kg of iron nails
Once constructed, each ABF is flushed with water to get rid of dirt, sand, mud, and dried
leaves (Figure 9). Then for each filter, two bottles of 60 mL Piyush solution (Figure 10)
are mixed with 20 L of water in a bucket. The entire 20 L mixture is poured into the
ABF filter to disinfect it. All sands and gravel are carefully washed before filling the
filter to get rid of very fine particles and clay, in an effort to minimize clogging. Then 2.5
L of gravel that can be collected in a local river (diameter 6-15mm) is slowly added to the
filter. The gravel layer is flattened before 2.5 L of coarse sand (diameter 1-6mm) are
slowly added on top of the gravel layer. The coarse sand can be purchased from a local
sand-crushing operation (Figure 11 and Figure 12) and sieved with a mosquito net. The
coarse sand layer is flattened as well. Then, the filter is slowly filled up with fine sand
that can be collected from a local river (diameter <1 mm) up to 5 cm below the water
outlet level (see Figure 3). Any air bubble trapped in the filter will clog the system.
Therefore, during the filling operation, it is important to make sure that there is always a
higher level of water than of sand. Additional water may be added if necessary. In other
words, each layer is added to water. Once the sand was put in place, a square piece of
polyester cloth is cut and placed inside the metal diffuser box. Five kg of shoe tack iron
nails of size 19 mm are added to the metal box. The metal box is inserted into the ABF,
which is then closed with the filter lid.
The filter is left undisturbed for 24 hours, during which time the Piyush solution
disinfected the sand layers. After 24 hours, tubewell water is added to the filter to flush
the Piyush solution. Water is added until there was no more chlorine odor in the filtered
water. The filter is then considered ready for use.

The Arsenic Biosand Filter Project Section 4: ABF Theory
14
Figure 9 - Washing ABFs at RWSSSP Laboratory
Figure 10 - Piyush Disinfecting Solution
Figure 11 - A Local Sand Crushing Operation by a Riverside near Butwal
Figure 12 - Filling up Bags of Crushed Sand
4.5 ABF Operation Procedure
The operation procedure is simple. First, ensure iron nail surface is always flat (no holes
or spaces in the iron nail layer) before use. If the surface is not flat, then the box is taken

The Arsenic Biosand Filter Project Section 4: ABF Theory
15
out and shaken to evenly distribute the iron nails. The metal box must be returned to the
filter. Then, slowly pour water into the metal box, and collect the filtered water from the
outlet. The filter lid should be closed at all time, except when pouring water into the
filter. When the water flow is too low, the filter needs to be cleaned.
4.6 ABF Cleaning Procedure
Cleaning the ABF is simple, and should be done when the water flow rate becomes too
low. First, the filter lid and the metal box containing the iron nails are removed. Then the
top 2 cm of the sand are gently scraped by hand. As a result of this scraping, the water
that sits above the sand will become very turbid. The next step is to remove that turbid
water using a small container. Arsenic-free water is then slowly added to replace the
water that was just removed. The scraping and water removal procedure is repeated five
times. Then the metal box containing the iron nails is shaken vigorously to make sure
that iron nails cover the whole surface of the box. Finally, the metal box is put back into
the filter, and the lid is put back on. The filter is clean, and can be used immediately.
The disposal of a small volume of arsenic-containing water (produced from the cleaning
procedure) to nearby ditches is not believed to pose significant health threat to human.
According to risk assessment analysis, of the three major arsenic exposure pathways
(namely, ingestion, adsorption, and inhalation), ingestion of arsenic (mainly through
drinking arsenic-contaminated water) is the only significant route of entry. Arsenic
intake into human body by skin adsorption is generally minimal53. Inhalation of arsenic
is also minimal because arsenic is not volatile. In addition, a study by the Australian
National University and the University of Queensland found that food irrigated with
arsenic contaminated water is unlikely to add significantly risk to total arsenic exposure
among Bangladeshis54.
(Refer to Appendix D for a copy of the pictorial cleaning instructions given to villagers
during the educational workshop in Sarawal.)

The Arsenic Biosand Filter Project Section 4: ABF Theory
16
4.7 ENPHO’s Arsenic Biosand Filter Setup
In addition to Tommy Ngai’s ABF design, which is described above, ENPHO also
installed at least 6 ABF on their own. Their filter setup is identical to the final design by
Tommy Ngai’s team, as shown in Section 4.1 Figure 3. Refer to Appendix F for a
description of their filter design and pilot study.
4.8 RWSSSP’s 3-Kolshi Filters Setup
About fifteen 3-Kolshi Filters were installed at two arsenic-affected villages (Dubiya
VDC and Barkalpur VDC) by RWSSSP in the summer of 2002. Refer to Appendix G for
a description of their filter design and pilot study.

The Arsenic Biosand Filter Project Section 5: Analytical Methods
17
5. ANALYTICAL METHODS
This section describes the analytical methods used to measure all relevant water quality
parameters in this study. The parameters include:
• Total inorganic arsenic
• Total iron
• Bacteria (Total coliform & E. Coli, and H2S bacteria)
• Flow rate
It is worth noting that Tommy Ngai and Sophie Walewijk used different field test kits for
filter monitoring than RWSSSP or ENPHO because they have different options available.
Table 1 summaries the various analytical methods used by these three groups to measure
the water quality parameters listed above. Details on each of these analytical methods
will be discussed in the following sections.
Table 1 - Analytical Methods used by Tommy Ngai’s Team, RWSSSP, and ENPHO
Tommy & Sophie RWSSSP ENPHO Arsenic • Industrial Test Systems
field test kit • MIT lab
• ENPHO new arsenic field test kit
• ENPHO lab
• ENPHO lab
Iron • HACH field test kit • N/A • N/A Bacteria • M-Coliblue24
membrane filtration • ENPHO P/A H2S
bacteria test vial • N/A
Flow rate • Graduated cylinder • N/A • N/A Note: N/A = Not Applicable. This particular water quality parameter was not measured in their regular monitoring.
Before collecting a water sample from a tubewell, the well is purged for approximately
30 seconds (about 5-10 L). Water used to fill filters was also collected after the initial
purging. This procedure attempts to mimic the usual water collection and filter usage
practices by villagers.

The Arsenic Biosand Filter Project Section 5: Analytical Methods
18
5.1 Arsenic
Four analytical methods for total inorganic arsenic are described below. Tommy Ngai’s
team used the Industrial Test System Inc. (ITS) Arsenic CheckTM Field Test Kit for all
their analysis in this study. The accuracy of this field test kit was investigated in a
separate study by Tommy Ngai, where he compared split-sample results analyzed by this
test kit with the more accurate and precise MIT Parsons Laboratory’s Perkin-Elmer
Graphite Furnace Atomic Absorption Spectrometer (GFAAS). Refer to Appendix H for
the comparison results. RWSSSP used the New Arsenic Test Kit developed by ENPHO
for their arsenic monitoring activities. RWSSSP also sent some of their water sample to
the ENPHO Laboratory to verify their test kit results. ENPHO used their laboratory’s
SOLAAR 969 Hydride Generation Atomic Absorption (HGAAS) for their monitoring
activities. The accuracy of this HGAAS was investigated in a separate study by Tommy
Ngai, where he compared split-sample results analyzed by the HGAAS with the MIT’s
GFAAS; and the two results are found to be very similar. Comparison results can be
found in Appendix H.
5.1.1 Industrial Test Systems Inc. Arsenic CheckTM Field Test Kit
This U.S.-made arsenic field test kit, shown in Figure 13, provides a safe and easy
method to test for aqueous inorganic arsenic. This method requires no electricity and no
refrigeration. The detection range is from 0 to 800 µg/L, with the most reliable range
between 5 to 100 µg/L. The upper detection limit can be extended to 4000 µg/L with a
simple 1 to 5 dilution. Components supplied in this kit include a detailed description of
the test method, a color chart, three chemical reagents with material safety data sheets,
three measuring spoons for the reagents, test strips, two reaction bottles, four bottle caps,
a thermometer, and a zip-loc test strips disposal bag.
The chemistry of the reaction is based on the conversion of inorganic arsenic compounds
in water to arsine gas (AsH3) by the reaction with zinc dust and tartaric acid55. The test
results are determined by colorimetry. The color chart is standardized at 25°C, starting at
pure white for 0 µg/L arsenic, a tint of yellow for 5 µg/L arsenic, to slightly more yellow

The Arsenic Biosand Filter Project Section 5: Analytical Methods
19
at 10 µg/L, and increasing yellow intensity at 20, 50, 100, 200, and 500 µg/L. At 500
µg/L arsenic, the color is dark brown. It is recommended that the water sample
temperature be between 20°C and 30°C for accurate reading off the color chart. This test
tolerates up to 2 µg/L hydrogen sulfide and 0.5 mg/L antimony without test result
interference. No interference from iron or sulfate was found. There are 100 tests per kit,
selling at $120 per kit.
A test was performed as part of the thesis study by Tommy Ngai in 2002 to determine the
accuracy of this field test kit56. Results on 23 split-samples showed the test kit results
agreed with the MIT GFAAS results 78% of the time, which is fairly good. It is therefore
assumed that the ITS test kit results are dependable and accurate. Refer to Appendix H
for more details.
Procedure as performed by Tommy Ngai and Sophie Walewijk:
1. Plastic sampling bottles shown in Figure 14, were used to collect water samples.
Prior to sampling, the bottles were washed with arsenic-free and iron-free water.
During sample collection, the bottles were rinsed with the actual sample water.
Then the bottles were filled up with the sample water.
2. A clean reaction bottle was filled with the sample to the 100 mL mark.
3. Three leveled pink spoons of reagent 1 (tartaric acid) were added to the bottle.
The bottle was capped and shaken vigorously for 15 seconds, time after which the
tartaric acid would be dissolved. The contents were allowed to sit for another 15
seconds.
4. Three leveled red spoons of reagent 2, which contains a mixture of ferrous salts,
were introduced to the reaction bottle. Again, the bottle was capped and shaken
vigorously for 15 seconds, time after which the metal salts are dissolved. The
content was allowed to sit for 2 additional minutes.
5. Then three leveled white spoons of reagent 3 (zinc dust), were added to the bottle
and shaken vigorously for 15 seconds. Immediately after the 15 seconds, the
yellow bottle cap was replaced with a white cap that allows a test strip containing
mercuric bromide to be inserted into the bottle.

The Arsenic Biosand Filter Project Section 5: Analytical Methods
20
6. A test strip was inserted into the bottle cap opening, with the red mark of the strip
facing the center of the cap. The cap opening was quickly closed to secure the
strip and to prevent gas from escaping the reaction bottle.
7. The bottle was capped for the next 30 minutes. Both hydrogen gas and arsine gas
bubbled out of the solution. The produced arsine gas then reacted with the
mercuric bromide on the test strip to form mixed mercury halogens (such as
AsH2HgBr) that appeared with a color change from white to yellow or brown.
Figure 13 - Industrial Test Systems Arsenic CheckTM Field Test Kit
Figure 14 - Bottle Used to Collect Arsenic and Iron Samples
8. At the end of 30 minutes, the test strip was taken out of the bottle and compared
to the color chart to determine the arsenic concentration. The comparison was
performed within the following five minutes because the color begin to fade away
Reaction Bottle
Reagent 1
Reagent 2
Reagent 3
Test Strips

The Arsenic Biosand Filter Project Section 5: Analytical Methods
21
after five minutes. In addition, because hydrogen may cause an explosion, and
arsine gas is toxic, it is highly recommended that the test be conducted in a well-
ventilated* area away from fire and other sources of ignition57.
5.1.2 Perkin-Elmer Graphite Furnace Atomic Absorption Spectrometry
(GFAAS)58
The GFAAS instrument from the MIT Parsons Laboratory was used as a check for the
accuracy of the ITS Test Kit and of the ENPHO lab HGAAS results.
GFAAS is one of the methods for measuring arsenic in drinking water that is approved
by the United States Environmental Protection Agency (USEPA). Atomic absorption is
based on the principle that atoms will absorb light at some characteristic wavelength.
These wavelengths are related to the atomic structure of an element and the energy
required for the promotion of its electrons from one quantum level to another. Therefore
each element has its own characteristic wavelength. A wavelength of 193.7 nm is
recommended for arsenic. The amount of light absorbed by an element at a certain
wavelength can be correlated to the concentration of the element within the linear
calibration range. The reliable calibration range is as low as 1-5 µg/L As, and as high as
200 µg/L As. Dilution of samples with higher arsenic concentrations may be required.
Chemical interferences may occur, but they can be ameliorated by the use of matrix
modifiers. This instrument is not suitable for field use because of its large size and the
sensitivity of some of its delicate components to transportation. The GFAAS requires
electricity, but no refrigeration.
Procedure as performed by Tommy Ngai and Sophie Walewijk:
1. Water samples from Nepal were first preserved by adding a drop of 6 M
hydrochloric acid (HCl) per 10 mL of sample at the time of collection. This
* A study by Hussam et al showed that in the immediate vicinity of some arsenic test kits, the arsine gas concentration can reach over 35 times the threshold limiting value (TLV) of 50 ppbv of arsenic from a single experiment with 100 µg/L of total arsenic in solution.

The Arsenic Biosand Filter Project Section 5: Analytical Methods
22
acidification prevents the precipitation of aqueous iron that would otherwise
adsorb arsenic.
2. At the MIT laboratory, 1 mL of the water sample was carefully pipetted into a
plastic vial specially made for GFAAS analysis. The vial was placed on the
sampling dish. A set of standard arsenic solutions and matrix modifiers was also
placed on the sampling dish. The dish has a capacity of 75 samples.
3. A pre-programmed arsenic testing procedure was loaded on the GFAAS computer
control. Information on the test samples was entered into the computer.
4. The test procedure was started by clicking the START button on the computer
screen. The instrument then automatically took a small amount of the sample and
volatilized the arsenic atoms by intense heating. Once the atoms were excited, a
monochrome lamp at 193.7 nm sent an optical beam through the headspace above
the sample. The instrument measured the absorption and reported it as a peak
focused around the 193.7 nm wavelength. The area under the peak was
numerically integrated. The integrated results were displayed on the computer
screen and on a printer printout.
5. By comparing the area under the peak of the sample water with standard arsenic
solutions, the concentration of the sample was determined. Because of the
variances associated with the instrument, a standard calibration curve was
developed for every six to eight samples analyzed to maintain accurate
measurements.
5.1.3 ENPHO New Arsenic Field Test Kit59
ENPHO developed this new test kit in the summer of 2002 as an improvement over their
previous arsenic field test kit. The detection range is 10 µg/L to 250 µg/L. Each test kit
consists of a glass arsine generator flask, a 25 mL measuring cylinder, mercuric bromide
paper, mercuric bromide paper holder, cotton, a forceps, acid tablets, lead acetate, and
sodium borohydride. Detailed instructions and a color chart are also included with each
test kit. The principle for this kit is that arsenic in water reacts with sodium borohydride
in the presence of an acidic medium to form arsine gas, which produces a yellow to
brown stain on the mercuric bromide paper. This principle is very similar to the ITS

The Arsenic Biosand Filter Project Section 5: Analytical Methods
23
Arsenic Test Kit used by Tommy Ngai described in 5.1.1. The cost for each ENPHO
New Arsenic Field Test Kit, including chemicals for 50 tests is 6200 Nepali Rupees
(~US$81). The replacement cost for the chemicals is 2500 Nepali Rupees (~US$32) per
50 tests, which is about US$0.65 per test.
Procedure as recommended by ENPHO:
1. Plastic sampling bottles shown in Figure 14, are used to collect water samples.
Prior to sampling, the bottles are washed with arsenic-free and iron-free water.
During sample collection, the bottles are rinsed with the actual sample water.
Then the bottles are filled up with the sample water.
2. 25 mL of the water sample is transferred to the arsenic generator flask using the
measuring cylinder.
3. Mercuric bromide paper is inserted into the paper holder.
4. One acid tablet is added to the sample in the generator flask. Swirl the flask
gently to dissolve and mix the acid table.
5. Sodium borohydride is added to the flask. The mercuric bromide paper holder is
immediately inserted into the flask to close the flask. The sample is left
undisturbed for 10 minutes.
6. Then, using the forceps, the mercuric bromide paper is taken out of the flask, and
compared to the color chart to determine arsenic concentration. If the arsenic
concentration is greater than the reliable detection limit of 250 µg/L, the sample
should be diluted and retested.
5.1.4 SOLAAR 969 Hydride Generation Atomic Absorption Spectrometer
(HGAAS)60
ENPHO has a British made HGAAS in their laboratory for accurate measurement of
arsenic. The HGAAS technique is based on the atomic absorption measurement of
arsenic generated by thermal decomposition of arsenic (III) hydride. Arsenic (III) is
reduced to gaseous arsenic (III) hydride by reaction with sodium tetrahydroborate in a
hydrochloric acid medium. As (III) and As(V) have different sensitivities using this
technique so pentavalent arsenic must be reduced to trivalent arsenic prior to

The Arsenic Biosand Filter Project Section 5: Analytical Methods
24
measurement. This reduction is carried out using hydrochloric acid, potassium iodide
and ascorbic acid.
A test was performed on this instrument against the MIT GFAAS to determine the
accuracy of the HGAAS results. Results on 22 split-samples showed the average
absolute difference between the two AAS instruments is 31%, which is very good. It is
considered that the HGAAS results are usually dependable and accurate. Refer to
Appendix H for more details.
5.2 Total Iron
Neither RWSSSP nor ENPHO tested for iron in their regular monitoring activities.
Tommy Ngai’s team used the HACH Portable Iron Test Kit Model IR-18 to test for total
iron.
5.2.1 HACH Portable Iron Test Kit Model IR-18
The HACH iron field test kit Cat. No. 1464-00, shown in Figure 15, is a simple method
to test for iron. It requires no electricity and no refrigeration. The detection range is
from 0.1 to 5 mg/L. The upper detection limit can be extended to 10 mg/L with a 1 to 2
dilution. All components are supplied in the kit, including a detailed description of the
test method, a color disc and comparator, two test tubes, and individually wrapped
FerroVer Iron Reagent Powder Pillow with material safety data sheets.
Figure 15 - HACH Portable Iron Test Kit Model IR-18

The Arsenic Biosand Filter Project Section 5: Analytical Methods
25
The test results are determined by colorimetry. Accuracy is not affected by undissolved
powder. The color chart is graduated, starting at pure transparent for <0.1 mg/L iron, a
tint of orange for 0.3 mg/L iron, to slightly more orange at 1 mg/L, and increasing orange
intensity to 5 mg/L. The chemistry of the reaction is based on the complexation of
aqueous iron with sulfite ligand to form an orange color complex. There are 100 tests per
kit, selling at $40 per kit.
Procedure as performed by Tommy Ngai and Sophie Walewijk:
1. A small quantity of the water sample collected for arsenic analysis was used for
iron analysis. Prior to sampling, the plastic collection bottles (Figure 14) were
washed with arsenic-free and iron-free water. During sample collection, the
bottles were rinsed with the actual sample water. Then the bottles were filled up
with the sample water.
2. Both test tubes were filled with the water sample to the 5 mL mark.
3. One packet of reagent was added to one of the two tubes. Both tubes were capped
and shaken for 30 seconds.
4. The blank test tube was inserted into the top left opening in the disc comparator.
The tube with reagent addition was inserted into the top right opening in the disc
compartment.
5. The comparator was held up to a light source such as the sky or a lamp. The disc
was rotated until the color matches in the two windows. Iron concentration was
shown in the scale window.
5.3 Bacteria
In practice, monitoring of indicator organisms frequently replaces the direct monitoring
of pathogens for assessing the microbial quality of drinking water. Indicator organisms
do not themselves cause the illnesses, but they can be found in association with
pathogenic species, and their concentration can be related to that of pathogens. Indicator
tests are cheaper, easier to perform and yield faster results, compared to direct pathogen
monitoring61,62. Commonly used indicators are total coliforms, E. Coli, and H2S bacteria,

The Arsenic Biosand Filter Project Section 5: Analytical Methods
26
which are all fecal indicators. Tommy Ngai’s team tested for total coliforms and E. Coli
using Millipore M-Coliblue24 Broth, Membrane Filtration and Incubation. RWSSSP
tested for H2S bacteria using ENPHO Presence/Absence H2S Bacteria Test Vials. Refer
to research by Low for more information on the appropriate microbial indicator tests for
drinking water in developing countries63.
5.3.1 Millipore M-Coliblue24 Broth, Membrane Filtration and Incubation64
Millipore M-Coliblue24 broth is a culture medium that selects for total coliforms and E.
Coli. The broth was developed specifically for culturing microorganisms on membrane
filters, and the broth is available in convenient single-use 2 mL plastic ampoules. The
broth combines the speed of presence-absence coliform test with the enumeration of
membrane filtration. In this test, E. Coli turn blue, and other coliforms red. Total
coliforms is the sum of the two.
The main pieces of equipment needed were: Petri Dishes with pads, filter paper with grid,
Millipore m-ColiBlue24 broth ($170 for 100 tests), forceps, methanol, Millipore portable
membrane filtration assembly unit, and an Amy Smith Phase Change Incubator*. This
incubator maintains a constant 35oC temperature without using electricity. Before use,
the incubator is immersed in boiling water until the waxy substance inside is completely
melted. Over the next 24 hours, the wax solidifies and releases heat to maintain a 35oC
temperature.
Procedure as performed by Tommy Ngai and Sophie Walewijk:
1. Disposable Whirlpack Bags were used for sample collection, as shown in Figure
16. Each new bag was sterile and sealed. During sampling, a bag was unsealed,
filled up with about 150 mL sample water, and closed. The bag was then placed
in a portable cooler until analysis. Analysis was performed on the same day as
sample collection.
* The Amy Smith Phase Change Incubator was created by Amy Smith of MIT’s Edgerton Center

The Arsenic Biosand Filter Project Section 5: Analytical Methods
27
2. Distilled water was boiled and let cooled to room temperature for several hours.
The working surface was sterilized by burning methanol on it. The top part of the
membrane filter unit was sterilized by placing it in boiling water for 5 minutes.
This part was then allowed to cool to below 35oC for about 15 minutes. While
cooling down, the part was covered with sterile aluminum paper. Figure 17 is a
picture of the filter assembly unit.
3. The top filter part was sterilized between each sample.
4. Steps five to seven outline the procedure to obtain one Petri dish. There was one
Petri dish per filter sample, and two Petri dishes per tubewell sample (a 1:10 and a
1:1 dilutions, with the 1:10 dilution filtered first).
5. The lid from a Petri dish containing an absorbent pad was removed. An m-
ColiBlue24 broth ampoule was inverted 2 or 3 times to mix the broth. The cap of
the ampoule was twisted open, and its contents evenly poured over the absorbent
pad. The lid was placed back on the Petri dish.
6. The membrane filter assembly was set up. A filter, grid side up, was placed into
the assembly using sterile forceps. 100 mL of sample or diluted sample were
filtered by creating a vacuum below the filter, using the pump-syringe attached to
the assembly.
7. The filter, grid side up, was then transferred on the absorbent pad in the
previously prepared Petri dish using sterile forceps. A slight rolling motion was
applied during the transfer to avoid air to be trapped in between the pad and the
filter. The Petri dish was replaced.
8. The Petri dishes were inverted and incubated in the Amy Smith Incubator at 35oC
for 24 hours. Before use, the incubator was heated with boiling water until the
inside waxy substance became liquid. The incubator was placed into its foam
insulation, and the resulting package was rolled in towels and placed into an
insulated place such as an oven. The oven should be off.
9. The Petri dishes were removed from the incubator and colonies were counted,
using the grid of the filter to avoid double-counting or missing some colonies
(Figure 18). A magnifying glass and a desk lamp were used to facilitate the
process.

The Arsenic Biosand Filter Project Section 5: Analytical Methods
28
Figure 16 - Whirlpack Bag Used to Collect Bacterial Samples
Figure 17 - Membrane Filter Unit
Figure 18 - Example of a Plate
Cup where the sample is poured
The filter is under the cup at this height
Bottom part: holds the filtered water that will be discarded
Top part: sterilized between each sample
Tube attached to pump-syringe that creates a vacuum within the filter

The Arsenic Biosand Filter Project Section 5: Analytical Methods
29
Coliform density was reported as number of colony forming units (CFU) per 100 mL of
sample. Preferably, each plate should have between 20 and 80 colonies for easy and
accurate counting. Samples that produced more than 250 colonies were reported as “too
numerous to count” (TNTC). Some colonies may overlap thus creating counting errors.
One in ten dilutions of tubewell water samples were made to avoid this. Figure 19 shows
a microbial test performed at the makeshift laboratory at RWSSSP guesthouse.
5.3.2 ENPHO Presence/Absence H2S Bacteria Test Vials65
RWSSSP purchased ENPHO P/A H2S Bacteria Test Vials from ENPHO to monitor the
presence or absence of H2S bacteria in their water sample. Unlike the membrane
filtration method used by Tommy Ngai and Sophie Walewijk to quantify water
contamination, the P/A test is a qualitative test that produces a yes or no result. It is a
very simple test based on the reaction of H2S gas produced by the metabolism of bacteria
like Salmonella, Proteus, Citrobacter, Klebsiella, etc. with iron to form a black precipitate
of iron sulfide. All necessary chemicals are included in the vial when purchased. Each
test vial costs 50 Nepali Rupees (~US$0.65) including a 10 Nepal Rupees (~US$0.13)
deposit on the vial, which is refundable upon return. Figure 20 shows an example of a
P/A H2S bacteria test. The vial on the left contains no H2S bacteria while the vial on the
right is contaminated.
Procedure as recommended by ENPHO:
1. A P/A test bottle is carefully filled to the top with the water sample.
2. The bottle is placed undisturbed for 48 hours in a room having temperature
between 22-440C.
After 48 hours, if the color of the liquid inside the bottle changes into black color, then it
indicates that the sample is contaminated.

The Arsenic Biosand Filter Project Section 5: Analytical Methods
30
Figure 19 - Microbial Test Performed at a Makeshift Laboratory at the RWSSSP
Guesthouse
Figure 20 - P/A H2S Bacteria Test Showing Uncontaminated Sample (left) and Contaminated Sample (right)
5.4 Flow Rate
Flow rate of the ABF was measured by Tommy Ngai’s team with a 100 mL plastic
graduated cylinder and a stopwatch. RWSSSP and ENPHO did not measure filter flow
rate in their regular monitoring.
Procedure as performed by Tommy Ngai and Sophie Walewijk:
1. Water was poured into the diffuser box to approximately half full.
2. Once a steady stream of water was flowing out of the filter outlet (typically 10-15
seconds), water was collected using a graduated cylinder.
3. The time needed to fill the cylinder to the 100 mL mark was measured in seconds.
The measurement was scaled up from seconds per 100 mL to liters per hour.

The Arsenic Biosand Filter Project Section 6: Lab Experiments at RWSSSP
31
6. LABORATORY EXPERIMENTS AT RWSSSP
Tommy Ngai traveled to Nepal between September 14 and October 4, 2002, and between
December 26, 2002 and January 14, 2003 as part of the project work. Debu Sen, a
former team member, accompanied Tommy during the September/October trip. Sophie
Walewijk, a current active member, assisted Tommy during the December/January trip.
For both trips, Tommy and his teammates stayed at and worked with Rural Water Supply
and Sanitation Support Programme (RWSSSP) in the city of Butwal, Rupandehi District.
Two major parts of the fieldwork conducted in Nepal are:
• Laboratory experiments at RWSSSP office – September 2002 (Chapter 6)
• Pilot study in Sarawal and Devdaha Village Development Committees (VDCs) –
September 2002 to January 2003 (Chapter 7)
6.1 Laboratory Experiments Overview
The laboratory experiments conducted at the RWSSSP office in September 2002
consisted of two parts: the main experiment, and three additional experiments. The
purpose of all these experiments was to investigate the arsenic performance of five
different ABF arrangements under actual local conditions, prior to a pilot study involving
the distribution of selected ABF designs to arsenic-affected households. Section 6.1.1
describes the five filter arrangements for the experiments. Section 6.1.2 and 6.1.3
describes the main experiment and the three additional experiments in detail. Section 6.2
shows the results of these experiments.
6.1.1 Filter Arrangements
The five filters were installed at the garage of the RWSSSP office (Figure 21). A
detailed description of each filter arrangement follows.

The Arsenic Biosand Filter Project Section 6: Lab Experiments at RWSSSP
32
Figure 21 - RWSSSP Laboratory Showing Five ABFs
Arrangement #1 – Control
This arrangement was essentially a Biosand Filter (BSF). The only difference was that
the diffuser plate in a regular BSF was replaced with a metal diffuser box (Figure 22). A
piece of polyester cloth was placed inside the box, with no iron nails added. The
pathogen removal unit was the same, with the usual amount of sand and gravel. Raw
water was poured directly into the diffuser box as usual. A few brick chips (20-30 mm
diameter) were placed inside the metal box to stabilize the polyester cloth.
Figure 22 - Metal Diffusers Boxes with Polyester Cloth

The Arsenic Biosand Filter Project Section 6: Lab Experiments at RWSSSP
33
Arrangement #2 – Coagulation/Flocculation
This arrangement was tested because of favorable results from Hwang’s study66, and by
recommendation of Dr. Manz, the inventor of the BioSand Filter67. The setup of this
filter was similar to arrangement #1. There was a piece of polyester cloth, but no iron
nails in the metal diffuser box. A few brick chips (20-30 mm diameter) were placed
inside the metal box to stabilize the polyester cloth. The pathogen unit was unchanged.
The only difference between this arrangement and the previous arrangement was that the
raw water was pre-treated in a 20 L plastic bucket before it was poured into the diffuser
box. For every 20 L bucket of raw water, one packet of ENPHO’s black coagulation
powder was added (Figure 23). ENPHO’s powder contained ferric chloride as coagulant,
charcoal as flocculent (weighting agent), and sodium hypochlorite as oxidant and
disinfectant. Details about this coagulation process can be found in Hwang’s thesis68.
According to Hwang’s study, the powder should be added to the raw water and mixed
vigorously with a stick or stirrer for 1 minute. Then the water should be left undisturbed
for 30 minutes. Finally, the supernatant (water on the top that is free of settled materials)
should be carefully poured into the ABF.
Arrangement #3 – High Quality Iron Nails
In this filter, 2.5 kg of high quality shoe tack iron nails were added to the metal diffuser
box of an ABF (Figure 24). These nails are of high quality because they are very strong
(i.e. do not bend easily). The nails cost 80 Nepali rupees (NRs) per kg. Brick chips (20-
30 mm diameter) were added on top of the nails to prevent iron nails from scattering with
the force of the incoming raw water. The pathogen unit was left unchanged.
Arrangement #4 – Medium quality Iron Nails
In this filter, 2.5 kg of medium quality iron nails (NRs.40/kg) were added to the metal
diffuser box. These nails are medium quality because they can be easily bent with bare
hands. Brick chips (20-30mm diameter) were added on top of the nails to prevent iron
nails from scattering with the force of the incoming raw water. The pathogen unit was
unchanged.

The Arsenic Biosand Filter Project Section 6: Lab Experiments at RWSSSP
34
Figure 23 - ENPHO’s Black Coagulation Powder Added to 20 L of Water
Figure 24 - A Diffuser Box Full of High Quality Shoe Tack Iron Nails
Arrangement #5 – High Quality Iron Nails & Sand Layer
In this setup, the metal box was replaced by two 10 L plastic diffuser buckets stacked on
top of each other (Figure 25 and Figure 26). Holes were drilled at the bottom of both
buckets. The lower diffuser bucket had a polyester cloth covering the holes, on top of
which there was a 25mm layer of fine sand (diameter <1mm). The second diffuser
bucket was filled with 2.5 kg of high quality shoe tack iron nails, which were covered
with a few brick chips.

The Arsenic Biosand Filter Project Section 6: Lab Experiments at RWSSSP
35
Figure 25 - Diagram of the Two Diffuser Buckets
Figure 26 - Diffuser Bucket Replacing the Metal Box in the ABF
6.1.2 Main Experiment
200 L of arsenic contaminated tubewell water from Nir B. Gurung’s well* in Devdaha
VDC were collected each morning for experimental use (Figure 27). 40 L of water were
poured into each of the five filters when Tommy Ngai returned to RWSSSP in the
afternoon (Figure 28). Arsenic and iron concentrations of the raw well water were
measured at the RWSSSP laboratory, just before passing the water through the filters.
Filtered water samples were collected when approximately 40 L of water had passed
through each of the five filters. The filtered water samples were analyzed for arsenic and
iron. The temperatures of both the raw water and the treated water were usually about
25°C. Flow rate measurements were taken when the filter was full (i.e. water level was at
the highest, at about 25 cm above the outlet). Each filter arrangement held approximately
20 L of water, except arrangement #1 (regular Biosand Filter). The reservoir of this
regular biosand filter was damaged such that the capacity was reduced to about 12 L
(water level of about 15 cm above the outlet).
* According to RWSSSP, this well is known to contain one of the highest arsenic concentrations of all wells
in Nepal.
Polyester Cloth
Fine sand (diameter <1mm,
25mm depth)
Iron nails 2.5kg
Brick chips (diameter 20-30mm)

The Arsenic Biosand Filter Project Section 6: Lab Experiments at RWSSSP
36
Figure 27 - Collecting Water from Devdaha
Figure 28 - Laboratory Experiments in Progress
6.1.3 Additional Experiments
Three simple additional experiments were carried out to measure arsenic and iron
concentrations at intermediate points in the set-up. The purpose of these additional
experiments was to gain a better understanding of the actual arsenic removal mechanism
in the different filter arrangements. These experiments are described below:
Additional Experiment 1
This experiment seeks to determine the proportion of arsenic that can be removed by the
coagulation/flocculation process in arrangement #2. To achieve this objective, a

The Arsenic Biosand Filter Project Section 6: Lab Experiments at RWSSSP
37
supernatant water sample was taken and analyzed for arsenic and iron. The results were
compared to the raw water composition.
Additional Experiment 2
In arrangement #3, a sample of the water exiting the metal diffuser box (after it passed
through the high quality shoe tack iron nails bed but before it reached the fine sand layer)
was collected and analyzed to investigate how much of the total influent arsenic was
bound to the iron nails that remains in the diffuser box. Arsenic and iron results for the
post-diffuser sample were compared to the raw water that was poured into the metal
diffuser box.
Additional Experiment 3
In arrangement #5, an experiment was conducted to investigate how much of the total
arsenic could be removed by the diffuser buckets. Arsenic and iron results from samples
taken between the lower diffuser and the sand were compared to the raw water (Figure
29).
Figure 29 - Location of Post-diffuser Sample Collection
Polyester Cloth
Fine sand (diameter <1mm,
25mm depth)
Iron nails 2.5kg
Brick chips (diameter 20-30mm)
Post-diffuser sample
Raw water in

The Arsenic Biosand Filter Project Section 6: Lab Experiments at RWSSSP
38
6.2 Results and Discussions
6.2.1 Main Experiment
Arsenic Results
Table 2 shows a summary of the different filter arrangements. Table 3 and Table 4 show
the arsenic test results of the five filters.
Table 2 - Summary Description of RWSSSP Lab Experiments Filter Arrangements
Description
Arrangement #1 No iron nails. Same as regular BioSand Filter Arrangement #2 Coagulation/Flocculation using ENPHO powder Arrangement #3 2.5 kg of high quality shoe tack iron nails* Arrangement #4 2.5 kg of medium quality iron nails* Arrangement #5 2.5 kg of high quality iron nails and sand layer
Table 3 - Arsenic Test Results in mg/L for Lab Experiments at RWSSSP
Volume of raw water treated (L)
Raw water (µg/L)
Arr. #1 filtered (µg/L)
Arr. #2 filtered (µg/L)
Arr. #3 filtered (µg/L)
Arr. #4 filtered (µg/L)
Arr. #5 filtered (µg/L)
40 800 ND ND ND ND ND 80 750 5 ND 5 5 ND 120 900 8 ND 5 5 ND
ND = Non-Detect = < 5 µg/L total arsenic
Table 4 - Arsenic Test Results in % Arsenic Removal for Lab Experiments at RWSSSP
Volume of raw water treated (L)
Raw water (µg/L)
Arr. #1 % As
removal
Arr. #2 % As
removal
Arr. #3 % As
removal
Arr. #4 % As
removal
Arr. #5 % As
removal 40 800 >99 >99 >99 >99 >99 80 750 99 >99 99 99 >99 120 900 99 >99 99 99 >99
* The nails are considered “high quality” because they are very strong (i.e. not easy to bend) * The nails are considered “medium quality” because they can be easily bend with bard hands.

The Arsenic Biosand Filter Project Section 6: Lab Experiments at RWSSSP
39
Discussion of Results
One important observation is that even a newly installed BioSand Filter (i.e. arrangement
#1), which was our control, does remove some arsenic. One explanation is that the sand
has some initial arsenic removal capacity. Detectable arsenic concentration was first
measured after 80 L of water was filtered, as shown in Table 3, column 3.
Comparison between the five filter arrangements shows that the best performing filters
are arrangements #2 and #5. Both filters produced water that contained less than 5 µg/L
of arsenic after treating 120 L of arsenic-contaminated water. However, the arsenic
concentrations in the other filtered samples are also very low, at 5 µg/L. Strictly
speaking, the difference in performance between filter arrangements #2, #3, #4, and #5 is
too small to provide sufficient evidence to suggest which filter works the best. The
difference between each filtrate could well be attributed to errors associated with the field
test kit’s accuracy69. A previous study by Ngai showed that the field test kit results agree
78% of the time with Graphite Furnace Atomic Absorption Spectrometry (GFAAS), a
more sophisticated and accurate laboratory equipment70.
It was also observed that when a bucket full of water was poured into the metal diffuser
box, the force of water could easily disperse the iron nails in arrangements #3 and #4.
This can lead to short-circuiting (i.e. arsenic contaminated water bypassing the iron
nails). In such cases, all arsenic would not be removed. In an effort to protect the nails
layer, a layer of brick chips of about 20-30 mm diameters was added on top of the nails.
The conclusion for the laboratory study arsenic results is that arsenic removal is very
good. However, the study is inconclusive in determining the relative arsenic removal
efficiency of each filter arrangement. A longer-term study (e.g. pilot study) is necessary.
Iron Results
Iron tests were performed on the same water samples as the arsenic tests. Results are
shown in Table 5 and Table 6.

The Arsenic Biosand Filter Project Section 6: Lab Experiments at RWSSSP
40
Table 5 - Iron Test Results in mg/L for Lab Experiments at RWSSSP
Volume of raw water treated (L)
Raw water
(mg/L)
Arr. #1 filtered (mg/L)
Arr. #2 filtered (mg/L)
Arr. #3 filtered (mg/L)
Arr. #4 filtered (mg/L)
Arr. #5 filtered (mg/L)
40 1.2 ND ND ND ND ND 80 1.3 ND ND ND ND ND 120 1.2 ND ND ND ND ND
ND = Non-Detect = <0.1 mg/L total iron
Table 6 - Iron Test Results in % Iron Removal for Lab Experiment at RWSSSP
Volume of raw water treated (L)
Raw water
(mg/L)
Arr. #1 % Fe
removal
Arr. #2 % Fe
removal
Arr. #3 % Fe
removal
Arr. #4 % Fe
removal
Arr. #5 % Fe
removal 40 1.2 >92 >92 >92 >92 >92 80 1.3 >92 >92 >92 >92 >92 120 1.2 >92 >92 >92 >92 >92
Discussion of Results
Iron removal is very high. All filtered samples contained non-detectable levels of iron
(i.e. <0.1 mg/L). This result is very encouraging for two reasons. First, because arsenic
is tightly bound to iron surface, if iron is found in the filtered water, then it is very likely
that arsenic will also be found. Therefore, complete iron removal is desirable. Second,
iron gives color and odor to water. The USEPA and WHO drinking water guidelines for
iron are both 0.3 mg/L71. Although higher iron content does not lead to adverse health
effect in absence of arsenic, water with >0.3 mg/L iron may be aesthetically
objectionable to the consumer.
Flow Rate Results
Five flow rate measurements were taken for each sampling time. The average of the five
measurements are shown in Table 7, Table 8 and Figure 30.

The Arsenic Biosand Filter Project Section 6: Lab Experiments at RWSSSP
41
Table 7 - Flow Rate Results for the Lab Experiments at RWSSSP
Volume of raw water
treated (L)*
Arr. #1 flow rate
(L/hr)
Arr. #2 flow rate
(L/hr)
Arr. #3 flow rate
(L/hr)
Arr. #4 flow rate
(L/hr)
Arr. #5 flow rate
(L/hr) 15 54 63 75 71 69 60 51 52 68 75 36 100 52 42 60 66 18 140 50 31 56 64 10
* Volume of raw water treated: refers to the actual volume of water that was filtered and that exited the outlet. It does not include water that was still inside the filter or in the diffuser box.
Figure 30 - Flow Rate as a Function of Volume of Water Treated
Table 8 - % Change in Flow Rate over the Duration of the Experiments
Arr. #1 Arr. #2 Arr. #3 Arr. #4 Arr. #5
% Decrease in flow rate * 7 51 25 10 86 * Calculated by comparing the flow rate at 15 L volume of raw water treated and that at 140 L volume of raw water treated.
Discussion of Results
In general, each filter arrangement had a very high initial flow rate, ranging from 54 to 75
L/hr. One of the reasons for these high initially flow rates is that the sand layers in newly
installed filters were loose, and therefore had high porosity (i.e. void space). Over time,
0
10
20
30
40
50
60
70
80
0 20 40 60 80 100 120 140 160Volume of water treated (L)
Ave
rage
flow
rate
whe
n fu
ll (L
/hr)
Arrangement #1Arrangement #2Arrangement #3Arrangement #4Arrangement #5

The Arsenic Biosand Filter Project Section 6: Lab Experiments at RWSSSP
42
sand compaction occurred, which reduced the porosity and decreased the flow rate.
Another explanation for the high flow rates, especially when compared to a similar
plastic laboratory models (flow rate about 20 L/hr), is that the fine sand used in the
concrete filter is not as fine as the sand used in the plastic model of the filter. High flow
rate is beneficial to the users; because that means that they do not need to wait a long
time to obtain water. On the other hand, high flow rate may reduce the contact time
between the raw water and the iron nails. Arsenic removal efficiency may be reduced.
Important insight into filter performance can be gained by comparing the flow rate results
for the different filter arrangements. For arrangement #1 (control), the flow rate
decreased very slightly over the experimental period, from 54 L/hr to 50 L/hr (7%). This
decrease could be attributed to sand compaction, as well as to clogging of the filter from
the sand, dust, and iron particles in the raw water. There was no addition of iron nails, so
iron particules did not contribute to clogging. For all other filter arrangements, the
decrease in flow rate exceeds 7%, and is assumed to be the direct result of the arsenic
removal unit (i.e. the iron nails).
For arrangement #2 (coagulation/flocculation), the flow rate decreased by 51%. Of this
51%, 44% is considered to be due to the coagulation/flocculation pre-treatment process.
It was observed that only about half of the flocs settled to the bottom of the bucket, even
after the recommended 30-minutes wait. The other half of the flocs were suspended or
floated on the water surface. When the supernatant was poured into the ABF, some of
the unsettled flocs entered the ABF. Over the course of the experiment, these flocs
accumulated on top of the fine sand layer in the ABF, leading to filter clogging.
For filter arrangement #3 (high quality iron nails), the drop in flow rate was moderate, at
25%. Of the 25%, 18% could be attributed to the arsenic removal unit (i.e. high quality
iron nails). It was observed that these iron nails rusted rapidly. Upon contact with water,
the nails started to oxidize almost instantaneously. It was also observed that the polyester
cloth could trap only large sand, iron, and dust particles in the raw water. The cloth was
much less effective to trap smaller-sized iron particles. As a result, most iron particles

The Arsenic Biosand Filter Project Section 6: Lab Experiments at RWSSSP
43
were deposited on top of the fine sand layer. After the experiments, a thin layer of
orange iron rust particles could be seen on top of the sand (Figure 31).
Figure 31 - Iron Rust Deposit on Top of the Fine Sand Layer
For filter arrangement #4 (medium quality iron nails), the drop in flow rate was minimal,
at 10%. Of the 10%, only 3% could be attributed to the arsenic removal unit (i.e.
medium quality iron nails). As for the high quality iron nails, it was observed that these
medium nails rusted very rapidly. Upon contact with water, the nails were oxidized
almost instantaneously. It was also observed that the polyester cloth could only trap large
sand, iron, and dust particles in the raw water. The cloth was much less effective to trap
smaller-sized iron rust. As a result, most iron particles were deposited on top of the fine
sand layer. After the course of the experiments, a thin layer of orange iron rust particles
could also be easily seen.
For filter arrangement #5 (double bucket setup), the flow rate were the worst, with an
86% drop over the course of the experiment. Of the 86% drop in flow rate, 79% could be
attributed to the arsenic removal unit setup. It was observed that the fine sand layer in the
lower diffuser bucket was quickly clogged up with iron particles. A thorough wash of the
sand in the lower diffuser bucket could clean up the clog, but this procedure was not easy.
Part of the sand was usually lost during each wash. In addition, this procedure would
have to be performed quite frequently. Therefore, this filter arrangement was not
recommended for further study.

The Arsenic Biosand Filter Project Section 6: Lab Experiments at RWSSSP
44
6.2.2 Additional Experiments
Additional Experiment 1 – Arsenic and Iron Results
Arsenic and iron concentrations of the supernatant are compared to that of the raw water
as shown in Table 9.
Table 9 - Additional Experiment 1 Results
Raw water
Supernatant Change
Total arsenic (µg/L)
900 500 44% decrease
Total iron (mg/L)
1.2 3.4 180% increase
Discussion of Results
This experiment shows that the coagulation/flocculation process removed less than half
of the total arsenic in the raw water. One explanation for the poor arsenic removal is
incomplete precipitation, probably due to poor mixing and settling regime. A mixing and
settling time of 30 minutes may be insufficient. However, Hwang’s work on the optimal
mixing and settling regime for ENPHO’s powder shows that the incremental
improvement in arsenic removal by lengthening the mixing-settling time is insignificant,
therefore not worth the effort. Moreover, even a 30-minutes mixing-settling time may be
too inconvenient for villagers to use.
A second explanation for the poor arsenic removal is insufficient arsenic oxidation. Of
the two major oxidation states of inorganic arsenic, namely As(III) and As(V), As(V)
occur as negatively charged H2AsO4- or HAsO4
2- species at normal groundwater pH of 6-
8, while As(III) occur as neutral H3AsO3 species at pH below 9.272. Many studies have
indicated that the coagulation/flocculation process, in which arsenic binds or adsorbs on
coagulant flocs, depends on the charge on the arsenic species. Generally, negatively
charged species, such as As(V), are removed more readily than neutral species, such as
As(III). For this reason, oxidation of As(III) to As(V) may be necessary in order to
effectively remove arsenic from water sources that contain high concentrations of

The Arsenic Biosand Filter Project Section 6: Lab Experiments at RWSSSP
45
As(III)73,74,75,76. An arsenic speciation study by Tommy Ngai in January 2002, in which
he surveyed over 40 tubewells in the Nawalparasi and Rupandehi Districts of Nepal,
found that on average 79% of all inorganic arsenic was in the As(III) oxidation state.
Only 21% was in the As(V) oxidation state. Unless the majority of the As(III) is
effectively oxidized by the calcium hypochlorite contained in the ENPHO powder during
the 30 minutes mixing/settling, these As(III) may be unlikely to be removed by the
coagulation/flocculation process. Therefore, high arsenic concentration remained in the
supernatant.
Additional Experiment 2 – Arsenic and Iron Results
Arsenic and iron concentrations for the post-diffuser sample are compared to that of the
raw water as shown in Table 10.
Table 10 - Additional Experiment 2 Results
Raw water
After diffuser
Change
Total arsenic (mg/L)
900 800 11% decrease
Total iron (mg/L)
1.2 3.6 200% increase
Discussion of Results
The experiment shows that only a small percentage of the total arsenic in the influent is
adsorbed onto the iron nails in the metal diffuser box. The majority of arsenic apparently
bypasses the iron nails and enters the fine sand layer below the diffuser. A hypothesis is
established to explain this phenomenon.
First, the iron nails’ surface is oxidized upon exposure to water and air. As a result, ferric
hydroxide is formed on the iron nails’ surface. Second, when arsenic contaminated water
passes through the iron nails bed, arsenic is quickly adsorbed to the ferric hydroxide
surface. Thus in theory, very low concentrations of arsenic should be found in the
effluent. However, iron hydroxide particles are constantly exfoliated (“peeled-off”) from

The Arsenic Biosand Filter Project Section 6: Lab Experiments at RWSSSP
46
the iron nails, i.e. they break off into smaller particles. This exfoliation is probably due to
the weak structural strength of rusted iron, and/or the scouring action of the passing
water, and/or other mechanisms. These exfoliated iron hydroxide particles are loaded
with arsenic. The mesh size of the polyester cloth is too large to block these small iron-
arsenic particles from escaping the diffuser box and entering the fine sand layer below.
As a result, high arsenic level was detected in the post-diffuser sample.
One implication of this hypothesis is that the constant exfoliation of iron nails would
expose the inner, unoxidized parts of the iron nails. This is highly desirable because the
more ferric hydroxide formed, the higher the arsenic adsorption capacity of these iron
nails. Arsenic breakthrough would occur when the surface of all iron nails would be
saturated with arsenic, and the exfoliation process would not keep generating sufficient
amounts of ferric hydroxide to adsorb arsenic. More research is required to test the
validity of this hypothesis.
Additional Experiment 3 – Arsenic and Iron Results
Raw water and a post-diffuser sample of filter arrangement #5 (double bucket setup)
were collected and tested. Results are shown in Table 11.
Table 11 - Additional Experiment 3 Results
Raw water
After diffuser
Change
Total arsenic (µg/L)
900 150 83% decrease
Total iron (mg/L)
1.2 0.2 83% decrease
Discussion of Results
Unlike the previous two experiments, the arsenic removal unit in this arrangement
actually removes a significant amount of arsenic. The above-mentioned hypothesis still
pertains; however, the reason why significant amount of arsenic was removed in this
arrangement but not in the previous (83% compared to 11%) is that there is an additional

The Arsenic Biosand Filter Project Section 6: Lab Experiments at RWSSSP
47
sand layer in this arrangement. Arsenic-loaded iron particles are trapped by the sand
layer in the bottom bucket. Nevertheless, it seems that the 25 mm sand layer in the lower
bucket was insufficiently deep to effectively trap all iron particles. A small amount of
iron particles was able to pass through the sand layer and exit the diffuser. This may
explain the presence of arsenic in the post-diffuser water.
6.2.5 Summary of the Laboratory Experiments at RWSSSP Results
A summary table of the laboratory results is shown in Table 12.
Table 12 - Summary of the Lab Experiments at RWSSSP
Arr. #1 Arr. #2 Arr. #3 Arr. #4 Arr. #5
Arsenic removal excellent excellent excellent excellent excellent
Iron removal excellent excellent excellent excellent excellent
Flow rate decrease minimal high moderate low very high
Recommended for continued study
yes no yes yes no
The conclusion of the laboratory experiments portion of the study is that filter
arrangements #1 (control), #3 (high quality iron nails), and #4 (medium quality iron
nails) should be studied further. These arrangements have excellent arsenic and iron
removal efficiency, as well as minimal to moderate decrease in flow rate over time.
Serious flaws were found in arrangements #2 and #5, which were thus rejected for further
study. For example, for arrangement #2, the 30-minutes wait can be cumbersome for
some users, and the coagulation powder may not be readily available in many rural
villages. Arrangement #5 has an unacceptably slow flow rate.
Arrangement #1 and #3 were chosen to be used in the pilot study at Sarawal and Devdaha
VDC. The reason why Arrangement #3 was chosen over Arrangement #4 in the pilot
study is that ENPHO highly recommended the high quality iron nails over the medium
quality iron nails based on their studies77. Nevertheless, the choice of iron nails should
be further investigated in another study.

The Arsenic Biosand Filter Project Section 7: Pilot Study in Sarawal & Devdaha
48
7. PILOT STUDY IN SARAWAL AND DEVDAHA VILLAGE
DEVELOPMENT COMMITTEES (VDCS) – SEPTEMBER 2002 TO
JANUARY 2003
7.1 Pilot Study Overview
A pilot study was set up by Tommy Ngai in September-October 2002, in collaboration
with RWSSSP. The filters were monitored by RWSSSP starting October 2002, until
Tommy Ngai’s team returned in December 2002. Table 13 shows the five stages of the
pilot study. There are two main purposes to the pilot study program. The first purpose is
to determine the long-term technical performance of the ABF, such as arsenic removal
efficiency, pathogen removal efficiency, iron removal efficiency, and flow rate, and to
modify design to improve performance. The second purpose is to investigate the social
acceptability of ABF, and to modify design according to users’ feedback. Results of the
pilot study are discussed in Section 7.2.
Table 13 - Five Stages of the ABF Pilot Study
Stages Time Description
1. Installation Sep-Oct 2002 Installed 10 ABFs in two villages 2. Monitoring by RWSSSP Oct-Dec 2002 Tested arsenic and H2S P/A bi-weekly 3. Monitoring by Tommy Ngai and Sophie Walewijk
Dec-Jan 2002 Measured arsenic, iron, total coliform, E. Coli, flowrate
4. ABF Modifications and New Design
Jan 2002 Develop new design, upgraded/re-installed all ABFs
5. Education Workshop Jan 2002 Demonstrated installation, operation, and maintenance procedures
7.1.1 Installation
Tommy Ngai and RWSSSP traveled to two arsenic-affected villages (Goini in Sarawal
VDC and Mandangram in Devdaha VDC) in late September to inspect the local drinking
water situation. Ten households were selected on the basis of high arsenic level in their
drinking water. Each household was asked if they would like to participate in a pilot

The Arsenic Biosand Filter Project Section 7: Pilot Study in Sarawal & Devdaha
49
study to evaluate the performance of a new water filter. They were informed that the
ABF are experimental and are not guaranteed to remove arsenic, iron and bacteria. All
ten households agreed to participate, partly because they currently do not have any
satisfactory alternative to their poor quality drinking water. Even if the filters were to
perform poorly, they would still be better off with the filters than with their existing
conditions. They also understood that their ABF is not free of charge. At the end of the
pilot study, they would need to pay a nominal fee if they wish to keep their ABF. Refer
to Appendix I for more details regarding the use of human subjects in scientific study.
A total of 10 ABFs were installed on September 30, 2002 and October 3, 2002 (
Figure 32, Figure 33, Figure 34, Figure 35) following the installation procedure described
earlier in Section 4.4. Seven ABFs were installed in the village of Goini, and three ABFs
were installed in the village of Mandangram. Tommy Ngai demonstrated the installation,
operation and maintenance procedure to both the men and women of each household. A
simple pamphlet in Nepali was handed out to remind each household about the ABF
operation and maintenance procedures. Four members of the RWSSSP staff, namely
Bhim Parajuli, Umesh Sharma, Devi Wagle, and Tula Bhattrai, were trained on filter
installation, operation and maintenance.
Sarawal
In Sarawal, there were three different setups among the seven installed filters. The first
setup contained no iron nails. The second setup contained 1.25 kg of high quality shoe
tack nails. The third setup contained 2.5 kg of high quality shoe tack nails. The quantity
of iron nails in each filter was determined from arsenic (using ITS Field Kit) and iron test
(using HACH Test Kit) results of the raw well water, analyzed before the filter
installation. These results are discussed in Section 7.2 (Table 20). In general, households
with high iron and low arsenic in their water were given the filter arrangement #1 (i.e. no
iron nails). Households with moderate iron and moderate arsenic in their water were
given the second setup (i.e. 1.25 kg iron nails). Households with very high arsenic

The Arsenic Biosand Filter Project Section 7: Pilot Study in Sarawal & Devdaha
50
concentration in their water were given 2.5 kg of iron nails*. Table 14 shows the selected
households in Sarawal and their respective ABF setup.
Figure 32 - Unloading New ABFs in Sarawal
Figure 33 - Filter Maintenance Demonstration at Harinarayan Chaudhary’s House
Figure 34 - Gathering Material to Install an ABF
Figure 35 - Shivsagar Yadav’s Tubewell, ABF, and House
* It should be noted that all ENPHO’s ABF (except one) were given 5 kg of iron nails regardless of arsenic or iron concentration of the well water. The only exception was that one ABF contains no iron nails because total iron concentration in the well water was very high.

The Arsenic Biosand Filter Project Section 7: Pilot Study in Sarawal & Devdaha
51
The quantity of sand and gravel in each of the filters followed the description stated in
Section 4.1, Figure 3. The only exception is that the size coarse sand used in four of the
filters (Nirahi Psd. Chaudhary, Harinarayan Chaudhary, Chintamani Chaudhary, and
Ramashankar Yadav), was too large. Tommy Ngai and RWSSSP staff forgot to bring
coarse sand on the day of filter installation. The coarse sand was obtained from the
village as a replacement. The other three filters (Harilal Yadav, Ramashankar Yadav,
Shivsager Yadav) were installed on the next day, and had the correct-sized coarse sand.
Appendix B shows the full details of each households’ filter, including location,
installation/re-installation dates, etc.
Table 14 - Sarawal: Selected Households and Their ABF Setup
Contact Person Iron nails given (kg)
Installation date
Nirahi Psd. Chaudhary 1.25 Sep 30, 2002 Harinarayan Chaudhary 1.25 Sep 30, 2002 Chintamani Chaudhary 0 Sep 30, 2002 Ramashankar Yadav* 2.5 Sep 30, 2002
Harilal Yadav 0 Oct 1, 2002 Ramashankar Yadav* 1.25 Oct 1, 2002
Shivsager Yadav 2.5 Oct 1, 2002 *Ramashankar Yadav has two houses, and collects water from two different wells
Devdaha
Three households were selected in the village of Mandangram, Devdaha VDC,
Rupandehi District. Each household collected their water from the same source, the Nar
B. Gurung’s tubewell. According to RWSSSP, this well is known to contain one of the
highest arsenic concentrations of all wells in Nepal (2600 µg/L), based on RWSSSP’s
data. This is also the tubewell that was used in the Laboratory Experiments at RWSSSP
(Section 6). The well water was tested for arsenic (using ITS Kit) and iron (using HACH
Test Kit) concentration before installing the filters. Although the arsenic concentration is
high, only 1.25 kg, rather than 2.5 kg of high quality shoe tack iron nails was included in
each filter. It was done to minimize the concern about filter clogging, as observed in the

The Arsenic Biosand Filter Project Section 7: Pilot Study in Sarawal & Devdaha
52
laboratory experiments. It was believed that the problem of clogging could be reduced if
less iron nails were given. The three filters were installed identically.
Because of the lower amount of iron nails in these ABFs, it was suspected that arsenic
breakthrough might occur. The RWSSSP staff was told to carefully monitor these three
ABFs. In case of arsenic breakthrough, RWSSSP staff was instructed to immediately
remove the old iron nails, and to replace with 2.5 kg of new iron nails. Table 15 shows
the selected household filters in Devdaha, and their ABF setup.
The quantity of sand and gravel in each of the filters followed the description stated in
Section 4.1, Figure 3. Correct sand sizes were used.
Appendix B shows the full details of each of these households, including location,
installation/re-installation dates, etc.
Table 15 - Devdaha: Selected Households and Their ABF Setup
Contact Person Iron nails given (kg)
Installation date
Nar B. Gurung 1.25 Oct 2, 2002 Durga Kumari 1.25 Oct 2, 2002 Tek B. Hamal 1.25 Oct 2, 2002
7.1.2 Monitoring by RWSSSP
Upon completion of the filters installation, Tommy Ngai asked RWSSSP to monitor the
filter performance until his team returned in December 2002. Six of the seven ABFs at
Sarawal were monitored bi-monthly by RWSSSP from October 2002 to December 2002.
The seventh ABF, Shivsager Yadav’s ABF, was not monitored because his well was not
constructed by RWSSSP, and was therefore outside of RWSSSP’s responsibility. In
Devdaha, all three ABFs were monitored bi-weekly. Arsenic in the raw water and
filtered water was measured with a field test kit distributed by ENPHO, and sometimes a
split sample was taken to be analyzed at ENPHO’s laboratory with their British made

The Arsenic Biosand Filter Project Section 7: Pilot Study in Sarawal & Devdaha
53
SOLAAR 969 AA spectrometer. H2S Bacteria Presence/Absence Tests supplied by
ENPHO were used to test for pathogens.
Three of the seven ABFs in Sarawal were decommissioned by RWSSSP in mid-
December 2002 because their monitoring results showed arsenic in the filtered water
were above the Nepali guideline of 50 µg/L.
7.1.3 Monitoring by Tommy Ngai and Sophie Walewijk
Tommy Ngai and Sophie Walewijk traveled to Nepal to from December 2002 to January
2003 to follow-up on the monitoring of the 10 filters installed (Figure 36, Figure 37,
Figure 38) and to make necessary changes to the design. They also visited six additional
ABFs installed by ENPHO staff between September 2002 and October 2002, which were
constructed following the same design concept of Tommy Ngai. Refer to Appendix F for
a description of the ENPHO ABF design and pilot study. Table 16 lists the 16
households visited, and the sampling dates. Because three of the filters were
decommissioned, pre and post-filtration water samples were collected and tested from the
remaining 13 locations. The water quality parameters tested were:
• Total arsenic
• Total iron
• Total coliform
• E. Coli
Flow rate was measured for each filter as well (Figure 37). The users were also asked
how often they cleaned the filter (if ever), and whether clogging was a serious issue.
Table 16 shows the 16 total locations.

The Arsenic Biosand Filter Project Section 7: Pilot Study in Sarawal & Devdaha
54
Figure 36 - Tommy Ngai and Sophie Walewijk Collecting a Tubewell Water Sample at Phagu N. Chaudhary’s Tubewell in Tilakpur VDC.
Figure 37 - Sophie Walewijk Measuring Flow Rate at Tek Bahadur Hamal’s ABF in Devdaha VDC.
Figure 38 - Analyzing Samples at the RWSSSP Guesthouse at Night

The Arsenic Biosand Filter Project Section 7: Pilot Study in Sarawal & Devdaha
55
Table 16 - ABF Households Visited by Tommy Ngai and Sophie Walewijk
Contact person Sampling date As + Fe Bacteria Flow rate
Nirahi Psd. Chaudhary Dec 31, 2002 Y
Y Y
Harinarayan Chaudhary decommissioned Y Y (well only)
N
Chintamani Chaudhary decommissioned Y N N Ramashankar Yadav decommissioned Y Y
(well only) N
Harilal Yadav Dec 31, 2002 & Jan 5, 2003
Y Y
Y
Ramashankar Yadav Dec 31, 2002 Y Y Y Shivsager Yadav Dec 31, 2002 Y Y Y
Nir B. Gurung Dec 29, 2002 Y N Y Durga Kumari Dec 29, 2002 Y N Y Tek B. Hamal Dec 29, 2002 Y N Y
Nim Chaudhary Jan 3, 2003 Y Y Y Min Chaudhary Jan 3, 2003 Y Y Y
Phakir Kami Jan 3, 2003 Y Y Y Phagu N. Chaudhary Jan 3, 2003 Y Y Y
Lila B. Pun Jan 3, 2003 Y Y Y Bhanu Primary School Jan 3, 2003 Y Y Y
In addition, Tommy Ngai and Sophie Walewijk visited five 3-Kolshi filters installed by
RWSSSP in the village of Rangai in Dubiya VDC, Kapilvastu district in the summer of
2002. Two filters were damaged at the time of visit. Arsenic, iron, and flow rate for the
remaining three filters were analyzed. Table 17 shows the 3 locations. Refer to
Appendix G for a description of the RWSSSP 3-Kolshi Filter design and pilot study.
Table 17 - 3-Kolshi Filters Visited by Tommy Ngai and Sophie Walewijk
Contact person Sampling date As + Fe Bacteria Flow rate
Aitwari Chaudhary Jan 1, 2003 Y N Y Sukhal Chaudhary Jan 1, 2003 Y N Y Jhinku Chaudhary Jan 1, 2003 Y N Y

The Arsenic Biosand Filter Project Section 7: Pilot Study in Sarawal & Devdaha
56
7.1.4 ABF Modifications and New Design
Based on the lessons learned from the pilot study monitoring, as well as feedback from
ENPHO, RWSSSP staffs and users, the design for ABF was slightly modified by Tommy
Ngai and Sophie Walewijk on January 3, 2003. The new design contains 5 kg of the high
quality shoe tack iron nails, instead of 0, 1.25 or 2.5 kg of nails in the old design. The
brick chips in the old design were found unnecessary as well (Secton 7.2.3). This new
design is expected to be more robust and user-friendly, and to achieve higher arsenic
removal efficiency. This is the design shown in Section 4.1 Figure 3.
All ABFs were immediately upgraded to the new setup by Tommy Ngai’s team with the
help of RWSSSP staff on January 4, 2003. The upgrade consisted of two parts – first, to
remove the brick chips and to increase the amount of iron nails in the existing filters to 5
kg; and second, to reinstall the three decommissioned filters. The procedures are
described below.
Add Iron Nails
The procedure to add nails was simple. First, the brick chips in the diffuser box were
removed and discarded. Second, new nails were washed to rid of dust. Then the new
nails were added to the diffuser box. The amount of iron nails added was determined
based on the difference between the existing amount of iron nails and 5 kg.
Re-installation
After RWSSSP emptied the three non-performing filters, all filter components were left
at the users’ home. When Tommy Ngai’s team and RWSSSP returned to re-install the
filters, some of the previous components were reused. The reused material included the
concrete filter casing, metal diffuser box, polyester cloth, iron nails, filter lid, gravel, and
fine sand. New coarse sand, Piyush solutions, and additional iron nails were brought to
the villages for re-installation. The empty filters were first flushed with water to get rid
of dirt and dust. Gravel, coarse sand, fine sand, and iron nails were also washed. A total
of 5 kg of iron nails was used. Then, the filters were filled-in with the filter media, layer
by layer, following the filter installation instructions described in Section 4.4.2.

The Arsenic Biosand Filter Project Section 7: Pilot Study in Sarawal & Devdaha
57
Due to insufficient time, arsenic was tested for only two of the filters that only received
additional iron nails (Table 18), and for the three re-installed filters (Table 19). Samples
were collected after one day of use. Appendix B shows the full details of each of these
households, including location, installation/re-installation dates, monitoring results, etc.
Table 18 - Two ABFs Selected for Arsenic Analysis after Having Added More Nails
Contact person Sampling date
As Bacteria Flow rate
Nirahi Psd. Chaudhary Jan 5, 2003 Y N N Ramashankar Yadav Jan 5, 2003 Y N N
Table 19 - Arsenic Analysis for the three Re-installed ABFs.
Contact person Sampling date
As Bacteria Flow rate
Harinarayan Chaudhary Jan 5, 2003 Y N Y Ramashankar Yadav Jan 5, 2003 Y N Y Ramashankar Yadav Jan 5, 2003 Y N Y
7.1.5 Education Workshop
On January 5, 2003, Tommy Ngai and Sophie Walewijk, Umesh Sharma and Bhim
Parajuli from RWSSSP and a staff member from ENPHO organized a village-wide
education workshop at the village of Goini in Sarawal VDC, Nawalparasi District
(Figure 39 and Figure 40). Health issues related to arsenic contamination were presented
by RWSSSP and ENPHO staff. The ABF filter setup, operation, and maintenance were
also demonstrated by Tommy Ngai and Sophie Walewijk. Posters on how to detect skin
diseases resulting from arsenic exposure were posted on the walls of the village, and
handouts on how to clean the filters were distributed to each household present at the
workshop (see Appendix D).

The Arsenic Biosand Filter Project Section 7: Pilot Study in Sarawal & Devdaha
58
Figure 39 - Tommy Ngai Explaining How to Operate the ABF
Figure 40 - Umesh Sharma Translating Sophie Walewijk’s Explanations on How to Clean the ABF

The Arsenic Biosand Filter Project Section 7: Pilot Study in Sarawal & Devdaha
59
7.2 Results and Discussion
7.2.1 Installation
Sarawal
Water from each of the seven selected tubewells in Sarawal was tested for arsenic and
iron by Tommy Ngai before installing the filters. Results are shown in Table 20.
Table 20 - Sarawal Tubewell Test Results, and Quantity of Iron Nails
Contact Person As (µg/L) Fe (mg/L) Nails quantity (kg)
Nirahi Psd. Chaudhary 350 1.4 1.25 Harinarayan Chaudhary 400 1.3 1.25 Chintamani Chaudhary 350 1.6 0 Ramashankar Yadav 500 1.5 2.5 Harilal Yadav 250 2.3 0 Ramashankar Yadav 400 1.4 1.25 Shivsager Yadav 900 1.4 2.5
Devdaha
Water from Nar Bir Gurung’s tubewell in Devdaha, which serves three households, was
tested for arsenic and iron by Tommy Ngai before installing the filters. Results are
shown in Table 21.
Table 21 - Devdaha Tubewell Test Results, and Quantity of Iron Nails
Contact Person As (µg/L) Fe (mg/L) Nails quantity (kg)
Nar Bir Gurung 860 1.3 1.25 Durga Kumari 860 1.3 1.25 Tek B. Hamal 860 1.3 1.25
7.2.2 Monitoring Results by RWSSSP
Arsenic and H2S Bacteria Results
Summary results for the nine households are shown in Table 22 to Table 31. Detailed
results are in Appendix B.

The Arsenic Biosand Filter Project Section 7: Pilot Study in Sarawal & Devdaha
60
Table 22 - Monitoring Results for Nirahi Chaudhary, Iron Nails = 1.25 kg
H2S P/A Arsenic by ENPHO test kit Arsenic by ENPHO lab Sampling date raw filtered raw
(µg/L) filtered (µg/L)
% removal
raw (µg/L)
filtered (µg/L)
% removal
Oct 3, 2002 A P 20 ND >75 186 ND >97 Oct 20, 2002 N/A N/A 200 ND >98 N/A N/A N/A Nov 14, 2002 A P N/A ND N/A 363 5 99 Nov 29, 2002 N/A P 10 ND >50 N/A N/A N/A Dec 16, 2002 A A 300 ND >98 213 30 86
Average= 80 Average= 94 ND = Non-Detected =< 5 µg/L arsenic N/A = Not tested A = Absence, P = Presence
Table 23 - Monitoring Results for Harinarayan Chaudhary, Iron Nails = 1.25 kg.
H2S P/A Arsenic by ENPHO test kit Arsenic by ENPHO lab Sampling date raw filtered raw
(µg/L) filtered (µg/L)
% removal
raw (µg/L)
filtered (µg/L)
% removal
Oct 3, 2002 A P 60 ND >92 237 7 97 Oct 20, 2002 N/A N/A 250 100 60 N/A N/A N/A Nov 14, 2002 N/A A N/A 300 N/A 401 140 65 Nov 29, 2002 N/A A 320 80 75 N/A N/A N/A Dec 16, 2002 A A 350 200 43 372 137 63
Average= 67 Average= 75 ND = Non-Detected =< 5 µg/L arsenic N/A = Not tested A = Absence, P = Presence
Table 24 - Monitoring Results for Chintamani Chaudhary, Iron Nails = 0 kg
H2S P/A Arsenic by ENPHO test kit Arsenic by ENPHO lab Sampling date raw filtered raw
(µg/L) filtered (µg/L)
% removal
raw (µg/L)
filtered (µg/L)
% removal
Oct 3, 2002 P P 90 ND >94 156 24 85 Oct 20, 2002 N/A N/A 250 150 40 N/A N/A N/A Nov 14, 2002 N/A P 150 ND >97 456 227 50 Nov 29, 2002 N/A P 350 70 80 N/A N/A N/A Dec 16, 2002 A P 400 400 0 288 207 28
Average= 62 Average= 54 ND = Non-Detected =< 5 µg/L arsenic N/A = Not tested A = Absence, P = Presence

The Arsenic Biosand Filter Project Section 7: Pilot Study in Sarawal & Devdaha
61
Table 25 - Monitoring Results for Ramashankar Yadav, Iron Nails = 2.5 kg
H2S P/A Arsenic by ENPHO test kit Arsenic by ENPHO lab Sampling date raw filtered raw
(µg/L) filtered (µg/L)
% removal
raw (µg/L)
filtered (µg/L)
% removal
Oct 3, 2002 P P 70 ND >93 298 ND >98 Oct 20, 2002 N/A N/A 350 150 57 N/A N/A N/A Nov 14, 2002 A A 50 450 0.0* 616 160 74 Nov 29, 2002 N/A P 180 60 67 N/A N/A N/A Dec 16, 2002 P P 450 350 22 N/A N/A N/A
Average= 48 Average= 86 ND = Non-Detected =< 5 µg/L arsenic N/A = Not tested A = Absence, P = Presence * Note: For Nov 14, 2002 arsenic test kit results, the filtered water contained 450 µg/L As, which is higher than the raw water 50 µg/L As. This may be due to incorrect analytical procedure, or errors associated with the test kit accuracy.
Table 26 - Monitoring Results for Harilal Yadav, Iron Nails = 0 kg
H2S P/A Arsenic by ENPHO test kit Arsenic by ENPHO lab Sampling date raw filtered raw
(µg/L) filtered (µg/L)
% removal
raw (µg/L)
filtered (µg/L)
% removal
Oct 3, 2002 P P 60 ND >92 67 ND >93 Oct 20, 2002 N/A N/A 200 ND >98 N/A N/A N/A Nov 14, 2002 N/A A N/A ND N/A 272 9 97 Nov 29, 2002 N/A P 320 10 >97 N/A N/A N/A
Average= 95 Average= 95 ND = Non-Detected =< 5 µg/L arsenic N/A = Not tested A = Absence, P = Presence * Note: During the Dec 16, 2002 monitoring round, no water sample was taken because Harilal Yadav has stopped using the filter. He claimed that the filter did not remove arsenic.
Table 27 - Monitoring Results for Ramashankar Yadav, Iron Nails = 1.25 kg
H2S P/A Arsenic by ENPHO test kit Arsenic by ENPHO lab Sampling date raw filtered raw
(µg/L) filtered (µg/L)
% removal
raw (µg/L)
filtered (µg/L)
% removal
Oct 3, 2002 A P 20 ND >75 163 ND >97 Oct 20, 2002 N/A N/A 200 ND >98 N/A N/A N/A Nov 14, 2002 A P N/A ND N/A 451 ND 99 Nov 29, 2002 N/A P 10 ND >50 N/A N/A N/A Dec 16, 2002 A A 300 ND >98 377 24 94
Average= 80 Average= 97 ND = Non-Detected =< 5 µg/L arsenic N/A = Not tested A = Absence, P = Presence

The Arsenic Biosand Filter Project Section 7: Pilot Study in Sarawal & Devdaha
62
Table 28 - Monitoring Results for Nir Bir Gurung, Iron Nails = 1.25 kg
H2S P/A Arsenic by ENPHO test kit Arsenic by ENPHO lab Sampling date raw filtered raw
(µg/L) filtered (µg/L)
% removal
raw (µg/L)
filtered (µg/L)
% removal
Oct 3, 2002 P A 150 ND >97 N/A N/A N/A Oct 20, 2002 N/A N/A 250 ND >98 N/A N/A N/A Nov 14, 2002 N/A N/A N/A ND N/A 848 9 99 Nov 29, 2002 N/A P >500 ND >99 N/A N/A N/A Dec 16, 2002 P A >500 ND >99 936 12 99
Average= >98 Average= 99 ND = Non-Detected =< 5 µg/L arsenic N/A = Not tested A = Absence, P = Presence
Table 29 - Monitoring Results for Durga Kumari, Iron Nails = 1.25 kg
H2S P/A Arsenic by ENPHO test kit Arsenic by ENPHO lab Sampling
date raw filtered raw (µg/L)
filtered (µg/L)
% removal
raw (µg/L)
filtered (µg/L)
% removal
Oct 3, 2002 P P 150 ND >97 N/A N/A N/A Oct 20, 2002 N/A N/A 250 ND >98 N/A N/A N/A Nov 14, 2002 N/A A N/A ND N/A 848 ND >99 Nov 29, 2002 N/A P >500 ND >99 N/A N/A N/A Dec 16, 2002 P A >500 ND >99 N/A N/A N/A
Average= >98 Average= >99 ND = Non-Detected =< 5 µg/L arsenic N/A = Not tested A = Absence, P = Presence
Table 30 - Monitoring Results for Tek B. Hamal, Iron Nails = 1.25 kg
H2S P/A Arsenic by ENPHO test kit Arsenic by ENPHO lab Sampling
date raw filtered raw (µg/L)
filtered (µg/L)
% removal
raw (µg/L)
filtered (µg/L)
% removal
Oct 3, 2002 P P 150 ND >97 N/A N/A N/A Oct 20, 2002 N/A N/A 250 ND >98 N/A N/A N/A Nov 14, 2002 N/A A N/A ND N/A 848 ND >99 Nov 29, 2002 N/A P >500 ND >99 N/A N/A N/A Dec 16, 2002 P A >500 ND >99 N/A N/A N/A
Average= >98 Average= >99 ND = Non-Detected =< 5 µg/L arsenic N/A = Not tested A = Absence, P = Presence

The Arsenic Biosand Filter Project Section 7: Pilot Study in Sarawal & Devdaha
63
Table 31 - Summary of RWSSSP Monitoring Results for Arsenic
Contact person Iron nails (kg)
Average % As removal (ENPHO test kit)
Average % As removal (ENPHO
lab) Nirahi Psd. Chaudhary 1.25 80 94 Harinarayan Chaudhary 1.25 67 75 Chintamani Chaudhary 0 62 54 Ramashankar Yadav 2.5 48 86 Harilal Yadav 0 95 95 Ramashankar Yadav 1.25 80 97 Nar Bir Gurung 1.25 >98 >99 Durga Kumari 1.25 >98 >99 Tek B. Hamal 1.25 >98 >99 Average= 81 89
Note: ND = Non-Detected =< 5 µg/L arsenic N/A = Not tested
Discussion of Results - Arsenic
The arsenic removal efficiency of the nine arsenic biosand filters was excellent. The
average removal is 81% according to the field test kit results, and 89% according to the
more accurate laboratory analytical results. Refer to Appendix H for a discussion
comparing the accuracy of various arsenic test methods.
At the time of the first monitoring round on October 3, 2002, all ABFs were able to
produce filtered water that met the Nepali arsenic drinking water guideline (50 µg/L As).
The filtered water contained between non-detectable level of arsenic (<5 µg/L) and 24
µg/L. These results in the regular biosand filters without the arsenic unit (Chintamani
Chaudhary and Harilal Yadav) confirmed with the laboratory experimental observation
that the regular biosand filter had some arsenic removal capacity. At the time of the
second monitoring round on October 20, 2002, three ABFs were not reducing arsenic
concentrations to an acceptable level. The ENPHO test kit results showed that the
filtered water of Harinarayan Chaudhary had 100 µg/L As, Chintamani Chaudhary had
150 µg/L As, and Ramashankar Yadav had 150 µg/L As. The same three ABFs were
also non-performing at the time of the third monitoring round on Nov 14, 2002. The

The Arsenic Biosand Filter Project Section 7: Pilot Study in Sarawal & Devdaha
64
ENPHO test kit and laboratory results showed that the filtered water of Harinarayan
Chaudhary had 300 µg/L As (field test kit) and 140 µg/L As (lab), Chintamani
Chaudhary had < 5 µg/L As (field test kit) and 227 µg/L As (lab), while Ramashankar
Yadav had 450 µg/L (field test kit) and 160 µg/L As (lab). These three ABFs continued
to show unacceptable levels of arsenic in the filtered water for all other monitoring
rounds as well. These three ABFs were decommissioned by RWSSSP just prior to the
arrival of Tommy Ngai and Sophie Walewijk in late December 2002. These three ABFs
were emptied of their content. On the other hand, all other ABFs worked well, with
arsenic concentrations in the filtered water never exceeding the Nepali guideline of 50
µg/L.
Inappropriate installation procedure is believed to be a major cause for the poor arsenic
removal in the three decommissioned filters. These three filters, plus Nirahi Chaudhary’s
filter, were installed on September 30, 2002. During that day, Tommy Ngai and the
RWSSSP staff forgot to bring coarse sand. Sand was obtained from the village as a
replacement. However, the sand size was not correct. The size of the coarse sand was
too large.
One important observation from the above data is that high iron concentration in the
influent water may enhance arsenic removal. For example, Chintamani Chaudhary’s
filter had no iron nails. The presence of arsenic in the filtered water at the time of the
second monitoring round shows that arsenic breakthrough had occurred. The natural
arsenic removal capacity of the regular biosand filter (BSF) had been exhausted. This
suggested that iron nails may be necessary in his filter. In contrast, Harilal Yadav’s filter,
which is another ABF without iron nails, had excellent arsenic removal for all monitoring
rounds. Apparently the natural arsenic removal capacity of Harilal Yadav’s ABF was not
yet exhausted. One explanation is that his tubewell water contained more iron (2.3 mg/L)
compared to Chintamani’s water (1.6 mg/L). The higher iron content in the raw water
could have adsorbed and subsequently removed more arsenic from the raw water. If the
raw water contains sufficiently high iron, then iron nails may not be necessary to remove
arsenic.

The Arsenic Biosand Filter Project Section 7: Pilot Study in Sarawal & Devdaha
65
Wide fluctuations in the raw water arsenic concentrations for a same tubewell were
observed. For example, laboratory analysis showed that Chintamani Chaudhary’s
tubewell contained 156 µg/L, 456 µg/L, and 288 µg/L of arsenic from the Oct 3, Nov 14,
and Dec 16 sampling rounds. While the fluctuation could be due to seasonal changes in
the groundwater chemistry, this is unlikely because of the shallowness of the well (55
feet). All RWSSSP tubewells were drilled to the second aquifer, which is a confined
aquifer. The groundwater chemistry in a confined aquifer is usually minimally affected
by the surface weather conditions. Therefore the change in climate may play only a
minor role with respect to the wide fluctuation in arsenic concentrations.
A more likely cause for such a wide fluctuation is inappropriate sampling techniques.
For example, the time elapsed between sample collection and laboratory analysis was
sometimes as long as a month. If the sample was not properly preserved, then the arsenic
in the sample could have settled to the bottom of the container. This would yield false
results.
In addition, inaccurate analytical technique appeared to be a problem. The ENPHO test
kit and laboratory results were frequently in disagreement. For example, in Ramashankar
Yadav’s raw tubewell water. The test kit showed 70 µg/L and 50 µg/L As on Oct 3 and
Nov 14, while the laboratory showed 298 µg/L and 616 µg/L As. The differences
between the two analytical techniques were very significant. In such cases, the ENPHO
laboratory results are taken to be more accurate. A split-sample test comparing the
arsenic test results between the ENPHO Laboratory’s SOLAAR 969 Hydride Generation
Atomic Absorption Spectrometer and the MIT Parsons Laboratory’s Perkins-Elmer
Graphic Furnace Atomic Absorption Spectrometry by Tommy Ngai in June 2002 showed
that the average difference between the two analytical methods is 31%. This is very
good. The high level of agreement between the two instrument suggested that the
ENPHO Laboratory’ arsenic results are usually dependable and accurate. Refer to
Appendix H for details on the above lab analysis comparisons.

The Arsenic Biosand Filter Project Section 7: Pilot Study in Sarawal & Devdaha
66
Discussion of Results – Pathogen
Table 32 summaries the results for RWSSSP pathogen monitoring using ENPHO’s P/A
H2S bacteria test vials.
Table 32 - Summary of RWSSSP Monitoring Results for P/A H2S bacteria
Influent Effluent Bacteria removal?
# of ABFs % of total
A A N/A 3 N/A A P No 1 20 P P No 1 20 P A Yes 3 60 Total 8 100
Note: A = Absence of H2S bacteria using ENPHO P/A H2S bacteria test vials P = Presence of H2S bacteria using ENPHO P/A H2S bacteria test vials N/A = Not applicable. Since both influent and effluent don’t have H2S bacteria, it is not possible to determine if the ABF removed bacteria. These three filters are not included in the % calculation
The P/A H2S bacteria tests results from RWSSSP monitoring showed that three of the
eight filters have indeterminate bacteria removal results because both the influent and
effluent are absence of H2S bacteria. For the remaining five filters, three (60%) were
able to remove bacteria.
The above bacteria results are not very reliable due to incorrect incubation temperatures.
The P/A test vials were incubated at ambient temperature in the RWSSSP office. The
room temperature in the summer (April to October) can be as high as 30-35°C, but drop
to as low as 10-15°C in the winter (November to March). The incubation temperature is
an important parameter affecting the accuracy of the test results. According to ENPHO,
the test vials should be maintained at temperature between 22 and 44°C for 48 hours.
Outside of this temperature range, the proper biochemical processes may not occur to
provide accurate analytical results (e.g. bacteria may be stressed thus unable to
reproduce).

The Arsenic Biosand Filter Project Section 7: Pilot Study in Sarawal & Devdaha
67
RWSSSP was advised that one way to improve the test reliability is to incubate the vials
at a constant temperature, such as using an Amy Smith incubator (see Page 25).
In addition, it should be noted that the P/A H2S bacteria test result may not correlate well
with the more accurate membrane filter technique used by Tommy Ngai’s team78,79.
Nevertheless, P/A H2S bacteria test has its merits, including low cost and simplicity of
use.
7.2.3 Monitoring Results by Tommy Ngai and Sophie Walewijk
Tommy Ngai and Sophie Walewijk visited a total of 16 households (the original 10 filters
in the pilot study plus six filters setup by ENPHO) and monitored 13 ABFs (seven of the
original 10 filters plus six by ENPHO). Three of the original 10 filters were
decommissioned by RWSSSP thus not tested. The test results and discussion for total
arsenic, total iron, total coliform, E. Coli, and flow rate are presented in the next few
sections.
Arsenic
Arsenic results are presented in Table 33. These results were obtained using the ITS
Arsenic Field Test Kit. Detailed results are in Appendix B.

The Arsenic Biosand Filter Project Section 7: Pilot Study in Sarawal & Devdaha
68
Table 33 - Arsenic Results from Tommy Ngai and Sophie Walewijk Monitoring
Note: ND = Non-Detect =< 5 µg/L As N/A = Not tested 1. For decommissioned filters, the % arsenic removal efficiency is assumed to be 25%. This is to avoid a high bias on the average % removal if these decommissioned filters are ignored in the calculation. 2. The % arsenic removal is likely to be higher than 75%, but this can only be confirmed using an arsenic test with a lower detection limit. 3. The 25% removal efficiency is obtained by Tommy Ngai using ITS Field Kit. According to the ENPHO monitoring results shown in Appendix F, the raw water and filtered water contained 241 µg/L and 6 µg/L of arsenic respectively. Therefore, the arsenic removal efficiency would be 98%, instead of 25%. Due to the inconsistency between ITS Field Kit and ENPHO Lab, this result was not included in the average % arsenic removal calculation.
Discussion of Results
Arsenic results are good. The average arsenic removal efficiency of the entire set of 16
ABFs is 75%. However, it should be noted that this value is derived from filters with
different quantity of iron nails. It is necessary to divide the 16 filters into four different
groups, according to iron nails given, in order to better understand the arsenic
performance of the different filter setup. Table 34 and Figure 41 compare the arsenic
removal efficiencies of the four groups of ABFs.
Arsenic by ITS Test Kit Contact person Iron nails quantity
(kg) Raw
(µg/L) Filtered (µg/L)
% removal
Nirahi Psd. Chaudhary 1.25 350 80 77 Harinarayan Chaudhary 1.25 Decommissioned 251 Chintamani Chaudhary 0 Decommissioned 25 Ramashankar Yadav 2.5 Decommissioned 25
Harilal Yadav 0 250 30 88 Ramashankar Yadav 1.25 400 30 93
Shivsager Yadav 2.5 900 ND >99 Nar Bir Gurung 1.25 700 300 57 Durga Kumari 1.25 700 30 96 Tek B. Hamal 1.25 700 ND >99
Nim Chaudhary 0 20 ND >752 Min Chaudhary 5 160 15 91
Phakir Kami 5 80 60 253 Phagu N. Chaudhary 5 120 ND 96
Lila B. Pun 5 60 8 87 Bhanu Primary School 5 120 ND 96
Average = 75

The Arsenic Biosand Filter Project Section 7: Pilot Study in Sarawal & Devdaha
69
Table 34 - Arsenic Removal Efficiencies for Different ABF Setups
Iron nails quantity (kg)
# of ABFs
% As removal for each ABF Average % As removal
0 3 Decommissioned1, 88, >75 63 1.25 6 77, decommissioned, 93, 57, 96, >99 75 2.5 2 decommissioned, >99 62 5 5 91, 252, 96, 87, 96 93
Note: The average % arsenic removal for each group was calculated assuming the decommissioned ABFs have 25% arsenic removal efficiency. 1. For decommissioned filters, the % arsenic removal efficiency is assumed to be 25%. This is to avoid a high bias on average % removal if these decommissioned filters are ignored in the calculation. 2. The 25% removal efficiency is obtained by Tommy Ngai using ITS Field Kit. According to the ENPHO monitoring results (Appendix F), the raw water and filtered water contained 241 µg/L and 6 µg/L of arsenic respectively. Therefore, the arsenic removal efficiency would be 98%, instead of 25%. Due to the inconsistency between ITS Field Kit and ENPHO Lab, this result was not included in the average % arsenic removal calculation.
Figure 41 - Arsenic Removal Efficiencies for Different ABF Setups
It is found that the group of ABFs with 5 kg iron nails has the highest average arsenic
removal efficiency, at 93%, which agrees with the ENPHO monitoring results of 95%
(Appendix F). In addition, the % arsenic removal for the individual filters within 5 kg
0102030405060708090
100
0 1.25 2.5 5
Iron Nails Quantity in ABF (kg)
Aver
age
% A
rsen
ic R
emov
al
(3)(6)
(2)
(4)
(bracketed numbers denote number of filters used in the calculations)

The Arsenic Biosand Filter Project Section 7: Pilot Study in Sarawal & Devdaha
70
iron nails group is more consistent, with smaller fluctuations. This is in contrast with the
ABFs in other groups, of which some of the ABFs had to be decommissioned due to
unacceptable performance. One reason that the 5 kg group has the best performance is
because of the thickest iron nails bed depth. The thick bed depth allows the longest
contact time between the arsenic contaminated water and the iron nails, which leads to
the highest arsenic adsorption. Another reason is that the pouring of water can easily
disperses the iron nails to the sides, especially when the iron nail bed depth is thin (Figure
42). This condition leads to short-circuiting because the “hole” in the iron bed allowed
raw water to pass through the arsenic removal unit without ever contacting any iron nails.
This condition was observed on several occasions for ABFs with small quantities of iron
nails, but to a lesser degree in the 5 kg iron nails group.
Figure 42 - Dispersed Iron Nails
The brick chips did not accomplish their function of protecting the underlying iron nails
from dispersion by the inlet water. On the contrary, the brick chips hindered the user to
easily redistribute (re-flatten) the dispersed iron nails. When the metal diffuser box
contains only iron nails with no brick chips, the user can easily redistribute (re-flatten)
the iron nails by removing the box and vigorously shaking the box. Another way of
protecting the underlying iron nails is to place another diffuser above the nails. Further
investigation is recommended to determine which of the above two methods (vigorous
shaking periodically vs. additional diffuser) is more socially acceptable and technically
superior.

The Arsenic Biosand Filter Project Section 7: Pilot Study in Sarawal & Devdaha
71
The third reason why the 5 kg iron nails ABFs have the highest arsenic removal
efficiency is that the arsenic concentration for raw water corresponding to these filters are
in general lower than for the other ABFs. The five 5 kg iron nails ABFs received raw
water with arsenic concentration between 60 to 160 µg/L (according to ITS field kit),
where as all other ABFs received raw water with higher arsenic concentration, between
250 to 900 µg/L* (according to ITS field kit). The higher raw water arsenic concentration
can exhaust the arsenic adsorption capacity of the iron nails more quickly, leading to
breakthrough of arsenic. Nevertheless, excellent arsenic removal efficiency was
observed for some of the high arsenic water (e.g. Shivsager Yadav’s 900 µg/L As water
was treated to non-detected; and Tek B. Hamal’s 700 µg/L As water was treated to non-
detected). This shows that the ABF can achieve a high degree of arsenic removal.
It should be noted that the ABF installed at Bhanu Primary School by ENPHO is the first
ABF in Nepal. It was installed on September 5, 2002 by ENPHO, who followed the
installation instruction given by Tommy Ngai in July 2002. The ABF at the school is
currently serving about 200 students, as opposed to other filters that are serving one
family. Because of the earliest installation date and the highest number of users, this
ABF has probably treated more water than any other ABFs in Nepal. The fact that this
filter can still remove a high percentage of arsenic suggests that the iron nails may have a
very high arsenic adsorption capacity.
In conclusion, it was found that the average arsenic removal efficiency for the four filters
with 5 kg of iron nails was 93%, which is consistent with ENPHO’s results of 95%
(Appendix F). It is therefore recommended that each new filter should contain about 5 kg
of iron nails. Less nails may result in poorer arsenic removal performance, more nails
may make the box too heavy to handle. It was also found that brick chips do not protect
the iron nails from dispersion when water is forcefully poured into the diffuser. One
solution is to add a diffuser plate on top of the iron nails.
* These five ABF were installed by ENPHO. 5 kg of iron nails were in each of these filters regardless of influent arsenic concentration

The Arsenic Biosand Filter Project Section 7: Pilot Study in Sarawal & Devdaha
72
Iron
Iron test results using HACH filed test kit are shown in Table 35. Detailed results are in
Appendix B.
Table 35 - Iron Results from Tommy Ngai and Sophie Walewijk Monitoring
Note: ND = Non-Detect =<0.1 mg/L N/A = Not tested
Discussion of Results
Iron removal for all ABFs is excellent, at >93%*. All filtered water contain non-detect
level of iron (<0.1 mg/L). This is desirable because effective iron removal is a key pre-
requisite for effective arsenic removal. As discussed previously, the surface of iron
particles is usually loaded with arsenic, because of the chemical interactions between
arsenic and ferric hydroxide. Therefore, if iron is found in the filtered water, then arsenic
is very likely to be found as well. * The % iron removal is likely to be higher than 93%, but this can only be confirmed using an iron test with a lower detection limit.
Iron by HACH Test Kit Contact person Iron nails quantity
(kg) Raw
(µg/L) Filtered (µg/L)
% removal
Nirahi Psd. Chaudhary 1.25 1.4 ND >93 Harinarayan Chaudhary 1.25 Decommissioned N/A Chintamani Chaudhary 0 Decommissioned N/A Ramashankar Yadav 2.5 Decommissioned N/A
Harilal Yadav 0 2.3 ND >96 Ramashankar Yadav 1.25 1.4 ND >93
Shivsager Yadav 2.5 1.4 ND >93 Nar Bir Gurung 1.25 1.3 ND >92 Durga Kumari 1.25 1.3 ND >92 Tek B. Hamal 1.25 1.3 ND >92
Nim Chaudhary 0 3.8 ND >97 Min Chaudhary 5 1.1 ND >91
Phakir Kami 5 2.3 ND >96 Phagu N. Chaudhary 5 1.4 ND >93
Lila B. Pun 5 1.2 ND >92 Bhanu Primary School 5 1.1 ND >90
Average = >93*

The Arsenic Biosand Filter Project Section 7: Pilot Study in Sarawal & Devdaha
73
The converse may not be true. If no iron is found in the filtered water, this does not mean
that arsenic is not found: it may or may not be found. For example, if all the iron
particles are saturated with arsenic, any excess arsenic will pass through the filter into the
drinking water. There is not enough iron to adsorb all arsenic. As a result, the filtered
water may not contain iron, but arsenic would still be found in the filtered water. One
implication of this observation is that the use of iron test as a replacement for arsenic test
may not be appropriate. It is true that if iron is detected in the filtered water, arsenic will
likely be found in the sample. But, if no iron is detected in the filtered samples, this does
not mean that there is no arsenic. In this case, no information about arsenic content in the
filtered water can be deducted.
An important observation was made at the household of Nim Chaudhary in Tilakpur
VDC. Iron concentration was found to be very high in the well water, at 3.8 mg/L
(according to HACH test kit). Because of the high iron content, ENPHO staff decided
not to add any iron nails in the diffuser box. Yet, after three months the filtered water
still did not contain any detectable level of arsenic. This observation confirms the earlier
suggestion that high iron in the raw water is beneficial for arsenic removal.
During a site visit, Phagu N. Chaudhary of Tilakpur VDC indicated that the main reason
for his household to continue to use the ABF is its excellent iron removal. According to
him, high iron in his water used to taint his cooked rice with a brown color. Because the
ABF water contains no iron, his family now enjoys white rice very much. One important
implication is that effective iron removal can produce clean-looking and good-tasting
water, which in turns encourage the users to continue to use the filter.
Similar findings were observed in a survey study in Nepal by Paynter in 200180. In his
study, the 89% who reported "liking" the biosand filter (BSF) addressed more immediate, direct
improvements in their water. Particularly they noted that the water tasted better, there was plenty of
water, the BSF always removed the seasonal cloudiness and that the filtered water was cool. It seems
likely that it is these "non-essential" parameters - taste, amount, clarity, and temperature - that will

The Arsenic Biosand Filter Project Section 7: Pilot Study in Sarawal & Devdaha
74
determine the acceptance of the BSF project. Because the health effects of the BSF may take months
or years to become apparent - and that's assuming the BSF is being used properly - the non-essential
parameters will greatly influence the user's decision to continue using the BSF. Of course, there are
other parameters to consider in behavioral change, particularly the additional labor involved. Put
another way, if a person has been using the BSF properly for half a year and doesn't feel any healthier,
that person will be more likely to continue using the BSF if there are other, more tangible benefits that
are not essential to the improvement of his health.
The conclusion for this iron study is that all ABFs were able to produce water with non-
detectable amount of iron (i.e. < 0.1 mg/L). This is favorable for the social acceptability
of the ABFs because iron-free water is aesthetically pleasing to some users.
E. Coli and Total coliforms
Results of E. Coli and total coliform tests, analyzed using Millipore M-Coliblue24
membrane filtration method are shown in Table 36. Detailed results are in Appendix B.
Table 36 - E. Coli and Total Coliforms Results from Tommy Ngai and Sophie Walewijk Monitoring
Total Coliform by M-Coliblue24
E. Coli by M-Coliblue24
Contact person Raw1 (CFU
/100mL)
Filtered (CFU
/100mL)
% Removal
Raw (CFU
/100mL)
Filtered (CFU
/100mL)
% Removal
Nirahi Chaudhary 3 0 >99 3 0 >99 Harinarayan Chaudhary 0 Decom2 N/A 0 Decom N/A
Ramashankar Yadav 160 Decom N/A 11 Decom N/A Harilal Yadav 340 52 853 30 1 973
Ramashankar Yadav 25 1 96 4 0 >99 Shivsager Yadav 0 0 N/A4 0 0 N/A4
Nim N. Chaudhary 450 49 89 60 9 85 Min N. Chaudhary 100 163 05 16 0 >99
Phakir Kami 100 15 85 0 5 0 Phagu N. Chaudhary 34 42 0 1 406 0
Lila B. Pun 49 47 4 4 0 >99 Bhanu Primary School 61 22 64 2 18 0
Average = 58 Average = 64 Note:

The Arsenic Biosand Filter Project Section 7: Pilot Study in Sarawal & Devdaha
75
1. Some of the raw water samples were analyzed at a 1:1 dilution (i.e. no dilution) and a 1:10 dilution. In those cases, the results derived from the dilution factor that gave the more accurate plate count (i.e. counts preferably between 20-80) are reported in this table. 2. Decom = Decommissioned ABF. Because no water sample could be collected for these wells, these filters are not included in the average % removal calculations. 3. Harilal Yadav’s water samples were analyzed a first time on December 31, 2002 and yielded more bacteria in the filtered water than in the raw water. The results were judged doubtful, and a second analysis was performed on January 5, 2003. The new results yielded a 84.7 % removal of the total Coliforms and a 97 % removal of E. Coli. 4. Because the raw water and filtered water of Shivsager Yadav was free of total coliform and E Coli, there is no value for % removal for either indicator. The filter is not included in the average % removal calculations. 5. For those filters with a higher count in the filtered water than raw water, the % removal is assumed to be zero in the average % removal calculations. 6. The blue dots representing E. Coli colonies were on the extremity of the plate, making the results doubtful.
Discussion of Results
On average, the total coliform removal and E. Coli removal was reasonable, at 58% and
64% respectively. A possible reason for not achieving even better performance could be
that the biofilm has not ripened. As a result, biological removal processes were not at
work to remove the influent total coliform and E. Coli. Unfavorable water chemistry
such as insufficient nutrient may affect the normal biofilm growth.
A second reason for the moderate performance is that the sand layer could have been
disturbed by the users just before the monitoring by Tommy Ngai and Sophie Walewijk.
This would have damaged the biofilm, and would have allowed bacteria to pass through
the filter.
Improvements in pathogen removal can also be attained by optimizing the filter
installation procedure. In a 2002 study in Lumbini by Stroller and Coan, it was found
that sand preparation method for a biosand filter had a significant impact on its
subsequent bacterial removal efficiency81. On-going research at MIT by Pincus and
others seeks to clarify some of these issues82.

The Arsenic Biosand Filter Project Section 7: Pilot Study in Sarawal & Devdaha
76
It is interesting to note that the ABFs installed in Sarawal VDC performed superior to the
ABFs installed in Tilakpur or Panchanager VDCs (Table 37 and Figure 43).
Table 37 - Comparing Total Coliform and E. Coli Average % Removal for ABFs in Different VDCs
VDC # of ABFs Average % Total Coliform
Removal
Average % E. Coli
Removal Sarawal 3 93 98 Tilakpur 4 44 46
Panchanager 2 34 50
Figure 43 - Comparing Total Coliform and E. Coli Average % Removal for ABFs in Different VDCs
The filters in Sarawal removed an average of 93% and 98% total coliforms and E. Coli
respectively. On the other hand, the average total coliform and E. Coli removal was 44%
and 46% respectively in Tilakpur, and 34% and 50% respectively in Panchanager. It is
speculated that discrepancy in the pathogen removal efficiencies may be attributed to the
different ABF setups. The ABFs in Sarawal contained relatively less iron nails than
those in Tilakpur and Panchanager. Perhaps the higher quantity of iron nails in the
Tilakpur and Panchanager ABFs altered the influent water in a way (e.g. higher iron
������������������������������������������������������������������������������������������������������������������������������������
������������������������������������������������������������������������
������������������������������������������������������������������������
0
20
40
60
80
100
120
Sarawal Tilakpur Panchanager
VDC
% R
emov
al
Total Coliform�������� E. Coli
(bracketed numbers denote number of filters used in the calculations)
(3)
(4) (2)

The Arsenic Biosand Filter Project Section 7: Pilot Study in Sarawal & Devdaha
77
concentration) that hindered the normal biofilm ripening, or reduces the biofilm’s ability
to remove influent pathogens. Perhaps the higher quantity of iron nails in those ABFs
resulted in more frequent filter clogging such that the users must clean the filter more
frequently, leading to disturbance to the otherwise healthy biofilm layer. Table 38
compares the iron nails quantity to total coliform and E. Coli removal. It should be noted
that the above speculations must be carefully investigated to establish any validity. The
authors are unaware of any link between iron concentration in water and biofilm health.
This speculative relationship is unlike the clear relationships between the presence of iron
in the water and arsenic removal. Therefore it is unreasonable to calculate average total
coliform and E. Coli removal efficiency of the ABF based only on the filters that
contained 5 kg of nails. It is proposed that the calculated average total coliform and E.
Coli removal efficiency be calculated from all filters.
Table 38 - Comparing Iron Nails Quantity to Total Coliform and E. Coli % Removal
Total Coliform and E. Coli by M-Coliblue24 Iron nails quantity (kg)
# of ABFs Average % Total
Coliform Removal Average %
E. Coli Removal 0 2 87 91
1.25 2 98 99 5 5 31 40
Another explanation for the significantly different pathogen removal efficiency between
the filters in Sarawal and those in Tilakpur and Panchanager is because of different water
composition. The water chemistry at Sarawal may be more favorable for coliform
removal than the water at Tilakpur and Panchanager. For example, microorganism
attachment to sand particles is pH dependent83. It should be noted that Tilakpur and
Panchanager are next to each other, while Sarawal is about 10 km to the south of
Panchanager. Due to the proximity between Tilakpur and Panchanager, the groundwater
chemistry between these two VDCs may be more similar to each other than the
groundwater from Sarawal. This may explain the equally poor performance from
Tilakpur and Panchanager. However, without further investigation on the local
groundwater characteristics disparity, this above explanation cannot be supported.

The Arsenic Biosand Filter Project Section 7: Pilot Study in Sarawal & Devdaha
78
It should be noted that pathogen removal results can be easily tampered by inappropriate
water handling practices. For example, the filter outlet can be easily contaminated if a
kid touches it with his/her dirty hand. In this case, the filtered water sample may show
high bacteria counts (i.e. low removal efficiency) even though the filter itself may have
excellent pathogen removal efficiency. Therefore, user education on basic health and
hygiene is crucial to the proper use of the filter to bring improved health benefits.
The conclusion for the pathogen monitoring by Tommy Ngai and Sophie Walewijk is
that the ABFs removed a reasonable percent of total coliform (58%) and E. Coli (64%).
The three ABFs in Sarawal VDC had far superior removal efficiency than those in
Tilakpur and Panchanager VDCs.
Flow rate
Flow rate results are shown in Table 39.
Table 39 - Estimated Maximum Flow Rate for Each Filter
Contact person Flow rate (L/hr)
Flow rate measured when
diffuser was
Calculated max flow rate when full
(L/hr) Nirahi Psd. Chaudhary 14 3/4 full 19 Harinarayan Chaudhary Decom1 N/A N/A Chintamani Chaudhary Decom N/A N/A Ramashankar Yadav Decom N/A N/A Harilal Yadav 23 3/4 full 31 Ramashankar Yadav Not
measured N/A N/A
Shivsager Yadav 24 1/2 full 48 Nar Bir Gurung 13 1/3 full 39 Durga Kumari 28 Completely full 28 Tek B. Hamal 4 1/3 full 12 Nim Chaudhary 11 1/3 full 33 Min Chaudhary 8 1/3 full 24 Phakir Kami 9 1/3 full 27 Phagu N. Chaudhary 7 1/3 full 21 Lila B. Pun 20 1/2 full 40 Bhanu Primary School 9 1/3 full 27
Average= 14 29

The Arsenic Biosand Filter Project Section 7: Pilot Study in Sarawal & Devdaha
79
Note: 1. Decom = Decommissioned filters. Because no flow rate could be measured, these filters are excluded in the calculations of average flow rate. 2. The diffuser box can hold about 20 L of water.
Discussion of Results
Darcy’s Law governs the flow rate of the filter. That is, the filter flow rate is
proportional to the water level above the outlet pipe. The higher the water level, the
higher the hydraulic head, which leads to higher Darcy flux through the sand, which in
turn means higher flow rate84. In the ABF design, the hydraulic head above the outlet
pipe can be roughly approximated by the water level in the diffuser box. Therefore,
under identical conditions, an ABF with a full diffuser box will have a flow rate three
times higher than a ABF with a diffuser box 1/3 full. Table 39 shows the estimated
maximum flow rate for each ABF from flow rate measurements, and assuming a full
diffuser box.
In general, the ABFs have high flow rates. If we assume the flow rate measurements
taken during the actual site visit represent the actual conditions under normal use, then
the average flow rates experienced by the users would ranged from 4 L/hr to 28 L/hr,
with an average of 14 L/hr. However, some users may realize that a higher flow rate
could be achieved by filling up the diffuser to the top with water. This would correspond
to the calculated maximum flow conditions. The calculated maximum flow rates ranged
from 12 L/hr to 48 L/hr, with an average maximum flow rate of 29 L/hr.
High flow rates are desirable for many reasons. First, a filter with a high flow rate
provides sufficient water for a large household. According to RWSSSP’s household
survey data, many of the above households receiving ABFs have up to 15 people per
household (See Appendix B). Second, users do not need to wait a long time before
obtaining safe drinking water. When the flow rate is excessively low, say less than 1
L/hr, the users have a tendency to skip filtration85. Finally, if the flow rate is high enough
to support more than one family, then the cost of the filter can be shared among several
households.

The Arsenic Biosand Filter Project Section 7: Pilot Study in Sarawal & Devdaha
80
A 2003 study by the World Health Organization (WHO) concluded that a minimum of
7.5 L of safe water per capita per day is necessary to meet basic consumption and basic
hygiene needs86. Consider a large household of 15 members sharing one ABF. The
minimum daily needs according to WHO is 7.5 X 15 = 112.5 L. To meet this need, a
filter must be able to deliver 9.4 L/hr of water for 12 hours daily. Comparing this figure
with the values obtained in Table 39. It is found that most of the above ABFs are able to
deliver at least 9.4 L/hr under normal use conditions, thus sufficient to supply for the
entire family of 15. Moreover, if the users fill up the diffuser box beyond the normal use
level (typically between 1/3 to 1/2 full), then even higher flow rates can be obtained. It
should be noted at none of the above ABFs has a calculated maximum flow rate less than
9.4 L/hr. Therefore, all of the ABFs should be capable of providing sufficient amount of
safe water for a large family, satisfying the minimum WHO recommendations.
During Tommy Ngai and Sophie Walewijk’s site visit in December, they talked to the
ABF users to learn about the users’ perception on the filter clogging issue. Of the 12
ABFs monitored, only a few had been cleaned by the users because of low flow rates.
This suggests that most of the ABFs continued to deliver sufficient water quantity after
three months of operation. When the users were asked to demonstrate the
cleaning/maintenance technique, the users were often able to accurately perform the
operations.
From the laboratory experiments results shown in Table 7, the flow rate decreased with
respect to volume of raw water treated. When those results are compared to the flow
rates shown in Table 39, it is revealed that the rate of flow rate decrease is less severe
during the pilot study than during the laboratory experiments. For example, if we linearly
extrapolate the decrease in the maximum flow rate for arrangement #3 over the duration
of the pilot study, then the maximum flow rate after three months would drop to merely
0.13 L/hr. Fortunately, the lowest measured flow rate was 12 L/hr, not 0.13 L/hr, and the
user confirmed that the ABF had never been cleaned since installation. Therefore, this
pilot study shows that extrapolation of the flow rate trends from the laboratory

The Arsenic Biosand Filter Project Section 7: Pilot Study in Sarawal & Devdaha
81
experiments might underestimate the actual flow rate. This result is encouraging because
it shows that clogging is not as serious a problem as initially predicted.
Based on the flow rates study, it is concluded that most of the ABFs is capable of
providing sufficient quantity of water for a household of 15 members, based on the latest
WHO research study recommendation of 7.5 L/capita/day. The average flow rate under
normal conditions is 14 L/hr. Higher flow rate may possible if the users fill up the
diffuser to the top with water. The calculated average maximum flow rate is 29 L/hr.
In addition, clogging of the filter is not a serious problem.
3-Kolshi Filters - Arsenic and Flowrate Results
Arsenic and flow rate results of the three operational 3-Kolshi filters are shown in Table
40. The other two 3-Kolshi filters observed were damaged during the visit.
Table 40 - Arsenic, Iron, and Flow Rate Results for 3-Kolshi Filters from Tommy Ngai and Sophie Walewijk Monitoring
Arsenic by ITS Kit Iron by HACH Kit Contact
person Raw (µg/L)
Filtered (µg/L)
% removal
Raw (mg/L)
Filtered (mg/L)
% removal
Flow rate
(L/hr) Aitwari Chaudhary
40 ND >88 1.0 ND >90 3
Sukhal Chaudhary
40 ND >88 1.0 ND >90 0.3
Jhinhu Chaudhary
40 15 65 1.0 ND >90 3
Average= 80 >90 2.1 Note: All three households use the same well ND = Non-Detect =< 5 µg/L As or =<0.1 mg/L Fe
Discussion of Results
The arsenic removal was good, with an average of 80% removal*. Iron removal was also
good, with an average of 90% removal. According to RWSSSP, the price is also good, at
* The 80% removal efficiency may seem low. The filter may be able to remove a higher percentage of arsenic. However, we cannot verify this because the inlet arsenic concentration (40 µg/L) is too low, approaching the detection limit of the test kit.

The Arsenic Biosand Filter Project Section 7: Pilot Study in Sarawal & Devdaha
82
about 400 Nepali Rupees (approx. US$ 5.1). However, before recommending this filter
for implementation, other issues such as durability and social acceptability should be
considered. For example, RWSSSP installed five 3-Kolshi filters in this remote village
approximately six months prior to the visit by Tommy Ngai and Sophie Walewijk. Of
the original five filters, two were damaged, thus not in use. One was leaking from a
crack, and had not been repaired. The other filter had the inlet water flowing straight
through the filter media without any restriction, resulting in water not treated at all. The
observations suggest that 3-Kolshi filters are fragile. To ensure that the users in remote
villages can continue to drink filtered water when their filters are damaged, either the
users should be taught how to repair a broken filter, or new kolshis should be available at
nearby markets.
Another major drawback of the 3-Kolshi filters is the low flow rate. Two of the filters
treated water at 3 L/hr, and the third filter treated water at only 0.3 L/hr. For example, if
the WHO’s recommendation of 7.5 L/capita/day is to be met for a family of 15 people,
then 7.5 X 15 = 112.5 L/day is required. However, a filter with a flow rate of 3 L/hr can
only deliver a maximum of 72 L per day even if operated continuously for 24 hours a
day. Therefore the 3-Kolshi filter is unable to meet the basic consumption and hygiene
needs to protect health according to WHO87. Moreover, the filter at 0.3 L/hr operated at
24 hours a day can only produce 7.2 L/day. This is not even enough for one person. The
users indicated that flow rate is indeed a major problem. They wanted to have a second,
or even a third filter to cover their water needs. In comparison, the ABF has an average
of 14 L/hr flow rate.
7.2.4 ABF Modification and New Design
Based on the lessons learned from the pilot study monitoring, as well as feedback from
ENPHO, RWSSSP staffs and users, the new design for ABF was completed by Tommy
Ngai and Sophie Walewijk on January 3, 2003. The new design contained 5 kg of the
high quality shoe tack iron nails, and no brick chips. Refer to Section 4.1 Figure 3 for a
diagram on the new design.

The Arsenic Biosand Filter Project Section 7: Pilot Study in Sarawal & Devdaha
83
All ABFs were immediately upgraded in Sarawal to the new setup on January 4. Due to
insufficient time, total arsenic was tested for only two of the upgraded setups (Table 41),
and for the three reinstalled filters (Table 42). All arsenic results were based on analysis
by Tommy Ngai performed in Jan 2003.
Table 41 - Arsenic Removal Improvement from Pre-upgraded to Upgraded Design
Arsenic by ITS Kit Pre-upgraded Upgraded
Contact person
Raw (µg/L)
Filtered (µg/L)
% removal
Raw (µg/L)
Filtered (µg/L)
% removal
Nirahi Psd. Chaudhary 350 80 77 75 6 92 Ramashankar Yadav 400 30 93 200 8 96 Average= 85 Average= 94
Table 42 - Arsenic Removal Improvement after Re-installation
Arsenic by ITS Kit Re-installed
Contact person
Raw (µg/L)
Filtered (µg/L)
% removal
Harinarayan Chaudhary 400 80 80 Chintamani Chaudhary 350 40 89 Ramashnkar Yadav 700 50 93 Average= 87
Discussion of Results
An arsenic removal comparison between the pre-upgraded filters and the upgraded filters
shows that the additional iron nails contributed to immediate additional arsenic removal.
For Nirahi Chaudhary, the arsenic removal efficiency increased from 77% to 92%. For
Ramashnkar Yadav, the arsenic removal efficiency increased from 93% to 96%.
Although no arsenic test was performed on the other ABFs, it is anticipated that all other
ABFs would experienced an increase in arsenic removal efficiency as well.
The arsenic removal efficiency of the three re-installed filters seems promising. The
three filters shown in Table 42 had been decommissioned by RWSSSP in mid-December

The Arsenic Biosand Filter Project Section 7: Pilot Study in Sarawal & Devdaha
84
due to unacceptable arsenic removal capability. For the three filters, the new design
yielded an average arsenic removal efficiency of 87%.
7.2.5 Education Workshop Observations
During the monitoring visits, Tommy Ngai and Sophie Walewijk found that some
villagers have misconceptions on drinking water and health. For example, one user
indicated that drinking clean-looking filtered water, as opposed to his discolored raw
tubewell water (high iron), can turn his skin whiter, which is highly desirable from the
Nepali’s perspective on beauty. In addition, a social acceptability study of three different
arsenic technologies (i.e. ABF, 3-Kolshi, 2-Kolshi) conducted by George Tabbal88 in
Nepal in 2003 indicated that villagers in general know what arsenic is, but do not make
the link between arsenic and its effects on their personal health. It is therefore very
important to educate people about arsenic, its health effects, and its removal from the
water they drink.
Forty-five adult villagers (both men and women) attended the education workshop
conducted by RWSSSP, ENPHO, and Tommy Ngai’s team on January 3, 2003. The
attendees asked very pertinent questions. Lots of children were also present. One of the
main questions asked was why RWSSSP only installed seven filters in the village if
arsenic is such a health threat.
During the educational workshop and the monitoring visits, Tommy Ngai and Sophie
Walewijk observed that the villagers take good care of their filters and generally follow
the distributed operating and cleaning instructions. Written instructions in Nepali -
prepared by Tommy Ngai, Sophie Walewijk and translated by RWSSSP - were
distributed to the villagers during the education workshop. (Refer to Appendix D for a
copy of the written instructions)
Most users like the high flow rate, simple operation, minimal maintenance, as well as the
clean-looking and good-tasting water coming out of the filters. They think the filter is a
durable, permanent solution to their drinking water problems.

The Arsenic Biosand Filter Project Section 7: Pilot Study in Sarawal & Devdaha
85
7.2.6 Summary of the Pilot Study Results
Important insights into the ABF performance were learned from the pilot study. The
most important findings are restated here:
• 5 kg of iron nails is the recommended amount to be used in the metal diffuser
box. Less nails may result in poorer arsenic removal performance, more nails
may make the box too heavy to handle. The iron nails should be tested to ensure
they do not leach out harmful substances to the water.
• Results based on ABFs with 5 kg of iron (Table 34) show an arsenic removal of
93%.
• Average results based on all ABFs show total coliform removal at 58% (Table
36), E. Coli removal at 64% (Table 36), iron removal at >93% (Table 35), and
flow rate at 14 L/hr (Table 39). A longer study is recommended to confirm these
values.
• The main arsenic removal mechanism appears to be arsenic adsorption to ferric
hydroxide particles. The arsenic adsorption capacity of the iron nails should be
investigated to determine the frequency of iron nails replacement.
• High iron concentration in raw water is beneficial as it may aid arsenic removal.
• Bacteria removal efficiency can be improved by further investigating optimal
sand preparation, installation, operation, and cleaning methods.
• The clean-looking and good-tasting filtered water resulting from an effective iron
removal is appealing to many users. While health improvements may take
months or years to appear, these favorable “observable” water qualities (e.g.
clarity, color, taste) may promote quick acceptance of the filter.
• Most users like the high flow rate, simple operation, and minimal maintenance of
the filter. They think the filter is a durable, permanent solution to their drinking
water problems.
• The clogging problem seems less severe than suggested by the laboratory study.
Even after three month without any cleaning, flow rate was still reasonably high
(Table 39) to supply sufficient quantity of water for a large family, according to a
recent WHO study on minimum water needs to stay healthy.

The Arsenic Biosand Filter Project Section 7: Pilot Study in Sarawal & Devdaha
86
• Although the 3-Kolshi filters have good arsenic and iron removal (Table 40), it is
observed that inadequate flow rate is a serious drawback. The durability and
social acceptability of the filter are other issues to consider.

The Arsenic Biosand Filter Project Section 8: Conclusions
87
8. CONCLUSIONS
The Arsenic Biosand Filter Project make a positive contribution to the growing body of
knowledge on appropriate household scale arsenic removal filters in Nepal. The ABF is
one of only three types of household arsenic removal filters tested at a pilot scale in
Nepal to date.
Results from the three-month pilot study are encouraging. The average arsenic removal
for the ABFs containing 5 kg iron nails is 93%. Total coliform and E. Coli removal for
all filters are reasonable at 58% and 64% respectively. Iron removal is excellent at
>93%. Flow rate is very high at 14 L/hr. These results are tabulated in Table 43.
Table 43 - Summary Technical Performance of ABF Pilot Study
Technical Indicator Range Average Results
Arsenic removal 87 to 96% 93% Total coliform removal 0 to >99% 58%
E. Coli removal 0 to >99% 64% Iron removal >90 to > 99% >93%
Flow rate 4 to 23 L/hr 14 L/hr
Regarding social acceptability, people like the high flow rate, simple operation, and
minimal maintenance of the filter. In addition, the clean-looking and good-tasting
filtered water is appealing. While health improvements may take months or years to
appear, these favorable “observable” water qualities (e.g. clarity, color, taste) may
promote quick acceptance of the filter. Most users think of the ABF as a very durable
and appropriate solution to arsenic and pathogens contamination.

The Arsenic Biosand Filter Project Section 9: Future Work
88
9. FUTURE WORK AND RECOMMENDATIONS
The major development stage of the ABF is completed. Several steps are proposed for
the future. They are divided into four categories – filter performance, filter cost,
implementation, and project effectiveness evaluation.
Filter Performance
It is recommended to:
• Monitor the arsenic removal of the new ABF design for another six months to
evaluate the arsenic adsorption capacity of 5 kg iron nails in order to determine
the appropriate iron nails replacement frequency.
• Test the arsenic adsorption capacity of different types of iron nails to determine
the best irons in terms of cost and performance.
• Test the composition of iron nails to ensure that no harmful substances will leach
out from the nails into the water.
• Investigate the effect on arsenic and bacterial removal if the space between the
top of the stationary water level within the filter and the bottom of the diffuser
box is reduced.*
• Investigate the possibility of adding a diffuser plate above the iron nails to protect
the nails from dispersion due to the force of the incoming water.
• Monitor the bacterial removal of the new ABF design, and study the effect of iron
nails on bacterial performance.
* Currently, the volume between the stationary water level within the filter and the bottom of the diffuser box is up to 5 L. Coincidentally, it was observed that most users pour about 5-10 L of water into the filter during each use. The influent water usually passes through the iron nails bed quickly, and accumulates in this 5 L space. It is because the resistance to water flow through the iron nails bed is much less than the resistance to water flow through the fine sand layer below. If the space (volume) between the sand layer and diffuser box is reduced, then a greater portion of the incoming 5-10 L water will remain in the diffuser box, instead of accumulating in the space below. This will increase the contact time between the influent water and the iron nails, and may improve arsenic removal. Secondly, if the space (distance) between the sand layer and diffuser box is reduced, then the disturbance to the sand layer (and possibly the bio-film) from the falling force of the incoming water may be reduced.

The Arsenic Biosand Filter Project Section 9: Future Work
89
• Study the effect of sand preparation methods on bacterial performance to
determine the optimal methods.
Filter Cost Reduction
Modifications of the filter design may reduce the filter construction cost. Possible
modifications include:
• Use cheaper iron nails (technical performance should be evaluated)
• Build the filter casing using plastic or fiber-glass, instead of concrete
• Use a plastic bucket to hold the nails, instead of a metal box.
• Teach the users how to build a filter in their homes, using bricks to construct the
filter casing.
Implementation
Some aspects to consider are:
• Cost recovery: What is users’ ability and willingness to pay? Which agency will
be responsible for collection of payment? How to minimize subsidies? What will
be the funding sources?
• Manufacturing options: What is the optimal option to produce the ABF, in terms
of materials, location and production process?
• Can we reduce implementation cost by setting up filter training workshops at
village level to teach the villagers how to construct an ABF using materials
available to them? How much flexibility is there in terms of choice of
construction materials?
• Under which social and geologic circumstances is providing an ABF necessary.
This can be answered by conducting a health-based study modeled after the WHO
health-based targets89.
Project Evaluation
The effectiveness of the project implementation should be measured frequently in order
to assess current progress and to guide future directions. Recommendations include:

The Arsenic Biosand Filter Project Section 9: Future Work
90
• Conduct a health survey pre- and post- filter implementation to evaluate the
effectiveness of the filters in improving the users’ health. Health indicators may
include diarrheal prevalence rate, and arsenic concentration in hair and nail
samples.
• Investigate the long-term usage rate of the filters. Results may be used to make
further design improvements to improve the filter’s social acceptability. This
investigation may carried similarly to the social acceptability studies conducted
by Tabbal90 and Paynter91.
Access to adequate safe drinking water is a basic human right92. It is not a privilege
available only to a selected few. Instead, it should be accessible to every single person on
our planet. Safe drinking water not only improves health, but also aids the social and
economic development of a society. Every effort should be taken to protect this right.

The Arsenic Biosand Filter Project Section 10: Team Members biography
91
10. TEAM MEMBERS BIOGRAPHY
Tommy Ngai received a Master of Engineering degree from
the Massachusetts Institute of Technology Civil and
Environmental Engineering Department. He is currently a
lecturer at MIT, assisting students of the MIT Nepal Water
Project to conduct research. He traveled to Nepal in January
2002 to study the arsenic contamination situation, and to field
test an arsenic removal technology. He returned to Nepal
two more times to carry out his ABF project. His interest in
searching for a practical solution for the arsenic problem
began with his undergraduate project on arsenic removal in
Bangladeshi groundwater. He is well informed of various
existing arsenic treatment technologies including their
strengths/weaknesses.
Sophie Walewijk is currently pursuing a Ph.D. at Stanford
University, where she received a Master of Engineering
degree in Civil and Environmental Engineering. Her interest
in finding a practical solution for the arsenic problem in rural
areas of developing countries began with her undergraduate
project on arsenic removal from Bangladeshi groundwater.
Since then, she attended talks and conferences on arsenic. At
the same time, she focused her research on bacteria. Sophie
performed preliminary experiments on the BioSand Filter at
Stanford, and traveled to Nepal in December 2002 -January
2003 to study the bacterial removal capacity of the ABF.

The Arsenic Biosand Filter Project Appendices
92
Appendices Appendix A - Description of Partner Organizations 93
Appendix B - Master Data Set of All Pilot Study Arsenic Biosand Filters 95
Appendix C - Map Showing Project Districts of Nepal 131
Appendix D1- Arsenic Biosand Filter Operating Procedure in Nepali 132
Appendix D2 - Arsenic Biosand Filter Cleaning Procedure in Nepali 133
Appendix E - Arsenic Biosand Filter Manufacturing Procedure 134
Appendix F - ENPHO Arsenic Biosand Filter Setup and Pilot Study 144
Appendix G - RWSSSP 3-Kolshi Filter Setup and Pilot Study 146
Appendix H - Comparison Between Analytical Arsenic Test Methods 149
Appendix I - Ethics of Experimental Work with Human Subjects 152

The Arsenic Biosand Filter Project Appendix A – Partner Organizations
93
APPENDIX A - DESCRIPTION OF PARTNER ORGANIZATIONS
The following organizations have kindly contributed to the Arsenic Biosand Filter Project. 1. Department of Civil and Environmental Engineering, Massachusetts Institute of Technology (MIT) Description:
The MIT Nepal Water Project was initiated by the Master of Engineering Program of the Civil and Environmental Engineering Department in 1999. The main objectives of this project are to increase awareness of water quality problems in Nepal, and to provide assistance in solving these problems. Address:
77 Massachusetts Avenue, Cambridge, Massachusetts 02139, USA Contact Person:
Susan Murcott, Lecturer and Principal Investigator of the MIT Nepal Water Project Phone number: 617-452-3442 Email: [email protected] 2. Rural Water Supply and Sanitation Support Programme (RWSSSP) Description:
RWSSSP is a programme that is run by a consultant, Plancenter Ltd, in cooperation with the government of Nepal and the government of Finland. Since its initiation in 1990, RWSSSP is working in eight districts, including six in Lumbini Zone plus Parbat and Tanahun districts. RWSSSP is currently headquartered in Butwal. Address:
Rural Water Supply and Sanitation Support Programme Nepal G.P.O. Box 12, Butwal Nepal Contact Person:
Heimo Ojanen, Team Leader Phone: +977-71-540782, +977-71-540513, +977-71-546572 Email: [email protected]

The Arsenic Biosand Filter Project Appendix A – Partner Organizations
94
3. Environment and Public Health Organization (ENPHO) Description:
ENPHO is an independent research laboratory and research institute established in Kathmandu in 1990. Their main objectives are to conduct research on public health, water, wastewater, soil, air and sound pollution; to disseminate research findings through public media; and to develop and promote appropriate technologies on water and wastewater treatment, solid waste management, and air emission control. Address:
Environment and Public Health Organization Thapagaon, New Baneshwor, Kathmandu, Nepal Contact Person:
Roshan Shrestha, Executive Chairperson Phone: +977-1-491052, +977-1-491376, +977-1-493188 Email: [email protected], [email protected] 4. International Buddhist Society (IBS) Description:
IBS is a non-governmental organization (NGO) established in Lumbini, Nepal to provide health assistance to 19 surrounding villages. Besides distributing biosand filters to the villagers, IBS also conduct health education workshops for the rural population, as well as operating a free health clinic. Address:
International Buddhist Society Buddha Nagar, Lumbini, Nepal Contact Person:
Bhikkhu Maitri, Founder Chairman Phone: +977-71-80133 Email: [email protected], [email protected]

The Arsenic Biosand Filter Project Appendix B – Master Data Set
95
APPENDIX B - MASTER DATA SET OF ALL PILOT STUDY
ARSENIC BIOSAND FILTERS
This appendix includes data for each of the pilot study ABFs visited by Tommy Ngai’s
team. There are 16 ABFs in total (10 installed by Tommy Ngai + 6 installed by
ENPHO). In addition, data for three 3-Kolshi filters is included at the end.
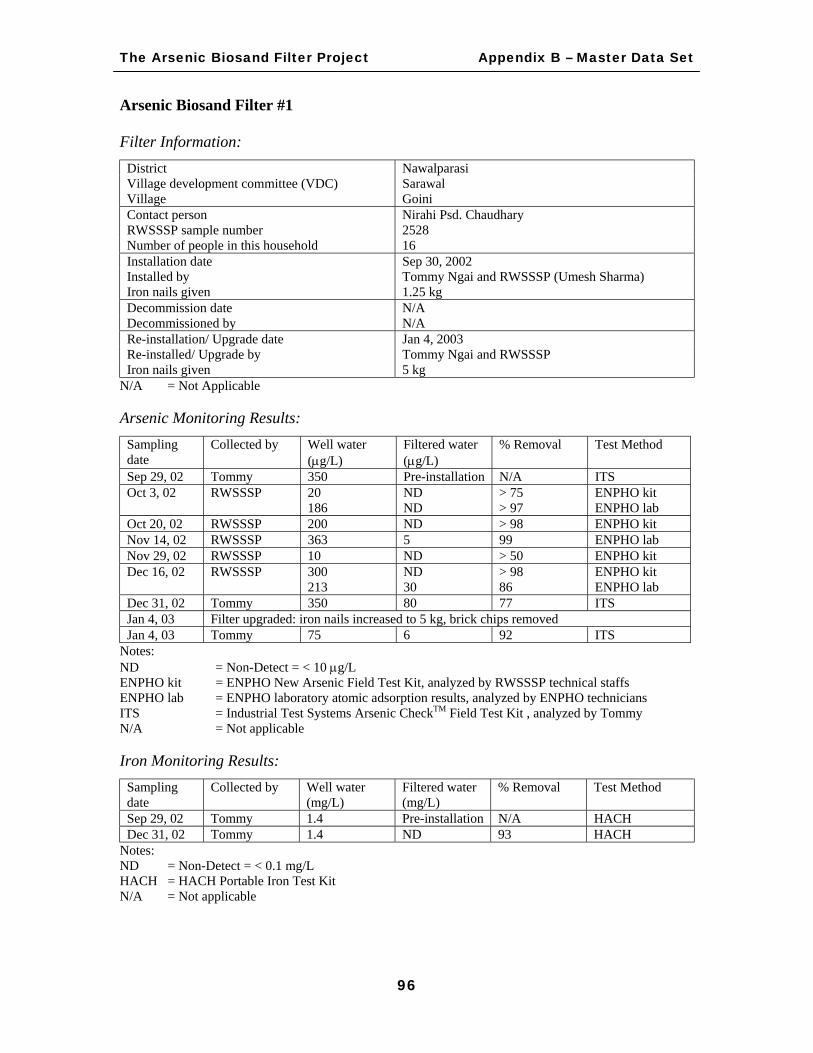
The Arsenic Biosand Filter Project Appendix B – Master Data Set
96
Arsenic Biosand Filter #1 Filter Information:
District Nawalparasi Village development committee (VDC) Sarawal Village Goini Contact person Nirahi Psd. Chaudhary RWSSSP sample number 2528 Number of people in this household 16 Installation date Sep 30, 2002 Installed by Tommy Ngai and RWSSSP (Umesh Sharma) Iron nails given 1.25 kg Decommission date N/A Decommissioned by N/A Re-installation/ Upgrade date Jan 4, 2003 Re-installed/ Upgrade by Tommy Ngai and RWSSSP Iron nails given 5 kg
N/A = Not Applicable Arsenic Monitoring Results:
Sampling date
Collected by Well water (µg/L)
Filtered water (µg/L)
% Removal Test Method
Sep 29, 02 Tommy 350 Pre-installation N/A ITS Oct 3, 02 RWSSSP 20 ND > 75 ENPHO kit 186 ND > 97 ENPHO lab Oct 20, 02 RWSSSP 200 ND > 98 ENPHO kit Nov 14, 02 RWSSSP 363 5 99 ENPHO lab Nov 29, 02 RWSSSP 10 ND > 50 ENPHO kit Dec 16, 02 RWSSSP 300 ND > 98 ENPHO kit 213 30 86 ENPHO lab Dec 31, 02 Tommy 350 80 77 ITS Jan 4, 03 Filter upgraded: iron nails increased to 5 kg, brick chips removed Jan 4, 03 Tommy 75 6 92 ITS
Notes: ND = Non-Detect = < 10 µg/L ENPHO kit = ENPHO New Arsenic Field Test Kit, analyzed by RWSSSP technical staffs ENPHO lab = ENPHO laboratory atomic adsorption results, analyzed by ENPHO technicians ITS = Industrial Test Systems Arsenic CheckTM Field Test Kit , analyzed by Tommy N/A = Not applicable Iron Monitoring Results:
Sampling date
Collected by Well water (mg/L)
Filtered water (mg/L)
% Removal Test Method
Sep 29, 02 Tommy 1.4 Pre-installation N/A HACH Dec 31, 02 Tommy 1.4 ND 93 HACH
Notes: ND = Non-Detect = < 0.1 mg/L HACH = HACH Portable Iron Test Kit N/A = Not applicable

The Arsenic Biosand Filter Project Appendix B – Master Data Set
97
Bacteria Monitoring Results: Sampling date
Collected by Well water Filtered water Removal Test Method
Oct 3, 02 RWSSSP A P No ENPHO P/A Nov 14, 02 RWSSSP A P No ENPHO P/A Nov 29, 02 RWSSSP Not tested P No ENPHO P/A Dec 16, 02 RWSSSP A A N/A ENPHO P/A Dec 31, 02 Sophie 3 TC 0 TC > 99% M-Coliblue24 3 EC 0 EC > 99% M-Coliblue24
Notes: P = Presence of H2S bacteria A = Absence of H2S bacteria ENPHO P/A = ENPHO H2S Bacteria Presence Absence Test M-Coliblue24 = Millipore M-Coliblue24 Broth, Membrane Filtration, measured in CFU/100mL TC = Total Coliform EC = E. Coli Flow Rate Results:
Sampling date
Collected by Flow rate (L/hr)
Flow rate measured when diffuser was
Calculated max flow rate when full (L/hr)
Dec 31, 02 Tommy + Sophie 14 3/4 full 19 Notes: Maximum flow rate is calculated assuming flow rate is directly proportional to water level in the diffuser box. For example, if the flow rate is 10 L/hr when the diffuser box is 1/3-filled, then the calculated maximum flow is three times 10 L/hr, which is 30 L/hr. Other Information: The user indicated that his filter was cleaned once every month, in order to improve the flow rate. The last cleaning was on Dec 21, 02.

The Arsenic Biosand Filter Project Appendix B – Master Data Set
98
Arsenic Biosand Filter #2 Filter Information:
District Nawalparasi Village development committee (VDC) Sarawal Village Goini Contact person Harinarayan Chaudhary RWSSSP sample number 2529 Number of people in this household 20 Installation date Sep 30, 2002 Installed by Tommy Ngai and RWSSSP (Umesh Sharma and
Tula Bhattrai) Iron nails given 1.25 kg Decommission date mid Dec 2002 Decommissioned by RWSSSP Re-installation/ Upgrade date Jan 4, 2003 Re-installed/ Upgrade by Tommy Ngai and RWSSSP Iron nails given 5 kg
N/A = Not Applicable Arsenic Monitoring Results:
Sampling date
Collected by Well water (µg/L)
Filtered water (µg/L)
% Removal Test Method
Sep 29, 02 Tommy 400 Pre-installation N/A ITS Oct 3, 02 RWSSSP 60 ND >92 ENPHO kit 237 7 97 ENPHO lab Oct 20, 02 RWSSSP 250 100 60 ENPHO kit Nov 14, 02 RWSSSP 401 140 65 ENPHO lab Nov 29, 02 RWSSSP 320 80 75 ENPHO kit Dec 16, 02 RWSSSP 350 200 43 ENPHO kit 372 137 63 ENPHO lab Dec 31, 02 Tommy N/A Decommissioned N/A ITS Jan 4, 03 Filter upgraded: iron nails increased to 5 kg, brick chips removed Jan 4, 03 Tommy 400 80 80 ITS
Notes: ND = Non-Detect = < 10 µg/L ENPHO kit = ENPHO New Arsenic Field Test Kit, analyzed by RWSSSP technical staffs ENPHO lab = ENPHO laboratory atomic adsorption results, analyzed by ENPHO technicians ITS = Industrial Test Systems Arsenic CheckTM Field Test Kit , analyzed by Tommy N/A = Not applicable Iron Monitoring Results:
Sampling date
Collected by Well water (mg/L)
Filtered water (mg/L)
% Removal Test Method
Sep 29, 02 Tommy 1.3 Pre-installation N/A HACH Dec 31, 02 Tommy N/A Decommissioned N/A HACH
Notes: ND = Non-Detect = < 0.1 mg/L HACH = HACH Portable Iron Test Kit N/A = Not applicable

The Arsenic Biosand Filter Project Appendix B – Master Data Set
99
Bacteria Monitoring Results: Sampling date
Collected by Well water Filtered water Removal Test Method
Oct 3, 02 RWSSSP A P No ENPHO P/A Nov 14, 02 RWSSSP N/A A N/A ENPHO P/A Nov 29, 02 RWSSSP N/A A N/A ENPHO P/A Dec 16, 02 RWSSSP A A N/A ENPHO P/A Dec 31, 02 Sophie 0 TC Decommissioned N/A M-Coliblue24 0 EC Decommissioned N/A M-Coliblue24
Notes: P = Presence of H2S bacteria A = Absence of H2S bacteria ENPHO P/A = ENPHO H2S Bacteria Presence Absence Test M-Coliblue24 = Millipore M-Coliblue24 Broth, Membrane Filtration, measured in CFU/100mL TC = Total Coliform EC = E. Coli Flow Rate Results:
Sampling date
Collected by Flow rate (L/hr) Flow rate measured when diffuser was
Calculated max flow rate when full (L/hr)
Dec 31, 02 Tommy + Sophie Decommissioned N/A N/A Notes: Maximum flow rate is calculated assuming flow rate is directly proportional to water level in the diffuser box. For example, if the flow rate is 10 L/hr when the diffuser box is 1/3-filled, then the calculated maximum flow is three times 10 L/hr, which is 30 L/hr.
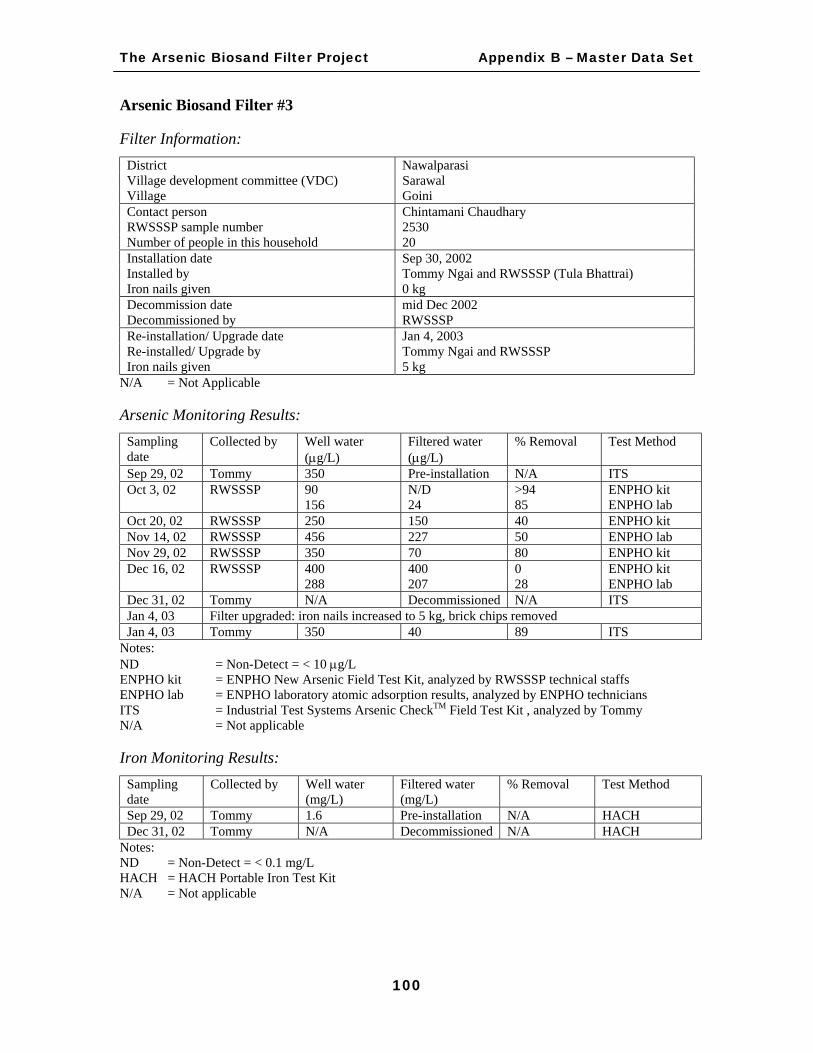
The Arsenic Biosand Filter Project Appendix B – Master Data Set
100
Arsenic Biosand Filter #3 Filter Information:
District Nawalparasi Village development committee (VDC) Sarawal Village Goini Contact person Chintamani Chaudhary RWSSSP sample number 2530 Number of people in this household 20 Installation date Sep 30, 2002 Installed by Tommy Ngai and RWSSSP (Tula Bhattrai) Iron nails given 0 kg Decommission date mid Dec 2002 Decommissioned by RWSSSP Re-installation/ Upgrade date Jan 4, 2003 Re-installed/ Upgrade by Tommy Ngai and RWSSSP Iron nails given 5 kg
N/A = Not Applicable Arsenic Monitoring Results:
Sampling date
Collected by Well water (µg/L)
Filtered water (µg/L)
% Removal Test Method
Sep 29, 02 Tommy 350 Pre-installation N/A ITS Oct 3, 02 RWSSSP 90 N/D >94 ENPHO kit 156 24 85 ENPHO lab Oct 20, 02 RWSSSP 250 150 40 ENPHO kit Nov 14, 02 RWSSSP 456 227 50 ENPHO lab Nov 29, 02 RWSSSP 350 70 80 ENPHO kit Dec 16, 02 RWSSSP 400 400 0 ENPHO kit 288 207 28 ENPHO lab Dec 31, 02 Tommy N/A Decommissioned N/A ITS Jan 4, 03 Filter upgraded: iron nails increased to 5 kg, brick chips removed Jan 4, 03 Tommy 350 40 89 ITS
Notes: ND = Non-Detect = < 10 µg/L ENPHO kit = ENPHO New Arsenic Field Test Kit, analyzed by RWSSSP technical staffs ENPHO lab = ENPHO laboratory atomic adsorption results, analyzed by ENPHO technicians ITS = Industrial Test Systems Arsenic CheckTM Field Test Kit , analyzed by Tommy N/A = Not applicable Iron Monitoring Results:
Sampling date
Collected by Well water (mg/L)
Filtered water (mg/L)
% Removal Test Method
Sep 29, 02 Tommy 1.6 Pre-installation N/A HACH Dec 31, 02 Tommy N/A Decommissioned N/A HACH
Notes: ND = Non-Detect = < 0.1 mg/L HACH = HACH Portable Iron Test Kit N/A = Not applicable

The Arsenic Biosand Filter Project Appendix B – Master Data Set
101
Bacteria Monitoring Results: Sampling date
Collected by Well water Filtered water Removal Test Method
Oct 3, 02 RWSSSP P P No ENPHO P/A Nov 14, 02 RWSSSP N/A P N/A ENPHO P/A Nov 29, 02 RWSSSP N/A P N/A ENPHO P/A Dec 16, 02 RWSSSP A P No ENPHO P/A Dec 31, 02 Sophie N/A Decommissioned N/A M-Coliblue24
Notes: P = Presence of H2S bacteria A = Absence of H2S bacteria ENPHO P/A = ENPHO H2S Bacteria Presence Absence Test M-Coliblue24 = Millipore M-Coliblue24 Broth, Membrane Filtration, measured in CFU/100mL Flow Rate Results:
Sampling date
Collected by Flow rate (L/hr) Flow rate measured when diffuser was
Calculated max flow rate when full (L/hr)
Dec 31, 02 Tommy + Sophie Decommissioned N/A N/A Notes: Maximum flow rate is calculated assuming flow rate is directly proportional to water level in the diffuser box. For example, if the flow rate is 10 L/hr when the diffuser box is 1/3-filled, then the calculated maximum flow is three times 10 L/hr, which is 30 L/hr.

The Arsenic Biosand Filter Project Appendix B – Master Data Set
102
Arsenic Biosand Filter #4 Filter Information:
District Nawalparasi Village development committee (VDC) Sarawal Village Goini Contact person Ramashankar Yadav RWSSSP sample number 2531 Number of people in this household 12 Installation date Sep 30, 2002 Installed by Tommy Ngai Iron nails given 2.5 kg Decommission date mid Dec 2002 Decommissioned by RWSSSP Re-installation/ Upgrade date Jan 4, 2003 Re-installed/ Upgrade by Tommy Ngai and RWSSSP Iron nails given 5 kg
N/A = Not Applicable Arsenic Monitoring Results:
Sampling date
Collected by Well water (µg/L)
Filtered water (µg/L)
% Removal Test Method
Sep 29, 02 Tommy 500 Pre-installation N/A ITS Oct 3, 02 RWSSSP 70 ND >93 ENPHO kit 298 ND >98 ENPHO lab Oct 20, 02 RWSSSP 350 150 57 ENPHO kit Nov 14, 02 RWSSSP 616 160 74 ENPHO lab Nov 29, 02 RWSSSP 180 60 67 ENPHO kit Dec 16, 02 RWSSSP 450 350 22 ENPHO kit Dec 31, 02 Tommy N/A Decommissioned N/A ITS Jan 4, 03 Filter upgraded: iron nails increased to 5 kg, brick chips removed Jan 4, 03 Tommy 700 50 93 ITS
Notes: ND = Non-Detect = < 10 µg/L ENPHO kit = ENPHO New Arsenic Field Test Kit, analyzed by RWSSSP technical staffs ENPHO lab = ENPHO laboratory atomic adsorption results, analyzed by ENPHO technicians ITS = Industrial Test Systems Arsenic CheckTM Field Test Kit , analyzed by Tommy N/A = Not applicable Iron Monitoring Results:
Sampling date
Collected by Well water (mg/L)
Filtered water (mg/L)
% Removal Test Method
Sep 29, 02 Tommy 1.5 Pre-installation N/A HACH Dec 31, 02 Tommy N/A Decommissioned N/A HACH
Notes: ND = Non-Detect = < 0.1 mg/L HACH = HACH Portable Iron Test Kit N/A = Not applicable

The Arsenic Biosand Filter Project Appendix B – Master Data Set
103
Bacteria Monitoring Results: Sampling date
Collected by Well water Filtered water Removal Test Method
Oct 3, 02 RWSSSP P P No ENPHO P/A Nov 14, 02 RWSSSP A A N/A ENPHO P/A Nov 29, 02 RWSSSP N/A P N/A ENPHO P/A Dec 16, 02 RWSSSP P P No ENPHO P/A Dec 31, 02 Sophie 160 TC (1:10) Decommissioned N/A M-Coliblue24 286 TC Decommissioned N/A M-Coliblue24 0 EC (1:10) Decommissioned N/A M-Coliblue24 11 EC Decommissioned N/A M-Coliblue24
Notes: P = Presence of H2S bacteria A = Absence of H2S bacteria ENPHO P/A = ENPHO H2S Bacteria Presence Absence Test M-Coliblue24 = Millipore M-Coliblue24 Broth, Membrane Filtration, measured in CFU/100mL TC = Total Coliform EC = E. Coli (1:10) = one in ten dilution Flow Rate Results:
Sampling date
Collected by Flow rate (L/hr) Flow rate measured when diffuser was
Calculated max flow rate when full (L/hr)
Dec 31, 02 Tommy + Sophie Decommissioned N/A N/A Notes: Maximum flow rate is calculated assuming flow rate is directly proportional to water level in the diffuser box. For example, if the flow rate is 10 L/hr when the diffuser box is 1/3-filled, then the calculated maximum flow is three times 10 L/hr, which is 30 L/hr. Other Information: Ramashankar Yadav has two houses, and collects water from two different wells.

The Arsenic Biosand Filter Project Appendix B – Master Data Set
104
Arsenic Biosand Filter #5 Filter Information:
District Nawalparasi Village development committee (VDC) Sarawal Village Goini Contact person Harilal Yadav RWSSSP sample number 2532 Number of people in this household 15 Installation date Oct 1, 2002 Installed by RWSSSP (Devi Wagle) Iron nails given 0 kg Decommission date N/A Decommissioned by N/A Re-installation/ Upgrade date Jan 4, 2003 Re-installed/ Upgrade by Tommy Ngai and RWSSSP Iron nails given 5 kg
N/A = Not Applicable Arsenic Monitoring Results:
Sampling date
Collected by Well water (µg/L)
Filtered water (µg/L)
% Removal Test Method
Sep 29, 02 Tommy 250 Pre-installation N/A ITS Oct 3, 02 RWSSSP 60 ND >92 ENPHO kit 67 ND >93 ENPHO lab Oct 20, 02 RWSSSP 200 ND 98 ENPHO kit Nov 14, 02 RWSSSP 272 9 97 ENPHO lab Nov 29, 02 RWSSSP 320 10 97 ENPHO kit Dec 16, 02 RWSSSP Harilal Yadav stopped using the filter because he
claimed that the filter did not remove arsenic ENPHO kit
N/A N/A N/A ENPHO lab Dec 31, 02 Tommy 250 300 88 ITS Jan 4, 03 Filter upgraded: iron nails increased to 5 kg, brick chips removed Jan 4, 03 Tommy N/A N/A N/A N/A
Notes: ND = Non-Detect = < 10 µg/L ENPHO kit = ENPHO New Arsenic Field Test Kit, analyzed by RWSSSP technical staffs ENPHO lab = ENPHO laboratory atomic adsorption results, analyzed by ENPHO technicians ITS = Industrial Test Systems Arsenic CheckTM Field Test Kit , analyzed by Tommy N/A = Not applicable Iron Monitoring Results:
Sampling date
Collected by Well water (mg/L)
Filtered water (mg/L)
% Removal Test Method
Sep 29, 02 Tommy 2.3 Pre-installation N/A HACH Dec 31, 02 Tommy 2.3 ND 96 HACH
Notes: ND = Non-Detect = < 0.1 mg/L HACH = HACH Portable Iron Test Kit N/A = Not applicable

The Arsenic Biosand Filter Project Appendix B – Master Data Set
105
Bacteria Monitoring Results: Sampling date
Collected by Well water Filtered water
Removal Test Method
Oct 3, 02 RWSSSP P P No ENPHO P/A Nov 14, 02 RWSSSP N/A A N/A ENPHO P/A Nov 29, 02 RWSSSP N/A P N/A ENPHO P/A Dec 16, 02 RWSSSP A A N/A ENPHO P/A Dec 31, 02 Sophie 340 TC (1:10)* N/A M-Coliblue24 TNTC TC 52 TC* 85% M-Coliblue24 30 EC 1 EC 97% M-Coliblue24
Notes: P = Presence of H2S bacteria A = Absence of H2S bacteria ENPHO P/A = ENPHO H2S Bacteria Presence Absence Test M-Coliblue24 = Millipore M-Coliblue24 Broth, Membrane Filtration, measured in CFU/100mL TC = Total Coliform EC = E. Coli TNTC = to numerous to count, >250 CFU/100mL (1:10) = one in ten dilution * = used to calculate % removal Flow Rate Results:
Sampling date
Collected by Flow rate (L/hr)
Flow rate measured when diffuser was
Calculated max flow rate when full (L/hr)
Dec 31, 02 Tommy + Sophie 23 3/4 full 31 Notes: Maximum flow rate is calculated assuming flow rate is directly proportional to water level in the diffuser box. For example, if the flow rate is 10 L/hr when the diffuser box is 1/3-filled, then the calculated maximum flow is three times 10 L/hr, which is 30 L/hr. Other Information: Harilal Yadav indicated that his filter’s flow rate has been very high since installation, therefore there was never a need to clean the filter.

The Arsenic Biosand Filter Project Appendix B – Master Data Set
106
Arsenic Biosand Filter #6 Filter Information:
District Nawalparasi Village development committee (VDC) Sarawal Village Goini Contact person Ramashankar Yadav RWSSSP sample number 3347 Number of people in this household 12 Installation date Oct 1, 2002 Installed by Tommy Ngai Iron nails given 1.25 kg Decommission date N/A Decommissioned by N/A Re-installation/ Upgrade date N/A Re-installed/ Upgrade by N/A Iron nails given N/A
N/A = Not Applicable Arsenic Monitoring Results:
Sampling date
Collected by Well water (µg/L)
Filtered water (µg/L)
% Removal Test Method
Sep 29, 02 Tommy 400 Pre-installation N/A ITS Oct 3, 02 RWSSSP 20 ND >75 ENPHO kit 163 ND 97 ENPHO lab Oct 20, 02 RWSSSP 200 ND >98 ENPHO kit Nov 14, 02 RWSSSP 0.451 ND 99 ENPHO lab Nov 29, 02 RWSSSP 0.01 ND >50 ENPHO kit Dec 16, 02 RWSSSP 300 ND >98 ENPHO kit 377 24 94 ENPHO lab Dec 31, 02 Tommy 400 30 93 ITS Jan 4, 03 Tommy 200 8 96 ITS
Notes: ND = Non-Detect = < 10 µg/L ENPHO kit = ENPHO New Arsenic Field Test Kit, analyzed by RWSSSP technical staffs ENPHO lab = ENPHO laboratory atomic adsorption results, analyzed by ENPHO technicians ITS = Industrial Test Systems Arsenic CheckTM Field Test Kit , analyzed by Tommy N/A = Not applicable Iron Monitoring Results:
Sampling date
Collected by Well water (mg/L)
Filtered water (mg/L)
% Removal Test Method
Sep 29, 02 Tommy 1.4 Pre-installation N/A HACH Dec 31, 02 Tommy 1.4 ND 93 HACH
Notes: ND = Non-Detect = < 0.1 mg/L HACH = HACH Portable Iron Test Kit N/A = Not applicable

The Arsenic Biosand Filter Project Appendix B – Master Data Set
107
Bacteria Monitoring Results: Sampling date
Collected by Well water Filtered water Removal Test Method
Oct 3, 02 RWSSSP A P No ENPHO P/A Nov 14, 02 RWSSSP A P No ENPHO P/A Nov 29, 02 RWSSSP N/A P N/A ENPHO P/A Dec 16, 02 RWSSSP A A N/A ENPHO P/A Dec 31, 02 Sophie 25 TC 1 TC >96% M-Coliblue24 4 EC 0 EC >99% M-Coliblue24
Notes: P = Presence of H2S bacteria A = Absence of H2S bacteria ENPHO P/A = ENPHO H2S Bacteria Presence Absence Test M-Coliblue24 = Millipore M-Coliblue24 Broth, Membrane Filtration, measured in CFU/100mL TC = Total Coliform EC = E. Coli TNTC = to numerous to count, >250 CFU/100mL (1:10) = one in ten dilution Flow Rate Results:
Sampling date
Collected by Flow rate (L/hr)
Flow rate measured when diffuser was
Calculated max flow rate when full (L/hr)
Dec 31, 02 Tommy + Sophie Not measured N/A N/A Notes: Maximum flow rate is calculated assuming flow rate is directly proportional to water level in the diffuser box. For example, if the flow rate is 10 L/hr when the diffuser box is 1/3-filled, then the calculated maximum flow is three times 10 L/hr, which is 30 L/hr. Other Information: Ramashankar Yadav has two houses, and collects water from two different wells.

The Arsenic Biosand Filter Project Appendix B – Master Data Set
108
Arsenic Biosand Filter #7 Filter Information:
District Nawalparasi Village development committee (VDC) Sarawal Village Goini Contact person Shivsager Yadav RWSSSP sample number N/A Number of people in this household No information Installation date Oct 1, 2002 Installed by RWSSSP (Umesh Sharma) Iron nails given 2.5 kg Decommission date N/A Decommissioned by N/A Re-installation/ Upgrade date Jan 4, 2003 Re-installed/ Upgrade by Tommy Ngai and RWSSSP Iron nails given 5 kg
N/A = Not Applicable Arsenic Monitoring Results:
Sampling date
Collected by Well water (µg/L)
Filtered water (µg/L)
% Removal Test Method
Sep 29, 02 Tommy 900 Pre-installation N/A ITS Dec 31, 02 Tommy 900 ND >99 ITS Jan 4, 03 Filter upgraded: iron nails increased to 5 kg, brick chips removed Jan 4, 03 Tommy N/A N/A N/A ITS
Notes: ND = Non-Detect = < 10 µg/L ENPHO kit = ENPHO New Arsenic Field Test Kit, analyzed by RWSSSP technical staffs ENPHO lab = ENPHO laboratory atomic adsorption results, analyzed by ENPHO technicians ITS = Industrial Test Systems Arsenic CheckTM Field Test Kit , analyzed by Tommy N/A = Not applicable Iron Monitoring Results:
Sampling date
Collected by Well water (mg/L)
Filtered water (mg/L)
% Removal Test Method
Sep 29, 02 Tommy 1.4 Pre-installation N/A HACH Dec 31, 02 Tommy 1.4 ND 93 HACH
Notes: ND = Non-Detect = < 0.1 mg/L HACH = HACH Portable Iron Test Kit N/A = Not applicable

The Arsenic Biosand Filter Project Appendix B – Master Data Set
109
Bacteria Monitoring Results: Sampling date
Collected by Well water Filtered water Removal Test Method
Dec 31, 02 Sophie 0 TC 0 TC N/A M-Coliblue24 0 EC 0 EC N/A M-Coliblue24
Notes: P = Presence of H2S bacteria A = Absence of H2S bacteria ENPHO P/A = ENPHO H2S Bacteria Presence Absence Test M-Coliblue24 = Millipore M-Coliblue24 Broth, Membrane Filtration, measured in CFU/100mL TC = Total Coliform EC = E. Coli Flow Rate Results:
Sampling date
Collected by Flow rate (L/hr)
Flow rate measured when diffuser was
Calculated max flow rate when full (L/hr)
Dec 31, 02 Tommy + Sophie 24 ½ full 48 Notes: Maximum flow rate is calculated assuming flow rate is directly proportional to water level in the diffuser box. For example, if the flow rate is 10 L/hr when the diffuser box is 1/3-filled, then the calculated maximum flow is three times 10 L/hr, which is 30 L/hr. Other Information: Because this family is new to the village, they are not covered under RWSSSP’s responsibility. Therefore, neither arsenic nor bacteria monitoring by RWSSSP was performed at this ABF.

The Arsenic Biosand Filter Project Appendix B – Master Data Set
110
Arsenic Biosand Filter #8 Filter Information:
District Rupandehi Village development committee (VDC) Devdaha Village Mandangram Contact person Nir B. Gurung RWSSSP sample number N/A Number of people in this household 10 Installation date Oct 2, 2002 Installed by RWSSSP (Devi Wagle) Iron nails given 1.25 kg Decommission date N/A Decommissioned by N/A Re-installation/ Upgrade date N/A Re-installed/ Upgrade by N/A Iron nails given N/A
N/A = Not Applicable Arsenic Monitoring Results:
Sampling date
Collected by Well water (µg/L)
Filtered water (µg/L)
% Removal Test Method
Sep 23, 02 Tommy 850 Pre-installation N/A ITS Oct 3, 02 RWSSSP 150 ND >97 ENPHO kit N/A N/A N/A ENPHO lab Oct 20, 02 RWSSSP 250 ND >98 ENPHO kit Nov 14, 02 RWSSSP 848 9 99 ENPHO lab Nov 29, 02 RWSSSP >500 ND >99 ENPHO kit Dec 16, 02 RWSSSP >500 ND >99 ENPHO kit 936 12 99 ENPHO lab Dec 30, 02 Tommy 700 300 57 ITS Jan 03 Tommy N/A N/A N/A ITS
Notes: ND = Non-Detect = < 10 µg/L ENPHO kit = ENPHO New Arsenic Field Test Kit, analyzed by RWSSSP technical staffs ENPHO lab = ENPHO laboratory atomic adsorption results, analyzed by ENPHO technicians ITS = Industrial Test Systems Arsenic CheckTM Field Test Kit , analyzed by Tommy N/A = Not applicable Iron Monitoring Results:
Sampling date
Collected by Well water (mg/L)
Filtered water (mg/L)
% Removal Test Method
Sep 23, 02 Tommy 1.3 Pre-installation N/A HACH Dec 30, 02 Tommy 1.3 ND 92 HACH
Notes: ND = Non-Detect = < 0.1 mg/L HACH = HACH Portable Iron Test Kit N/A = Not applicable

The Arsenic Biosand Filter Project Appendix B – Master Data Set
111
Bacteria Monitoring Results: Sampling date
Collected by Well water Filtered water Removal Test Method
Oct 3, 02 RWSSSP P A Yes ENPHO P/A Nov 14, 02 RWSSSP N/A N/A N/A ENPHO P/A Nov 29, 02 RWSSSP N/A P N/A ENPHO P/A Dec 16, 02 RWSSSP P A Yes ENPHO P/A Dec 30, 02 Sophie Not sampled N/A N/A M-Coliblue24
Notes: P = Presence of H2S bacteria A = Absence of H2S bacteria ENPHO P/A = ENPHO H2S Bacteria Presence Absence Test M-Coliblue24 = Millipore M-Coliblue24 Broth, Membrane Filtration, measured in CFU/100mL Flow Rate Results:
Sampling date
Collected by Flow rate (L/hr)
Flow rate measured when diffuser was
Calculated max flow rate when full (L/hr)
Dec 30, 02 Tommy + Sophie 13 1/3 full 39 Notes: Maximum flow rate is calculated assuming flow rate is directly proportional to water level in the diffuser box. For example, if the flow rate is 10 L/hr when the diffuser box is 1/3-filled, then the calculated maximum flow is three times 10 L/hr, which is 30 L/hr. Other Information: Nir B. Gurung’s tubewell contains one of the highest arsenic concentration of all wells under RWSSSP’s project area. This tubewell is shared by three families (Nir B. Gurung, Durga Kumari, and Tek B. Hamal).

The Arsenic Biosand Filter Project Appendix B – Master Data Set
112
Arsenic Biosand Filter #9 Filter Information:
District Rupandehi Village development committee (VDC) Devdaha Village Mandangram Contact person Durga Kumari RWSSSP sample number N/A Number of people in this household No information Installation date Oct 2, 2002 Installed by RWSSSP (Umesh Sharma) Iron nails given 1.25 kg Decommission date N/A Decommissioned by N/A Re-installation/ Upgrade date N/A Re-installed/ Upgrade by N/A Iron nails given N/A
N/A = Not Applicable Arsenic Monitoring Results:
Sampling date
Collected by Well water (µg/L)
Filtered water (µg/L)
% Removal Test Method
Sep 23, 02 Tommy 860 Pre-installation N/A ITS Oct 3, 02 RWSSSP 150 ND >97 ENPHO kit N/A N/A N/A ENPHO lab Oct 20, 02 RWSSSP 250 ND >98 ENPHO kit Nov 14, 02 RWSSSP 848 ND >99 ENPHO lab Nov 29, 02 RWSSSP >500 ND >99 ENPHO kit Dec 16, 02 RWSSSP >500 ND >99 ENPHO kit N/A N/A N/A ENPHO lab Dec 30, 02 Tommy 700 30 96 ITS Jan 03 Tommy N/A N/A N/A ITS
Notes: ND = Non-Detect = < 10 µg/L ENPHO kit = ENPHO New Arsenic Field Test Kit, analyzed by RWSSSP technical staffs ENPHO lab = ENPHO laboratory atomic adsorption results, analyzed by ENPHO technicians ITS = Industrial Test Systems Arsenic CheckTM Field Test Kit , analyzed by Tommy N/A = Not applicable Iron Monitoring Results:
Sampling date
Collected by Well water (mg/L)
Filtered water (mg/L)
% Removal Test Method
Sep 23, 02 Tommy 1.3 Pre-installation N/A HACH Dec 30, 02 Tommy 1.3 ND 92 HACH
Notes: ND = Non-Detect = < 0.1 mg/L HACH = HACH Portable Iron Test Kit N/A = Not applicable

The Arsenic Biosand Filter Project Appendix B – Master Data Set
113
Bacteria Monitoring Results: Sampling date
Collected by Well water Filtered water Removal Test Method
Oct 3, 02 RWSSSP P P No ENPHO P/A Nov 14, 02 RWSSSP N/A A N/A ENPHO P/A Nov 29, 02 RWSSSP N/A P N/A ENPHO P/A Dec 16, 02 RWSSSP P A Yes ENPHO P/A Dec 30, 02 Sophie Not sampled N/A N/A M-Coliblue24
Notes: P = Presence of H2S bacteria A = Absence of H2S bacteria ENPHO P/A = ENPHO H2S Bacteria Presence Absence Test M-Coliblue24 = Millipore M-Coliblue24 Broth, Membrane Filtration, measured in CFU/100mL Flow Rate Results:
Sampling date
Collected by Flow rate (L/hr)
Flow rate measured when diffuser was
Calculated max flow rate when full (L/hr)
Dec 30, 02 Tommy + Sophie 28 Full 28 Notes: Maximum flow rate is calculated assuming flow rate is directly proportional to water level in the diffuser box. For example, if the flow rate is 10 L/hr when the diffuser box is 1/3-filled, then the calculated maximum flow is three times 10 L/hr, which is 30 L/hr. Other Information: This family collects water from Nir B. Gurung’s tubewell. Nir B. Gurung’s tubewell contains one of the highest arsenic concentration of all wells under RWSSSP’s project area.

The Arsenic Biosand Filter Project Appendix B – Master Data Set
114
Arsenic Biosand Filter #10 Filter Information:
District Rupandehi Village development committee (VDC) Devdaha Village Mandangram Contact person Tek B. Hamal RWSSSP sample number N/A Number of people in this household No information Installation date Oct 2, 2002 Installed by Tommy Ngai Iron nails given 1.25 kg Decommission date N/A Decommissioned by N/A Re-installation/ Upgrade date N/A Re-installed/ Upgrade by N/A Iron nails given N/A
N/A = Not Applicable Arsenic Monitoring Results:
Sampling date
Collected by Well water (µg/L)
Filtered water (µg/L)
% Removal Test Method
Sep 23, 02 Tommy 860 Pre-installation N/A ITS Oct 3, 02 RWSSSP 150 ND >97 ENPHO kit N/A N/A N/A ENPHO lab Oct 20, 02 RWSSSP 250 ND >98 ENPHO kit Nov 14, 02 RWSSSP 848 ND >99 ENPHO lab Nov 29, 02 RWSSSP >500 ND >99 ENPHO kit Dec 16, 02 RWSSSP >500 ND >99 ENPHO kit N/A N/A N/A ENPHO lab Dec 30, 02 Tommy 700 ND >99 ITS Jan 03 Tommy N/A N/A N/A ITS
Notes: ND = Non-Detect = < 10 µg/L ENPHO kit = ENPHO New Arsenic Field Test Kit, analyzed by RWSSSP technical staffs ENPHO lab = ENPHO laboratory atomic adsorption results, analyzed by ENPHO technicians ITS = Industrial Test Systems Arsenic CheckTM Field Test Kit , analyzed by Tommy N/A = Not applicable Iron Monitoring Results:
Sampling date
Collected by Well water (mg/L)
Filtered water (mg/L)
% Removal Test Method
Sep 23, 02 Tommy 1.3 Pre-installation N/A HACH Dec 30, 02 Tommy 1.3 ND 92 HACH
Notes: ND = Non-Detect = < 0.1 mg/L HACH = HACH Portable Iron Test Kit N/A = Not applicable

The Arsenic Biosand Filter Project Appendix B – Master Data Set
115
Bacteria Monitoring Results: Sampling date
Collected by Well water Filtered water Removal Test Method
Oct 3, 02 RWSSSP P P No ENPHO P/A Nov 14, 02 RWSSSP N/A A N/A ENPHO P/A Nov 29, 02 RWSSSP N/A P N/A ENPHO P/A Dec 16, 02 RWSSSP P A Yes ENPHO P/A Dec 30, 02 Sophie Not sampled N/A N/A M-Coliblue24
Notes: P = Presence of H2S bacteria A = Absence of H2S bacteria ENPHO P/A = ENPHO H2S Bacteria Presence Absence Test M-Coliblue24 = Millipore M-Coliblue24 Broth, Membrane Filtration, measured in CFU/100mL Flow Rate Results:
Sampling date
Collected by Flow rate (L/hr)
Flow rate measured when diffuser was
Calculated max flow rate when full (L/hr)
Dec 30, 02 Tommy + Sophie 4 1/3 full 12 Notes: Maximum flow rate is calculated assuming flow rate is directly proportional to water level in the diffuser box. For example, if the flow rate is 10 L/hr when the diffuser box is 1/3-filled, then the calculated maximum flow is three times 10 L/hr, which is 30 L/hr. Other Information: This family collects water from Nir B. Gurung’s tubewell. Nir B. Gurung’s tubewell contains one of the highest arsenic concentration of all wells under RWSSSP’s project area.

The Arsenic Biosand Filter Project Appendix B – Master Data Set
116
Arsenic Biosand Filter #11 Filter Information:
District Nawalparasi Village development committee (VDC) Tilakpur Village Patkhauli Contact person Nim N. Chaudhary RWSSSP sample number N/A Number of people in this household No information Installation date Oct 30, 2002 Installed by ENPHO Iron nails given 0 kg
N/A = Not Applicable Arsenic Monitoring Results:
Sampling date
Collected by Well water (µg/L)
Filtered water (µg/L)
% Removal Test Method
Early Dec 02 ENPHO 78 3 96 ENPHO lab Jan 3, 03 Tommy 20 ND >75 * ITS
Notes: ND = Non-Detect = < 10 µg/L ENPHO lab = ENPHO laboratory atomic adsorption results, analyzed by ENPHO technicians ITS = Industrial Test Systems Arsenic CheckTM Field Test Kit , analyzed by Tommy N/A = Not applicable * = The % arsenic removal is likely to be higher than 75%, but this can only be confirmed
using an arsenic test with a lower detection limit. Iron Monitoring Results:
Sampling date
Collected by Well water (mg/L)
Filtered water (mg/L)
% Removal Test Method
Jan 3, 03 Tommy 3.8 ND 97 HACH Notes: ND = Non-Detect = < 0.1 mg/L HACH = HACH Portable Iron Test Kit N/A = Not applicable

The Arsenic Biosand Filter Project Appendix B – Master Data Set
117
Bacteria Monitoring Results: Sampling date
Collected by Well water Filtered water Removal Test Method
Jan 3, 03 Sophie 450 TC (1:10)* N/A M-Coliblue24 135 TC 49 TC*
89% M-Coliblue24
60 EC (1:10)* N/A M-Coliblue24 0 EC 9*
85% M-Coliblue24
Notes: M-Coliblue24 = Millipore M-Coliblue24 Broth, Membrane Filtration, measured in CFU/100mL TC = Total Coliform EC = E. Coli (1:10) = one in ten dilution * = used to calculate % removal Flow Rate Results:
Sampling date
Collected by Flow rate (L/hr)
Flow rate measured when diffuser was
Calculated max flow rate when full (L/hr)
Jan 3, 03 Tommy + Sophie 11 1/3 full 33 Notes: Maximum flow rate is calculated assuming flow rate is directly proportional to water level in the diffuser box. For example, if the flow rate is 10 L/hr when the diffuser box is 1/3-filled, then the calculated maximum flow is three times 10 L/hr, which is 30 L/hr. Other Information: According to ENPHO, the influent contains high iron concentration (about 7-8 mg/L). ENPHO decided not to give any iron nails to this filter.

The Arsenic Biosand Filter Project Appendix B – Master Data Set
118
Arsenic Biosand Filter #12 Filter Information:
District Nawalparasi Village development committee (VDC) Tilakpur Village Patkhauli Contact person Min N. Chaudhary RWSSSP sample number N/A Number of people in this household No information Installation date Oct 30, 2002 Installed by ENPHO Iron nails given 5 kg
N/A = Not Applicable Arsenic Monitoring Results:
Sampling date
Collected by Well water (µg/L)
Filtered water (µg/L)
% Removal Test Method
Early Dec 02 ENPHO 241 6 98 ENPHO lab Jan 3, 03 Tommy 160 15 91 ITS
Notes: ND = Non-Detect = < 10 µg/L ENPHO lab = ENPHO laboratory atomic adsorption results, analyzed by ENPHO technicians ITS = Industrial Test Systems Arsenic CheckTM Field Test Kit , analyzed by Tommy N/A = Not applicable Iron Monitoring Results:
Sampling date
Collected by Well water (mg/L)
Filtered water (mg/L)
% Removal Test Method
Jan 3, 03 Tommy 1.1 ND 91 HACH Notes: ND = Non-Detect = < 0.1 mg/L HACH = HACH Portable Iron Test Kit N/A = Not applicable

The Arsenic Biosand Filter Project Appendix B – Master Data Set
119
Bacteria Monitoring Results: Sampling date
Collected by Well water Filtered water Removal Test Method
Jan 3, 03 Sophie 100 TC (1:10)* N/A M-Coliblue24 38 TC 163*
0% M-Coliblue24
10 EC (1:10) N/A M-Coliblue24 16 EC 0
>99% M-Coliblue24
Notes: M-Coliblue24 = Millipore M-Coliblue24 Broth, Membrane Filtration, measured in CFU/100mL TC = Total Coliform EC = E. Coli (1:10) = one in ten dilution * = used to calculate % removal Flow Rate Results:
Sampling date
Collected by Flow rate (L/hr)
Flow rate measured when diffuser was
Calculated max flow rate when full (L/hr)
Jan 3, 03 Tommy + Sophie 8 1/3 full 24 Notes: Maximum flow rate is calculated assuming flow rate is directly proportional to water level in the diffuser box. For example, if the flow rate is 10 L/hr when the diffuser box is 1/3-filled, then the calculated maximum flow is three times 10 L/hr, which is 30 L/hr. Other Information: Min Chaudhary indicated that the ABF was last cleaned on Nov 19, 2002 because of low flow rate.

The Arsenic Biosand Filter Project Appendix B – Master Data Set
120
Arsenic Biosand Filter #13 Filter Information:
District Nawalparasi Village development committee (VDC) Tilakpur Village Patkhauli Contact person Phakir Kami RWSSSP sample number N/A Number of people in this household No information Installation date Oct 30, 2002 Installed by ENPHO Iron nails given 5 kg
N/A = Not Applicable Arsenic Monitoring Results:
Sampling date Collected by Well water (µg/L)
Filtered water (µg/L)
% Removal Test Method
Early Dec 02 ENPHO 241 6 98 ENPHO lab Jan 3, 03 Tommy 80 60 25* ITS
Notes: ENPHO lab = ENPHO laboratory atomic adsorption results, analyzed by ENPHO technicians ITS = Industrial Test Systems Arsenic CheckTM Field Test Kit , analyzed by Tommy N/A = Not applicable * = Reliability of this result is doubtful. Iron Monitoring Results:
Sampling date
Collected by Well water (mg/L)
Filtered water (mg/L)
% Removal Test Method
Jan 3, 03 Tommy 2.3 ND 96 HACH Notes: ND = Non-Detect = < 0.1 mg/L HACH = HACH Portable Iron Test Kit N/A = Not applicable

The Arsenic Biosand Filter Project Appendix B – Master Data Set
121
Bacteria Monitoring Results: Sampling date
Collected by Well water Filtered water
Removal Test Method
Jan 3, 03 Sophie 100 TC (1:10)* N/A M-Coliblue24 TNTC TC 15 TC* 85% M-Coliblue24 0 EC 5 EC 0% M-Coliblue24
Notes: M-Coliblue24 = Millipore M-Coliblue24 Broth, Membrane Filtration, measured in CFU/100mL TC = Total Coliform EC = E. Coli TNTC = to numerous to count, >250 CFU/100mL (1:10) = one in ten dilution * = used to calculate % removal Flow Rate Results:
Sampling date
Collected by Flow rate (L/hr)
Flow rate measured when diffuser was
Calculated max flow rate when full (L/hr)
Jan 3, 03 Tommy + Sophie 9 1/3 full 27 Notes: Maximum flow rate is calculated assuming flow rate is directly proportional to water level in the diffuser box. For example, if the flow rate is 10 L/hr when the diffuser box is 1/3-filled, then the calculated maximum flow is three times 10 L/hr, which is 30 L/hr.
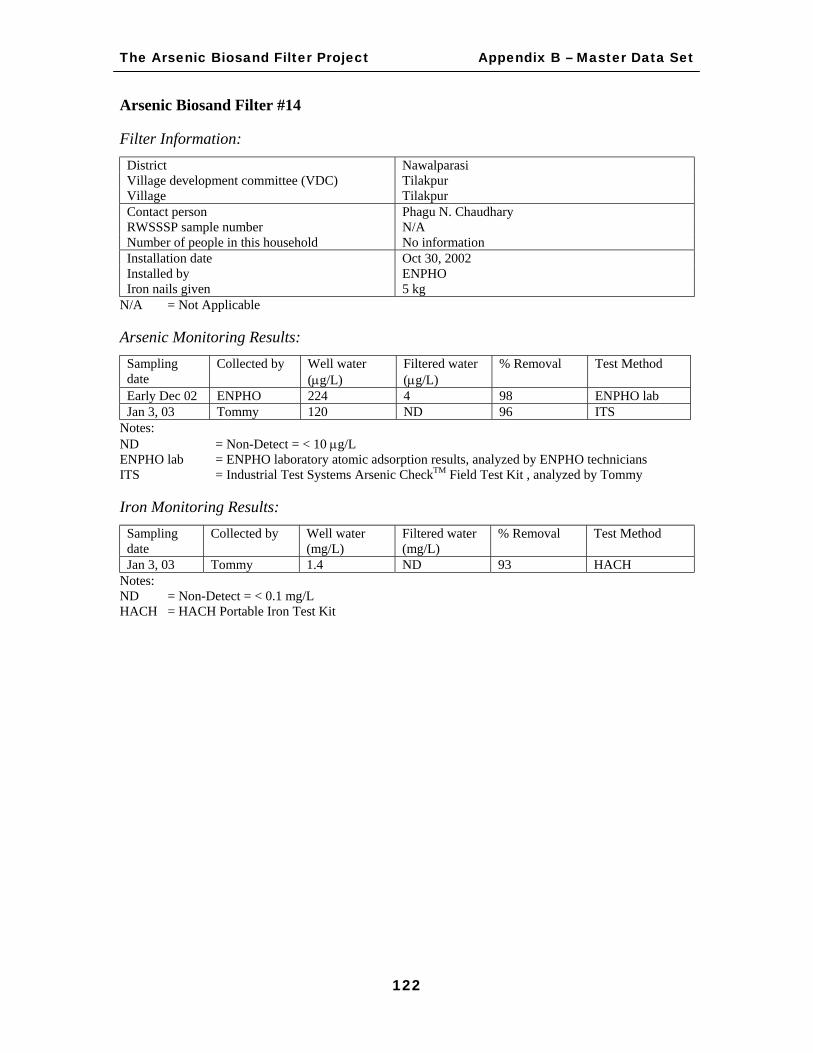
The Arsenic Biosand Filter Project Appendix B – Master Data Set
122
Arsenic Biosand Filter #14 Filter Information:
District Nawalparasi Village development committee (VDC) Tilakpur Village Tilakpur Contact person Phagu N. Chaudhary RWSSSP sample number N/A Number of people in this household No information Installation date Oct 30, 2002 Installed by ENPHO Iron nails given 5 kg
N/A = Not Applicable Arsenic Monitoring Results:
Sampling date
Collected by Well water (µg/L)
Filtered water (µg/L)
% Removal Test Method
Early Dec 02 ENPHO 224 4 98 ENPHO lab Jan 3, 03 Tommy 120 ND 96 ITS
Notes: ND = Non-Detect = < 10 µg/L ENPHO lab = ENPHO laboratory atomic adsorption results, analyzed by ENPHO technicians ITS = Industrial Test Systems Arsenic CheckTM Field Test Kit , analyzed by Tommy Iron Monitoring Results:
Sampling date
Collected by Well water (mg/L)
Filtered water (mg/L)
% Removal Test Method
Jan 3, 03 Tommy 1.4 ND 93 HACH Notes: ND = Non-Detect = < 0.1 mg/L HACH = HACH Portable Iron Test Kit

The Arsenic Biosand Filter Project Appendix B – Master Data Set
123
Bacteria Monitoring Results: Sampling date
Collected by Well water Filtered water Removal Test Method
Jan 3, 03 Sophie 34 TC 42 TC 0% M-Coliblue24 1 EC 40* EC 0% M-Coliblue24
Notes: M-Coliblue24 = Millipore M-Coliblue24 Broth, Membrane Filtration, measured in CFU/100mL TC = Total Coliform EC = E. Coli * blue dots were on the extremity of the plate, doubtful results Flow Rate Results:
Sampling date
Collected by Flow rate (L/hr)
Flow rate measured when diffuser was
Calculated max flow rate when full (L/hr)
Jan 3, 03 Tommy + Sophie 7 1/3 full 21 Notes: Maximum flow rate is calculated assuming flow rate is directly proportional to water level in the diffuser box. For example, if the flow rate is 10 L/hr when the diffuser box is 1/3-filled, then the calculated maximum flow is three times 10 L/hr, which is 30 L/hr.

The Arsenic Biosand Filter Project Appendix B – Master Data Set
124
Arsenic Biosand Filter #15 Filter Information:
District Nawalparasi Village development committee (VDC) Panchanagar Village Bhutaha Contact person Lila B. Pun RWSSSP sample number N/A Number of people in this household No information Installation date Oct 30, 2002 Installed by ENPHO Iron nails given 5 kg
N/A = Not Applicable Arsenic Monitoring Results:
Sampling date Collected by Well water (µg/L)
Filtered water (µg/L)
% Removal Test Method
Early Dec 02 ENPHO 157 0.4* 99 ENPHO lab Jan 3, 03 Tommy 60 8 87 ITS
Notes: ND = Non-Detect = < 10 µg/L ENPHO lab = ENPHO laboratory atomic adsorption results, analyzed by ENPHO technicians ITS = Industrial Test Systems Arsenic CheckTM Field Test Kit , analyzed by Tommy N/A = Not applicable * = This value of 0.4 mg/L is probably below the reliable detection limit of the instrument,
therefore the result is doubtful. Iron Monitoring Results:
Sampling date
Collected by Well water (mg/L)
Filtered water (mg/L)
% Removal Test Method
Jan 3, 03 Tommy 1.2 ND 92 HACH Notes: ND = Non-Detect = < 0.1 mg/L HACH = HACH Portable Iron Test Kit N/A = Not applicable

The Arsenic Biosand Filter Project Appendix B – Master Data Set
125
Bacteria Monitoring Results: Sampling date
Collected by Well water Filtered water Removal Test Method
Jan 3, 03 Sophie 49 TC 47 TC 4% M-Coliblue24 4 0 >99% M-Coliblue24
Notes: M-Coliblue24 = Millipore M-Coliblue24 Broth, Membrane Filtration, measured in CFU/100mL TC = Total Coliform EC = E. Coli Flow Rate Results:
Sampling date
Collected by Flow rate (L/hr)
Flow rate measured when diffuser was
Calculated max flow rate when full (L/hr)
Jan 3, 03 Tommy + Sophie 20 ½ full 40 Notes: Maximum flow rate is calculated assuming flow rate is directly proportional to water level in the diffuser box. For example, if the flow rate is 10 L/hr when the diffuser box is 1/3-filled, then the calculated maximum flow is three times 10 L/hr, which is 30 L/hr. Other Information: This well is built by the Nepal Red Cross Society (NRCS). NRCS also monitored arsenic for this well.

The Arsenic Biosand Filter Project Appendix B – Master Data Set
126
Arsenic Biosand Filter #16 Filter Information:
District Nawalparasi Village development committee (VDC) Panchanagar Village Bhanunagar Contact person Bhanu primary school RWSSSP sample number N/A Number of users About 200 student Installation date Sept 5, 2002 Installed by ENPHO Iron nails given 5 kg
N/A = Not Applicable Arsenic Monitoring Results:
Sampling date
Collected by Well water (µg/L)
Filtered water (µg/L)
% Removal Test Method
Early Dec 02 ENPHO 225 38 83 ENPHO lab Jan 3, 03 Tommy 120 ND 96 ITS
Notes: ND = Non-Detect = < 10 µg/L ENPHO lab = ENPHO laboratory atomic adsorption results, analyzed by ENPHO technicians ITS = Industrial Test Systems Arsenic CheckTM Field Test Kit , analyzed by Tommy N/A = Not applicable Iron Monitoring Results:
Sampling date
Collected by Well water (mg/L)
Filtered water (mg/L)
% Removal Test Method
Jan 3, 03 Tommy 1.1 ND 91 HACH Notes: ND = Non-Detect = < 0.1 mg/L HACH = HACH Portable Iron Test Kit

The Arsenic Biosand Filter Project Appendix B – Master Data Set
127
Bacteria Monitoring Results: Sampling date
Collected by Well water Filtered water % Removal Test Method
Jan 3, 03 Sophie 40 TC (1:10) N/A M-Coliblue24 61 TC* 22 TC* 64% M-Coliblue24 0 EC (1:10) N/A M-Coliblue24 2EC 18 0% M-Coliblue24
Notes: M-Coliblue24 = Millipore M-Coliblue24 Broth, Membrane Filtration, measured in CFU/100mL TC = Total Coliform EC = E. Coli (1:10) = one in ten dilution * = used to calculate % removal Flow Rate Results:
Sampling date
Collected by Flow rate (L/hr)
Flow rate measured when diffuser was
Calculated max flow rate when full (L/hr)
Jan 3, 03 Tommy + Sophie 9 1/3 full 27 Notes: Maximum flow rate is calculated assuming flow rate is directly proportional to water level in the diffuser box. For example, if the flow rate is 10 L/hr when the diffuser box is 1/3-filled, then the calculated maximum flow is three times 10 L/hr, which is 30 L/hr. Other Information: This ABF is the first one installed in Nepal. About 200 students currently drink the filtered water from this filter, which is maintained by the school principal.

The Arsenic Biosand Filter Project Appendix B – Master Data Set
128
3-Kolshi #1 Kolshi Information:
District Kapilvastu Village development committee (VDC) Dubiya Village Rangai Contact person Aitwari Chaudhary RWSSSP sample number 2528 Number of people in this household 15 Installation date August 2002
Arsenic Monitoring Results:
Sampling date
Collected by Well water (µg/L)
Filtered water (µg/L)
% Removal Test Method
Jan 1, 03 Tommy + Sophie 40 ND >88 ITS Notes: ND = Non-Detect = < 10 µg/L ITS = Industrial Test Systems Arsenic CheckTM Field Test Kit , analyzed by Tommy Iron Monitoring Results:
Sampling date
Collected by Well water (mg/L)
Filtered water (mg/L)
% Removal Test Method
Jan 1, 03 Tommy + Sophie 1 ND >90 HACH Notes: ND = Non-Detect = < 0.1 mg/L HACH = HACH Portable Iron Test Kit Flow Rate Results:
Sampling date
Collected by Flow rate (L/hr)
Jan 1, 03 Tommy + Sophie 3 Other Information: The users indicated that the filter flow rate is too low to produce sufficient for their family of 15. They said three filters are needed.

The Arsenic Biosand Filter Project Appendix B – Master Data Set
129
3-Kolshi #2 Kolshi Information:
District Kapilvastu Village development committee (VDC) Dubiya Village Rangai Contact person Sukhal Chaudhary RWSSSP sample number 2529 Number of people in this household No information Installation date August 2002
Arsenic Monitoring Results:
Sampling date
Collected by Well water (µg/L)
Filtered water (µg/L)
% Removal Test Method
Jan 1, 03 Tommy + Sophie 40 ND >88 ITS Notes: ND = Non-Detect = < 10 µg/L ITS = Industrial Test Systems Arsenic CheckTM Field Test Kit , analyzed by Tommy Iron Monitoring Results:
Sampling date
Collected by Well water (mg/L)
Filtered water (mg/L)
% Removal Test Method
Jan 1, 03 Tommy + Sophie 1 ND >90 HACH Notes: ND = Non-Detect = < 0.1 mg/L HACH = HACH Portable Iron Test Kit Flow Rate Results:
Sampling date
Collected by Flow rate (L/hr)
Jan 1, 03 Tommy + Sophie 0.3 Other Information: The users complained about the very low flow rate of 0.3 L/hr.

The Arsenic Biosand Filter Project Appendix B – Master Data Set
130
3-Kolshi #3 Kolshi Information:
District Kapilvastu Village development committee (VDC) Dubiya Village Rangai Contact person Jhinku Chaudhary RWSSSP sample number 2530 Number of people in this household No information Installation date August 2002
Arsenic Monitoring Results:
Sampling date
Collected by Well water (µg/L)
Filtered water (µg/L)
% Removal Test Method
Jan 1, 03 Tommy + Sophie 40 15 63 ITS Notes: ND = Non-Detect = < 10 µg/L ITS = Industrial Test Systems Arsenic CheckTM Field Test Kit , analyzed by Tommy Iron Monitoring Results:
Sampling date
Collected by Well water (mg/L)
Filtered water (mg/L)
% Removal Test Method
Jan 1, 03 Tommy + Sophie 1 ND >90 HACH Notes: ND = Non-Detect = < 0.1 mg/L HACH = HACH Portable Iron Test Kit Flow Rate Results:
Sampling date
Collected by Flow rate (L/hr)
Jan 1, 03 Tommy + Sophie 3

The Arsenic Biosand Filter Project Appendix C – Map of Nepal
131
APPENDIX C - MAP SHOWING PROJECT DISTRICTS OF NEPAL

The Arsenic Biosand Filter Project Appendix D – Education Materials
132
APPENDIX D1 - ARSENIC BIOSAND FILTER OPERATING
PROCEDURE IN NEPALI

The Arsenic Biosand Filter Project Appendix D – Education Materials
133
APPENDIX D2 - ARSENIC BIOSAND FILTER CLEANING
PROCEDURE IN NEPALI

The Arsenic Biosand Filter Project Appendix E – ABF Manufacturing
134
APPENDIX E - ARSENIC BIOSAND FILTER MANUFACTURING
PROCEDURE
The section describes the manufacturing of a Arsenic Biosand filter. The information is
an excerpt taken from Lee93 thesis.
Cross-Section Diagram
Cross-section of a concrete BioSand Filter (BSF) is shown in Figure 44. A BSF has
several main components: shell/casing, diffuser plate, fine sand, coarse sand, gravel, and
lid. Each of these components will be described in detail in this section. For a ABF, the
diffuser plate is replaced by a metal diffuser box filled with iron nails. Table 44 shows
the design parameters of a BSF/ABF.
Figure 44 - Cross-Section of a Concrete BioSand Filter

The Arsenic Biosand Filter Project Appendix E – ABF Manufacturing
135
Table 44 - BSF/ABF Design Parameters
Design Parameter Value
Fine Sand Size <1mm
Coarse Sand Size 1mm – 6mm
Underdrain Gravel Size 6mm – 15mm
Surface Area of Sand 540m2
Initial Flow Rate 1L/min ± 30%
BSF Size 30cm x 30 cm x 90cm
Concrete Shell/Casing
The BSF shell/casing is made of concrete that is casted in a steel mold. Ideally, casting is
carried out on site because transportation over long distances with bumpy road conditions
to some of the less accessible places in Nepal might cause damages to the BSF shell.
Riser Pipe Assembly
Cut the PVC pipe into four sections and saw off the edges forming a 45° angle as shown
in Figure 45.
Figure 45 - PVC pipe dimensions (not to scale)
Join the various sections together with glue. Alternatively, heat join using a flat heating
plate.
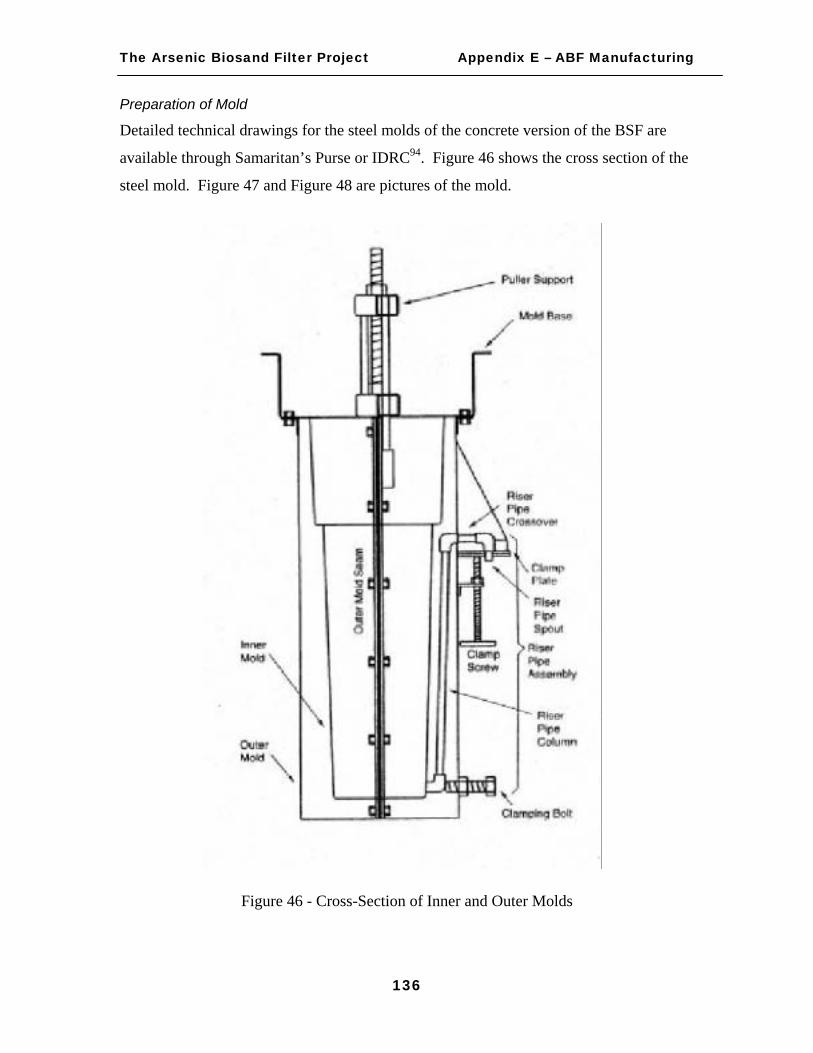
The Arsenic Biosand Filter Project Appendix E – ABF Manufacturing
136
Preparation of Mold
Detailed technical drawings for the steel molds of the concrete version of the BSF are
available through Samaritan’s Purse or IDRC94. Figure 46 shows the cross section of the
steel mold. Figure 47 and Figure 48 are pictures of the mold.
Figure 46 - Cross-Section of Inner and Outer Molds

The Arsenic Biosand Filter Project Appendix E – ABF Manufacturing
137
Figure 47 - Unassembled Steel Mold –
Inner Mold (left) and Outer Mold (right).
Figure 48 - Steel Mold for Concrete BSF
Shell (assembled)
Stand the fully assembled mold upright, base down. Install the riser pipe that was
assembled previously inside the outer mold section. Coat the inside of the molds and the
clamping bolt with edible oil or lard. This is to prevent the concrete from sticking to the
molds.
Mixing Concrete
Materials required for concrete body include:
• 36 L of cement • 36 L of sand • 36 L of gravel • Water • Bucket • Shovel

The Arsenic Biosand Filter Project Appendix E – ABF Manufacturing
138
• Mixing tray/slab or wheel barrow • Steel or wood rod • Piece of wood (to use as a trowel)
Concrete is mixed in equal proportion (by volume) in a wheelbarrow or on any clean
surface (Figure 49, Figure 50). Water is added a little at a time until concrete reaches the
proper consistency. The amount of water needed depends on the initial moisture level of
the sand and gravel. As a rough guide, take a handful of the final mixture and squeeze it
hard. If the consistency is right, it will just be possible to squeeze a few drops of liquid
out of the handful.
Figure 49 - Concrete Mixing I
Figure 50 - Concrete Mixing II

The Arsenic Biosand Filter Project Appendix E – ABF Manufacturing
139
Concrete Pour
The concrete pour should not be carried out in direct sunlight because the concrete must
cure in the shade. These are the procedures for pouring:
Pour one third of the concrete into the steel mold. Thrust a steel or wooded rod in and
out of the concrete and pound the outside of the mold with a rubber mallet to ensure that
the concrete fills all sections of the mold and to release any air bubbles (Figure 51).
Repeat this procedure twice more, each time pouring a third of the concrete. Prior to
completely filling the mold, oil the top portion of the inner mold as some oil will have
worn off in the pouring process.
Figure 51 - Tamping the Concrete Mixture with a Wooden Rod
Level the top of the concrete surface using a short piece of wood. Adjust the clamping
bolt which holds the riser pipe against the inner mold so that there is enough pressure to
hold the rise pipe in place without causing the outside mold to deflect on that side. This
will leave a hole in the filter wall that will have to be patched later. About fifteen minutes
after the concrete is poured, release the concrete clamping bolt.
De-molding
Materials required are:

The Arsenic Biosand Filter Project Appendix E – ABF Manufacturing
140
• Mold wrenches • About 200g of concrete • Pliers • Hammer • Scrap wood
Carefully turn the mold right side up (inner mold legs up). Since the mold, now charged
with concrete, has an enhanced capacity to smash fingers, set a piece of wood down to
avoid setting the mold flat on the ground. Remove the riser pipe clamping-bolt using a
wrench. Clean this bolt and its threading nut with a wire brush after each casting.
Place the puller-support in its slots and screw in the threaded rod. The rod only needs to
be threaded the depth of the base nut. Once in place, hand tightens the floating nut
against the puller-support crossbar. Remove base bolts. Using a wrench, continue to
tighten the floating nut against the crossbar to break the inner mold free. Raise it about
5cm. At this point, the inner mold should be sufficiently loose for two people to lift it out
by hand. If the inner mold sticks, tap the outer mold with a rubber mallet while
tightening the nut. Set the inner mold aside. Remove the nuts and bolts connecting the
two sections of the outer mold. Remove the riser pipe spout using a pair of pliers.
Remove the pour spout clamp plate and gasket.
Starting with the rear outer mold section, use both hands to slowly pull back on the mold
base and remove this section. Pull gently and evenly, avoiding jerking motion. If the
mold does not budge, tap the connection edge (where the halves bolt together) using a
piece of wood and a hammer, alternating from one side to another. Be careful not to
strike the concrete with the hammer and always use a piece of wood. One person should
be pulling on the mold while another is tapping. Remove the front section of the mold.
Using some concrete, patch the hole created by the clamping bolt, any cracks that appear,
and any other significant imperfections in the concrete. Scrape the rough edges off the
filter. These usually occur at the top of the filter and along the two sides where the seam
of the outer mold section was. Scraping should be done while the concrete is still curing.

The Arsenic Biosand Filter Project Appendix E – ABF Manufacturing
141
Keep the filter wet and out of the sun for 2 to 3 days to allow the concrete to cure
properly. Water can be poured in to keep the filter body wet. If it cures too quickly due
to sun exposure or a warm, dry wind, cracking may occur. Clean the mold and all its
parts. If an even, debris-free layer of lard or oil remains on the mold, it may be left for the
next casting.
Diffuser Box
The diffuser box is tin metal box with 3 mm perforations spaced 2 cm apart in a square
grid at the bottom. The box rests on the inner ledge above the resting water level. The
main function of the diffuser box is to distribute the fall of the water over the whole
filtering surface to avoid damage to the upper sand layer and the destruction of the
biological layer.
A main criterion for the choice of metal is non-corrosiveness. Tin was chosen. A metal
box is usually made from three sheets of metal. To increase rigidity, the top edge of the
diffuser basin is folded back. Holes are drilled at the base of the diffuser box. The
dimensions of a diffuser box are approximately 30 cm x 30 cm x 20 cm. There should be
a handle on the box for lifting it out of the filter.
Sand and Gravel
Sand porosity is an important factor relative to the formation of the filter cake and the
biologically active zone. Sand porosity depends on the size and shape of the grains. It
increases with the size of the grains and with the homogeneity of grain size and shape.
High porosity leads to high flow rate and low probabilities of collisions between particles
in water and the sand grains. Low porosity will bring about low flow rate and clogging.
Therefore, a moderate porosity is required for optimal operation of the BSF. The
porosity is small enough to trap particles in the water and large enough to let the water
through and allow some room for biological growth.
The following are requirements for the type of sand appropriate for use in a slow sand
filter:

The Arsenic Biosand Filter Project Appendix E – ABF Manufacturing
142
• Hard, durable, angular grains free from loam, clay and organic matter. Angular
grains decrease porosity and increase resistance to flowing water.
• An effective diameter (d10) range of 0.15-0.35mm.
• A uniformity coefficient (Cu) of less than 3. Uniformity coefficient is a ratio
calculated as the size opening that will just pass 60 percent (by weight) of a
representative sample of the filter material divided by the size opening that will
just pass 10 percent (by weight) of the same sample95. This implies a fairly
narrow range of grain sizes with an almost even distribution between the smallest
10% and the largest 10% and with most of the grains being a size in the middle.
This distribution of sizes decreases the porosity of the sand, increasing the surface
area per volume and the likelihood of collisions in the top portions of the sand.
Preparation
There are several steps to the preparation of the sand and gravel.
Step 1: Locating source of gravel and sand
Sand from a crushing operation is usually clean and relatively uniform in size and shape.
It requires the least preparation and is often an excellent sand source. In the absence of a
manufactured source, it is necessary to locate a natural hillside sand deposit, or use
riverbed sand. The fine sand used in the ABFs is river sand. Although river sand could
be contaminated from human, animal, and other organic wastes, a study by Stroller and
Coan in 2002 showed that biosand filters installed with river sand performed better than
biosand filters installed with crushed sand or burnt sand96. Research at MIT by Pincus
seeks to investigate this apparent paradox97.
Step 2: Biological quality testing
Each sand source needs to be tested for its biological quality. A sand source that is
regularly used should be tested every 6 months. The following is the recommended
procedure98:
1. Boil about 1 liter of the cleanest and purest water available (not distilled, mineral,
or chlorinated water) for about 5 minutes.

The Arsenic Biosand Filter Project Appendix E – ABF Manufacturing
143
2. Let the water cool to room temperature
3. Test a sample of this water for microbial contamination. This is used as a control.
4. Add 5 g of sand to 100 ml of water. Stir to mix, cover and let sit indoor or in the
shade for 12 hours.
5. Decant the water into a clean container.
6. Test a sample of this water for microbial contamination.
The boiled water should show negative results. If it does not, there has been a sampling
error or the water was not boiled long enough. Positive results in the water with sand
sample means the contamination is coming from the sand. Sand from this sand source is
not suitable for use in the filter; however it could be used for the construction of the
concrete body. More sand sources should be sought out and tested for biological quality
as outlined above until a clean source is found99. Alternatively, the sand could be
disinfected by soaking in a chlorine solution (e.g. Piyush) or spread out in the sun.
Step 3: Sifting
Sifting is required to separate coarse and fine sands from underdrain gravel and larger
rocks. A total of three different size screens are needed: 12 mm screen for under-drain
gravel, 6 mm screen for the coarse sand, and 1 mm screen for the fine sand.
Step 4: Cleaning and Flow Rate Test
The sand must be free of dirt, clay fines, and organic matter. Slow sand filters are not
backwashed so after the sand is placed in the filter beds, it cannot be cleaned quickly or
easily. Therefore, sand must be washed and impurities removed before placement in the
filter.
Lid
A lid is essential to prevent debris, insects and dirty hands from entering and
contaminating the filter. The lid should cover the filter at all times, except when adding
water or performing maintenance. The lid may be made out of any material, but it must
be clean, must not contain gaps that insects might pass through and should be secure and
heavy enough so young children cannot disturb it.

The Arsenic Biosand Filter Project Appendix F – ENPHO ABF Setup
144
APPENDIX F - ENPHO ARSENIC BIOSAND FILTER SETUP AND
PILOT STUDY
Setup
Following the same design concept of Tommy Ngai, ENPHO staff designed and installed
six arsenic biosand filters. Their filter setup is identical to the new design by Tommy
Ngai’s team, as shown in Section 4.1 Figure 3.
Pilot Study
Six ENPHO ABFs were installed between September 5 and October 30, 2002 in the
Nawalparasi District (household shown in Table 45). ENPHO staff was responsible for
the entire process of the pilot study, including the transportation of the filters to the
villages, installation at selected households, education of users, and monitoring of arsenic
performance. Arsenic in the raw well water and filtered water was tested every two
weeks, using both the ENPHO New Arsenic Field Test Kit, and the ENPHO laboratory.
Table 45 - Summary of the ENPHO ABF Pilot Study
VDC Village Contact Person Installation Date
Iron nails given (kg)
Tilakpur Patkhauli Nim Chaudhary Oct 30, 2002 0 Tilakpur Patkhauli Min Chaudhary Oct 30, 2002 5 Tilakpur Patkhauli Phakir Kami Oct 30, 2002 5 Tilakpur Tilakpur Phagu N. Chaudhary Oct 30, 2002 5
Panchanagar Bhutaha Lila B. Pun Oct 30, 2002 5 Panchanagar Bhanunagar Bhanu Primary School Sep 5, 2002 5

The Arsenic Biosand Filter Project Appendix F – ENPHO ABF Setup
145
Monitoring Results by ENPHO
The results for the latest monitoring round (early December 2002) by ENPHO are shown
in Table 46.
Table 46 - ENPHO Pilot Study Monitoring Results for Arsenic (early December 2002)
Arsenic by ENPHO Lab Contact Person Raw
(µg/L) Filtered (µg/L)
% Removal
Nim Chaudhary 78 3 96 Min Chaudhary 241 6 98
Phakir Kami 175 2 99 Phagu N. Chaudhary 224 4 98
Lila B. Pun 157 0.4* 99 Bhanu Primary School 225 38 83
Average= 95 Note: * This value of 0.4 mg/L is probably below the reliable detection limit of the
instrument, therefore the result is doubtful. This filter result is not used in the
calculation of average arsenic removal.
Discussion of Results
Excellent arsenic removal is observed from all six ABFs installed by ENPHO. The
average arsenic removal efficiency is 95%. This value confirm with the 93% removal
efficiency obtained by Tommy Ngai’s team, testing on the same filters
It should be noted that the ABF installed at Bhanu Primary School is the first ABF in
Nepal. It was installed on September 5, 2002 by ENPHO, who followed the installation
instruction given by Tommy Ngai in July 2002. The ABF at the school is currently
serving about 200 students, as opposed to other filters that are serving one family.
Because of the earliest installation date and the highest number of users, this ABF has
probably treated more water than any other ABFs in Nepal. The fact that this filter can
still remove a high percentage of arsenic suggests that the iron nails may have a very high
arsenic adsorption capacity.

The Arsenic Biosand Filter Project Appendix G – RWSSSP 3-Kolshi Setup
146
APPENDIX G - RWSSSP 3-KOLSHI FILTER SETUP AND PILOT
STUDY
Setup
The 3-Kolshi Filter was originally developed at Bangladesh by the following
organization in 2000100:
• Sono Diagnostic Center Environment Initiative (SDCEI), Kushtia, Bangladesh
(Contact: A.H.Khan, et.al , 2000.)
• BRAC, Dhaka Community Hospital, Grameen Bank
• Department of Public Health Engineering (with Ministry of LGD&C, UNICEF)
• NGO Forum (with SDC, DANIDA & CAFOD/EU Partner NGOs)
This technology was transferred to RWSSSP in 2002. A picture of the filter is shown in
Figure 52. A cross-section diagram of the filter setup is illustrated in Figure 53.
Figure 52 - A 3-Kolshi Filter Installed in a household in Barkalpur VDC of Kapilvastu District
Top kolshi
Metal stand
Bottom kolshi
Middle kolshi
Lid

The Arsenic Biosand Filter Project Appendix G – RWSSSP 3-Kolshi Setup
147
Figure 53 - RWSSSP 3-Kolshi Filter Cross-Section

The Arsenic Biosand Filter Project Appendix G – RWSSSP 3-Kolshi Setup
148
Pilot Study
About fifteen 3-Kolshi Filters has been installed in two arsenic-affected villages (Dubiya
VDC and Barkalpur VDC) by RWSSSP in the summer of 2002. RWSSSP staff was
responsible for the entire process of the pilot study, including the transportation of the
filters to the villages, installation at selected households, education of users, and
monitoring of arsenic performance. Five of the filters have been visited by Tommy
Ngai’s team to assess the filters’ preliminary performances. However, two of the five
filters were broken during the visit. Table 47 shows the details of the remaining three
filters.
Table 47 - Three RWSSSP 3-Kolshi Filters Visited by Tommy Ngai’s Team
District VDC Village Contact Person Installation Date Kapilvastu Dubiya Rangai Aitwari Chaudhary
(2761) August 2002
Kapilvastu Dubiya Rangai Sukhal Chaudhary (2761)
August 2002
Kapilvastu Dubiya Rangai Jhinku Chaudhary (2761)
August 2002
Monitoring Results by RWSSSP
The results by RWSSSP are not included here.

The Arsenic Biosand Filter Project Appendix H – Compare Analytical Methods
149
APPENDIX H - COMPARISON BETWEEN ANALYTICAL ARSENIC
TEST METHODS
This appendix shows the comparison between the arsenic test results from the MIT
Parsons Laboratory’s Perkin-Elmer Graphite Furnace Atomic Absorption Spectrometer
(GFAAS) and ENPHO Laboratory’s SOLAAR 969 Hydride Generation Atomic
Absorption Spectrometer (HGAAS); followed by the comparison between the MIT’s
GFAAS and Industrial Test Systems Inc. (ITS) Arsenic Check Field Test Kit. Refer to
Chapter 6 for a description of each of the above arsenic test methods.

The Arsenic Biosand Filter Project Appendix H – Compare Analytical Methods
150
Comparison between MIT GFAAS and ENPHO HGAAS
In June 2002, 22 arsenic samples collected by ENPHO in Nepal, were analyzed by
Tommy Ngai at the MIT Parsons Laboratory’s GFAAS for arsenic concentration. After
the analysis was completed, the results were sent to ENPHO for comparison. At the
same time, a split-sample of these 22 samples were analyzed by ENPHO Laboratory’s
HGAAS. Table 48 compares the two laboratory results. The average absolute %
difference is 31%, which is very good. The high level of agreement shows that the
ENPHO laboratory results are usually dependable and accurate.
Table 48 - A Comparison of Arsenic Split-Sample Results Analyzed at MIT Laboratory vs. ENPHO Laboratory
Total Arsenic (µg/L) Sample # MIT ENPHO
Absolute %
Difference*
1 38 67 76 2 380 338 11 3 102 124 22 4 99 134 35 5 59 82 38 6 48 58 21 7 46 89 93 8 334 412 23 9 384 340 12 10 276 281 2 11 222 289 30 12 72 47 35 13 69 31 55 14 66 28 58 15 73 46 37 16 177 123 30 17 138 125 10 18 53 53 0 19 71 95 35 20 41 26 36 21 42 51 21 22 55 51 7 Average = 31
*Note: The Absolute % Difference is calculated by calculating the absolute value of the difference between MIT and ENPHO values and dividing the difference by the MIT values.

The Arsenic Biosand Filter Project Appendix H – Compare Analytical Methods
151
Comparison between MIT GFAAS and ITS Arsenic Field Test Kit
Tommy Ngai compared the arsenic results between the MIT GFAAS and the ITS
ArsenicCheck Field Test Kit as part of his Master Thesis work101. A total of 23 Nepal
water samples were analyzed in Nepal in January 2002 using the ITS Arsenic Field Test
Kit. A split-sample of these 23 samples were preserved and brought to MIT for GFAAS
analysis. These samples were analyzed by Tommy Ngai between February and March
2002. Table 49 compares the two sets of results. On average, 78% of the results agree
with each other, which is quite good. The fairly high level of agreement shows that the
ITS Arsenic Field Test Kit results are often dependable and accurate.
Table 49 - A Comparison of Arsenic Split-Sample Results Analyzed at MIT Laboratory vs. Industrial Test Systems Arsenic CheckTM Field Test Kit
Total Arsenic (µg/L) Sample # GFAAS ITS kit
Agreement?
1 572 500 yes 2 863 800 yes 3 121 100-200 yes 4 328 200 no 5 158 50-100 no 6 149 100-200 yes 7 140 100 yes 8 93 50-100 yes 9 154 100 yes 10 102 100-200 yes 11 103 50-100 yes 12 96 100-200 no 13 95 50 no 14 56 50-100 yes 15 150 100-200 yes 16 91 200 no 17 328 300-500 yes 18 233 200-300 yes 19 242 300 yes 20 45 20-50 yes 21 70 100 yes 22 147 200 yes 23 16 10 yes Average = 78 %

The Arsenic Biosand Filter Project Appendix I – Human Subjects in Experiment
152
APPENDIX I - ETHICS OF EXPERIMENTAL WORK WITH HUMAN
SUBJECTS
In the US, public attention was drawn to the ethical issues related to experimental work
with human subjects by reported abuses of human subjects in concentration camps during
World War II. As a result, in 1978, the National Commission for the Protection of
Human Subjects of Biomedical and Behavioral Research (established by Public Law 93-
348 in 1974) submitted "The Belmont Report: Ethical Principles and Guidelines for the
Protection of Human Subjects of Research."102, which describes the basic ethical
principles underlying the acceptable conduct of research involving human subjects.
These principles are respect for persons, beneficence, and justice.
In practice, respect for persons involves obtaining the informed consent of subjects, i.e.
people should be given clear information about the experiment that they will be subjected
to, they should fully understand the terms and conditions and they should be allowed to
freely decide whether or not to be part of the experiment. In addition subjects must know
that they can withdraw from the research at any time. If a person cannot make an
autonomous decision (due to age or mental incapacity), that person should be protected.
Tommy Ngai and RWSSSP applied these guidelines by telling villagers that the filters
were experimental and not guaranteed to remove arsenic, iron and bacteria. The villagers
were asked if they wanted to participate in the experiment, and they all agreed. Most of
the villagers currently have no satisfactory alternative to their poor quality drinking
water. They believe that even if the filters have mediocre performance, they are still
better off with the experimental filters than with their existing conditions.
Beneficence involves protecting subjects from harm by maximizing anticipated benefits
and minimizing possible risks of harm. In this case, the filters did have the great potential
to remove arsenic, iron and bacteria, while at the same did not represent a health treat.
The filters are made of concrete, sand, gravel, and iron nails; and do not contain any

The Arsenic Biosand Filter Project Appendix I – Human Subjects in Experiment
153
known toxic substances. Thus anticipated benefits were maximized and risks were
minimized, by the very nature of the ABFs.
Finally, justice requires that the benefits and burdens of research be distributed fairly.
This means that if there are burdens placed on the subjects or type of subjects, they
should also receive the benefits of the project. For example, it is inappropriate to use
poor people in experiments that would only benefit rich people. Tommy Ngai and
RWSSSP applied this principle by selecting subjects based on levels of arsenic in wells,
and not by any other criteria such as cast, tribe, gender, income, etc. Moreover, the filters
directly impact the subjects in a positive way if they work and neutral if they don’t work.
In conclusion, the use of human subjects (i.e. villagers) in the ABF pilot study is justified
on the above basis.

The Arsenic Biosand Filter Project References
154
REFERENCES
1 Ngai, Tommy K.K. “Arsenic Speciation and Evaluation of Adsorption Media in Rupandehi and Nawalparasi Districts of Nepal.” MIT Master of Engineering Thesis. May 2002. 2 World Bank Indicator Database April 2002. Accessed on April 9, 2003. Available: www.worldbank.org 3 United Nations Children’s Fund Statistics. “Nepal Country Information.” Accessed on April 9, 2003. Available: http://www.unicef.org/statis/Country_1Page122.html 4 United Nations Children’s Fund Statistics. “Nepal Country Information.” April 9, 2003. Available: http://www.unicef.org/statis/Country_1Page122.html 5 World Bank Indicator Database April 2002. Accessed on April 9, 2003. Available: www.worldbank.org 6 United Nations Children’s Fund Statistics. “Nepal Country Information.” April 9, 2003. Available: http://www.unicef.org/statis/Country_1Page122.html 7 World Bank Group. “Nepal at a glance.” 29 Feb 2002. Available: http://www.worldbank.org/data/countrydata/aag/npl_aag.pdf 8 Nepal Red Cross Society “Research on Arsenic Contamination in the Groundwater of Terai Nepal.” Final Report. Sep 2000. 9 Nepal Red Cross Society “Research on Arsenic Contamination in the Groundwater of Terai Nepal.” Final Report. Sep 2000. 10 Halsey, Patricia M. “Arsenic Contamination Study of Drinking Water in Nepal.” MIT Master of Engineering Thesis. May 2000. 11 Nepal Red Cross Society “Research on Arsenic Contamination in the Groundwater of Terai Nepal.” Final Report. Sep 2000. 12 Nepal Red Cross Society “Research on Arsenic Contamination in the Groundwater of Terai Nepal.” Final Report. Sep 2000. 13 Rural Water Supply and Sanitation support Program. “Summary of Arsenic Test Results.” Jan 2002. 14 Nepal Red Cross Society “Research on Arsenic Contamination in the Groundwater of Terai Nepal.” Final Report. Sep 2000.

The Arsenic Biosand Filter Project References
155
15 World Health Organization. “United Nations Synthesis Report on Arsenic in Drinking Water.” Internet. Accessed on April 9, 2003. Available: http://www.who.int/water_sanitation_health/Arsenic/ArsenicUNRep1.htm 16 Ngai, Tommy K.K. “Arsenic Speciation and Evaluation of Adsorption Media in Rupandehi and Nawalparasi Districts of Nepal.” MIT Master of Engineering Thesis. May 2002. 17 Gao, Yong Xuan. “Community-Based Water Supply: Tubewell Program in the Lumbini Zone, Nepal.” MIT Master of Engineering Thesis. May 2002. 18 UNICEF water and sanitation database. Access on April 25, 2002. Available: www.unicef.org 19 Lee, Tse-Luen. “Biosand Household Water Project in Nepal”. MIT Master of Engineering Thesis. May 2001. 20 Lackovic, J.A., N.P. Nikolaidis and G.M. Dobbs. Inorganic Arsenic Removal by Zero-Valent Iron. Environmental Engineering Science, vol 17, no. 1. p.29-39. 2000. 21 Bridge, T. “Arsenic Crisis: A challenge for Scientists to find the Origin of the Arsenic that caused the Poisoning Disaster in Bangladesh.” University of Kansas, Kansas, USA. 2000. 22 Husain, M. “Oxyhydroxide Reduction and Agrochemical Hypotheses: Myth or Reality?” Kansas Dept. of Health And Environment, Kansas, USA. 2000. 23 Harvey, C. “The Arsenic Crisis in Bangladesh: An Epidemiological, Hydrologic and Biogeochemical Analysis”. Associated Professor, Massachusetts Institute of Technology. Presentation on April 22, 2002. 24 Hurd, Jessie. “Evaluation of three Arsenic Removal Technologies in Nepal”. MIT Master of Engineering Thesis. May 2001. 25 Murcott, Susan. “Arsenic Remediation Technologies – Online Information Database”. Internet, Accessed on March 31, 2003. Available: http://web.mit.edu/murcott/www/arsenic/ 26 Fields, K., Chen, A., Wang, L. “Arsenic Removal from Drinking Water by Iron Removal Plants”, EPA Report EPA/600/R-00/086. 2000 27 Gulledge, J. H. and O’Connor, J. T. “Removal of As(V) From Water by adsorption on Aluminum and Ferric Hydroxide”, Journal of American Water Works Association, August 1973.

The Arsenic Biosand Filter Project References
156
28 Munir et al. “Evaluation of Performance of Sono 3-Kolshi Filter for Arsenic Removal from groundwater Using Zero-Valent Iron Through Laboratory and Field Studies”, Technologies for Arsenic Removal from Drinking Water, p. 171-189, May 2001 29 Robins, R., Nishimura, T., Singh, P. “Removal of Arsenic from Drinking Water by Precipitation, Adsorption or Cementation.” Technologies for Arsenic Removal from Drinking Water. P. 31-41. May 2000. 30 Bellamy, W. D., Silverman, G. P., Hendricks, D. W., & Logsdon, G. S. “Removing Giardia cysts with slow sand filtration”. Journal of American Water Works Association, vol. 77, no. 2, p. 52-60, 1985 31 Weber-Shirk, M. L. and Dick, R. I. ‘”Physical-Chemical Mechanisms in Slow Sand Filters”. Journal American Water Works Association, vol. 89, no.1, pp. 87-100, 1997 32 Lukacs, Heather. “From Design to Implementation: Innovative Slow Sand Filtration for use in Developing Countries.” MIT Master of Engineering Thesis. May 2002. 33 Lukacs, Heather. “From Design to Implementation: Innovative Slow Sand Filtration for use in Developing Countries.” MIT Master of Engineering Thesis. May 2002. 34 Lee, Tse-Luen. “Biosand Household Water Project in Nepal”. MIT Master of Engineering Thesis. May 2001. 35 Buzunis, B. J. “Intermittently Operated Slow Sand Filtration: A New Water Treatment Process.” University of Calgary Masters Thesis. 1995. 36 Herzig, J. P., Leclerc, D. M., and LeGolf, P. “Flow of Suspensions Through Porous Media: Application to Deep Filtration.” Ind. Eng. Chem. Vol. 62, p. 8-35. 1970. 37 Haarhoff, Johannes, and John L. Cleasby. “Biological and Physical Mechanisms in Slow Sand Filtration”. Slow Sand Filtration. Gary Logsdon, ed. American Society of Civil Engineers, New York, 1991 38 Gerba, C. P., Yates, M. V. and Yates, S. R.. “Quantification of Factors Controlling Viral and Bacterial Transport in the Subsurface.” Modeling the Environmental Fate of Microorganisms, (C. J. Hurst, ed) American Society of Microbiology Press, Washington, DC p.77-88. 1991. 39 Harvey, R. W. and S. P. Garabedian. “Use of Colloid Filtration Theory in Modeling Movement of Bacteria Through a Contaminated Sandy Aquifer.” Environmental Science and Technology. Vol 25. p. 178-185. 1991

The Arsenic Biosand Filter Project References
157
40 Huisman, L. and Wood, W. E. Slow Sand Filtration. World Health Organization, Geneva. 1974. 41 Collins, M. R., Eighmy, T. T., Fenstermacher, J. M., and Spanos, S. K. “Removing Natural Organic Matter by Conventional Slow Sand Filtration.” Journal AWWA. p. 80-90. May 1992. 42 Huisman, L. and Wood, W. E. Slow Sand Filtration. World Health Organization, Geneva. 1974. 43 Buzunis, B. J. “Intermittently Operated Slow Sand Filtration: A New Water Treatment Process.” University of Calgary Masters Thesis. 1995. 44 Ritenour, R. “BioSand household Water Filter: A transfer of Slow Sand Filtration Technology to Developing Countries”. 3rd ed. Samaritan’s Purse, Canada. 1998. 45 Harvey, R. W., C.J. Hurst ed. “Parameters Involved in Modeling Movement of Bacteria in Groundwater.” Modeling the Environmental Fate of Microorganisms, (C. J. Hurst, ed) American Society of Microbiology Press, Washington, DC p.77-88. 1991. 46 Weber-Shirk, M. L. and Dick, R. I. “Biological Mechanisms in Slow Sand Filters”. Journal American Water Works Association, vol. 89, no.2, p. 72-83, 1997. 47 Baral, J.K. Personal communication. Director of Health, Water, Sanitation & Housing at PROSHIKA, Dhaka, Bangladesh, Oct 17, 2002. 48 Jellison, K.L., Dick, R. I., and Weber-Shirk, M. L. (December 2000) “Enhanced Ripening of Slow Sand Filters.” Journal of Env. Eng. p. 1153-1157. 49 Gupta, Anirban. Personal communication. Assistant Professor at Bengal Engineering College, Civil Engineering Department, Howrah, Calcutta, India. Oct 12, 2002. 50 Bellamy, W. D., Silverman, G. P., Hendricks, D. W., & Logsdon, G. S. “Removing Giardia cysts with slow sand filtration”. Journal of American Water Works Association, vol. 77, no. 2, p. 52-60, 1985 51 Pincus, Melanie. “Safe Drinking Water via BioSand Filtration: Pilot Project Evaluation and Feasibility Study of a BioSand Pitcher Filter.”. MIT Master of Engineering Thesis. May 2003. 52 Lee, Tse-Luen. “Biosand Household Water Project in Nepal”. MIT Master of Engineering Thesis. May 2001. 53 Smith, A. “Everything but the Kitchen Sink – Exposure to Arsenic from Bathing and Other Indirect Water Pathways.” Environmental Toxicology Program, Bureau of Health, Department of Human Services, State of Maine. Conference Abstract. Arsenic in New

The Arsenic Biosand Filter Project References
158
England: A Multidisciplinary Scientific Conference, May 29-31, 2002, Manchester, New Hampshire. 54 Milton, A. “An Intervention Trail to Assess the Contribution of Food Chain to Total Arsenic Exposure.” Australian National University. Conference Abstract. 5th International Conferenc on Arsenic Exposure and Health Effects, July 14-18, 2002, San Diego, California. 55 Hussam, A. “Evaluation of Arsine Generation in Arsenic Field Kit.” Environmental Science and Technology, 1999, Vol 33, p. 3686-3688. 56 Ngai, Tommy K.K. “Arsenic Speciation and Evaluation of Adsorption Media in Rupandehi and Nawalparasi Districts of Nepal.” MIT Master of Engineering Thesis. May 2002. 57 Hussam, A. “Evaluation of Arsine Generation in Arsenic Field Kit.” Environmental Science and Technology, 1999, Vol 33, p. 3686-3688. 58 U.S. Environmental Protection Agency. “Analytical Methods Support Document for Arsenic in Drinking Water”. 1999 59 Shrestha, Roshan. Personal email communications. Executive chairperson of Environment and Public Health Organization, Kathmandu, Nepal. April 3, 2003. 60 Shrestha, Roshan. Personal email communications. Executive chairperson of Environment and Public Health Organization, Kathmandu, Nepal. April 3, 2003. 61 Stetler, E.R. “Coliphages as Indicators of Enteroviruses”. Applied and Environmental Microbiology. Vol. 48. No.3. p. 668-670. Sep 1994 62 World Health Organization (WHO), “Guidelines for Drinking Water Quality, Vol. 2 – Health criteria and other supporting information.” 2nd ed. Geneva. 1996. 63 Low, Jason. “Appropriate Microbial Indicator Tests for Drinking Water in Developing Countries.” MIT Master of Engineering Thesis. May 2002. 64 Millipore. “M-ColiBlue24 ® Broth Instructions”. Internet, March 2, 2003. Available: http://www.millipore.com/publications.nsf/docs/PC021 65 Shrestha, Roshan. Personal email communications. Executive chairperson of Environment and Public Health Organization, Kathmandu, Nepal. April 3, 2003. 66 Hwang, Soon Kyu. “Point of Use Arsenic Removal from Drinking Water in Nepal using Coagulation and Filtration”. MIT Master of Engineering Thesis. May 2001.

The Arsenic Biosand Filter Project References
159
67 Dr. Manz, David. Personal telephone communication. Inventor of the Biosand Filter. July 31, 2002. 68 Hwang, Soon Kyu. “Point of Use Arsenic Removal from Drinking Water in Nepal using Coagulation and Filtration”. MIT Master of Engineering Thesis. May 2001. 69 US Environmental Protection Agency (EPA). “Environmental Technology Verification Report (ETV), QuickTM Arsenic Test Kit.” Prepared by Battelle, July 2002. 70 Ngai, Tommy K.K. “Arsenic Speciation and Evaluation of Adsorption Media in Rupandehi and Nawalparasi Districts of Nepal.” MIT Master of Engineering Thesis. May 2002. 71 U.S.EPA “Current Drinking Water Standards.” Internet, April 11, 2002. Available: http://www.epa.gov/safewater/mcl.html 72 University of Western Australia. “Arsenic Water Chemistry”. Internet. Accessed on Nov 28, 2001. Available: www.cwr.uwa.edu.au/~linge/word/arsenic.htm. 73 Viessman, W., Hammer, M. “Water supply and Pollution Control.” 6th ed. Addison-Wesley Longman, Inc.: Menlo Park, Ca. 1998. 74 Cheng, R.C., Liang, S. Wang, H.C. and Beuhler, M.D. “Enhanced coagulation for arsenic removal” Journal of American Water Works Association, vol. 86(9), p. 79. 1994 75 Hering , J.G., Chen, C., Wilkie, J.A., Elimelech, M. 1997, “Arsenic Removal from Drinking Water During Coagulation”, Journal of Environmental Engineering, Vol. 123, No. 8, p. 800. August 1997 76 Metcalf & Eddy. “Wastewater Engineering. Treatment, Disposal, and Reuse.” 3rd ed. McGraw-Hill Inc. New York. 1991. 77 Panday, Upendra. Personal interview. September 20, 2002. 78 Low, Jason. “Appropriate Microbial Indicator Tests for Drinking Water in Developing Countries.” MIT Master of Engineering Thesis. May 2002. 79 Sullivan, Hannah. “Household Water Chlorination for the Developing World. A Case Study in Lumbini, Nepal.” MIT Master of Engineering Thesis. May 2002. 80 Paynter, Nathaniel. “Household Water Use and Treatment Practices in Rural Nepal BioSand Filter Evaluation and Considerations for Future Projects”. MIT Master of Engineering Thesis. May 2001.

The Arsenic Biosand Filter Project References
160
81 Stroller, Scott., Coan, Seth. “Biosand Filter Experiment in Lumbini, Nepal.” University of California, Berkeley. Nov 2002. 82 Pincus, Melanie. “Safe Drinking Water via BioSand Filtration: Pilot Project Evaluation and Feasibility Study of a BioSand Pitcher Filter.”. MIT Master of Engineering Thesis. May 2003. 83 Huisman, L. & Wood, W.E. Slow Sand Filtration, World Health Organization, Geneva, 1974 84 Freeze, A., Cherry, J. “Physical Properties and Principles.” Groundwater. Page 15-80. Prentice-Hall: New Jersey. 1979. 85 Tabbal, Georges. “Social and Technical Evaluations of Three Arsenic Removal Technologies in Nepal.” MIT Master of Engineering Thesis, May 2003 86 Howard, Guy., Bartam, Jamie. “Domestic Water Quantity, Service Level, and Health.” World Health Organization 2003. Internet. Accessed on April 7, 2003. Available: http://www.who.int/water_sanitation_health/Documents/domesticwater/domestwatertoc.htm 87 Howard, Guy., Bartam, Jamie. “Domestic Water Quantity, Service Level, and Health.” World Health Organization 2003. Internet. Accessed on April 7, 2003. Available: http://www.who.int/water_sanitation_health/Documents/domesticwater/domestwatertoc.htm 88 Tabbal, Georges. “Social and Technical Evaluations of Three Arsenic Removal Technologies in Nepal.” MIT Master of Engineering Thesis, May 2003 89 WHO. “Guideline for Drinking Water Quality, 3rd ed.”. Chapter 3, Health-Based Targets. World Health Organization. 2003. 90 Tabbal, Georges. “Social and Technical Evaluations of Three Arsenic Removal Technologies in Nepal.” MIT Master of Engineering Thesis, May 2003 91 Paynter, Nathaniel. “Household Water Use and Treatment Practices in Rural Nepal BioSand Filter Evaluation and Considerations for Future Projects”. MIT Master of Engineering Thesis. May 2001. 92Kofi Annan, United Nations Secretary-General. 2003. 93 Lee, Tse-Luen. “Biosand Household Water Project in Nepal”. MIT Master of Engineering Thesis. May 2001. 94 IDRC Module 5. Slow Sand Filters, 1998

The Arsenic Biosand Filter Project References
161
95 Sims, R. C. & Slezak, L. A. “Slow Sand Filtration: Present Practice in the United States." Slow Sand Filtration. Gary Logsdon, ed. American Society of Civil Engineers, New York. 1991 96 Stroller, Scott., Coan, Seth. “Biosand Filter Experiment in Lumbini, Nepal.” University of California, Berkeley. Nov 2002. 97 Pincus, Melanie. “Safe Drinking Water via BioSand Filtration: Pilot Project Evaluation and Feasibility Study of a BioSand Pitcher Filter.”. MIT Master of Engineering Thesis. May 2003. 98 Ritenour, R. “BioSand household water filter: A transfer of slow sand filtration technology to developing countries”. 3rd ed. Samaritan’s Purse, Canada, 1998 99 Ritenour, R. “BioSand household water filter: A transfer of slow sand filtration technology to developing countries”. 3rd ed. Samaritan’s Purse, Canada, 1998 100 Murcott, Susan. “Arsenic Remediation Technologies – Online Information Database”. Internet, Accessed on March 31, 2003. Available: http://web.mit.edu/murcott/www/arsenic/ 101 Ngai, Tommy K.K. “Arsenic Speciation and Evaluation of Adsorption Media in Rupandehi and Nawalparasi Districts of Nepal.” MIT Master of Engineering Thesis. May 2002. 102 National Commission for the Protection of Human Subjects of Biomedical and Behavioral Research. “The Belmont report : ethical principles and guidelines for the protection of human subjects of research / National Commission for the Protection of Human Subjects of Biomedical and Behavioral Research”, Washington, D.C. 1978.