the art of economic forecasting and the us economic
TRANSCRIPT

June 21, 2011
333 South Grand Avenue Los Angeles, CA 90071
The Art of Economic Forecasting & the Mid-Year US Economic Outlook
Jeffrey C. ClevelandSenior Economist

F:\GRAPHICS\Economics\USO\September 2010\USO September.ppt
Can We Model the Economy?The Economy
“Human behavior is simply too complex and nuanced to be fully represented mathematically, at least with the maths known to modern man. Maths can help us to gain insight into economic processes, but it is not the only way to gain such insight, nor even the most productive.” -- DeLisle Worrell, Governor of the Central Bank of Barbados
2

F:\GRAPHICS\Economics\USO\September 2010\USO September.ppt
33
The US Economy is Like A Giant Jigsaw Puzzle
F:\GRAPHICS\Economics\USO\September 2010\USO September.ppt
44
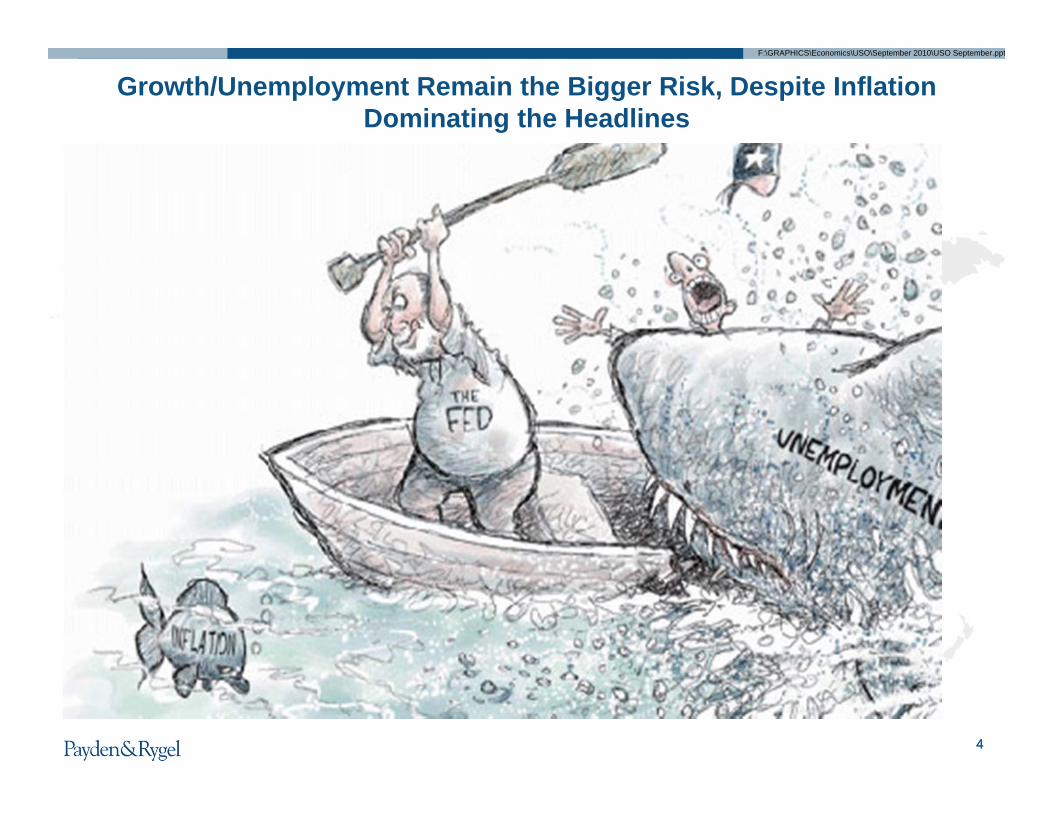
Growth/Unemployment Remain the Bigger Risk, Despite Inflation Dominating the Headlines
F:\GRAPHICS\Economics\USO\September 2010\USO September.ppt
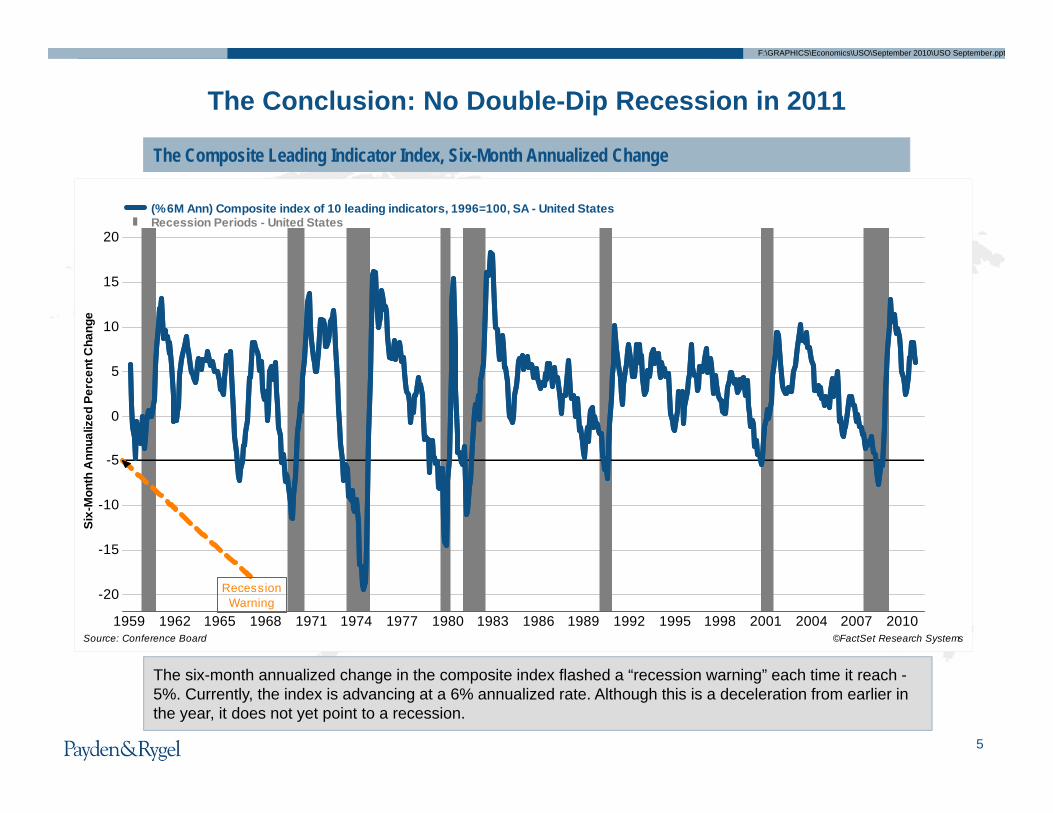
The Composite Leading Indicator Index, Six-Month Annualized Change
The Conclusion: No Double-Dip Recession in 2011
The six-month annualized change in the composite index flashed a “recession warning” each time it reach -5%. Currently, the index is advancing at a 6% annualized rate. Although this is a deceleration from earlier in the year, it does not yet point to a recession.
1959 1962 1965 1968 1971 1974 1977 1980 1983 1986 1989 1992 1995 1998 2001 2004 2007 2010
-20
-15
-10
-5
0
5
10
15
20
Six-
Mon
th A
nnua
lized
Per
cent
Cha
nge
Recession Warning
©FactSet Research SystemsSource: Conference Board
(% 6M Ann) Composite index of 10 leading indicators, 1996=100, SA - United States Recession Periods - United States
5

The Art of Economic ForecastingThe Art of Economic Forecasting
II
The Problem: The Plight of the Fortune Tellers
Types of Forecasting
Our Outlook: The Narrative
The Outlook in Numbers: GDP, Employment, Inflation, Interest Rates
III
IV
I

F:\GRAPHICS\Economics\USO\September 2010\USO September.ppt
The Problem: The Plight of the Fortune TellersI

F:\GRAPHICS\Economics\USO\September 2010\USO September.ppt
8
The Problem: How do we make decisions about the future in a world of uncertainty?
The Cardsharps, Cavaggio (1594)
Where is the economy headed?
What is the path of interest rates?
What are the inflation/deflation
risks?
What’s going on in the labor market?

F:\GRAPHICS\Economics\USO\September 2010\USO September.ppt
Physical science
Rain
Snow
Wind
Laboratory Experiments
Meteorology Economics
Social science
Human Beings
Human Choice
Data Availability
History, But Few Labs
“Most fundamentally, and perhaps most challenging for researchers, the crisis should motivate economists to think further about their modeling of human behavior.” – Ben Bernanke commenting on economics in the
wake of the financial crisis
The Economist or the Meteorologist: Which is More Accurate?
9

Types of ForecastsII

F:\GRAPHICS\Economics\USO\September 2010\USO September.ppt
11
Types of Forecasts
Forecast Type Example“Theory-free” forecasts Leading indicators
Mathematical “models” of the economy The Fed model
Market-based models The Yield Curve
“The Mental Model” The Art: Combines narrative + economic indicators + market-
based indicators

F:\GRAPHICS\Economics\USO\September 2010\USO September.ppt
12
The US Index of Leading Indicators Suggests Growth Will Improve
2006 2007 2008 2009 2010 2011
-5.0
0.0
5.0
10.0
Qua
rter
-ove
r-Q
uart
er A
nnua
lized
Per
cent
Cha
nge
-8.0
-6.0
-4.0
-2.0
0.0
2.0
4.0
6.0 Quarter-over-Q
uarter Annualized Percent C
hange
Sources: The Conference Board and The Commerce Department
Composite index of 10 leading indicators (Left)Real Gross Domestic Product (Right)
Composite of 10 Leading Economic Indicators and Real Gross Domestic Product (GDP)
The Conference Board’s Leading Economic Index (LEI) leads turning points in the economy by an average of 7 months. The index correctly predicted a rebound in real GDP growth over the past 2 years. At the present time, it is pointing to continued expansion in the second half of 2011.
Recession Periods – United States
Last Updated: Q2 2011

F:\GRAPHICS\Economics\USO\September 2010\USO September.ppt
1313
Short-Term Focus: Leading Economic Indicators Score CardLead Time(months) Reliability
Growth Momentum (3-Month Change)
Pointing to Recession?
Financial Indicators
Yield Curve 12 to 24 High Moderating XM2 12 to 24 Low Rising XStock Prices 3 to 6 Medium Moderating XReal Indicators
Building Permits 6 to 9 High Stable XISM Manufacturing Index 3 to 6 High Moderating XConsumer Expectations 3 to 6 Low Moderating XNew Orders for Nondefense Durable Goods 1 to 3 High Moderating XUnemployment Insurance Claims 1 to 3 Medium Moderating XNew Orders for Consumer Goods 1 to 3 Medium Moderating X Average Weekly Hours (Manufacturing) 1 to 3 High Stable X

F:\GRAPHICS\Economics\USO\September 2010\USO September.ppt
Real GDP and Yield Spread between 2-Year and 10-Year US Treasuries
The yield curve tends to lead the economy by between 1 to 2 years, and is defined as the difference between 2-and 10-year US Treasury yields. To illustrate, if investors think the coming two years will be much better for the economy than the next six years, the yield spread will be small or even negative. Currently, however, the curve is pointing towards a continued expansion.
The Yield Curve Is Indicating Positive Growth
1986 1988 1990 1992 1994 1996 1998 2000 2002 2004 2006 2008 2010-1%
-0.5%
0%
0.5%
1%
1.5%
2%
2.5%
3%
3.5%
Yiel
d Sp
read
in B
asis
Poi
nts
-6%
-4%
-2%
0%
2%
4%
6%
Year-to-Year Percent Change
Sources: Federal Reserve and the Commerce Department
US Treasury Yield Curve (10Yr - 2Yr) (Left)US Gross Domestic Product (Right)
Recession Periods - United States
14

F:\GRAPHICS\Economics\USO\September 2010\USO September.ppt
Money Supply (M2) and National Product Account
After falling sharply during the recession, the money supply (M2) began to expand again in mid-2010. M2 tends to lead the economy by between one to two years, so the recent expansion is a positive sign for future growth.
The Money Supply Has Begun to Expand
2001 2002 2003 2004 2005 2006 2007 2008 2009 20100%
2%
4%
6%
8%
10%
12%
Year
-to-
Year
Per
cent
Cha
nge
in M
2
-5%
-4%
-3%
-2%
-1%
0%
1%
2%
3%
4%
5%
Year-to-Year Percent Change in N
PA
©FactSet Research SystemsSource: The Federal Reserve
Money Supply M2 (Left)National Product Account GDP (Right)
Recession Periods - United States
15

F:\GRAPHICS\Economics\USO\September 2010\USO September.ppt
Stock Market Growth is Slower But Still Above Year-Ago LevelsUS Stock Prices
Despite a recent slowing, the S&P 500 is over 13% higher than it was one year ago. Stock prices generally lead the economy by between three to six months.
2009 2010-60%
-40%
-20%
0%
20%
40%
60%
80%
Year
-to-
Year
Per
cent
Cha
nge
©FactSet Research SystemsSource: Standard & Poor's
S&P 500 Stock Price Index Recession Period - United States
Equity prices are still rising, just less quickly
16

F:\GRAPHICS\Economics\USO\September 2010\USO September.ppt
After Plummeting Post-Tax Credit, Home Sales Show Some Life
Existing Home Sales and Economic Growth
The federal homebuyer tax credit produced a large spike in sales of existing homes in 2009-2010. Following the expiration of the credit, homes sales experienced the largest month-to-month percentage drop in history. However, after the initial adjustment, sales appear to be growing again, perhaps aided by record low mortgage rates and investors looking for deals on foreclosed homes.
2001 2002 2003 2004 2005 2006 2007 2008 2009 2010-40%
-30%
-20%
-10%
0%
10%
20%
30%
40%
50%
Year
-to-
Year
Cha
nge
-5%
-4%
-3%
-2%
-1%
0%
1%
2%
3%
4%
5%
Year-to-Year Change
©FactSet Research SystemsSources: National Association of Realtors and Commerce Department
US Existing-Home Sales (Left)US Real Gross Domestic Product, Lagged 1 Yr (Right)
Recession Periods - United States
17

F:\GRAPHICS\Economics\USO\September 2010\USO September.ppt
ISM Purchasing Managers Index and Non-Residential Business Investment
The Institute of Supply Management’s Index of manufacturing activity rose dramatically following the recession and continues to rise as demand returns and companies replenish their low inventories. Recently, the index reached a 25-year high. The steep pull back is a concern, but the measures is above 50, indicating expansion, not contraction. Business investment is likely to continue to grow in coming months.
Manufacturing and Business Investment Continue to Drive Growth
2001 2002 2003 2004 2005 2006 2007 2008 2009 2010-20
-15
-10
-5
0
5
10
Year
to Y
ear P
erce
nt C
hang
e
35
40
45
50
55
60
Index
Sources: Institute for Supply Management and the Commerce Department
ISM Manufacturing Index (Right)Business Investment (Left)Recession Periods - United States
18

F:\GRAPHICS\Economics\USO\September 2010\USO September.ppt
Confidence and Consumer Spending Battered by Gas Prices
2005 2006 2008 2009 2011
30
40
50
60
70
80
90
100
110
Inde
x
-2%
-1%
0%
1%
2%
3%
4%
Year-over-Year Percent Change
Sources: The Conference Board and The Commerce Department
The Conference Board Consumer Confidence Expectations (Left)Real Consumer Spending (Right)
Consumer Expectations Six Month Hence and Real Consumer Spending
After faltering in the summer of 2010, consumer confidence and consumer spending have rebounded into year end. Rising gas prices stifled consumer spending and sentiment in early 2011. Over the past decade, expectations have had an 89% correlation with consumer spending.
19
F:\GRAPHICS\Economics\USO\September 2010\USO September.ppt
2005 2006 2007 2008 2009 2010-25%
-20%
-15%
-10%
-5%
0%
5%
10%
15%
20%
Year
to Y
ear P
erce
nt C
hang
e
-40%
-30%
-20%
-10%
0%
10%
20%
30%
Year to Year Percent Change
©FactSet Research SystemsSources: Census Department and the Commerce Department
Business Investment (Left)Capital Expenditure Excluding Aircraft and Defense (Right)Recession Periods - United States
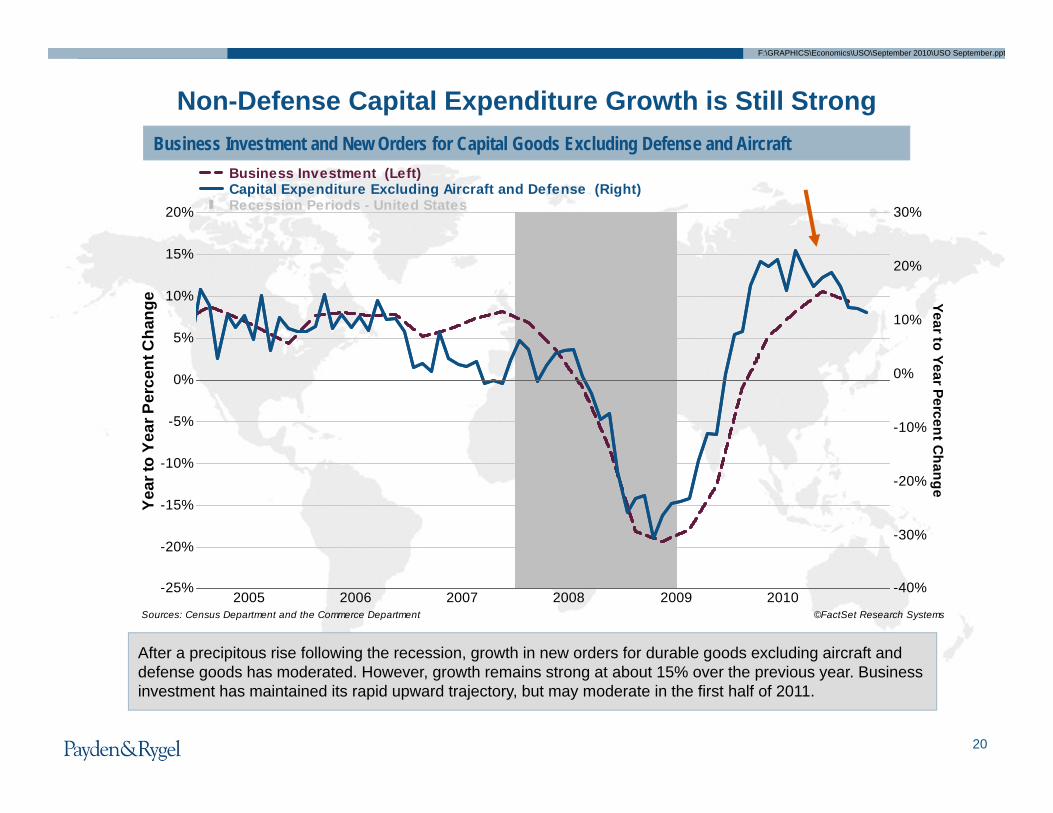
Business Investment and New Orders for Capital Goods Excluding Defense and Aircraft
After a precipitous rise following the recession, growth in new orders for durable goods excluding aircraft and defense goods has moderated. However, growth remains strong at about 15% over the previous year. Business investment has maintained its rapid upward trajectory, but may moderate in the first half of 2011.
Non-Defense Capital Expenditure Growth is Still Strong
20
F:\GRAPHICS\Economics\USO\September 2010\USO September.ppt
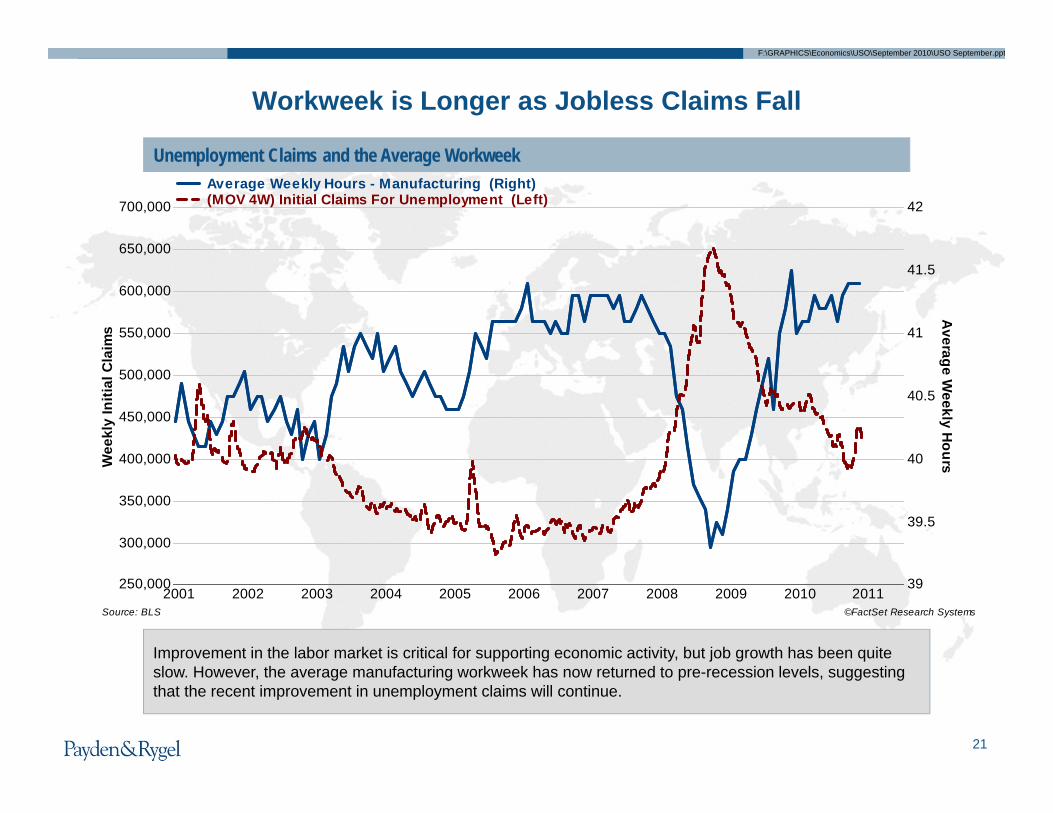
Unemployment Claims and the Average Workweek
Workweek is Longer as Jobless Claims Fall
Improvement in the labor market is critical for supporting economic activity, but job growth has been quite slow. However, the average manufacturing workweek has now returned to pre-recession levels, suggesting that the recent improvement in unemployment claims will continue.
2001 2002 2003 2004 2005 2006 2007 2008 2009 2010 2011250,000
300,000
350,000
400,000
450,000
500,000
550,000
600,000
650,000
700,000
Wee
kly
Initi
al C
laim
s
39
39.5
40
40.5
41
41.5
42
Average W
eekly Hours
©FactSet Research SystemsSource: BLS
Average Weekly Hours - Manufacturing (Right)(MOV 4W) Initial Claims For Unemployment (Left)
21

F:\GRAPHICS\Economics\USO\September 2010\USO September.ppt
The Composite Leading Indicator Index, Six-Month Annualized Change
The Conclusion: No Double-Dip Recession in 2011
The six-month annualized change in the composite index flashed a “recession warning” each time it reached -5%. Currently, the index is advancing at a 6% annualized rate. Although this is a deceleration from earlier in the year, it does not yet point to a recession.
1959 1962 1965 1968 1971 1974 1977 1980 1983 1986 1989 1992 1995 1998 2001 2004 2007 2010
-20
-15
-10
-5
0
5
10
15
20
Six-
Mon
th A
nnua
lized
Per
cent
Cha
nge
Recession Warning
©FactSet Research SystemsSource: Conference Board
(% 6M Ann) Composite index of 10 leading indicators, 1996=100, SA - United States Recession Periods - United States
22

F:\GRAPHICS\Economics\USO\September 2010\USO September.ppt
1946 1949 1952 1955 1958 1961 1964 1967 1970 1973 1976 1979 1982 1985 1988 1991 1994 1997 2000 2003 2006 2009
-4
-2
0
2
4
6
Yiel
d Sp
read
: 10-
year
Tre
asur
y yi
elds
min
us 3
-mon
th b
ill y
ield
s
©FactSet Research SystemsSource: FactSet
US Benchmark Bond - 10 Year - Yield - US Benchmark Bond - 3 Month - Yield Recession Periods - United States
The Yield Curve Model
The yield curve is the single most reliable predictor of recessions. Over the past 60 years, each time the yield curve “inverted,” or 3-month yields were higher than 10-year yields, the business cycle peaked about 18-24 months later and a recession followed. There was one false signal during the mid-1960s. Currently, the curve is very steep, indicating that the expansion is likely to continue.
False alarm
23

F:\GRAPHICS\Economics\USO\September 2010\USO September.ppt
Mathematical Models of the EconomyThe Economy
“Human behavior is simply too complex and nuanced to be fully represented mathematically, at least with the maths known to modern man. Maths can help us to gain insight into economic processes, but it is not the only way to gain such insight, nor even the most productive.” -- DeLisle Worrell, Governor of the Central Bank of Barbados
24

F:\GRAPHICS\Economics\USO\September 2010\USO September.ppt
Our Outlook: The Economic NarrativeIII

F:\GRAPHICS\Economics\USO\September 2010\USO September.ppt
2626
The US Economy is Like A Giant Jigsaw Puzzle

F:\GRAPHICS\Economics\USO\September 2010\USO September.ppt
1951 1954 1957 1960 1963 1966 1969 1972 1975 1978 1981 1984 1987 1990 1993 1996 1999 2002 2005 20081
1.5
2
2.5
3
3.5
4
Mul
tiple
of N
omin
al G
DP
Source: Federal Reserve
Credit market Debt Outstanding to Nominal GDP
2727
Boom and Bust Cycle Still in the Unwinding Phase
After building too many homes and employing too many workers in housing-related industries, the 2007 bust forced a reallocation of resources (both labor and capital) across the economy.

F:\GRAPHICS\Economics\USO\September 2010\USO September.ppt
1980 1982 1984 1986 1988 1990 1992 1994 1996 1998 2000 2002 2004 2006 2008 2010$0
$2
$4
$6
$8
$10
$12
$14
$16
$18
$20
Trill
ions
of U
S $
Sources: Federal Reserve Flow of Funds and Federal Reserve Bank of New York Report #458, July 2010Shadow Banking consists of: total outstanding open market paper, total repo liabi
Shadow Banking Liabilities Commercial Banking Liabilities
28
The Real Financial System: George Bailey Is Dead
George Bailey’s system dominated here
“Shadow Banking” – Vital to Credit Process, Now in Retreat

F:\GRAPHICS\Economics\USO\September 2010\USO September.ppt
This Time Really IS Different: Nonfarm Employment From the Start of Each Recession
29
Nonfarm Employment Levels, Percent Change Since Peak By Recession
Current recovery levels of employment are 5% below pre-recession peak
Recession Start Year

F:\GRAPHICS\Economics\USO\September 2010\USO September.ppt
This Time Really IS Different: Real GDP Since the Start of Each Recession
30
Real GDP Level, Percent Change Since Peak by Recession
Economic output is back above the pre-recession peak, but still a following a shallow path relative to previous recoveries
F:\GRAPHICS\Economics\USO\September 2010\USO September.ppt
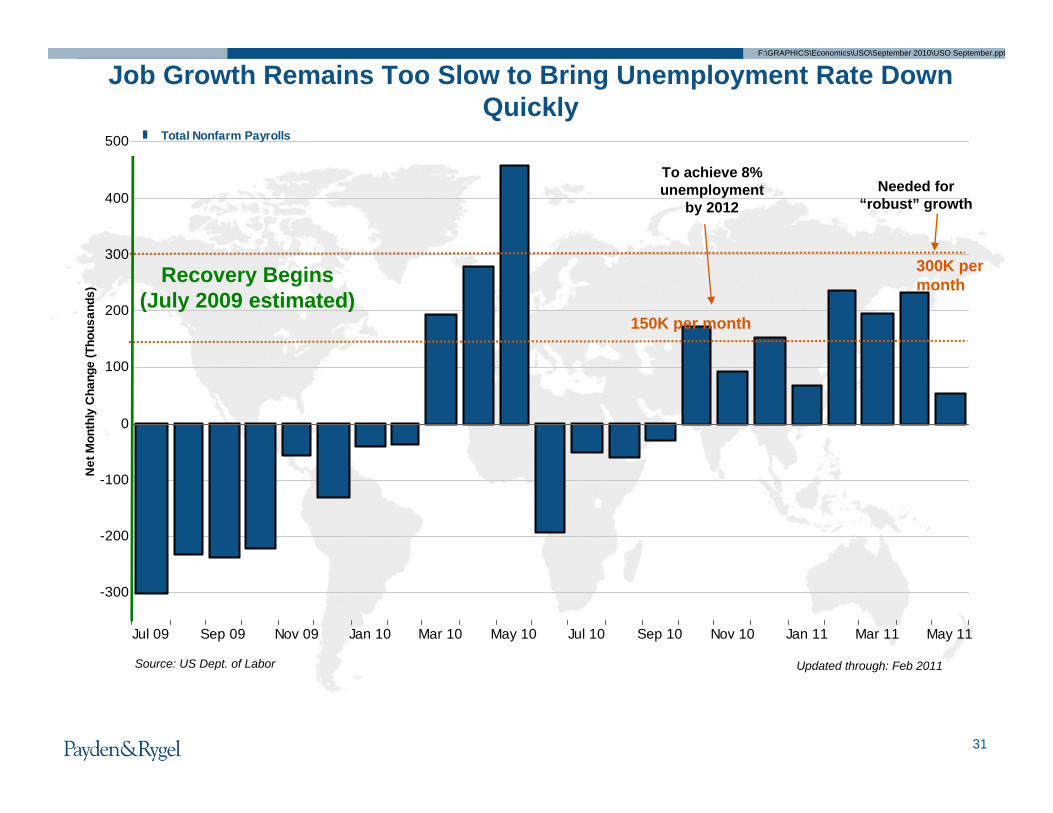
Jul 09 Sep 09 Nov 09 Jan 10 Mar 10 May 10 Jul 10 Sep 10 Nov 10 Jan 11 Mar 11 May 11
-300
-200
-100
0
100
200
300
400
500
Net
Mon
thly
Cha
nge
(Tho
usan
ds)
Total Nonfarm Payrolls
31
Job Growth Remains Too Slow to Bring Unemployment Rate Down Quickly
300K per month
150K per month
Recovery Begins (July 2009 estimated)
Needed for “robust” growth
To achieve 8% unemployment
by 2012
Updated through: Feb 2011Source: US Dept. of Labor

F:\GRAPHICS\Economics\USO\September 2010\USO September.ppt
32
Too Few Have Jobs
Updated through: Apr 2011Source: US Dept. of Labor1948 1951 1954 1957 1960 1963 1966 1969 1972 1975 1978 1981 1984 1987 1990 1993 1996 1999 2002 2005 2008
54
56
58
60
62
64
66
Perc
ent o
f Wor
king
Age
Pop
ulat
ion
Empl
oyed
Cyclical: The current ratio at 58.4% in May when compared
to the long-term trend at approximately 61.8%
suggests there are 6 million people able to work but
unemployed.
Structural: The long-term trend line reflects
structural shifts in the US economy (e.g., rise of
female labor force participation and the baby
boomer retirement)
©FactSet Research SystemsSource: BLS
Employment-to-Population Ratio (% of Working Age, Civilian, Non-instititional Population Employed)Recession Periods - United StatesTrendline: 10 Year Moving Average
F:\GRAPHICS\Economics\USO\September 2010\USO September.ppt
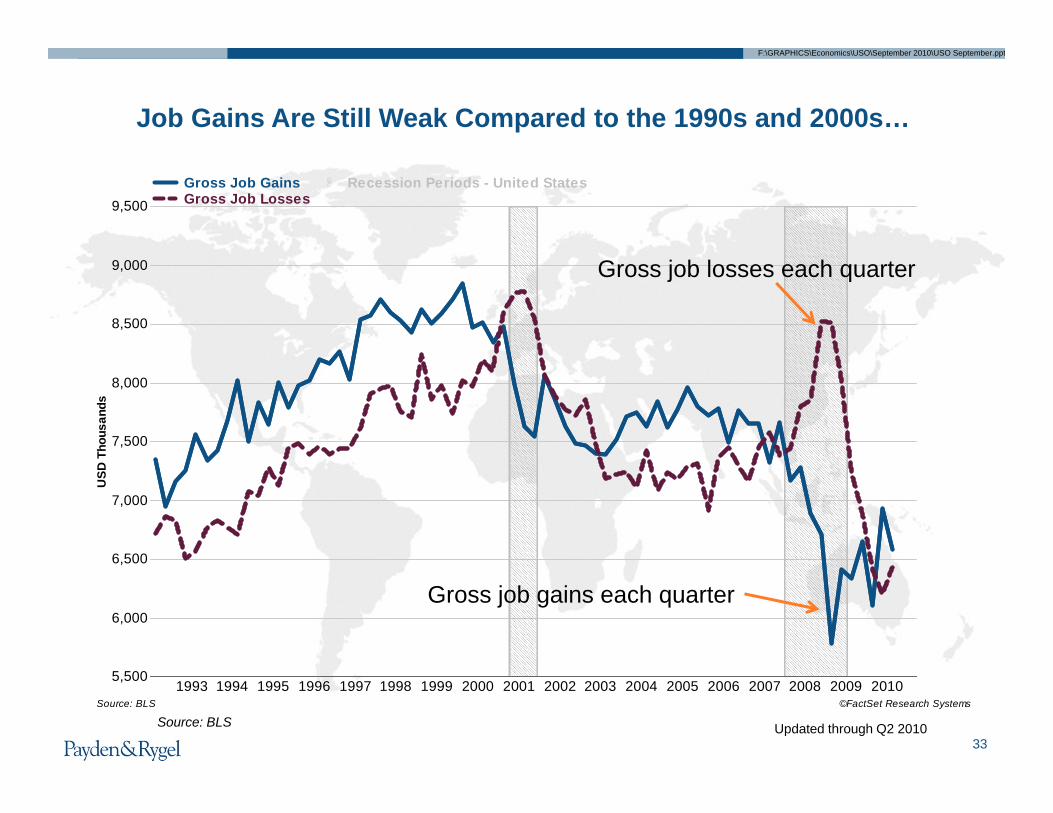
1993 1994 1995 1996 1997 1998 1999 2000 2001 2002 2003 2004 2005 2006 2007 2008 2009 20105,500
6,000
6,500
7,000
7,500
8,000
8,500
9,000
9,500
USD
Tho
usan
ds
©FactSet Research SystemsSource: BLS
Gross Job GainsGross Job Losses
Recession Periods - United States
33
Job Gains Are Still Weak Compared to the 1990s and 2000s…
Gross job losses each quarter
Gross job gains each quarter
Updated through Q2 2010Source: BLS

F:\GRAPHICS\Economics\USO\September 2010\USO September.ppt
Small Business Plans to Hire/Fire and Job Openings
34
2000 2001 2002 2003 2004 2005 2006 2007 2008 2009 2010 20112,000
2,500
3,000
3,500
4,000
4,500
5,000
Job
Ope
ning
s, T
hous
ands
-10
-5
0
5
10
15
20
% Plans to H
ire/Fire(+/-) Over the N
ext Three Months
Sources: National Federation of Independent Businesses, Bureau of Labor Statistics
Plans to Hire/Fire Over the Next Three Months (Right)Job Openings, Total Nonfarm (Left)Recession Periods - United States
Small businesses employ 91 million workers and account for most of the hiring in the last 12 months…
F:\GRAPHICS\Economics\USO\September 2010\USO September.ppt
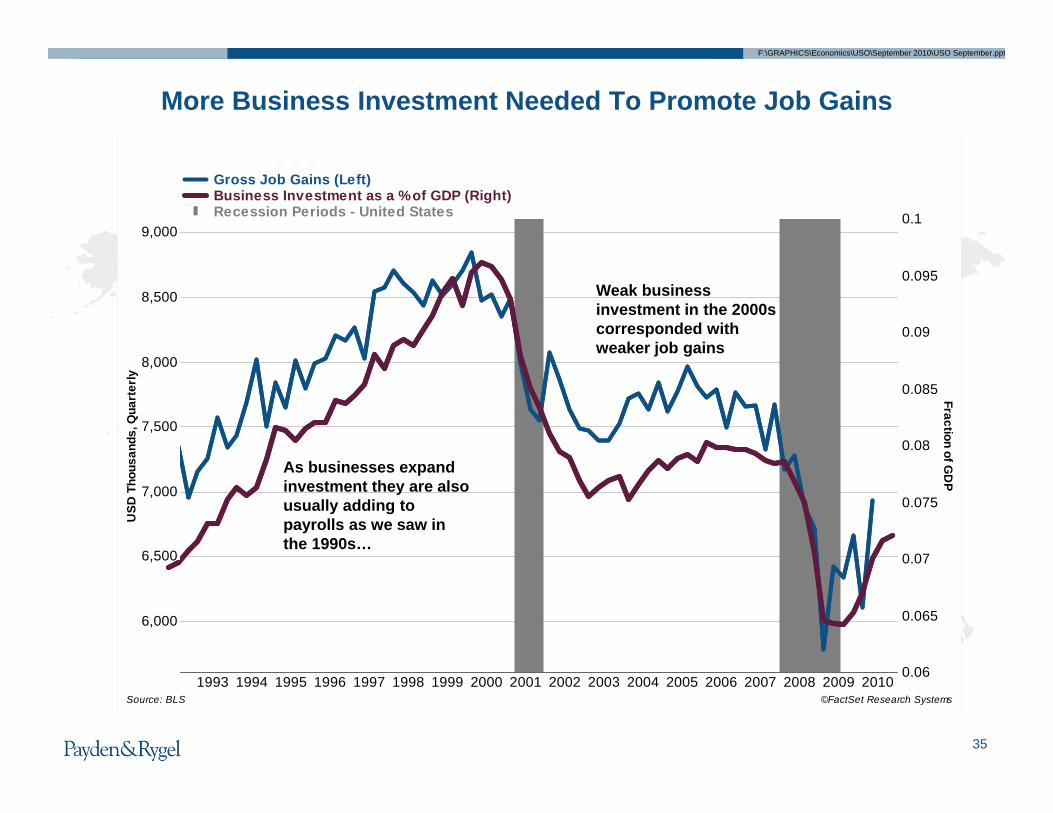
35
More Business Investment Needed To Promote Job Gains
Updated through: 10-29-20101993 1994 1995 1996 1997 1998 1999 2000 2001 2002 2003 2004 2005 2006 2007 2008 2009 2010
6,000
6,500
7,000
7,500
8,000
8,500
9,000
USD
Tho
usan
ds, Q
uart
erly
0.06
0.065
0.07
0.075
0.08
0.085
0.09
0.095
0.1
Fraction of GD
P
©FactSet Research SystemsSource: BLS
Gross Job Gains (Left)Business Investment as a % of GDP (Right)Recession Periods - United States
As businesses expand investment they are also usually adding to payrolls as we saw in the 1990s…
Weak business investment in the 2000s corresponded with weaker job gains

F:\GRAPHICS\Economics\USO\September 2010\USO September.ppt
36
What’s the Fed To Do? Another Way To Think of Monetary PolicyThe Fed wants some positive rate of inflation (approximately 2%) and higher inflation expectations…
….but not too much inflation!

F:\GRAPHICS\Economics\USO\September 2010\USO September.ppt
2007 2007 2007 2008 2008 2008 2008 2009 2009 2009 2009 2010 2010 2010 2010 20110
0.5
1
1.5
2
2.5
Trill
ions
of U
SD
Source: Federal Reserve
U.S. Treasuries Mortgage-backed Securities
Term Auction Credit Federal Agency Debt
37
Policy Response: The Fed’s Balance Sheet, Quantitative Easing 1 & 2
QE1: Federal Agency
Source: Federal Reserve
“If action is taken by the Fed, a clear option is to grow the size of the balance sheet since the policy interest rate, for all practical purposes, cannot go any lower” – Dennis P. Lockhart, President, Federal Reserve Bank of Atlanta, 9/28/2010
Updated through: 3-1-2011
QE1: Mortgage-Backed Securities – shrinking
over time
QE2 + reinvestment of maturing mortgage debt
US Treasuries
Liquidity Facilities & Other

F:\GRAPHICS\Economics\USO\September 2010\USO September.ppt
2006 2007 2008 2009 20100
0.5
1
1.5
2
2.5
3
Trill
ions
of U
S D
olla
rs
©FactSet Research SystemsSource: Federal Reserve
Reverse Repurchase AgreementsDeposits, Depository InstitutionsCurrency in Circulation (Left)
3838
The Other Side of the Fed Balance Sheet: New “Bank Reserves” Created To Pay for Treasury Purchase Program (QE2)
“Bank Reserves”
Physical Currency(Cash in your wallet)

F:\GRAPHICS\Economics\USO\September 2010\USO September.ppt
39
The Limits of QE: Banks Accumulate Excess Reserves, Not New Loans
01/2006 01/2007 01/2008 01/2009 01/20100
500
1,000
1,500
2,000
2,500
USD
Bill
ions
Excess Reserves
Commercial Banks, Cash Assets
Federal Reserve Assets
Source: Federal Reserve
Commercial Banks, Cash AssetsFederal Reserve AssetsExcess Reserves

F:\GRAPHICS\Economics\USO\September 2010\USO September.ppt
11/2010 12/2010 01/2011 02/2011 03/2011 04/2011 05/2011 06/2011
1,000
1,200
1,400
1,600
1,800
2,000
USD
Bill
ions
6,680
6,700
6,720
6,740
6,760
6,780
6,800
USD
Billions
Commercial Banks, Loans & Leases (Right)
Excess Reserves (Left)
Commercial Banks, Cash Assets (Left)
Source: Federal Reserve
Commercial Banks, Cash Assets (Left)Excess Reserves (Left)Commercial Banks, Loans & Leases (Right)
40
The Limits of QE: Banks Accumulate Excess Reserves, Not New Loans
The banks are hoarding money…
…and not making new loans.
In textbooks, reserves work through the “money multiplier” to increase aggregate lending and demand.
F:\GRAPHICS\Economics\USO\September 2010\USO September.ppt
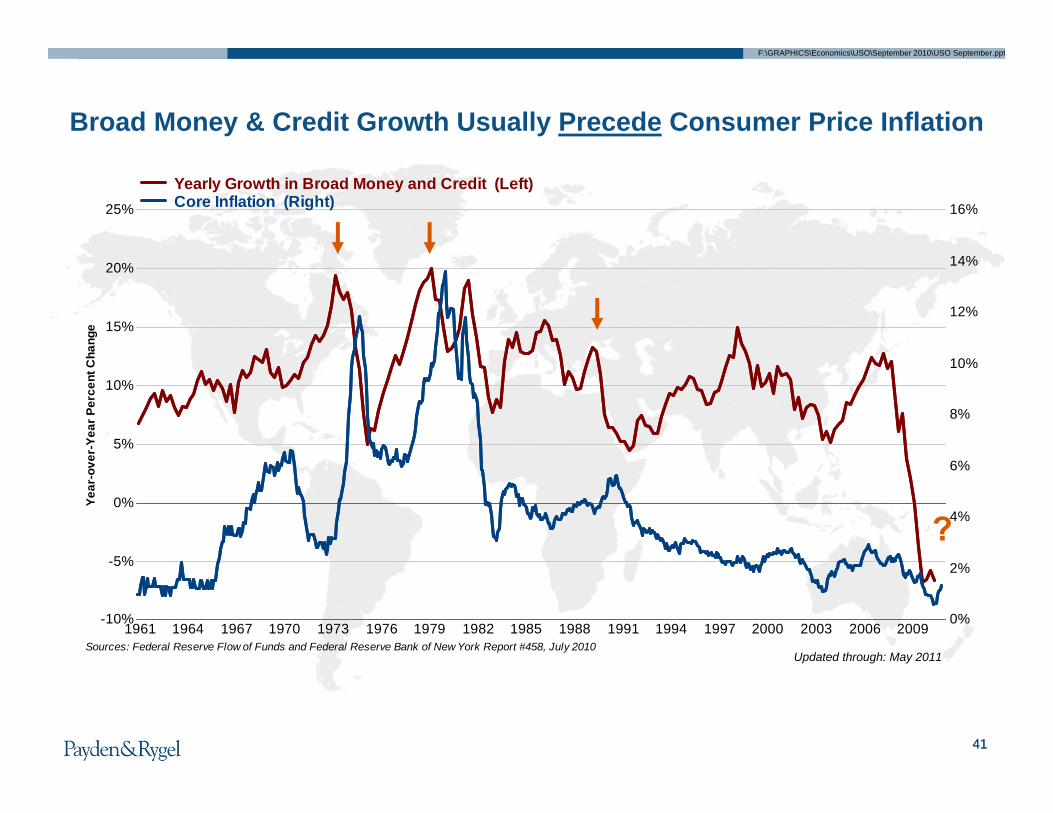
1961 1964 1967 1970 1973 1976 1979 1982 1985 1988 1991 1994 1997 2000 2003 2006 2009-10%
-5%
0%
5%
10%
15%
20%
25%
Year
-ove
r-Ye
ar P
erce
nt C
hang
e
0%
2%
4%
6%
8%
10%
12%
14%
16%
Sources: Federal Reserve Flow of Funds and Federal Reserve Bank of New York Report #458, July 2010
Yearly Growth in Broad Money and Credit (Left)Core Inflation (Right)
4141
Broad Money & Credit Growth Usually Precede Consumer Price Inflation
?
Updated through: May 2011

F:\GRAPHICS\Economics\USO\September 2010\USO September.ppt
The Outlook in NumbersIV

F:\GRAPHICS\Economics\USO\September 2010\USO September.ppt
43
2011 Baseline US Economic Forecast*
Actual Forecast
2009 2010 2011Q3 Q4 Q1 Q2 Q3 Q4 Q1 Q2 Q3 Q4
Real GDP(quarter-to-quarter annualized percent change)
1.6 5.0 3.7 1.7 2.6 3.1 2.0 2.5 3.0 3.3
Unemployment Rate(percent)
9.6 10.0 9.7 9.7 9.6 9.6 8.9 8.8 8.6 8.5
Headline CPI Inflation(year-over-year percent change)
-1.6 1.5 2.4 1.8 1.2 1.2 2.2 3.5 3.3 2.8
Core CPI Inflation(year-over-year percent change)
1.5 1.7 1.3 1.0 0.9 0.6 1.1 1.2 1.4 1.6
Federal Funds Rate(percent)
<0.25
<0.25
<0.25
<0.25
<0.25 <0.25 <0.25 <0.25 <0.25 <0.25
10-Year Treasury(percent)
3.30 3.54 3.71 3.49 2.80 3.37 3.47 3-4% 3-4% 3-4%
*Data represent quarterly averages
“I can calculate the motions of heavenly bodies, but not the madness of people.” – Sir Isaac Newton
Inflation still below Fed’s target
Unemployment will remain high
Fed keeps “foot on pedal”

F:\GRAPHICS\Economics\USO\September 2010\USO September.ppt
0%
10%
20%
30%
40%
50%
60%
70%
80%
90%
100%
0
100
200
300
400
500
600
700
1‐2% 2‐3% 3‐4% 4‐5% 5‐6% 6‐7% 7‐8% 8‐9% 9‐10% 10% or Higher
Cumulative %
Freq
uency (M
onths)
Interest Rate Buckets
Frequency (Left) Cumulative % (Right)
Source: Robert Shiller
44
Updated through Nov. 2010
Interest rates have been below 5% over 70% of the time since 1871!
High Interest Rates are the Anomaly, Not Low OnesNominal Long-Term Monthly Yields since 1871

F:\GRAPHICS\Economics\USO\September 2010\USO September.ppt
4545
U.S. Interest Rate Scorecard
Factor Comment Explanatory Power Impact on Rates AssessmentFundamental Factors – Help to establish long-term fair value
GDP Growth Below long-term trend of 3% High
Economic and structural fundamentals point to
continued low yields. The most significant change in
last six months is the “bottoming” in the core
rate of inflation.
Inflation Rising from historic lows High
Foreign Central Banks Foreign central banks hold nearly 50% of marketable Treasury debt Medium
Federal Reserve policy Monetary policy stance (short-term rates) High
Bank Lending and Private Debt Issuance
Banks are buying Treasuries instead of making new loans
Medium
Technical Factors – Influence near-term volatilityMarket Sentiment Concern for higher rates High
Technical factors are mixed and do not suggest
immediate upward pressure on interest
rates.
Investor Safe-Haven Demand for Treasuries
High global demand for a safe-haven investment
Medium
Treasury Auctions
Federal Reserve Purchases (QE2)
Record funding requirements
$600 billion program over 8 mos. plus mortgage reinvestment
Medium
Medium
Conclusion: Yields on benchmark 10-year US Treasuries should fluctuate between 3% and 4% in 2011. As for the federal funds rate, we do not anticipate rate hikes in 2011. This implies a steep yield curve throughout the year.

F:\GRAPHICS\Economics\USO\September 2010\USO September.ppt
46
The Risks to the Forecast“I can calculate the motions of heavenly bodies, but not the madness of people.” – Sir Isaac Newton
Oil Prices Shock
Fiscal/Regulatory Uncertainty
Global Growth Slowdown
QE3?

F:\GRAPHICS\Economics\USO\September 2010\USO September.ppt
Biographies
Jeffrey C. ClevelandSenior Economist
2006 – Joined Payden & Rygel
Jeffrey Cleveland is a Senior Economist at Payden & Rygel. He isresponsible for developing views on the US and global economy. Hisresearch areas include macroeconomics, central banks and themoney markets, money supply, credit cycles, housing, state and localgovernments and regional economics.
Prior to joining Payden & Rygel, Cleveland was a senior associate atDavid Taussig & Associates in Newport Beach, California, where hemanaged the firm’s fiscal and economic impact studies andconsulting services. Cleveland worked with local agencies, includingcities, counties, and agencies to analyze the impact of economicdevelopment projects on municipal finance. He also assisted infinding municipal finance solutions to budget and service needs.
Cleveland is a member of the National Association for BusinessEconomics (NABE). He is also an avid open-water swimmer. Heswam across the English Channel in September 2008, across theCatalina Channel in 2009 and around Manhattan in 2010. This isconsidered the triple crown of open-water swimming, with only 35people having done this in history.
Jeffrey Cleveland earned a MA in International Political Economy withan emphasis in international money and finance from ClaremontGraduate University. He received a BA in Economics/Global PoliticalEconomy from Whittier College through the Whittier ScholarsProgram.

F:\GRAPHICS\Economics\USO\September 2010\USO September.ppt
Question & Answer Session

Thank you for joining us.To learn more about Payden & Rygel, visit payden.com.
Thank you for joining us.To learn more about Payden & Rygel, visit payden.com.
Jeffrey C. ClevelandSenior Economist