the fine art of forecasting
TRANSCRIPT

HELP FROM ABOVEMaking the drones work harder
PROTECTING TAONGAPartnering for keystone species
SEARCHING SOUTHERN SKIESWorld famous in Central Otago
SNOW BUSINESSKeeping the slopes safe
AUGUST 2021
THE FINE ART OF FORECASTING
Water & Atmosphere is published by NIWA. It is available online atwww.niwa.co.nz/pubs/waEnquiries to:The EditorWater & AtmosphereNIWAPrivate Bag 14901KilbirnieWellington 6241 New Zealandemail:[email protected]
Water & Atmosphere is produced using vegetable-based inks on paper made from FSC certifed mixed-source fi bres under the ISO 14001 environmental management system.
facebook.com/nzniwa
twitter.com/niwa_nz
niwa_science
www.niwa.co.nz
August 2021
©National Institute of Water & Atmospheric Research LtdISSN 1172-1014Water & Atmosphere team:Editors: Rory Newsam and Susan Pepperell Production: NIWA Communicationsand Marketing TeamEditorial Advisory Board:Geoff Baird, Bryce Cooper, Sarah Fraser, Barb Hayden, Rob Murdoch
Follow us on:
Water & Atmosphere August 2021
Cover: A young visitor captivated by NIWA’s America’s Cup weather data, projected across the Spark 5G Race Zone fl oor. (Stuart Mackay)
Lana
You
ngDa
ve A
llen

www.niwa.co.nz August 2021 Water & Atmosphere 3
CONTENTS
4 Investing in our data NIWA CE0 John Morgan on the growing role of data
technology in science
5 News in brief
8 Searching southern skies A Central Otago research station with a global reputation
10 The fine art of forecasting From the Great Walks to the America’s Cup – how high-
resolution forecasting is re-shaping decision making
18 The weather on ice Flying the flag at Scott Base
20 Protecting our taonga together Empowering kaitiakitanga for keystone species
26 How do you make a fast boat go faster?
A sneak peak at NIWA’s work with Emirates Team New Zealand
34 Super charging the view from above Advanced computer skills are making the drones
work harder
38 Know your snow The alpine weather network helping keep the
slopes safe

www.niwa.co.nz4 Water & Atmosphere August 2021
PANORAMA
Good decision making is firmly rooted in good science.
Whether you are faced with negotiating your way through an international pandemic, trying to predict how climate change will impact your business or simply aiming to get a group of trampers safely o� the Routeburn Track – you need highly accurate forecasts based on first-rate science to make the right call.
Fundamentally, quality science is founded on sharp analytical minds working with high-calibre information. NIWA is already well-positioned on both fronts. We employ more than 450 highly skilled researchers and technicians, and we are home to some of the longest running environmental data series in the Southern Hemisphere.
However, the relentless advance of digital technology is fast changing the way we do science – opening up fresh opportunities, but also bringing new challenges.
The volume of information flowing from our environmental monitoring activities is growing exponentially, as advances in connectivity deliver more and more real-time data. NIWA’s network of rainfall gauges, alone, now registers more than a million new data entries every month.
This ever-growing deluge of environmental data puts additional demands on science institutions. Quality research is now increasingly dependent on your ability to intelligently analyse and investigate your data. To answer many of today’s complex questions,
researchers must be able to process vast amounts of information through powerful computers, running increasingly sophisticated digital modelling or Artificial Intelligence software.
NIWA is committed to powering up our data science skills and services. The three Cray supercomputers housed in our High Performance Computing Facility are already capable of more than two thousand trillion calculations a second. We have also recently launched a global campaign to recruit eight new data specialists. They will work within our Technology and Innovation analytics and modelling hub to meet demand – both internally and externally.
This investment means we can continue to support researchers across our climate, freshwater and marine platforms when they reach for advanced software solutions, such as machine learning, computer vision and digital twin technologies. These technologies are already delivering for our clients and we are determined to take full advantage of the ongoing opportunities that this new wave o�ers.
Data science is now an integral part of advanced research, and our aim is to build the largest and best resourced data science team in New Zealand.
Because, in today’s world, robust decisions depend on excellent data science.
Investing in our dataNIWA Chief Executive John Morgan looks at the growing role data technology plays in environmental research.
“NIWA is committed to powering up our data science skills and services”John Morgan

www.niwa.co.nz August 2021 Water & Atmosphere 5
IN BRIEFLa
na Y
oung
Rod
Budd
DEEP DOWNLOADA state-of-the-art remotely operated vehicle (ROV) has recovered new data about New Zealand’s largest earthquake fault from the seabed o� the North Island’s east coast.
The three-tonne Canadian ROV was deployed from NIWA’s research vessel Tangaroa, as part of a joint NIWA, GNS Science and University of Washington investigation.
The ROV successfully downloaded data along the Hikurangi subduction zone from equipment on two observation platforms installed 400m below the sea surface.
The platforms have been continuously recording movement and slow slip earthquakes along the subduction zone for the past two years, and their data will provide fresh insight into the region’s seismic activity.
UNDER WE GONIWA’s scientific divers successfully completed 2,471 dives in the past 12 months, spending a total of 42,593 minutes – or almost 30 days – underwater.
NIWA has one of the largest specialist dive teams in New Zealand with 39 divers working across the marine and freshwater research platforms.
Operations range throughout New Zealand, as far north as the Kermadec Islands, down to expeditions under the ice in Antarctica.
A large proportion of the work involves ecological monitoring, along with ongoing biosecurity surveys checking for invasive pests and plants in harbours, ports, rivers and lakes.
MINING THE DATAGrowing demand for advanced computing techniques to support next generation research has prompted NIWA to establish a new data science team.
Researchers are increasingly turning to advanced data capabilities to help analyse the rapidly-growing wave of information flowing in from NIWA’s environmental monitoring networks.
The new data experts will work within the Technology and Innovation Group, with a particular focus on machine learning, artificial intelligence, optical recognition and digital twin technologies.
The eight-strong team will be supported by NIWA’s existing High Performance Computing Facility and integrate data science across the climate, freshwater and marine research programmes.
Lana
You
ng

www.niwa.co.nz6 Water & Atmosphere August 2021
IN BRIEF
iSto
ck
WAVE THREATSNIWA coastal researchers are working with residents to help refine advanced models for large wave events along Wellington’s south coast.
The move follows a large southerly storm that swept into Wellington in late June bringing waves of more than 6m in Cook Strait. (See p.17)
Emergency managers decided to evacuate some residents after considering factors, including modelling results, which indicated a potential threat to life and properties in worst case scenarios.
Scientists are continuing to work with residents, gathering recent photos and experience of previous large storms, to update models for future events.
PLAYING WITH THE WINDA NIWA climate scientist is combining work and a sporting interest to benefit golfers throughout New Zealand.
Wind speed is a key factor in determining the di¨culty rating of each course, which is then used when calculating player handicaps. A higher average wind speed makes a course more di¨cult to play.
However, applying consistent daily wind speeds to a huge variety of courses has been a long-term challenge for Golf NZ and widely debated by players.
Meteorologist Dr Richard Turner is currently working with Golf New Zealand on a nationwide reassessment of almost 400 golf course ratings using NIWA’s in-house high resolution weather model.
The new course ratings – and hopefully an end to the debates – are expected soon.
NZ
Stor
y
PLASTIC PATHWAYS Research has revealed that microplastic
fragments can find their way through the gut lining and into muscle tissue of
New Zealand fish.
Two experiments were carried out by students from the joint NIWA/University of Auckland Institute of Aquatic and Atmospheric Science.
The first surveyed six fish species commonly found in the Hauraki Gulf:
snapper, yellowbelly flounder, gurnard, jack mackerel, kahawai and pilchard.
Microplastics were found in the guts of 25 percent of fish sampled.
A separate experiment also found traces of microplastics in the muscle tissue of snapper that had been fed high concentrations of polystyrene
microplastics.
Big waves in Lyall Bay, Wellington. (Lana Young)
www.niwa.co.nz August 2021 Water & Atmosphere 7
Mar
ty F
lana
gan
Nav
a Fa
dae�
Met
hane
SAT
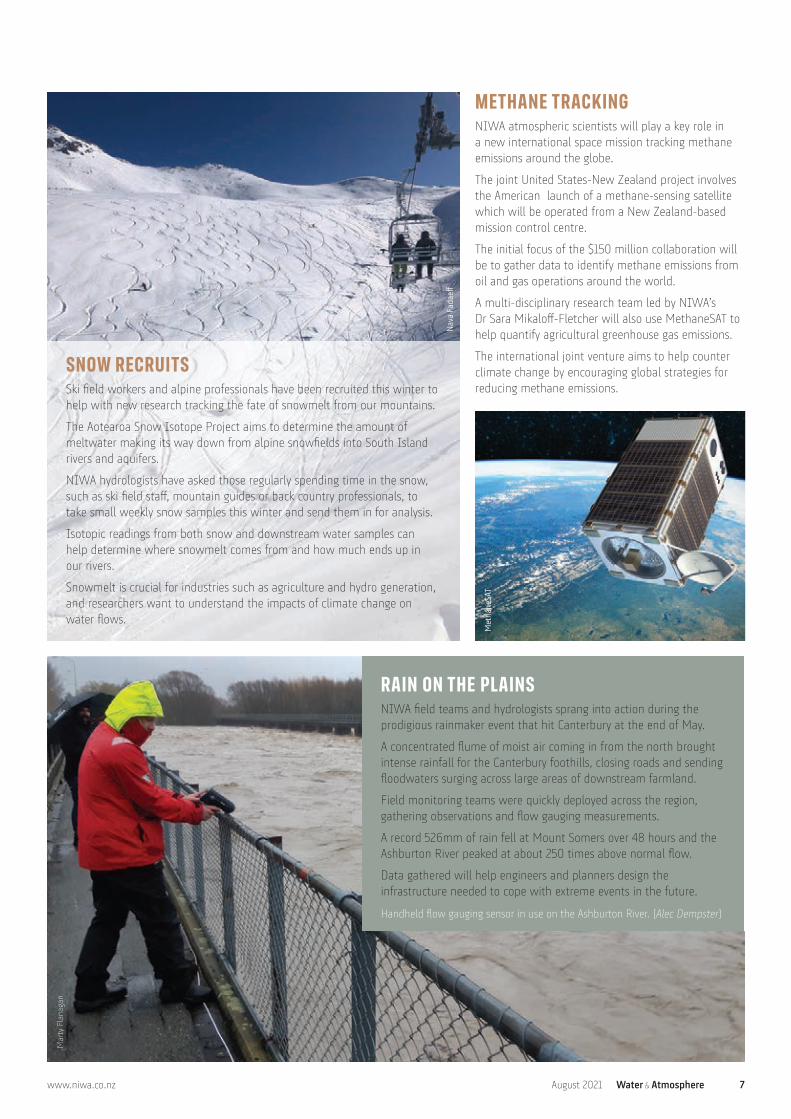
METHANE TRACKINGNIWA atmospheric scientists will play a key role in a new international space mission tracking methane emissions around the globe.
The joint United States-New Zealand project involves the American launch of a methane-sensing satellite which will be operated from a New Zealand-based mission control centre.
The initial focus of the $150 million collaboration will be to gather data to identify methane emissions from oil and gas operations around the world.
A multi-disciplinary research team led by NIWA’sDr Sara Mikalo� -Fletcher will also use MethaneSAT to help quantify agricultural greenhouse gas emissions.
The international joint venture aims to help counter climate change by encouraging global strategies for reducing methane emissions.
SNOW RECRUITSSki fi eld workers and alpine professionals have been recruited this winter to help with new research tracking the fate of snowmelt from our mountains.
The Aotearoa Snow Isotope Project aims to determine the amount of meltwater making its way down from alpine snowfi elds into South Island rivers and aquifers.
NIWA hydrologists have asked those regularly spending time in the snow, such as ski fi eld sta� , mountain guides or back country professionals, to take small weekly snow samples this winter and send them in for analysis.
Isotopic readings from both snow and downstream water samples canhelp determine where snowmelt comes from and how much ends up inour rivers.
Snowmelt is crucial for industries such as agriculture and hydro generation, and researchers want to understand the impacts of climate change on water fl ows.
RAIN ON THE PLAINSNIWA fi eld teams and hydrologists sprang into action during the prodigious rainmaker event that hit Canterbury at the end of May.
A concentrated fl ume of moist air coming in from the north brought intense rainfall for the Canterbury foothills, closing roads and sending fl oodwaters surging across large areas of downstream farmland.
Field monitoring teams were quickly deployed across the region, gathering observations and fl ow gauging measurements.
A record 526mm of rain fell at Mount Somers over 48 hours and the Ashburton River peaked at about 250 times above normal fl ow.
Data gathered will help engineers and planners design the infrastructure needed to cope with extreme events in the future.
Handheld fl ow gauging sensor in use on the Ashburton River. (Alec Dempster)

www.niwa.co.nz8 Water & Atmosphere August 2021
NEWS
Searching southern skiesSusan Pepperell looks at the Central Otago scientific station with a global reputation.
or a small group of unassuming buildings nestled amongst the wide-open spaces of the Maniototo, the Lauder Atmospheric Research Station punches
well above its weight.
The station, which celebrated its 60th anniversary in April, is situated about 36km from Alexandra, almost exactly halfway between the equator and the South Pole.
Deliberately chosen for its remote location and the clear skies above, it was opened in 1961 as an ideal site for monitoring Southern Hemisphere atmospheric conditions.
It is now home to nine NIWA scientists and technicians.
Their work, measuring gases in the southern atmosphere, helps to benchmark global understanding of, among other things, climate change, skin-cancer causing ultraviolet (UV) radiation levels and ozone levels.
The team maintain an impressive array of instruments, including some state-of-the-art equipment which is operated in collaboration with overseas science institutes. The data generated from the Central Otago skies, feeds into several key international monitoring networks.
Lauder’s reputation as an internationally significant and much respected scientific facility stems from the length of time consistent measurements have been made at the site, and what they have revealed about our changing atmosphere and climate.
Today its focus is largely on measuring the greenhouse gases that contribute to climate change, along with UV research.
Atmospheric scientist and Lauder group manager, Dr Richard Querel, says the instruments used to measure ozone, UV radiation, methane and carbon dioxide have enabled scientists to see small trends over several decades.
“If you don’t have good data, then you’re speculating. High quality, traceable, well calibrated data, comparable to other sites – that’s the bread and butter stu� we do here.”
Querel says the importance of having these long time series has been amplified since the advent of satellites. While satellites can provide global coverage, they may only be up for a few years, and there may be significant gaps before another one is launched.
Continuous ground-based measurements, like those from Lauder, “ground truth” satellite observations and tie individual satellites together.
Researchers wearing fire protection coats release a hydrogen-filled weather balloon. Launched weekly, sensors tethered from the balloon gather valuable readings from the atmosphere more than 35km above. (Rebekah Parsons-King)
Dr Richard Querel, Lauder group manager. (Rebekah Parsons-King)
“If you don’t have good data, then you’re speculating.”Dr Richard Querel

www.niwa.co.nz August 2021 Water & Atmosphere 9
auder began as a station measuring auroral activity, between 100 and 400km above, to better
understand its e�ects on compass readings and radio signals. In the late 1970s interest in upper atmospheric research diminished and was replaced by research into the stratosphere (15–50km).
Work at Lauder was crucial in the e�orts that led to the discovery of the Antarctic ozone hole in 1985 and the 1987 signing of the Montreal Protocol – a successful international treaty that resulted in the phasing out of ozone-depleting substances.
One of the most recent sta� additions to Lauder is Dr Alex Geddes. Originally from the UK, Geddes has played a central role in Lauder’s recent modernisation programme and the introduction of new instruments to extend research opportunities.
He says Lauder is “world famous” in atmospheric science circles.
“It is like gold dust – there’s not many really good measuring sites in the Southern Hemisphere and Lauder is the most well instrumented and most highly regarded.
“You know that if we see changes happening in the atmosphere at Lauder, they’re definitely real and a big deal.”
Data from MethaneSAT will support greenhouse gas reduction strategies. (MethaneSAT)
“It is like gold dust – there’s not many really good measuring sites in the Southern Hemisphere”Dr Alex Geddes
“There is so much going on here and we have to keep advancing.”
One of the new projects at Lauder is MethaneSAT – a joint US-New Zealand space mission that will see a satellite launched next year to locate and measure methane from human sources around the globe.
Geddes says the objective is look at methane leaks across the world at very high resolution, initially from oil and gas production facilities, but also from agricultural sources.
“We don’t have much oil and gas in New Zealand, so we want to look at agricultural methane emissions which account for about 75% of all methane emitted here.”
Geddes says the findings will help design emissions reduction strategies.
While technology is changing at Lauder, some things remain. Manual weather observations are recorded weekly to ensure the integrity of the time series and, conditions permitting, an upper air monitoring balloon is launched every Tuesday.
And when the skies are clear, passers-by may see a thin green laser beam shooting into the night sky as the aerosol lidar heads to infinity.
Six decades on, and Lauder is still making waves.
Lasers fire up to 100km through the night skies to measure atmospheric constituents and ozone concentrations above Lauder. (Rebekah Parsons-King)

www.niwa.co.nz10 Water & Atmosphere August 2021

www.niwa.co.nz August 2021 Water & Atmosphere 11
The fine art of forecasting
Susan Pepperell looks at how high-resolution forecasting is driving sharper decision making – from deep in the back
country to the finish line of the America’s Cup.

www.niwa.co.nz12 Water & Atmosphere August 2021
For about a week before walking Fiordland’s Routeburn Track at New Year, Nava Fedae� was constantly checking and rechecking the weather forecast.
hat early “test” forecast for the Routeburn Track at New Year was spot on.
“I knew there was going to be rain, and that it might be bad, but I didn’t think it would be far enough west to a�ect us,” Fedae� says.
She was right. The forecast was correct. The rain caused flooding in Otago, but the Routeburn stayed mostly dry.
Testing is now well and truly over and the Parks Weather forecast site has been operational for several months. Driven by NIWA’s extensive forecast data, it provides a daily national weather hazard overview video, presented by a NIWA forecaster. It also features tailored, detailed forecasts for all 13 national parks and about 50 huts or specific locations.
For instance, click on Arthur’s Pass National Park and you can view a video showing the topography and weather for the next six days, as well as NIWA’s unique flow forecast, which uses data visualisation tools to depict changes in river flow and levels.
Click again and you will see separate six-day forecasts for Carroll Hut, Avalanche Peak and Carrington Hut. Each location has its own predictions for rain, snow, average wind speed, wind gusts, wind chill, temperature, visibility, freezing level and relative humidity.
Particular hazards such as heavy rain, low temperatures, strong winds, and more are highlighted in yellow, orange, or red, depending on their chance of occurrence. Users can also click through to the DOC website for more information on planning their trip and print a summary of the forecast to take with them.
“We’ve really thought about how people might navigate the website and use the information. People heading outdoors are more exposed and more at risk, so we’ve brought hazards to the forefront of how we’re communicating,” Fedae� says.
She says the site is firmly focused on the user.
“Improving public safety is at the heart of the design. We put a lot of e�ort into how to make those messages more prominent. We want people to know what it actually means when we forecast wind gusts of 90km/h.
“If we can get people to read the forecast, they will know what decisions they need to make when planning their trip.”
The Parks Weather forecasts are the end result of a complex process that requires taking streams and streams of weather information gathered from NIWA’s vast environmental monitoring network, applying new data science techniques, some behind-the-scenes weighting and model bias correction, and then customising it with a specific client in mind.
While it may look like a new step in bespoke weather forecasting, it is something NIWA has been working towards for some time.
Nava Fedae� (far left) and her tramping party enjoy a dry bite to eat on New Year’s Eve at Routeburn Flats. (Nava Fedae�)
Previous pages: Low cloud hangs over the peaks above Lake Harris on the Routeburn Track. Detailed forecasts are essential for safe back country experiences. (Nava Fedae�)
ith three days ahead without cell phone reception, this was very much standard tramping preparation. However, the forecast
Fedae� was checking was far from standard – at that stage it was not even available to the public.
It sat in a test space in the back end of NIWA’s website, accessible only to the small team working on it. Fedae� is a NIWA forecaster and one of the projects occupying her time over summer was compiling the new “Parks Weather” function on the NIWA Weather website.
Parks Weather is the result of a collaboration with the Department of Conservation (DOC) to provide better weather information for people venturing into New Zealand’s rugged, remote and ever-changing great outdoors.
In many ways, Fedae� is the perfect fit for the project. A keen tramper and user of New Zealand’s conservation spaces, she is also a weather scientist with advanced skills in data visualisation.
Having inherited artistic talent from her parents, she has an innate ability to turn her detailed understanding of how weather works across this country’s varied terrain into smart visual information that is easy for people to use.
“Improving public safety is at the heart of the design”Nava Fedae�
The fine art of forecasting

www.niwa.co.nz August 2021 Water & Atmosphere 13
Videos on NIWA’s Parks Weather website show a strong nor’westerly system sweeping onto Fiordland National Park. The wind forecast (top) shows gusts reaching 90km/h hitting the high country, while rain and low cloud (middle) sweeps across the Milford Track. Flow predictions (bottom) warn trampers about rising river levels. (NIWA)
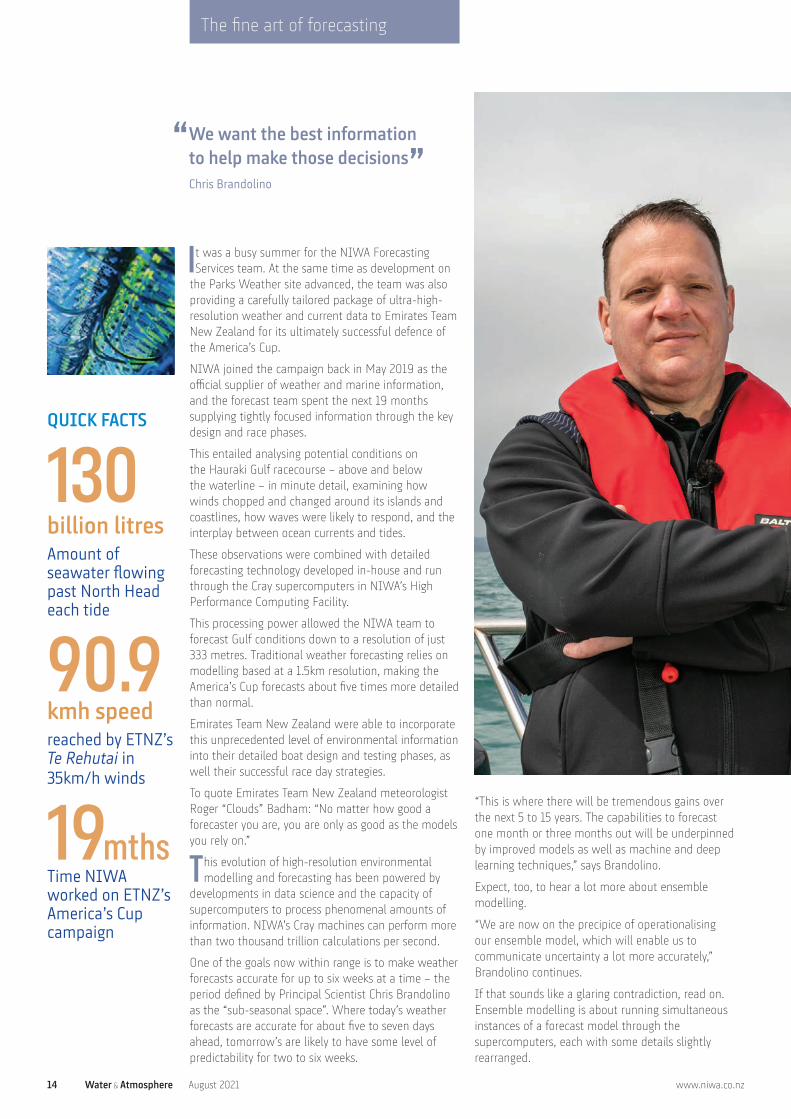
QUICK FACTS
130billion litresAmount of seawater flowing past North Head each tide
90.9kmh speedreached by ETNZ’s Te Rehutai in 35km/h winds
19mthsTime NIWA worked on ETNZ’s America’s Cup campaign
www.niwa.co.nz14 Water & Atmosphere August 2021
t was a busy summer for the NIWA Forecasting Services team. At the same time as development on
the Parks Weather site advanced, the team was also providing a carefully tailored package of ultra-high-resolution weather and current data to Emirates Team New Zealand for its ultimately successful defence of the America’s Cup.
NIWA joined the campaign back in May 2019 as the o¨cial supplier of weather and marine information, and the forecast team spent the next 19 months supplying tightly focused information through the key design and race phases.
This entailed analysing potential conditions on the Hauraki Gulf racecourse – above and below the waterline – in minute detail, examining how winds chopped and changed around its islands and coastlines, how waves were likely to respond, and the interplay between ocean currents and tides.
These observations were combined with detailed forecasting technology developed in-house and run through the Cray supercomputers in NIWA’s High Performance Computing Facility.
This processing power allowed the NIWA team to forecast Gulf conditions down to a resolution of just 333 metres. Traditional weather forecasting relies on modelling based at a 1.5km resolution, making the America’s Cup forecasts about five times more detailed than normal.
Emirates Team New Zealand were able to incorporate this unprecedented level of environmental information into their detailed boat design and testing phases, as well their successful race day strategies.
To quote Emirates Team New Zealand meteorologist Roger “Clouds” Badham: “No matter how good a forecaster you are, you are only as good as the models you rely on.”
his evolution of high-resolution environmental modelling and forecasting has been powered by
developments in data science and the capacity of supercomputers to process phenomenal amounts of information. NIWA’s Cray machines can perform more than two thousand trillion calculations per second.
One of the goals now within range is to make weather forecasts accurate for up to six weeks at a time – the period defined by Principal Scientist Chris Brandolino as the “sub-seasonal space”. Where today’s weather forecasts are accurate for about five to seven days ahead, tomorrow’s are likely to have some level of predictability for two to six weeks.
“This is where there will be tremendous gains over the next 5 to 15 years. The capabilities to forecast one month or three months out will be underpinned by improved models as well as machine and deep learning techniques,” says Brandolino.
Expect, too, to hear a lot more about ensemble modelling.
“We are now on the precipice of operationalising our ensemble model, which will enable us to communicate uncertainty a lot more accurately,” Brandolino continues.
If that sounds like a glaring contradiction, read on. Ensemble modelling is about running simultaneous instances of a forecast model through the supercomputers, each with some details slightly rearranged.
“We want the best information to help make those decisions”Chris Brandolino
The fine art of forecasting

www.niwa.co.nz August 2021 Water & Atmosphere 15
Out the other end comes a range of possible forecast scenarios that are then analysed to determine which are most likely to occur. The models then estimate the chance of reaching or exceeding certain thresholds, such as rainfall exceeding 100mm.
Brandolino describes ensemble modelling as “leveraging the wisdom of the crowd”.
“When you are predicting the future state of the atmosphere, you have to know the current state. With ensemble modelling we can say ‘What if the atmosphere is in this state or that state?’ and use di�erent starting points.”
NIWA’s ensemble model – the only one of its kind in New Zealand – has 18 members and therefore 18 potential starting points. A forecaster can slice and dice the results by asking, for example, how many
Principal scientist Chris Brandolino on the Hauraki Gulf – NIWA data helped shape Emirates Team New Zealand boat design and race-day tactics. (Stuart Mackay)
of the 18 members are predicting 100mm of rain on Thursday. If 12 come to the same conclusion, it o�ers a forecast with a high degree of certainty. If there’s only two or three, confidence is lower.
“This enables me to better understand the range of outcomes,” says Brandolino. “And I can then communicate uncertainty more easily. You’re not putting all your eggs in one basket.”
nsemble modelling is already coming into its own on the Parks Weather site, used to articulate the
chance of a particular weather hazard occurring.
NIWA’s Seasonal Climate Outlook (SCO) will also benefit. These are issued at the beginning of every month and o�er expectations on the most likely weather patterns over the next three months, as determined by NIWA’s forecasters and hydrologists.

www.niwa.co.nz16 Water & Atmosphere August 2021
the National Oceanic and Atmospheric Administration in the United States.
While Brandolino is understandably excited by the potential of data science techniques to improve forecasting, he recognises that it also requires a huge shift in thinking that people will need to make.
“It seems to me that as this area improves people will need to think about the best way to use the information. If I tell people that in three months’ time there will be a bad cold snap for 10 days, they are likely to respond that there’s a lot of time between now and then.
“We don’t have that capability right now, so people are not sure how to leverage and use this information. So, it’s not just developing the capability, but it is also about engaging with end users to maximise this new frontier.”
Noll says producing actionable forecasts out to three months has long been a challenge, but is hopeful advancements in sub-seasonal prediction will help to bridge the gap between weather and climate.
hat’s the challenge facing forecasters as they develop the capability to provide highly specific
forecasts for any business, organisation or individual whose success in some way relies on certain climatic conditions.
Farming and the energy sector are obvious examples, but rain or shine also a�ects the number of people attending a large event, while the type of weather can influence sales and product choices. Knowing when and what the weather will do means better planning and potentially better outcomes.
Meanwhile, Fedae� is expanding NIWA’s work with the Department of Conservation. There has been ongoing work with DOC Visitor Centres, learning how rangers operate in the back country and what weather services they need.
There are also other tweaks, such as an automated email to warn companies operating on the Tongariro Alpine Crossing of bad weather.
“I’ve always been excited about this project because I’ve been to a lot of these places and I’m a forecaster, so I know what information is out there. It’s made it more rewarding building something I would use myself.
“This is a first step – there is so much more we want to do.”
NIWA has been producing them since 1999 and they are among the most accessed items on its website. Farmers, horticulturalists and others in the primary sector are among the biggest users.
Forecaster Ben Noll, who regularly compiles the SCO, says the goal is always to improve their accuracy and usefulness. This can be done by improving the models that drive the outlook, refining communication techniques such as focusing on impacts, and working more closely with end users.
It’s especially important on the heels of back-to-back drought events.
Noll is hopeful NIWA may soon publicly issue its one-month outlook. So far, it has been a product reserved for specific clients. Now, with new and improved models and data-driven machine and deep learning techniques, strides are being made in sub-seasonal forecast skill.
One of the techniques used to improve the resolution and usefulness of climate models over New Zealand is called “statistical downscaling” – taking global models with a 25 to 50km resolution over New Zealand, down to 5km to more accurately resolve Aotearoa’s complex terrain.
Current machine learning experiments under way include looking at 35-day rainfall forecasts by leveraging an upgraded forecast model launched by
Ben Noll in action in NIWA’s Auckland media studio. Each year the NIWA team produce close to 3,000 video-based forecasts alone. (Stuart Mackay)
“It is about engaging with end users to maximise this new frontier”Ben Noll
The fine art of forecasting

www.niwa.co.nz August 2021 Water & Atmosphere 17
Large waves battering Wellington Airport’s breakwater. (Rebekah Parsons-King)
The perfect storm for modellersOccasionally, the science of forecasting and serendipity coincide in a way that
demands some immediate action.
At the end of June, NIWA forecaster, Chris Brandolino, spotted huge waves heading for the Wellington’s south coast.
Brandolino called his coastal modeller colleague, Dr Christo Rautenbach, who along with NIWA hydrodynamic modeller, Dr Cyprien Bosserelle, had been doing some in-depth work on the capital’s south coast for Wellington City Council.
The work had involved reconfiguring an international model that enabled local coastal simulations to be run faster and cover bigger areas at much higher resolution. The pair investigated six previously large storms hitting the Wellington coast, scouring news reports for information on coastal inundation.
When they looked at the projected o�shore waves, they realised the forecast wave direction and height was incredibly similar to the waves recorded during a
1992 storm. They worked into the night of 28 June, using the model and latest forecasts to urgently assess how people and property might be a�ected.
With the results showing substantial risk, Dr Andrew Tait, NIWA Chief Scientist Climate, contacted the Wellington Region Emergency Management O¨ce, and the team was immediately brought into emergency preparedness meetings alongside other agencies such as the council, MetService, and Fire and Emergency New Zealand.
On 29 June the latest information was showing the biggest risk to be to a portion of Breaker Bay Road, contributing to a decision to evacuate residents.
While the waves did not result in the worst-case scenario this time around, Dr Rautenbach is very happy with the accuracy of the model’s predictions.
“In our model there is always a choice between one option and a more conservative option – we always choose the conservative one.”
Evaluation of the model is ongoing and likely to provide further insight into how it can be improved.
It is now being used in the Bay of Plenty, and there are plans to make it available to other areas.
“This experience has shown us that this is potentially a valuable tool that can be developed further for bespoke purposes. I’m super happy with the outcomes, given how we were able to produce a high-resolution prediction at the eleventh hour,” Dr Rautenbach said.

www.niwa.co.nz18 Water & Atmosphere August 2021
Putting the weather on iceSam Fraser-Baxter catches up with a Fiji-born weather technician with a newfound love for the cold.
Heavy snow is falling as Anuragh Chandra checks the air temperature at his latest work site.Taking wind chill into account it is -26°C.Chandra grins. Just two years ago, he was living and working in Fiji.Now, he’s battling the elements, trying to set up a weather station in the coldest place on earth.
e feels like he’s been on a rollercoaster recently, but the Christchurch-based NIWA instruments
technician is relishing the ride.
Chandra grew up on Vitu Levu, Fiji’s largest island, and his career as a weather technician could be described as a ‘happy accident’.
After enjoying science classes in high school, Chandra decided to study electronic engineering at university. He needed to complete work experience to graduate, so applied for an internship with the Fiji Meteorological Service.
“In Fiji when you talk about electronics, you’re mostly talking about radios, televisions, receivers and transceivers. But when I went to the weather o¨ce and I saw all these electronic applications, I thought ‘Woah, this is really cool.’”
Just weeks after starting, a technician who managed the weather surveillance radars suddenly left. Their responsibilities were now his. It was 2003, and Chandra was 22-years-old.
“When I looked inside the weather radar’s transmitter cabinet, everything just looked too complicated. I thought ‘Maybe this is not my cup of tea...’”
Chandra backed himself and, after furious study of the radar’s manual, managed to fix the instrument.
PROFILE
Recognising talent, the Fiji Meteorological Service took him on fulltime and, over the next 13 years, he worked his way up the ranks to become a senior technician, developing the skills needed to plan, install, and maintain a full array of weather monitoring instrumentation.
Along the way, he worked with NIWA technicians on a major upgrade of Fiji’s automatic weather network, and Chandra started wondering what it would be like to take his new skills to the colder climes of New Zealand.
Like many developments in his career, it happened sooner than expected.
By 2018, he had landed a job at NIWA’s Christchurch o¨ce as an instrument technician.
The role involves helping to manage NIWA’s network of more than 100 weather stations, and requires an encyclopaedic knowledge of the technology, combined with an acute understanding of the climate science the data is used for.
With weather stations sited in all corners of the South Island, he’s also been able to test himself against the full rigours of New Zealand’s winter.
“In Fiji, a cold day is 19 degrees, so I was really looking forward to living in Christchurch and seeing if I could survive.”
Another brisk day at the o¨ce for the NIWA installation team. (Alec Dempster)

www.niwa.co.nz August 2021 Water & Atmosphere 19
Chandra hasn’t just survived – he has flourished. He says visiting stations on both islands and training NIWA field technicians has been an amazing opportunity to develop his professional capabilities. He’s also loved the cold, watching the leaves change colour and the shorter, darker winter days.
Then, one night in October 2020, Chandra’s phone rang. It was his manager, Andrew Harper.
“He said ‘Do you want to go to the ice?’ And I said ‘Yeah, why not?’”
here has been a weather station at Scott Base recording climate data since 1957, and it has played
a crucial role in charting Antarctica’s changing climate. However, a new station needed to be installed as part of the Scott Base upgrade.
One of his colleagues had to pull out of the job and Chandra had just two weeks to prepare before joining environmental monitoring technician Alec Dempster in isolation for the 14-day pre-trip Covid quarantine period.
Chandra recalls those days as a chaotic blur of excitement and uncertainty.
But, in late November, he was aboard a Hercules aircraft packed with the latest meteorological equipment and headed for the ice.
“We landed and I couldn’t believe I was standing on frozen ocean. It was a proud feeling. I never imagined that I would end up there so early in my career. For my family and friends back home, it was a big moment. People from Fiji don’t get to go to Antarctica.
“I can still remember my excitement levels when I was seeing everything for the first time: ice for the first time, daylight at night for the first time, Scott Base for the first time. It felt like we were on a mission, like we were on the moon.”
Chandra says it normally takes two technicians about three days to install an automatic weather station in New Zealand. But, due to the challenges posed by Antarctica’s extreme conditions and remote location, it took Chandra and Dempster 16 days.
Chandra says the successful install is, without doubt, the proudest accomplishment of his career.
“What we did at Antarctica, it looks so small, but it’s so special. The data is going to be used for so many things, for so many applications, for so many purposes.
“I’m proud I’ve played some part in making this information available to all those scientists and researchers.”
Alec
Dem
pste
r
Anuragh Chandra flies the Fiji flag in front of Scott Base’s new weather station earlier this year. (Alec Dempster)
“It felt like we were on a mission, like we were on the moon ”Anuragh Chandra

www.niwa.co.nz20 Water & Atmosphere August 2021
Rebe
kah
Pars
ons-
King

www.niwa.co.nz August 2021 Water & Atmosphere 21
Protecting our taonga together
Alex Fear looks at the Cultural Keystones Species research programme, a research partnership that grew out of the
vision of a Ngāti Hau kaumatua.
Northland hapū members join NIWA researchers combing a tributary of
the Wairua River for juvenile tuna/eel.
(Rebekah Parsons-King)

www.niwa.co.nz22 Water & Atmosphere August 2021
r Erica Williams was hearing time and again from hapū
partners about the impacts they were observing when they went to their awa to get food for the table.“For some time they were reporting that the abundance and size of freshwater taonga species were declining,” says Williams, Pou Whakarae – Te Hiringa Taiao (Chief Scientist) of Te Kūwaha, NIWA’s Māori Environmental Research team.
Taonga species such as tuna (freshwater eel), kōura (freshwater crayfish) and kākahi (freshwater mussels) are central to the identity and wellbeing of many Māori communities.
But these species, which for generations have sustained Māori and helped transfer knowledge of customary practices from one generation to the next, were clearly in trouble.
Dr Williams says she was also getting a strong message that hapū wanted significant improvements in the management and restoration of freshwater and estuarine environments to help support the taonga species that live within them.
“My mentor, the late Matua Allan Halliday, wanted to know more about his rohe than any other agency, so that their hapū were always in the front-foot position,” explains Williams.
“He wanted his hapū to develop the skillsets needed to influence change and to be acknowledged and respected as the experts of their rohe. It is his vision that sits at the heart of the Cultural Keystone Species (CKS) programme.”
he MBIE Endeavour-funded CKS programme included interlinked studies centred around
understanding what causes stress to freshwater taonga species throughout their life. One focus was on juvenile life stages to maximise species survival through this vulnerable period.
“We have developed ways to communicate state and trends of these taonga populations, as well as frameworks to support hapū decision making in their management,” says Williams.
“It is all designed to meet the needs of our partnerships and to deliver new tools and knowledge that support the protection and restoration of freshwater taonga species.”
Each year dozens of elvers – juvenile tuna/eel – are monitored as part of ongoing research into tuna recruitment in the Wairua catchment. (Rebekah Parsons-King)
“Our partnership with NIWA has enabled us to strengthen the hapū position as kaitiaki ”Delaraine Armstrong, Chairperson of NKoNWN
Protecting our taonga together

www.niwa.co.nz August 2021 Water & Atmosphere 23
embers of Te Tai Tokerau (Northland) hapū collective Ngā Kaitiaki o Ngā Wai Māori
(NKoNWM) have long been concerned about the declining tuna populations in their respective rohe. Over the last decade NKoNWM have worked with Northpower, NIWA, Ministry for Primary Industries, Department of Conservation, and other agencies to move juvenile eels over the Wairua Falls power station as they swim upstream as part of their life cycle.
To test the success of the trap and transfer programme, each March NKoNWM and NIWA look at how the elvers that are being moved are surviving. The annual two-week survey involves catching juvenile eels in streams connected to the Wairua River to assess their numbers and distribution. The eels are caught using electric fi shing techniques, identifi ed, measured, and then promptly returned to the stream.
The survey is one of many projects within the CKS programme where mana whenua undertake the fundamental research required to inform their unique responsibilities as kaitiaki.
“This is the fi rst time research of this type has been undertaken with our own hapū in our own rohe,” says Delaraine Armstrong, Chairperson for NKoNWM.
“This mahi keeps alive the tradition of kaitiaki looking after tuna and gives our seven hapū the opportunity to come together for the survey.
“Our tamariki and mokopuna join us as well and have the chance to learn from the research and mātauranga.”
Prior to the Wairua River elver surveys very little research had been undertaken nationally to help explain what makes stream habitats suitable for elvers to thrive.
This multi-year survey, alongside other projects within the CKS programme, has signifi cantly improved understanding of the factors that impact the survival of juvenile eels and what habitats are good for tuna.
The benefi ts for the hapū involved also extend beyond the immediate research results.
“With the support of NIWA we have recently completed the certifi cation of nine electric fi shers,” explains Armstrong.
“That has allowed us to develop our own independent waterways surveying capability which has recently led to the signing of a contract with the Living Water partnership. With the development of this expertise we have provided career pathways for rangatahi to stay in the rohe.
“Our partnership with NIWA has enabled us to strengthen the hapū position as kaitiaki – working together to bring our weight to the mahi needed to clean up our waterways.”
Hapū-driven research, where it is co-designed and undertaken in a context relevant to the partner’s needs, sits at the heart of the CKS programme. The programme focused on building capability and capacity by helping the hapū partnerships further develop the skills they need to navigate the science and policy systems.
“It is about valuing mātauranga Māori alongside other science knowledge systems,” says Williams.
“It is also about taking every opportunity to build shared experiences, where hapū become comfortable working with scientists, and both partners build mutual understandings and capacity.
“More e� ort is needed to do this type of place-based, mātauranga-driven mahi. The benefi ts are almost unquantifi able, and the outcomes are valued by all parties so much more.”
Dr Erica Williams (left) searches for tuna using an electric fi shing wand. Tuna are temporarily stunned and returned unharmed after assessment. (Rebekah Parsons-King)
Over fi ve years the CKS programme has supported at least 30researchers working in partnershipwith 20 hapū/tribal entities,7 consultancies, 2 power companies, and 15 regional and central government agencies.

www.niwa.co.nz24 Water & Atmosphere August 2021
“We hope that funding agencies are ready for the next step in this journey as we seek to influence larger opportunities that are completely focused on Māori research needs and are led and delivered by hapū and iwi.”
Williams says the CKS programme would not have happened without kaumatua such as the late Matua George Tuhiwai, May Tito, and Allan Halliday.
“This programme and its outcomes are on the back of their e�orts, leadership and vision. All of us wish that we had listened more.
“We all have much more to do to realise their vision.”In collaboration with the University of Waikato, the CKS team has also supported five graduate students and three summer research scholarship interns through a variety of practical experiences. These experiences include developing strong professional networks and understanding of the importance of partnerships between hapū/iwi, agencies, and research providers.
Williams says NIWA is also learning from the students.
“They bring fresh, new approaches to how research is conducted, the communication of research on social media platforms, along with their pre-existing talents in planning, photography and design.”
What’s the next challenge?
“There are very few datasets that are addressing issues impacting taonga species from a Māori perspective – focusing on species of importance to them, at locations and scales of importance to them,” says Williams.
“We have filled some of the holes, but have also exposed more gaps in the datasets that hapū need.”
She says NIWA is also continuing to evolve its approach to the co-design and co-delivery of Māori-driven research.
Te Kūwaha Māori graduate intern, Melanie Mayall-Nahi, readies elvers for measurement alongside the Karukaru River. (Rebekah Parsons-King)
Milestones from the CKS programme include:
• significant advances in understanding the water quality and habitat needs of juvenile tuna, kōura and kākahi
• new methods for undertaking state and trend analyses that are directed by mātauranga Māori and informed by hapū-driven datasets
• research that enables improved tuna, kōura and kākahi restoration and management actions
• publications available via Te Wai Māori website on the current state of taonga species and steps needed to improve management under a changing climate
• new taonga species booklets to provide accessible information about tuna, kākahi, īnanga, kōura, piharau, and kanae life cycles.
More information at niwa.co.nz/te-kuwaha
Protecting our taonga together

www.niwa.co.nz August 2021 Water & Atmosphere 25
The Ngā Kaitiaki o Ngā Wai Māori and NIWA field team outside the wharenui on the Korokota marae in Northland. (Rebekah Parsons-King)
“We all have much more to do to realise their vision”Dr Erica Williams

www.niwa.co.nz26 Water & Atmosphere August 2021
How do you make a fast boat go faster?
It’s not easy keeping up with a high-performance foiling monohull capable of speeds of up to 90km/h
This Emirates Team New Zealand chase boat needed all the power its four 400hp Mercury engines could generate, just to keep up on the Hauraki Gulf this summer.
You need impressive marine engineering and hydraulic skills to get a 6.5 tonne yacht to fly - you also need the best sailors and the best forecasts you can get
about conditions, both above and below the water.
NIWA worked with Emirates Team New Zealand for more than 19 months as the official supplier of weather and marine data, delivering high resolution wind and
current forecasts to help shape both boat design and race day tactics.
We can’t give away all the secrets, but as Emirates Team New Zealand trimmer Glen Ashby says: “Getting accurate forecasting is absolutely paramount to the
success of our team.”

www.niwa.co.nz August 2021 Water & Atmosphere 27
ETN
Z
www.niwa.co.nz28 Water & Atmosphere August 2021
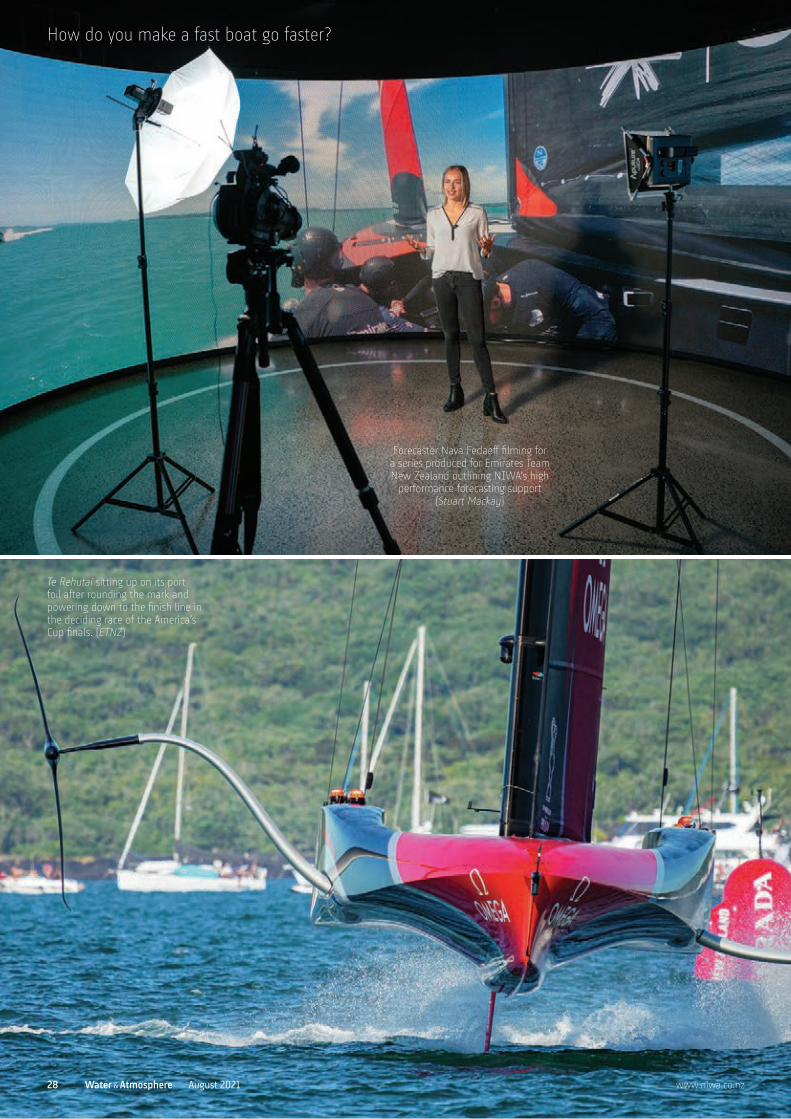
Forecaster Nava Fedaeff filming for a series produced for Emirates Team New Zealand outlining NIWA’s high
performance forecasting support (Stuart Mackay)
Te Rehutai sitting up on its port foil after rounding the mark and powering down to the finish line in the deciding race of the America’s Cup finals. (ETNZ)
How do you make a fast boat go faster?

www.niwa.co.nz August 2021 Water & Atmosphere 29
A budding young America’s Cup sailor captures course data projected across the Race Zone
floor from real-time NIWA wind and tide forecasts.
(Stuart Mackay)
Visitors to the Spark 5G Race Zone at the Viaduct Basin interact with a digital animation of race day winds built from NIWA data. More than 30,000 people visited the Race Zone during the Cup campaign. (Stuart Mackay)

How do you make a fast boat go faster?
www.niwa.co.nz30 Water & Atmosphere August 2021
Tacticians had to contend with powerful tidal currents moving
past North Head and out through the Rangitoto Channel, as well as the marked eastern flows between
Rangitoto and Browns Island/Motukorea. (NIWA)
Light conditions taunted regatta officials. Dark shading in this high
-resolution wind forecast indicates winds below the 6 knot minimum
needed for racing on course D, while the Rangitoto Channel options look
more promising. (NIWA)
Race day strategies centred around complex predictions of how the
prevailing westerlies (yellow) and the late afternoon sea breezes (green)
would play out across the inner harbour courses. (NIWA)

www.niwa.co.nz August 2021 Water & Atmosphere 31
As well as high-resolution forecasts for Emirates Team New Zealand eyes only, NIWA meteorologists
also delivered daily weather updates to hundreds of thousands of TV viewers during the America’s
Cup finals. (NIWA)
Winds swirling around the islands and headlands leave a disconcerting
pattern of eddies around the harbour entrance for the helmsman
to negotiate. (NIWA)
The flag flies proudly as triumphant team members join the victorious sailing crew moments after Team New Zealand secured the America’s Cup for the fourth time. (TVNZ)

www.niwa.co.nz32 Water & Atmosphere August 2021
Supercharging the view from
aboveFrom the rocky shores of Wellington’s South Coast to the icy waters of Antarctica, NIWA scientists are combining drone
technology with advanced computer skills to map, measure and analyse the natural environment as never before.
Campbell Gardiner explains.

www.niwa.co.nz August 2021 Water & Atmosphere 33
t low tide on a drizzly morning at Wellington’s Taputeranga
Marine Reserve, environmental monitoring technician Hamish Sutton clambers among rocks looking for the best place to set up his GPS tripod.
His colleague, marine ecologist Dr Leigh Tait picks through nearby tide pools laying out rubber mats, visually identifying kelp species and registering their coordinates.
When the rain clears, Sutton unboxes a big black drone and launches it on a pre-programmed flight over 20 hectares of shallow reef. The area below is home to an abundance of sea creatures and underwater plants, including nearly 400 species of seaweed.
A multispectral camera that registers colours invisible to the human eye hangs from the bottom of the drone. With six lenses, it lights the seaweed up like a Christmas tree, taking a high-resolution photo every two seconds.
There’s a long way to go, but these initial photos are the first step towards creating a detailed digitally-enhanced overview of Taputeranga’s tidal seaweed forests.
Untroubled by a flock of territorial gulls, the drone continues down its pre-ordained path. “It’s just like mowing a lawn,” says Sutton. Reaching the end of a line, the machine stops in mid-air and automatically pivots for its next run. Sutton lands the machine for battery changes, data card switch-outs and rain interruptions.
The rubber mats play an important role in ‘ground truthing’ the 30,000 images the camera will take. Being able to relate the images to real features on the ground makes things easier when it comes to digitally “stitching” the photos together into 2D or 3D models. After the stitching is complete, Tait will run the images through powerful computer software – software he’s trained to automatically identify the precise type of seaweed it sees.
It is this advanced machine learning capability which means Tait can turn the drone images into a comprehensive bird’s-eye view of the reserve’s seaweed stocks.
Bull kelp plants are revealed in bright scarlet, other seaweeds (fleshy red algae and coralline) are light pink and mussel patches are distinguished by dark brown or black shadows. (NIWA)
Images captured by the multi-spectral camera mounted on this DJI Matrice 600 drone will help build a detailed map of Wellington south coast ecosystems. (Rebekah Parsons-King)

www.niwa.co.nz34 Water & Atmosphere August 2021
t’s important work. By providing nutrients and shelter for animals and absorbing carbon emissions,
seaweed plays a major role in sustaining marine ecosystems and in bu�ering our warming climate. We all need to know whether our seaweed is doing OK.
This survey is being conducted for the Department of Conservation (DOC). DOC will use the information in a report card on the state of our marine reserves – helping to chart the health of these vital seaweed forests over time.
Where once researchers like Tait could only observe from above using expensive aircraft or satellites, drones now enable scientists to transform the scope and scale of their work.
The small, remote-controlled units are easily deployed and can quickly survey large, hard-to-access areas. Plus, repeated flights can help illuminate changes over time that might otherwise go unnoticed.
The drones also carry increasingly specialised camera equipment and sensors.
But, perhaps more significantly, computing advances now mean the data this equipment captures can be enhanced using advanced processing power and artificial intelligence software.
That package of drones and digital science is now opening up a whole new array of research opportunities.
Drone pilot Hamish Sutton (left) and Dr Leigh Tait check settings before launching another pre-programmed flight across the Taputeranga Marine Reserve. (Rebekah Parsons-King)
Super-charging the view from above

www.niwa.co.nz August 2021 Water & Atmosphere 35
Sutton’s three-hour drone flight at Lake Tennyson captured a staggering one billion LiDAR data points
hristchurch-based Sutton has been flying drones at NIWA for three years. He’s one of many
drone pilots across the organisation who have passed advanced flight training courses approved by the Civil Aviation Authority. The main goal when operating these expensive flying machines, he says, is “don’t crash”. It’s a lesson that has come from hard experience – and even harder landings.
Late last year, Sutton took the controls for a research project in the Canterbury high country. At Lake Tennyson, north of Hanmer Springs, boulders studded into moraines (material left behind by moving glaciers) are giving NIWA principal scientist Dr Andrew Lorrey and colleagues from Victoria University of Wellington and the University of Maine, vital clues about the glaciers that dominated the landscape tens of thousands of years ago.
The fluctuation of glaciers and ice sheets – past and present – reflects their sensitivity to climate. Thanks to topographic data gleaned from the whirring drone, 4D glacier models put together by Lorrey and colleagues are revealing what the temperature changes were like when much larger glaciers underwent a rapid retreat.
With much of the terrain covered in dense tussock, it’s been tricky up until now to define the moraines and know where the best Lake Tennyson boulder samples can be found. Enter drone-mounted LiDAR technology, which Lorrey likens to “x-ray vision”. LiDAR is a remote sensing method that can generate ultra-precise, 3D elevation maps of ground features.
“It’s not terribly clear, in some cases, what’s going on in a landscape like this because vegetation gets in the way and the landforms we’re looking for are very subtle,” says Lorrey.
“We see through all that with the drone’s LiDAR, using it to strategically target where to take our field samples. Now, we can look at the GPS coordinates of samples we’ve already taken and figure out where the gaps are – where we need to sample next.”
Sutton’s three-hour drone flight at Lake Tennyson captured a staggering one billion LiDAR data points, which were processed back at NIWA’s Christchurch lab and turned into a detailed map. This map lets Lorrey and colleagues analyse the old glacial landforms at footprint scale, defining glacier timelines in the landscape and locating boulder samples on them with pinpoint accuracy.
Climate scientist Dr Drew Lorrey takes samples from a boulder left behind by a retreating glacier in North Canterbury’s Tennyson Valley. The boulder was identified using drone-mounted LiDAR. (Rebekah Parsons-King)

www.niwa.co.nz36 Water & Atmosphere August 2021
ight hundred kilometres north at NIWA’s Ruakura research facility, freshwater ecologist Dr Daniel
Clements and aquatic biology technician Aleki Taumoepeau put a small autonomous boat through its paces in a hydraulic flume pool.
At first glance, the sleek aquatic drone looks like the kind of thing that would delight small children. But this is no toy – the technology is integral to developing new techniques for detecting the introduced weeds that plague our lakes and rivers.
Invasive aquatic weeds are a major problem in many New Zealand waterways. They outcompete native species, play havoc with our irrigation and hydropower infrastructure, and severely compromise cultural and recreational values. Early detection is the key to e�ective control.
Working with NIWA’s Instrument Systems and Marine Biosecurity groups, Clements and his team are developing algorithms for a new underwater detection system. Video imagery and hydroacoustic
data, captured by sensors as the boat skims over the surface of the water, are combined with an artificial intelligence technology known as ‘deep learning’. This digital advance enables computer software to ‘search’ the video frame by frame for target species – tagging GPS co-ordinates as it goes.
The aquatic drone also collects information about bathymetry, sediment and vegetation abundance, resulting in a rapid and cost-e�ective detection and mapping tool that can be e�ectively used over large areas.
The trial is in its early stages, and Clements readily acknowledges that human dive surveys will always play a role in this work. But, drawing parallels with New Zealand’s Covid-19 response, he says the technology o�ers huge potential.
“Eradicating a freshwater invasive weed by detecting it early is much more feasible and cost-e�ective than dealing with a widespread incursion in the long term.”
Aquatic biology technician Aleki Taumoepeau monitors the autonomous drone during weed detection trials on Lake Rototoa near Kaipara. (Daniel Clements)
Dr Daniel Clements with the aquatic drone – part of NIWA’s suite of high-tech data-gathering tools. (Mary de Winton)
Super-charging the view from above

www.niwa.co.nz August 2021 Water & Atmosphere 37
IWA’s drone capability extends well below the waterline. As well as tracking weeds and sediment
fl ows, remote or autonomous vehicles are used, among other things, to assess the health of scallop populations, map ocean currents and measure coastal water quality and algal blooms.
Dr Leigh Tait recently broke new ground, dipping under the surface of Antarctica’s icy Ross Sea with a BoxFish ROV (remotely operated vehicle), surveying the Antarctic marine life more than 100 metres below.
The vehicle is tethered to a surface ship by cable and “fl own” by Tait using the sensors and high defi nition cameras it carries.
Operating out of sight on the Antarctic sea fl oor brings its own set of problems. But high-speed fi bre optic cables have brought a new era of data transfer back to the mother ship, and Tait believes we’re at the start of an explosion of advanced marine ROV use.
“We’re now beginning to take what we’ve learnt from using technology on aerial drones and are fi tting out similar, miniaturised systems for underwater use.”
Among the rich diversity of Ross Sea life, the recent survey uncovered surprisingly deep and dense stands of large kelp, raising interesting questions about their role in the Antarctic marine carbon cycle.
“It really opens up a whole new fi eld of research in how those plants are taking CO2 out of the atmosphere and storing that in the deep cold sea. We really know very little about that.”
Tait is already planning how he can get his ROV back down to the Ross Sea to uncover some of the answers.
With the advances in technology matched by the relentless march of computer science, expect to see a lot more drone activity in our skies, lakes and distant oceans in the years ahead.
“It really opens up a whole new fi eld of research”Dr Leigh Tait
The Boxfi sh ROV reveals the richness of life 70m below in the Ross Sea, including Antarctic scallops, feather and brittle stars, tubeworms and an array of sea cucumbers, corals and urchins. (NIWA)

www.niwa.co.nz38 Water & Atmosphere August 2021
SOLUTIONS
Know your snowWith the winter snowpack starting to build, who’s keeping an eye out on conditions in the mountains? Sam Fraser-Baxter looks at a remote network of weather stations helping keep alpine adventurers safe.
t’s a mountaineer’s worst nightmare – a loud crack, then a cascade of snow and ice hurtling downhill.
Avalanches have claimed the lives of 27 people in New Zealand in the past two decades.
Knowing exactly when and where an avalanche might occur is a bit like trying to predict lightning.
But, with NIWA’s help, the Mountain Safety Council (MSC) can e�ectively forecast the degree of avalanche danger for those venturing into the backcountry mountains.
It’s one of just a range of services flowing from the data gathered by a network of 11 high elevation weather stations set up and maintained by NIWA’s environmental technicians.
Hydrologist Dr Christian Zammit is the current custodian of NIWA’s alpine weather network and its genesis.
The genesis of the network can be traced back to the mid-2000s. At the time, growing awareness of climate change was starting to prompt questions about New Zealand’s future water supply.
Snow plays a significant role in both national water flows and the economy. Snow melt contributes to as much as 30% of the intake of major hydroelectricity lakes, and large areas of the South Island rely on meltwater for irrigation. Snowflakes themselves are big business – in 2019 alone, there were about 1.7 million visitors to ski fields in New Zealand.
“Understanding the amount, seasonal nature and long-term changes to snow and ice is hugely important – especially with a warming climate,” says Zammit.
Before the NIWA snow and ice monitoring network, there was no infrastructure to help measure how much water was stored as snow in our mountains.
NIWA’s solution was hugely ambitious – a network of alpine weather stations that would record the depth, density and temperature of snow, as well as a range of other climate measurements such as precipitation, wind speed, temperature and humidity.
In 2008, after years of intensive planning, NIWA technicians headed into the mountains to start installing the equipment needed to gather that data.
It was no easy network to set up. Situated in some of New Zealand’s harshest environments, the stations had to endure freezing temperatures, gale-force winds, lightning, heavy rain and, of course, heavy snow.
They also needed to deal with kea – the mountain parrots notorious for pecking and ripping apart anything they get their beaks on.
NIWA’s environmental monitoring technicians learnt many lessons the hard way. The wind sensors, for example, require special modifications to thwart the inquisitive birds.
Andrew Aarsen working in summer snow during a December service visit to Mt Larkin station. The snowpack can be almost 2m deep in winter. (Sam Fraser-Baxter)

www.niwa.co.nz August 2021 Water & Atmosphere 39
NIWA technicians Adrian Aarsen (left) and James Townshend re-calibrate equipment on Mount Larkin snow and ice station, 1915m high up in the Richardson Mountains. (Sam Fraser-Baxter)
Back cover photo:Visitors to the Viaduct Basin interact with a digital animation of America’s Cup race day winds, built from NIWA forecast data. (Stuart Mackay)
Five years later, however, the snow and ice monitoring network was complete, made up of 10 high elevation stations running the length of the Southern Alps and one on Mount Ruapehu.
With specialist recording instruments in place from Fiordland to Tongariro National Park, the network covers a representative range of distinct high-altitude areas between 800 and 2200 metres above sea level.
The stations, and the long-term data series they provide, play a pivotal role in delivering insights into the ever-changing alpine climate to everyone from power planners and hydrologists, to farmers and ski field operators.
It is also crucial in helping the MSC shape its avalanche forecasts for recreational backcountry users, such as mountaineers, ski tourers, winter trampers or anyone else venturing into vulnerable areas.
Unlike ski fields, backcountry mountains are neither patrolled nor controlled, so understanding the condition of the snowpack and the avalanche threat it poses is vital.
The MSC’s forecasts are compiled by experienced snow safety professionals with an expert knowledge of avalanche phenomena. They use data from the NIWA network, coupled with direct observations from the field.
“Over the course of days, weeks and months, forecasters can start to build an understanding of what the snowpack is doing and how it is changing.
Continuous flow of data from these stations is really important,” says MSC operations manager Nathan Watson.
Avalanche forecasts covering 12 alpine regions are published daily during the snow season on the MSC’s Avalanche Advisory website (www.avalanche.net.nz).
They provide a rating for the avalanche danger – low, moderate, considerable, high, and extreme – across three elevation bands: sub alpine, alpine and high alpine.
“In a storm cycle, usually no one is in the field observing the snow – there’s no one out heli-skiing, climbing or touring.
“So, you’re relying on the stations and the weather data to paint a picture of what’s going on.”
The value of those stations, and the information they supply, will only go up as our climate warms.
Zammit says while researchers expect higher snowlines and less snow in future years, that will not necessarily mean less avalanche danger.
There might be fewer snow days, says Zammit, but expect larger amounts of snow falling during storm events.
“With climate change, the extremes get more extreme.”
Even more reason to ensure the data keeps flowing o� the mountains.
“Continuous flow of data from these stations is really important”Nathan Watson
