the average run length performance of a multivariate
TRANSCRIPT

International Journal of Business and Statistical Analysis ISSN (2384-4663)
Int. J. Bus. Stat. Ana. 1, No. 1 (July-2014)
E-mail address: [email protected], [email protected], [email protected],[email protected]
The Average Run Length Performance of a Multivariate
Exponentially Weighted Moving Average Control Chart
Procedure with Application
A. M. Kandil
1, M. S. Hamed
1*, S. M. Mohamed
2 and H. M. Shehata
3
1Department of Applied Statistics, Faculty of Commerce, Benha University, Egypt
2Department of Applied Statistics, Institute of statistical studies and research, Cairo University, Egypt 3Department of Commercial Affairs, Workers University, Egypt
Received: 15 Jan. 2014, Revised: 15 April. 2014, Accepted: 16 Apr. 2014, Published: 1 July 2014
Abstract: One of the most powerful tools in quality control is the statistical control chart. First developed in the 1920's by Walter
Shewhart, the control chart found widespread use during World War II and has been employed, with various modifications ever
since. The drawbacks to multivariate charting schemes is their inability to identify which variable was the source of the signal. The
multivariate exponentially weighted moving average (MEWMA) developed by Lowry, et al (1992) is an example of a multivariate
charting scheme whose monitoring statistic is unable to determine which variable caused the signal. In this paper, the run length
performance of multivariate exponentially weighted moving average (MEWMA) chart with application is studied. Industry fertilizers
is important one of the chemical industries in Egypt, so that this work concerns the fertilizers industries quality control, especially
urea fertilizer with application on Delta fertilizer and chemical industries which is considered on of the leading companies the field
of fertilizer production in Middle east with application of multivariate quality control procedures to achieve best one procedure for
multivariate quality control.
Keywords: Quality Control, Multivariate Analysis, MEWMA, (Multivariate Exponentially Weighted Moving Average).
1. INTRODUCTION
With today's use of computers, it is common to
monitor several correlated quality characteristics
simultaneously. Various types of multivariate control
charts have been proposed to take advantage of the
relationships among the variables being monitored. Alt
(1985), Jackson (1985), Lowry and Montgomery (1995),
and Mason et al. (1997) discuss much of the literature on
this topic.. The formatter will need to create these
components, incorporating the applicable criteria that
follow.
2. THE EWMA CONTROL CHART PROCEDURE:
Timm (1996) developed a control chart using the
EWMA to control a process mean. The EWMA
techniques give the most recent observation the greatest
weight with all previous observations weights decreasing
in a geometric (exponential) progression from the recent
back to the first. To demonstrate the EWMA technique,
suppose that we observe sample means , …
in the univariate case, where,
( ) (1)
MacGregor (1995) as introduced the univariate
Exponentially Weighed Moving Average (EWMA)
control chart:
( ) (2)
Where is a smoothing constant and is the value of
the EWMA after observation where represents the
observation number as well as an index of a point in time,
where we required without loss of
generality and
And he supposed that if , … are
independently and identically distributed ( )
random variables, the mean of is 0 and the variance is

2 A. M. Kandil et. al: The Average Run Length …
( )
{ [ ( ) ]
} ̅
(3)
Thus, he suggested that when the in-control
value of the mean is 0, the control limits of the EWMA
chart are at where are the parameters
of the chart.
Lucas and Saccucci (1990) have discussed that the
choice of for the interval ( ) work well in practice, with and being popular choices. A good rule of thumb is to use smaller values of to detect smaller shifts. They have also found that (the usual three – sigma limits) works although when is small – say, - there is an advantage in reducing the width of the limits by using a value of between about 2.6 and 2.8 although their control limits, were based on the asymptotic form of
which is given by √
.
3. MULTIVARIATE EXTENSION OF THE EWMA
CONTROL CHART:
Lowry, Woodall Champ, Rigdon (1992) has
generalized the concept of the univariate EWMA control
chart to the multivariate case. They defined the MEWMA
vectors as:
( ) (4)
Where and (
)
The MEWMA control chart gives an out of
control signal as soon as:
י ∑
(5)
Where is chosen to achieve a specified in-
control ARL, and ∑ is the covariance matrix of .
Mason et al. (1997) provide a technique to
interpret the out-of-control signal and identify an
assignable cause from a multivariate control chart. Their
method can be applied to MEWMA control chart.
Mason et al's method has assumed that Phase I
of process control is when the first subgroups are drawn
from the process and little is known about the joint
distribution of the quality characteristics.
Phase II is when sufficient information is known
about the process and subgroups are drawn to test if the
process is in control.
Often there is no reason to apply different
exponential weights to past observations of the
deferent quality characteristics. In this situation, Lowry et.
(1992) assumed the equal weights across characteristics
where , , the MEWMA
vectors can then be written as
( ) (6)
Under the assumption of equal weights, Lowry et
al. (1992) have shown that the covariance matrix of
can be written in terms of the exponential weight and
the covariance matrix of the process data ∑ as :
∑ { [ ( ) ]
} ∑ (7)
Note that if , the MEWMA chart is
equivalent to Hotellin's chart.
Lowry et al. have suggested that when the
process is likely to stay in-control for some time period,
the asymptotic from of the covariance matrix ∑ used to
calculate the MEWMA test statistic:
∑ {
} ∑ (8)
Lowry et al. (1992) have also, added the use of
exact variance of the EWMA statistic leads to a natural
fast initial response for the EWMA chart. Thus, the initial
that, out-of-control conditions can also, applied to the
MEWMA chart. Because, however, it may be more likely
that the process will stay in control for a while and then
shift out of control, they assumed for chart design that the
asymptotic (as ) covariance matrix, is give by
Equation (8) .
Linderman and Love (2000) have pointed out
that the used of exact covariance matrix and the
asymptotic covariance matrix lead to two different
procedures; actually, they have concentrated their efforts
concerned solely on the MEWMA chart using the
asymptotic covariance matrix and the exact covariance
matrix.
They have depended on the use of MEWMA
chart in order to study the quality characteristics
associated with a process. The process begins in the in-
control state with mean vector and covariance
matrix ∑ They supposed also that the process is subject
to a single assignable cause, which shifts the process
mean from to a point on the constant probability
density contour D; defined by
⌊ | ́ ∑ ⌋ (9)
Where , the parameter describing the size of shift, is
known. Note that Equation (9) is the constant probability
density contour for a - dimensional multivariate normal
distribution. This contour forms an ellipsoid which is
centered at and has axes at √ ,
where ∑ , .

Int. J. Bus. Stat. Ana. 1, No. 1, 1-14 (July -2014) 3
Khoo (2003) has suggested that the main choice for the value of in Equations (7) and (8) is, founded on the magnitude of shift where a quick detection is required. In general, small values of used for quick detection of small shifts, where as larger values of used for quick detection of large shifts. He has, also added that in case of ( ) the exact covariance matrix in Equation (7) is approximately equal to the asymptotic covariance matrix in Equation (8); pointing out that this, the two covariance matrices in Equation (7) and (8) differ only in initial periods when values are small. However, the advantages of the exact MEWMA chart over the asymptotic MEWMA chart are that the Exact MEWMA chart enables quicker detection of initial out-of-control conditions and is more sensitive for detecting shifts involving smaller values of .
4. THE AVERAGE RUN LENGTH (ARL)
PERFORMANCE:
The average run length is metric used to determine the
control chart's ability in order to determine if the process
is in control or out of control. Lowry et al. (1992)
established that ARL performance for a MEWMA control
chart is directionally invariant and determined solely by
the non-centrality parameter. This means that the average
run length depends only on the distance between the in
control and out of control mean, and not on the direction.
The non-centrality parameter given by Lowry et al.
(1992), as:
( ) ( ) ∑ (
) (10)
Where is the mean when the process is out of
control. They supposed that if , the
non-centrality parameter is given as:
( ∑
)
Recent researches have been developed to
approximate the ARL for a MEWMA control chart. These
methodologies have assumed that the in control
distribution is given as ( ∑ ) . In addition, all these
methodologies have made use of the ARL following fact
that the performance depends only on the non-centrality
parameter. As a result, to determine the ARL for a
MEWMA control chart with an in-control distribution
( ∑) and out-of-control distribution ( ∑) , we
can determine the ARL performance of a MEWMA
control chart with an in control distribution ( ) and
out of control distribution ( ) , where
( ). That is, the non-centrality parameter between
both problems is identical.
Actually, the ARL performance, which only depends
on the non-centrality parameter, is central to methodologies that have suggested to approximate ARL0 and ARL1 for a MEWMA chart. The approximation
methodologies include simulation Lowry et al. (1992), a bivariate Markov chain method Runger & Prabhu (1996), and integral equation Rigdon (1996, (a), (b)).
5. The Application:
Delta Fertilizers and Chemical Industries is considered on
of the leading companies in the field of fertilizers
production in Egypt. About 4500 employees are working
for it, on the various managerial levels. Urea production is
one of the major products of the company. The production
of urea occurs through three stages, summarized as
follows:
A) HIGH PRESSURE STAGE:
In this stage, urea is produced through two
reactions; the first reaction occurs by condensation of
Ammonia Gas and Carbon dioxide under high pressure
and temperature for the sake of the production of
intermediate material, known as Carbamate .The second
reaction happens by separating the water from the
Carbamate in order to a chive urea. In this, stage the
condensation of urea approximately 56%.
It contains 16 variables, these are:
X1 E-201Outlet Temperature
X2 Outlet Cold NH3 from E- 201
X3 Co2 to Train
X4 Co2 pressure to Synthesis
X5 Co2 after E-22
X6 R-201
X7 Temperature in Reactor R-201
X8 Temperature in Reactor R-201
X9 Temperature in Reactor R-201
X10 Temperature in Reactor R-201
X11 Stripper level
X12 Liquid Leaving the Stripper
X13 Stream from E-204 to j-201
X14 Conditioned water to Scrubber E-204
X15 Conditioned water from Scrubber E-
204
X16 Stream from j-203
4 A. M. Kandil et. al: The Average Run Length …
Table analysis of laboratory in this stage:
t1.1 NH3 Rector outlet
t1.2 CO2 Rector outlet
t1.3 UR Rector outlet
t1.4 B1 Rector outlet
t1.5 H2O Rector outlet
t2.1 NH3 Stripper outlet
t2.2 CO2 Stripper outlet
t2.3 UR Stripper outlet
t2.4 B1 Stripper outlet
t2.5 H2O Stripper outlet
B) LOW PRESSURE STAGE:
In this stage, the condensation of urea liquid rises
from 56% to 71%. This happens through the
decomposition of the remaining Carbamate and the
elimination of water under low pressure.
It contains seven variables, these are:
y1 Urea Solution from stripper E-202
y2 Steam to E-205
y3 Urea Carbonate Solution from stripper T-201 to E-205
y4 Gas leaving T-201
y5 Level in TK-201
y6 P-203
y7 Urea Solution in TK-201
Table analysis of laboratory in this stage:
t3.1 NH3 D 202 Outlet
t3.2 CO2 D 202 Outlet
t3.3 UR D 202 Outlet
t3.4 B1 D 202 Outlet
t3.5 H2O D 202 Outlet
t4.1 NH3 In TK 201
t4.2 CO2 In TK 201
t4.3 UR In TK 201
t4.4 B1 In TK 201
t4.5 H2O In TK 201
t5.1 NH3 In PI 302
t5.2 CO2 In PI 302
t5.3 UR In PI 302
C) EVAPORATION AND PRILLING STAGE:
This stage occurs by two stage:
Firstly, Evaporation stage:
In this stage, the condensation of urea rises from
71% to 98.7% approximately and the urea liquid trams
forms to urea melt. This happens under high pressure and
temperature.
Secondly, Prilling Stage:
In this stage, the urea melt is through formed into
prilling in the prilling tower.
It contains four variables, these are:
Z1 Urea Solution from D-204 to E-209
Z2 D- 205 Vacuum
Z3 Urea to periling tower X-202
Z4 E- 211 Vacuum
Table analysis of laboratory in this stage:
t6.1 B1
t6.2 H2O
t6.3 Pills > 3.35
t6.4 Pills 3.35: 2.4
t6.5 Pills 2.4 : 1.4
t6.6 Pills 1.4 :1.0
t6.7 Pills < 1.0
t6.8 UR
5.1 DATA DESCRIPTION: For the application of multivariate quality
control, chart data originate from urea production process,
which consists of the three stages and the analysis of
laboratory, which discussed above.
The number of the sample is 732 observations
taken per hour.
The advantages of this sample that, it has several
variables and several stage of the production. This
advantage of the production is the basic reason for
choosing this production to allow us to study the
multivariate quality control charts.

Int. J. Bus. Stat. Ana. 1, No. 1, 1-14 (July -2014) 5
In this application, we shall introduce the most
common using techniques of multivariate quality control
chart; MEWMA.
A multivariate EWMA chart consists of:
Plotted points, each of which represents the
multivariate statistic for each observation.
Upper control limits (red), which provide a
visual means for assessing whether the
process is in-control.
MINITAB marks points outside of the
control limits with a red symbol.
We select combination of r and ARL
for plotting several MEWMA charts for each
stage of the production study.
ARL and r are the parameters of the
MEWMA chart, the minimum allowable
ARL is 1 and the value of r must be a
number between zero and one.
Note that the default value of r = 0.1
and the default value of ARL= 200.
Fig. (1) MEWMA chart of x1, ..., x16 with ARL = 200, r = 0.1
We can summarize the MEWMA chart of
x1,…,x16 and t1.1,…,t2.5 (where ARL = 200 and r = 0.1)
as follows:
The upper control limit is 40.0.
Therefore, we expect the MEWMA
statistics to fall below40.0.
Test results indicate that all points
beyond the control limits except point 2
and 3 fall below the upper control limit.
Test results indicate that the process is
in- control for two points and out –of
control for 730 point. Then the out-of-
control rate 99.73% and the in-control
rate 0.27%.
Fig. (2) MEWMA chart of x1, ..., x16 with ARL = 200, r = 0.3
We can summarize the MEWMA chart of
x1,…,x16 and t1.1,…,t2.5 (where ARL = 200 and r = 0.3)
as follows:
The upper control limit is 40.5.
Therefore, we expect the MEWMA
statistics to fall below 40.5.
Test results indicate that 491 points
beyond the control limits.
Test results indicate that the process is
in-control for 241 points and out –of
control for 491 point. Then the out-of-
control rate 67.08% and the in-control
rate 32.92%.
Fig. (3) MEWMA chart of x1, ..., x16 with ARL = 200, r = 0.5
We can summarize the MEWMA chart of
x1,…,x16 and t1.1,…,t2.5 (where ARE = 200 and r = 0.5)
as follow:
The upper control limit is 41.0.
Therefore, we expect the MEWMA
statistics to fall below 41.0.
Test results indicate that 274 points
beyond the control limits.
Test results indicate that the process is
in- control for 458 points and out –of
6 A. M. Kandil et. al: The Average Run Length …
control for 274 point. Then the out-of-
control rate 37.43% and the in-control
rate 62.57%.
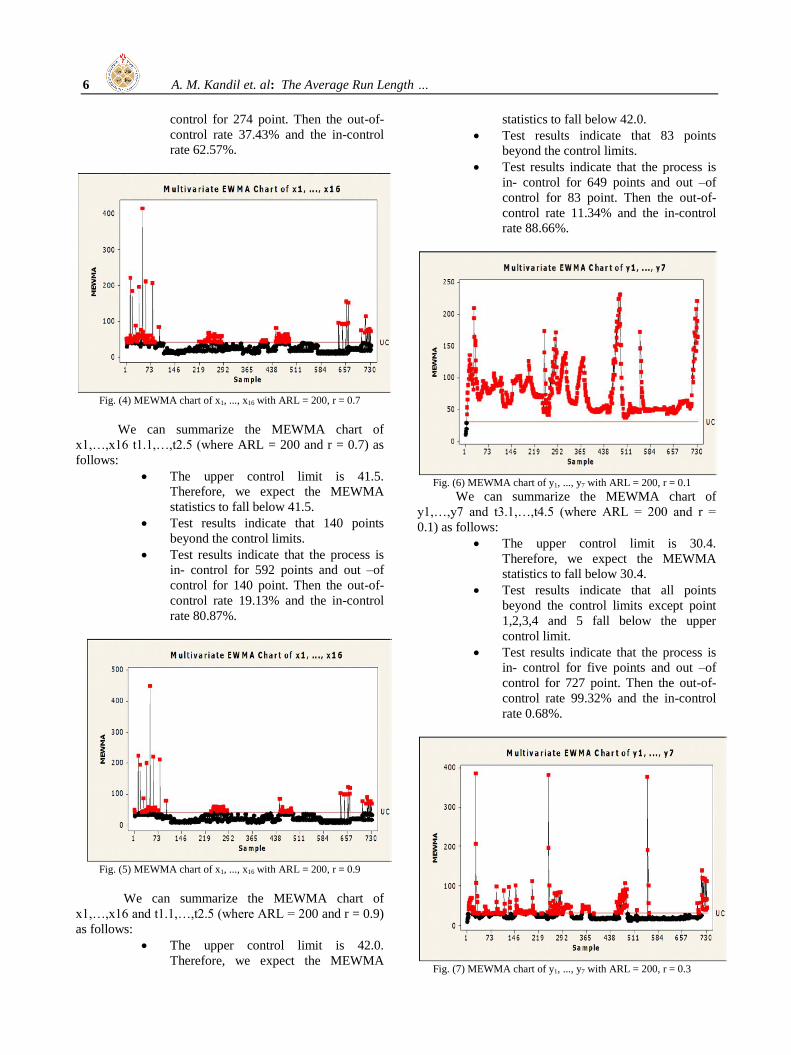
Fig. (4) MEWMA chart of x1, ..., x16 with ARL = 200, r = 0.7
We can summarize the MEWMA chart of
x1,…,x16 t1.1,…,t2.5 (where ARL = 200 and r = 0.7) as
follows:
The upper control limit is 41.5.
Therefore, we expect the MEWMA
statistics to fall below 41.5.
Test results indicate that 140 points
beyond the control limits.
Test results indicate that the process is
in- control for 592 points and out –of
control for 140 point. Then the out-of-
control rate 19.13% and the in-control
rate 80.87%.
Fig. (5) MEWMA chart of x1, ..., x16 with ARL = 200, r = 0.9
We can summarize the MEWMA chart of
x1,…,x16 and t1.1,…,t2.5 (where ARL = 200 and r = 0.9)
as follows:
The upper control limit is 42.0.
Therefore, we expect the MEWMA
statistics to fall below 42.0.
Test results indicate that 83 points
beyond the control limits.
Test results indicate that the process is
in- control for 649 points and out –of
control for 83 point. Then the out-of-
control rate 11.34% and the in-control
rate 88.66%.
Fig. (6) MEWMA chart of y1, ..., y7 with ARL = 200, r = 0.1
We can summarize the MEWMA chart of
y1,…,y7 and t3.1,…,t4.5 (where ARL = 200 and r =
0.1) as follows:
The upper control limit is 30.4.
Therefore, we expect the MEWMA
statistics to fall below 30.4.
Test results indicate that all points
beyond the control limits except point
1,2,3,4 and 5 fall below the upper
control limit.
Test results indicate that the process is
in- control for five points and out –of
control for 727 point. Then the out-of-
control rate 99.32% and the in-control
rate 0.68%.
Fig. (7) MEWMA chart of y1, ..., y7 with ARL = 200, r = 0.3

Int. J. Bus. Stat. Ana. 1, No. 1, 1-14 (July -2014) 7
We can summarize the MEWMA chart of
y1,…,y7and t3.1,…,t4.5 (where ARL = 200 and r = 0.3)
as follows:
The upper control limit is 30.9.
therefore ,we expect the MEWMA
statistics to fall below 30.9.
Test results indicate that 256 points
beyond the control limits .
Test results indicate that the process is
in-control for 476 point and out-of
control for256 point . then the out-of-
control rat 34.97% and the in-control rat
65.03%.
Fig. (8) MEWMA chart of y1, ..., y7 with ARL = 200, r = 0.5
We can summarize the MEWMA chart of
y1,…,y7and t3.1,…,t4.5( where ARL = 200 and r = 0.5 )
as follows:
The upper control limit is 31.4.
therefore ,we expect the MEWMA
statistics to fall below 31.4.
Test results indicate that 83 points
beyond the control limits .
Test results indicate that the process is
in-control for 649 point and out-of
control for83 point . then the out-of-
control rat 11.34% and the in-control rat
88.66 %.
Fig. (9) MEWMA chart of y1, ..., y7 with ARL = 200, r = 0.7
We can summarize the MEWMA chart of
y1,…,y7and t3.1,…,t4.5 (where ARL = 200 and r = 0.7)
as follows:
The upper control limit is 31.9.
Therefore, we expect the MEWMA
statistics to fall below 31.9.
Test results indicate that 58 points
beyond the control limits.
Test results indicate that the process is
in- control for 674 points and out –of
control for 58 points. Then the out-of-
control rate 7.92% and the in-control
rate 92.08%.
Fig. (10) MEWMA chart of y1, ..., y7 with ARL = 200, r = 0.9
We can summarize the MEWMA chart of
y1,…y7 and t3.1,…,t4.5 (where ARL = 200 and r = 0.9)
as follows:
The upper control limit is 32.3.
Therefore, we expect the MEWMA
statistics to fall below 32.3.
Test results indicate that 54 points
8 A. M. Kandil et. al: The Average Run Length …
beyond the control limits.
Test results indicate that the process is
in- control for 678points and out –of
control for 54 point. Then the out-of-
control rate 7.38% and the in-control
rate 92.62%.
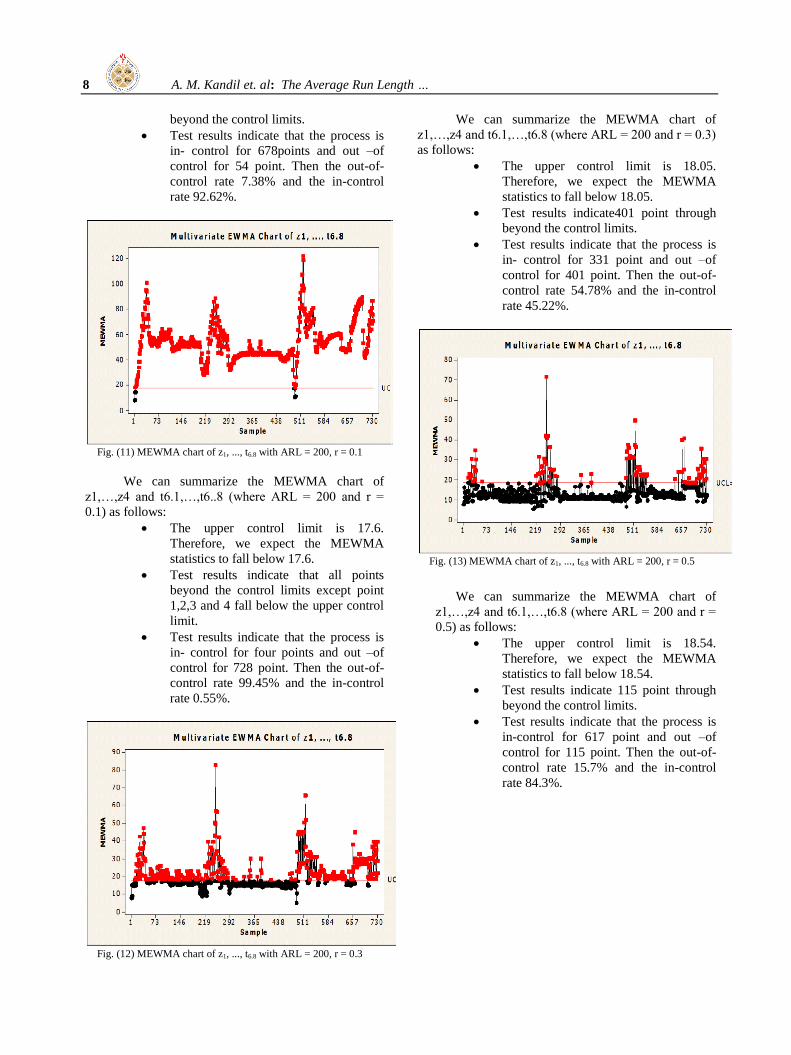
Fig. (11) MEWMA chart of z1, ..., t6.8 with ARL = 200, r = 0.1
We can summarize the MEWMA chart of
z1,…,z4 and t6.1,…,t6..8 (where ARL = 200 and r =
0.1) as follows:
The upper control limit is 17.6.
Therefore, we expect the MEWMA
statistics to fall below 17.6.
Test results indicate that all points
beyond the control limits except point
1,2,3 and 4 fall below the upper control
limit.
Test results indicate that the process is
in- control for four points and out –of
control for 728 point. Then the out-of-
control rate 99.45% and the in-control
rate 0.55%.
Fig. (12) MEWMA chart of z1, ..., t6.8 with ARL = 200, r = 0.3
We can summarize the MEWMA chart of
z1,…,z4 and t6.1,…,t6.8 (where ARL = 200 and r = 0.3)
as follows:
The upper control limit is 18.05.
Therefore, we expect the MEWMA
statistics to fall below 18.05.
Test results indicate401 point through
beyond the control limits.
Test results indicate that the process is
in- control for 331 point and out –of
control for 401 point. Then the out-of-
control rate 54.78% and the in-control
rate 45.22%.
Fig. (13) MEWMA chart of z1, ..., t6.8 with ARL = 200, r = 0.5
We can summarize the MEWMA chart of
z1,…,z4 and t6.1,…,t6.8 (where ARL = 200 and r =
0.5) as follows:
The upper control limit is 18.54.
Therefore, we expect the MEWMA
statistics to fall below 18.54.
Test results indicate 115 point through
beyond the control limits.
Test results indicate that the process is
in-control for 617 point and out –of
control for 115 point. Then the out-of-
control rate 15.7% and the in-control
rate 84.3%.
Int. J. Bus. Stat. Ana. 1, No. 1, 1-14 (July -2014) 9
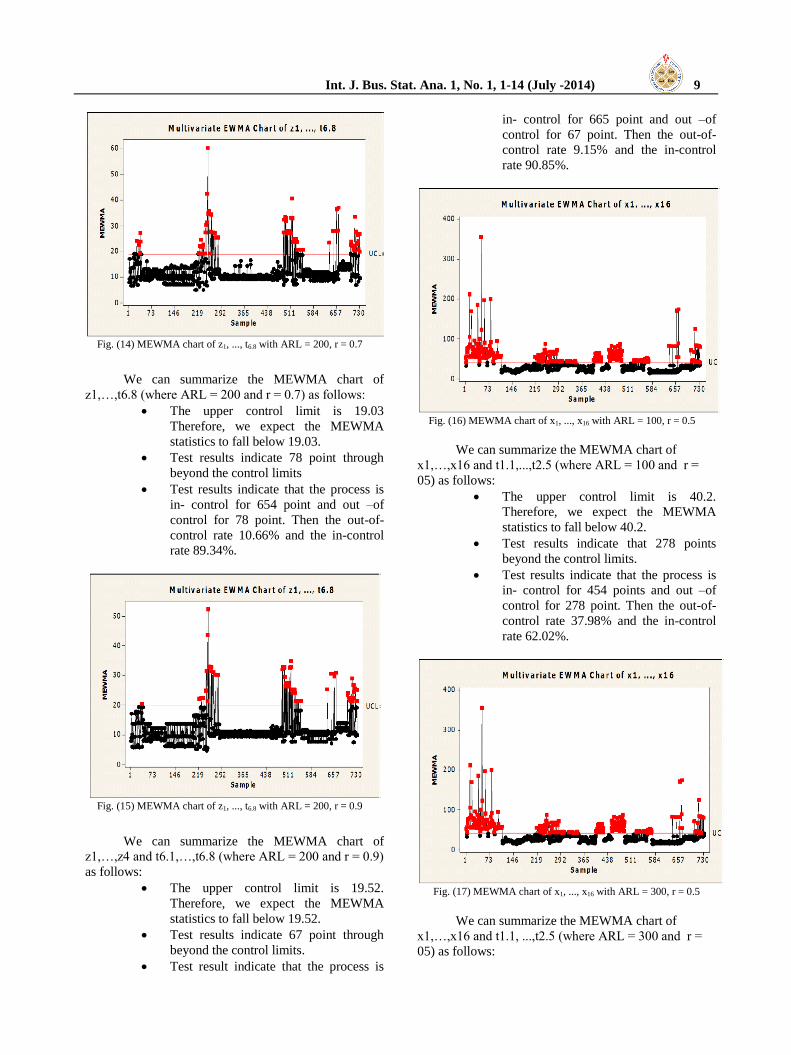
Fig. (14) MEWMA chart of z1, ..., t6.8 with ARL = 200, r = 0.7
We can summarize the MEWMA chart of
z1,…,t6.8 (where ARL = 200 and r = 0.7) as follows:
The upper control limit is 19.03
Therefore, we expect the MEWMA
statistics to fall below 19.03.
Test results indicate 78 point through
beyond the control limits
Test results indicate that the process is
in- control for 654 point and out –of
control for 78 point. Then the out-of-
control rate 10.66% and the in-control
rate 89.34%.
Fig. (15) MEWMA chart of z1, ..., t6.8 with ARL = 200, r = 0.9
We can summarize the MEWMA chart of
z1,…,z4 and t6.1,…,t6.8 (where ARL = 200 and r = 0.9)
as follows:
The upper control limit is 19.52.
Therefore, we expect the MEWMA
statistics to fall below 19.52.
Test results indicate 67 point through
beyond the control limits.
Test result indicate that the process is
in- control for 665 point and out –of
control for 67 point. Then the out-of-
control rate 9.15% and the in-control
rate 90.85%.
Fig. (16) MEWMA chart of x1, ..., x16 with ARL = 100, r = 0.5
We can summarize the MEWMA chart of
x1,…,x16 and t1.1,...,t2.5 (where ARL = 100 and r =
05) as follows:
The upper control limit is 40.2.
Therefore, we expect the MEWMA
statistics to fall below 40.2.
Test results indicate that 278 points
beyond the control limits.
Test results indicate that the process is
in- control for 454 points and out –of
control for 278 point. Then the out-of-
control rate 37.98% and the in-control
rate 62.02%.
Fig. (17) MEWMA chart of x1, ..., x16 with ARL = 300, r = 0.5
We can summarize the MEWMA chart of
x1,…,x16 and t1.1, ...,t2.5 (where ARL = 300 and r =
05) as follows:

10 A. M. Kandil et. al: The Average Run Length …
The upper control limit is 41.4.
Therefore, we expect the MEWMA
statistics to fall below 41.4.
Test results indicate that 271 points
beyond the control limits.
Test results indicate that the process is
in- control for 461points and out –of
control for 271 point. Then the out-of-
control rate 38.02% and the in-control
rate 62.98%.
Fig. (18) MEWMA chart of x1, ..., x16 with ARL = 400, r = 0.5
We can summarize the MEWMA chart of
x1,…,x16 and t1.1,….,t2.5 (where ARL = 400 and r =
05) as follows:
The upper control limit is 41.7.
Therefore, we expect the MEWMA
statistics to fall below 41.7.
Test results indicate that 268 points
beyond the control limits.
Test results indicate that the process is
in- control for 464points and out –of
control for 268 point. Then the out-of-
control rate 36.61% and the in-control
rate 63.39%.
Fig. (19) MEWMA chart of y1, ..., y7 with ARL = 100, r = 0.5
We can summarize the MEWMA chart of
y1,…,y7 and t3.1,…,t4.5 (where ARL = 100 and r =
0.5) as follows:
The upper control limit is 30.6.
Therefore, we expect the MEWMA
statistics to fall below 30.6.
Test results indicate that 89 points
beyond the control limits.
Test results indicate that the process is
in- control for 634 points and out –of
control for 89 point. Then the out-of-
control rate 12.16% and the in-control
rate 87.84%.
Fig. (20) MEWMA chart of y1, ..., y7 with ARL = 300, r = 0.5
We can summarize the MEWMA chart of
y1,…,y7 and t3.1,…,t4.5 (where ARL = 300 and r =
0.5) as follows:
The upper control limit is 31.8.
Therefore, we expect the MEWMA
statistics to fall below 31.8.
Test results indicate that 82 points
beyond the control limits.
Test results indicate that the process is
in- control for 650 points and out –of
control for 82 point. Then the out-of-
control rate 11.20% and the in-control
rate 88.80%.

Int. J. Bus. Stat. Ana. 1, No. 1, 1-14 (July -2014) 11
Fig. (21) MEWMA chart of y1, ..., y7 with ARL = 400, r = 0.5
We can summarize the MEWMA chart of
y1,…,y7 and t3.1,…,t4.5 (where ARL = 400 and r =
0.5) as follows:
The upper control limit is 32.1.
Therefore, we expect the MEWMA
statistics to fall below 32.1.
Test results indicate that 81 points
beyond the control limits.
Test results indicate that the process is
in- control for 651 points and out –of
control for 81 point. Then the out-of-
control rate 11.07% and the in-control
rate 88.93%.
Fig. (22) MEWMA chart of z1, ..., t6.8 with ARL = 100, r = 0.5
We can summarize the MEWMA chart of
z1,…,z4 and t6.1,…,t6.8 (where ARL = 100 and r =
0.5) as follows:
The upper control limit is 17.78
Therefore, we expect the MEWMA
statistics to fall below 17.78.
Test results indicate 135 point through
beyond the control limits.
Test results indicate that the process is
in- control for 597 point and out –of
control for 135 point. Then the out-of-
control rate 18.44% and the in-control
rate 81.56%.
Fig. (23) MEWMA chart of z1, ..., t6.8 with ARL = 300, r = 0.5
We can summarize the MEWMA chart of
z1,…,z4 and t6.1,…,t6.8 (where ARL=300 and r = 0.5)
as follows:
The upper control limit is 18.99.
Therefore, we expect the MEWMA
statistics to fall below 18.99.
Test results indicate 102 point through
beyond the control limits.
Test results indicate that the process is
in- control for 630 point and out –of
control for 102 point. Then the out-of-
control rate 13.93% and the in-control
rate 86.07%.
Fig. (24) MEWMA chart of z1, ..., t6.8 with ARL = 400, r = 0.5
We can summarize the MEWMA chart of
z1,…,z4 and t6.1,…,t6.8 (where ARL = 400 and r =
0.5) as follows:
The upper control limit is 19.31.
Therefore, we expect the MEWMA
12 A. M. Kandil et. al: The Average Run Length …
statistics to fall below 19.31.
Test results indicate 98 point through
beyond the control limits.
Test results indicate that the process is
in- control for 634 point and out –of
control for 98 point. Then the out-of-
control rate 13.39% and the in-control
rate 86.61%.
Test results indicate that for the same
ARL=200 the out of control rate
decreased by increasing the value of r
Test results indicate that UCL increased
by increasing the value of r.
We note that for the same value of r the
out-of control decreased by increasing
the value of ARL but with small rate.
Finally, we note that we use small value
of r to determine small shift in the
process mean and use large value of r to
determine large shift in the process
mean.
5.2 TEST RESULTS OF APPLICATION STUDY:
It is shown that in the High pressure stage, test
result of MEWMA (when r = 0.1 and ARL=200) the out-
of-control percentage 99.73% and the in-control
percentage 0.27%. The difference occurred in the
percentage is due to the sensitivity of MEWMA of the
small shifts, and the out-of-control percentage (when r =
0.3, r = 0.5, r = 0.7, r = 0.9 and ARL = 200) are
respectively (67.080%, 37.43%, 19.13%, 11.34% )
and the in-control percentage (32.92%, 62.57%,
80.87%%, 88.66%).
It is shown that in the Low-pressure stage, test
results of MEWMA (when r = 0.1 and ARL = 200)
indicate the out-of-control percentage 99.32% and the in-
control 0.68%, while, in the MEWMA the out-of-control
percentage(when r = 0.3, r = 0.5, r = 0.7, r = 0.9, and
ARL = 200) respectively (34.97%, 11.34%, 7.92%,
7.38%) and the in-control percentage (65.03%, 88.66%,
92.08%, 92.62%,).
It is shown that in the Evaporation and Prilling
stage, test result in MEWMA indicates (when r = 0.1, r
= 0.3, r = 0.5, r = 0.7, r = 0.9 and ARL = 200) the out-
of-control percentage respectively (99.45%, 54.78,
15.70%, 10.66%, 9.15%) and the in-control percentage
(0.55%, 45.22%, 84.3%, 89.34% 90.85%).
These results allow us to determine whether the
joint process variability is in-control or out-of-control.
It is shown that the out-of-control and the in-
control percentage changes by using difference values of
and ARL.
It was shown that there is a relationship between
the value of r and the out-of-control percentage, the out-
of-control percentage increased by increasing the value of
r.
Test results indicate that in the High pressure
stage, for example the points (114, 118, 123, 128,
133, 134, 138, 140, 143) out-of-control and the
variables which causes the out-of-control signals are (x6,
t2.4, x16) . Also points (151, 156, 161, 166, 167,
171, 173) out-of-control and the variables which causes
the out-of-control signal are (x2, x3, t2.1, t2.4) and so
on.
It is shown that in the design of MEWMA
control charts, small values of r are more efficient in
detecting small process mean shifts and large values of r
are more efficient in detecting large process mean shifts.
6. Finally:
The company should use multivariate quality control
chart; MEWMA, to monitor the quality of the urea
production.
On using the MEWMA chart to determine
whether or not the process in control, the company should
choose small values of r to detect small process mean
shifts and choose large values of r to detect large process
mean shifts.

Int. J. Bus. Stat. Ana. 1, No. 1, 1-14 (July -2014) 13
Table (1): Summarize MEWMA charts
ARL = 200, r = 0.1 ARL = 200, r = 0.3 ARL = 200, r = 0.5 ARL = 200, r = 0.7 ARL = 200, r = 0.9
UCL
Out-of-
control
Rate
In-
control
rate
UCL
Out-of-
control
rate
In-
control
rate
UCL
Out-of-
control
rate
In-
control
rate
UCL
Out-
of-
control
rate
In-
control
rate
UCL
Out-of-
control
rate
In-
control
rate
MEWMA
for x1, ...,
x16
40.00 99.73
% 0.27 % 40.50 67.08% 32.92% 41.00 37.43% 62.57% 41.50
19.13
%
80.87
% 42.00 11.34% 88.66%
MEWMA
for y1, ...,
y 6
30.40 99.32% 0.68% 30.9 34.97% 65.03% 31.4 11.34% 88.66% 31.90 7.92% 92.08% 32.30 7.38% 92.62%
MEWMA
for z1, ...,
t6.8
17.60 99.45
% 0.55 % 18.05 54.78% 45.22% 18.54 15.70 84.3% 19.03
10.66
%
89.34
% 19.52 9.15% 90.85%
Table (2): Summarize MEWMA charts
ARL = 100, r = 0.5 ARL = 200, r = 0.5 ARL = 300, r = 0.5 ARL =400, r = 0.5
UCL
Out-
of-
control
rate
In-
control
rate
UCL
Out-of-
control
rate
In-
control
rate
UCL
Out-of-
control
rate
In-control
rate UCL
Out-of-
control
rate
In-
control
rate
MEWMA
for x1, ...,
x16
40.20 37.98
% 62.02 % 41.00 37.43% 62.57% 41.40 38.02% 62.98% 41.70 36.61 % 63.39 %
MEWMA
for y1, ..., y
6
30.60 12.16
% 87.84% 31.4 11.34% 88.66% 31.8 11.20% 88.80% 32.10 11.07% 88.93%
MEWMA
for z1, ...,
t6.8
17.78 18.44
% 81.56 % 18.54 15.70% 84.3% 18.99 13 .93% 86.07% 19.31 13.39 % 86.61 %
14 A. M. Kandil et. al: The Average Run Length …
References [1] Alt, F. B. 1985. "Multivariate Quality control,"
Encyclopedia of the statistical Sciences, (Kot, Z, S;
Johnson, N.L.; and Read, C. R. eds.) Vol. 6, pp. 111-122.
[2] Alt, F. B. and Smith, N. D. 1988. "Multivariate process
control," Handbook of Statistics, Krishnaiah, P.R. and
Rao, C.R., Eds. Elsevier, Vol. 7, PP. 333-335.
[3] Fuchs, C. and Kenett, R. S. 1998. "Multivariate
Quality Control theory and Applications," Marcel
Dekker, Inc., New York.
[4] Jackson, J. E. 1985. "Multivariate Quality Control,"
Communications in Statistic-Theory and Methods, 11,
pp. 2657-2688.
[5] Jackson, J. E. and Morris, R. H. 1957. "An application of
multivariate Quality Control to photographic
processing," Journal of the American Statistical
Association, 52, pp. 186-199.
[6] Khoo, C. B. 2003. "Increasing the sensitivity of
Multivariate EWMA Control chart," Quality
Engineering. 16, pp.75-85.
[7] Linderman, K. W. and Love, T. E. 2000. "Economic
and Economic Statistical Design for MEWMA Control
chants," Journal of Quality Technology. 32, pp. 410-
417.
[8] Lowry, C. A. and Montgomery, D. C. 1995. "A Review
of Multivariate Control Charts," IIE Transactions, 27,
pp. 800-810.
[9] Lowry, C. A. ; Woodall, W. H. ; champ, C.W.; and
Rigdon, S.E. 1992. "A Multivariate Exponentially
Weighted Moving Average Control Chart,"
Technometrics, 34, pp. 46-53.
[10] Lucas, J. M. and Saccucci. M.S. 1990. " Average Run
Length for Exponentially Weighted Moving average
control Schemes using The Markov chain Approach, "
Journal of Quality Technology, 22, pp. 154-162.
[11] MacGregor, J. F, and Harris, T. J. 1990. " Discussion of
Exponentially weighted Moving Average control
Schemes," Technometrics, 32, pp. 23-26.
[12] MacGregor, J. F, and kourti, T. 1995. "Statistical
process control of multivariate process," Control Eng.
Practice. Vol. 3. No. 3, pp. 403-414.
[13] Mason, R. L. ; Champ, C.W. ; Tracy, N. D.; Wierda,
S.T. ; and Young, J. C. 1997. "Assessment of
Multivariate process control Techniques: A discussion
on Statistically - Based process monitoring and
control," Journal of Quality Technology, 29, pp. 140-
143.
[14] Masson, R. L. ; Tracy. N. D ; and Young, J. C. 2002.
"Multivariate Statistical process Control with
Industrial Application," The American Statistical
Association and Society for Industrial and Applied
Mathematics.
[15] Rigdon, S. E. 1995 . "An Integral Equation For the in
control Average Run Length of a Multivariate
Exponentially Weighted moving Average Control Chart,"
Journal of Statistical computation and simulation. 52, pp.
351-365.
[16] Runger, G. C. and prabhu, S.S. 1996. "A Markov Chain
Model for the Multivariate Exponentially Weighted
moving Averages Control chart," Journal of the
American statistical Association, 91, pp. 1701-1706.
[17] Timm, H. N. 1996. "Multivariate Quality control using
finite intersection Tests," Journal of Quality Technology.
28, pp. 233-243.
[18] Wierda, S. J. 1994 ."Multivariate Statistical process
control," Wolters – Noordhoff , Groningen.