the big bang of 2014 - dent research
TRANSCRIPT

January 2014
The Big Bang of 2014Signals for the Biggest Collapse in 84 Years
Welcome to the precipice of the greatest market collapse since the Great Depression. Make no mistake about it: this is the eve of destruction, a giant bubble about to pop. And don’t listen to those idiot economists and politicians, who refuse to even admit we’re in a bubble. I’ve done the math and I’ve seen the signs.
Four of the most important economic cycles are coming together, like an unstoppable, interstellar disaster. Despite widespread denial, the trend is very clearly downward. I follow four cycles: the 39-year spending-wave cycle, the 36-year geopolitical cycle, the 30-year commodity cycle and the nine-to-13-year sunspot cycle. (See chart on the following page.)
I regard each of them as highly important economic indicators. These cyclical patterns have collided only once before in the last 100 years — during the zenith of the Great Depression, between 1930 and 1934.
Now, here we are again. This alone should be enough to convince anyone with half a brain that we’re in for a rough ride ahead. The latest confluence of these four cycles points directly to a major slowdown that will begin this year and will last through 2019.
What’s more, there are two specific danger periods that are most ripe for stock crashes and economic disrup-tions — 2014 into early 2015 and 2018 into late 2019. So, consider yourself warned!
The causes of this extended bubble-burst are plain to everyone. The problem is that those who are responsible for it are either un-able to recognize or they simply refuse to acknowledge it.
Albert Einstein once defined insanity as “doing the same thing over and over and expecting different results.” To me, Einstein’s quote is a better definition of stupidity. Either way, it applies per-fectly to the Fed’s monetary-stimulus policy — think QEI, QEII, QE Lite QEIII and QE Forever. OK, the Fed just sliced $10 bil-lion from the bond-buying program — but $75 billion a month is still enormous by anyone’s standards.
Have we seen any sign of a sustainable recovery other than an artificially over-inflated stock market? Sure, we’ve had modest, three-to-four-quarter improvements that follow every new stimu-
Inside This Issue:
Why This One is Different ............ Pg. 2
When the Bubble Pops................. Pg. 4
Portfolio Review ........................... Pg. 7
China and the Art Market ............ Pg. 11
Editors
Harry Dent and Rodney Johnson

2 Boom & Bust
lus program, before the economy flops back to zero growth again — back into its coma.
Four Primary CyclesFour Primary Cycles
1900 1930 1960 2000
9-13 Year Sun Spot Cycle
30-Year Commodity Cycle
36-Year Geopolical Cycle
39-Year Generation Cycle
2030
*The shaded area on the right denotes the downtrend ahead.
If the Fed wasn’t so busy trying to keep the bubble going, it might notice the disaster lurking just around the corner. In terms of the stock mar-ket, these downward-pointing “sell” signals are as strong as I've seen them outside of early 2000 and late 1929.
In this special January issue of Boom & Bust, I look ahead at the impact of the great bubble burst and Adam O’Dell, our investment analyst, looks back on just how well we’ve performed over the past year in preparation for the trouble brewing ahead.
Why This One is Different
The current bubble is different from others in his-tory because central banks around the world have fought to keep it from bursting. They almost always lower interest rates and run fiscal deficits. But this level of stimulus — with its massive monetary injec-tions — is unprecedented.
Despite denial from governments and economists, there is also a clear similarity with previous bubbles. With rare exceptions, bubbles last around five years. And that five-year line puts us in early March 2014 at the latest for a likely market peak.
Never before have we seen such coordinated and reckless stimulus from governments in so many countries around the world. At the same time,
we’re on the downslope of drastically slowing de-mographic trends, as the largest generation in his-tory — Baby Boomers — recedes from its spending peak. The end result is a government-fueled bubble that has already reached epic proportions. The last five years have been running on nothing but artifi-cial stimulus.
Just look at the S&P. Since the bottom of the last bubble bust in early 2009, the S&P 500 has gained 177% and it looks to be heading toward 185% be-fore it likely peaks just ahead.
During the previous five-year bubble, between October 2002 and October 2007, the bull market gained 100%. And economists still don’t see signs?
As our current bubble enters uncharted territory, the resulting bust could be as bad as the collapse that
Bubbles Throughout History • South Seas Bubble (1718−1722) In the
early 1700s, the first trading companies, led by the East India Trading Company, launched long-term sailing expeditions to the East Indies and allowed investors to share in the profits. By 1719, South Seas shares rose almost 800% in less than two years, but soon lost all but 6% of their value.
• Roaring ’20s (1921−1928) The Fed was created in 1913 to help flatten short-term interest rate cycles by setting and controlling interest rates. These actions created a com-pounding curve in debt and finance that, combined with the end of WWI, led to the Roaring ’20s. During the Great Depression that followed, some 32,000 companies went bankrupt and more than 5,000 banks failed.
• Tech Bubble (1997−2000) Driven by the Baby Boomer spending wave, technol-ogy stocks — often with little to back them up other than a dot.com in their name — soared to ridiculous heights. At the peak of the bubble, America’s 371 publicly traded Internet companies were collectively valued at $1.3 trillion. After peaking at 5,408, on March 10, 2000, the Nasdaq finally hit bot-tom at 1,100 in late 2002.

3Boom & Bust
spurred the Great Depression. Japan, which has arti-ficially stimulated its economy longer than the U.S., has seen its stock market fall 82%. At its low in early 2009, its real-estate market dropped over 60% with-out ever really bouncing back.
The hardest forecast is discerning when this bub-ble will burst. It is made even more difficult when governments manipulate economies. I have found the best approach is to look for valuations that sug-gest the market is nearing unsustainable levels and look for divergences that suggest the smart money is starting to exit, while the dumb money piles in full force.
That means looking at what are called technical indicators.
Signals That Warn of a Market Peak
These days, we have to be a bit skeptical of all major economic indicators in a market that has been more thoroughly manipulated by the Fed and cen-tral banks than at any time in history. No indicators work as well as they did in the past. For example, many leading indicators, which, prior to 2008, pro-vided six to nine months warning, now give two months warning at most.
Nonetheless, here are the key signals I’m eyeing, as I watch for the next market peak.
• MarginDebt—Now approaching the 2007 high of $430 million and rising fast, these readings have climbed during each market peak. I believe this one will top out some-where around $460 to $475 million a month or so from now.
• Stock Buybacks — Currently, 83% of S&P 500 companies are buying back their own stock. In 2007, it was 87%. So we’re almost at the peak level of the last bubble and likely to rise a bit higher.
• CorporateProfitasaPercentageofGDP — Driven by record-low short-term interest rates, the current level of 11% is already the highest ever, exceeding even the extreme 2000 bubble, and the 10% levels before that in 1950.
• P/ERatios— Most major stock peaks occur between a P/E ratio of 22 and 27, when you ad-just for cyclical patterns. Currently, we’re above 24 and moving higher. So the best assumption would be that this bubble will peak at the same cyclically adjusted P/E level we saw in 2007, around 27. Don’t listen to analysts that quote normal P/E ratios, because they are too vola-tile. This cyclically adjusted measure takes the inflation-adjusted average earnings over the last 10 years, not current earnings.
• Market Value of Non-Financial StocksDividedbyGDP— During major peaks, the ratio of market value of non-financial stocks divided by GDP tends to range between 0.3 and 1.5. We’re now at 1.3 and rising, likely heading towards 1.4. That’s a bubble if I’ve ever seen one.
• S&P Price-to-Revenue Valuation — The S&P price-to-revenue valuation model is ap-proaching the highs in 2000. The current level would suggest a range of negative 3% per year at worst, to 1% at best, over the next 10 years. This is similar to what investors saw after the 1929 peak. Not a pretty picture.
• Bullsvs.Bears — Bullish investment advisors are now at 60% vs Bearish advisors, who are at 14%. Such readings suggest the market could turn at any time.
• Theoretical Bubble Progression Model — The chart below is one of my favorites. It su-perimposes a logarithmic or natural theoretical bubble model on the S&P since 2010. This suggests a top in the S&P 500 around 1,900 or a bit higher, which would be consistent with

4 Boom & Bust
my peak targets for the Dow between 16,700 and 17,200 in the months ahead. How could you look at this chart and not be worried?
Bubble Progression Model vs. S&PBubble Progression Model vs. S&P
1000
1200
1400
1600
1800
2010 2011 2012 2013 2014
When the Bubble Pops Nine Major Forecasts
Imagine how absurd it will look in the hindsight of history, when future observers look back at all these signs and ask the question: Why didn't they see they were creating a bigger bubble that would burst again?
Central banks helped create the greatest bubble in modern history — and then decided the best policy was simply to keep the bubble going. If that isn’t insanity, I don’t know what is! But it has to end. And when it does, it won’t be pretty…
Forecast#1:
StockCrashWillBeginEarly2014
Since the market top of early 2000, each bubble has become increasingly inflated and each successive crash has been a bigger disaster. This phenomenon displayed is called a Megaphone Pattern, as shown in the following chart. Stocks had a similar pattern in a triple peak between 1965 and 1972, the last time a generation peaked in their spending. The 1973–1975 crash was the largest.
However, after the next crash, the rebound will not rise to test new highs as it did during previous booms. Indeed, the Dow is likely to fall as low as 5,000 over the next two to three years and then bounce to some-
thing like 10,000 into 2017. After that, it will likely see an ultimate bottom of 3,300 by 2020.
DOW Megaphone Pattern
1995 1999 2003 2007 2015
2000
4000
6000
8000
10000
12000
14000
16000
2011
DOW Megaphone Pattern
My research also suggests that corporate profits will tumble by 24% or more in the next four years. That, along with a drop in P/E levels to as low as 5, suggests a 65%-plus decline for stocks in the next few years and ultimately an 80% decline.
Forecast#2:
OilPricesWillHit$45by2016
Once oil breaks $80, the next stop is likely to be at least $45 between late 2014 and 2016.
What’s more, I see the price of crude dropping to between $10 and $20 per barrel between early 2020 and 2023. However, the first sign of weakness will be a drop below $80, which I expect by this summer.
This price fall will occur for two reasons:1. The world economy slows with falling demand; 2. Ongoing sanctions pressure on Iran forces a deal.
The last bubble that peaked saw home prices fall-ing years ahead. That is now happening with com-modities. This leading indicator is worth heeding.
Ultimately, I am looking for a massive real-estate bubble to burst in China that would cripple its econ-omy. That would be the biggest blow to oil and most other commodities — particularly gold, (as shown in the chart below). China is the second largest pur-chaser of that precious metal; India is first by a hair.

5Boom & Bust
Where Gold is Headed
450
1999 20162013201120092007200520032001
700
950
1200
1450
1700
1950
2200
200
Forecast#3:
GoldPricesContinuetoPlunge
After falling back to reality last year, gold is now trading more opposite to stocks than normal. That suggests we are nearing a top in stocks, and gold will run in the opposite direction. This is what hap-pened in 2007 to 2008. Gold is likely to fall back to $1,125–$1,150 early next year, as stocks rise and peak. It should then stage a final rally to around $1,400 to $1,430 by mid-2014, before collapsing dramatically again.
Historically, gold tends to rally in the anticipa-tion of a financial crisis, then collapse when debt deleveraging and deflation sets in. I would advise selling any remaining holdings of gold and silver on such a rally.
The next stop for gold by 2015 or 2016 is around $700. Ultimately, gold will likely bottom around $250 between 2020 and 2023.
Overall, commodities have peaked in the long-term and will not rebound again until around 2023 to 2024, when we could see the strongest commodity boom in modern history. This is when commodity-intensive emerging countries will drive most of the global growth.
Forecast#4:
BondYieldswillRiseThenTumble
Interest rates are likely to help trigger the next crash. Ten-year Treasury yields have been trading in
a predictable channel since 1989, with demograph-ic-driven trends of falling inflation.
These trends are projected to become deflationary in the years ahead, as the number of retirees exceeds new workers, and as the greatest debt and asset bub-ble in modern history deleverages and deflates. Bond yields bottomed in late 2012 at 1.38% and are now rising, as we forecast. If they top out around 3.7% by mid-2014, as I expect they will, a more deflationary economy will reduce yields to even lower levels, pos-sibly 1% by 2016.
That’s almost as low as a savings account!
Forecast#5:
RealEstateSetforaBiggerCrash
The word almost everywhere these days is that real estate has finally hit a mode of sustainable recovery. This is wishful thinking, at best.
As I have argued in several previous issues, real estate is rebounding because of speculation from institutional and individual investors — little more. Mortgage applications for purchases continue to be flat and mortgage rates are rising. I see home prices falling another 34% to 44% between now and 2016.
My advice: Sell now and ask questions later!
Forecast#6:
TheU.S.DollarWillKeepRising
The biggest surprise over the next few years will be a continuing rally in the U.S. dollar. Many traders doubt this, but an environment of debt deleveraging, global bubbles and crises will make the dollar the safe haven again, as it was during the late 2008 meltdown.
I see the U.S. dollar index, which measures the dollar against six key global currencies, rising even more than the 27% by which it increased in 2008. I see a potential for the U.S. dollar index to rise as much as 40% over the next couple of years.

6 Boom & Bust
U.S. Dollar Index
601980 1990 2000 2010 2015
80
100
120
140
160
U.S. Dollar Index 1980–2015
+40%
-58%
+62%
A bet on the U.S. dollar rising is undoubtedly the best way to hedge your portfolio, outside of being short stocks.
Forecast#7:
TheTaperWillStall
Well, the economists finally got something right as the largest number expected the taper to start in January. Some were expecting a taper as early as September, and Bernanke obliged them with a $10 billion January taper announced in December. The markets reacted favorably, because he also pledged to keep interest rates near zero even longer and to slow the taper if the economy shows signs of weakness.
My guess is that by April the economy will show those signs of weakness. The seven quarter recovery and collapse stimulus model I have developed supports a slowdown in the third quarter of 2014.
The Fed typically does not like to whipsaw on such policies. Once it starts tapering, it will expect to continue in that direction. But it will not be able to do so in a declining economy. I see tapering stall-ing by the second quarter as the economy grows weaker.
Forecast#8:
SouthernEuropetoFallFirst
In my opinion, the first indication of a global economic slowdown will come from increasing bad loans in Spain and Greece. That would suggest these
countries need bigger bailouts or have to consider leaving the euro zone.
Any shock from Europe would likely trigger the bursting of the biggest bubble in the world: Chinese real estate. This would be the kiss of death for central banks and would cause them to lose control over the economy.
Finally, continued increases in long-term bond and mortgage rates will crimp the real-estate recov-ery in the U.S. and trigger a larger slowdown.
Forecast#9:
MarketBubbleandMelt
Recent stock market patterns suggest we will not likely see a bigger correction of more than 7% ahead. This would be more normal before surging to a final top. Instead, expect a lot of smaller corrections as we continue to bubble and melt up.
Dow Channel
10,000
16,000
12,000
14,000
2011 2012 2013 2014
Any Dow correction to as low as 14,700 should be regarded as a short-term buying opportunity for aggressive investors. Nonetheless, that scenario looks less likely at this point. The previous chart shows a rising channel for the Dow and suggests the top will come around 16,700 to 16,800 by late January — or 17,000-plus if the rally lasts through March, or early May at the latest. I see late January as the most likely time for a top.
This is no time for a buy-and-hold strategy. The only strategy that works — other than holding all cash — is to sell stocks when they bubble up to new highs and buy again when they crash to new lows. You have to think like a long-term trader and watch

7Boom & Bust
the roller coaster ride from a safe position. This way, you can invest at the end of the major down cycles that are coming. I expect stocks to peak early in 2014 and to bottom in 2015 or 2016, and I expect a final bottom by early 2020.
How We Have Prepared
In spite of the coming disaster, we have posi-tioned ourselves extraordinarily well. The Boom & Bust model portfolio performed quite respectably this year. Adam O’Dell, our investment analyst, has helped us to make good gains in many sectors, tak-ing both long and short positions.
Portfolio ReviewOne for the History Books
U.S. equity markets in 2013 marched higher, gaining about 29% year-to-date, as of December 26. That’s the best annual gain since the S&P 500 gained 31% in 1997.
Commodities didn’t fare so well, though. Broadly, most commodity markets peaked in 2011, in sync with the 30-year Commodity Cycle we’ve discussed all year. Those markets failed to find a footing in 2013. The Commodity Research Bureau (CRB) commodity index lost 7%, while the copper and gold markets tanked, losing 10% and 31%, respectively.
A sharp rise in interest rates between May and September spurred big moves in fixed-income in-vestments and stocks that are particularly sensitive to interest rates.
The rate changes can largely be attributed to speculation that the Fed would taper bond purchases beginning in September. The Fed surprised many by not tapering in September. Instead, it will begin the long-awaited taper later this month, trimming monthly bond purchases by $10 billion a month, a reduction of 12%.
The Boom & Bust model portfolio performed quite well this year. We locked in profits on long stock positions… including Siemens (NYSE: SI), ABB (NYSE: ABB) and Agrium (NYSE: AGU).
The long stock positions we carried in from 2012 — and continue to hold — have strengthened. These holdings include Dow Chemical (NYSE: DOW), Brookfield Infrastructure Partners (NYSE: BIP), Omega Healthcare Investors (NYSE: OHI), Atlas Pipeline Partners (NYSE: APL) and Associated Estate Realty Group (NYSE: AEC).
We also added a long stock position in Thor Industries (NYSE: THO) this year. That stock is off to a strong start, gaining 33% since our May entry.
Betting against stocks, commodities and curren-cies worked out quite well for us, too.
Our short/bearish position on Southern Copper Corp. (NYSE: SCCO) has handed us open gains of 15% since we placed a bet against the struggling miner in May.
We’ve also made impressive open gains betting against the Japanese yen… and betting against China’s best crash-predictor, Sotheby’s (NYSE: BID).
Let’s dig in a bit deeper. Many of the significant trends of 2013 are likely to persist into 2014.
Betting on the Boomers
The Baby Boomer generation is unique. First, it’s huge — there will be 10,000 65th birthdays celebrated each and every day for the next 16 years. So based on sheer size, this generation has always enjoyed consid-erable sway, influencing political and consumer trends as they’ve moved through various life stages.
Harry’s research has shown that consumer spend-ing peaks around the age of 46, or 51 for the more affluent subset, so an aggregate slowdown in spend-ing threatens to be a drag on the U.S. economy as

8 Boom & Bust
Boomers age. But that doesn’t mean Boomers stop spending money; they just spend it in different places.
We covered this topic several times. In June, we hit the road with Baby Boomers who, as we said, are “changing the face of the Great American Road Trip.” Boomers have a penchant for freedom and travel. And while affluent Boomers fly abroad to get their fix for new sights, many aging Boomers are hit-ting U.S. roads in recreational vehicles (RVs).
This Baby Boomer driven trend is spurring in-creases in demand for RVs. And industry leader Thor Industries (NYSE: THO) has boomed!
Thor is the world’s largest manufacturer of rec-reation vehicles (RVs) and it has zero debt. As of January 1, 2013, there was $108 million in cash on its balance sheet. And the company has been profit-able every year since 1980. That’s a rock-solid 33-year track record if I’ve ever seen one! And if Thor isn’t the ideal image of a company that can weather any storm, I don’t know what is.
In fiscal 2012, the company booked an all-time sales record of $3.1 billion. This represented a solid 12% increase.
Now, unlike some companies, Thor doesn’t hoard the profits it has consistently generated over the past three decades. It rewards shareholders by paying regu-lar dividends since 1987. The company’s $0.18 per share quarterly dividend, which was recently increased by 20%, gives investors an annual yield of 1.8%.
Action toTake: BuyThor Industries (NYSE:THO)upto$55.
Home security is another Boomer-driven trend we hopped on this year. In October, I introduced you to Deb and Merle Balboni, two Boomers who looked to ADT (NYSE: ADT) to make their Plymouth, Massachusetts home safe and secure.
ADT, with its 6.5 million customers, is the largest
security company in North America. And with a vir-tual stranglehold on its 25% market share, it would be easy to assume that ADT has all but squeezed the last drop of juice from an already ripe piece of fruit. Yet nothing could be further from the truth.
Pulse is ADT’s home automation platform. And at just $50 per month, it’s also the first home automa-tion platform to hit the market at an affordable price.
For consumers, particularly Baby Boomers like Deb and Merle, that means a soup-to-nuts security and home automation system is now affordable to nearly all homeowners, not just the wealthiest.
For ADT and its investors, Pulse is the key to future growth and profitability. Pulse customers are worth 25% more in annual revenue than ADT’s tra-ditional customers, making them profit-margin fat-teners. The company’s margins are already showing a strengthening trend: net income margin is up 39%, from 9.2% to 12.8%, since 2010. And the best is yet to come.
At present, ADT’s stock is trading just over $41, af-ter finding solid support at $39 twice this year. I think the stock is easily worth $50 a share over the next 12 to 18 months, as ADT’s dealers boost sales of Pulse and drive profit margins even higher. Credit Suisse thinks the stock is worth even more, with a price target of $55.
These upside targets put potential gains of be-tween 21% and 33% within our sights. And that doesn’t even account for the 1.2% in annual yield we stand to collect from ADT’s quarterly dividend payments. A nice little security blanket, if you will.
ActiontoTake:BuyADTCorporation(NYSE:ADT)upto$44.
Taper Talk Trumps Everything
One trend the Boomers aren’t driving is inter-est rates. For that, we look to the unprecedented

9Boom & Bust
stimulus package being implemented by the Federal Reserve.
The stimulus itself isn’t anything new. It’s been going on since 2009, originally as a blood loss tactic in the aftermath of the great financial crisis.
Instead, the new game in town in 2013 was specu-lation over whether the Fed would or wouldn’t taper its $85 billion a month bond-buying program, as it began saying in May that it would do in September… but come September, the Fed backed down.
Clearly, “taper” was the word of the year.
Intent and speculation were enough to push in-terest rates higher from May to September and that naturally put downward pressure on bond prices, fixed-income funds, real estate investment trusts (REITs) and interest rate-sensitive stocks, like utili-ties and telecom companies.
Our Boom & Bust model portfolio holds two of these…
Omega Healthcare Investors (NYSE: OHI) and Associated Estate Realty Group (NYSE: AEC) are the two REITs we’ve held since May 2012 and June 2011, respectively.
These investments are great in that they provide a lucrative, steady flow of income to investors through quarterly payments. Yet, they’re also very sensitive to interest rate changes. When rates go higher, it be-comes more expensive for Omega and Associated to finance new property acquisitions: the lifeblood of their income streams. This makes REIT investors nervous. So when interest rates move higher, as they did this summer, REITs trade lower.
Both Omega Healthcare and Associated Estate succumbed to the pressure of rising rates, with their share prices falling 26% and 29%, respectively, from late May into early September. That’s a sharp drop, but likely just a short-term blip on the radar.
Since the beginning of 2013, Associated Estate is essentially flat and Omega Healthcare is holding on to a nice gain of 26%. Our open portfolio positions are still firmly in profit territory.
Omega Healthcare is up 58% from our original entry price and Associated Estate is up 10%.
These investments will continue to be pressured by further interest rate increases, but I think the worst of the spike is over. Much of the rapid rise in rates can be attributed to speculation and uncer-tainty surrounding the Fed’s taper plan.
Now that the Fed announced it will reduce stimulus by 12% ($10 billion) a month starting this month, the market knows what to expect. This should allow interest rates to move more freely on economic data, instead of Fed mouthpiece manipu-lation.
Action to Take: Buy Omega HealthcareInvestors(NYSE:OHI)upto$34.
Action toTake:BuyAssociatedEstateRealtyGroup(NYSE:AEC)upto$17.
Currency Wars
On the currency front, we’ve long been support-ers of the U.S. dollar. Post-2008 debt deleveraging and a safe haven tailwind have kept the dollar’s value firm. While our bullish position in the PowerShares DB USD Index Bullish ETF (NYSE: UUP) hasn’t gained much since late 2011, the Japanese yen made big moves in 2013.
And that trend put lots of greenbacks in our pockets.
The Abenomics-driven, yen-devaluation story is a beaten horse, so I won’t rehash it all here. But to sum-marize, the newly elected prime minister of Japan has had a laser-focus on pushing the yen’s value lower to increase the competitiveness of Japan’s exporters.
10 Boom & Bust
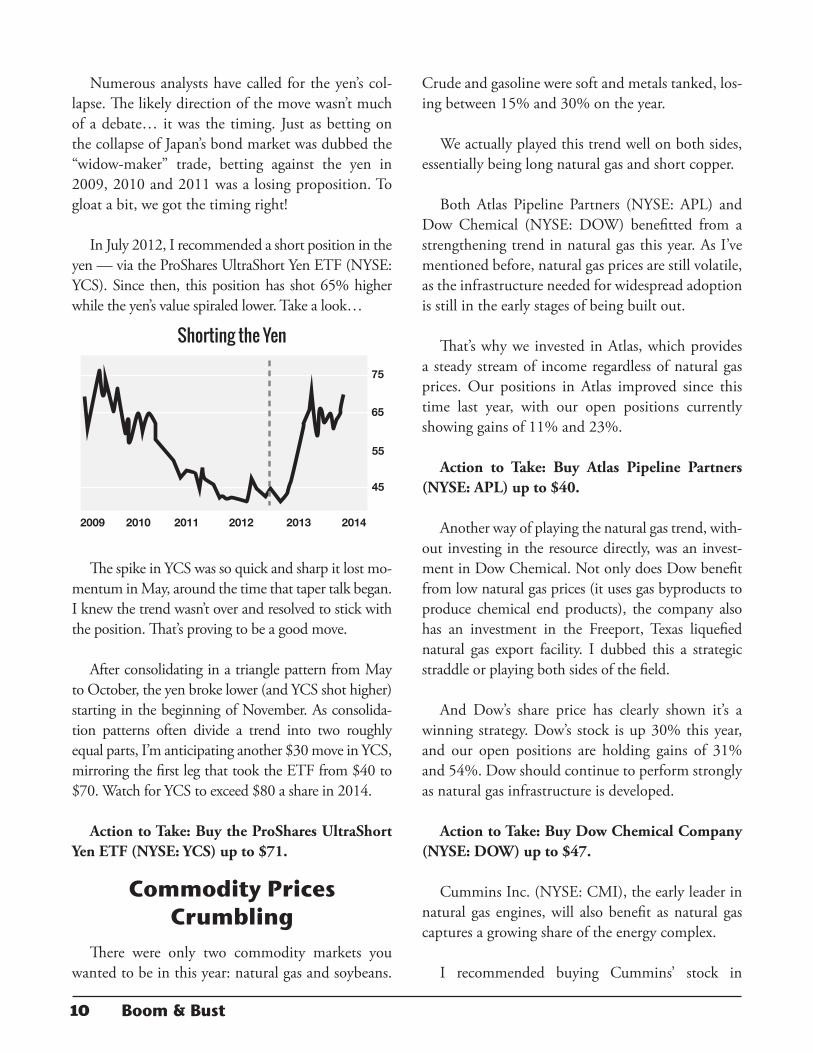
Numerous analysts have called for the yen’s col-lapse. The likely direction of the move wasn’t much of a debate… it was the timing. Just as betting on the collapse of Japan’s bond market was dubbed the “widow-maker” trade, betting against the yen in 2009, 2010 and 2011 was a losing proposition. To gloat a bit, we got the timing right!
In July 2012, I recommended a short position in the yen — via the ProShares UltraShort Yen ETF (NYSE: YCS). Since then, this position has shot 65% higher while the yen’s value spiraled lower. Take a look…
Shorting the Yen
45
75
55
65
2009 2011 20122010 2013 2014
Shorting the Yen2009–2013
The spike in YCS was so quick and sharp it lost mo-mentum in May, around the time that taper talk began. I knew the trend wasn’t over and resolved to stick with the position. That’s proving to be a good move.
After consolidating in a triangle pattern from May to October, the yen broke lower (and YCS shot higher) starting in the beginning of November. As consolida-tion patterns often divide a trend into two roughly equal parts, I’m anticipating another $30 move in YCS, mirroring the first leg that took the ETF from $40 to $70. Watch for YCS to exceed $80 a share in 2014.
ActiontoTake:BuytheProSharesUltraShortYenETF(NYSE:YCS)upto$71.
Commodity Prices Crumbling
There were only two commodity markets you wanted to be in this year: natural gas and soybeans.
Crude and gasoline were soft and metals tanked, los-ing between 15% and 30% on the year.
We actually played this trend well on both sides, essentially being long natural gas and short copper.
Both Atlas Pipeline Partners (NYSE: APL) and Dow Chemical (NYSE: DOW) benefitted from a strengthening trend in natural gas this year. As I’ve mentioned before, natural gas prices are still volatile, as the infrastructure needed for widespread adoption is still in the early stages of being built out.
That’s why we invested in Atlas, which provides a steady stream of income regardless of natural gas prices. Our positions in Atlas improved since this time last year, with our open positions currently showing gains of 11% and 23%.
Action to Take: Buy Atlas Pipeline Partners(NYSE:APL)upto$40.
Another way of playing the natural gas trend, with-out investing in the resource directly, was an invest-ment in Dow Chemical. Not only does Dow benefit from low natural gas prices (it uses gas byproducts to produce chemical end products), the company also has an investment in the Freeport, Texas liquefied natural gas export facility. I dubbed this a strategic straddle or playing both sides of the field.
And Dow’s share price has clearly shown it’s a winning strategy. Dow’s stock is up 30% this year, and our open positions are holding gains of 31% and 54%. Dow should continue to perform strongly as natural gas infrastructure is developed.
ActiontoTake:BuyDowChemicalCompany(NYSE:DOW)upto$47.
Cummins Inc. (NYSE: CMI), the early leader in natural gas engines, will also benefit as natural gas captures a growing share of the energy complex.
I recommended buying Cummins’ stock in

11Boom & Bust
How China Brings the Art Market to its Knees
And finally, there’s China…
China’s massive, state-run “build ’em then fill ’em” construction and urbanization plan seems to have overshot logical growth targets. If there’s a real-estate market sorely due for a crash, it’s China’s. And that crash will devastate the new money Chinese elite, who have been buying up properties — and ungodly expensive art — in recent years.
That sets Sotheby's, the 269-year-old auction house, up for a tragic fall. Yet, it shouldn’t come as a surprise. Sotheby’s stock has crashed after every single new-wealth bubble-turned-bust in the last 30 years. Take a look…
Sotheby's Stock Price Tracks PeaksSotheby Stock Price Tracks Peaks
0
$20
$40
$60
1989
Japan Inc. Bust
China Bust?
Dot Com Bust
U.S. Housing Bust
20142009200419991994
China’s real-estate market collapse seems inevi-table, but getting the timing right is the tricky part. That makes a pure short sell of Sotheby’s stock a difficult move. Instead, I’ve recommended buying a long-dated put option. This investment will pay off if Sotheby’s stock price is trading below $30 come January 2015.
As I’ve said, this is no sure bet, so consider only a small allocation to this trade idea. But the payout could be huge, potentially turning an investment of a couple hundred dollars into $2,000 or more.
Action to Take: Buy January 17, 2015,$30-strikeputoptionsonSotheby’s(NYSE:BID)upto$2.
Survive & Prosper on August 8 this year. Since then, Cummins’ shares are up 15%, but there’s more to come. My first profit target on this stock is $158 per share, and my second sits at $285 per share. But re-member, this is a long-term play. It will likely take several years for the natural-gas infrastructure market to gain full traction. But when it does… Cummins will be a clear beneficiary.
Natural gas is the positive side of the commodity story this year. Metals were the negative side. And if you followed the Boom & Bust portfolio into a short sell trade on Southern Copper Corp. (NYSE: SCCO), you’ve done quite well as the metal markets melted down.
While copper futures lost a little more than 10% this year, Southern Copper’s stock did even worse. That’s because, as I highlighted in May, Southern stacks up poorly to its peers.
When I picked apart Southern’s annual reports and quarterly earnings statements, I found plenty of chinks in its armor. Southern has the highest price-to-earnings (P/E) ratio among its peers. Its price-to-sales (P/S) and price-to-cash (P/C) ratios are also the highest of all copper miners I surveyed.
Southern’s price-to-book value (P/B) is higher than each of its peers. In fact, it’s 270% higher than Freeport-McMoRan’s and 825% higher than Sterlite, an Indian miner! Southern’s debt-to-equity ratio, a measure of its debt load, is also higher than any of its peers. It’s more than four-times worse than Freeport- McMoRan’s.
Beyond a comparative analysis of Southern ver-sus its peers, recent quarterly statements show the company is definitely not moving in the right direc-tion. Net sales are down, earnings are down and, of course, copper prices are down.
Action to Take: Buy Sell Short SouthernCopperCorp.(NYSE:SCCO)downto$26.

12 Boom & Bust
Boom & Bust is published 12 times per year for US$99/year by Dent Reserch, 55 N.E. 5th Avenue, Suite 200, Delray Beach, FL 33283, USA. For information about your mem-bership, contact Member Services at 888-272-1858 or fax 561-272-5427. Contact us at www.boomandbustinvestor.com/contact-us. All Rights Reserved.
Protected by copyright laws of the United States and international treaties. This Newsletter may only be used pursuant to the subscription agreement and any reproduc-tion, copying, or redistribution (electronic or otherwise, including on the worldwide web), in whole or in part, is strictly prohibited without the express written permission of Delray Publishing.
LEGAL NOTICE: This work is based on SEC filings, current events, interviews, corporate press releases and what we’ve learned as financial journalists. It may contain errors and you shouldn’t make any investment decision based solely on what you read here. It’s your money and your responsibility. The information herein is not intended to be personal legal or investment advice and may not be appropriate or applicable for all readers. If personal advice is needed, the services of a qualified legal, investment or tax professional should be sought. We expressly forbid our writers from having a financial interest in any security recommended to our readers. All of our employees and agents must wait 24 hours after on-line publication or 72 hours after the mailing of printed-only publication prior to following an initial recommendation.
NOTES: The Boom & Bust Portfolio is an equally-weighted strategy and does not include dealing charges to purchase or sell securities, if any. Taxes are not included in total return calculations. “Total Returns” includes gains from price appreciation, dividend payments, interest payments and stock splits. Securities listed on non-U.S. exchanges; total return also includes any change in the value of the underlying currency versus the U.S. dollar. For transparency’s sake, we want you to know that we have an advertising relationship with Swissmetal, Inc. and as such, we may receive fees if you choose to invest in their products. In addition, we receive a marketing fee based on our relationship with EverBank. Stop-losses: The Boom & Bust Portfolio maintains stop-losses on every stock, ETF and bond recommendation; stop-losses are not exercised for mutual funds unless otherwise noted. Sources for price data: Yahoo! Finance (finance.yahoo.com), Financial Times Portfolio Service (www.ft.com), TradeNet (www.trade-net.ch/EN), and websites maintained by securities issuers.
Senior Editor .......................................... Harry S. DentSenior Editor .......................................... Rodney Johnson Portfolio Manager .................................. Adam O’Dell
Publisher ................................................ Shannon SandsManaging Editor .................................... James WellsGraphic Design ...................................... Bruce Borich
Boom & Bust PortfolioInvestment Ticker Entry
AddedBuy
PriceCurrent Price
Stop Loss
Total Dividends
Total Returns Call
Boom Portfolio Vitamin Shoppe Inc. VSI/NYSE 11/25/13 $53.38 $52.59 30% - -1.48% Buy up to $57
The ADT Corp. ADT/NYSE 09/25/13 $41.95 $40.94 30% - -2.41% Buy up to $44
Thor Industries THO/NYSE 05/23/13 $41.10 $53.01 25% $1.64 32.97% Buy up to $55
Brookfield Infrastructure Partners BIP/NYSE 11/21/12 $33.98 $39.07 25% $2.10 21.14% Buy up to $41
The Dow Chemical Company DOW/NYSE 09/21/12 $30.26 $44.86 30% $1.60 53.54% Buy up to $42
The Dow Chemical Company (2nd Entry) DOW/NYSE 07/24/13 $34.37 $44.86 30% _ 31.45% Buy up to $42
Omega Healthcare Investors OHI/NYSE 05/24/12 $20.93 $30.42 30% $2.72 58.34% Buy up to $34
Omega Healthcare Investors (2nd Entry) OHI/NYSE 08/28/13 $28.59 $30.42 30% $0.48 8.08% Buy up to $34
Atlas Pipeline Partners LP APL/NYSE 04/02/12 $35.12 $34.83 30% $4.10 10.85% Buy up to $40
Atlas Pipeline Partners LP (2nd Entry) APL/NYSE 06/29/12 $31.18 $34.83 30% $1.71 23.06% Buy up to $40
PowerShares DB USD Index Bullish ETF UUP/NYSE 10/25/11 $21.51 $21.63 25% _ 0.56% Buy up to $23
Associated Estate Realty Group AEC/NYSE 06/20/11 $16.14 $15.89 25% $1.81 9.67% Buy up to $17
Bust Portfolio
Sotheby's (Jan. 17, 2015 $30 Puts) BID150117P00030000 10/25/13 $1.20 $1.59 - - 32.50% Buy up to $2.00
Southern Copper Corp SCCO/NYSE 05/01/13 $33.98 $27.64 30% - 14.93%Sell Short down
to $26
ProShares UltraShort Yen YCS/ARCX 07/27/12 $41.96 $70.15 15% _ 67.18% Buy up to $71
iShares MSCI Canada Index Fund EWC/NYSEArca 02/28/12 $29.10 $29.07 20% $0.59 -9.24% Sell Short down to $24
SPDR Barclays Capital High Yield Bond ETF JNK/NYSE 07/28/11 $40.25 $40.70 20% $0.00 -17.22% Sell Short down to $38