the big picture_follow the money
DESCRIPTION
The first course assignment, Group of follow the moneyTRANSCRIPT

Follow the Money GroupJingyuan Hu
Kari HavnevikGu!rún Lilja Jónsdóttir
Francisco Rodríguez Saa
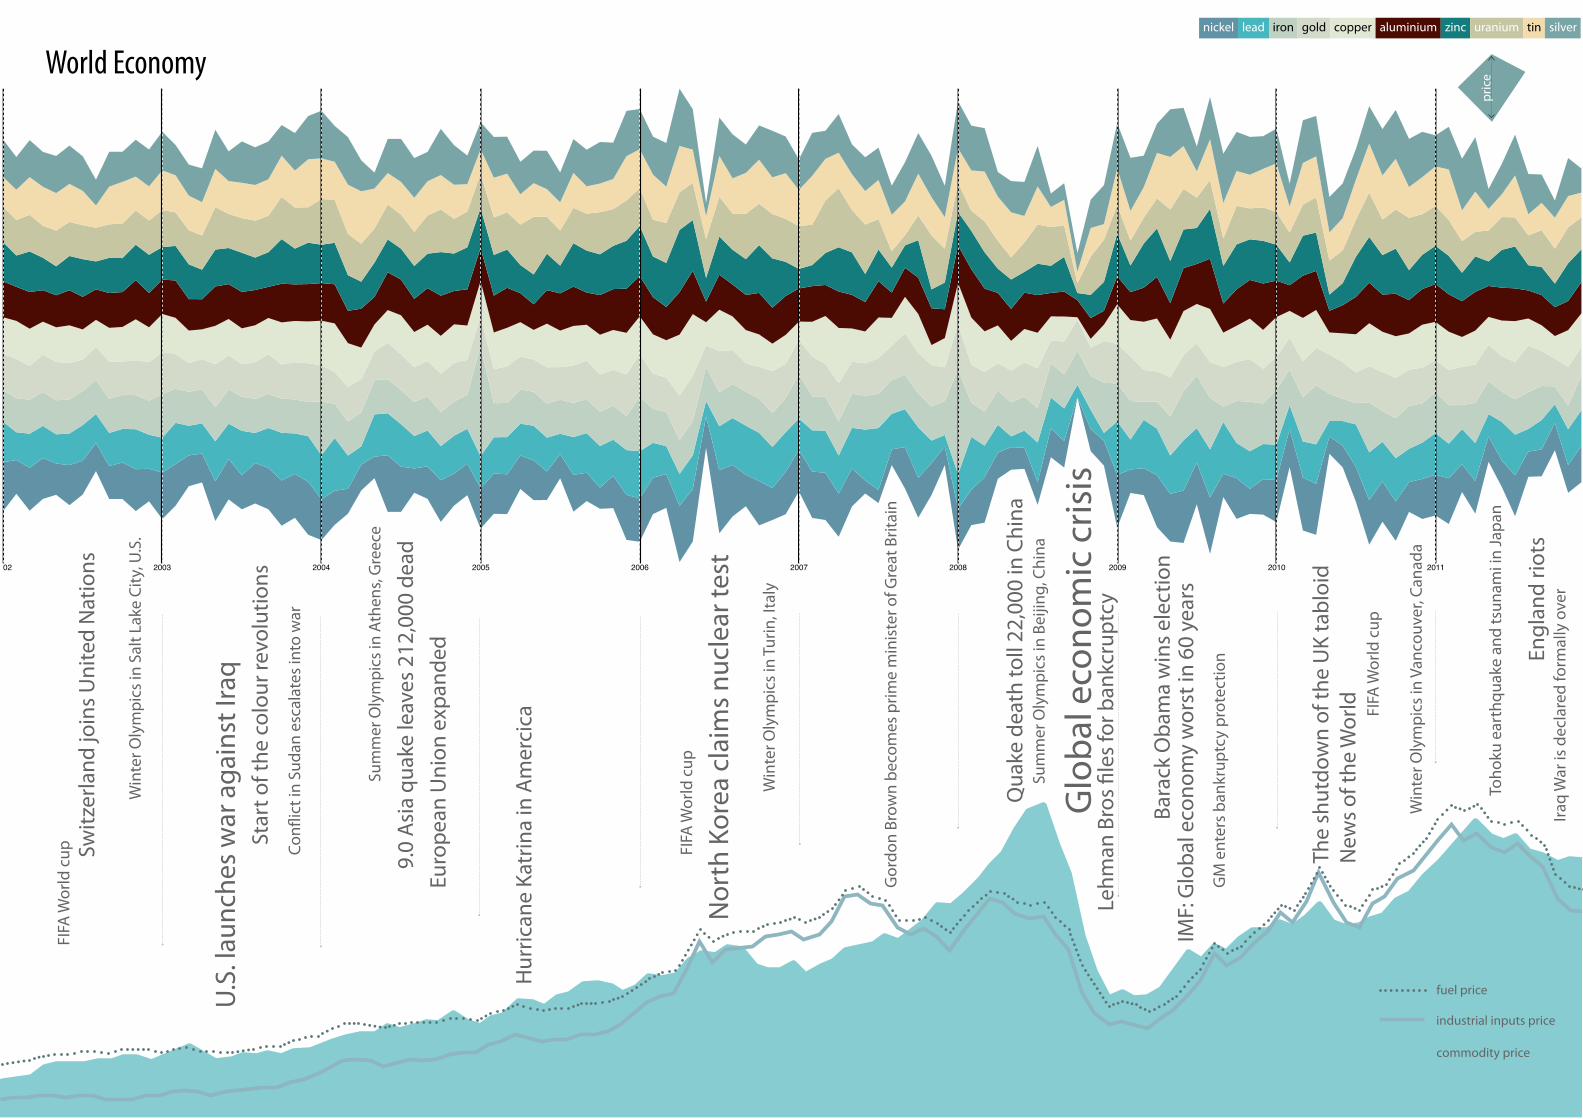
2/1/12 8:18 AMStreamgraph
Page 1 of 1file:///Users/amy/Dropbox/jj/commodity/stream.html
nickel lead iron gold copper aluminium zinc uranium tin silver
2002 2003 2004 2005 2006 2007 2008 2009 2010 2011
World Economy
Glo
bal e
cono
mic
cris
is
U.S.
laun
ches
war
aga
inst
Iraq
Nor
th K
orea
cla
ims n
ucle
ar te
st
Hur
rican
e Ka
trin
a in
Am
erci
ca
9.0
Asia
qua
ke le
aves
212
,000
dea
d
Switz
erla
nd jo
ins U
nite
d N
atio
ns
Win
ter O
lym
pics
in S
alt L
ake
City
, U.S
.
FIFA
Wor
ld c
up
Sum
mer
Oly
mpi
cs in
Ath
ens,
Gre
ece
Win
ter O
lym
pics
in Tu
rin, I
taly
Gor
don
Brow
n be
com
es p
rime
min
ister
of G
reat
Brit
ain
Sum
mer
Oly
mpi
cs in
Bei
jing,
Chi
na
Win
ter O
lym
pics
in V
anco
uver
, Can
ada
Star
t of t
he c
olou
r rev
olut
ions
Con!
ict i
n Su
dan
esca
late
s int
o w
ar
Euro
pean
Uni
on e
xpan
ded
Lehm
an B
ros "
les f
or b
ankc
rupt
cy
Qua
ke d
eath
toll
22,0
00 in
Chi
na
Bara
ck O
bam
a w
ins e
lect
ion
GM
ent
ers b
ankr
uptc
y pr
otec
tion
IMF:
Glo
bal e
cono
my
wor
st in
60
year
s
The
shut
dow
n of
the
UK
tabl
oid
New
s of t
he W
orld
Iraq
War
is d
ecla
red
form
ally
ove
rEn
glan
d rio
ts
Toho
ku e
arth
quak
e an
d ts
unam
i in
Japa
n
FIFA
Wor
ld c
up
FIFA
Wor
ld c
up
nickel lead iron gold copper aluminium zinc uranium tin silver
2002 2003 2004 2005 2006 2007
commodity price
industrial inputs price
fuel price
pric
e
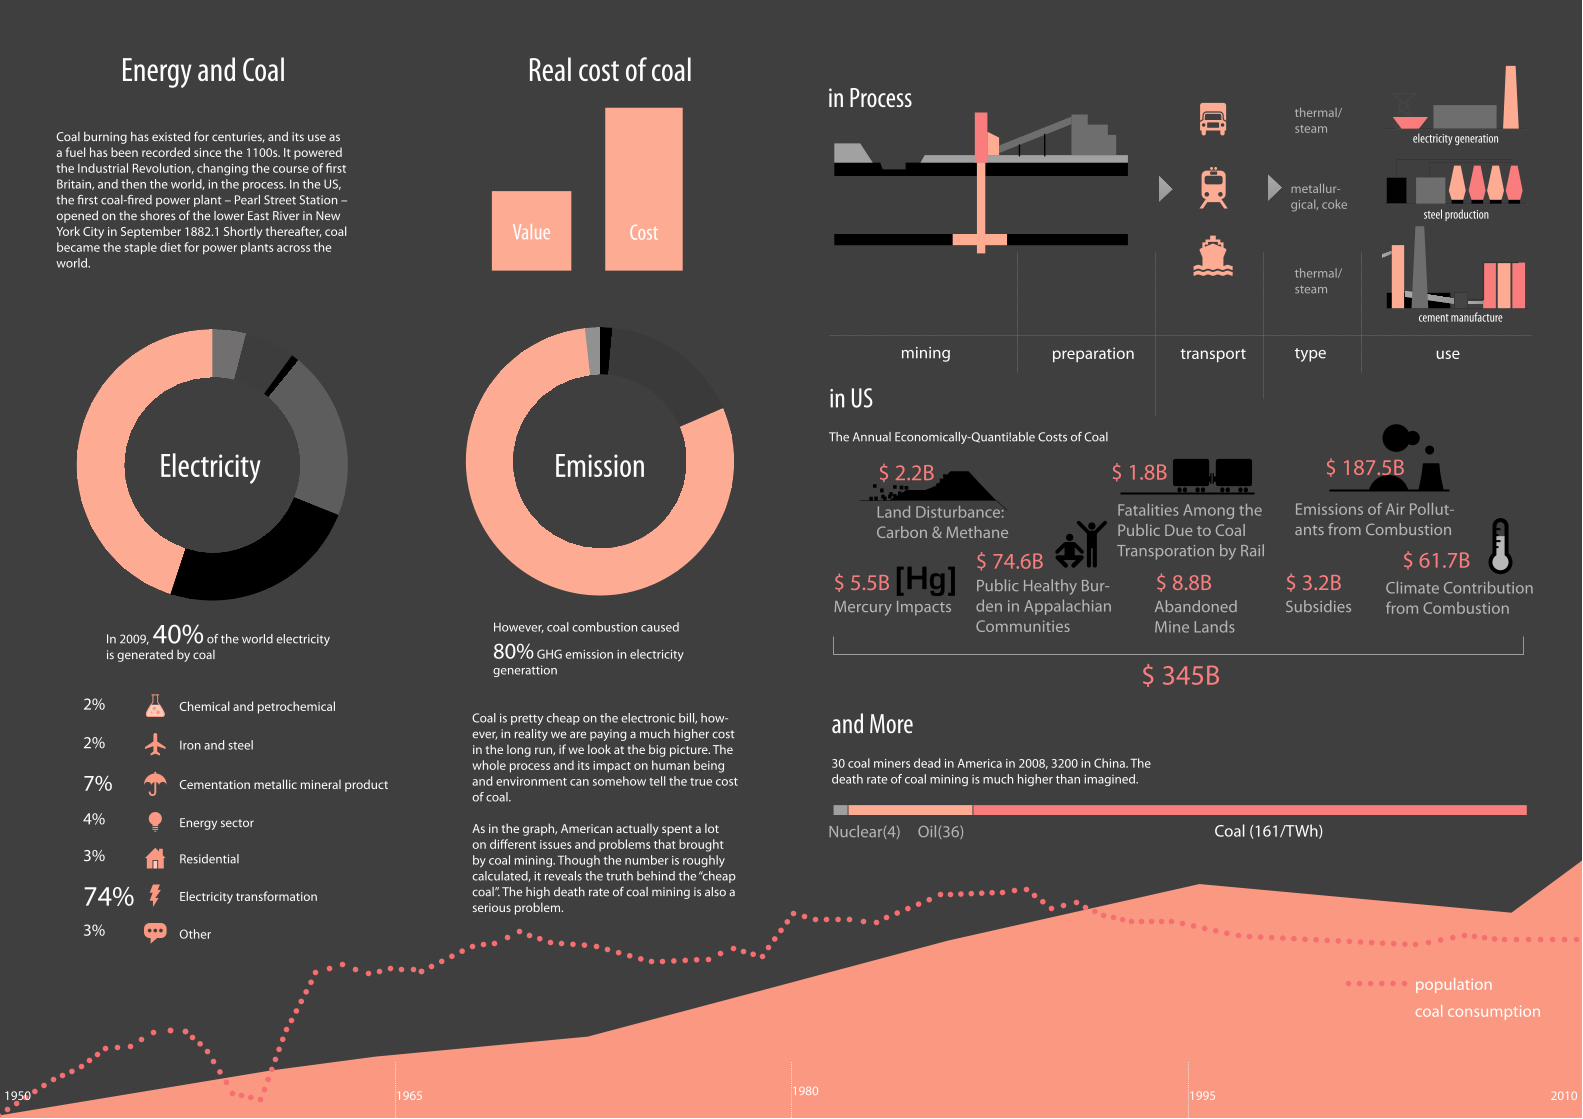
Chemical and petrochemical
Iron and steel
Cementation metallic mineral product
Energy sector
Residential
Electricity transformation
Other
2%
2%
7%4%
3%
74%3%
Energy and Coal Real cost of coal
Electricity Emission
Coal burning has existed for centuries, and its use as a fuel has been recorded since the 1100s. It powered the Industrial Revolution, changing the course of !rst Britain, and then the world, in the process. In the US, the !rst coal-!red power plant – Pearl Street Station – opened on the shores of the lower East River in New York City in September 1882.1 Shortly thereafter, coal became the staple diet for power plants across the world.
Coal is pretty cheap on the electronic bill, how-ever, in reality we are paying a much higher cost in the long run, if we look at the big picture. The whole process and its impact on human being and environment can somehow tell the true cost of coal.
As in the graph, American actually spent a lot on di"erent issues and problems that brought by coal mining. Though the number is roughly calculated, it reveals the truth behind the “cheap coal”. The high death rate of coal mining is also a serious problem.
In 2009, 40% of the world electricity is generated by coal
However, coal combustion caused
80% GHG emission in electricity generattion
30 coal miners dead in America in 2008, 3200 in China. The death rate of coal mining is much higher than imagined.
Value Cost
thermal/steam
mining preparation transport type use
electricity generation
steel production
cement manufacture
metallur-gical, coke
thermal/steam
in US
in Process
and More
$ 345B
Land Disturbance: Carbon & Methane
$ 2.2B $ 1.8B
$ 74.6B$ 8.8B $ 3.2B$ 5.5B
$ 61.7BPublic Healthy Bur-den in Appalachian Communities
Fatalities Among the Public Due to Coal Transporation by Rail
Emissions of Air Pollut-ants from Combustion
Mercury Impacts
Nuclear(4) Oil(36) Coal (161/TWh)
Climate Contribution from CombustionSubsidiesAbandoned
Mine Lands
[Hg]
$ 187.5BThe Annual Economically-Quanti!able Costs of Coal
coal consumption
population
2010199519801950 1965
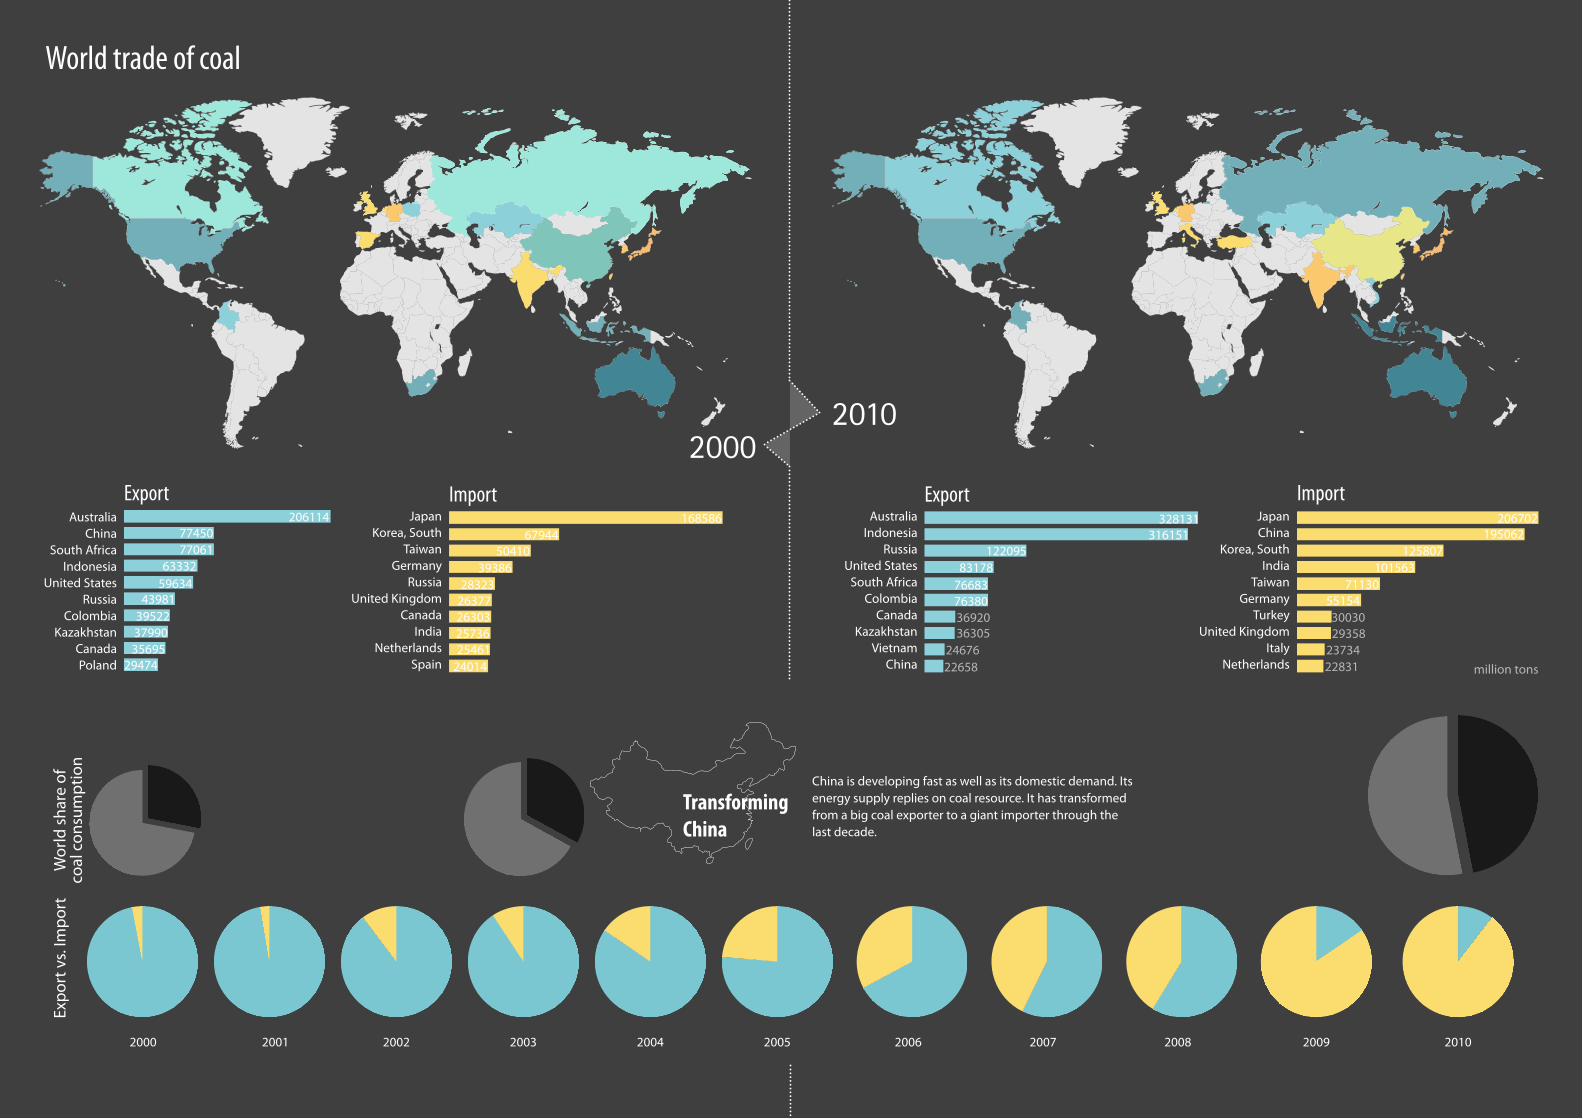
2010
ImportExportAustralia
IndonesiaRussia
United StatesSouth Africa
ColombiaCanada
KazakhstanVietnam
China
JapanChina
Korea, SouthIndia
TaiwanGermany
TurkeyUnited Kingdom
ItalyNetherlands
2000Export
Expo
rt v
s. Im
port
Wor
ld sh
are
of
coal
con
sum
ptio
n
Transforming China
AustraliaChina
South AfricaIndonesia
United StatesRussia
ColombiaKazakhstan
CanadaPoland
ImportJapan
Korea, SouthTaiwan
GermanyRussia
United KingdomCanada
IndiaNetherlands
Spain
China is developing fast as well as its domestic demand. Its energy supply replies on coal resource. It has transformed from a big coal exporter to a giant importer through the last decade.
2000 2003 20062001 2004 2007 20092002 2005 2008 2010
206114 168586 328131316151
12209583178
76683763803692036305
2467622658
7745077061
6333259634
43981395223799035695
29474
6794450410
3938628323
26377263032573625461
24014
206702195062
125807101563
71130551543003029358
2373422831 million tons
World trade of coal
Resource1. http://www.skepticalscience.com/true-cost-of-coal-power.html
2. http://www.coalcrusher.org/coal/coal-application.html
3. http://www.markenglehartevans.com/2011/05/state-grid-vs-beijing-a-familiar-game-of-chicken/
4. http://seekingalpha.com/article/238639-the-coal-situation-in-asia
5. http://www.worldcoal.org/
6. http://www.c2es.org/technology/overview/electricity
7. http://nextbigfuture.com/2011/03/deaths-per-twh-by-energy-source.html
8. http://www.sourcewatch.org/index.php?title=Coal_mining_disasters
9. http://www.mapreport.com/subtopics/i.html
10. http://en.wikipedia.org/wiki/21st_century#Economics_.26_Industry
11. Ming Coal, Mounting Costs: The life cycle consequences of coal (http://chge.med.har-vard.edu/programs/ccf/documents/MiningCoalMountingCosts.pdf )
12. The True Cost of Coal (http://www.greenpeace.org/international/Global/international/planet-2/report/2008/11/cost-of-coal.pdf )
13. BP Statistical Review of World Energy 2011 (http://www.bp.com/assets/bp_internet/globalbp/globalbp_uk_english/reports_and_publications/statistical_energy_re-view_2011/STAGING/local_assets/pdf/statistical_review_of_world_energy_full_re-port_2011.pdf)
14. http://www.indexmundi.com/
15. http://en.wikipedia.org/wiki/Coal
16. http://www.visualizing.org/
17. http://www.iea.org/index.asp
Iron Ore
Cast IronSub Part orSub- component
Assemblage
Cast IronAuto Part
Cast Iron Scrap +
1st. Shipping 2nd. Shipping 3rd. Shipping 4th. Shipping
From Coal - Metallurgical Coke is used as fuel
Pig Iron ingot
S&B Industrial Minerals S.A.Annual Report 2010
Pelletizingmachine
Iron OrePellets
BlastFurnace
Refractory Bricks& Monolithics
Otheringredients
Iron ore Ship Building
Automotive IndustryFoundry
Formed SteelPig Iron
ContinuousCasting
Reinforced Concrete
Iron Ore - Production2001 2010
South Africa
Mauritania
Brazil
Australia
0 50 100 150 200 250
China
Brazil
Australia
Russia
Other Countries
India
United States
Ukraine
Canada
South Africa
Sweden
Kazakhstan
Mauritania
Kazakshtan
Russia
China
India
USA
Canada
Ukraine
Sweden
Australia
South Africa
Mexico Mauritania
Venezuela
Brazil
India
0 200 400 600 800 1000 1200
China
Australia
Brazil
India
Russia
Ukraine
South Africa
United States
Other countries
Canada
Iran
Kazakhstan
Mexico
Venezuela
Mauritania
China
Russia
USA
Canada
Ukraine
Iran
Resource: nationmaster.com
Iron Ore Price
0
20
40
60
80
100
120
140
160
180
200
Dec 2
001 jun.02
Dec 2
002 jun.03
Dec 2
003 jun.04
Dec 2
004 jun.05
Dec 2
005 jun.06
Dec 2
006 jun.07
Dec 2
007 jun.08
Dec 2
008 jun.09
Dec 2
009 jun.10
Dec 2
010 jun.11
Dec 2
011
Series1
Over the last 40 years, iron ore prices have been decided in closed-door negotiations between the small handful of miners and steelmakers which dominate both spot and contract markets. Traditionally, the !rst deal reached between these two groups sets a benchmark to be
followed by the rest of the industry
This benchmark system has however in recent years begun to break down, with participants along both demand and supply chains calling for a shift to short term pricing. Given that most other commodities already have a mature market-based pricing system, it is natural for iron ore to follow suit. Although exchange-cleared iron ore swap contracts have developed over the past few years, to-date no exchange has established a proper futures market for the largely seaborne $88 billion a year iron ore
trade.[6]
To answer increasing market demands for more transparent pricing, a number of !nancial exchanges and/or clearing houses around the world have o"ered
iron ore swaps clearing.
The CME group, SGX (Singapore Exchange), London Clearing House (LCH.Clearnet),
NOS Group and ICEX (Indian Commodities Exchange)
all o"er cleared swaps based on The Steel Index's (TSI) iron ore transaction data.
The CME also o"ers a Platts based swap, in addition to their TSI swap clearing.
The ICE (Intercontinental Exchange) o"ers a Platts based swap clearing service also.
The swaps market has grown quickly, with liquidity clustering around TSI's pricing.
By April 2011, over US$5.5 billion dollars worth of iron ore swaps have been cleared basis TSI prices.
Iron ore is the source of primary iron for the world's iron and steel industries. It is therefore essential for the production of steel, which in turn is essential to maintain a strong industrial base. Almost all (98%) iron ore is used in steelmaking. Iron ore is mined in about 50 countries. The seven largest of these producing countries account for about three-quarters of total world production. Australia and Brazil together dominate the world's iron ore exports, each having about one-third of total exports.
In 2009, China imported almost two-thirds of the world’s total iron ore exports and produced about 60% of the world’s pig iron. Since international iron ore trade and production of iron ore and pig iron are key indicators of iron ore consumption, this demonstrates that iron ore consumption in China is the primary factor upon which the expansion of the international iron ore industry depends.
US Geological Survey2011 Annual ReportIron Ore Worldwide
Iron Ore - Market2010 2010
ExportsIron Ore - Supplying Countries from the ore (before sub-parts or sub-components are made)
ImportsIron Ore - Demanding Countries (Consumers) - Importers
South Africa
M
Ch
Pe
Ve
Brazil
New Z.
Ar
Br
0 5 10 15 20 25 30 35
Brazil
Australia
India
Canada
Sweden
South AĮrca
Ukraine
United States
Bahrain
Kazakhstan
Chile
Peru
Venezuela
Philiphines
Mexico
Norway
New Zeland
Albania
0 5 10 15 20 25 30 35 40
China
Japan
Germany
France
Italy
United States
Belgium
Czech Republic
Austria
Poland
Canada
Netherlands
Romania
ArgenƟna
Turkey
Oman
Slovakia
Spain
Finland
Malaysia
Ukraine
Phillipines
Malasya
Finland
Slovakia
Turkey
Oman
China
China
Romania
N PA
Czech R
Al
Bahrain
Australia
India
Canada
SwedenNorway
US
Resource: US Geogolical Survey >usgs.gov Annual Report 2010 of S&B Industrial Minerals
“Many nations impose royalty tax, but some nations -as diverse as Chile, Greenland, Mexico, Sweden, and Zimbabwe- do not. In most nations that impose royalty tax, policy nakers are interested in determining whether the level of royalty and its computational method are competitive and e!cient.”
Mining Royalties A Global Study of Their Impact on Investors, Government, and Civil Society.
Mining Royalties & Mining Taxation2006
Europe
Sw, Gr
SwedenGreenland
1 - 6 %
5 %
3 - 4 %
0 - 3 %
0,2 - 3 %
0 - 3 %
South America
Ch, M
Ar
Pe
Ve
Br
Dom. R.
Bo
BoliviaDominican RepublicVenezuelaArgentinaBrazilPeruChileMexico
3-12 %
3-10 %
5-10 %
Variable0-5%
2%
0%
GhanaMozambiqueBotswanaNamibiaSouth AfricaTanzaniaZambiaZimbabwe
Africa
SA - V
B
N
Ta
Zi
Za
G M 0.4-20 %
2.5-7.5%
1- 4 %
1-7.5%
2%
0%
Unit Based
IndiaMongoliaChinaMyanmarPapua New GuineaPhilippinesIndonesia
Asian & Paci"c Countries
Ch
Indo.
Mon
Mya
N. Gui, Phi
India
Northern TerritoriesNew South WalesWestern AustraliaQueensland
18 %
4 - 7 %
2.5-7.5%
2.7 %
Australia
N. S. Wales
North. Territ.
Queensland
W. Aus.
M Dom. R.
Ont.
NW. Territ.
Bri. Colum. Saskatch.
B
SA - V
N
Ta
Zi
Za
G
Ch Ar
Pe
Ve
Br
Bo MNorth.Territ.
Queensl.W. Aus.
Indo
Phi
N. Gui
Mon
MyaIndia
ChAR
MINV
Northwest TerritoriesBritish ColumbiaOntarioMichiganNevadaSaskatchewanArizona
North America
5 - 14 %
13% of Net R.2% of Net P.
10 %
2 - 7 %
2 - 5 %
5 % of Net P.
2% AR
Saskatch.
Bri. Colum.
NW. Territ
MI
NV
Ont.
Resource: Mining Royalties_A Global Study of Their Impact on Investors, Government, and Civil Society
EU 27 China Japan South Korea India Russia Ukraine USA Canada Brazil
Impo
rt a
nd E
xpor
t of S
teel
bet
wee
n 19
99-2
006
show
n in
%
Impo
rt
Exp
Ϭ�
ϭϬϬ�
ϮϬϬ�
ϯϬϬ�
ϰϬϬ�
ϱϬϬ�
ϲϬϬ�
ϭϵϵϴ� ϮϬϬϮ� ϮϬϬϲ� ϮϬϬϴ�Ϭ�
ϭϬϬ�
ϮϬϬ�
ϯϬϬ�
ϰϬϬ�
ϱϬϬ�
ϲϬϬ�
ϭϵϵϴ� ϮϬϬϮ� ϮϬϬϲ
Ϭ�
ϭϬϬ�
ϮϬϬ�
ϯϬϬ�
ϰϬϬ�
ϱϬϬ�
ϲϬϬ�
ϭϵϵϴ� ϮϬϬϮ� ϮϬϬϲ� ϮϬϬϴ
Ϭ�
ϭϬϬ�
ϮϬϬ�
ϯϬϬ�
ϰϬϬ�
ϱϬϬ�
ϲϬϬ�
ϭϵϵϴ� ϮϬϬϮ� ϮϬϬϲ� ϮϬϬϴ�
��
��
��
��
��
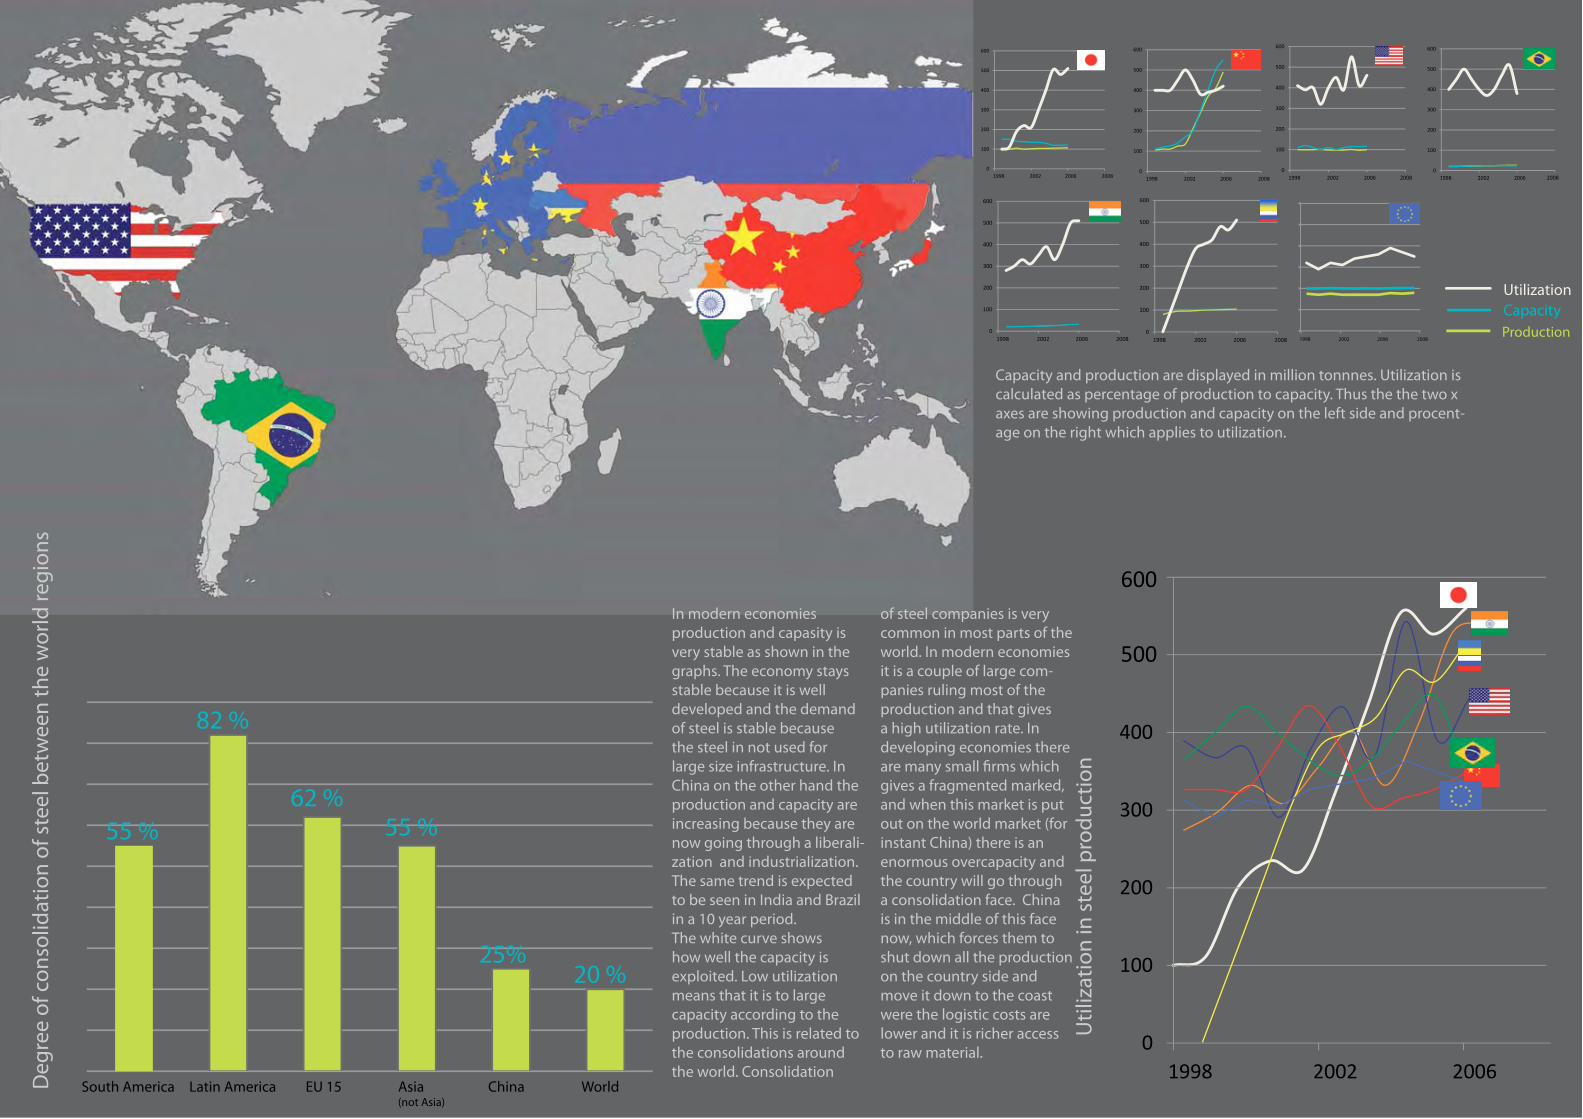
55 %
82 %
62 %55 %
25%20 %
WorldChinaAsia(not Asia)
EU 15Latin AmericaSouth America
UtilizationCapacityProduction
Deg
ree
of c
onso
lidat
ion
of st
eel b
etw
een
the
wor
ld re
gion
s
Util
izat
ion
in st
eel p
rodu
ctio
n
Ϭ�
ϭϬϬ�
ϮϬϬ�
ϯϬϬ�
ϰϬϬ�
ϱϬϬ�
ϲϬϬ�
ϭϵϵϴ� ϮϬϬϮ� ϮϬϬϲ� ϮϬϬϴ�
Ϭ�
ϭϬϬ�
ϮϬϬ�
ϯϬϬ�
ϰϬϬ�
ϱϬϬ�
ϲϬϬ�
ϭϵϵϴ� ϮϬϬϮ� ϮϬϬϲ�
�
�
�
�
� � � � � �1998 2002 2006 2008
20082008
Ϭ�
ϭϬϬ�
ϮϬϬ�
ϯϬϬ�
ϰϬϬ�
ϱϬϬ�
ϲϬϬ�
ϭϵϵϴ� ϮϬϬϮ� ϮϬϬϲ�
Capacity and production are displayed in million tonnnes. Utilization is calculated as percentage of production to capacity. Thus the the two x axes are showing production and capacity on the left side and procent-age on the right which applies to utilization.
In modern economies production and capasity is very stable as shown in the graphs. The economy stays stable because it is well developed and the demand of steel is stable because the steel in not used for large size infrastructure. In China on the other hand the production and capacity are increasing because they are now going through a liberali-zation and industrialization. The same trend is expected to be seen in India and Brazil in a 10 year period. The white curve shows how well the capacity is exploited. Low utilization means that it is to large capacity according to the production. This is related to the consolidations around the world. Consolidation
of steel companies is very common in most parts of the world. In modern economies it is a couple of large com-panies ruling most of the production and that gives a high utilization rate. In developing economies there are many small ! rms which gives a fragmented marked, and when this market is put out on the world market (for instant China) there is an enormous overcapacity and the country will go through a consolidation face. China is in the middle of this face now, which forces them to shut down all the production on the country side and move it down to the coast were the logistic costs are lower and it is richer access to raw material.
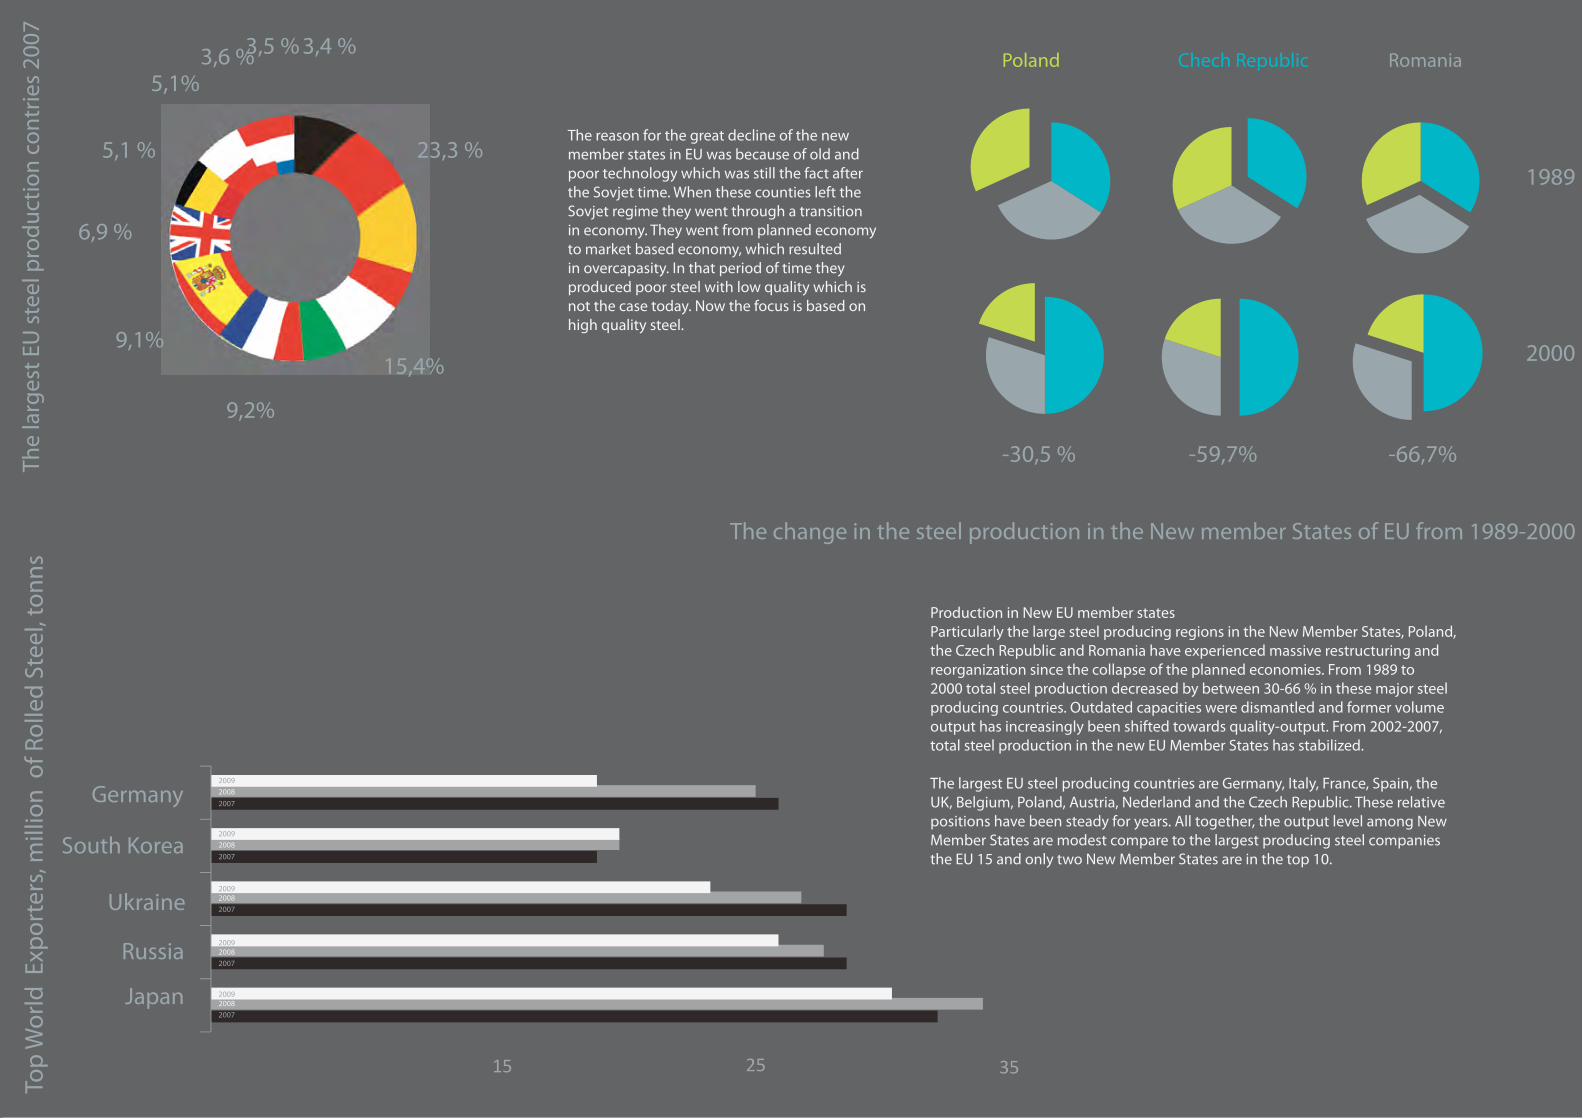
Ϯϱ ϯϱ
Top
Wor
ld E
xpor
ters
, mill
ion
of R
olle
d St
eel,
tonn
s
The change in the steel production in the New member States of EU from 1989-2000
The
larg
est E
U st
eel p
rodu
ctio
n co
ntrie
s 200
7
2007
2007
20092008
ϭϱ
23,3 %
15,4%
9,2%
9,1%
6,9 %
5,1 %
5,1%3,6 %3,5 % 3,4 %
Poland Chech Republic Romania
1989
2000
-30,5 % -59,7% -66,7%
Germany
South Korea
Ukraine
Russia
Japan
20092008
2007
20092008
2007
20092008
2007
20092008
Production in New EU member statesParticularly the large steel producing regions in the New Member States, Poland, the Czech Republic and Romania have experienced massive restructuring and reorganization since the collapse of the planned economies. From 1989 to 2000 total steel production decreased by between 30-66 % in these major steel producing countries. Outdated capacities were dismantled and former volume output has increasingly been shifted towards quality-output. From 2002-2007, total steel production in the new EU Member States has stabilized.
The largest EU steel producing countries are Germany, Italy, France, Spain, the UK, Belgium, Poland, Austria, Nederland and the Czech Republic. These relative positions have been steady for years. All together, the output level among New Member States are modest compare to the largest producing steel companies the EU 15 and only two New Member States are in the top 10.
The reason for the great decline of the new member states in EU was because of old and poor technology which was still the fact after the Sovjet time. When these counties left the Sovjet regime they went through a transition in economy. They went from planned economy to market based economy, which resulted in overcapasity. In that period of time they produced poor steel with low quality which is not the case today. Now the focus is based on high quality steel.
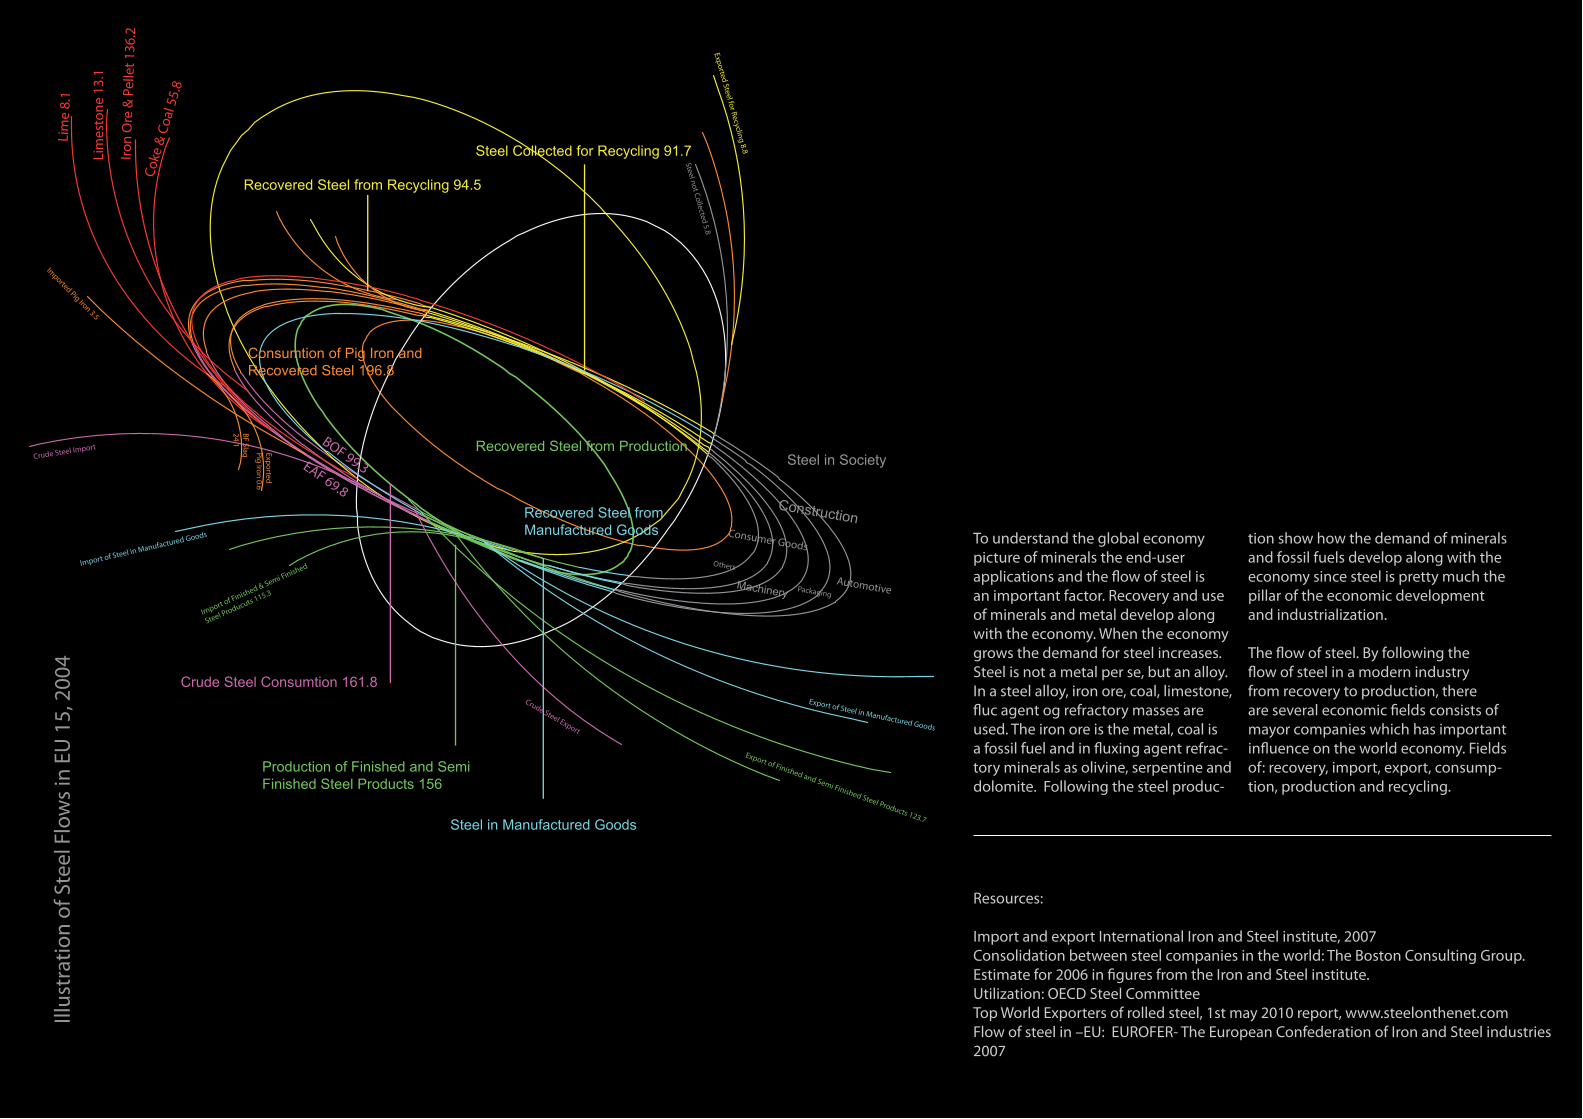
Machinery
Construction
Production of Finished and Semi Finished Steel Products 156
Crude Steel Consumtion 161.8
Steel Collected for Recycling 91.7
Recovered Steel from Recycling 94.5
Steel in Manufactured Goods
Consumtion of Pig Iron and Recovered Steel 196.8
Recovered Steel from Production
Recovered Steel from Manufactured Goods
Steel in Society
Coke
& C
oal 5
5.8
Lim
e 8.
1
Lim
esto
ne 1
3.1
Iron
Ore
& P
elle
t 136
.2
Imported Pig Iron 3.5
Exported Pig Iron 0.6
BF Slag 24.1
Crude Steel ImportBOF 99.3EAF 69.8
Import of Finished & Semi Finished
Steel Producuts 115.3
Import of Steel in Manufactured Goods
Crude Steel Export
Export of Finished and Semi Finished Steel Products 123.7
Export of Steel in Manufactured Goods
Packaging
Others
Automotive
Consumer Goods
Steel not Collected 5.8Exported Steel for Recycling 8.8
Illus
trat
ion
of S
teel
Flo
ws i
n EU
15,
200
4
To understand the global economy picture of minerals the end-user applications and the ! ow of steel is an important factor. Recovery and use of minerals and metal develop along with the economy. When the economy grows the demand for steel increases. Steel is not a metal per se, but an alloy. In a steel alloy, iron ore, coal, limestone, ! uc agent og refractory masses are used. The iron ore is the metal, coal is a fossil fuel and in ! uxing agent refrac-tory minerals as olivine, serpentine and dolomite. Following the steel produc-
tion show how the demand of minerals and fossil fuels develop along with the economy since steel is pretty much the pillar of the economic development and industrialization.
The ! ow of steel. By following the ! ow of steel in a modern industry from recovery to production, there are several economic " elds consists of mayor companies which has important in! uence on the world economy. Fields of: recovery, import, export, consump-tion, production and recycling.
Resources:
Import and export International Iron and Steel institute, 2007Consolidation between steel companies in the world: The Boston Consulting Group. Estimate for 2006 in " gures from the Iron and Steel institute. Utilization: OECD Steel CommitteeTop World Exporters of rolled steel, 1st may 2010 report, www.steelonthenet.comFlow of steel in –EU: EUROFER- The European Confederation of Iron and Steel industries 2007
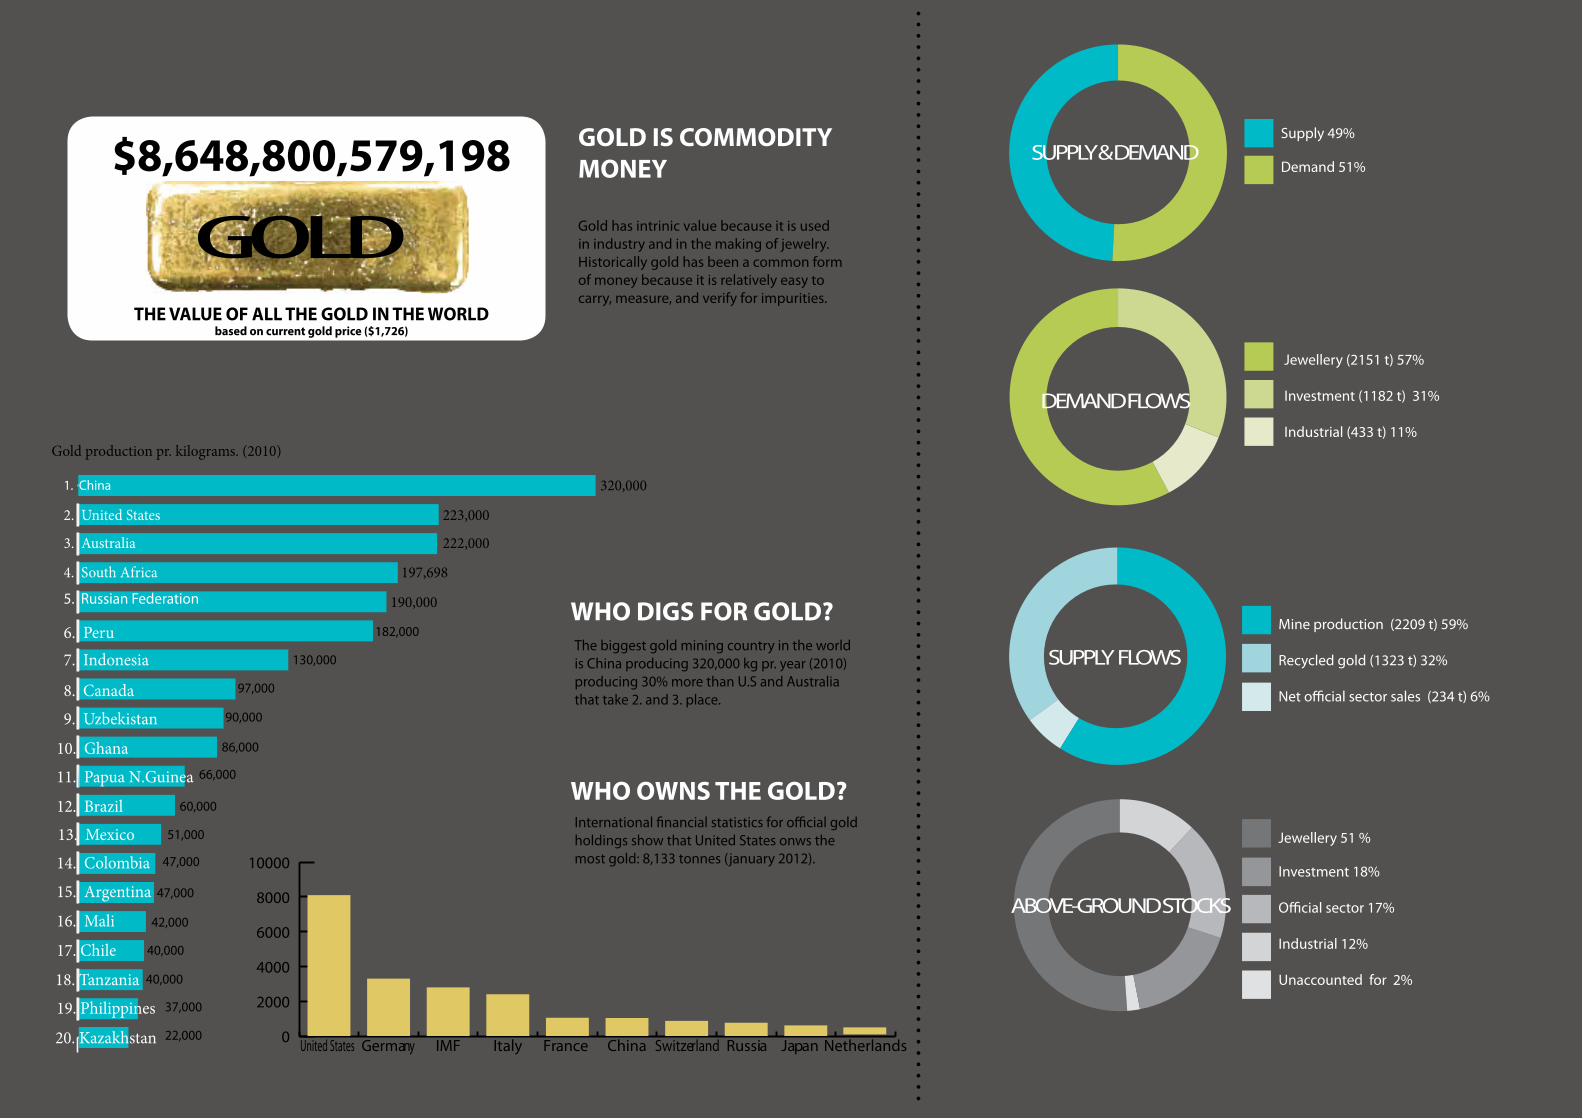
SUPPLY AND DEMAND
Gold demand in the third quarter of 2011 reached 1,053.9 tonnes, an increase of 6% compared to the same period last year. This equates to US$57.7bn, an all-time high in value terms. Demand growth was driven by investment de-mand, which rose by 33% year-on-year to 468.1 tonnes, generating a record quarterly value of US$25.6bn.
Investment demand in Europe reached a record quarterly value of !4.6bn, equating to 118.1 tonnes - a year-on-year increase of 135%. The increase in overall investment demand was all the more impressive given the sharp gold price correction in September, which encouraged a wave of pro"t taking among bar and coin investors. Virtually all markets saw strong double-digit growth in demand for gold bars and coins. Chinese jewellery demand was 13% higher year-on-year at 131.0 tonnes, equivalent to RMB46.0bn. The bulk of this increase was seen in smaller cities as retail chains expanded their networks to meet increasing demand fuelled by rising income levels. China’s growing appetite for gold as a means of investment saw demand for gold bars and coins expand by 24% from year earlier levels to 60.2 tonnes. Jewellery demand in India was sluggish during the seasonally slow months of July and August, compounded by high in#ation and greater volatility in the local gold price. Buying has since recovered slightly with the onset of the fes-tive and wedding season. Overall, Indian jewellery demand in Q3 saw a 26% decline in tonnage, when compared to the same quarter in 2010, to 125.3 tonnes, however yearly demand to the end of September is very close to the record levels seen in 2010.
1. China
3. Australia
2. United States
4. South Africa5. Russian Federation
6. Peru7. Indonesia
8. Canada9. Uzbekistan
10. Ghana11. Papua N.Guinea12. Brazil13. Mexico14. Colombia15. Argentina16. Mali17. Chile18. Tanzania19. Philippines
223,000
222,000
197,698
190,000
182,000
20. Kazakhstan
130,000
97,000
90,000
86,000
66,000
60,000
51,000
47,000
47,000
42,000
40,000
40,000
37,000
22,000
The biggest gold mining country in the world is China producing 320,000 kg pr. year (2010)producing 30% more than U.S and Australia that take 2. and 3. place.
$8,648,800,579,198
THE VALUE OF ALL THE GOLD IN THE WORLD based on current gold price ($1,726)
GOLD
SUPPLY & DEMANDSupply 49%
Demand 51%
DEMAND FLOWS
Jewellery (2151 t) 57%
Investment (1182 t) 31%
Industrial (433 t) 11%
SUPPLY FLOWS
ABOVE-GROUND STOCKS
Mine production (2209 t) 59%
Recycled gold (1323 t) 32%
Net o$cial sector sales (234 t) 6%
Jewellery 51 %
Investment 18%
O$cial sector 17%
Industrial 12%
Unaccounted for 2%
0
2000
4000
6000
8000
10000
NetherlandsJapan RussiaSwitzerlandChinaFrance ItalyIMFGermanyUnited States
International "nancial statistics for o$cial gold holdings show that United States onws the most gold: 8,133 tonnes (january 2012).
GOLD IS COMMODITY MONEY
Gold has intrinic value because it is used in industry and in the making of jewelry. Historically gold has been a common form of money because it is relatively easy to carry, measure, and verify for impurities.
WHO OWNS THE GOLD?
320,000
Gold production pr. kilograms. (2010)
WHO DIGS FOR GOLD?
W
0
100
200
300
400
500
2000 2001 2002 2003 2004 2005 2006 2007 2008 2009 2010
(Total cash cost US$/oz)
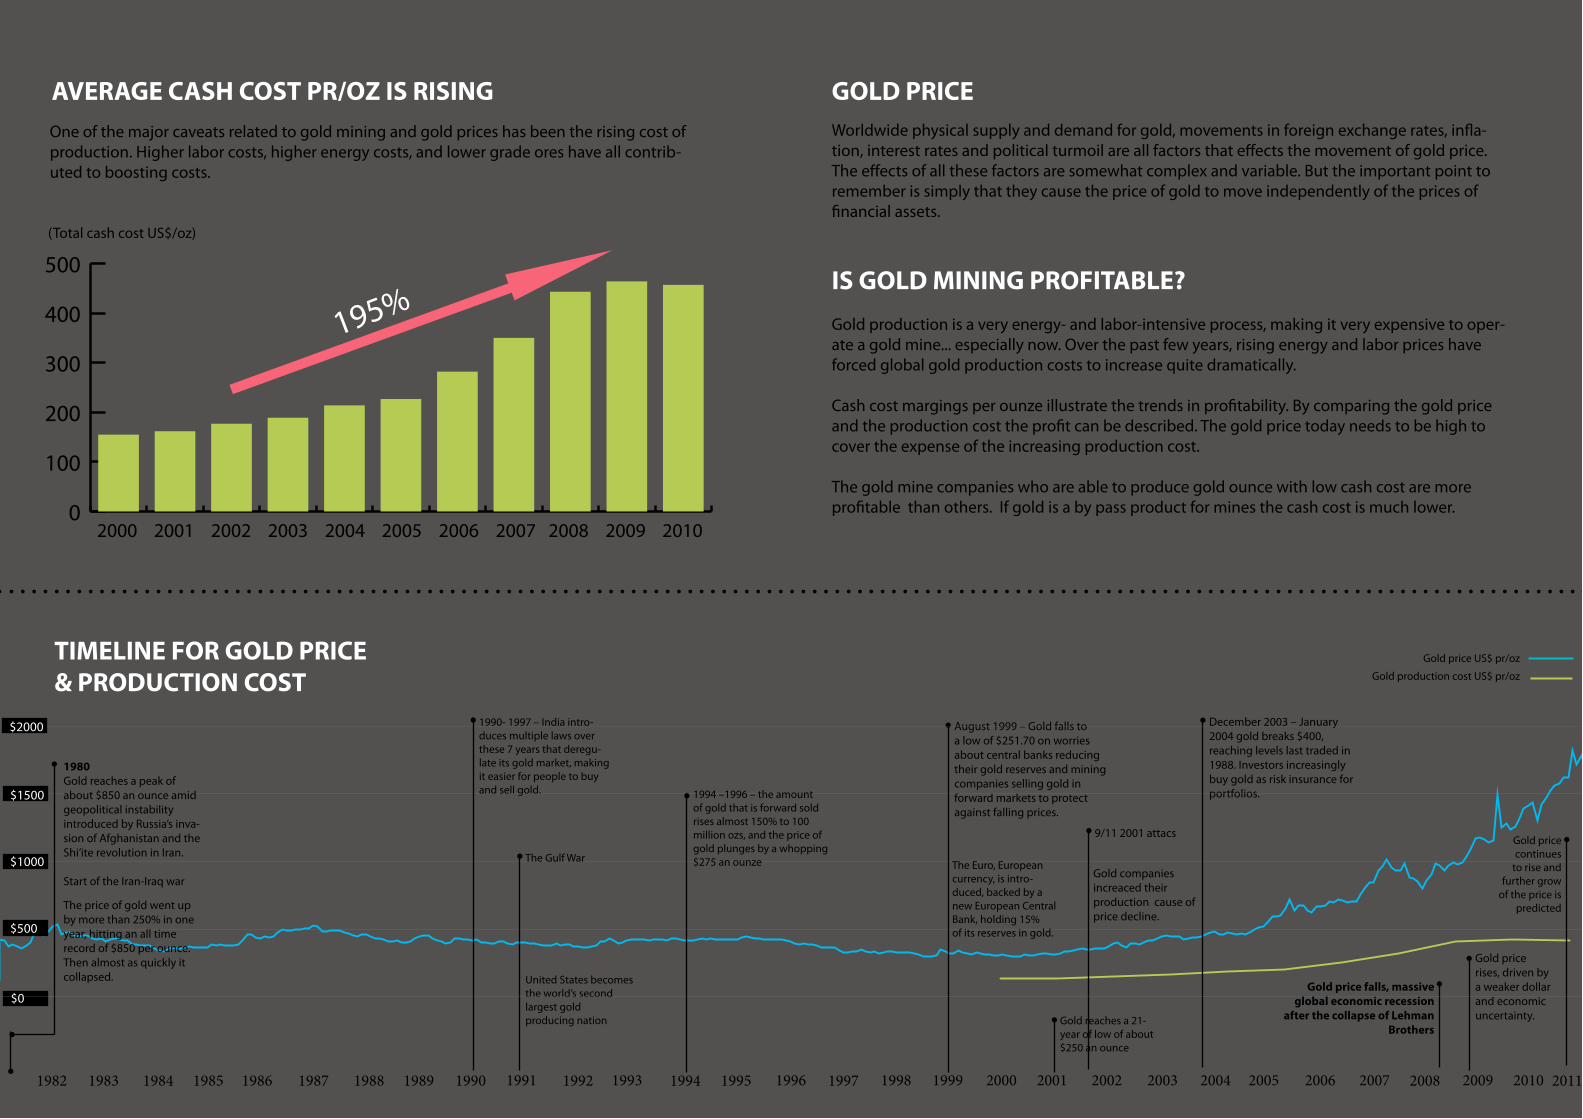
AVERAGE CASH COST PR/OZ IS RISING
Dec 20Dec 2010Dec 2009Dec 2008Dec 2007Dec 2006Dec 2005Dec 2004Dec 2003Dec 2002Des 2001Dec 2000Dec 1999Dec 1998Dec 1997Dec 1996Dec 1995Dec 1994Dec 1993Dec 1992Dec 1991Dec 1990Dec 1989Dec 1988Dec 1987Dec 1986Dec 1985Dec 1984Dec 1983Dec 1982an.82
1982 1983 1984 1985 1986 1987 1988 1989 1990 1991 1992 1993 1994 1995 1996 1997 1998 1999 2000 2001 2002 2003 2004 2005 2006 2007 2008 2009 2010 2011
August 1999 – Gold falls to a low of $251.70 on worries about central banks reducing their gold reserves and mining companies selling gold in forward markets to protect against falling prices.
December 2003 – January 2004 gold breaks $400, reaching levels last traded in 1988. Investors increasingly buy gold as risk insurance for portfolios.
Gold price continues
to rise and further grow
of the price is predicted
Worldwide physical supply and demand for gold, movements in foreign exchange rates, in!a-tion, interest rates and political turmoil are all factors that e"ects the movement of gold price. The e"ects of all these factors are somewhat complex and variable. But the important point to remember is simply that they cause the price of gold to move independently of the prices of #nancial assets.
IS GOLD MINING PROFITABLE?Gold production is a very energy- and labor-intensive process, making it very expensive to oper-ate a gold mine... especially now. Over the past few years, rising energy and labor prices have forced global gold production costs to increase quite dramatically.
Cash cost margings per ounze illustrate the trends in pro#tability. By comparing the gold price and the production cost the pro#t can be described. The gold price today needs to be high to cover the expense of the increasing production cost.
The gold mine companies who are able to produce gold ounce with low cash cost are more pro#table than others. If gold is a by pass product for mines the cash cost is much lower.
Gold price US$ pr/oz
Gold production cost US$ pr/oz
TIMELINE FOR GOLD PRICE& PRODUCTION COST
9/11 2001 attacs
One of the major caveats related to gold mining and gold prices has been the rising cost of production. Higher labor costs, higher energy costs, and lower grade ores have all contrib-uted to boosting costs.
GOLD PRICE
195%
The Gulf War
United States becomes the world’s second largest goldproducing nation
The Euro, European currency, is intro-duced, backed by a new European Central Bank, holding 15%of its reserves in gold.
Gold companies increaced their production cause of price decline.
Gold price rises, driven by a weaker dollar and economic uncertainty.
$0Gold price falls, massive
global economic recession after the collapse of Lehman
Brothers
The price of gold went up by more than 250% in one year, hitting an all time record of $850 per ounce. Then almost as quickly it collapsed.
1980Gold reaches a peak of about $850 an ounce amid geopolitical instability introduced by Russia’s inva-sion of Afghanistan and the Shi’ite revolution in Iran.
Start of the Iran-Iraq war
1990- 1997 – India intro-duces multiple laws over these 7 years that deregu-late its gold market, making it easier for people to buy and sell gold. 1994 –1996 – the amount
of gold that is forward sold rises almost 150% to 100 million ozs, and the price of gold plunges by a whopping $275 an ounze
Gold reaches a 21-year of low of about $250 an ounce
$2000
$1500
$500
$1000
W
10 biggest goldmines
Other big goldmines
WORLD BIGGEST GOLD MINE COMPANIES & MINES
North America 40% North America 40%
South America 40%
South America 27%Australia
Paci!c25%
AustraliaPaci!c11%
Africa 8%
Africa 9%
2010 Production 2010 Gold ReservesBARRICK COMPANY
Barrick is the gold industry leader, with a portfolio of 26 operating mines located across !ve continents. The Company also has the largest reserves in the gold industry, with about 140 million ounces of proven and probable gold reserves.
Barrick produced 7,765 millions ounce of gold in 2010. The Company is targeting growth in annual gold production to 9.0 million ounces within !ve year.
Sources: www.gold.org, www.barrick.com, http://www.wealthdaily.com/articles/gold-mining-production-costs, http://www.theunder-
groundinvestor.com/2006/10/a-the-gold-timeline-a-history-of-gold-prices/, www.infomine.com, www.indexmundi.com.