the biodiversity network for the cape town municipal area
TRANSCRIPT

The Biodiversity Network for the Cape Town Municipal Area
C-PLAN & MARXAN ANALYSIS: 2016 METHODS & RESULTS
Patricia Holmes & Amalia Pugnalin, Environmental Resource Management Department (ERMD), City of Cape Town, June 2016

Biodiversity Network 2016 Analysis
2
TABLE OF CONTENTS
Acronyms .............................................................................................................................. 3
Acknowledgements ................................................................................................................. 3
INTRODUCTION ....................................................................................................................... 4
History of Systematic Biodiversity Planning in the City ..................................................... 4
DATA PREPARATION ............................................................................................................. 5
Software .................................................................................................................................... 5
Analysis Data Inputs ............................................................................................................... 5
Formation of the Planning Units ............................................................................................ 5
Threats to the Biodiversity Network ...................................................................................... 6
Biodiversity Features Incorporated ....................................................................................... 6 Excluded Biodiversity Features ............................................................................................. 9 Allowing for Biodiversity Processes: Connectivity ............................................................... 14 Allowing for Biodiversity Processes: Adaptation to Climate Change .................................. 14 Assessment of Vegetation Type, Ecosystem Protection Level ........................................... 14 SANBI ecosystem threat status categories and thresholds ................................................ 15 SANBI ecosystem protection level categories .................................................................... 15
Calculation of Biodiversity Feature per Planning Unit ...................................................... 15
Setting Biodiversity Targets ................................................................................................. 15 Indigenous Vegetation......................................................................................................... 15 Indigenous Flora Species Locations ................................................................................... 15 Wetlands ............................................................................................................................. 16
ANALYSIS ............................................................................................................................... 16
Software .................................................................................................................................. 16
C-Plan Analysis...................................................................................................................... 17 Selection from Good & Fair Habitat Condition Sites ........................................................... 17 Selection from Poor Habitat Condition Sites ....................................................................... 17 Inclusion of SaSflora Data ................................................................................................... 17
MARXAN Analysis ................................................................................................................. 17 Species Penalty Factor ....................................................................................................... 18
CLASSIFICATION OF CRITICAL BIODIVERSITY AREAS .................................................. 18
IN FUTURE ANALYSES ......................................................................................................... 18
RESULTS ................................................................................................................................ 19
National Vegetation Types .................................................................................................... 19
Species Biodiversity Targets ............................................................................................... 20
Critical Biodiversity Area (CBA) Categories ....................................................................... 20
CBAs inside and outside of the urban edge ....................................................................... 23
City Vegetation Subtypes ..................................................................................................... 24
Wetlands ................................................................................................................................. 24
Biodiversity Network 2016 Analysis
3
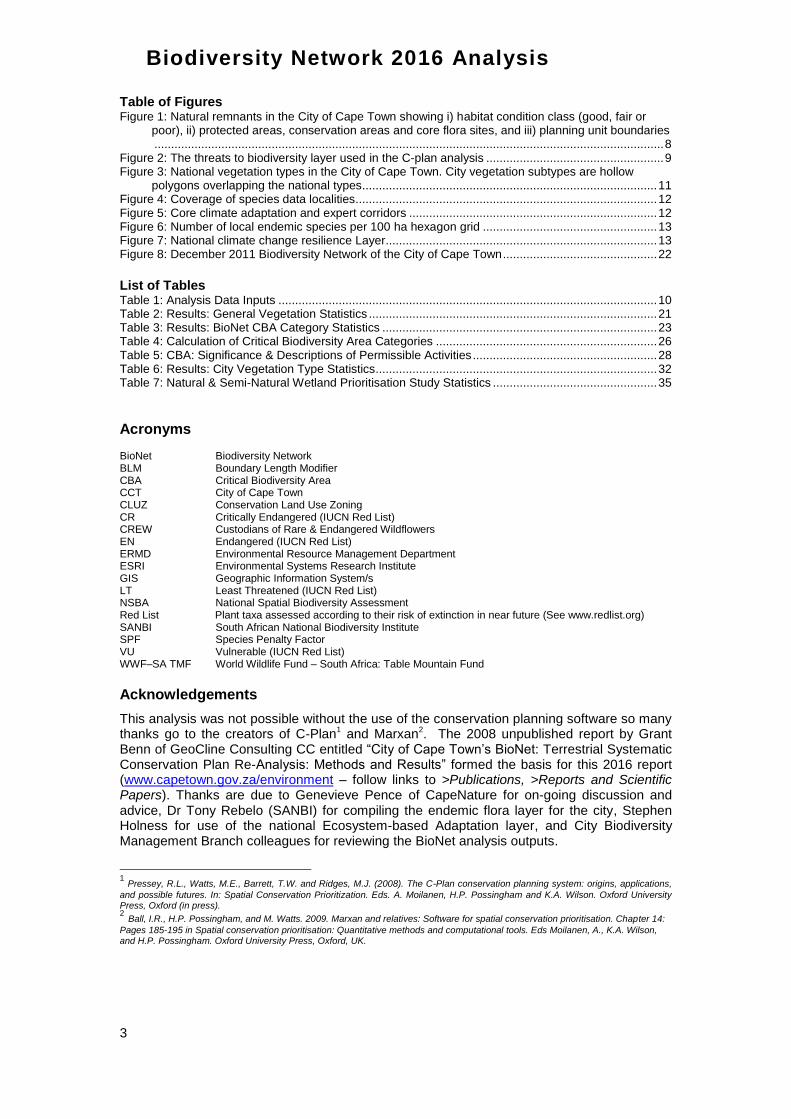
Table of Figures Figure 1: Natural remnants in the City of Cape Town showing i) habitat condition class (good, fair or
poor), ii) protected areas, conservation areas and core flora sites, and iii) planning unit boundaries ........................................................................................................................................................ 8
Figure 2: The threats to biodiversity layer used in the C-plan analysis ..................................................... 9 Figure 3: National vegetation types in the City of Cape Town. City vegetation subtypes are hollow
polygons overlapping the national types ........................................................................................ 11 Figure 4: Coverage of species data localities .......................................................................................... 12 Figure 5: Core climate adaptation and expert corridors .......................................................................... 12 Figure 6: Number of local endemic species per 100 ha hexagon grid .................................................... 13 Figure 7: National climate change resilience Layer ................................................................................. 13 Figure 8: December 2011 Biodiversity Network of the City of Cape Town .............................................. 22 List of Tables Table 1: Analysis Data Inputs ................................................................................................................. 10 Table 2: Results: General Vegetation Statistics ...................................................................................... 21 Table 3: Results: BioNet CBA Category Statistics .................................................................................. 23 Table 4: Calculation of Critical Biodiversity Area Categories .................................................................. 26 Table 5: CBA: Significance & Descriptions of Permissible Activities ....................................................... 28 Table 6: Results: City Vegetation Type Statistics .................................................................................... 32 Table 7: Natural & Semi-Natural Wetland Prioritisation Study Statistics ................................................. 35
Acronyms
BioNet Biodiversity Network BLM Boundary Length Modifier CBA Critical Biodiversity Area CCT City of Cape Town CLUZ Conservation Land Use Zoning CR Critically Endangered (IUCN Red List) CREW Custodians of Rare & Endangered Wildflowers EN Endangered (IUCN Red List) ERMD Environmental Resource Management Department ESRI Environmental Systems Research Institute GIS Geographic Information System/s LT Least Threatened (IUCN Red List) NSBA National Spatial Biodiversity Assessment Red List Plant taxa assessed according to their risk of extinction in near future (See www.redlist.org) SANBI South African National Biodiversity Institute SPF Species Penalty Factor VU Vulnerable (IUCN Red List) WWF–SA TMF World Wildlife Fund – South Africa: Table Mountain Fund
Acknowledgements
This analysis was not possible without the use of the conservation planning software so many thanks go to the creators of C-Plan1 and Marxan2. The 2008 unpublished report by Grant Benn of GeoCline Consulting CC entitled “City of Cape Town’s BioNet: Terrestrial Systematic Conservation Plan Re-Analysis: Methods and Results” formed the basis for this 2016 report (www.capetown.gov.za/environment – follow links to >Publications, >Reports and Scientific Papers). Thanks are due to Genevieve Pence of CapeNature for on-going discussion and advice, Dr Tony Rebelo (SANBI) for compiling the endemic flora layer for the city, Stephen Holness for use of the national Ecosystem-based Adaptation layer, and City Biodiversity Management Branch colleagues for reviewing the BioNet analysis outputs.
1 Pressey, R.L., Watts, M.E., Barrett, T.W. and Ridges, M.J. (2008). The C-Plan conservation planning system: origins, applications,
and possible futures. In: Spatial Conservation Prioritization. Eds. A. Moilanen, H.P. Possingham and K.A. Wilson. Oxford University Press, Oxford (in press). 2 Ball, I.R., H.P. Possingham, and M. Watts. 2009. Marxan and relatives: Software for spatial conservation prioritisation. Chapter 14:
Pages 185-195 in Spatial conservation prioritisation: Quantitative methods and computational tools. Eds Moilanen, A., K.A. Wilson, and H.P. Possingham. Oxford University Press, Oxford, UK.

Biodiversity Network 2016 Analysis
4
INTRODUCTION
We have used a systematic biodiversity planning approach to prioritise remnant indigenous vegetation in the Cape Town Metropolitan area (=city) based on factors such as connectivity, habitat condition and location of threatened flora. Systematic biodiversity planning generally involves the following steps:
Subdividing a region into a series of planning units
Gathering data describing the distribution of biodiversity features within this region
Calculating the amount of each biodiversity feature found in each planning unit
Setting biodiversity targets for each biodiversity feature in order to ensure their adequate conservation
Using software to select a set of planning units which meets these biodiversity targets in an efficient manner.
The primary product of this approach is the Biodiversity Network (BioNet) for the city area, which exists in the form of a GIS shapefile, with associated tabular information. The shapefile can be mapped and analysed and statistics can be derived, giving users a picture of not only the situation on the ground but most importantly, where to focus their conservation efforts in light of limitations in staff, budget and available open space. Similarly, users can identify areas that are a low biodiversity priority and thus potential development areas. This report gives an overview of the methodology used but the technical process using GIS technology and the biodiversity planning software packages of C-Plan and MARXAN/CLUZ is described in a separate manual (contact [email protected]).
History of Systematic Biodiversity Planning in the City
In 2002, the first systematic biodiversity planning study to identify the minimum set of conservation areas required in the city was initiated using the biodiversity planning software “C-Plan”. This study pre-dated the National Environmental Management: Biodiversity Act (2004), the Vegetation Map of South Africa, Lesotho and Swaziland (Mucina et al. 20063) and the National Spatial Biodiversity Assessment (2004). The study built on earlier work done in partnership with the Botanical Society which resulted in a report entitled: “Core Flora Conservation Areas on the Cape Flats” (Maze & Rebelo 19994). In the latter report, 38 sites were identified as critically important contributors to Cape Town’s biodiversity and have since become known as the “Core Flora Sites”. Data informants for the 2002 study included a remnant layer based on 1998 aerial photography, available plant species information and a local vegetation map drawn up by botanical consultant A. B. Low. The study culminated in the Biodiversity Network Prioritization Report (20045). In 2006, a revised desktop systematic biodiversity planning study was initiated to update the BioNet using the latest: 1) remnant layer based on 2005 aerial photography, 2) species information and 3) a vegetation map aligned to the 2006 national vegetation map (Mucina et al. 2006). Results from this re-analysis may be found in the 2007 report6. This version of the
3 Mucina, L., Rutherford, M. C. and Powrie, L., editors. 2006. Vegetation Map of South Africa, Lesotho and Swaziland: Shapefiles of
basic mapping units. Beta version 4.0. February 2004. South African National Botanical Institute, Cape Town. 4 Maze K E & Rebelo A G 1999. Core Flora Conservation Areas on the Cape Flats. FCC Report 99/1. Botanical Society of South
Africa. 5 Note: all City biodiversity reports are available on the ERMD website:
http://www.capetown.gov.za/en/environmentalresourcemanagement/Pages/default.aspx; “publications > reports” City of Cape Town. 2004. Biodiversity Network Prioritisation Project, Final Draft Report prepared by MLA-Sustainability Matters, in association with GISCOE, Biodiversity & Conservation Biology Department UWC, Settlement Planning Services & Freshwater Consulting Group. 6 City of Cape Town. 2007. The Identification and Prioritisation of a Biodiversity Network for the City of Cape Town, Final Report prepared by MLA-Sustainability Matters, in association with GISCOE (Pty) Ltd.
Biodiversity Network 2016 Analysis
5
BioNet was approved by council (PEPCO, November 2006) subject to continuing collaborations with Spatial Planning and Urban Design. In 2008, after extensive ground-truthing of vegetation remnants during 2007-8, the remnant layer was again updated and C-Plan was re-run using habitat condition as an additional informant. The programme “Marxan” was next applied, using a “Boundary Length Modifier” tool, to select additional remnants needed to improve connectivity among selected remnants. This, together with expert corridor sites, replaced the friction analysis used in the first analysis to identify corridors on the BioNet. Corridors help to conserve ecological processes, which include the dispersal and migration of plants and animals, and are necessary to conserve healthy populations in the long-term. All wetlands and rivers in this and earlier versions are considered part of the BioNet. In the 2008 analysis, the national biodiversity targets were adopted for the first time. Methods and results of the 2008 analysis of the BioNet are reported in Benn (20087). In 2009, the analysis was redone closely following the methodology of the 2008 analysis but with improved input data. The methods and results of the 2009 analysis of the BioNet are reported in Holmes & Stipinovich (2009)8. The analysis was again run in 2011 with updated input data (Holmes et al. 2012)9. This analysis also took into account the need for the BioNet to allow for biodiversity processes to adapt ecosystems to climate change.
DATA PREPARATION
Software
The data were prepared using ESRI’s GIS software versions ArcGIS 10.2 and ArcView 3.3. C-Plan 3.4, Spatial Analyst, Marxan and CLUZ extensions to ArcView 3.3 were used as well as Microsoft’s Excel. Further Marxan work was done within QGIS using the CLUZ plug-in.
Analysis Data Inputs
See Table 1: Analysis Data Inputs on page 9.
Formation of the Planning Units
The planning domain was the area enclosed by the administrative boundary of the City. The basis for the formation of the planning units within the planning domain was the city indigenous vegetation remnants coverage. The remnants had been ground-truthed in 2007-8 for the third C-Plan analysis and creation of the BioNet of 2008. Each remnant’s habitat condition was evaluated as being good, fair or poor. The status of these remnants is updated by the Environmental Resource Management Department (ERMD) on an ongoing basis, to ensure the information is as current as possible. In the 2009 analysis, the Protected Areas were considered to be in good habitat condition as time did not permit their being ground-truthed. Since the 2009 analysis, the Protected Areas have been ground-truthed. Each good, fair or poor condition portion of a remnant formed a separate planning unit of variable size. Any remnants over 100 hectares in size that were not classified as Protected
7 Benn G. 2008. City of Cape Town BioNet: Terrestrial Systematic Conservation Plan Re-Analysis: Methods & Results. (Available for
download from ERMD website) 8 Holmes P. M. & Stipinovich A. 2009. City of Cape Town’s Biodiversity Network: C-PLAN & MARXAN ANALYSIS: 2009 METHODS & RESULTS. (Available for download from ERMD website) 9 Holmes P.M, Stipinovich A. & Purves A. 2012. The Biodiversity Network for Cape Town. C-PLAN & MARXAN ANALYSIS: 2011
METHODS & RESULTS. (Available for download from ERMD website)

Biodiversity Network 2016 Analysis
6
Areas were further subdivided into hexagon grid cells of 100 hectares in area. Thus maximum planning unit size was 100 ha. Existing protected area boundaries were integrated into the remnant layer before this process was carried out. “Protected Areas” included those in process of being proclaimed that are managed by the City and other organizations. Core Flora Sites were also considered as a priori “protected areas” for the purposes of the analysis although not all are protected (Figure 1). Only features that were located on the existing remnants coverage were considered in the analysis.
Threats to the Biodiversity Network
A combined threats layer was used, which included:
Urban expansion (based on the Urban Edge): all areas within the urban edge were considered under high threat, and those outside the urban edge low threat.
Potential agriculture: based on a soil productivity study for the city, all land considered agricultural is under high threat, other agricultural areas and mountain areas under medium threat and other areas (e.g. national parks, urban areas) under low threat from this land use.
Potential mining areas: based on a mining potential study and mined deposit layers, all areas with potential for mining are considered under high threat and the remaining areas under low threat.
New Development Areas: all such areas identified in the District Spatial Development Plans are considered under high threat.
The thresholds for high, medium or low threat are described above. The relative area of each threat level per planning unit was calculated. This information was used to select sites under least threat as a rule in the C-plan analysis.
Biodiversity Features Incorporated
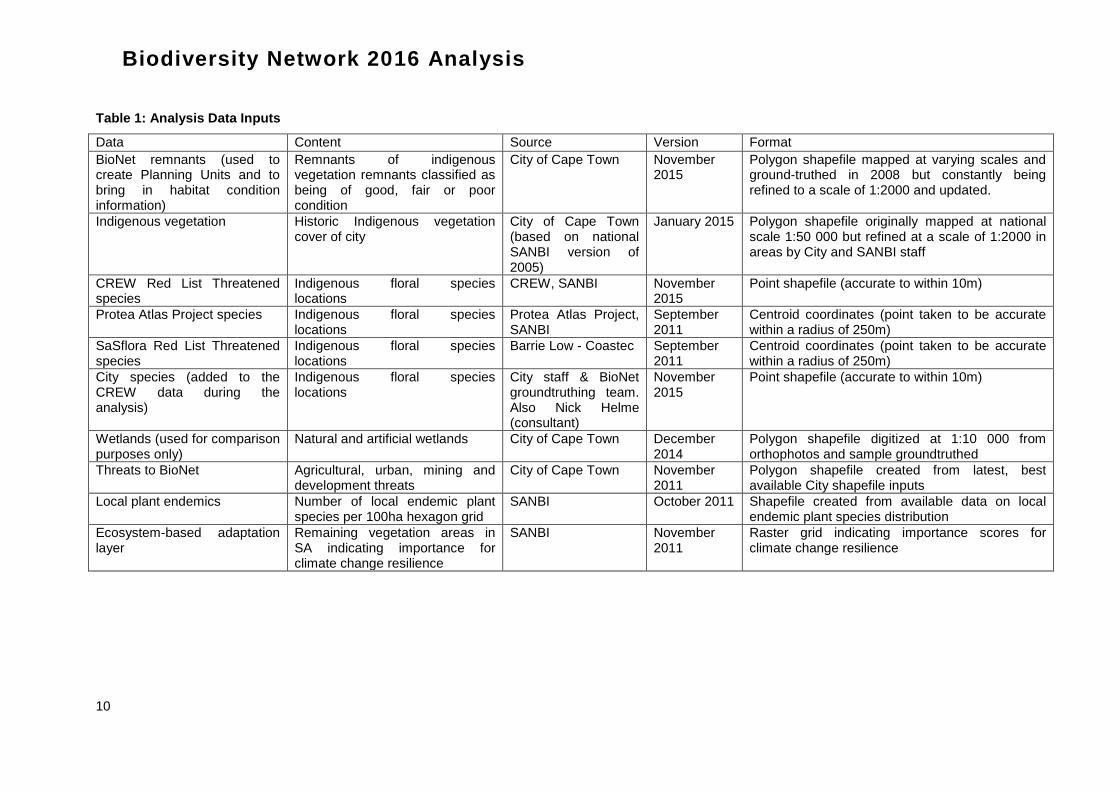
The indigenous vegetation (Figure 3) and flora (Figure 4) of a planning unit was used as a surrogate for biodiversity, as the coverage of the available GIS flora data was far greater than that available for indigenous fauna. Vegetation and flora generally are good indicators for the fauna. Included were the various national vegetation types and their local city subtypes as well as three plant species databases, additional city records and their individual Red List threatened species status. The variety, numbers or area, and rarity of each are considered by the conservation planning software. The biodiversity features brought into the analysis as factors were as follows:
Current indigenous vegetation extent with remnants classified as good, fair or poor habitat condition
Revised city indigenous vegetation: This aligns the city vegetation types with the South African National Biodiversity Institute (SANBI) National Vegetation types; the city types are classed as subtypes at a finer scale
CREW10 indigenous flora species data
City indigenous flora species data
Protea Atlas Project (SANBI) indigenous flora species data
SaSflora11 indigenous flora species data City wetlands were prioritized in a separate analysis (Snaddon & Day 2009)12 and incorporated into the terrestrial Critical Biodiversity Area (CBA) map. In addition, the internal
10 CREW = Custodians of Rare and Endangered Wildflowers 11 SaSflora = Site and Species flora database (Coastec)
12 Snaddon K. & Day E. (2009) Prioritization of City Wetlands. www.capetown.gov.za/environment - follow links to Publications > Reports and scientific papers.

Biodiversity Network 2016 Analysis
7
expert review of the analysis ensured that Important Bird Areas, known localities of threatened and endemic fauna and Baboon home ranges were included in the BioNet.

Biodiversity Network 2016 Analysis
8
Figure 1: Natural remnants in the City of Cape Town showing habitat condition class (good, fair or poor), conservation and core flora site areas and planning unit boundaries

Biodiversity Network 2016 Analysis
9
Figure 2: The threats to biodiversity layer used in the C-plan analysis
Excluded Biodiversity Features
The dunes at Atlantis were extracted from the vegetation coverage as they extend over an area of 270 hectares. Areas identified as “Reclaimed” areas in the Vegetation coverage were also excluded.
Beach vegetation types in the False Bay area were grouped with the False Bay subtype of Cape Flats Dune Strandveld. There were no Beach vegetation types in the West Coast area.
Subtypes of Southern Afrotemperate Forest vegetation were combined and brought in as one “Southern Afrotemperate Forest” unit as this type covers a very small area and is formally conserved in the Table Mountain National Park.
Any exotic flora species listed in the CREW, CCT, SaSflora or Protea Atlas Project data were excluded. Only those species listed as Critically Endangered, Endangered, Vulnerable or Near Threatened on the IUCN Red List were included to cater for software limitations.
Large artificial water bodies and waste water treatment works (e.g. dams such as Steenbras and Kleinplasie) were extracted from the vegetation coverage so as not to bias vegetation statistics. Other areas of natural and semi-natural water bodies fell into the wetland vegetation types.
Biodiversity Network 2016 Analysis
10
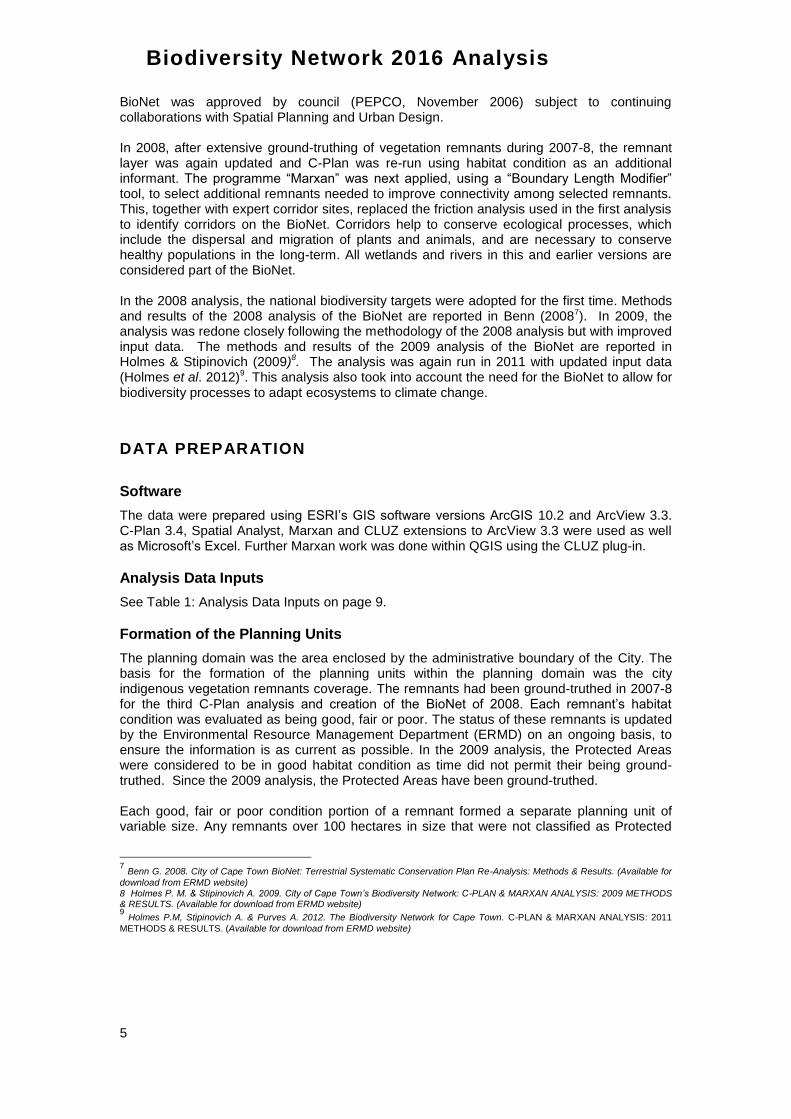
Table 1: Analysis Data Inputs
Data Content Source Version Format
BioNet remnants (used to create Planning Units and to bring in habitat condition information)
Remnants of indigenous vegetation remnants classified as being of good, fair or poor condition
City of Cape Town November 2015
Polygon shapefile mapped at varying scales and ground-truthed in 2008 but constantly being refined to a scale of 1:2000 and updated.
Indigenous vegetation
Historic Indigenous vegetation cover of city
City of Cape Town (based on national SANBI version of 2005)
January 2015 Polygon shapefile originally mapped at national scale 1:50 000 but refined at a scale of 1:2000 in areas by City and SANBI staff
CREW Red List Threatened species
Indigenous floral species locations
CREW, SANBI November 2015
Point shapefile (accurate to within 10m)
Protea Atlas Project species Indigenous floral species locations
Protea Atlas Project, SANBI
September 2011
Centroid coordinates (point taken to be accurate within a radius of 250m)
SaSflora Red List Threatened species
Indigenous floral species locations
Barrie Low - Coastec September 2011
Centroid coordinates (point taken to be accurate within a radius of 250m)
City species (added to the CREW data during the analysis)
Indigenous floral species locations
City staff & BioNet groundtruthing team. Also Nick Helme (consultant)
November 2015
Point shapefile (accurate to within 10m)
Wetlands (used for comparison purposes only)
Natural and artificial wetlands City of Cape Town December 2014
Polygon shapefile digitized at 1:10 000 from orthophotos and sample groundtruthed
Threats to BioNet Agricultural, urban, mining and development threats
City of Cape Town November 2011
Polygon shapefile created from latest, best available City shapefile inputs
Local plant endemics Number of local endemic plant species per 100ha hexagon grid
SANBI October 2011 Shapefile created from available data on local endemic plant species distribution
Ecosystem-based adaptation layer
Remaining vegetation areas in SA indicating importance for climate change resilience
SANBI November 2011
Raster grid indicating importance scores for climate change resilience
Biodiversity Network 2016 Analysis
11
Figure 3: National vegetation types in the city. City vegetation subtypes are hollow polygons overlying the national

Biodiversity Network 2016 Analysis
12
Figure 4: Coverage of species data localities
Figure 5: Core climate adaptation and expert corridors

Biodiversity Network 2016 Analysis
13
Figure 6: Number of local endemic species per 100ha hexagon grid
Figure 7: National climate change resilience Layer

Biodiversity Network 2016 Analysis
14
Allowing for Biodiversity Processes: Connectivity
Potential corridors to ensure connectivity through the fragmented landscapes of the CCT were mapped by Biodiversity Management Branch’s experienced staff and included in the analysis as features (Figure 5):
Blaauwberg Nature Reserve to Koeberg Private Nature Reserve
Diep River Fynbos Corridor (Rietvlei to Blaauwberg Nature Reserve)
Kuils River Corridor (Driftsands Nature Reserve to the coast at Macassar Dunes)
False Bay Coastline
Dassenberg Coastal Catchment Corridor (Silverstroomstrand to Riverlands Nature Reserve)
Important linkages on the Cape Peninsula.
Allowing for Biodiversity Processes: Adaptation to Climate Change
As for the 2011 analysis, the 2016 methodology explicitly incorporated climate adaptation strategies based on international best practice (Pence 2009; Pence 2011)13,14. Previous analyses had addressed the protection of representative habitats, critical habitats & large intact habitats; risk-spreading through replication; incorporation of ecological connectivity; and reduction of threats. The potential for the BioNet to adapt to climate change was further strengthened by inclusion of the potential key climate refugia, identified as areas of high local endemic plant species richness (Figure 6) and prioritisation of regional connectivity. The latter adaptation features were incorporated into the C-plan Minset rules. In the Marxan analysis, an important climate change adaptation corridor that was identified in a WWF-SA TMF study (Pence 2009), aligning with the Dassenberg Coastal Catchment Corridor, was included as a conservation feature. It has been adapted slightly since 2011 to avoid areas planned for development. In addition, the national layer of areas important for climate change resilience (Holness et al. in prep)15 as outlined in the 2011 National Biodiversity Assessment (NBA), was used as the cost surface in Marxan to preferentially select areas of high resilience value (Figure 7). The climate change resilience layer incorporates the following areas:
Areas with a high diversity of habitats
Environmental gradients (including topographic, temperature, and precipitation)
Climate refugia (including south-facing slopes and gorges)
Corridors
Large unfragmented natural ecosystems
Intact centres of endemism; and
Buffer ecosystems (i.e. riparian and coastal).
Assessment of Vegetation Type, Ecosystem Protection Level
Ecosystem protection level status was calculated using the status categories developed by SANBI. The assessment of the status can be done at either the national vegetation type or the CCT vegetation subtype level. This analysis operated at the subtype level, but the results are also presented at the national vegetation level in order to summarize the contribution towards achieving biodiversity targets.
13 Pence, G.Q.K., 2009. Climate Adaptation Scenarios for the Cape Floristic Region: Technical Report. Unpublished Report, Table Mountain Fund, World Wildlife Fund-South Africa, Cape Town. 14Pence G. (2011). Incorporating Climate Change Adaptation Strategies into the Updating of the City of Cape Town’s Biodiversity Network Analysis. Unpublished Report City of Cape Town. 15 Holness, S. (2008) SANBI Ecosystem-based Adaptation layer. Unpublished GIS dataset prepared for South African National
Biodiversity Institute and Department of Environmental Affairs, Pretoria. See also Driver et al. 2012 NBA.
Biodiversity Network 2016 Analysis
15
SANBI ecosystem threat status categories and thresholds16
Critically Endangered (CR): current area less than biodiversity threshold area (e.g. 30% of historical distribution for fynbos vegetation types)
Endangered (EN): current area less than biodiversity threshold + 15% of historical distribution
Vulnerable (VU): current area < 60% of historic distribution
Least Threatened (LT): current area > 60% of historic distribution
SANBI ecosystem protection level categories
Not protected: 0% of biodiversity threshold conserved } First 2 categories amal-
Hardly protected: 0-<5% of biodiversity threshold conserved } gamated in 2011 NBA
Poorly protected: 5> - <50% of biodiversity threshold conserved
Moderately protected:>50 - <100% of biodiversity threshold conserved
Well protected: 100% of biodiversity threshold conserved Please see Table 2: Vegetation Statistics for the results of these calculations.
Calculation of Biodiversity Feature per Planning Unit
The planning unit and biodiversity feature datasets were then brought together in GIS to summarise the features per planning unit. The inputs required for the C-plan and Marxan software were tables. Population figures for each recorded location of a species were rare. The species input tables were instead records of the frequency of a species’ locality data point intersecting with a planning unit. Only one occurrence of a species on a planning unit was retained so as to reduce the size of the input data as the software typically cannot process huge datasets. Available information on the IUCN Red List status of each species e.g.CR, EN, was included. The above process was done for the planning units and vegetation and threats datasets, respectively. However, these recorded the areas in hectares of each vegetation type/ each level of threat as opposed to number of locations.
Setting Biodiversity Targets
Indigenous Vegetation
Biodiversity targets were based on national vegetation type percentages as determined for the 2004 National Spatial Biodiversity Assessment (NSBA) but were applied at the level of the city vegetation subtypes. Actual biodiversity target values were calculated from the historic area for each subtype in the city (Please refer to Table 2: General Vegetation Statistics).
Indigenous Flora Species Locations
For CREW, Protea Atlas Project, SaSflora and CCT’s recorded flora species, biodiversity targets were based on the number of known species locations. For species described in the
16 Note that in the latest ecosystem assessment: Driver A (2011) Threatened ecosystems for listing under NEM:BA 2004, South African Biodiversity Institute, Pretoria; vegetation types may be assessed as threatened owing to both habitat loss and the species criteria (i.e. containing high numbers of threatened species). In 2011 only two national vegetation types in the City were considered
Least Threatened: Southern Afrotemperate Forest and Western Coastal Shaleband Vegetation. For the purposes of this analysis however, we adopt the habitat loss criterion to report on ecosystem threat status within the city.

Biodiversity Network 2016 Analysis
16
datasets, a simple sliding scale target was used for each species on the basis of the number of locations:
100% of all locations for Critically Endangered (CR) species
5 locations for Endangered (EN), Vulnerable (VU) and Near Threatened (NT) species.
These targets were assigned on the basis that common, non-threatened species also will be conserved at localities of more threatened species and there are likely to be more unrecorded localities of the commoner species.
Wetlands
Wetlands were not brought into this C-plan/Marxan run directly. Wetland prioritization was analyzed separately by specialist consultants (Snaddon et al. 2009)9. This prioritization was done using a city-wide ranking approach within each major wetland type. The selection of ranking criteria resulted from a workshop organized by the Western Cape Wetlands Forum in 2008. All wetlands were scored and those natural or semi-natural wetlands scoring in the highest quarter were allocated to CBA1; those in the second quarter to CBA2 (for estuaries the lowest category was CBA2). High ranking artificial wetlands and third quarter natural or semi-natural wetlands were allocated to ‘Critical’ Ecological Support Area (CESA) and the remainder to ‘Other’ Ecological Support Area (OESA). Priority wetlands occurring on natural vegetation remnants were included post-hoc into the BioNet as CBA wetlands, aligning to the prioritization study allocation to categories as far as possible. In some cases, subsequent wetland ground-truthing indicated that priority wetlands located in poor to irreversibly modified vegetation were degraded and in practice would be difficult to restore and conserve. The latter wetlands were re-assigned to either CESA or OESA status based on level of modification. Wetland ground-truthing has continued since the 2011 BioNet re-analysis and the wetland layer is updated on a continuous basis.
ANALYSIS
For the detailed biodiversity planning analysis technical manual please refer to Pugnalin & Holmes (2016)17.
Software
The ArcView 3.3 extension C-Plan 3.4 was used to calculate the irreplaceability of a planning unit and to select an optimal and efficient set of remnants to meet the biodiversity targets. To assist in ensuring connectivity within the conservation network, MARXAN18 was also used in order to select additional planning units aimed at ensuring connectivity across the BioNet. MARXAN has the ability to consider spatial pattern in selecting reserve networks through the use of its Boundary Length Modifier (BLM). The BLM allows the selection process to consider landscape connectivity in the selection process. CLUZ19 is an extension to ArcView3.3 and QGIS20 and was used in the software to provide a user-friendly interface to MARXAN.
17 Pugnalin A. & Holmes P. M. 2016. City of Cape Town’s Biodiversity Network C-Plan and Marxan Analysis Manual. City of Cape Town: Unpublished. This is based on Benn 2009, City of Cape Town BioNet Analysis Manual. GeoCline Consulting: Cape Town. 18 Possingham et al. 2000, Ball and Possingham, 2000, http://www.ecology.uq.edu.au/ index.html 19 Smith 2004, http://www.mosaic-conservation.org/cluz 20
QGIS Development Team, 2016. QGIS Geographic Information System. Open Source Geospatial Foundation Project.
http://qgis.osgeo.org
Biodiversity Network 2016 Analysis
17
C-Plan Analysis
Selection from Good & Fair Habitat Condition Sites
To ensure that good and fair condition planning units were selected preferentially over poor condition planning units, the latter were initially excluded from the analysis. Irreplaceability was then calculated, and those planning units with 100% irreplaceability scores selected. Irreplaceable planning units are those for which no alternatives exist if biodiversity targets are to be met.
The Minset Algorithm
Outstanding biodiversity target values were then met by running C-Plan’s Minset algorithm that uses a series of rules. Successive rules in the Minset algorithm are only used when a tie occurs. The expert mapped corridors were used in the Minset to ensure that where possible, and if the preceding rules result in ties, planning units within these corridors were preferentially selected. The Minset algorithm rules were as follows: 1. Highest Irreplaceability score 2. Habitat condition = Good 3. Location of planning unit in one of the expert mapped corridors 4. Highest “local endemics” value 5. Lowest “High plus Medium” threat value 6. Highest percentage contribution to meeting biodiversity targets 7. Feature rarity 8. Summed rarity 9. Richness 10. Site Area Highest 11. Select first site in list
Selection from Poor Habitat Condition Sites
The poor condition planning units were then brought into the analysis and irreplaceability recalculated to try to meet any biodiversity targets that had not yet been met when only good and fair condition planning units were considered. Any poor condition planning units given a status of 100% irreplaceability were included in the set of selected planning units. At this point, all achievable biodiversity targets were attained.
Inclusion of SaSflora Data
The previous analyses in 2009 and 2011 attempted to include the entire large SaSflora species database, as well as the CREW, CCT and Protea Atlas plant species databases. However, during these analyses, software problems were experienced owing to the large size of the input data. For this reason a reduced and combined species database was used that included only the Red List Threatened species – CR, EN, VU and NT - as these are the species most likely to influence planning unit selection. In addition, any duplicates of a species on a planning unit within or between source datasets were removed. The C-plan output with the reduced species data was considered to produce the best result and was used as the input into Marxan.
MARXAN Analysis
The protected areas and the good and fair condition sites selected during the C-Plan analysis in order to reach biodiversity targets were set aside as having already been identified as essential to conserve (i.e. “mandatory”). MARXAN was then run to select further sites that would allow for connectivity between them in order to meet ecological process biodiversity targets. Sites could therefore be selected by Marxan even if they were not required to directly meet biodiversity pattern targets. The plant species features were not included in the
Biodiversity Network 2016 Analysis
18
MARXAN analysis as they cause the software to freeze. This was not considered to be of concern as the feasible flora biodiversity targets had already been met and the relevant sites selected in the C-Plan step of the analysis. Vegetation features and the climate change adaptation corridor feature were included. The NBA’s Ecosystem-Based Adaptation layer was used as a cost surface (see description on p. 9) in order to connect the selected planning units using sites of high climate adaptation potential where possible. A Boundary Length Modifier (BLM) of 0.5 was used, based on the findings of Benn21 in the 2008 BioNet run: the value 0.5 proved to be the least land-hungry, important in the case of the city where open land is at a premium. The higher the BLM is defined, the more land hungry a run will be with the selection being more biased towards reducing boundary length and less towards meeting feature biodiversity targets. In contrast to previous analyses, a bound.dat with an XY tolerance of 50 was used as opposed to the default of 0.002. This XY tolerance proved to select the most viable distribution of planning units. External edges were included in the determination of boundary length, although certain edges could be excluded in future where they make up a natural boundary, such as a coastline.
Species Penalty Factor
The Species Penalty Factor (SPF) is the cost associated with not meeting the biodiversity target for a specific biodiversity feature. Setting a high cost value for a particular feature will increase the likelihood of that feature’s biodiversity target being met, as MARXAN acts to minimise the cost of the final portfolio that it identifies. 100 000, a very high value, was set for all features in the MARXAN analysis to ensure that all biodiversity targets were met. The number of iterations was set at 1,000,000 and the number of runs at 100. Increasing the number of iterations and runs generally improves the efficiency of the portfolio that MARXAN identifies but also increases the processing time.
CLASSIFICATION OF CRITICAL BIODIVERSITY AREAS
The selected planning units were ranked and given specific attributes by both the C-Plan and the MARXAN software. These rankings and attributes were combined and used to identify a range of different Critical Biodiversity Area (CBA) categories (Tables 3, 5). CBA 2 and Other Natural Vegetation areas that had additional importance in that they served to consolidate CBA 1b remnants were manually upgraded to CBA 1d status. Unselected natural vegetation and irreversibly modified areas of open land were upgraded to CESA and OESA respectively wherever they fell within Baboon home ranges, Important Bird Area, a large mammal movement corridor or a management consolidation area.
IN FUTURE ANALYSES
In order to promote connectivity between established protected areas in addition to consolidation of fragments, known ecological corridors other than the climate change corridor
21 Benn, Grant. 2008. City of Cape Town’s BioNet: Terrestrial Systematic Conservation Plan Re-Analysis: Methods and Results. GeoCline Consulting CC (www.capetown.gov.za – follow links to ERMD/ Reports).
Biodiversity Network 2016 Analysis
19
could be factored into the Marxan process rather than adding them in after C-Plan and Marxan have been run. Any additional fauna data needs to be assessed to gauge whether it should be incorporated in the future, software-permitting.
RESULTS
National Vegetation Types
The results for 19 terrestrial and 3 wetland vegetation types are presented in Table 2. Three of the national types have been divided into two subtypes of regional importance: Cape Flats Dune Strandveld into False Bay and West Coast subtypes and Peninsula Granite Fynbos into North and South subtypes, the latter usually being located on wetter aspects and slopes. Thirdly, Peninsula Shale Fynbos is a locally significant subtype of Cape Winelands Shale Fynbos. Six national vegetation types are endemic (i.e. confined to the city). These are: Cape Flats Dune Strandveld, Cape Flats Sand Fynbos, Lourensford Alluvium Fynbos, Peninsula Granite Fynbos, Peninsula Sandstone Fynbos and Peninsula Shale Renosterveld. The biodiversity targets were calculated from species-area curves as the minimum area required for conserving 75% of the plant species in a vegetation type. Note that this is the minimum requirement and that additional areas may be needed to maintain ecological processes and to provide habitat for certain threatened plant and animal species. The 2012 National Biodiversity Assessment indicates which vegetation types have elevated threat status based on the species criterion: i.e. high concentrations of Red List threatened species. For the city this applies to Atlantis Sand Fynbos (CR), Peninsula Sandstone Fynbos (EN) and Kogelberg Sandstone Fynbos (CR). The areas required to meet the vegetation and species biodiversity targets are indicated on the map (Figure 1) as CBA1a-d and CBA2; and those areas required to conserve ecological processes as CBA1e. Additional ecological support areas required, primarily for Baboon home ranges and other large mammal movement corridors, are indicated on the map as CESA for natural remnants and OESA for irreversibly modified land (usually across extensive agriculture areas). In 2016, eight of the national vegetation types in the city have insufficient habitat remaining to conserve the minimum biodiversity target. These are Cape Flats Sand Fynbos, Lourensford Alluvium Fynbos, Peninsula Shale Renosterveld, Swartland Alluvium Fynbos, and Swartland Alluvium, Granite, Shale and Silcrete Renosterveld vegetation types. Three of these national vegetation types are endemic to the city and thus cannot be conserved elsewhere: Cape Flats Sand Fynbos with 13.4%, Lourensford Alluvium Fynbos with 1.1% and Peninsula Shale Renosterveld with 11.5% habitat remaining. The latter type is mostly all conserved in the Table Mountain National Park, but the other two are an urgent priority for conserving remaining habitat. Unfortunately over half of this habitat is in poor condition. The five non-endemic types have traditionally been exploited for commercial agriculture (cereal & fruit crops) and little natural habitat remains either inside or outside of the city. Although sufficient remnant habitat remains to meet biodiversity targets for the other 14 national terrestrial and wetland vegetation types, there is much work to be done in attaining adequate protection for them in nature reserves. Ten vegetation types, all in the lowlands or foothills, have no protection, or are hardly or poorly protected. Moderately to well-conserved types (i.e. proportion in proclaimed protected areas in the city relative to biodiversity targets) are Cape Estuarine Salt Marsh, Cape Lowland Freshwater Wetlands, Freshwater Lakes, Cape Winelands Shale Fynbos (including Peninsula Shale Fynbos subtype), Hangklip Sand Fynbos, Kogelberg Sandstone Fynbos, Peninsula Granite Fynbos (North subtype), Peninsula Sandstone Fynbos, Southern Afrotemperate Forest and Western Coastal Shaleband Vegetation (Table 2). These are mainly conserved in the Table Mountain National Park and various reserves in mountainous areas of the Helderberg district.

Biodiversity Network 2016 Analysis
20
It is important to note the anomaly in the city statistics for Elgin Shale Fynbos – a vegetation type occurring mainly outside of the city – which has largely been converted for intensive agriculture and orchards and is nationally Critically Endangered. However, within the city, a lower proportion has been lost and there is an opportunity to secure as much of this ecosystem as possible to improve its national ecosystem protection level. However, currently these remnants are under pine plantations in the land adjacent to the Steenbras Dam and are in need of restoration. Swartland Alluvium Renosterveld has no remaining habitat in the city.
Species Biodiversity Targets
The comprehensive flora data sets available for the city enabled all the known locations of threatened species to be selected in the BioNet, or where these exceeded biodiversity targets for these to be met. Vegetation types rich in endemic and threatened species have more extensive areas selected in the BioNet in order to accommodate species populations, except for those types that largely been lost such as Cape Flats Sand Fynbos and Lourensford Alluvium Fynbos. An example of a vegetation type for which additional areas are selected for threatened species biodiversity targets is Atlantis Sand Fynbos. Two other vegetation types that are conserved as Mountain Catchment Areas (Kogelberg Sandstone Fynbos in the Steenbras Nature Reserve) and National Park (Peninsula Sandstone Fynbos in the Table Mountain National Park), conserve many endemic and threatened species.
Critical Biodiversity Area (CBA) Categories
Table 3 presents the general statistics by CBA map category for the BioNet analysis. For an explanation of categories refer to Table 5. CBAs comprising natural remnants (from good to poor condition) cover 81,398 ha or 33.1% of the city; with CESAs included, this increases to 87,206ha or 35.4% of the city. Some proclaimed nature reserves and unproclaimed conservation areas include portions of irreversibly modified land, which increases the BioNet total area to 36.4% of the city, although these latter areas do not contribute towards meeting biodiversity targets. Sixty percent of the BioNet is conserved, although some of these areas currently have no statutory protection (i.e. Conservation Areas in Table 3). Currently a process is underway to proclaim City-run nature reserves under the National Environmental Management: Protected Areas Act (NEM:PAA 57 of 2003). The 100% irreplaceable, good-fair condition remnants comprise the next highest category of the BioNet (CBA1a&b: 17.4%) followed by CBA1c (1.9%) and areas selected for ecological process biodiversity targets (CBA1e: 6.3%). A significant portion of the BioNet (11.6%) is in poor condition (i.e. CBA1d, CBA2, portions of CESA) and requires ecological restoration in order to promote long-term resilience and conservation of biodiversity.

Biodiversity Network 2016 Analysis
21
Table 2: Results: National Vegetation Type Statistics
These statistics are for the vegetation extent of the major national vegetation types within city only and exclude portions of the vegetation type occurring outside city boundaries. Note that six national vegetation types – marked with “*” are endemic to the city. The azonal ‘beach’ vegetation is included under strandveld.
Vegetation Type
Historic exent (ha)
Current extent (ha)
% Remain-ing from Historic Extent
National Ecosys-tem Target %
Target Area (ha)
Selected in BioNet (PAs/ Conservation Areas/CBA 1&2)
% Target Selected in BioNet
In Proclaimed PAs - In Perpetuity/ For Limited Period (ha)
% Target met in procl-aimed PAs
National Ecosys-tem Status 2012
Status based on area remaining in City City Ecosys-tem Status
SANBI Protection Level
Target + 15%
CR < target
EN < target +15%
VU < 60%
Atlantis Sand Fynbos 25177 14810 58.8 30 7553 10342 137.3 3844 50.9 CR-D1 11330 FALSE FALSE TRUE LT Moderately
Boland Granite Fynbos 9379 5631 60.0 30 2814 4229 150.3 272 9.7 VU 4221 FALSE FALSE FALSE LT Poorly
Cape Estuarine Salt Marshes 201 201 100.0 24 48 197 408.4 197 408.4 LT 78 FALSE FALSE FALSE LT Well
Cape Flats Dune Strandveld - False Bay* 28189 8012 28.4 24 6765 7314 109.5 2866 42.4 EN 10851 FALSE TRUE TRUE EN Poorly
Cape Flats Dune Strandveld - West Coast 12734 10373 81.5 24 3056 7595 248.5 6373 208.5 EN 4966 FALSE FALSE FALSE LT Well
Cape Flats Sand Fynbos* 54335 7303 13.4 30 16300 7302 45.8 1087 6.7 CR 24451 TRUE TRUE TRUE CR Poorly
Cape Lowland Freshwater Wetlands 1656 1122 67.7 24 397 1103 277.6 771 194.0 LT 646 FALSE FALSE FALSE LT Well
Cape Winelands Shale Fynbos 4006 2277 56.8 30 1202 1794 149.3 1281 106.6 VU 1803 FALSE FALSE TRUE VU Well
Elgin Shale Fynbos 841 330 39.3 30 252 328 130.0 324 128.4 CR 379 FALSE TRUE TRUE EN Well
Freshwater Lake 82 82 100.0 24 20 82 416.7 82 416.7 LT 32 FALSE FALSE FALSE LT Well
Hangklip Sand Fynbos 3295 1850 56.2 30 989 1553 157.1 1241 125.5 VU 1483 FALSE FALSE TRUE VU Well
Kogelberg Sandstone Fynbos 9435 9203 97.5 30 2831 8572 304.0 7285 257.3 CR-D1 4246 FALSE FALSE FALSE LT Well
Lourensford Alluvium Fynbos* 3585 239 6.7 30 1076 239 22.2 9 0.8 CR 1613 TRUE TRUE TRUE CR Hardly
Peninsula Granite Fynbos North* 2070 1476 71.3 30 621 1323 213.0 889 143.1 CR 932 FALSE FALSE FALSE LT Well
Peninsula Granite Fynbos South* 7158 2471 34.5 30 2147 2234 104.0 1567 73.0 CR 3221 FALSE TRUE TRUE EN Moderately
Peninsula Sandstone Fynbos* 21936 21043 95.9 30 6581 19950 303.2 15634 237.6 EN-D1 9871 FALSE FALSE FALSE LT Well
Peninsula Shale Fynbos 1263 660 52.3 30 379 657 173.4 571 150.7 LT 568 FALSE FALSE TRUE VU Well
Peninsula Shale Renosterveld* 2384 275 11.6 26 620 275 44.4 268 35.2 CR 978 TRUE TRUE TRUE CR Poorly
Southern Afrotemperate Forest 348 345 99.4 34 118 343 290.3 218 184.5 LT 170 FALSE FALSE FALSE LT Well
Swartland Alluvium Fynbos 1734 56 3.2 30 520 56 10.8 0 0.0 CR 780 TRUE TRUE TRUE CR Not
Swartland Alluvium Renosterveld 61 0 0.0 26 16 0 0.0 0 0.0 VU 25 TRUE TRUE TRUE CR Not
Swartland Granite Renosterveld 7292 1844 25.3 26 1896 1823 97.6 93 4.9 CR 2990 TRUE TRUE TRUE CR Hardly
Swartland Shale Renosterveld 47316 3607 7.6 26 12302 3607 30.0 719 5.8 CR 19399 TRUE TRUE TRUE CR Poorly
Swartland Silcrete Renosterveld 1091 151 13.8 26 284 151 53.2 4 1.4 CR 447 TRUE TRUE TRUE CR Hardly
Western Shaleband Vegetation 317 316 99.7 30 95 314 329.8 232 243.7 LT 143 FALSE FALSE FALSE LT Well

Biodiversity Network 2016 Analysis
22
Figure 8: March 2016 Biodiversity Network for the City of Cape Town Municipal Area

Biodiversity Network 2016 Analysis
23
Table 3: Results: BioNet CBA Category Statistics
BioNet category Natural (ha) Irreversibly
modified (ha)
Total (ha) % of BioNet
Protected: In Perpetuity 41060 2061 43121 48.1
Protected: Not In Perpetuity 4810 85 4895 5.5
Conservation Area 5498 202 5700 6.4
CBA 1a 2931 0 2931 3.3
CBA 1b 12654 0 12654 14.1
CBA 1c 1711 0 1711 1.9
CBA 1d 1971 0 1971 2.2
CBA 1e 5620 0 5620 6.3
CBA 2 5142 0 5142 5.7
CESA 5808 0 5808 6.5
Total 87206 2348 89554 100
In terms of ecological processes, the Marxan analysis selected the larger non-fragmented natural remnants, achieving connectivity where most efficient and meaningful in terms of expert corridors and areas important for climate change resilience. On a scale of 0-60 only 11% of the city has a climate change resilience score of >30, whereas 32% of the BioNet has a score of >30, equating to an area of 27,000 ha (Figure 7) and includes the majority of the high-scoring climate change resilience land in the city. It is anticipated that this area will have higher climate change resilience than the surrounding landscape (Pence 2011). The 1 km-wide core climate change adaptation corridor in the north of the city, which is nested within part of the Dassenberg Coastal Catchment Corridor, was included in its entirety, linking several existing conservation areas to each other and the coast. This is one of the few areas of the city where significant choices can be made without forfeiting biodiversity targets. This important corridor influenced the selections of adjacent planning units for meeting associated vegetation type biodiversity targets as well as buffering the core corridor, the result of which is an effective corridor width of 2 km-wide along most of its length. The BioNet also includes significant areas of potential climate refugia, corresponding with known concentrations of local endemic plant species (Figure 6), where it is postulated that ecological communities are more stable despite past climate change and will be less likely to undergo significant climate-induced changes in future. Some of these areas are embedded in the BioNet and are relatively secure inside the Table Mountain National Park, but in other areas comprise irreplaceable sites requiring urgent conservation and restoration. The City Local Biodiversity Strategy and Action Plan (LBSAP 2016-2026)22 includes a Local Biodiversity Implementation Plan which outlines the conservation implementation priorities for CBA remnants in the BioNet.
CBAs inside and outside of the urban edge
The BioNet lies mainly outside the urban edge with only 15% located inside the urban edge (Table 4). Of the latter, about 5% is protected in perpetuity; and the remainder comprises mostly the 100% irreplaceable vegetation (such as Cape Flats Sand Fynbos) for which thresholds can no longer be met, either in good to fair condition (CBA1b) or poor condition
22 LBSAP www.capetown.gov.za/environment - follow links to Publications > Reports and scientific papers.
Biodiversity Network 2016 Analysis
24
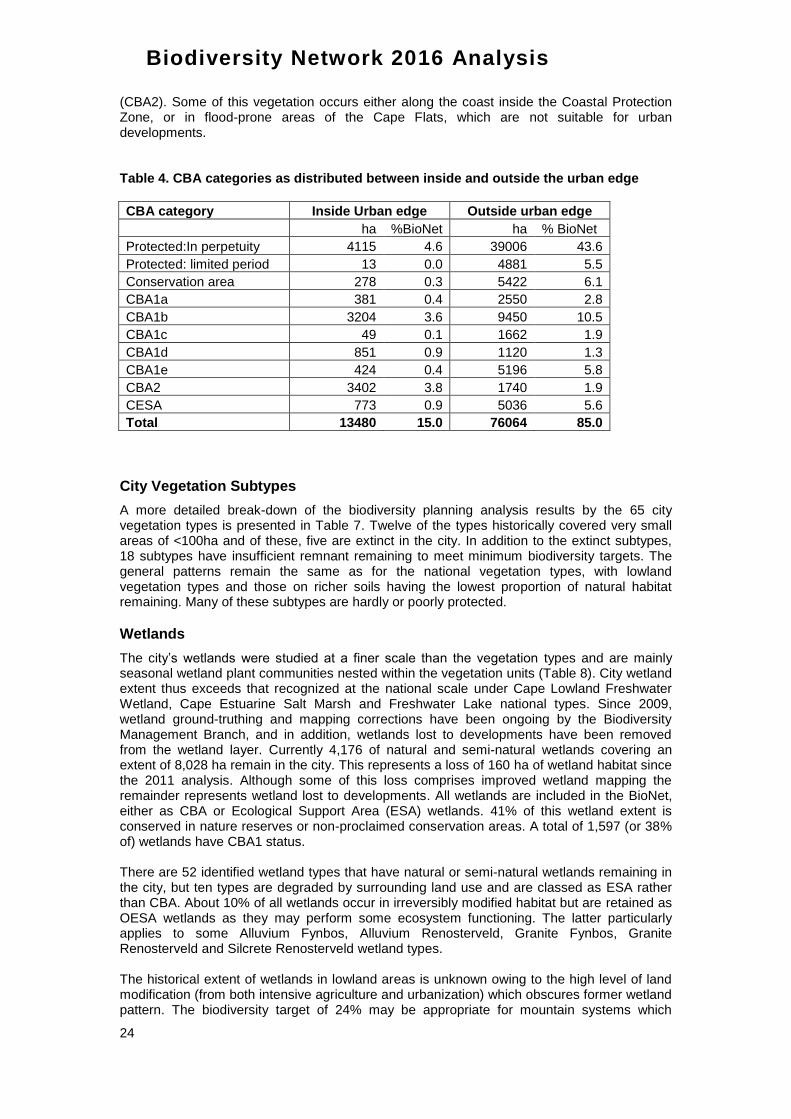
(CBA2). Some of this vegetation occurs either along the coast inside the Coastal Protection Zone, or in flood-prone areas of the Cape Flats, which are not suitable for urban developments. Table 4. CBA categories as distributed between inside and outside the urban edge
CBA category Inside Urban edge Outside urban edge
ha %BioNet ha % BioNet
Protected:In perpetuity 4115 4.6 39006 43.6
Protected: limited period 13 0.0 4881 5.5
Conservation area 278 0.3 5422 6.1
CBA1a 381 0.4 2550 2.8
CBA1b 3204 3.6 9450 10.5
CBA1c 49 0.1 1662 1.9
CBA1d 851 0.9 1120 1.3
CBA1e 424 0.4 5196 5.8
CBA2 3402 3.8 1740 1.9
CESA 773 0.9 5036 5.6
Total 13480 15.0 76064 85.0
City Vegetation Subtypes
A more detailed break-down of the biodiversity planning analysis results by the 65 city vegetation types is presented in Table 7. Twelve of the types historically covered very small areas of <100ha and of these, five are extinct in the city. In addition to the extinct subtypes, 18 subtypes have insufficient remnant remaining to meet minimum biodiversity targets. The general patterns remain the same as for the national vegetation types, with lowland vegetation types and those on richer soils having the lowest proportion of natural habitat remaining. Many of these subtypes are hardly or poorly protected.
Wetlands
The city’s wetlands were studied at a finer scale than the vegetation types and are mainly seasonal wetland plant communities nested within the vegetation units (Table 8). City wetland extent thus exceeds that recognized at the national scale under Cape Lowland Freshwater Wetland, Cape Estuarine Salt Marsh and Freshwater Lake national types. Since 2009, wetland ground-truthing and mapping corrections have been ongoing by the Biodiversity Management Branch, and in addition, wetlands lost to developments have been removed from the wetland layer. Currently 4,176 of natural and semi-natural wetlands covering an extent of 8,028 ha remain in the city. This represents a loss of 160 ha of wetland habitat since the 2011 analysis. Although some of this loss comprises improved wetland mapping the remainder represents wetland lost to developments. All wetlands are included in the BioNet, either as CBA or Ecological Support Area (ESA) wetlands. 41% of this wetland extent is conserved in nature reserves or non-proclaimed conservation areas. A total of 1,597 (or 38% of) wetlands have CBA1 status. There are 52 identified wetland types that have natural or semi-natural wetlands remaining in the city, but ten types are degraded by surrounding land use and are classed as ESA rather than CBA. About 10% of all wetlands occur in irreversibly modified habitat but are retained as OESA wetlands as they may perform some ecosystem functioning. The latter particularly applies to some Alluvium Fynbos, Alluvium Renosterveld, Granite Fynbos, Granite Renosterveld and Silcrete Renosterveld wetland types. The historical extent of wetlands in lowland areas is unknown owing to the high level of land modification (from both intensive agriculture and urbanization) which obscures former wetland pattern. The biodiversity target of 24% may be appropriate for mountain systems which

Biodiversity Network 2016 Analysis
25
remain relatively intact, but in the modified lowlands will underestimate the requirement if based on current wetland extent. Therefore we have assessed whether wetland biodiversity targets are met based only on the CBA wetlands, which remain relatively natural. ESA wetlands are excluded as meeting biodiversity targets, although they may be important for some ecological processes. On this basis, 71% (37) of wetland types have the minimum biodiversity target (by area) selected in the BioNet and the remainder (15) do not. Of the latter, seven have no selected CBA wetlands, as the remaining sites are all in irreversibly modified landscapes (Table 8: Alluvium Fynbos isolated depression, Alluvium Renosterveld valley bottom, Granite Fynbos depression, Granite Renosterveld floodplain, Sand Fynbos isolated depression, Silcrete Renosterveld seep and valley bottom). In general, these wetlands have a lower habitat condition and will be difficult to restore given current land-use. Nineteen wetland types have the minimum biodiversity target met within conservation areas. These comprise mainly the strandveld and sandstone fynbos wetland types. However, Sand Fynbos depression is also well conserved owing to water bodies such as Princessvlei, Rondevlei and Zeekoevlei being included in this type (Table 8). Historically, these vleis would have been seasonal wetlands, but have become permanent water bodies following urban development and altered drainage patterns. This has altered their ecological and biodiversity characteristics.
Biodiversity Network 2016 Analysis
26
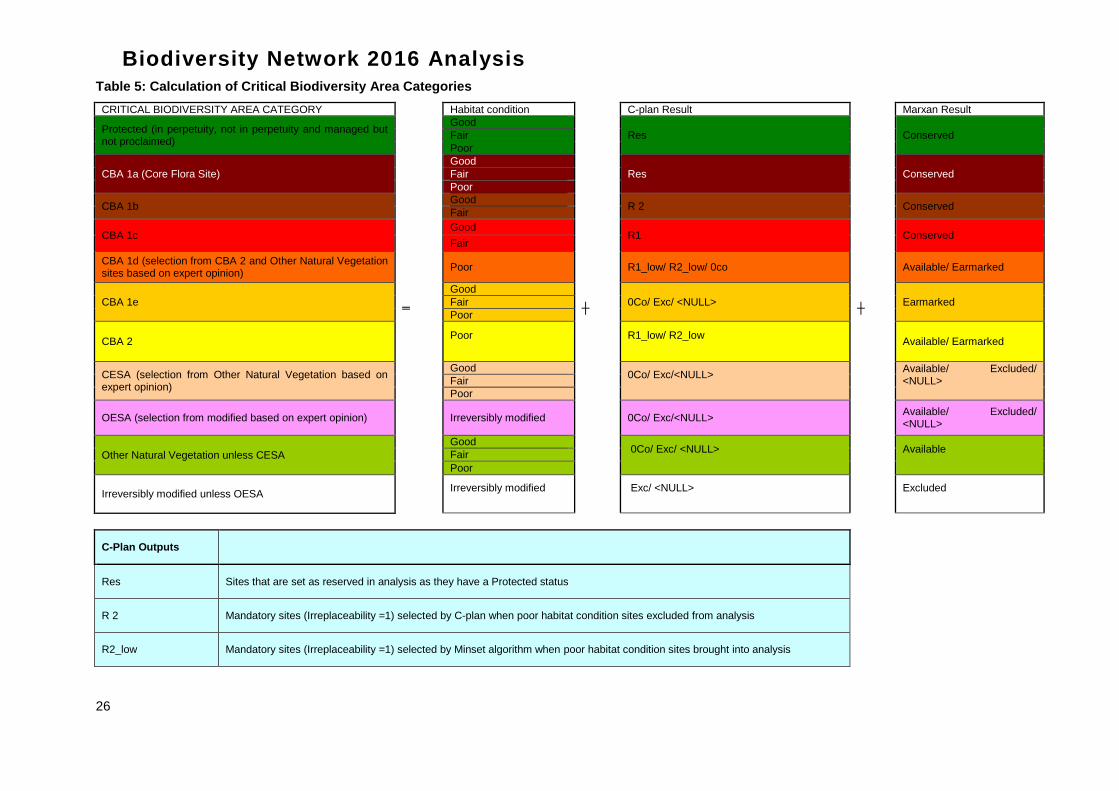
Table 5: Calculation of Critical Biodiversity Area Categories
CRITICAL BIODIVERSITY AREA CATEGORY
═
Habitat condition
┼
C-plan Result
┼
Marxan Result
Protected (in perpetuity, not in perpetuity and managed but not proclaimed)
Good
Res Conserved Fair
Poor
CBA 1a (Core Flora Site)
Good
Res Conserved Fair
Poor
CBA 1b Good
R 2 Conserved Fair
CBA 1c Good
R1 Conserved Fair
CBA 1d (selection from CBA 2 and Other Natural Vegetation sites based on expert opinion)
Poor R1_low/ R2_low/ 0co Available/ Earmarked
CBA 1e
Good
0Co/ Exc/ <NULL> Earmarked Fair
Poor
CBA 2 Poor
R1_low/ R2_low
Available/ Earmarked
CESA (selection from Other Natural Vegetation based on expert opinion)
Good 0Co/ Exc/<NULL>
Available/ Excluded/ <NULL>
Fair
Poor
OESA (selection from modified based on expert opinion) Irreversibly modified 0Co/ Exc/<NULL> Available/ Excluded/ <NULL>
Other Natural Vegetation unless CESA
Good 0Co/ Exc/ <NULL>
Available
Fair
Poor
Irreversibly modified unless OESA Irreversibly modified
Exc/ <NULL>
Excluded
C-Plan Outputs
Res Sites that are set as reserved in analysis as they have a Protected status
R 2 Mandatory sites (Irreplaceability =1) selected by C-plan when poor habitat condition sites excluded from analysis
R2_low Mandatory sites (Irreplaceability =1) selected by Minset algorithm when poor habitat condition sites brought into analysis

Biodiversity Network 2016 Analysis
27
R 1 Negotiable sites selected by C-plan
R1_low Negotiable sites selected by Minset algorithm when poor habitat condition sites brought into analysis
0Co Sites that are not selected by C-plan
Exc Sites that are excluded in C-plan initially due to having either Poor habitat condition or for being irreversibly modified so that better condition sites are considered first
Marxan Outputs
Conserved Sites that are set as reserved in analysis as they have a Protected status or were selected in C-plan as R2 or R1 sites
Earmarked Sites that were earmarked by Marxan
Available Sites that were available for Marxan to choose from but were not earmarked by Marxan
Excluded Sites that were excluded from the analysis as they are irreversibly modified

Biodiversity Network 2016 Analysis
28
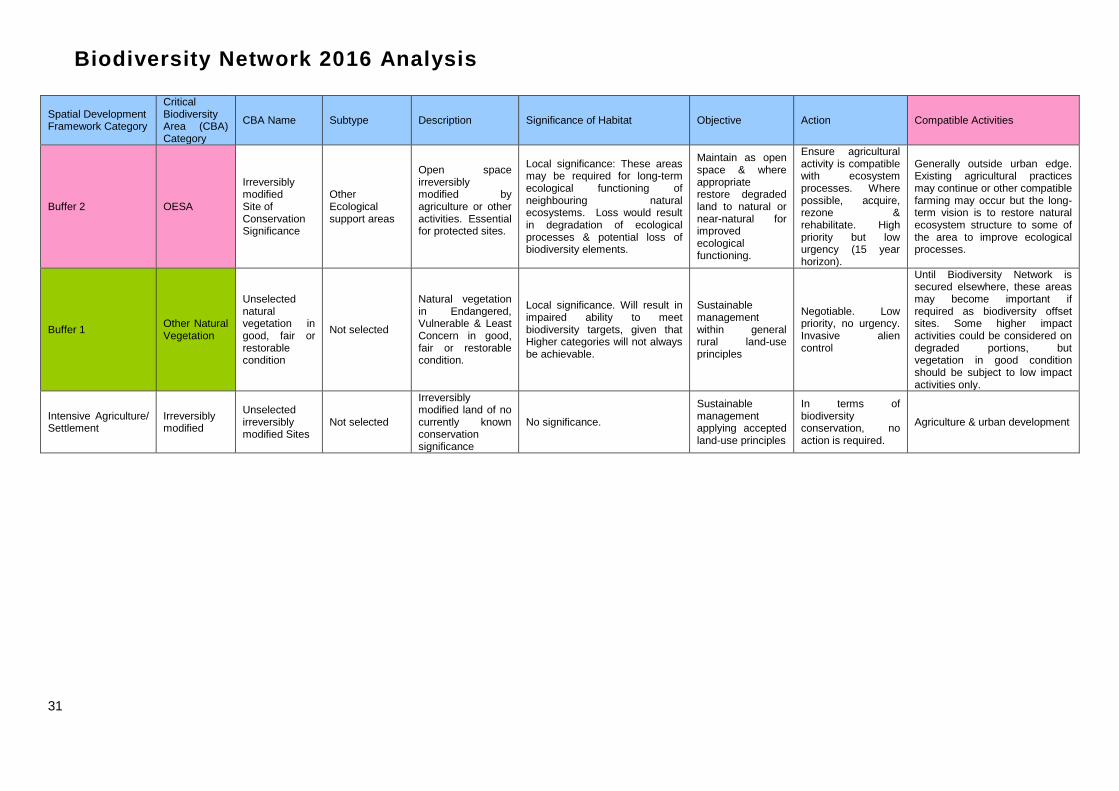
Table 6: CBA: Significance & Descriptions of Permissible Activities
Spatial Development Framework Category
Critical Biodiversity Area (CBA) Category
CBA Name Subtype Description Significance of Habitat Objective Action Compatible Activities
Core 1 Protected: In Perpetuity
Protected: In Perpetuity
National, Provincial, Local
Protected Areas (National, Provincial, Local & Contractual Nature Reserves)
Local, National & International significance: Loss of habitat will probably result in extinction of some species & inability to attain biodiversity targets.
Maintain natural ecosystems, restore degraded land to natural & manage for no further degradation. Ensure site is an asset to the surrounding communities.
Statutory Protected Areas. Ensure management plans are in place, implemented and audited.
Conservation, low impact recreation & environmental education as outlined in the management plan for the site; hard infrastructure should not be situated in critical biodiversity areas, but outside & adjacent to these, or in existing highly degraded areas only.
Core 1 Protected: Not In Perpetuity
Protected: Not In Perpetuity
National, Provincial or Local government land managed but with no status
These areas are currently being managed as part of existing reserves or core flora sites, but have no formal protected area status as yet.
Local, National & International significance: Loss of habitat will probably result in extinction of some species & inability to attain biodiversity targets.
Maintain natural ecosystems, restore degraded land to natural & manage for no further degradation.
Secure formal ecosystem protection level under the Protected Areas Act. Consolidate into existing provincial or local authority reserves where they lie adjacent. Ensure management plans are in place, implemented and audited.
Conservation, low impact recreation & environmental education as outlined in the management plan for the site; hard infrastructure should not be situated in critical biodiversity areas, but outside & adjacent to these, or in existing highly degraded areas only.
Core 1 Conservation Area
Conservation Area
Local or Private areas managed for conservation but without statutory protection
Non- proclaimed local and private conservation areas.
Local, National & International significance: Loss of habitat will probably result in extinction of some species & inability to attain biodiversity targets.
Maintain natural ecosystems, restore degraded land to natural and manage for no further degradation.
Pursue appropriate stewardship conservation status (contractual or biodiversity agreement). Ensure management plans are in place, implemented and audited.
Conservation, low impact recreation & environmental education as outlined in the management plan for the site; hard infrastructure should not be situated in critical biodiversity areas, but outside & adjacent to these, or in existing highly degraded areas only.

Biodiversity Network 2016 Analysis
29
Spatial Development Framework Category
Critical Biodiversity Area (CBA) Category
CBA Name Subtype Description Significance of Habitat Objective Action Compatible Activities
Core 1 CBA 1a Irreplaceable Core Flora sites
Non-protected core flora sites
Core Flora Sites: Irreplaceable sites of historical significance & very high priority
Local, National & International significance: Loss of habitat will probably result in extinction of some species & inability to attain biodiversity targets.
Obtain appropriate formal ecosystem protection level. Maintain natural ecosystems, restore degraded land to natural & manage for no further degradation.
Core Flora sites to be gazetted ASAP - we need action. High priority, very high urgency (immediate). Land owner negotiations. Invasive aliens to be controlled.
Conservation, low impact recreation & environmental education as outlined in the management plan for the site; hard infrastructure should not be situated in critical biodiversity areas, but outside & adjacent to these, or in existing highly degraded areas only.
Core 1 CBA 1b Irreplaceable Good & Fair Condition sites
Irreplaceable sites
Critically Endangered vegetation of Good & Fair quality. Needed for biodiversity targets. Any loss is a permanent & irrevocable loss.
Local, National & International significance: Loss of habitat will probably result in extinction of some species & inability to attain biodiversity targets.
Obtain appropriate ecosystem protection level. Maintain natural ecosystems, restore degraded land to natural & manage for no further degradation.
Needed for biodiversity targets. High priority, very high urgency (immediate). Invasive aliens to be controlled.
Conservation, low impact recreation & environmental education as outlined in the management plan for the site; hard infrastructure should not be situated in critical biodiversity areas, but outside & adjacent to these, or in existing highly degraded areas only.
Core 1 CBA 1c Minset Good & Fair Condition sites
Minset biodiversity Targets
Good & Fair condition vegetation that is selected on the Biodiversity Network for meeting biodiversity targets (C Plan). Loss can be replaced by obtaining specific Unselected Natural Vegetation sites.
Local, National & International significance: Any loss will require specific alternative areas to be targeted for conservation, but these areas have been set as not negotiable so that the alternative sites can be freed up for development. Consequently these are not negotiable unless alternative, equivalent sites not on the Biodiversity Network are secured first.
Obtain appropriate ecosystem protection level. Maintain natural ecosystems, restore degraded land to natural & manage for no further degradation.
Needed for biodiversity targets. High priority, high urgency (5-10 year horizon). Invasive aliens to be controlled.
Conservation, low impact recreation & environmental education as outlined in the management plan for the site; hard infrastructure should not be situated in critical biodiversity areas, but outside & adjacent to these, or in existing highly degraded areas only.
Core 1 CBA 1d Irreplaceable Consolidation sites
Minset biodiversity Targets
Critically Endangered vegetation of poor/ restorable condition. Essential for management consolidation & viability of CBA1a, CBA1b & protected sites.
Local, National & International significance: These areas are required to make existing remnants ecologically viable. Loss would result in higher condition remnants being lost through degradation of ecological processes & exorbitant interventionary ecosystem management costs.
Obtain appropriate ecosystem protection level. Maintain natural ecosystems, restore degraded land to natural & manage for no further degradation.
Needed for biodiversity targets. High priority, high urgency (10 year horizon). Invasive aliens to be controlled.
As above, but higher impact activities (picnic sites, conservation offices, restaurants, EE centres etc) may be situated on highly degraded areas on existing development footprints where this does not impact negatively on ecological processes.

Biodiversity Network 2016 Analysis
30
Spatial Development Framework Category
Critical Biodiversity Area (CBA) Category
CBA Name Subtype Description Significance of Habitat Objective Action Compatible Activities
Core 1 CBA1e Connectivity sites
Marxan & expert corridor
Vegetation that is selected on the Biodiversity Network for connectivity & ecological processes (Marxan)
Local, National & International significance: required to maintain large-scale ecosystem processes, climate change mitigation, animal migration & other long-term, large-scale effects.
As above but with a focus on the maintenance of ecological processes.
Consideration can only be given if suitable alternatives exist. High priority, medium urgency (10-20 year horizon). Invasive aliens to be controlled.
Low impact recreation (hiking, environmental education, bird watching etc); higher impact activities only where environment is suitable (e.g. mountain biking; horse riding on existing roads; boating on vleis etc); hard infrastructure should not be situated in critical biodiversity areas, but outside & adjacent to these, or in existing highly degraded areas on existing development footprints only.
Core 1 CBA 2 Restorable Irreplaceable sites
Irreplaceable poor condition sites
Critically Endangered vegetation of restorable condition. Needed for biodiversity targets but not for management consolidation, connectivity or viability of priority Biodiversity Network sites.
Although irreplaceable these are degraded. Their loss will have Local, National & International significance but low impact on good quality remnants.
Obtain appropriate ecosystem protection level. Maintain natural ecosystems, restore degraded land to natural & manage for no further degradation.
Conserve & restore. Alternatives can be negotiated with the use of compensation for the securing of priority sites. Medium priority, low urgency. Will require a bylaw: High priority, immediate urgency. Invasive aliens to be controlled.
Some higher impact activities (play parks, braai areas, picnic sites, conservation offices, restaurants, EE centres etc) may be situated on the edges of these sites or where the activity does not impact negatively on ecological processes, provided the remainder is restored; resource harvesting may be considered in accordance with the management plan for the site, but under strictly controlled conditions only.
Core 2 CESA
Unselected Natural Vegetation Sites of Conservation Significance
Consolidation & ecological support areas
Unselected areas that are in natural vegetation. Essential ecological support for CBA 1, CBA 2 & protected sites.
Local, national & international significance. Required to make existing remnants ecologically more viable & for larger fauna movement. Loss would result in the remnants or faunal species being lost & exorbitant interventionary ecosystem management costs.
Obtain appropriate formal status, such as open space zoning. Maintain as open space & where appropriate restore degraded land to natural or near-natural for consolidation of other remnants.
Map areas & check zoning is appropriate. Where possible rehabilitate to enhance ecosystem functioning, including invasive alien control.
Activities that do not impinge on ecological functioning & water quality are permissible.
Biodiversity Network 2016 Analysis
31
Spatial Development Framework Category
Critical Biodiversity Area (CBA) Category
CBA Name Subtype Description Significance of Habitat Objective Action Compatible Activities
Buffer 2 OESA
Irreversibly modified Site of Conservation Significance
Other Ecological support areas
Open space irreversibly modified by agriculture or other activities. Essential for protected sites.
Local significance: These areas may be required for long-term ecological functioning of neighbouring natural ecosystems. Loss would result in degradation of ecological processes & potential loss of biodiversity elements.
Maintain as open space & where appropriate restore degraded land to natural or near-natural for improved ecological functioning.
Ensure agricultural activity is compatible with ecosystem processes. Where possible, acquire, rezone & rehabilitate. High priority but low urgency (15 year horizon).
Generally outside urban edge. Existing agricultural practices may continue or other compatible farming may occur but the long-term vision is to restore natural ecosystem structure to some of the area to improve ecological processes.
Buffer 1 Other Natural Vegetation
Unselected natural vegetation in good, fair or restorable condition
Not selected
Natural vegetation in Endangered, Vulnerable & Least Concern in good, fair or restorable condition.
Local significance. Will result in impaired ability to meet biodiversity targets, given that Higher categories will not always be achievable.
Sustainable management within general rural land-use principles
Negotiable. Low priority, no urgency. Invasive alien control
Until Biodiversity Network is secured elsewhere, these areas may become important if required as biodiversity offset sites. Some higher impact activities could be considered on degraded portions, but vegetation in good condition should be subject to low impact activities only.
Intensive Agriculture/ Settlement
Irreversibly modified
Unselected irreversibly modified Sites
Not selected
Irreversibly modified land of no currently known conservation significance
No significance.
Sustainable management applying accepted land-use principles
In terms of biodiversity conservation, no action is required.
Agriculture & urban development

Biodiversity Network 2016 Analysis
32
Table 7: Results: City Vegetation Subtype Statistics
National vegetation type plus subtype Historic exent (ha)
Current extent (ha)
% Remain-ing from Historic Extent
National Ecosys-tem Thresh-old %
Target Area (ha)
Selected in BioNet (PAs/ Conservation Areas/ CBA1&2
% Thresh-old Select-ed in BioNet
In Proclaimed PAs - In Perpetuity/ For Limited Period (ha)
% Target met in procl-aimed PAs
National Ecosys-tem Status 2012
Thres-hold Extent + 15% Historic Exent
Status based on area remaining in City
City Ecosys-tem Status
SANBI Protection Level
CR <thresh-old
EN <thresh-old+15%
VU <60%
Atlantis Sand Fynbos-on marine-derived acid sands 10766 6273 58.3 30 3230 3790 117.3 1216 37.7 CR_D1 4845 FALSE FALSE TRUE LT Poorly
Atlantis Sand Fynbos-on older non-aeolian colluvium 2777 900 32.4 30 833 783 94.1 25 3.0 CR_D1 1250 FALSE TRUE TRUE EN Hardly
Atlantis Sand Fynbos-on recent non-aeolian colluvium 2681 241 9.0 30 804 218 27.2 0.00 0.0 CR_D1 1206 TRUE TRUE TRUE CR Not
Atlantis Sand Fynbos-Strandveld/Fynbos transition (on calcareous/acidic/neutral sands) 8953 7396 82.6 30 2686 5551 206.7 2603 96.9 CR_D1 4029 FALSE FALSE FALSE LT Moderately
Beach (azonal type aligned to CFDS - False Bay) 366 366 100.0 24 110 357 325.4 222 202.6 LT 165 FALSE FALSE FALSE LT Well
Boland Granite Fynbos-on Alluvium 59 26 44.1 30 18 26 149.5 0 2.5 VU 27 FALSE TRUE TRUE EN Hardly
Boland Granite Fynbos-on Brackish 246 0 0.0 30 74 0 0.0 0 0.0 VU 111 TRUE TRUE TRUE CR Not
Boland Granite Fynbos-on Granite 4194 2599 62.0 30 1258 1967 156.3 159 12.6 VU 1887 FALSE FALSE FALSE LT Poorly
Boland Granite Fynbos-on Gravelly clay/ loam soil 14 0.00 0.0 30 4 0 0.0 0 0.0 VU 6 TRUE TRUE TRUE CR Not
Boland Granite Fynbos-on Loam and sandy loam 428 0.00 0.0 30 128 0 0.0 0 0.0 VU 193 TRUE TRUE TRUE CR Not
Boland Granite Fynbos-on older non-aeolian colluvium 180 57 31.6 30 54 57 105.7 0 0.0 VU 81 FALSE TRUE TRUE EN Not
Boland Granite Fynbos-on recent non-aeolian colluvium 4259 2948 69.2 30 1278 2178 170.5 113 8.9 VU 1916 FALSE FALSE FALSE LT Poorly
Cape Estuarine Salt Marshes-Wetlands 201 201 100.0 24 60 201 333.3 197 328.3 LT 90 FALSE FALSE FALSE LT Well
Cape Flats Dune Strandveld - False Bay-on Granite 18 10 58.1 24 5 10 193.6 9 172.3 EN 8 FALSE FALSE TRUE VU Well
Cape Flats Dune Strandveld - False Bay-on Mudstone 9 9 91.7 24 3 9 305.8 0 0.0 EN 4 FALSE FALSE FALSE LT Not
Cape Flats Dune Strandveld - False Bay-on sands 25490 6645 26.1 24 7647 6018 78.7 2319 30.3 EN 11471 FALSE TRUE TRUE EN Poorly
Cape Flats Dune Strandveld - False Bay-on sands over or on limestone 1927 662 34.3 24 578 607 105.0 141 24.5 EN 867 FALSE TRUE TRUE EN Poorly
Cape Flats Dune Strandveld - False Bay-on Sandstone 379 320 84.4 24 114 312 273.7 174 153.4 EN 170 FALSE FALSE FALSE LT Well
Cape Flats Dune Strandveld - West Coast-on recent non-aeolian colluvium 80 7 8.8 24 24 7 29.5 0 0.0 EN 36 TRUE TRUE TRUE CR Not
Cape Flats Dune Strandveld - West Coast-on sands 10082 8324 82.5 24 3025 5946 196.6 5002 165.4 EN 4537 FALSE FALSE FALSE LT Well
Cape Flats Dune Strandveld - West Coast-on sands over or on limestone 2239 1839 82.1 24 672 1559 232.0 1345 200.3 EN 1008 FALSE FALSE FALSE LT Well
Cape Flats Dune Strandveld - West Coast-on Shale 332 203 61.2 24 100 83 83.3 26 25.9 EN 150 FALSE FALSE FALSE LT Poorly
Cape Flats Sand Fynbos-on marine-derived acid sands 49528 6257 12.6 30 14859 6255 42.0 997 6.7 CR 22288 TRUE TRUE TRUE CR Poorly
Cape Flats Sand Fynbos-on older non-aeolian colluvium 4104 910 22.2 30 1231 910 73.9 36 2.9 CR 1847 TRUE TRUE TRUE CR Hardly
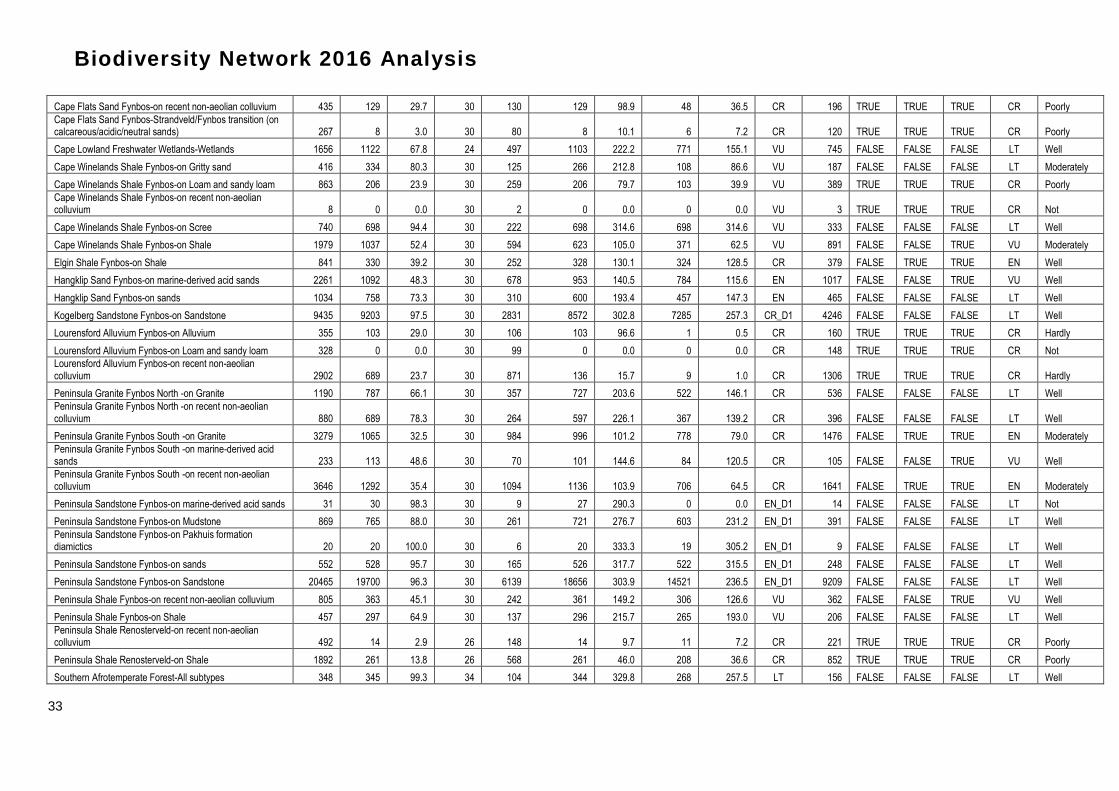
Biodiversity Network 2016 Analysis
33
Cape Flats Sand Fynbos-on recent non-aeolian colluvium 435 129 29.7 30 130 129 98.9 48 36.5 CR 196 TRUE TRUE TRUE CR Poorly
Cape Flats Sand Fynbos-Strandveld/Fynbos transition (on calcareous/acidic/neutral sands) 267 8 3.0 30 80 8 10.1 6 7.2 CR 120 TRUE TRUE TRUE CR Poorly
Cape Lowland Freshwater Wetlands-Wetlands 1656 1122 67.8 24 497 1103 222.2 771 155.1 VU 745 FALSE FALSE FALSE LT Well
Cape Winelands Shale Fynbos-on Gritty sand 416 334 80.3 30 125 266 212.8 108 86.6 VU 187 FALSE FALSE FALSE LT Moderately
Cape Winelands Shale Fynbos-on Loam and sandy loam 863 206 23.9 30 259 206 79.7 103 39.9 VU 389 TRUE TRUE TRUE CR Poorly
Cape Winelands Shale Fynbos-on recent non-aeolian colluvium 8 0 0.0 30 2 0 0.0 0 0.0 VU 3 TRUE TRUE TRUE CR Not
Cape Winelands Shale Fynbos-on Scree 740 698 94.4 30 222 698 314.6 698 314.6 VU 333 FALSE FALSE FALSE LT Well
Cape Winelands Shale Fynbos-on Shale 1979 1037 52.4 30 594 623 105.0 371 62.5 VU 891 FALSE FALSE TRUE VU Moderately
Elgin Shale Fynbos-on Shale 841 330 39.2 30 252 328 130.1 324 128.5 CR 379 FALSE TRUE TRUE EN Well
Hangklip Sand Fynbos-on marine-derived acid sands 2261 1092 48.3 30 678 953 140.5 784 115.6 EN 1017 FALSE FALSE TRUE VU Well
Hangklip Sand Fynbos-on sands 1034 758 73.3 30 310 600 193.4 457 147.3 EN 465 FALSE FALSE FALSE LT Well
Kogelberg Sandstone Fynbos-on Sandstone 9435 9203 97.5 30 2831 8572 302.8 7285 257.3 CR_D1 4246 FALSE FALSE FALSE LT Well
Lourensford Alluvium Fynbos-on Alluvium 355 103 29.0 30 106 103 96.6 1 0.5 CR 160 TRUE TRUE TRUE CR Hardly
Lourensford Alluvium Fynbos-on Loam and sandy loam 328 0 0.0 30 99 0 0.0 0 0.0 CR 148 TRUE TRUE TRUE CR Not
Lourensford Alluvium Fynbos-on recent non-aeolian colluvium 2902 689 23.7 30 871 136 15.7 9 1.0 CR 1306 TRUE TRUE TRUE CR Hardly
Peninsula Granite Fynbos North -on Granite 1190 787 66.1 30 357 727 203.6 522 146.1 CR 536 FALSE FALSE FALSE LT Well
Peninsula Granite Fynbos North -on recent non-aeolian colluvium 880 689 78.3 30 264 597 226.1 367 139.2 CR 396 FALSE FALSE FALSE LT Well
Peninsula Granite Fynbos South -on Granite 3279 1065 32.5 30 984 996 101.2 778 79.0 CR 1476 FALSE TRUE TRUE EN Moderately
Peninsula Granite Fynbos South -on marine-derived acid sands 233 113 48.6 30 70 101 144.6 84 120.5 CR 105 FALSE FALSE TRUE VU Well
Peninsula Granite Fynbos South -on recent non-aeolian colluvium 3646 1292 35.4 30 1094 1136 103.9 706 64.5 CR 1641 FALSE TRUE TRUE EN Moderately
Peninsula Sandstone Fynbos-on marine-derived acid sands 31 30 98.3 30 9 27 290.3 0 0.0 EN_D1 14 FALSE FALSE FALSE LT Not
Peninsula Sandstone Fynbos-on Mudstone 869 765 88.0 30 261 721 276.7 603 231.2 EN_D1 391 FALSE FALSE FALSE LT Well
Peninsula Sandstone Fynbos-on Pakhuis formation diamictics 20 20 100.0 30 6 20 333.3 19 305.2 EN_D1 9 FALSE FALSE FALSE LT Well
Peninsula Sandstone Fynbos-on sands 552 528 95.7 30 165 526 317.7 522 315.5 EN_D1 248 FALSE FALSE FALSE LT Well
Peninsula Sandstone Fynbos-on Sandstone 20465 19700 96.3 30 6139 18656 303.9 14521 236.5 EN_D1 9209 FALSE FALSE FALSE LT Well
Peninsula Shale Fynbos-on recent non-aeolian colluvium 805 363 45.1 30 242 361 149.2 306 126.6 VU 362 FALSE FALSE TRUE VU Well
Peninsula Shale Fynbos-on Shale 457 297 64.9 30 137 296 215.7 265 193.0 VU 206 FALSE FALSE FALSE LT Well
Peninsula Shale Renosterveld-on recent non-aeolian colluvium 492 14 2.9 26 148 14 9.7 11 7.2 CR 221 TRUE TRUE TRUE CR Poorly
Peninsula Shale Renosterveld-on Shale 1892 261 13.8 26 568 261 46.0 208 36.6 CR 852 TRUE TRUE TRUE CR Poorly
Southern Afrotemperate Forest-All subtypes 348 345 99.3 34 104 344 329.8 268 257.5 LT 156 FALSE FALSE FALSE LT Well

Biodiversity Network 2016 Analysis
34
Swartland Alluvium Fynbos-on Malmesbury Sandstone 1734 56 3.2 30 520 56 10.8 0 0.0 CR 780 TRUE TRUE TRUE CR Not
Swartland Alluvium Renosterveld-on recent non-aeolian colluvium 61 0 0.0 26 18 0 0.0 0 0.0 CR 27 TRUE TRUE TRUE CR Not
Swartland Granite Renosterveld-on Granite 5020 1432 28.5 26 1506 1411 95.5 63 4.2 CR 2259 FALSE TRUE TRUE CR Hardly
Swartland Granite Renosterveld-on older non-aeolian colluvium 2111 371 17.6 26 633 371 58.5 0 0.0 CR 950 TRUE TRUE TRUE CR Not
Swartland Granite Renosterveld-on recent non-aeolian colluvium 161 41 25.7 26 48 41 88.8 30 63.2 CR 72 TRUE TRUE TRUE CR Moderately
Swartland Shale Renosterveld-on Loam and sandy loam 712 17 2.4 26 214 17 7.9 10 4.5 CR 321 TRUE TRUE TRUE CR Hardly
Swartland Shale Renosterveld-on recent non-aeolian colluvium 5224 243 4.7 26 1567 243 15.5 32 2.1 CR 2351 FALSE FALSE FALSE CR Hardly
Swartland Shale Renosterveld-on Shale 41379 3346 8.1 26 12414 3346 27.6 677 5.5 CR 18621 TRUE TRUE TRUE CR Poorly
Swartland Silcrete Renosterveld-on recent non-aeolian colluvium 1091 151 13.8 26 327 151 46.2 4 1.3 CR 491 TRUE TRUE TRUE CR Hardly
Western Shaleband Vegetation-on Cedarberg Shale Band 317 316 99.6 30 95 314 330.2 232 243.3 LT 143 FALSE FALSE FALSE LT Well
* (on calcareous/acidic/neutral sands) Note: The vegetation type “Reclaimed” was excluded as little to no vegetation exists there; the “Beach” vegetation type was grouped with “Strandveld” for national type. Wetland types remain the same as for national.

Biodiversity Network 2016 Analysis
35
Table 8: Natural & Semi-Natural Wetland Prioritisation Study Statistics
General statistics from the wetland prioritization study, including only the natural and semi-natural wetlands, where prioritization ranking was performed within each wetland type. CBA = Critical Biodiversity Area; CESA = Critical Ecological Support Area; OESA = Other Ecological Support Area (i.e. irreversibly modified habitat); updated from Snaddon & Day (2009).
Wetland Type Area in proclaimed (In Perpetuity/ Limited Period) P.A.s (ha)
No of proclaimed Wetlands
Area of CBA 1 Wetlands (ha)
No. of CBA 1 Wetlands
Area of CBA 2 Wetlands (ha)
No. of CBA 2 Wetlands
Area of CESA Wetlands (ha
No. of CESA Wetlands
Area of OESA Wetlands (ha)
No. of OESA Wetlands
Total Area of CBA 1, CBA 2, CESA & OESA Wetlands (ha)
Total No. of CBA 1, CBA 2, CESA & OESA Wetlands (ha)
Alluvium fynbos floodplain 0.0 0 2.4 3 0.0 0 0.4 10 0.6 1 3.4 14
Alluvium fynbos isolated depression 0.2 1 0.0 0 0.0 0 0.9 2 0.9 2 1.8 4
Alluvium fynbos isolated seep 2.0 1 2.0 1 0.0 0 12.6 16 0.0 0 14.6 17
Alluvium fynbos seep 13.1 9 11.6 10 0.0 0 64.2 38 0.0 0 75.8 48
Alluvium fynbos valley bottom 0.0 0 38.7 3 2.2 1 2.8 3 0.0 0 43.6 7
Alluvium renosterveld valley bottom 0.0 0 0.0 0 0.0 0 0.7 1 0.0 0 0.7 1
Cape estuarine channel 101.2 12 100.6 10 0.4 1 3.1 3 0.0 0 104.0 14
Cape estuarine depression 130.9 16 130.9 15 0.7 2 1.9 2 0.0 0 133.6 19
Cape river mouth 0.0 0 20.6 4 0.3 1 1.7 2 0.6 1 23.1 8
Dune strandveld depression 46.9 15 35.3 13 11.8 5 13.2 7 15.3 2 75.6 27
Dune strandveld floodplain 307.1 48 193.5 30 488.8 102 51.7 31 4.7 1 738.7 164
Dune strandveld isolated depression 192.0 133 170.9 127 267.1 258 193.6 196 24.2 50 655.7 631
Dune strandveld isolated seep 74.9 38 74.2 27 22.5 21 176.7 67 5.3 9 278.7 124
Dune strandveld seep 70.8 19 81.2 31 0.6 2 0.6 2 1.6 1 84.0 36
Dune strandveld valley bottom 46.1 20 45.0 15 12.8 4 2.0 9 0.8 2 60.6 30
Granite fynbos depression 0.0 0 0.0 0 0.0 0 0.6 2 0.0 0 0.6 2
Granite fynbos floodplain 0.0 0 43.5 3 0.0 0 51.1 25 125.8 4 220.3 32
Granite fynbos isolated 0.3 1 0.3 2 0.0 0 0.6 2 0.3 5 1.1 9

Biodiversity Network 2016 Analysis
36
Wetland Type Area in proclaimed (In Perpetuity/ Limited Period) P.A.s (ha)
No of proclaimed Wetlands
Area of CBA 1 Wetlands (ha)
No. of CBA 1 Wetlands
Area of CBA 2 Wetlands (ha)
No. of CBA 2 Wetlands
Area of CESA Wetlands (ha
No. of CESA Wetlands
Area of OESA Wetlands (ha)
No. of OESA Wetlands
Total Area of CBA 1, CBA 2, CESA & OESA Wetlands (ha)
Total No. of CBA 1, CBA 2, CESA & OESA Wetlands (ha)
depression
Granite fynbos isolated seep 6.9 11 33.2 43 6.5 4 22.7 23 4.2 6 66.6 76
Granite fynbos seep 33.1 35 246.6 122 30.1 49 45.7 27 4.8 2 327.1 200
Granite fynbos valley bottom 24.3 8 74.7 20 1.0 3 49.0 51 1.5 1 126.3 75
Granite renosterveld depression 0.0 0 0.0 0 1.1 1 0.0 0 0.0 0 1.1 1
Granite renosterveld floodplain 0.0 0 0.0 0 0.0 0 0.0 0 1.8 1 1.8 1
Granite renosterveld isolated depression 0.0 0 0.2 1 0.0 0 0.3 1 0.0 0 0.5 2
Granite renosterveld isolated seep 0.0 0 1.7 1 0.0 0 4.1 5 0.4 1 6.2 7
Granite renosterveld seep 0.0 0 0.7 1 8.8 4 42.1 20 0.0 0 51.6 25
Granite renosterveld valley bottom 0.0 0 37.0 4 26.3 2 15.0 14 0.0 0 78.3 20
Sand fynbos depression 522.6 22 160.4 14 57.4 17 357.7 19 5.4 9 581.0 59
Sand fynbos floodplain 405.4 83 488.7 74 39.7 10 228.1 59 4.6 10 761.1 153
Sand fynbos isolated depression 49.9 49 68.0 44 184.5 122 100.9 119 87.4 154 440.7 439
Sand fynbos isolated seep 81.5 40 74.8 36 121.6 64 336.6 173 58.0 48 591.0 321
Sand fynbos non-isolated depression 0.0 0 0.0 0 0.0 0 0.0 0 1.6 2 1.6 2
Sand fynbos seep 4.3 4 15.2 9 85.9 33 87.4 49 19.3 16 207.8 107
Sand fynbos valley bottom 157.6 15 153.2 9 15.4 14 78.4 35 60.6 42 307.6 100
Sandstone fynbos depression 0.0 0 0.0 0 0.0 0 0.0 0 0.4 1 0.4 1
Sandstone fynbos isolated depression 19.7 30 20.4 35 0.0 2 0.2 1 0.1 1 20.7 39
Sandstone fynbos isolated seep 204.2 369 208.8 385 16.6 36 3.6 4 0.0 0 228.9 425
Sandstone fynbos seep 414.8 340 435.3 371 26.2 47 10.3 14 0.8 2 472.7 434
Sandstone fynbos valley bottom 308.4 100 312.1 103 13.0 7 7.4 8 0.2 1 332.7 119
Shale band seep 15.9 1 17.1 5 0.0 0 0.0 0 0.0 0 17.1 5

Biodiversity Network 2016 Analysis
37
Wetland Type Area in proclaimed (In Perpetuity/ Limited Period) P.A.s (ha)
No of proclaimed Wetlands
Area of CBA 1 Wetlands (ha)
No. of CBA 1 Wetlands
Area of CBA 2 Wetlands (ha)
No. of CBA 2 Wetlands
Area of CESA Wetlands (ha
No. of CESA Wetlands
Area of OESA Wetlands (ha)
No. of OESA Wetlands
Total Area of CBA 1, CBA 2, CESA & OESA Wetlands (ha)
Total No. of CBA 1, CBA 2, CESA & OESA Wetlands (ha)
Shale fynbos non-isolated seep 0.2 1 0.2 1 0.0 0 0.0 0 0.0 0 0.2 1
Shale fynbos valley bottom 13.5 5 12.0 4 4.2 4 4.2 1 0.8 2 21.2 11
Shale renosterveld depression 3.3 4 0.0 0 3.1 4 11.9 6 0.7 7 15.8 17
Shale renosterveld floodplain 5.1 2 3.0 1 5.6 3 105.8 21 46.8 10 161.1 35
Shale renosterveld isolated depression 2.0 2 4.2 3 1.8 1 13.9 21 0.0 0 19.9 25
Shale renosterveld isolated seep 18.4 3 16.8 1 17.4 9 87.8 73 0.9 2 122.8 85
Shale renosterveld non-isolated depression 4.7 1 4.7 1 0.0 0 0.0 0 0.0 0 4.7 1
Shale renosterveld seep 1.4 5 12.7 8 26.9 9 166.0 90 15.2 12 220.8 119
Shale renosterveld valley bottom 0.0 0 102.5 6 72.1 8 124.1 58 18.0 5 316.7 77
Slcrete renosterveld isolated seep 0.0 0 0.1 1 0.3 1 1.5 1 0.0 0 1.8 3
Slcrete renosterveld seep 0.0 0 0.0 0 0.0 0 1.0 2 0.0 0 1.0 2
Slcrete renosterveld valley bottom 0.0 0 0.0 0 0.0 0 0.5 1 2.3 1 2.7 2
TOTAL 3282.6 1443 3454.5 1597 1572.7 851 2484.5 1314 515.7 414 8027.4 4176
* Note: historical extent for wetlands is unknown; therefore biodiversity targets are based on current extent. For highly modified environments, such as the Cape Flats, the biodiversity target should be set higher than 24% of current extent as Cape Lowland Freshwater Wetlands are considered Critically Endangered.