the birth of a familiar, everyday map mac benoy folios... · the birth of a familiar, everyday map...
TRANSCRIPT

The Birth of a Familiar, Everyday Map 9
Journal of The Australian and New Zealand Map Society Inc.
THE BIRTH OF A FAMILIAR, EVERYDAY MAP Mac Benoy1
Abstract: The national weather map we view daily in the electronic and print media had a distinct period of birth and development during a 3-5 year period spanning in the early 1880s. The Government Astronomers of the established colonies experimented with the creation of local weather maps based on the real-time data they gathered through their new colonial telegraph systems. With the establishment of a national telegraph system that included the Overland Telegraph, the Astronomers and their meteorological assistants were able to build weather maps that stretched across the Continent and beyond. This article traces the development of the modern weather map as told by the weather folios kept for 31 years by Sir Charles Todd, the Government Astronomer of South Australia. Todd’s folios are possibly unique in Australia for their breadth in both time and content. The early weather maps were one symbol of the rapidity of change brought by new technologies to the Victorian Colonies. Time and geographic boundaries were re-defined as weather maps showed the true continental reach of weather systems and their ability to change on a daily basis. A volunteer group has imaged all 11,000 days of the Todd weather folios. They are now preparing to take the data buried in these folios into the digital age to help establish historical benchmarks for climate change analysis.
here is a national map that many Australians view on a daily basis. A small army of staff work up the daily version of the map and it is served at the end of the news. It is the continental weather map. We give no thought to the assembly of this map, but we expect to have a
meaningful background of pastel colours representing the Australian landforms and the sea. Overlayed on this are numbers showing temperatures and animated graphics showing sunshine, cloud and rain. Underpinning it all are dynamic lines drawn across the continent and adjacent waters showing the high and low pressure systems moving over the States. This way we are given a visual cue of how the weather will affect us in the coming days. One hundred and thirty years ago, Australia’s pioneer meteorologists foresaw this animation of the daily weather map and how it could be used to explain the dynamic nature of the weather to the colonial residents of Australia. Weather ‘systems’ were only just beginning to be understood in the mid-Victorian era of the 1860s. The movement of continent-wide anti-cyclones and smaller cyclones that changed on a daily basis was a revelation which the meteorologists wanted to share with the public. In Adelaide, one man was at the centre of the network that enabled the mapping of these weather systems: Sir Charles Todd, the Government Astronomer for the Territory of South Australia. This article is a story of the early development of weather observation and weather forecasting as told through the incomparable series of 10,000 weather maps drawn by Todd and his staff. The maps are a unique legacy for those of us fortunate enough to have rediscovered and worked with them. The history of observation and forecasting we have derived from these maps is a story of fact and supposition, an insight into the discussion and the development of collegial agreement on how to illustrate weather activity in our corner of the globe in the late nineteenth century. It is also a story of technology, how the binary code of dots and dashes in the Morse code of the national telegraph network enabled the assembly of a daily weather map that covered the seven colonies of
1 Mac Benoy is a retired Information Systems professional. Since 2005 he has been involved with the volunteer group of the Australian Meteorological Association, hosted by the Bureau of Meteorology. He leads a project to salvage old weather records, an increasingly important activity to assist with climate change analysis. Among the documents are thousands of early weather maps that form part of the story of the development of meteorology in Australia. Mac is also a Volunteer Consultant with Australian Red Cross.
T
The Globe, Number 67, 2011
Journal of The Australian and New Zealand Map Society Inc.
10
Australasia. It is a story that laid the foundations of the televised and animated maps we now see nightly after the news. Charles Todd was a nineteenth-century polymath of extraordinary reach. As a young man he arrived in the Territory of South Australia, as the Superintendent of Telegraphs and Government Astronomer, after a career start at Greenwich where he was an early observer of the planet Neptune. When he retired 50 years later in 1905 at the age of 78, he had filled the Colonial positions of Government Astronomer, Postmaster General and Superintendent of Electric Telegraph, and was elected a Fellow of the Royal Meteorological Society and the Society of Electrical Engineers. In addition, Todd is seen by some as one of the founding fathers of both surveying and electrical engineering in Australia. Todd was the first to display electric light in South Australia, and he played important parts in wireless telegraphy and in standardising time zones in Australia (Edwards 1993, 352-3). The position of Government Astronomer was a curious one by modern standards. Most colonies carried the position and one can only presume what was the full range of functions of the Colonial Astronomical Observatory. Press articles of the day emphasised the activity of astronomy, with a connection to the dropping of the time ball (or sometimes cannon-shot) which was used to set the ship-board chronometers so important to navigation. The calculation of longitude was based on the positions of the sun and moon at the precise time of the day, thus, accurate time was essential to effective and safe navigation. However, there are also references to other physical sciences being under the aegis of the Observatory. These include geodetic surveying, magnetic research, electricity, heat, light and optics. Interestingly, the Government Astronomers of the Australian colonies also became our pioneer meteorologists. One could perhaps see a discussion develop among colonial citizens where there was less interest in the safety of marine navigation than the daily weather activities that affected their livelihoods – in agriculture, transport and other endeavours. It would have been natural for influence to be applied to astronomers to observe weather rather than the stars, “We can see the stars for ourselves, but we want to know more about the weather!” But, in the next step, the citizens would argue that weather observation, a backward-looking enterprise, was telling them what they had already experienced yesterday. What they wanted to know was “What will the weather be tomorrow, and the next day, and the next…” Thus, from roughly 1850 to 1890, Government Astronomers moved from watching the sky to observing and documenting the weather before making the final leap of forecasting the weather. In Europe, the same process led to regular weather forecasting by 1860 (Anderson 2005, 2).
THE 19TH CENTURY INTERNET GIVES BIRTH TO WEATHER CARTOGRAPHY The development of a network of observers whose data eventually led to weather forecasting was only made possible by the growth of telecommunications via the telegraph. One can map the birth and growth of modern meteorology with the spread of telegraphic links across countries and continents. Jan Golinski (2007, 210) expressed this well in his book British Weather and the Climate of Enlightenment:
In the course of the nineteenth century, large scale movements of the air were mapped with considerable success. Storm systems, anticyclones, and (in the early twentieth century) weather fronts came to be identified, their motions charted and eventually predicted. These developments depended on the crucial technology of the telegraph, and later on wireless communication, which allowed for rapid collection of simultaneous observations from dispersed points. It was only possible to begin to map such weather phenomenon when human messages could travel more rapidly than air itself. A series of visual techniques was then developed to trace on paper the motions of air masses shortly after they had occurred, and eventually to offer predictions of how

The Birth of a Familiar, Everyday Map 11
Journal of The Australian and New Zealand Map Society Inc.
they would behave in the coming hours. At the beginning of the nineteenth century, this was simply inconceivable. For all that they sought to collect observations, from dispersed sites, meteorologists of that era had little idea of the spatial scale of the phenomenon they were searching for. And as regards the dimension of time, their attention was focussed on changes measured in days, months or seasons rather than hours. Only in the 1850s, with the establishment of telegraphic networks to convey weather information, did meteorologists begin to consider the events happening on a much shorter timescale across a much larger expanse of geographical space.
Todd expressed these thoughts contemporaneously and extended them to forecasting in his paper Meteorological Work in Australia: A Review delivered at an 1893 conference:
[By 1860 t]he investigation of the law of storms, by Buys Ballot, Dove, and others, and the researches of Ferrel, then just commenced, on the theory of atmospheric motions, cleared the way to further advances; and, later on, the utilisation of the electric telegraph, which is to the meteorologist what the telescope is to the astronomer, in extending his field of view over large areas of the earth’s surface, enabled the observer to mark and watch the birthplace of storms, track their course and rate of translation. The same means informed him of the general distribution of pressure, and, knowing the laws governing the circulation of air currents round regions of high and low barometers, he soon felt himself justified in issuing warnings of coming gales and the probable state of the weather some hours in advance. He was no longer confined to his own particular locality, laboriously compiling statistics and studying local prognostics; he could look far around him, see storms a thousand or more miles distant, and tell people with a considerable amount of confidence when they might be expected and what would be their force. (Todd 1894, 252-3)
The seismic shifts in thinking about the spatial and time dimensions of weather are clearly shown in the first continental weather maps which Charles Todd configured in the early 1880s. Not only did these maps cover continental Australia, a landmass as large as greater Europe or the lower 48 States of the continental American union, but the weather systems were charted across Tasmania, New Zealand and many sections of the adjacent seas. The geographic breadth of these maps would have been beyond the comprehension of the mid-nineteenth century residents of the seven colonies. The distance from Perth to Auckland is 5300 kilometres, not much less than London to Kabul, an incomprehensible distance to citizens of Europe of the time. But this audacity of distance was amplified as the large continental maps were overlayed daily by weather data drawn from the time-synchronised observations of dozens of observers made possible by the new telegraph systems. Both the space and time dimensions of the weather systems were revolutionary in mid-Victorian times. Today, we can see this revolution unfold in the daily weather maps drawn by Todd and his staff from 1879 to 1909. Todd’s ability to draw these maps was intimately entwined with his best known accomplishment. He was the leading pioneer of the telegraph in the Australian colonies and he is best known for the conception and project management of Australia’s largest, continental-scale, engineering project of the nineteenth century, the Overland Telegraph. It connected Australia electrically to the rest of the world. Less known is the fact that he was also a key driver in connecting New South Wales, Victoria and Western Australia with South Australia into a continental telegraphic network. By completing the last link, the Overland, Todd ‘filled in’ a blank section of the continent that ran south to north from the Southern Ocean through the “dead heart” to the Timor Sea. It is at this point that we may divert, for a moment, from the weather theme of this article to consider recognition for Todd as our internet pioneer. The telegraph was a digital system of dots and dashes and, as the force behind connecting the Colonies to each other and then the rest of the technological world of Europe and America, Todd created Australia’s first digital, electronic internet (even if it did cost £1 a word in its early days! (e.g. see Sydney Morning Herald 1873, 12). As our contemporary version of the internet has recently changed our conception of space and time, so did the telegraph
The Globe, Number 67, 2011
Journal of The Australian and New Zealand Map Society Inc.
12
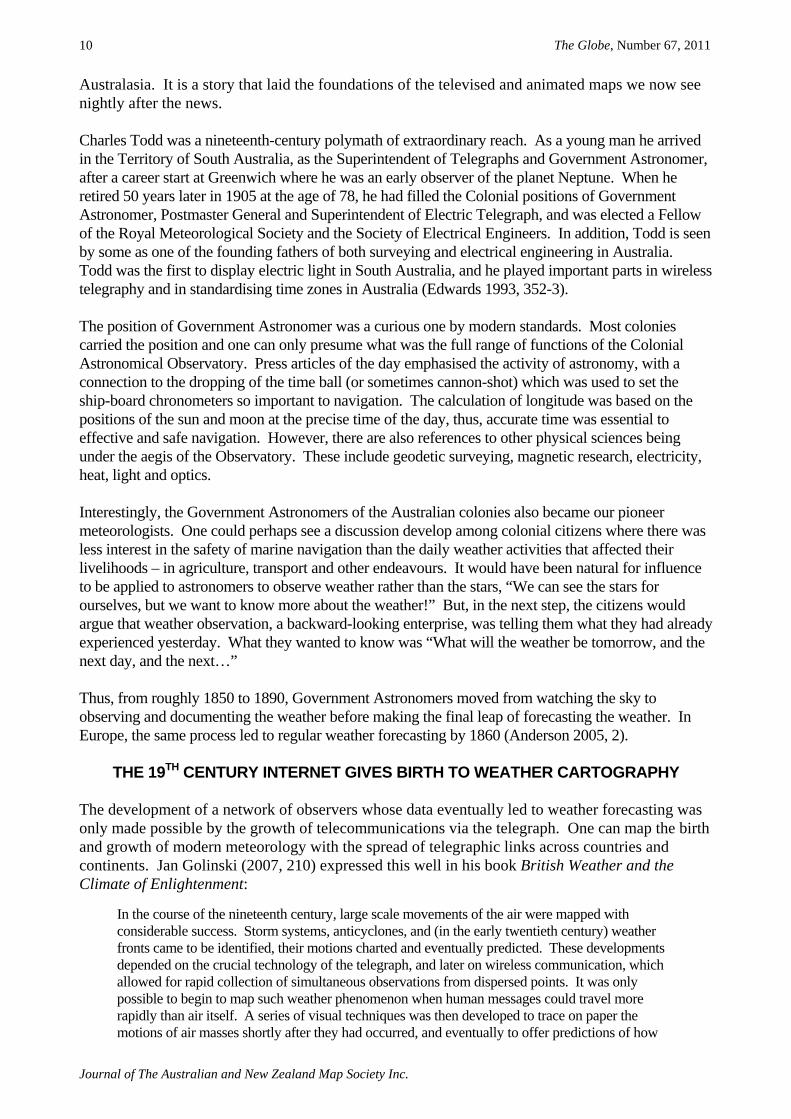
change the settlers’ notion of their spatial and temporal dimensions 150 years ago. The telegraph and the internet are the bookends of our electronic world. Another piece of the jigsaw that put Todd in the driver’s seat as the pioneer of continental weather observation was his appointment as Postmaster General to the Colony. With his interest in documenting weather activity, Todd trained not only his telegraph operators but also his postmasters as weather observers. These observers provided valuable data points that, in combination with telegraphed observations from the other colonies (including New Zealand), allowed Todd to ‘join the dots’ and draw the all-important isobars that showed the development and progress of weather activity across a large part of the Southern Hemisphere. The lynchpin was the observations along the Overland Telegraph which allowed a guess to be made on connecting isobaric readings in Queensland via the same readings on the Overland, on through to the readings on the south and west coast of South and Western Australia. Todd’s early maps are full of these continuous lines that join vast geographic distances. In places they are solid lines, and in places they are dashed, showing the range from certainty to speculation on the part of Todd and his staff. Dashed isobaric lines are especially evident where isobars are drawn from New South Wales and Queensland to the west coast of New Zealand across the Tasman Sea (Fig. 1.) as there were no reassuring readings coming from a mid-ocean equivalent to the Overland Telegraph.
Figure 1. Continuous and dashed isobaric lines indicate the levels of confidence and speculation of the meteorologist. Sat. 10 Nov. 1883.
Assisting the claim that Todd was the father of continental weather observation is a report by Ernest Cooke, Todd’s equivalent in Western Australia in a paper to the Eighth International Geographic Congress of 1904 in Washington. Cooke had worked for Todd for many years before his appointment in the west. He indicated in his paper that Todd was the first person of note to theorise that weather systems in Australia generally proceeded from west to east.
The colonization of Australia practically started from Sydney, on the eastern coast, extending down to Melbourne, then round to Adelaide, and quite recently to Perth, on the west coast.
The Birth of a Familiar, Everyday Map 13
Journal of The Australian and New Zealand Map Society Inc.
It was perhaps but natural that people should imagine the weather followed the same law, and it was certainly the prevalent belief in South Australia some thirty years ago that all weather changes were experienced first on the east coast, next at Melbourne, then at Adelaide, and we may suppose that those who troubled any further about the matter would add, finally at Perth, on the west coast. Sir Charles Todd, who has done so much for Australian meteorology, was the first, I believe, to point out that exactly the reverse process was taking place; that in fact weather movements had a general easterly trend throughout the southern portions of Australia. (Cooke 1905, 386)
It is strange that this notion of weather proceeding from east to west should have ever been held. After all, weather in the mid-latitudes of the Northern Hemisphere, which would have been familiar to the scientific community of the day, proceeds from west to east. Perhaps the converse view sprung from the notion that since the eastern colonies were more significant, they would get the weather first! More probably it may have been the result of winds circulating around high pressure regions in a clockwise direction in the northern hemisphere and anti-clockwise in the southern (and vice versa for low pressure areas). For whatever reason, this notion was firmly put to rest with Todd’s daily weather maps covering all Colonies and in our modern age, as part of the evening news, we see these weather systems march from the left to right on our television screens.
THE FULL TODD WEATHER COLLECTION The Todd weather journals covering the years 1879 to 1909 consist not only of the daily weather maps (except for Sunday), but also include clippings from newspapers detailing weather statistics and events for all the eastern colonies. Newspapers from Brisbane, Sydney, Melbourne and Adelaide were collected as they came off the inter-colonial trains and were processed for pasting up next to the corresponding weather chart. The whole was then bound into roughly six-month folios, 63 of which cover the entire period. Here we have the 10,000 continental weather maps along with 750 rainfall maps for South Australia, roughly 10 million printed words of news text and innumerable handwritten observations and correspondences about the weather. Amongst this collection are:
Tables of meteorological observations for SA, Vic, NSW and Qld Rainfall listings for SA, Vic and NSW Weather experienced by shipping (the lifeline to the rest of the world) Ships’ logs with detailed weather observations River levels for SA, Vic and NSW Articles on the all-important nexus of the weather and farming Telegrams about the weather Thousands of isobaric readings for Hong Kong, Singapore and Batavia South Australia’s first known experimental weather forecast Notes from the Observatory.
Together, this collection is an incomparable report of weather and its effects on the citizens of eastern and southern Australia. A contemporary account of this collection-in-progress is contained in the Brisbane Courier of 2 January 1886.
In order that all information possible relative to Australian meteorology may be obtained it is one person’s duty to find, cut out, and insert in a book kept for the purpose, any paragraphs from newspapers bearing on the subject, such as the daily weather report from the Brisbane Courier and South Australian Register, the charts in the Melbourne Argus and S.M. Herald, and any meteorological notice that may be in any paper either from country stations or from any ship within a reasonable distance of Australia. Thus each page of the book is a journal of meteorological interest for that day available for immediate reference. Scattered over the colony are 280 rain-gauge stations; of these some fifteen are fully equipped with barometer, &c., and observations are taken at 9 a.m., noon, 3 p.m., 6 p.m., and 9 p.m.; but of these fifteen there are six
The Globe, Number 67, 2011
Journal of The Australian and New Zealand Map Society Inc.
14
that take observations every three hours night and day. All observers are properly trained personally at the central office before being sent to out-stations. (Thorpe 1886, 6)
With reference to the maps, the article relates:
The 9 a.m. weather reports are received daily from all telegraph stations in the colony, fully equipped stations forwarding all readings in what may be termed the “raw” state, all the necessary corrections being applied at the Observatory. Reports then come in cipher from Western Australia, Victoria and Tasmania, New South Wales and New Zealand, and Queensland, and when all have been deciphered and corrected a series of maps is made and exhibited, for the information of the public, at the central office. (Thorpe 1886, 6)
As indicated earlier, the maps were proof that weather generally proceeded from west to east. This was on show at the GPO in Adelaide as Todd and his staff composed a daily
map of Australia, showing by isobars the pressure of air over the continent. Six of these maps are always on view; that exposed on the 1st of the month being withdrawn when the one for the 7th is placed in position. Thus the weather of to-day can be compared at a glance with that of the previous five days, the latest map being on the right hand side (Thorpe 1886, 6, col.5) By this means the progress of the storm areas from west to east along the Australian coast can be watched. (Thorpe 1886, 6)
One can only imagine the weather-tragics of the day gathering to examine the six maps and trace the changes of isobars as they denoted the progress of weather systems across a vast area of their home continent. If this expectation of our early meteorologists was a touch ambitious, 150 years later, with today’s computer technology we can truly fulfil their desire to educate the citizenry. Using the digitised images of a sequential run of Todd’s daily maps, then animating them using slideshow software, showing each map half a second apart, an unmistakable pattern is created of fronts appearing off the south west coast of the continent progressing through the Bight and on to the east coast and New Zealand (Benoy 2010). This is the Victorian era equivalent of flipping through a series of static pictures to simulate motion, called in its day a ‘kinetograph’.
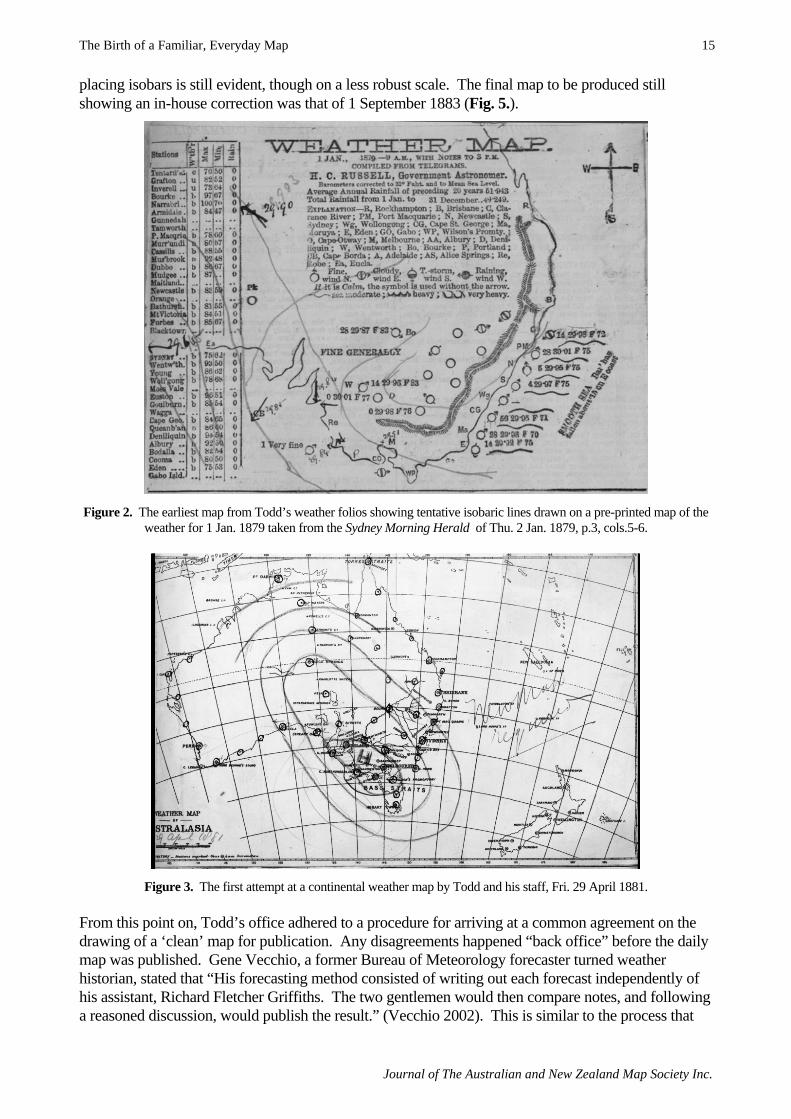
SEMINAL WEATHER MAPS IN A SERIES OF TEN THOUSAND The earliest map showing isobars in Todd’s folios is a scrappy clipping, from the Sydney Morning Herald, showing the weather map for south-eastern Australia with printed weather observations for 1 January 1879 (Fig. 2.). Over it, Todd (or one of his staff) has drawn isobars in pencil. We can only guess on what basis they decided the curve of the isobars. These regional maps continued until 29 April 1881 at the exact time of the inter-colonial weather conference when the first attempt at a full continental map was drawn in South Australia (Fig. 3.). Todd’s office took to heart the recommendation of the Conference to draw isobaric maps. They produced their first documented attempt at a map with isobars within days of the Conference session. Following this map was an 18-month period that can best be characterised as ‘development’. Scanning through the folio, the reader notes that maps are drawn and re-drawn as discussions ensued in the Government Astronomer’s office, showing individual inferences of where isobaric lines should be drawn. This ‘discussion’ reached its height in the map of 26 February 1883 (Fig. 4.) which is especially scruffy and almost speaks of heated disagreement among the meteorologists of the day. Further perusal of the maps shows the development of a more professional approach to the activity of weather mapping. The first pre-printed colour maps appeared on 21 March 1883. Disagreement on
The Birth of a Familiar, Everyday Map 15
Journal of The Australian and New Zealand Map Society Inc.
placing isobars is still evident, though on a less robust scale. The final map to be produced still showing an in-house correction was that of 1 September 1883 (Fig. 5.).
Figure 2. The earliest map from Todd’s weather folios showing tentative isobaric lines drawn on a pre-printed map of the weather for 1 Jan. 1879 taken from the Sydney Morning Herald of Thu. 2 Jan. 1879, p.3, cols.5-6.
Figure 3. The first attempt at a continental weather map by Todd and his staff, Fri. 29 April 1881. From this point on, Todd’s office adhered to a procedure for arriving at a common agreement on the drawing of a ‘clean’ map for publication. Any disagreements happened “back office” before the daily map was published. Gene Vecchio, a former Bureau of Meteorology forecaster turned weather historian, stated that “His forecasting method consisted of writing out each forecast independently of his assistant, Richard Fletcher Griffiths. The two gentlemen would then compare notes, and following a reasoned discussion, would publish the result.” (Vecchio 2002). This is similar to the process that

The Globe, Number 67, 2011
Journal of The Australian and New Zealand Map Society Inc.
16
still prevails today within the Bureau of Meteorology. Even with modern science and its sophisticated weather models, final representation of the weather map is partly the result of human interpretation.
Figure 4. A classic example of a ‘map in progress’ showing the sketchy nature of the early continental weather maps. Mon. 26 Feb. 1883.
Figure 5. The last map to show disagreement or re-work (in west-central WA), Sat. 1 Sept. 1883, acting as the bookend for the development period that started 29 months earlier.
The telegraph was the contemporary high technology that enabled the collection and reporting of weather observations during Todd’s era. Not so sophisticated, however, was the process of

The Birth of a Familiar, Everyday Map 17
Journal of The Australian and New Zealand Map Society Inc.
transferring the observations to a map where pens or pencils were used for isobaric lines, pencil shading for clouds and colouring pencils for rainfall. See the first and only rainfall map for Australia, drawn in the Adelaide offices on 1 August 1890 (Fig. 6.), closely followed by the first rainfall map for South Australia drawn 29 September 1890 (Fig. 7.). We might be tempted to believe that Todd and his staff raided their children’s box of colouring pencils to complete the maps. However, even in the modern day, although computers could replace hand drawn maps, the use of pencils at the Bureau of Meteorology continues as manually produced maps still assist forecasters to understand subtle weather patterns not easily depicted by an automated process.
Figure 6. The only continental rainfall map included in the Todd weather folios. Fri. 1 Aug. 1890.
Figure 7. The first rainfall map for South Australia, created for Mon. 29 Sept. 1890.
The Globe, Number 67, 2011
Journal of The Australian and New Zealand Map Society Inc.
18
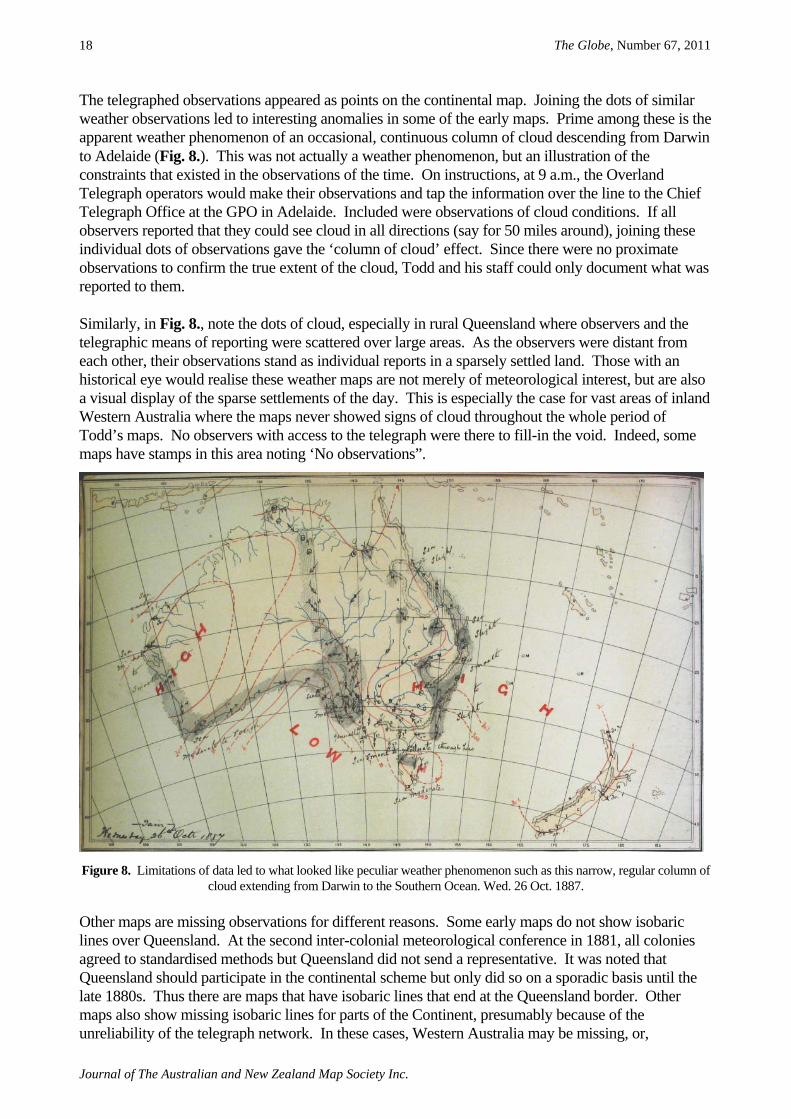
The telegraphed observations appeared as points on the continental map. Joining the dots of similar weather observations led to interesting anomalies in some of the early maps. Prime among these is the apparent weather phenomenon of an occasional, continuous column of cloud descending from Darwin to Adelaide (Fig. 8.). This was not actually a weather phenomenon, but an illustration of the constraints that existed in the observations of the time. On instructions, at 9 a.m., the Overland Telegraph operators would make their observations and tap the information over the line to the Chief Telegraph Office at the GPO in Adelaide. Included were observations of cloud conditions. If all observers reported that they could see cloud in all directions (say for 50 miles around), joining these individual dots of observations gave the ‘column of cloud’ effect. Since there were no proximate observations to confirm the true extent of the cloud, Todd and his staff could only document what was reported to them. Similarly, in Fig. 8., note the dots of cloud, especially in rural Queensland where observers and the telegraphic means of reporting were scattered over large areas. As the observers were distant from each other, their observations stand as individual reports in a sparsely settled land. Those with an historical eye would realise these weather maps are not merely of meteorological interest, but are also a visual display of the sparse settlements of the day. This is especially the case for vast areas of inland Western Australia where the maps never showed signs of cloud throughout the whole period of Todd’s maps. No observers with access to the telegraph were there to fill-in the void. Indeed, some maps have stamps in this area noting ‘No observations”.
Figure 8. Limitations of data led to what looked like peculiar weather phenomenon such as this narrow, regular column of cloud extending from Darwin to the Southern Ocean. Wed. 26 Oct. 1887.
Other maps are missing observations for different reasons. Some early maps do not show isobaric lines over Queensland. At the second inter-colonial meteorological conference in 1881, all colonies agreed to standardised methods but Queensland did not send a representative. It was noted that Queensland should participate in the continental scheme but only did so on a sporadic basis until the late 1880s. Thus there are maps that have isobaric lines that end at the Queensland border. Other maps also show missing isobaric lines for parts of the Continent, presumably because of the unreliability of the telegraph network. In these cases, Western Australia may be missing, or,

The Birth of a Familiar, Everyday Map 19
Journal of The Australian and New Zealand Map Society Inc.
frequently, isobars for New Zealand will be absent. For those studying the telegraph, these maps may be indications that the telegraphic system was inoperable at the time the observations were due to be reported. There is one forlorn map during a Christmas period that shows isobars for South Australia alone. An interesting footnote for South Australians was the first in-house attempt at a weather forecast included in Todd’s journal on 20 March 1884. With a heading of copperplate handwriting, a small map is appended showing a division of the State into forecasting zones (Fig. 9.). Weather enthusiasts in the State will recognise the similarity to our modern weather zones. One hundred and thirty years ago, Todd’s office had settled on the division of the Colony into these natural weather regions. The first public weather forecast was not published until 15 November 1888 and arrived in the daily paper without fanfare along with the weather observations for the previous day which had been the standard fare up to that point. Todd was late in acceding to demands for a forecast. The Colony of Victoria had started forecasting considerably earlier but Todd’s assistant Ernest Cooke (1885, 70) stated that Victoria benefited from a longer warning time of weather systems moving through the Bight. In South Australia, however, not only was the warning time shorter, but the behaviour of storms as they entered and passed through the Bight was not well understood. Thus, with less timely and reliable information, forecasting in South Australia was a dubious activity.
Figure 9. The map accompanying the first recorded attempt at a weather forecast in Adelaide on Thu. 20 March 1884 showing forecasting zones for the colony familiar to contemporary citizens of the State.
Though it is not within the scope of this paper, a brief reference should be made to the extensive text that accompanied the 11,000 weather maps in the folios. Most comprise clippings of newsprint and tell the story of the weather during this period. Here are noted the effects of weather on a generation of settlers. For instance, weather in the Brisbane area during the first three years of the 1890s expressed itself in three devastating floods, all of which are extensively documented by news clippings in Todd’s journals. Some of these have echoes in modern accounts of floods. Suburbs that were flooded in February 1893 again appeared in accounts of floods in Brisbane of May 2009. With no radio or television to supplement the newspaper reports, journalists of the day had a turn of phrase never seen in today’s press. For instance, the following clipping from a South Australian newspaper takes the reader right up to the storm front:

The Globe, Number 67, 2011
Journal of The Australian and New Zealand Map Society Inc.
20
At about 3 o’clock in the afternoon a sudden change came over the sky, black clouds gathered in the north, and lightning flashed vividly at short intervals, accompanied by tremendous claps of thunder. After a few volleys of this firmamental artillery a large cloud was seen coming down from the direction of Sterling North, and its approach was heralded by a strange noise similar to the distant roar of a stormy sea. The sound grew nearer and nearer, till the hailstones reached the ground at Baroota, sweeping Messrs. Wood &. Gartrell’s crop of wheat and effectually reaping it. The hailstorm madly rushed on, sweeping the crop of Captain Mortess, of Telowie, destroying 200 acres, which was yielding 10 bushels to the acre. It then continued its mad career, making its way across by Newbold’s and the Messrs. Holman Bros., but I have not heard how they were affected. Fortunately the course of the storm was checked by the Flinders range, whose grim cliffs and rocky declivities were proof against the utmost violence of the unwelcome invader. (South Australian Advertiser 1883, 5)
HISTORY’S PLACE IN THE FUTURE
This article has used the Todd journals to trace an historical story, the early steps leading to modern meteorology in Australia. However, the journals are now set to play their part in the future of weather forecasting. An ingredient in effective climate change analysis is the historical and paleo-climatic record. A comprehensive back-catalogue of weather information is essential in setting the benchmark for determining the degree and significance of recent and future change. Building this climate record is a detailed and painstaking activity. It involves the discovery, assessment and digitisation of millions of points of weather data, a treasure hunt of global proportions. There are a number of international initiatives involved in the hunt. A significant one is ACRE (Atmospheric Circulation Reconstruction over the Earth) led by Dr. Rob Allan, an Australian working at the Climate Monitoring and Attribution Group, Meteorology Office Hadley Centre, UK. ACRE exists to
… facilitate the recovery of historical instrumental surface terrestrial and marine global weather observations to underpin weather reconstructions (reanalyses) spanning the last 200-250 years for climate applications and impacts needs worldwide. (ACRE n.d.)
In essence, it is the gathering of data to fuel a weather ‘backcasting’ model extending back to 1750. The Todd journals contain data of value to this initiative, data that is no longer available through other records. In many cases, the original journals containing the data recorded by weather observers are no longer in existence or are irretrievably lost, which gives significance to their recording in Todd’s weather maps and ancillary documents. The first part of the salvage operation is nearing completion. A team of nine volunteers of the Australian Meteorological Association (AMetA), hosted by the Bureau of Meteorology, has digitally imaged the full 31 year run of Todd’s weather maps and accompanying text. The volunteers are currently completing the clean-up phase of the project, preparing the digital images for handover to the National Archives for inclusion in the Australian Digital Heritage collection. Once completed, there will be quick and concurrent access to over 20,000 high quality images without disturbing the original documents, which are in a fragile state. Three key concerns have driven the project - to make this historical archive discoverable, accessible, and future-proofed. In an electronic format on the internet, discoverability and accessibility will be greatly enhanced. With National Archives agreement to store the images, future-proofing the technology is assured. Following the completion of the current phase, there will be two new initiatives. The first is to continue the digital imaging of Bureau of Meteorology weather maps up to the Second World War.
The Birth of a Familiar, Everyday Map 21
Journal of The Australian and New Zealand Map Society Inc.
These maps again exist only in paper form and are effectively locked away from use by today’s generation of online weather researchers. The volunteer group have recently acquired more sophisticated photographic equipment to capture the more than 40,000 images and their accompanying text. The aim will be to make the complete set of maps and text from 1879 to 1939 available on the Internet. This would create a unique online resource. The second initiative aims to identify and digitise the data recorded in the Todd journals that would prove useful in the weather ‘backcasting’ model assisted by ACRE. These are primarily the mean sea level pressure (mslp) readings used by Todd’s office to construct the daily weather charts with their isobaric lines. Additionally, the Todd journals have recorded mslp readings outside Australasia that are of equal value. Once the useful data points have been identified, volunteers will type that data into spreadsheets to be used internationally to update the historical weather records for the Pacific area. The Todd journals are a great illustration of the value of long term projects undertaken by dedicated staff across a multi-disciplinary base. Telegraphers, postmasters, lighthouse keepers, general citizens and others, recorded observations that early meteorologists aggregated into a series of weather maps covering a significant historical period of nineteenth-century Australasian history. A twenty-first century project to preserve and present this opus has re-birthed a project undertaken by Todd and his staff who, at times, must have had an inkling that they were securing a place in history.

The Globe, Number 67, 2011
Journal of The Australian and New Zealand Map Society Inc.
22
REFERENCES
ANDERSON, Katherine (2005), Predicting the Weather: Victorians and the Science of Meteorology,
University of Chicago Press, Chicago. ATMOSPHERIC CIRCULATION RECONSTRUCTION OVER THE EARTH [ACRE], (n.d.). online at
http://www.met-acre.org/ accessed 15 Sept. 2010. BENOY, Mac (2010), Sir Charles Todd – weather animation, online video at
http://www.youtube.com/watch?v=hvl5V-jLcf0 accessed 15 Sept. 2010. COOKE, W. Ernest (1885), ‘A Few Remarks about Weather Forecasting for South Australia’,
Transactions and Proceedings and Report of the Royal Society of South Australia, 8:67-70. Also online at http://www.samuseum.sa.gov.au/Journals/TRSSA/TRSSA_V008/TRSSA_V008_p067p070.pdf accessed 15 Sept. 2010.
——— (1905), ‘Meteorology of Western Australia’, Report of the Eighth International Geographic Congress, held in the United States, 1904, Govt. Printing Office, Washington, D.C., pp.386-392.
EDWARDS, P.G. (1993), ‘Charles Todd and the Adelaide Observatory’, Proceedings, Astronomical Society of Australia, 10(4):349-354. Also online at http://articles.adsabs.harvard.edu/cgi-bin/nph-iarticle_query?db_key=AST&bibcode=1993PASAu..10..349E&letter=.&classic=YES& defaultprint=YES&whole_paper=YES&page=349&epage=353&send=Send+PDF&filetype=.pdf accessed 15 Sept. 2010.
GOLINSKI, Jan (2007), British Weather and the Climate of Enlightenment, University of Chicago Press, Chicago.
SOUTH AUSTRALIAN ADVERTISER (1883), Wed. 12 Dec., p.5, col.2. Also online at http://newspapers.nla.gov.au/ndp/del/page/2212242 accessed 15 Sept. 2010.
SYDNEY MORNING HERALD (1873), advertisement for Greville’s Telegram Co., Sat. 6 Sept., p.12, col.3: two words £2/10/- and 10/- per additional word. Also online at http://newspapers.nla.gov.au/ndp/del/page/1449650 accessed 15 Sept. 2010.
THORPE, Jas. (1886), ‘Meteorology In The Southern Colonies’, Brisbane Courier, Sat. 2 Jan. p.6, cols.3-6. Also online at http://newspapers.nla.gov.au/ndp/del/article/4490730 accessed 15 Sept. 2010.
TODD, Sir Charles (1894), ‘Meteorological work in Australia: A Review’, Report of the fifth Meeting of the Australasian Association for the Advancement of Science, held at Adelaide, South Australia, September, 1893, The Association, Glebe, pp.246-270. Also online at http://www.austehc.unimelb.edu.au/fam/1549.html through to http://www.austehc.unimelb.edu.au/fam/1570.html accessed 15 Sept. 2010.
VECCHIO, Gennaro (Gene) (2002), ‘A History of Meteorology in South Australia to 2001’, online at http://www.bom.gov.au/sa/inside/history/ accessed 15 Sept. 2010.