the british survey of fertiliser practice
TRANSCRIPT

THE BRITISH SURVEY OF
FertiliserPractice
FERTILISER USE ON FARM CROPS FOR CROP YEAR 2004
BSFP final inner 10/12/05 11:05 am Page a

© Crown Copyright 2005
First published 2005
British Library Cataloguing in Publication Data.
A catalogue record for this book is available from the British Library.
ISBN 0 9552569 0 9
Limited extracts from this publication may be reproduced providing the source is acknowledged.
Further statistical analyses of the survey results are also available. For details and costs please contact:
Nicola Leeds
Nutrient Management Unit, Livestock Strategy Division
Area 5c, 9 Millbank House
c/o Nobel House
17 Smith Square
London SW1P 3JR
Tel: +44 (0) 20 7238 5586
Fax: +44 (0) 20 7238 3082
BSFP final inner 10/12/05 11:05 am Page b

i
FOREWORD
The British Survey of Fertiliser Practice provides information on fertiliser use on the majorcrops and grass grown in mainland Britain.
The 2004 Survey was sponsored by the Department for Environment, Food and Rural Affairs(Defra) and the Scottish Executive Environment and Rural Affairs Department (SEERAD). TheSurvey has the full support of the Farmers' Unions in England, Scotland and Wales.
The Survey is carried out annually and is based upon returns from a sample of farms. In 2004,the Survey was co-ordinated by Kynetec Ltd., which was responsible for the survey design,statistical analysis and quality control monitoring.
May 2005
ACKNOWLEDGEMENTS
The sponsors gratefully acknowledge the co-operation of all farmers taking part in the 2004British Survey of Fertiliser Practice.
The authors of the report wish to thank all those involved for their assistance and support in thedesign, conduct and analysis of the Survey.
The agronomic interpretation of the Survey results benefited from advice from Chris Dawson(Chris Dawson and Associates), Agronomic Consultant to the Agricultural IndustriesConfederation (AIC).
Gillian Goodlass1
Will Welch2
1ADAS High Mowthorpe, Duggleby, Malton, North Yorkshire YO17 8BP
2Kynetec Limited, Weston Court, Weston, Newbury, Berkshire RG20 8JE
BSFP final inner 10/12/05 11:05 am Page i

ii
CONTENTS
LIST OF TABLES AND FIGURES iv
EXECUTIVE SUMMARY vi
A1 Introduction and structure of the report 1A1.1 History 1
A2 Survey methodology 2A2.1 Sample 2A2.2 Data collection 4A2.3 Data processing 4A2.4 Definitions of terms 5
A3 General trends and issues 7A3.1 Crop areas and weather conditions 7
B1 2004 results for Great Britain and changes in recent years 11B1.1 Overview of fertiliser use on all crops and grass 11
B1.1.1 Nitrogen 12B1.1.2 Phosphate and potash 13
B1.2 Fertiliser use on major tillage crops 13B1.2.1 Nitrogen 16B1.2.2 Phosphate and potash 20B1.2.3 Sulphur 21
B1.3 Fertiliser use on grassland 23B1.3.1 Nitrogen 24B1.3.2 Phosphate and potash 26B1.3.3 Sulphur 27
B2 Longer term trends 28B2.1 Longer term trends for Great Britain 28
B2.1.1 Nitrogen use 28B2.1.2 Phosphate and potash use 31B2.1.3 Fertiliser use on major tillage crops 32B2.1.4 Autumn and winter applications of nitrogen fertiliser 34
SECTION AThe British Survey of Fertiliser Practice 1
SECTION BCommentary on fertiliser use in Great Britain 10
BSFP final inner 10/12/05 11:05 am Page ii

iii
B2.2 Longer term trends for England & Wales 36B2.2.1 Nitrogen use 36B2.2.2 Phosphate and potash use 38
B2.3 Longer term trends for Scotland 38B2.3.1 Nitrogen use 38B2.3.2 Phosphate and potash use 41
4
SECTION DAnalysis of supplementary survey information 97
SECTION CContents 44Tables 46
APPENDICES
Appendix 1 107App 1.1 Sampling variation 107App 1.2 Estimating the standard error 108App 1.3 An alternative approach to estimation of overall rates 108App 1.4 Response rate 109
Appendix 2 110App 2.1 BSFP regions in England & Wales 110App 2.2 Comparison of BSFP and Defra counties 111App 2.3 English counties within BSFP and Defra regions 112
Appendix 3 113App 3.1 BSFP regions in Scotland 113
Appendix 4 114App 4.1 UK farm classification system 114
BSFP final inner 10/12/05 11:05 am Page iii

iv
LIST OF TABLES AND FIGURES
Table A2.1 Derivation of the stratified random sample for the 2004 survey,England & Wales 3
Table A2.2 Derivation of the stratified random sample for the 2004 survey, Scotland 4
Table A3.1 Cropping and grassland areas, Great Britain 2002/2003 - 2003/2004 9
Table B1.1 Overall nitrogen use, Great Britain 2000 - 2004 11
Table B1.2 Overall phosphate and potash use, Great Britain 2000 - 2004 13
Table B1.3 Overall fertiliser use on major tillage crops, Great Britain 2000 - 2004 14
Table B1.4 Average field rates on major tillage crops, Great Britain 2000 - 2004 15
Table B1.5 Average field application rates of nitrogen on cereals by market use,Great Britain 2000 - 2004 16
Table B1.6 Percentage distribution of cereal crop areas by market use,Great Britain 2000 - 2004 17
Table B1.7 Average field application rates of nitrogen on winter and spring oilseedrape and estimated percentage distribution of crop areas,Great Britain 2000 - 2004 19
Table B1.8 Dressing cover and average application rate of sulphur on cereals andoilseed rape, Great Britain 2000 - 2004 22
Table B1.9 Dressing cover of sulphur on cereals and oilseed rape by region, 2000 - 2004 22
Table B1.10 Overall fertiliser use on grassland, Great Britain 2000 - 2004 23
Table B1.11 Dressing cover and average application rate of fertiliser on grassland,Great Britain 2000 - 2004 23
Table B1.12 Grassland utilisation, Great Britain 2000 - 2004 24
Table B1.13 Nitrogen application rates by grassland utilisation,Great Britain 2000 - 2004 25
Table B1.14 Phosphate and potash use by grassland utilisation,Great Britain 2000 - 2004 26
Table B1.15 Sulphur use on grassland, Great Britain 2000 - 2004 27
Table B2.1 Total overall nitrogen application rates, Great Britain 1983 - 2004 28
Table B2.2 Overall phosphate and potash application rates, Great Britain 1983 - 2004 31
Table B2.3 Dressing cover and average application rate of autumn or winter-appliednitrogen on winter cereals and winter oilseed rape by region, 1999 - 2004 35
Table D1.1 Numbers and percentage of farmers using each type of manure 97
Table D1.2 Exported manures 97
Table D1.3(a) Number of farmers importing farm manures (solids and liquids), showingquantity imported 98
Table D1.3(b) Number of farmers importing non-farm manures (solids and liquids),showing quantity imported 98
Table D1.4 Number and percentage of farms using each type of application methodwhere any slurry was applied, by country and robust type 99
Table D1.5 Number and percentage of farms using each type of application method,by slurry type 99
Table D1.6 Degree of incorporation of organic manures/slurries applied in current season 99
BSFP final inner 10/12/05 11:05 am Page iv
v
Table D1.7 Frequency of incorporation time by manure/slurry type 100
Table D1.8 Use of contractors to spread manure/slurry in current season 100
Table D2.1 Average number of years between organic manure applications 100
Table D2.2 Percentage of fields receiving each organic manure type 100
Table D2.3 Typical rates of manure application 101
Table D2.4 Number of fields receiving low, medium or high rates of organic manure type 101
Table D3.1 Overall field rate of fertiliser application to tillage crops in Great Britain,with and without applications of organic manure 102
Table D3.2 Average field rate of fertiliser application on grassland in England & Walesand in Scotland, with and without applications of organic manure 103
Table D3.3 Average field rate of fertiliser application on dairy grassland in England& Wales and in Scotland, with and without applications of organic manure 104
Table D4.1 Frequency of spread pattern checks using a catch tray 106
Table D4.2 Record keeping methods for fertiliser and manure applications on farmswhere each respective nutrient type was applied during the 2003-04 crop year 106
Table App1.1 Standard errors of application rates for the major crops in 2004 107
Table App1.2 Re-estimation of overall total fertiliser use, Great Britain 2004 108
Table App1.3 Response to main and reserve samples in 2004 109
Table App1.4 Response to main and reserve samples for 2000 - 2004 109
Figure A3.1 Monthly rainfall as a percentage of the long term average 9
Figure B1.1 Overall fertiliser use on all crops and grass, Great Britain 2000 - 2004 11
Figure B1.2 Overall straight and compound nitrogen use, Great Britain 2000 - 2004 12
Figure B2.1 Overall application rates of (a) total nitrogen and (b) phosphate and potashon tillage crops and grassland, Great Britain 1983 - 2004 30
Figure B2.2 Overall application rates of (a) total nitrogen, (b) phosphate and (c) potashon major arable crops, Great Britain 1983 - 2004 33
Figure B2.3 Overall application rates of (a) total nitrogen, (b) straight and compoundnitrogen and (c) phosphate and potash on tillage crops and grassland,England & Wales 1969 - 2004 37
Figure B2.4 Overall application rates of (a) total nitrogen, (b) straight and compoundnitrogen and (c) phosphate and potash on tillage crops and grassland,Scotland 1983 - 2004 39
Figure B2.5 Overall application rates of (a) total nitrogen to tillage crops and, (b) totalnitrogen to grassland, in Scotland and in England & Wales 1983 - 2004 40
Figure B2.6 Overall application rates of (a) phosphate and, (b) potash to tillage crops,in Scotland and in England & Wales 1983 - 2004 42
Figure B2.7 Overall application rates of (a) phosphate and, (b) potash to grassland, inScotland and in England & Wales 1983- 2004 43
Figure D2.1 Percentage of fields receiving each organic manure type by season 102
BSFP final inner 10/12/05 11:05 am Page v

vi
EXECUTIVE SUMMARY
The British Survey of Fertiliser Practice is an annual, nationally representative survey based onthe selection of a random stratified sample of farms from mainland Britain. In 2004approximately 1,300 farms were surveyed. The main purpose of the survey is to estimateaverage application rates of nitrogen, phosphate and potash used for agricultural crops andgrassland. Information is also collected on applications of sulphur fertilisers, organic manuresand lime. Aggregated data have been obtained for Great Britain since 1983, the first year thatthe existing survey in England & Wales was extended to Scotland.
The main findings from the 2004 Survey on the use of each fertiliser nutrient in Great Britainare summarised below. Weather and economic factors which may have contributed to recordedchanges in fertiliser use during the 2003/2004 cropping season are also discussed in the report.
Nitrogen
• The total nitrogen use on all crops and grassland declined slightly to 110 kg/ha in 2004from 113 kg/ha in 2003. This decline is associated with a drop in the overall applicationrate of both straight and compound nitrogen applied to grassland. Conversely, on tillageland, the use of straight nitrogen has actually increased slightly whilst levels of compoundN have remained comparable.
• On arable crops the overall total nitrogen use (152 kg/ha) increased slightly from the 2003level to match the 2002 level which was the highest in the 5 year period. Over recent yearschanges in cropping areas (notably in 2001 and to a lesser extent in 2003), rather thanapplication rates to individual crops, have been the major factor influencing the pattern ofnitrogen use on the all tillage crops category. Overall rates of total nitrogen decreased onboth winter and spring barley as well as sugar beet in 2004, although it remained constantfor winter wheat and increased on maincrop/second early potatoes and oilseed rape.
• Overall total nitrogen use on grassland continued to show a decline with a drop of 6 kg/hafrom the previous year. This was due to a decrease in the use of both compound N (-3 kg/ha) and straight nitrogen (-4 kg/ha). The area receiving nitrogen remainedunchanged. The total nitrogen rate (77 kg/ha) was the lowest reported for both the last fiveyears (mean: 88 kg/ha) and also for the whole survey period since 1983. This may berelated to the continuing decline in dairy cow numbers in Great Britain
Phosphate
• Overall phosphate use on tillage crops in 2004 was very similar at 41 kg/ha to the previousyear which, at 40 kg/ha, was the lowest rate for the period. Phosphate use on grasslanddecreased very slightly (-1 kg/ha) compared with the previous year to 17 kg/ha andrepresents the lowest rate for the period. Over the last five years phosphate use on allcrops and grassland has dropped by 4 kg/ha, from 32 to 28 kg/ha. The area of tillage cropsand grassland receiving phosphate fertiliser was similar to previous years (and the same asthe five year mean) at 65% and 59% respectively.
BSFP final inner 10/12/05 11:05 am Page vi

vii
Potash
• Potash use on tillage crops increased slightly (+1 kg/ha) to 55 kg/ha in 2004. The overallrate of potash on grassland remained at the same low level for the period at 22 kg/ha. Overthe last five years, potash use on all crops and grassland has dropped by 3 kg/ha, to 37 kg/ha. The area of tillage crops receiving potash fertiliser was similar to previous yearsat 67% (five year mean: 66%), whilst for grassland the area receiving potash fertiliserincreased slightly to 58% (five year mean: 58%).
Sulphur
• The Survey has collected detailed information on sulphur fertiliser use since 1993, whenonly 3-6% of the cereal crop areas and 8% of the oilseed rape area received a sulphurapplication. By 1997, these proportions had increased markedly to 13-14% for cereals and30% for oilseed rape. Since then, however, dressing covers for sulphur generally remainedfairly static until 2002 when the areas increased. There have been further increases sincethen with over half the oilseed rape crop now being treated.
• Despite an underlying upward trend in average application rates over the last 5 years, thecereal levels in 2004 have plateaued or declined compared with 2003. The rate for oilseedrape is the highest ever recorded at 85 kg/ha. The rates applied are generally higher thanthe recommended practice of 25-40 kg/ha SO3, applied as a water soluble form in earlyspring, for potentially sulphur-deficient cereal crops and 50-75 kg/ha for oilseed rape.
Longer term trends
The longer term trends in application rates since 1983 show that:
• Overall nitrogen use on all crops and grassland, as a single category averaged at 142 kg/ha(peak 144 kg/ha) in the first five years (1983-1987) of the Great Britain data set. Themeans for each of the subsequent five year periods are 1988-92: 134 kg/ha, 1993-1997:130 kg/ha, 1998-2002: 121 kg/ha and 2003-to date: 111 kg/ha, reflecting the downwardtrend observed on both grassland and, to a lesser extent, on tillage crops
• Overall phosphate use on tillage crops had gradually declined over the period since 1983,from a five-year mean of 58 kg/ha in 1983-87, 54 kg/ha in 1988-1992, 53 kg/ha in 1993-97 to 46 kg/ha for the period 1998-2002. For grassland the five-year means havebeen 25 kg/ha in 1983-87, 23 kg/ha in 1988-1992, 23 kg/ha in 1993-97, 20 kg/ha in 1998-2002 and 18 kg/ha for the period 2003-04. The 2003 rate of 40 kg/ha for tillage and16 kg/ha for grassland are the lowest since Great Britain records began in 1983.
• Overall potash use on tillage crops had declined slightly between 1983 and 1997, with afive-year mean of 64 kg/ha in 1983-87, 63 kg/ha in 1998-1992, 62 kg/ha in 1993-1997.There was larger drop to 57 kg/ha for the period 1998-2002. The pattern of overall potashuse on grassland has been more variable, compared to tillage crops, but has also shown anet decline between 1983 and 2003. Overall potash rates were relatively stable at 31-33 kg/ha during the mid-late 1980s but, since then, have tended to decline despitetemporary recorded increases in 1989-91 and in 1997. Annual potash use between 1998-2002 has been consistently lower (mean: 26 kg/ha) than in earlier years and the valueof 22 kg/ha in 2003 and 2004 represents the lowest values recorded since 1983.
BSFP final inner 10/12/05 11:05 am Page vii

BSFP final inner 10/12/05 11:05 am Page viii

1
SECTION A
THE BRITISH SURVEY OF FERTILISER PRACTICE
A1 INTRODUCTION AND STRUCTURE OF THE REPORT
The British Survey of Fertiliser Practice (BSFP) is unique in its range and in its aspiration toproduce an accurate assessment of fertiliser use for England & Wales, and for Scotland. Toachieve this aim, estimates from the survey data are used in conjunction with crop areas fromthe Annual Agricultural Census3. It relates applications of nutrients to major crop types andgrassland throughout Great Britain. The report is the principal source of estimates for fertiliserapplications in Great Britain, and is used by the British fertiliser industry, by Government andby the wider agricultural community. With such a high profile it is essential that the claimsmade from the survey are underpinned by an effective methodology. Section A2 describes thismethodology, detailing measures undertaken to avoid bias and unreliability. National changesin relative cropping areas are discussed in Section A3.
Section B provides a commentary of recent changes in survey data and longer term trends.Section C presents the main tables of results from the Survey, grouped by geographic coverage.They include major crop groups, grassland, product types and farm types. Figures for estimatesof ‘total’, ‘straight’ and ‘compound’ nutrient rates are presented in separate tables.Supplementary questions, which change each year, are also included in the Survey. Section Dprovides an analysis of information which was gathered in the 2004 Survey regarding theapplication protocols of organic manures and manufactured fertilisers.
A1.1 HISTORY
The survey has been in existence, in various forms, since 1942 for England & Wales. It wasextended to Scotland in 1983. Historical data from 1942 to 1997 have been summarised inseveral reviews spanning this period of time 4,5,6,7.
The current methods of survey design and implementation are the result of adaptation of theoriginal design by Rothamsted Experimental Station, undertaken by Edinburgh Data Library atthe University of Edinburgh between 1992 and 1998. From 1999 until 2003 responsibility fordesign and analysis transferred to the Rural Business Unit at the University of Cambridge andin 2004 this responsibility was conferred on Kynetec Limited, who also retained responsibilityfor conducting the fieldwork.
3Defra/SEERAD/NAWAD June Census data, 2003.
4Yates, F. and Boyd, D.A. (1965). Two decades of Surveys of Fertiliser Practice. Outlook on Agriculture 5,203-210.
5Church, B.M. and Lewis, D.A. (1977). Fertiliser use on farm crops, England and Wales: Information from theSurvey of Fertiliser Practice, 1942-1976. Outlook on Agriculture 9, 186-193.
6Chalmers, A.G., Kershaw, C.D. and Leech, P.K. (1990). Fertiliser use on farm crops in Great Britain: Resultsfrom the Survey of Fertiliser Practice, 1969-1988. Outlook on Agriculture 19, 269-278.
7Chalmers, A.G., Renwick, A.W., Johnston, A.E. and Dawson, C.J. (1999). Design, development and use of anational survey of fertiliser applications. Proceedings No. 437. York: The International Fertiliser Society.
BSFP final inner 10/12/05 11:05 am Page 1

2
A2 SURVEY METHODOLOGY
A2.1 SAMPLE
The basis of the sample framework is the Agricultural Census which is undertaken annually andrecords information on farm size, cropping, stocking and employment. Each year, two samplesare extracted from the Census, one for England & Wales and one for Scotland. In England &Wales, farms are classified into one of three types, cropping, livestock and horticulture. Farmsare then further classified into four size groups. In Scotland, a similar number of size groupsare used but farms are classified into only two types, mainly cropping and mainly livestock.This produces 20 stratification cells, 12 for England & Wales and 8 for Scotland, shown inTables A2.1 and A2.2. Holdings less than 20 hectares in size are excluded from the BSFPsample. The process of random stratification results in more precise estimates than those whichwould be obtained by simple random sampling. The ‘robust’ farm types (coded 1-8) identifiedfor each farm group classification in Tables A2.1 and A2.2 are defined in Section A2.4.
The fraction of farm holdings sampled from each cell is proportional to the total area of cropsand grass (see Column 3, Tables A2.1 and A2.2). An exception to this is that in England &Wales a deliberate policy of over sampling is undertaken for the horticultural group to ensuresufficient numbers for a robust estimate to be made. The notional sampling fraction presentedin Tables A2.1 and A2.2 indicates the percentage of the total population of holdings that aresampled in each cell. As the larger farms cover a greater area, then a higher proportion of theseholdings are sampled. The process of selecting the actual holdings to be surveyed involves twosteps. First the holdings in each cell are ordered by geographic location (using the County,Parish, Holding (CPH) identifier). This enables a high degree of geographic dispersion in thesample. The number of farms to be surveyed is then drawn at random from these stratifiedgroups. This process leads to a sought sample (a total of 1,473 farms) that is representative ofthe population as a whole. The actual sample achieved is influenced, like all surveys, by anumber of factors.
Current census data for the year of the survey were not available. Therefore, information usedfrom the census to draw the annual sample is to some extent historic, being either one or twoyears old. For this reason not all of the holdings selected were actually eligible for the survey,simply through the process of structural change. In addition, as the survey is voluntary, it is alsoinevitable that there will be some non-response from those that are eligible. In the 2000 survey,a move was made towards establishing a core of co-operators who would stay in the survey fora certain number of years. This procedure is already used on other surveys by other departmentsof Defra. Co-operators in 1999 were asked if they would be prepared to stay in the survey andapproximately one-third of the sample agreed to continue. It was also decided to have threereserve lists in an attempt to reduce the rate of non-response. Non-response is a problem as itmay introduce bias into the survey. Clearly it would be wrong to assume that those farms thatdid not co-operate have the same level of fertiliser use as those that did. Reserve lists weredrawn which matched geographically and by farm type and size to the continuing sample from1999 (to provide alternatives if any of the continuing sample changed their minds). The rest ofthe main sample was drawn to complete the sample structure and three reserve lists wereprovided by selecting the nearest holding, as represented by the CPH number, which falls in thesame stratification cell as the main list holding. This ensures that the geographical dispersionis maintained.
BSFP final inner 10/12/05 11:05 am Page 2

3
Table A2.1 Derivation of the stratified random sample for the 2004 survey, England andWales
England & Wales
(Defra robust types 4-7)
crops & grass area20-50 ha 17864 6.2 0.43 76 112 0.63
51-100 ha 15799 11.7 0.91 143 181 1.15
101-200 ha 9522 13.4 1.73 165 163 1.71
200+ ha 3537 13.8 4.75 168 105 2.97
(Defra robust types 1,2,8)
crops & grass area20-50 ha 8949 6.7 0.93 83 74 0.83
51-100 ha 9191 13.6 1.81 166 144 1.57
101-200 ha 7756 31.1 4.90 380 255 3.29
200+ ha 7754 2.8 0.44 34 40 0.52
(Defra robust type 3)
crops & grass area20-50 ha 742 0.2 1.62 12 12 1.62
51-100 ha 243 0.2 3.70 9 8 3.29
101-200 ha 112 0.2 8.04 9 5 4.46
200+ ha 38 0.1 13.16 5 3 7.89
Total for England 81507 100.0 1250 1102 1.35
and Wales
farm holdings total crops notional target achieved achieved
in population and grass sampling sample sample sample
in 2003 in 2003 fractiona
size size fractionb
(column %) (%) (%)
Crops & mixed
Horticulture
Livestock
aThe notional sample fraction is found by expressing the target sample size as a percentage of the farm holdingsin population in 2003.
bThe achieved sample fraction is found by expressing the achieved sample size as a percentage of the farmholdings in population in 2003.
Each farm in the main sample is contacted; if for whatever reason a farm is not able to take partin the survey, the first reserve for that farm is then contacted. If this farm also refuses then thesecond and if necessary the third reserve is contacted. If all four farms refuse then no farm isrecruited into the survey. Any over sampling (or under sampling) that occurs through thisprocess is corrected for by the use of weighting factors, which are the inverse of the achievedsampling fraction.
BSFP final inner 10/12/05 11:05 am Page 3
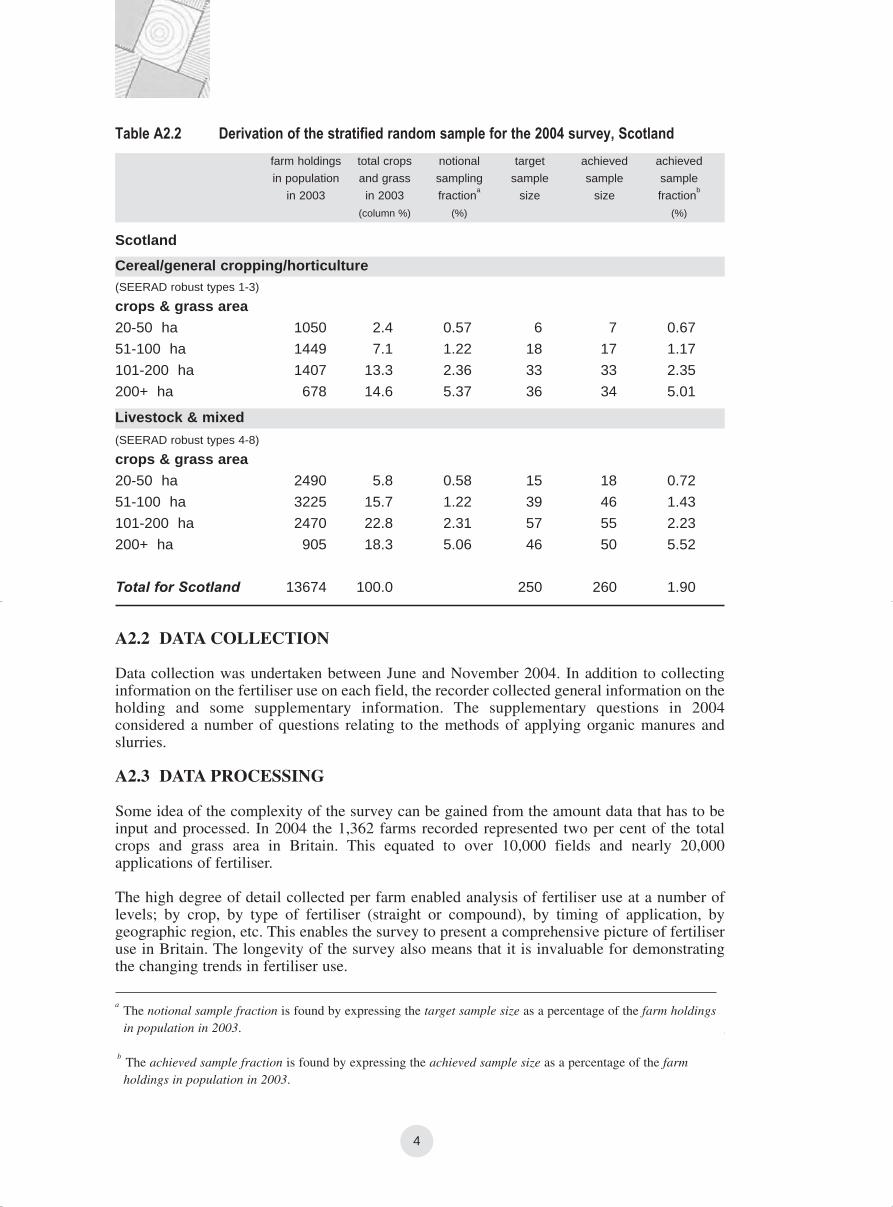
A2.2 DATA COLLECTION
Data collection was undertaken between June and November 2004. In addition to collectinginformation on the fertiliser use on each field, the recorder collected general information on theholding and some supplementary information. The supplementary questions in 2004considered a number of questions relating to the methods of applying organic manures andslurries.
A2.3 DATA PROCESSING
Some idea of the complexity of the survey can be gained from the amount data that has to beinput and processed. In 2004 the 1,362 farms recorded represented two per cent of the totalcrops and grass area in Britain. This equated to over 10,000 fields and nearly 20,000applications of fertiliser.
The high degree of detail collected per farm enabled analysis of fertiliser use at a number oflevels; by crop, by type of fertiliser (straight or compound), by timing of application, bygeographic region, etc. This enables the survey to present a comprehensive picture of fertiliseruse in Britain. The longevity of the survey also means that it is invaluable for demonstratingthe changing trends in fertiliser use.
A2.4 DEFINITIONS OF TERMS
1. For the purpose of the Survey, the term Great Britain (or Britain) is defined to coverEngland (including the Isle of Wight), Wales (including Anglesey) and mainland Scotland.
4
Table A2.2 Derivation of the stratified random sample for the 2004 survey, Scotland
Scotland
(SEERAD robust types 1-3)
crops & grass area20-50 ha 1050 2.4 0.57 6 7 0.67
51-100 ha 1449 7.1 1.22 18 17 1.17
101-200 ha 1407 13.3 2.36 33 33 2.35
200+ ha 678 14.6 5.37 36 34 5.01
(SEERAD robust types 4-8)
crops & grass area20-50 ha 2490 5.8 0.58 15 18 0.72
51-100 ha 3225 15.7 1.22 39 46 1.43
101-200 ha 2470 22.8 2.31 57 55 2.23
200+ ha 905 18.3 5.06 46 50 5.52
Total for Scotland 13674 100.0 250 260 1.90
farm holdings total crops notional target achieved achieved
in population and grass sampling sample sample sample
in 2003 in 2003 fractiona
size size fractionb
(column %) (%) (%)
Cereal/general cropping/horticulture
Livestock & mixed
aThe notional sample fraction is found by expressing the target sample size as a percentage of the farm holdingsin population in 2003.
bThe achieved sample fraction is found by expressing the achieved sample size as a percentage of the farmholdings in population in 2003.
BSFP final inner 10/12/05 11:05 am Page 4

5
A2.4 DEFINITIONS OF TERMS
1. For the purpose of the Survey, the term Great Britain (or Britain) is defined to coverEngland (including the Isle of Wight), Wales (including Anglesey) and mainland Scotland.
2. The survey year ran from autumn 2003 to autumn 2004, corresponding to the 2004 seasonor harvest year. The recording period for fertiliser applications varied for different crop andgrass groups on farms of not less than 20 hectares (ha) in size.
3. For the purposes of this survey, a field is defined as any single area of land measuring morethan 0.2 ha (half an acre) which had a uniform cropping and fertiliser history from autumn2003. For data collection and processing purposes, separate fields with identical croppingand fertiliser management on the same farm are blocked together as one ‘field’, torepresent the total combined area of those fields. Areas within the same natural boundaryreceiving different treatments (crops on fertilisers) were recorded separately. Agriculturalland which had been set-aside under the Arable Area Payment Scheme was recorded, butwas not included in analyses unless it was used to grow an industrial crop. Fallow landother than set-aside has always been recorded in the survey.
4. In the report, tillage is defined as all crops except grass, forestry, glasshouse crops and landdesignated as 'set-aside' under the Arable Area Payments scheme. Grass refers to all formsof grassland which may be grazed, conserved or grown for seed production; rough grazingis excluded.
5. The abbreviation N is used for nitrogen; P2O5 for phosphate; K2O for potash, SO3 forsulphur and FYM for all types of organic manure e.g. slurries and solid manures. Thephrase total use includes both straight (single nutrient) and compound (multi nutrient)products. Fertiliser products containing nitrogen and sulphur only are classified as withnitrogen.
6. For each fertiliser nutrient, the average field rate (of application) is defined as the sum ofnutrient applied divided by the total area of those fields which received any dressing of thenutrient. Crop area without any application of the nutrient is excluded from the calculationof the average field rates of application. These field-specific application rates providedirect evidence on the level and variation in farming practice.
7. The term dressing cover is used to describe the proportion of crop area treated with anydressing of the fertiliser nutrient in question, and is stated as a percentage.
8. The overall application rate is defined as the total quantity of nutrient used, in kilograms(kg), divided by the total extent of crop area, in hectares (ha) (including any areas withoutapplication of the nutrient). When combined with information from the national total croparea estimates in the Agricultural Census, these overall application rates provide a meansof estimating the tonnage of fertiliser nutrient used during the survey year.
Any change in an overall application rate is due to a change in either the (actual) field rateof application used on farms, or to a change in the dressing cover, or to changes in both.Arithmetically, overall application rate is equivalent to the sum obtained by multiplying theaverage field rate of application by the proportion of crop area that receives any nutrientdressing. The overall application rate of a nutrient on a crop, by definition, cannot be greaterthan the average field rate of application.
9. The UK farm type system, which is based on the EC system, aggregates a wide range ofdefined farm types into nine ‘robust’ types:
BSFP final inner 10/12/05 11:05 am Page 5

6
(1) Cereals;
(2) General Cropping;
(3) Horticulture;
(4) Pigs and Poultry;
(5) Dairy;
(6) Cattle and Sheep (LFA);
(7) Cattle and Sheep (low ground);
(8) Mixed;
(9) Other.
The composition of ‘robust’ types is presented in greater detail in Appendix 4. Thesampling framework outlined in Section A2.1 can be related to robust types as set outbelow.
England & Wales:
BSFP sampling frame robust types
cropping 1, 2, 8
livestock 4, 5, 6, 7
horticulture 3
Scotland:
BSFP sampling frame robust types
mainly cropping 1, 2, 3, 8
mainly livestock 4, 5, 6, 7
Data presented in tables EW5.1 to EW5.4 and SC5.1 to SC5.4 in Section C are derivedfrom the robust types shown below.
England & Wales:
table number farm type(s) as given in table title robust types
EW5.1 dairy farms 5
EW5.2 cattle and sheep farms 6, 7
EW5.3 other livestock farms 4, 8
EW5.4 cropping/horticultural farms 1, 2, 3
Scotland:
table number farm type(s) as given in table title robust types
SC5.1 general cropping farms 1, 2
SC5.2 dairy farms 5
SC5.3 mixed farms 4, 6, 7, 8
SC5.4 farms in Less Favoured Areas All farms in LFAs
BSFP final inner 10/12/05 11:05 am Page 6
7
10. Regional analysis of the Survey data for England is based on the MAFF administrativeregions, which were revised in 1996 to take account of changes to county boundaries andnomenclature resulting from the introduction of Unitary Local Authorities between April1995 and April 19989. These revised regions are termed BSFP regions and are detailed inAppendices 3 and 4.
11. Where changes in application rates are termed ‘significant’ this indicates that theprobability of a change of this magnitude arising purely by chance (sampling error) is lessthan five percent.
12. Commentary in Section B suggesting possible reasons for observed differences in fertiliserpractice is shown in italics.
A3 GENERAL TRENDS AND ISSUES
A3.1 CROP AREAS AND WEATHER CONDITIONS
Annual changes in relative cropping areas, as well as any changes in fertiliser practice forindividual crops, may affect nutrient application rates when aggregated across the main cropgroupings. Table A3.1 provides a summary of Census estimates for areas of individual majorcrops, crop groupings and total tillage and grassland categories in 2002/03 and 2003/04, andillustrates percentage changes in relative cropping areas over the past five years. There wereabout 10.6 million hectares of managed agricultural land in Britain in 2004, of which 4.6 million hectares (43%) were cultivated for tillage cropping and the remainder, 6.0 millionhectares, were grassland (excluding rough grazing).
The total tillage area was slightly higher (+2.6%) in 2004, mainly due to a decrease in the areaof set aside. The area of wheat increased by 152,700 ha (+8%). The area of barley decreasedby 37,400 ha (-8%) and 33,900 (-6%) for the winter and spring crops respectively. The totalcereal area was up by 2.4% after a 4.6% decrease the previous year. Less land was entered as set aside giving a decrease of 18% from 2003. The total oilseed rape area increased by38,100 ha (+8%), this was due in part to an increase in the winter sown crop (up 5.5%) but alsoto an increase in the area sown in spring (up 26% over the previous year). The linseed area wasless than in the previous year and is now <1% of the total tillage area, considerably less than in1999 when the economic returns for this crop were more favourable. The areas of potatoes andpeas/beans increased by 2% and 4% respectively. The area of sugar beet decreased (-5%), thisis the third year in a row that the area has declined. Other tillage crop categories and the totalarea of managed grassland showed little change in area (less than 1%), compared with 2003.
The total tillage area was 113,900 ha less (-2.4%) in 2004, compared to 1999. The total area ofcereals was very similar (-0.1%) but there were changes in the areas of wheat (+9%) relative tobarley (-14%) in 2004 compared with 1999. The biggest change occurring in winter barleywhich was nearly 128,500 ha less in 2003. The oilseed rape area was higher (+19%) as wasthe area of peas/beans (+21%). The areas of sugar beet and potatoes were down by 16% and17% respectively in 2004 compared with 1999.
BSFP final inner 10/12/05 11:05 am Page 7

8
Table A3.1 Cropping and grassland areas (’000 ha) Great Britain, 2002/03 - 2003/04
Wheat 1830 1982 8.3 9.2 43.4
Barley - winter 452 415 -8.3 -23.7 9.1
- spring 598 565 -5.7 -5.9 12.3
Total cereals1
3021 3095 2.4 -0.1 67.7
Oilseed rape - total 460 498 8.3 19.4 10.9
Sugar beet 162 154 -4.9 -15.8 3.4
Potatoes2
139 141 1.7 -16.9 3.1
Linseed 32 29 -10.0 -86.2 0.6
Peas/beans3
235 244 3.8 20.8 5.3
Maize/other fodder 178 179 0.5 9.7 3.9
Vegetables 124 124 0.1 -0.3 2.7
Total tillage4
4454 4571 2.6 -2.4 100.0
Set-aside5
678 555 -18.1 -2.7 10.8
Less than 5 years old 1063 1109 4.4 2.2 18.3
5 years and older 4973 4940 -0.7 4.0 81.7
Total grass6
6036 6050 0.2 3.6 100.0
Total crops and grass7
10461 10621 1.5 0.9
1 including minor cereals (oats, rye, triticale, mixed corn)
2 early + second early + maincrop potatoes
3 harvested dry for animal consumption or, for peas, human consumption
4 including other crops and bare fallow, but not set-aside
5 including industrial crops; the percentage area is expressed as the ratio of set-aside area to the total areadesignated for cultivation
6 managed grassland, excluding rough grazing
7 total tillage + total grassland
Source: Annual Defra/SEERAD/NAWAD June Census data
Crops 2002/2003 2003/2004 % change % change 2003/2004 crop
000s ha 000s ha since since areas as % of
2002/3 1998/99 total tillage area
Grassland 2003/2004 grass
areas as % of
total grass area
BSFP final inner 10/12/05 11:05 am Page 8

9
Unusual seasonal weather conditions can influence fertiliser usage in some years. Forexample:
• A very wet (or very dry) autumn can delay the establishment of winter sown crops, or alterthe ratio of winter to spring sown crops, with their different fertiliser requirements.
• Prolonged wet weather can increase leaching losses of some nutrients, particularlynitrogen and sulphur. Weather conditions also affect other aspects of soil chemistry andnutrient availability.
• Adverse weather conditions can disrupt planned farming activities, such as fertiliserspreading.
• Growing conditions determine plant growth and hence affect nutrient requirements.
As in the previous year when weather conditions were also dry, autumn 2003 caused problemsfor autumn drilling. In general September and October were very dry (Figure A3.1) and as aresult germination of autumn sown crops was slow. Oilseed rape in particular was badlyaffected with patchy development and many crops were replaced with spring sown crops. Thisexplains the increase in spring oilseed rape area.
The dry autumn conditions also affected the potato harvest making lifting difficult andincreasing the incidence of bruising. Autumn growth of grass for late grazing was also affected.Conditions during the winter and summer were generally warmer than average and 2004ranked as the 5th warmest in Central England where temperature series date back to 1659. Thewarmer years were 1949, 1990, 1999 and 2002. Rainfall in August was much higher thanaverage (Figure A3.1) and adversely affected the cereal harvest.
When the weather affects the proportion of winter to spring crops (notably cereals and oilseedrape) this has a major impact on fertiliser use as spring crops require less fertiliser. The impactof these all these factors on fertiliser use are discussed in Section B of this report.
25
50
75
100
125
150
175
200
225
Sep-03 Oct-03 Nov-03 Dec-03 Jan-04 Feb-04 Mar-04 Apr-04 May-04 Jun-04 Jul-04 Aug-04
%of
1961-1
990
avera
ge
England Wales Scotland
Figure A3.1 Monthly rainfall as a % of the long term average (source: Met Office8)
8 www.metoffice.gov.uk/climate/uk
BSFP final inner 10/12/05 11:05 am Page 9

10
SECTION B
COMMENTARY ON FERTILISER USE IN GREAT BRITAIN
This commentary refers to rates of application in mainland Britain of fertilisers containingnitrogen (N), phosphate (P2O5), potash (K2O) and sulphur (SO3) on tillage crops and grassland(excluding rough grazing). Section B1 of the report covers the five-year period 2000 to 2004.Comments on longer term trends are made in Section B2, using data available from what were,prior to 1992, two separate Surveys of Fertiliser Practice, for England & Wales and forScotland.
The estimates of overall application rates from the survey relate to usage on farms during the2003/2004 growing season: they form a basis for estimating quantities of fertiliser used inGreat Britain. The estimates of the average field rates provide a better indication than overallapplication rates of actual usage levels and also of any annual variation in fertiliser practice onfarms.
The statistics on the pattern of fertiliser practice reported for Great Britain largely reflectpractice in England & Wales due to its greater area of total crops and grassland: about 8.7 million hectares in England & Wales and about 1.8 million hectares in Scotland. In whatis otherwise a commentary on Britain as a whole, remarks on the separate regions are onlymade to highlight particular trends of interest. Readers interested in more detailed recent trendsfor individual crops in England & Wales or in Scotland can refer to tables presented in the finalSection of this and earlier annual Reports in conjunction with the summary tables of annualfertiliser use in the main text of the 1995 report9. A summary of the last 15 years data isavailable in Chalmers 200110.
The nutrient rates presented and discussed in the main text of this Report are based on cropareas estimated from the survey data. Data from the 2003 Agricultural Census on crop areashave been summarised in Table A3.1. Crop area estimates from the Agricultural Census havegreater reliability as they are derived from a far larger sample of farms. Census crop areas areused in the Appendix of the report to re-estimate application rates, for total tillage and grasslandcrop groupings, taking into account the limitations of survey crop area estimates extrapolatedfrom a comparatively small survey sample. These adjusted rates have now been calculated forseveral years and the adjusted estimates are generally very close to those reported in Section Bof the annual Reports, and this has proved to be the case again this year.
9Burnhill, P M, Chalmers, A G and Fairgrieve, J (1996). The British Survey of Fertiliser Practice: fertiliser useon farm crops 1995. HMSO: Edinburgh.
10 Chalmers A G (2001) A Review of fertiliser, lime and organic manure us on farm crops in Great Britain from1983 to 1997. Soil Use and Management 17 254-262
BSFP final inner 10/12/05 11:05 am Page 10

11
B1 2004 RESULTS FOR GREAT BRITAIN AND CHANGES INRECENT YEARS
B1.1 OVERVIEW OF FERTILISER USE ON ALL CROPS AND GRASS
Overall rates of total nitrogen, phosphate and potash in Great Britain over the last five years areillustrated in Figure B1.1, which is based on data presented in Tables B1.1 and B1.2.Application rates for straight and compound nitrogen applied on crops and grassland are alsopresented in Table B1.1. Definitions of the terms used are set out in Section A of this report.
Table B1.1 Overall nitrogen use (kg/ha), Great Britain 2000 - 2004
Total nitrogen
2000 149 99 1232001 145 94 1162002 152 89 1172003 149 83 1132004 152 77 110
tillage grass all cropscrops and grass
Straight nitrogen
2000 130 43 852001 118 39 742002 128 32 762003 129 31 742004 132 27 73
tillage grass all cropscrops and grass
Compound nitrogen
2000 19 56 382001 27 55 422002 22 57 422003 20 53 382004 20 50 37
tillage grass all cropscrops and grass
Figure B1.1 Overall fertiliser use (kg/ha) on all crops and grass, Great Britain 2000 - 2004
020
40
60
80
100
120
140
Total nitrogen Total phosphate Total potash
kg/h
a n
utr
ient
2000 2001 2002 2003 2004
BSFP final inner 10/12/05 11:05 am Page 11

12
020
40
60
80
100
120
140
Straight N
on tillage
Compound N
on tillage
Straight N
on grass
Compound N
on grass
kg/h
a N
2000 2001 2002 2003 2004
Figure B1.2 Overall straight and compound nitrogen use (kg/ha), Great Britain 2000 - 2004
B1.1.1 NITROGEN
All crops and grassland
The total nitrogen use on all crops and grassland declined slightly in 2004 compared with therates in 2003 (Figure B1.1), due to a decrease in the amount applied to grass (Table B1.1). Thisdecline is associated with a drop in the overall application rate of both straight nitrogen andcompound N (Figure B1.2). Conversely, on tillage land, the use of straight nitrogen hasincreased slightly, whilst levels of compound N have remained the same as 2003. Therelatively high level of compound to tillage in 2001 probably reflects the effects of the wetautumn in 2000 on crop management.
Tillage crops
Overall total nitrogen use (152 kg/ha) increased slightly from the 2003 level to match the 2002level which was the highest in the 5 year period. Over recent years changes in cropping areas(notably in 2001 and to a lesser extent in 2003), rather than application rates to individualcrops, have been the major factor influencing the pattern of nitrogen use on the all tillage cropscategory.
Grassland
Overall total nitrogen use on grassland continued to show a decline with a drop of 6 kg/ha fromthe previous year. This was due to a decrease in the use of both compound N (-3 kg/ha) andstraight nitrogen (-4 kg/ha), the area receiving nitrogen remained unchanged. The totalnitrogen rate (77 kg/ha) was the lowest reported for both the last five years (mean: 88 kg/ha)and also for the whole survey period since 1983 (see section B2). This may be related to thecontinuing decline in dairy cow numbers in Great Britain.
BSFP final inner 10/12/05 11:05 am Page 12

13
B1.1.2 PHOSPHATE AND POTASH
Phosphate
Overall phosphate use on tillage crops in 2004 was very similar at 41 kg/ha to the previous yearwhich, at 40 kg/ha, was the lowest rate for the period (Table B1.2). Phosphate use on grasslanddecreased very slightly (-1 kg/ha) compared with the previous year to 17 kg/ha and representsthe lowest rate for the period. Over the last five years phosphate use on all crops and grasslandhas dropped by 4 kg/ha, from 32 to 28 kg/ha. The area of tillage crops and grassland receivingphosphate fertiliser was similar to previous years (and the same as the five year mean) at 65%and 59% respectively.
Potash
Potash use on tillage crops increased slightly (+1 kg/ha) to 55 kg/ha in 2004. The overall rateof potash on grassland remained at the same low level for the period at 22 kg/ha. Over the lastfive years, potash use on all crops and grassland has dropped by 3 kg/ha, to 37 kg/ha. The areaof tillage crops receiving potash fertiliser was similar to previous years at 67% (five year mean: 66%), whilst for grassland the area receiving potash fertiliser increased slightly to 58% (five year mean: 58%).
B1.2 FERTILISER USE ON MAJOR TILLAGE CROPS
Overall and average field rates of fertiliser application for major tillage crops in Great Britainover the past five years are summarised in Tables B1.3 and B1.4. More detailed statistics for2004 are presented in Section C. Longer term trends in overall application rates of nitrogen,phosphate and potash since 1983 are summarised in Section B2.
Small apparent changes in fertiliser use on individual crops should be treated with a degree ofcaution as these estimates are based on a smaller number of farms and fields than theaggregate estimates for all tillage crops. Information on 'sampling errors', which help injudging whether apparent changes may be real or attributable to sampling variation alone, isgiven in Appendix 1.
Table B1.2 Overall phosphate and potash use (kg/ha), Great Britain 2000 - 2004
Total phosphate
2000 47 20 322001 43 19 292002 44 20 312003 40 16 282004 41 17 28
tillage grass all cropscrops and grass
Total potash
2000 55 26 402001 52 24 372002 57 25 402003 54 22 362004 55 22 37
tillage grass all cropscrops and grass
BSFP final inner 10/12/05 11:05 am Page 13

14
Table B1.3 Overall fertiliser use (kg/ha) on major tillage crops, Great Britain 2000 - 2004
Total nitrogen
2000 188 107 146 160 195 1042001 185 111 145 151 193 1032002 193 110 154 158 199 1062003 197 107 148 152 191 1032004 197 104 144 154 202 95
winter spring winter maincrop oilseed sugarwheat barley barley potatoes
arape
bbeet
Total phosphate
2000 44 47 48 159 41 392001 42 43 45 127 41 362002 41 45 46 123 50 432003 39 44 41 130 38 342004 39 44 46 125 39 36
winter spring winter maincrop oilseed sugarwheat barley barley potatoes
arape
bbeet
Compound nitrogen
2000 11 45 12 128 15 132001 14 45 19 115 17 202002 15 43 22 108 18 152003 12 46 20 116 13 132004 11 45 19 105 13 10
winter spring winter maincrop oilseed sugarwheat barley barley potatoes
arape
bbeet
Straight nitrogen
2000 177 62 134 32 180 912001 171 66 127 37 176 832002 178 66 132 52 181 912003 186 61 128 37 179 912004 186 59 125 49 189 85
winter spring winter maincrop oilseed sugarwheat barley barley potatoes
arape
bbeet
Total potash
2000 47 56 61 234 43 912001 45 51 64 184 42 782002 47 56 62 221 50 1042003 47 57 59 214 42 912004 48 57 62 201 46 104
winter spring winter maincrop oilseed sugarwheat barley barley potatoes
arape
bbeet
aFigures for maincrop potatoes include second earlies.
bSingle crop grouping for the combined winter and spring oilseed rape areas.
BSFP final inner 10/12/05 11:05 am Page 14

15
Table B1.4 Average field rates (kg/ha) on major tillage crops, Great Britain 2000 - 2004
Total nitrogen
2000 193 112 150 174 195 1082001 189 114 149 175 196 1062002 197 113 156 172 201 1122003 199 111 149 163 194 1082004 199 106 145 156 203 103
winter spring winter maincrop oilseed sugarwheat barley barley potatoes
arape
bbeet
Total phosphate
2000 69 58 65 187 70 762001 66 55 65 163 64 762002 69 57 64 141 71 822003 64 54 60 149 60 632004 63 53 61 146 62 71
winter spring winter maincrop oilseed sugarwheat barley barley potatoes
arape
bbeet
Compound nitrogen
2000 49 65 44 156 47 752001 70 72 62 155 59 932002 63 63 61 129 52 812003 60 69 70 143 42 602004 63 33 33 131 52 64
winter spring winter maincrop oilseed sugarwheat barley barley potatoes
arape
bbeet
Straight nitrogen
2000 185 96 142 73 190 1052001 184 95 143 96 186 1002002 189 94 150 101 187 1052003 193 90 143 122 185 1052004 195 87 140 101 195 102
winter spring winter maincrop oilseed sugarwheat barley barley potatoes
arape
bbeet
Total potash
2000 77 66 80 265 75 1422001 72 64 82 231 68 1242002 80 68 80 235 77 1292003 77 66 78 237 68 1252004 78 65 79 231 72 130
winter spring winter maincrop oilseed sugarwheat barley barley potatoes
arape
bbeet
aFigures for maincrop potatoes include second earlies.
bSingle crop grouping for the combined winter and spring oilseed rape areas.
BSFP final inner 10/12/05 11:05 am Page 15

16
Table B1.5 Average field application rates (kg/ha) of nitrogen on cereals by market use,Great Britain 2000 - 2004
Total nitrogen
2000 211 184 105 103 135 1542001 209 182 119 100 137 1512002 208 192 118 101 149 1592003 215 191 114 99 145 1522004 224 188 111 99 134 151
winter wheat spring barley winter barleymilling non-milling malting non-malting malting non-malting
B1.2.1 NITROGEN
Overall rates of total nitrogen (Table B1.3) decreased on barley (winter and spring), and sugarbeet in 2004, and increased on oilseed rape and maincrop/second early potatoes. The rate forwinter wheat remained unchanged. Except for potatoes (where there was a decrease) theaverage field rates (Table B1.4) showed a similar trend.
Winter wheat
After increases in 2002 and 2003, the overall rate of total nitrogen on winter wheat remainedunchanged at 197 kg/ha in 2004, the highest level in the five year period (Table B1.3). Theaverage field rate (Table B1.4) followed a similar pattern and at 199 kg/ha was also unchangedand the highest for the period. The majority of the nitrogen continued to be applied in thestraight form.
The field cropping information collected in the Survey enables separate estimates to be madeof nitrogen fertiliser use on milling and non-milling (feed/seed) categories of winter wheat(Table B1.5).
The mean difference of 26 kg/ha in average nitrogen rate between milling and non-millingwheats reflects differences in crop husbandry and nitrogen management practices.
Nitrogen fertiliser requirements for winter wheat depend on the intended market end use (grainN levels), as well as upon soil type and the residual soil nitrogen fertility from previouscropping and manure practice11. Milling varieties are often grown as a second wheat and oftenreceive extra nitrogen, either as a solid dressing or as late foliar urea spray, which is appliedto improve the chances of achieving an adequate grain protein content for a milling premium.High yielding feed crops, rather than lower yielding varieties of milling wheat, are often grownas a first winter wheat after a break crop. This is to exploit the potential yield and residual soilnitrogen benefits from the crop rotation, and also to avoid any risk of lower grain proteinconcentrations as a result of high yield diluting the grain nitrogen concentration for first wheatin the rotation.
The non-milling crop continues to be the major crop area (Table B1.6) with only 30% of thecrop area in 2004 as milling wheat (5 year mean: 30%).
11Anon (2000). Fertiliser Recommendations for Agricultural and Horticultural Crops. MAFF Reference Book209 (Seventh edition). London: The Stationery Office.
BSFP final inner 10/12/05 11:05 am Page 16

17
Table B1.6 Percentage distribution (% crop area) of cereal crop areas by market use,Great Britain 2000 - 2004, as estimated from the Survey
2000 28 72 59 41 27 732001 31 69 54 46 31 692002 27 73 61 39 33 672003 33 67 63 37 36 642004 30 70 60 40 33 67
winter wheat spring barley winter barleymilling non-milling malting non-malting malting non-malting
12Anon (2000). Fertiliser Recommendations for Agricultural and Horticultural Crops. MAFF ReferenceBook 209 (Seventh edition). London: The Stationery Office.
Spring barley
Overall use of total nitrogen on spring barley declined slightly to 104 kg/ha in 2004 which isthe lowest for the five year period (mean: 108 kg/ha). The overall rate of straight nitrogendecreased in 2004 falling to the lowest value for the period (59 kg/ha) whilst the compoundnitrogen rate decreased slightly to 45 kg/ha. The lowest value for the period was 43 kg/ha in2002. Average field rates showed a similar pattern.
Further analysis of the data by crop type (Table B1.5) shows a decline in the average rateapplied to the spring malting crop in 2003 and 2004 compared with the high rates of theprevious two years. For non-malting crops nitrogen application rate was at its highest for theperiod (103 kg/ha) in 2000. In 2004 it remained the same as the low level (99 kg/ha) applied2003.
Estimated nitrogen rates on malting crops have been consistently slightly higher on maltingthan non-malting crops, with a mean difference of 13 kg/ha over the last five years.
This slightly higher use of nitrogen on malting than non-malting crops may seem anomalous,since lower rates of nitrogen are recommended for malting barley, under the same conditionsof soil type and nitrogen fertility level, than for the feed varieties of barley. Thisrecommendation is made to avoid the risk of high grain nitrogen content, which wouldadversely affect subsequent malt quality. However, malting crops are normally grown on soilswith low nitrogen fertility and the average field rates of nitrogen reported for malting varietiesin Table B1.5 are generally in the range recommended for mineral soil types with low nitrogenresidues (70 - 120 kg/ha)12. Feed crops on the other hand are often grown within mixedrotations, which tend to have a higher soil nitrogen fertility, with consequently less need fornitrogen fertiliser.
The proportion of spring barley grown for malting has fluctuated during the last five years(Table B1.6). The mean for the period 2000-2004 is 59%.
BSFP final inner 10/12/05 11:05 am Page 17

18
Winter barley
Overall total nitrogen use on winter barley decreased in 2004 to 144 kg/ha after reaching thehighest level (154 kg/ha) for the 2000-2004 period in 2002 (mean: 147 kg/ha). The overall useof straight nitrogen has fluctuated during the period and at 125 kg/ha in 2004 is the lowest forthe five year period (mean: 129 kg/ha). The overall compound nitrogen rate has also fluctuatedwith the lowest level of 12 kg/ha in 2000 and the highest level of 22 kg/ha in 2002 (mean: 18 kg/ha). Average field rates show a similar pattern.
Nitrogen requirements for winter barley, as with the spring sown crop, depend on a range ofagronomic factors, including the intended market for the grain. Field average rates of nitrogencontinued to decline on malting crops (-11 kg/ha) to 134 kg/ha and by 1 kg/ha to 151 kg/ha onnon-malting crops in 2004 after the high levels of 2002 (Table B1.5)
The higher application rates of nitrogen (five-year mean of +13 kg/ha) on non-malting,compared to malting winter barley crops, reflect typical agronomic practice. The majority ofwinter barley crops (both feed and malting) are grown in England in arable rotations, usuallyafter a previous cereal crop, when the soil nitrogen fertility status is low. Higher nitrogen ratesare recommended for feed crops.
After a gradual increase from 2000 to 2003 the survey estimates showed a drop in the relativecrop area grown for malting in 2004, down to 33% (Table B1.6).
Maincrop potatoes
Overall total nitrogen use on maincropa potatoes has fluctuated over the last five years, in 2004it increased by 2 kg/ha to 154 kg/ha, slightly below the five year mean of 155 kg/ha (TableB1.3). This increase appears to be mainly due to an increase in the area receiving straightnitrogen. Overall most of the nitrogen input for maincrop potatoes is applied in compoundform.
Oilseed rape
Overall total nitrogen use on oilseed rape, as a combined category for both the autumn andspring sown crop, increased in 2004 to the highest level for the 2000-2004 period (202 kg/ha)after reaching the lowest level (191 kg/ha) in 2003 (mean: 196 kg/ha). The average field rateshowed a similar fluctuation. Straight nitrogen is the main source of nitrogen for the oilseedrape crop.
A more detailed breakdown of the data for oilseed rape (Table B1.7) shows that the averagefield rate of nitrogen on winter oilseed rape has been relatively stable during the 2000-2003period (range: 203-211 kg/ha) compared with the spring crop (range: 133-151 kg/ha). Thehighest levels occurred in 2004 and 2001 respectively. The five-year mean nitrogen rates were207 kg/ha for winter oilseed rape, compared to 140 kg/ha for spring oilseed rape.
BSFP final inner 10/12/05 11:05 am Page 18

19
Most of the oilseed rape area is autumn, rather than spring sown (Table B1.7). The lowest areasof winter crops (81%) occurred in 2001 and 2003. The high level of spring cropping in 2001was almost certainly due to the very wet conditions in autumn 2000. In contrast the autumns of2002 and 2003 were very dry during August and September so that winter sown crops did notestablish well and were often re-drilled with a spring crop.
Sugar beet
The overall nitrogen use on sugar beet decreased (-8 kg/ha) in 2004 to 95 kg/ha, this is less thanthe mean for the five year period 2000-2004 of 102 kg/ha. Average field rates showed a similarpattern of slight fluctuations with a five year mean of 107 kg/ha. Most of the nitrogen input forsugar beet is applied as straight nitrogen.
Table B1.7 Average field application rates of nitrogen (kg/ha) on winter and spring oilseed rape and percentage distribution (%) of crop areas, Great Britain 2000 - 2004
Total nitrogen (kg/ha) Percentage distribution (%)
2000 203 1332001 209 1512002 207 1372003 206 1412004 211 136
winter springoilseed rape oilseed rape
2000 90 102001 81 192002 91 92003 81 192004 89 11
winter springoilseed rape oilseed rape
BSFP final inner 10/12/05 11:05 am Page 19

20
B1.2.2 PHOSPHATE AND POTASH
Phosphate
The small change in overall phosphate use on tillage crops in 2004 can be partly attributed tothe lack of change in use on most of the major arable crops (Table B1.3). Only winter barley(down) and potatoes (up) showed a significant change in rate. Average field rates showed thebiggest changes for potatoes (down) and sugar beet (up). In spite of annual fluctuations theunderlying trend for the major tillage crops from 2000-2004 is a reduction in both overall andaverage field rates of phosphate use. The area receiving phosphate fertiliser has fluctuatedthroughout the five year period, except for wheat where there is a gradual decline from 64 to61% (mean: 62%).
Overall phosphate rates for cereals in 2004 were: winter wheat 39 kg/ha, spring barley 44 kg/ha, and winter barley 46 kg/ha (+5 kg/ha) (Table B1.3). The rate for winter wheat wasthe lowest recorded value in the period 2000 to 2004. The average field rate for each cereal cropwere 63, 53 and 61 kg/ha for winter wheat, spring barley and winter barley respectively. Therates for winter wheat and spring barley were the lowest for the five year period. The areareceiving phosphate fertiliser remained lower for winter wheat (61%) and winter barley (74%)than for spring barley (84%), this is mainly due to the greater use of NPK compounds on thelatter.
The overall rate of phosphate on maincrop/second early potatoes was reduced by 5 kg/ha to 125 kg/ha in 2004, this is one of the lowest values for the five year period (mean: 132 kg/ha).The average field rate shows similar annual variation (mean: 157 kg/ha). Except in 2001 whenit was 78%, the area of maincrop potatoes receiving phosphate has been relatively static (range:85-87%) during the other four years.
The overall application rate of phosphate showed little change in 2004 (39 kg/ha) comparedwith 2003 (38 kg/ha), the latter being the lowest value for the period. The highest rate occurredin 2002 and the mean for the period 2000-2004 was 42 kg/ha. The average field rate showssimilar fluctuations.
The recorded overall rate of phosphate on sugar beet increased slightly in 2004 to 36 kg/hafrom the lowest value for the period of 34 kg/ha in 2003 (mean: 38 kg/ha). The average fieldrate shows similar fluctuations. There was little change in area receiving phosphate fertiliser at51% (mean: 51%).
Potash
Overall potash use on tillage crops showed little change in 2004, partly due to the limitedchanges in application rates on cereal crops which represent a large area of the major tillagecrops. Average field rates of potash use on cereals are also largely unchanged in 2004. For eachof the major tillage crops the area receiving potash fertiliser has remained fairly static but theaverage field rates of potash on these crops have fluctuated throughout the period.
The overall potash use on cereals was largely unchanged at 48, 57 and 62 kg/ha for winterwheat, spring barley and winter barley respectively (Table B1.3). The corresponding averagefield rates were 78, 65 and 79 kg/ha (Table B1.4). The area receiving potash fertiliser hasremained fairly static throughout the period 2000-2004.
The overall potash rate on maincrop potatoes decreased in 2004 by 13 kg/ha to 201 kg/ha.There has been a great deal of fluctuation in overall rate during the period 2000-2004 (range:184-234 kg/ha, mean: 211 kg/ha). In comparison the average field rate has been less variable(range: 231-265 kg/ha, mean: 240 kg/ha). Thus the fluctuations in overall rate appear to be due
BSFP final inner 10/12/05 11:05 am Page 20

21
to changes in the area receiving potash fertiliser (for example only 79% in 2001 compared with91% in 2003).
In 2004 potash use on oilseed rape increased to 46 kg/ha for the overall rate and 72 kg/ha forthe average field rate. The highest overall potash use for the five-year period was 50 kg/ha in2002 (mean: 45 kg/ha).
Overall rates of potash for sugar beet have fluctuated throughout the period 2000-2004 (Table1.3), with the highest values (104 kg/ha) in 2002 and 2004 and the lowest value (78 kg/ha) in2001. The mean for the five year period is 94 kg/ha. Fluctuations in overall rate are partlyrelated to average field rate and partly with changes in the area receiving fertiliser. For examplethe increase in overall rate in 2004 was associated with an increase in the average field rate of+5 kg/ha and by an increase in the dressing cover from 72% to 80%.
Part of the reason for recent apparent fluctuations in estimates of nutrient application rates forsugar beet and potatoes may be because these crops are not always managed by the farmersthemselves; it is recognised that information on the nutrient content of fertilisers applied bycontractors, is less reliably reported by farmers than for self-applied products.
B1.2.3 SULPHUR
The risk of sulphur deficiency in crops such as oilseed rape, cereals and intensively cut grass,which have a high sulphur requirement, has increased appreciably over the last decade.Sulphur reserves have become depleted in some soil types, particularly sandy and shallow soils,because of the continuing reduction in sulphur dioxide emissions from industrial sources andconsequent decline in atmospheric deposition of sulphur over the last thirty years13. Sulphurapplication is now an essential agronomic requirement for susceptible crops grown in mostparts of Great Britain.
The Survey has collected detailed information on sulphur fertiliser use since 1993, when only3-6% of the cereal crop areas and 8% of the oilseed rape area received an application ofsulphur. By 1997, the proportions of these crop areas which were treated with sulphur hadincreased markedly to 13-14% for cereals and 30% for oilseed rape. Since then, however,dressing covers for sulphur generally remained fairly static until 2002 when the areasincreased. There have been further increases since then with over half the oilseed rape cropnow being treated (Table B1.8).
Over the last five years the underlying trend in average application rates has been upwardsalthough for cereals the levels in 2004 have stayed the same or declined compared with 2003.The rate for oilseed rape is the highest ever recorded (85 kg/ha) (Table B1.8). The rates appliedare generally higher than the recommended practice of 25-40 kg/ha SO3, applied as a watersoluble form in early spring, for potentially sulphur-deficient cereal crops and 50-75 kg/ha foroilseed rape14.
13McGrath S P, Zhao F J and Blake-Kalff M M A (2002). History and outlook for sulphur fertilisers in Europe.Proceedings No. 497. The International Fertiliser Society, York. ISBN 0 85310 133 7.
14Anon. (2000). Fertiliser Recommendations for Agricultural and Horticultural Crops. MAFF Reference Book 209(Seventh edition). London: The Stationery Office.
BSFP final inner 10/12/05 11:05 am Page 21

22
In general a higher proportion of cereal and oilseed crops are treated with sulphur in Scotlandthan in England & Wales (Table B1.9). This regional difference probably reflects the greaterawareness of the risk of sulphur deficiency in Scotland, due to historically extremely low levelsof atmospheric sulphur deposition, compared to most other areas of Britain. However there isevidence in recent years that farmers in England & Wales are now more aware of the need toapply sulphur.
* Scottish data are apparently more variable due to smaller sample sizes.
winter winter spring oilseedwheat barley barley rape
Table B1.8 Dressing cover (% area) and average application rate (kg/ha SO3) of sulphur on cereals and oilseed rape, Great Britain 2000 - 2004
Dressing cover (%)
2000 15 16 18 292001 18 19 15 262002 28 27 25 472003 30 35 27 542004 38 37 27 57
Average field rate (kg/ha SO3)
2000 49 45 39 682001 51 48 36 612002 48 54 40 782003 53 53 48 742004 53 48 46 85
winter winter spring oilseedwheat barley barley rape
Table B1.9 Dressing cover (% area) of sulphur on cereals and oilseed rape by region,2000 - 2004
England & Wales 2000 13 14 14 25
2001 17 14 11 23
2002 27 22 20 43
2003 29 34 27 55
2004 37 35 25 57
Scotland* 2000 45 29 22 55
2001 34 35 19 56
2002 51 54 28 72
2003 42 39 28 49
2004 59 57 29 60
winter winter spring oilseedwheat barley barley rape
BSFP final inner 10/12/05 11:05 am Page 22

23
B1.3 FERTILISER USE ON GRASSLAND
Overall fertiliser usage on grassland in Great Britain over the last five years, as previouslyshown in Tables B1.1 and B1.2, is summarised again in Table B1.10. The correspondingestimates of dressing cover and average field rates for each nutrient are shown in Table B1.11.
The 6 kg/ha drop in overall total nitrogen use on grassland in 2004 was associated with adecrease in the average field rate for nitrogen (Table B1.11) which at 109 kg/ha is the lowestfor the period.
Over the last five years, the dressing cover for straight nitrogen has shown a gradual declinefrom a level of 35% in 2000 down to 25% in 2004. The corresponding average field rates havenot shown any consistent change during this period. The area receiving compound nitrogen hasfluctuated during the period, reaching its lowest level (56%) in 2003, (period mean: 59%). Theaverage field rate for compound nitrogen has also fluctuated but not in the same pattern, thelowest rate for the period (84 kg/ha) occurring in 2000 (period mean: 92%).
Average field rates for phosphate and potash were at their lowest level for the five year periodin 2003, falling to 29 kg/ha for phosphate and 38 kg/ha for potash compared with a mean forthe period of 32 kg/ha and 41 kg/ha respectively. The dressing cover which has variedthroughout the last five years, increased slightly in 2004 after reaching the lowest level for bothphosphate and potash in 2003 (five year mean: 59% phosphate and 58% potash).
Table B1.10 Overall fertiliser use (kg/ha) on grassland, Great Britain 2000 - 2004
2000 43 56 99 20 262001 39 55 94 19 242002 32 57 89 20 252003 31 53 83 18 222004 27 51 77 17 22
straight compound total total totalnitrogen nitrogen nitrogen phosphate potash
Table B1.11 Dressing cover (%) and average application rate (kg/ha) of fertiliser on grassland, Great Britain 2000 - 2004
Dressing cover (%)
2000 35 67 75 60 592001 31 57 72 58 582002 28 59 73 60 592003 27 56 70 57 572004 25 58 70 59 59
straight compound total total totalnitrogen nitrogen nitrogen phosphate potash
Average field rate (kg/ha)
2000 123 84 133 34 452001 128 96 133 32 422002 113 97 122 33 422003 114 94 119 31 392004 107 88 109 29 38
straight compound total total totalnitrogen nitrogen nitrogen phosphate potash
BSFP final inner 10/12/05 11:05 am Page 23

24
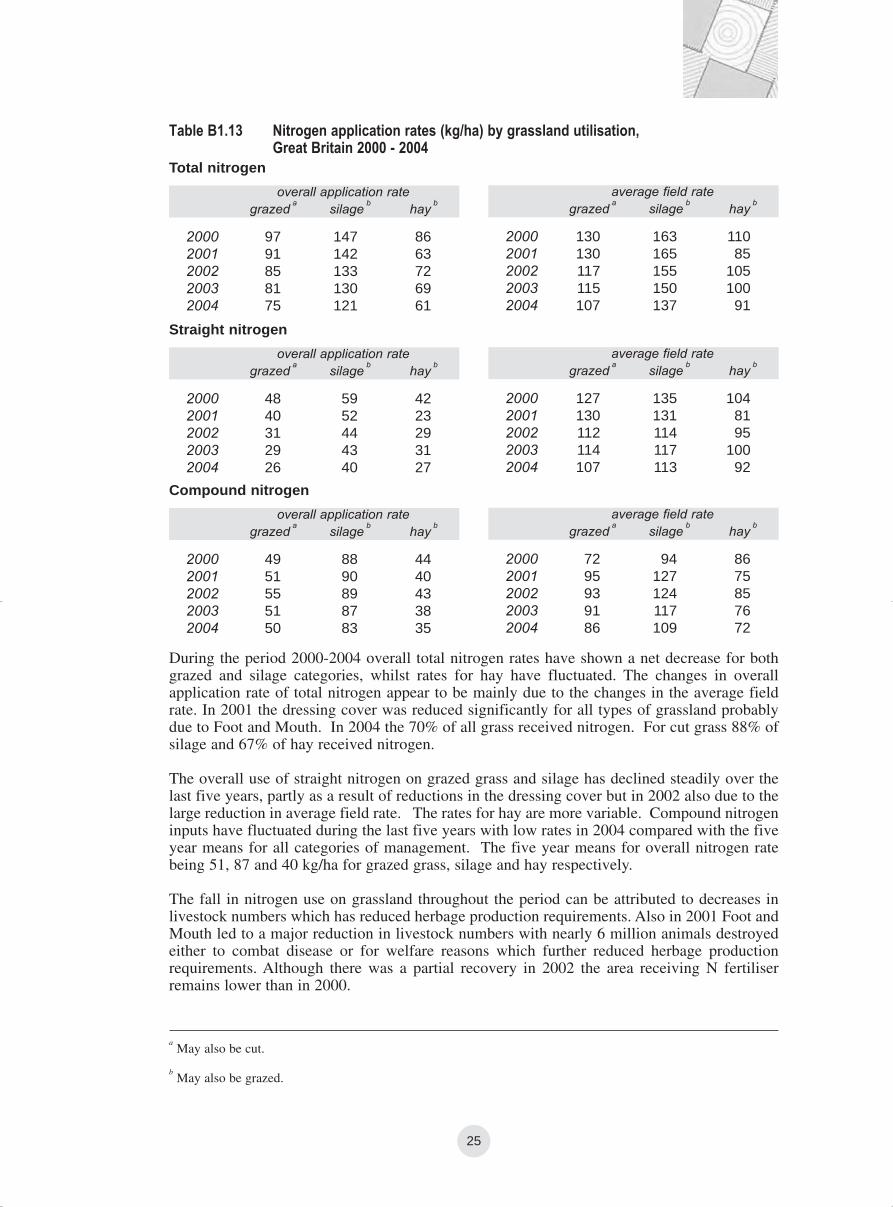
B1.3.1 NITROGEN
The survey information collected for grassland fields enables nitrogen and other fertilisernutrient usage to be assessed in more detail according to sward management practice.
Cutting and grazing management
Fertiliser requirements for grassland vary according to the type of livestock enterprise, intensityof production and the associated cutting and grazing regimes used for sward management.Fertiliser use on dairy, other livestock and mixed farms in England & Wales and in Scotland in2004 are presented in Section C tables. The Survey estimates for annual distributions of thetotal grassland area between grazing and cutting management regimes since 2000 aresummarised in Table B1.12. These should not be taken as authoritative national estimates ofgrassland utilisation, as the Survey is designed to estimate fertiliser application rates, not toderive accurate crop areas. Fertiliser usage for the different cutting and grazing categories ispresented in Table B1.13. The differences in average field rates for each nutrient illustrate theinfluence of grassland management practice on fertiliser inputs.
Nearly all grassland is grazed at some stage during the season (Table B1.12). In 2001 grazingand hay decreased whilst silage increased. It is not possible to say how much this may havebeen influenced by Foot and Mouth. Since then grassland utilisation for cutting and grazinghad shown very little change.
Table B1.12 Grassland utilisation (% of grass area), Great Britain 2000 - 2004
2000 93 33 132001 91 38 102002 92 31 102003 93 29 102004 94 29 11
grazeda
silageb
hayb
aMay also be cut.
bMay also be grazed.
BSFP final inner 10/12/05 11:05 am Page 24
25
Table B1.13 Nitrogen application rates (kg/ha) by grassland utilisation,Great Britain 2000 - 2004
Total nitrogen
2000 97 147 862001 91 142 632002 85 133 722003 81 130 692004 75 121 61
overall application rategrazed
asilage
bhay
b
2000 130 163 1102001 130 165 852002 117 155 1052003 115 150 1002004 107 137 91
average field rategrazed
asilage
bhay
b
Straight nitrogen
2000 48 59 422001 40 52 232002 31 44 292003 29 43 312004 26 40 27
overall application rategrazed
asilage
bhay
b
2000 127 135 1042001 130 131 812002 112 114 952003 114 117 1002004 107 113 92
average field rategrazed
asilage
bhay
b
Compound nitrogen
2000 49 88 442001 51 90 402002 55 89 432003 51 87 382004 50 83 35
overall application rategrazed
asilage
bhay
b
2000 72 94 862001 95 127 752002 93 124 852003 91 117 762004 86 109 72
average field rategrazed
asilage
bhay
b
aMay also be cut.
bMay also be grazed.
During the period 2000-2004 overall total nitrogen rates have shown a net decrease for bothgrazed and silage categories, whilst rates for hay have fluctuated. The changes in overallapplication rate of total nitrogen appear to be mainly due to the changes in the average fieldrate. In 2001 the dressing cover was reduced significantly for all types of grassland probablydue to Foot and Mouth. In 2004 the 70% of all grass received nitrogen. For cut grass 88% ofsilage and 67% of hay received nitrogen.
The overall use of straight nitrogen on grazed grass and silage has declined steadily over thelast five years, partly as a result of reductions in the dressing cover but in 2002 also due to thelarge reduction in average field rate. The rates for hay are more variable. Compound nitrogeninputs have fluctuated during the last five years with low rates in 2004 compared with the fiveyear means for all categories of management. The five year means for overall nitrogen ratebeing 51, 87 and 40 kg/ha for grazed grass, silage and hay respectively.
The fall in nitrogen use on grassland throughout the period can be attributed to decreases inlivestock numbers which has reduced herbage production requirements. Also in 2001 Foot andMouth led to a major reduction in livestock numbers with nearly 6 million animals destroyedeither to combat disease or for welfare reasons which further reduced herbage productionrequirements. Although there was a partial recovery in 2002 the area receiving N fertiliserremains lower than in 2000.
BSFP final inner 10/12/05 11:05 am Page 25

26
B1.3.2 PHOSPHATE AND POTASH
Phosphate and potash requirements for grassland depend, as for nitrogen, on the swardmanagement system.
Overall phosphate rates fluctuated throughout the period 2000-2004 (Table B1.14), with anunderlying downward trend for grazed grass. In 2004 the rates of 17, 26 and 14 kg/ha forgrazed grass, silage and hay respectively were the lowest or equal lowest for the period. Thecorresponding five year means were 18, 28 and 17 kg/ha. Average field rates showed a similarpattern. Grass cut for silage is more likely to receive phosphate (74%) than grazed grass (59%)or hay (49%).
Like phosphate there have been fluctuations in overall potash rates between years but theunderlying trend is downwards with a net decrease in inputs to all types of grass. Overall ratesin 2004 were the lowest (or equal lowest) for the period. The biggest decline has occurred withgrazed grass and silage. Average field rates show a similar trend. Grass cut for silage is morelikely to receive potash (79%) than grazed grass (59%) or hay (50%).
Most phosphate and potash fertiliser inputs on grassland are applied in some form of NPKcompound (Section C).
Total phosphate
2000 20 30 182001 18 27 152002 19 30 202003 17 27 162004 17 26 14
overall application rategrazed
asilage
bhay
b
2000 33 40 332001 31 38 282002 32 42 372003 30 37 312004 29 36 29
average field rategrazed
asilage
bhay
b
Total potash
2000 25 47 212001 23 45 182002 23 47 242003 21 43 182004 21 42 18
overall application rategrazed
asilage
bhay
b
2000 43 62 422001 40 59 352002 40 63 442003 37 57 362004 36 53 36
average field rategrazed
asilage
bhay
b
aMay also be cut.
bMay also be grazed.
Table B1.14 Phosphate and potash use (kg/ha) by grassland utilisation,Great Britain 2000 - 2004
BSFP final inner 10/12/05 11:05 am Page 26

27
B1.3.3 SULPHUR
The risk of sulphur deficiency is increasing15 in grassland, where it can cause loss of herbageyield. Quality is also affected because sulphur deficiency causes a widening of the N:S ratio ingrassland which results in a reduction in digestibility for ruminants. The risk is greatest wheregrassland is cut intensively for silage, and is less likely where swards are used mainly forgrazing or single hay cuts. Potential yield losses of silage due to sulphur deficiency on coarsetextured or shallow soils in low sulphur deposition areas are most likely to occur in second andsubsequent cuts, rather than first cut, unless the deficiency is very severe. The Survey dataconfirm that, as expected, a higher proportion of grassland cut for silage is treated with sulphurcompared to grazed grass or grass cut for hay (Table B1.15). Estimated dressing coversdecreased slightly in 2001 (possibly due to Foot and Mouth), but have increased since, mostnotably on silage in 2002. The total area of grass treated in 2004 (6%) was similar to that inthe previous year and represents a 4% increase from the value recorded in 1993, wheninformation on sulphur applications was first collected in the Survey.
The significant proportion of heavier textured soil types which occur in the main grasslandfarming areas, and inputs of sulphur from slurry applications to silage fields, are amongpossible reasons for the current low level of sulphur fertiliser use on grassland. Insufficientfarmer awareness about the risks of sulphur deficiency in cut grass, particularly for second cutsilage, may also be a contributory factor.
Estimated average field rates of sulphur application for each sward management category didnot show any consistent changes during 2000-2004, with five year means of 38, 41 and 40 kg/ha SO3 for grazed, silage and hay grassland, respectively (Table B1.15). Note that theaverage application rates in Table B1.15 are annual totals, not rates per cut. The recommendedrate for silage grass is 40 kg/ha SO3 for each susceptible cut.
Table B1.15 Sulphur use on grassland, Great Britain 2000 - 2004
Dressing cover (%)
2000 4 9 4 52001 2 5 2 22002 5 12 4 62003 4 10 6 52004 5 10 5 6
Average field rate (kg/ha SO3)
2000 40 44 41 412001 34 33 30 312002 42 48 57 442003 37 44 44 402004 36 37 29 38
grazeda
silageb
hayb
all grass
grazeda
silageb
hayb
all grass
15McGrath S P, Zhao F J and Blake-Kalff M M A (2002). History and outlook for sulphur fertilisers in Europe.Proceedings No. 497. The International Fertiliser Society, York. ISBN 0 85310 133 7.
aMay also be cut.
bMay also be grazed.
BSFP final inner 10/12/05 11:05 am Page 27

28
B2 LONGER TERM TRENDS
B2.1 LONGER TERM TRENDS FOR GREAT BRITAIN
The British Survey of Fertiliser Practice was first undertaken as an integrated British survey in1992. Before then, the annual Survey of Fertiliser Practice had been carried out separately forEngland & Wales and for Scotland. Survey statistics from those earlier surveys have, however,been collated in order to report an aggregated series for total nitrogen, phosphate and potashuse on tillage crops and grassland in Great Britain since 1983, when the survey in Scotlandstarted. Data series are also presented in this section for England & Wales, starting from 1969when the present design of the survey was first used, and for Scotland, beginning in 1983. Theaggregated data for Great Britain follow a similar pattern to that observed for England & Wales,because a large proportion of both the tillage and grassland areas in Britain is located inEngland & Wales.
B2.1.1 NITROGEN USE
Overall total nitrogen rates for tillage crops and grassland in Great Britain since 1983 aresummarised in Table B2.1 and presented graphically in Figure B2.1(a). Overall nitrogen usehas been consistently higher on tillage crops than on grassland ever since the British surveystarted.
The maximum overall rate of nitrogen on tillage crops was recorded in the mid 1980s, at 157 kg/ha. Overall nitrogen use dropped in 1988 and, since then, has remained at a lower levelwith annual rates mostly in the range 145-149 kg/ha. However, larger fluctuations in overallnitrogen rates were recorded in both 1991, when there was a temporary increase to 151 kg/ha,and in 1993, when the application rate fell sharply to 137 kg/ha. Overall nitrogen use showedanother, smaller drop in 1998-99 before reaching a levels of 149 kg/ha in 2000. The 152 kg/ha
Table B2.1 Total overall nitrogen application rates (kg/ha), Great Britain 1983 - 2004
1983 149 126 1361984 157 131 1431985 157 131 1441986 152 132 1421987 157 130 1431988 146 119 1321989 147 124 1361990 147 129 1381991 151 129 1391992 147 105 1241993 137 112 1231994 149 116 1311995 149 118 1321996 145 113 1281997 149 123 1361998 144 109 1261999 141 110 1252000 149 99 1232001 145 94 1162002 150 89 1172003 149 83 1132004 152 77 110
tillage crops grass all crops and grass
BSFP final inner 10/12/05 11:05 am Page 28

29
rate in 2004 is the highest since 1987. The downward shift in total nitrogen use on tillage cropsduring the 1980s and 1990s was caused by the combined effects of changes in:
(i) the relative cropping areas of the major arable crops, as influenced by seasonal weatherand market economic factors,
(ii) the widespread introduction of set-aside in 1993,
(iii) the nitrogen application rates for particular crops (see Figure B2.2 (a)).
Most of total nitrogen fertiliser used on tillage crops each year has, since 1983, been applied instraight form.
Overall nitrogen use on grassland also peaked in the mid 1980s, at around 131 kg/ha, and thendropped very sharply to 119 kg/ha in 1988 before largely recovering over the following threeyears. Subsequent nitrogen use has, however, declined as a result of the net effects of a verysignificant drop in overall application rate in 1992 and, despite some recovery over thefollowing five years, further falls occurred in 1998 through to 2004. The overall nitrogen rateof 77 kg/ha on grassland in 2004 was the lowest rate recorded so far in the British survey and,over a longer timescale, this level of nitrogen use had not been observed in England & Walessince the early 1970s (see Figure B2.3 (a)).
Overall nitrogen use on all crops and grassland, as a single category averaged at 142 kg/ha(peak 144 kg/ha) in the first five years (1983-1987) of the Great Britain data set. The meansfor each of the subsequent five year periods are 1988-92: 134 kg/ha, 1993-1997: 130 kg/ha,1998-2002: 121 kg/ha and 2003-to date: 111 kg/ha, reflecting the downward trend observed onboth grassland and, to a lesser extent, on tillage crops (Table B 2.1).
BSFP final inner 10/12/05 11:05 am Page 29

30
Figure B2.1 Overall application rates (kg/ha) of (a) total nitrogen and (b) phosphate and potash on tillage crops and grassland, Great Britain 1983 - 2004
(a)
0
20
40
60
80
100
120
140
160
180
198
3
198
4
198
5
198
6
198
7
198
8
198
9
199
0
199
1
199
2
199
3
199
4
199
5
199
6
199
7
199
8
199
9
200
0
200
1
200
2
200
3
200
4
kg
/ha
N
Total nitrogen on tillage Total nitrogen on grass
(b)
0
10
20
30
40
50
60
70
80
198
3
198
4
198
5
198
6
198
7
198
8
198
9
199
0
199
1
199
2
199
3
199
4
199
5
199
6
199
7
199
8
199
9
200
0
200
1
200
2
200
3
200
4
kg
/ha
nu
trie
nt
Phosphate on tillage Phosphate on grass
Potash on tillage Potash on grass
BSFP final inner 10/12/05 11:05 am Page 30

31
Overall phosphate use on tillage crops had gradually declined over the period since 1983, froma five-year mean of 58 kg/ha in 1983-87, 54 kg/ha in 1988-1992, 53 kg/ha in 1993-97 to 46 kg/ha for the period 1998-2002. The 2003 rate of 40 kg/ha was the lowest since GreatBritain records began in 1983.
The overall rate of phosphate on grassland was highest in 1983, at 28 kg/ha, and thenapplication remained relatively stable at 23-25 kg/ha between 1985 and 1997, apart from atemporary recorded drop to 21 kg/ha in 1992-93. However, overall phosphate use has decreasedgradually since 1997 to a level of 16 kg/ha in 2003, the lowest recorded since 1983. The five-year means have been 25 kg/ha in 1983-87, 23 kg/ha in 1988-1992, 23 kg/ha in 1993-97, 20 kg/ha in 1998-2002 and 18 kg/ha for the period 2003-04.
Overall potash use on tillage crops had declined slightly between 1983 and 1997, with a five-year mean of 64 kg/ha in 1983-87, 63 kg/ha in 1998-1992, 62 kg/ha in 1993-1997. There waslarger drop to 57 kg/ha for the period 1998-2002. The overall application rate appeared torecover in 1997, but then dropped each year to a low of 52 kg/ha in 2001, it has recoveredslightly since then. The 2001 value is the lowest level recorded since 1983 and represents a23% fall from the peak value of 68 kg/ha in 1984. Like phosphate use on tillage, the 2001 levelwas associated principally with a higher proportion of spring barley, which has a lower fertiliserrequirement.
Table B2.2 Overall phosphate and potash application rates (kg/ha),Great Britain 1983 - 2004
1983 55 60 28 29 40 431984 62 68 26 33 42 491985 58 64 25 32 41 481986 57 62 23 33 40 471987 58 64 24 33 40 481988 56 63 23 31 39 471989 54 62 24 34 39 481990 53 64 25 36 39 491991 54 63 23 34 38 491992 53 61 21 28 36 441993 51 60 21 28 34 431994 53 63 24 31 38 461995 53 61 24 31 37 451996 52 61 23 30 36 441997 55 67 25 35 39 501998 51 64 21 29 35 461999 45 57 20 28 32 422000 47 55 20 26 32 402001 43 52 19 24 29 37 2002 44 57 20 25 31 402003 40 54 16 22 28 362004 41 55 17 22 28 37
tillage crops grass all crops and grassphosphate potash phosphate potash phosphate potash
B2.1.2 PHOSPHATE AND POTASH USE
Annual overall rates of phosphate and potash on tillage crops and on grassland since 1983 areillustrated in Figure B2.1(b), using the data presented in Table B2.2. Overall rates of phosphateand potash applied to tillage crops were approximately double those used on grassland.
BSFP final inner 10/12/05 11:05 am Page 31

32
The pattern of overall potash use on grassland has been more variable, compared to tillagecrops, but has also shown a net decline between 1983 and 2003. Overall potash rates wererelatively stable at 31-33 kg/ha during the mid-late 1980s but, since then, have tended todecline despite temporary recorded increases in 1989-91 and in 1997. Annual potash usebetween 1998-2002 has been consistently lower (mean: 26 kg/ha) than in earlier years and thevalue of 22 kg/ha in 2003 and 2004 represents the lowest values recorded since 1983.
B2.1.3 FERTILISER USE ON MAJOR TILLAGE CROPS
Overall application rates of total nitrogen, phosphate and potash on the main arable crops inGreat Britain since 1983 are shown in Figure B2.2.
Nitrogen
Between 1983-87 the five year mean for winter wheat was 189 kg/ha. Over the following fiveyears it declined to 185 kg/ha, increasing to 188 kg/ha for the period 1993 to 1997 and droppingslightly to 187 kg/ha in 1998-2002. The rates of 197 kg/ha in 2003 and 2004 (Figure B2.2(a))are the highest recorded since 1983. For winter barley the mean since 1988 has settled at about10 kg/ha less than the peak of 153 kg/ha in 1983-87. For spring barley the mean for the 1998-2002 five year period at 104 kg/ha is higher than each of the previous five years cycles(99, 92 and 95 kg/ha) and the values in the new millennium are the highest since records startedin 1983.
Nitrogen use on oilseed rape decreased between 1984 and 1994 and then showed a slightrecovery. Before 1992, this change was mainly caused by reductions in autumn-appliednitrogen, as a result of cutbacks in both area treated and average rate. Between 1992 and 1994the decreases in total nitrogen use resulted from reduced autumn and spring nitrogenrecommendations for oilseed rape. This reflected economic change associated with theintroduction of Arable Area Payments, and a temporary increase in the proportion of spring-sown crops, which have a lower nitrogen requirement than winter oilseed rape. After reachinga low of 179 kg/ha in 1994 rates have tended to fluctuate between 188 kg/ha and 203 kg/ha,mean usage for the period 1993-1997 was 188 kg/ha compared with 194 kg/ha for 1998-2002.The value of 202 kg/ha in 2004 is the highest since 1997.
Since the early 1980s, overall nitrogen use on maincrop potatoes has tended to decrease,despite some large variability in estimated annual rates; mean usage was 197, 187, 179 and 163 kg/ha for the periods 1983-1987, 1988-1992, 1993-1997 and 1998-2002 respectively.Sugar beet has also experienced a decline (137, 120 113 and 104 kg/ha) over the same periods.Mean rates of 153 kg/ha for maincrop potatoes and 99 kg/ha for sugar beet for 2003-2004continue the decline. The trend towards less nitrogen use on sugar beet reflects greater industryand farmer awareness about the adverse effects of unnecessarily high nitrogen input on sugaryield, related to the formation of high concentrations of amino-nitrogen compounds in theroots.
Phosphate and potash
Overall application rates of phosphate have gradually declined on winter wheat and, lessconsistently, on winter barley since the mid 1980s (Figure B2.2(b)); the mean for the five yearperiod 1998-2002 showed a drop to below 50 kg/ha for the first time in both crops (43 kg/hafor winter wheat and 47 kg/ha for winter barley). This downward trend has continued with afall to 39 and 44 kg/ha for winter wheat and winter barley respectively for the 2003-2004period. In contrast, however, phosphate use has risen slightly on spring barley between 1983and 1997, but has declined since then. Overall phosphate use has also declined on oilseed rape,maincrop potatoes and sugar beet with means for 1983-87 of 61, 206 and 64 kg/ha respectivelydeclining to 42, 133 and 38 in the new millennium.
BSFP final inner 10/12/05 11:05 am Page 32

33
Figure B2.2 Overall application rates (kg/ha) of (a) total nitrogen, (b) phosphate and (c) potash on major arable crops, Great Britain 1983 - 2004
(c)
0
50
100
150
200
250
300
19
83
19
84
19
85
19
86
19
87
19
88
19
89
19
90
19
91
19
92
19
93
19
94
19
95
19
96
19
97
19
98
19
99
20
00
20
01
20
02
20
03
20
04
kg
/ha
pota
sh
Wi t h t Wi t b l S i b l
(b)
0
50
100
150
200
250
300
1983
1984
1985
1986
1987
1988
1989
1990
1991
1992
1993
1994
1995
1996
1997
1998
1999
2000
2001
2002
2003
2004
kg/h
a p
hosph
ate
(a)
0
50
100
150
200
250
300
1983
1984
1985
1986
1987
1988
1989
1990
1991
1992
1993
1994
1995
1996
1997
1998
1999
2000
2001
2002
2003
2004
kg/h
a n
itro
gen
1983
1984
1985
1986
1987
1988
1989
1990
1991
1992
1993
1994
1995
1996
1997
1998
1999
2000
2001
2002
2003
2004
Winter wheat Winter barley Spring barley
Oilseed rape Maincrop potatoes Sugar beet
BSFP final inner 10/12/05 11:05 am Page 33

34
On winter wheat the mean overall potash rates were very similar for the five year periods 1983-87, 1988-92 and 1993-97 at 52, 52 and 53 kg/ha respectively but there was a reduction to48 kg/ha in 1998-2002. For barley the same periods have seen an increase in potash use from59 kg/ha (winter barley) and 47 kg/ha (spring barley) in 1983-87 to 63 and 55 kg/ha in 1998-2002. The corresponding means for oilseed rape, maincrop potatoes and sugar beet showdecreases from 57, 269 and 146 kg/ha in 1983-1987 to levels of 46, 233 and 104 kg/ha for the1998-2002 period. Rates in 2003 and 2004 suggest the downward trend is continuing(mean: 45, 211, 94 kg/ha).
Much of the reduction in the overall rates of application of phosphate and potash to combinablearable crops results more from a decrease in the dressing cover than from a reduction in theaverage application rates.
B2.1.4 AUTUMN AND WINTER APPLICATIONS OF NITROGEN FERTILISER
In 1985 about two thirds of the winter cereals and nearly 90% of winter oilseed rape receivedautumn and early winter nitrogen. Since that time the area has decreased considerably inEngland & Wales and to a lesser extent in Scotland. For cereals the dressing cover is now lessthan 5% in England & Wales (Table B2.3). There was a large reduction in 2003 in Scotlandwhich meant it reduced to less than 50% on both crops for the first time, but it increased againin 2004. The Great Britain values have now fallen below 10% for both crops. This reduction isin keeping with the standard advice that autumn nitrogen is not required for winter cereals, aseconomic yield benefits are rare and autumn-applied nitrogen is vulnerable to leaching loss. InScotland some farmers still consider that autumn-applied nitrogen reduces the risk of poorestablishment of winter cereal crops under the colder and wetter conditions in that part ofBritain. The area receiving autumn nitrogen is now too low for data relating to average fieldapplication to be used.
In England & Wales the proportion of winter oilseed rape dressed with autumn-winter appliednitrogen fell rapidly between 1985 and 1989 down to about a half, but showed little furtherchange until 1997/98, when it dropped to one third of the crop area. The proportion in Scotlandis higher although with the low number of crops in the sample the values for 2001 onwardsshould be treated with caution. The average field rate for England & Wales was 49 kg/ha in1985-89, 43 kg/ha in 1990-94, 38 kg/ha in 1995-99 and 44 kg/ha in 2000-04. Autumn nitrogenat 30 kg/ha is recommended for winter oilseed rape, unless the soil has a high nitrogen fertility,as the crop normally requires more nitrogen than winter cereals during the autumn growthperiod. However, the economic benefits are usually small and this is reflected in currentfertiliser practice.
The survey results may be taken to indicate the implementation of good agronomic andenvironmental practice by arable farmers in response to their awareness of research findingsand advisory recommendations.
BSFP final inner 10/12/05 11:05 am Page 34
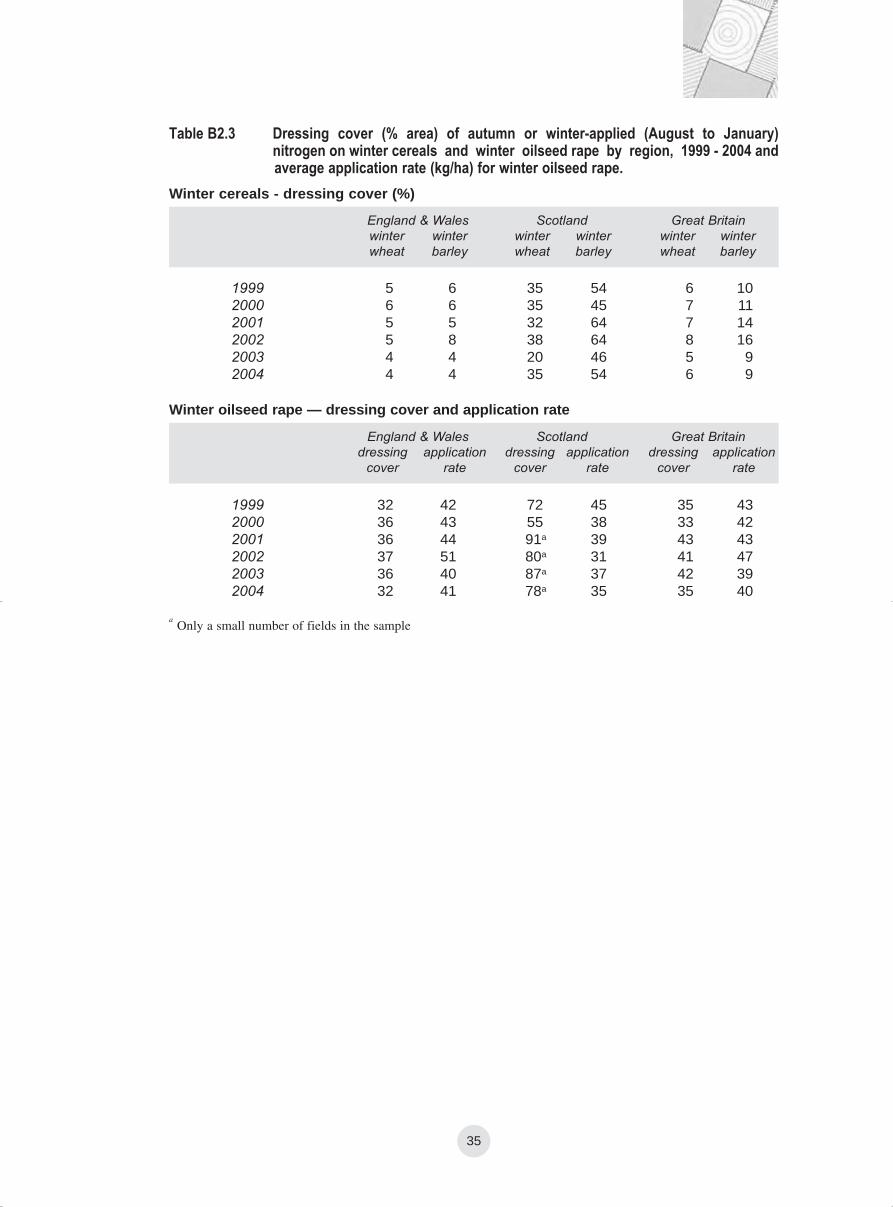
35
Table B2.3 Dressing cover (% area) of autumn or winter-applied (August to January)nitrogen on winter cereals and winter oilseed rape by region, 1999 - 2004 andaverage application rate (kg/ha) for winter oilseed rape.
Winter cereals - dressing cover (%)
1999 5 6 35 54 6 102000 6 6 35 45 7 112001 5 5 32 64 7 142002 5 8 38 64 8 162003 4 4 20 46 5 92004 4 4 35 54 6 9
England & Wales Scotland Great Britainwinter winter winter winter winter winterwheat barley wheat barley wheat barley
aOnly a small number of fields in the sample
1999 32 42 72 45 35 432000 36 43 55 38 33 422001 36 44 91a 39 43 432002 37 51 80a 31 41 472003 36 40 87a 37 42 392004 32 41 78a 35 35 40
England & Wales Scotland Great Britaindressing application dressing application dressing application
cover rate cover rate cover rate
Winter oilseed rape — dressing cover and application rate
BSFP final inner 10/12/05 11:05 am Page 35
36
B2.2 LONGER TERM TRENDS FOR ENGLAND AND WALES
The earlier surveys for England & Wales, which together now account for around 83%(8.6 million ha) of the agricultural land in Britain, provide a longer time series than for GreatBritain, based on the present survey design.
B2.2.1 NITROGEN USE
The falls in nitrogen use on tillage crops (Figure B2.3(a)) in the 1988, 1999 and 2001 seasonscan be largely attributed to the reduced cropping areas of winter cereal and winter oilseed rapedue, except for oilseed rape in 1999, to very wet autumns which restricted drillingopportunities. For example in England in 2001 there was a 46% increase in the area of springbarley grown compared with the previous season. The large drop in nitrogen use on tillagecrops in 1993 also resulted from a fall in the proportion of the total tillage area cropped withcereals and oilseed rape. This was caused by the introduction of the Arable Area PaymentScheme (AAPS) and widespread adoption of rotational set-aside on arable farms. This schemehalved the commodity price for oilseed rape, thereby reducing the optimum economic fertilisernitrogen rate for this crop. A big increase in spring instead of winter oilseed rape cropping, inresponse to rape seed price reductions under the AAPS, was a further contributory factor to thedrop in nitrogen use on tillage crops in 1993.
The sharp drop in nitrogen use on grassland in both 1988 and 1992 may have partly reflectedthe influence of seasonal weather pattern on grass growth and related nitrogen requirements.The increased use of fertiliser nitrogen on grassland during the 1980s had been accentuated byits high cost/benefit ratio, reliability in producing a consistent response and its potential tosupport high stocking rates and high output. Nitrogen recommendations for grassland werereduced in the early 1990s, in light of further research findings, which could also partly accountfor the lower use of nitrogen in recent years. The further large fall in nitrogen use which startedin 1998 is associated with an ongoing reduction in livestock numbers, especially in the dairysector. Increasing use of extended grazing practice on dairy farms, with consequently smallersilage requirements for winter feeding, may also have been a contributory factor to thereduction in nitrogen use on grassland. In 2001 Foot and Mouth had a major impact onlivestock numbers, the North, West and South West were particularly badly affected. Therewas an average of 10% reduction in the dressing cover in these areas with a 5% reduction forEngland & Wales as a whole compared with the previous year. Nitrogen application rates tograss in 2004 were the lowest since the early 1970s and are probably related to the ongoingreduction in the dairy herd (numbers in England have fallen by 4% since 2003).
Most nitrogen fertiliser on tillage crops in England & Wales is now applied in straight formfollowing the large steady increase in straight nitrogen application rate which occurred between1975 and 1985, combined with a decrease in compound nitrogen use between 1970 and 1992(Figure B2.3(b)). The use of straight nitrogen has largely determined the changes in totalnitrogen rate on tillage crops since 1969. On grassland, however, use of compound nitrogenincreased between 1975 and 1990, while straight nitrogen use remained fairly static. Since1998 use of straight N on grass has declined reaching, in 2004, the lowest level since currentrecords began in 1969.
BSFP final inner 10/12/05 11:05 am Page 36
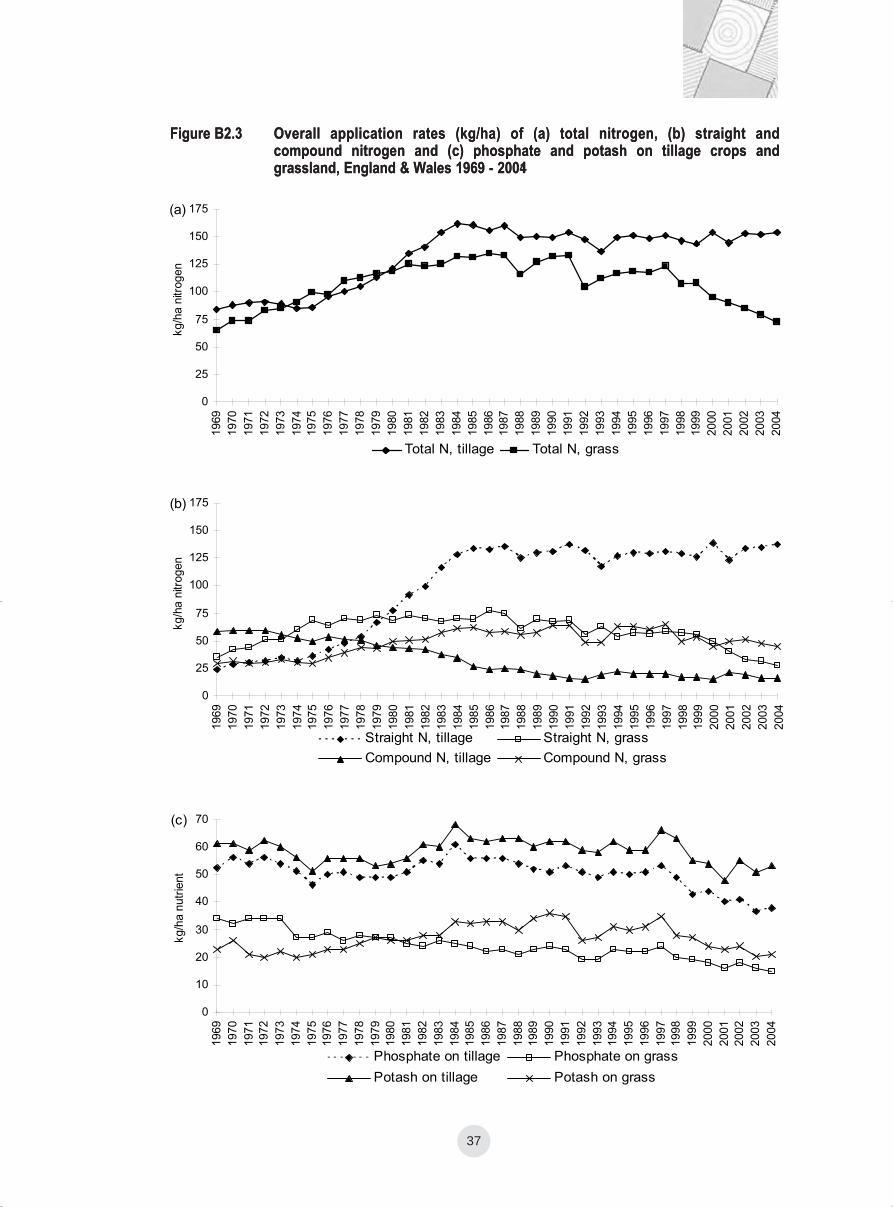
37
Figure B2.3 Overall application rates (kg/ha) of (a) total nitrogen, (b) straight and compound nitrogen and (c) phosphate and potash on tillage crops andgrassland, England & Wales 1969 - 2001
Figure B2.3 Overall application rates (kg/ha) of (a) total nitrogen, (b) straight and compound nitrogen and (c) phosphate and potash on tillage crops andgrassland, England & Wales 1969 - 2004
(a)
0
25
50
75
100
125
150
1751969
1970
1971
1972
1973
1974
1975
1976
1977
1978
1979
1980
1981
1982
1983
1984
1985
1986
1987
1988
1989
1990
1991
1992
1993
1994
1995
1996
1997
1998
1999
2000
2001
2002
2003
2004
kg/h
a n
itrogen
Total N, tillage Total N, grass
(c)
0
10
20
30
40
50
60
70
1969
1970
1971
1972
1973
1974
1975
1976
1977
1978
1979
1980
1981
1982
1983
1984
1985
1986
1987
1988
1989
1990
1991
1992
1993
1994
1995
1996
1997
1998
1999
2000
2001
2002
2003
2004
kg/h
a n
utr
ient
Phosphate on tillage Phosphate on grass
Potash on tillage Potash on grass
(b)
0
25
50
75
100
125
150
175
1969
1970
1971
1972
1973
1974
1975
1976
1977
1978
1979
1980
1981
1982
1983
1984
1985
1986
1987
1988
1989
1990
1991
1992
1993
1994
1995
1996
1997
1998
1999
2000
2001
2002
2003
2004
kg/h
a n
itrogen
Straight N, tillage Straight N, grass
Compound N, tillage Compound N, grass
BSFP final inner 10/12/05 11:05 am Page 37

38
B2.2.2 PHOSPHATE AND POTASH USE
Overall application rates of phosphate and potash on tillage crops have shown a broadly similarpattern of annual changes in use, over the last thirty years (Figure B2.3.(c)). The mean ratesfor phosphate were 52, 54, and 50 kg/ha during the 1970s, 1980s and 1990s. For potash theequivalent figures were 57, 61 and 61 kg/ha. The falls in overall phosphate and potash use overthe last five years, mean that in 2004 application rates were at, or close to, the lowest recordedlevels since 1969.
Overall phosphate use on grassland slowly but steadily declined from 34 kg/ha in 1969, to 19 kg/ha 1992, then recovered slightly before dropping back to 19 kg/ha in 1999. Levelscontinued to decline into the 2000s and, at 15 kg/ha, reached their lowest recorded level in2004. The mean rates for phosphate were 30, 24, and 22 kg/ha during the 1970s, 1980s and1990s, and 17 kg/ha over the last five years.
Insoluble phosphate fertilisers, such as basic slag or ground rock phosphate, were stillcommonly used on grassland in the early 1970s, at application rates which may have suppliedrelatively large amounts of total phosphate. Since then, phosphate inputs have been largelybased on fertiliser products containing water soluble phosphate, which may partly explain thedecline observed in the overall application rate.
In contrast, the overall rate of potash on grassland gradually increased with a mean rate of 23,30 and 31 kg/ha during the 1970s, 1980s and 1990s. Rates have declined in the 2000s with themean for the first five years at 22 kg/ha.
B2.3 LONGER TERM TRENDS FOR SCOTLAND
Overall rates for total nitrogen, phosphate and potash use on tillage crops and on grasslandsince 1983, the first year that the Survey was undertaken in Scotland, are presented in FigureB2.4. The trends differ from those for England & Wales over the same timescale.
B2.3.1 NITROGEN USE
Recorded annual overall rates of total nitrogen on both grass and tillage crops in Scotlandtended to fluctuate during 1983-88 and 1995-2001, but were relatively stable in the interveningyears (Figure B 2.4 (a)), since 2001 rates have declined. Total nitrogen rates on tillage crops inScotland were much lower than those in England & Wales during the 1980s. This was largelybecause of differences in cropping practice and associated nitrogen requirement; malting springbarley and mixed rotations are more common in Scotland than in England & Wales, wherewinter wheat and oilseed rape are grown on a much higher proportion of the total tillage area.However during the 2000s there has been a change to more winter barley at the expense ofspring and this is now reflected in the nitrogen inputs as the rates in Scotland have increasedrelative to those in England. In 2001 the rate of 147 kg/ha was the highest level since recordsbegan in 1983 and was greater than the rate used in England & Wales (Figure B2.5(a)).
Before 1985, more nitrogen was applied to tillage crops in compound than in straight form(Figure B2.4(b)). Subsequently, about 60-65% of the total nitrogen input for tillage crops hasbeen applied in straight form, in 2002 this increased temporarily to 70%; the correspondingproportion in England & Wales is nearly 90%. Compound nitrogen has consistently been themain form of nitrogen fertiliser used on grassland, with relatively little change in applicationrate since 1983, apart from a marked drop in 1996 and higher recorded usage in 1997-99,compared to earlier years. Straight nitrogen use has decreased since the late 1980s, down toabout one quarter of the total nitrogen input on grassland in recent years.
BSFP final inner 10/12/05 11:05 am Page 38

39
(a)
0
20
40
60
80
100
120
140
1601983
1984
1985
1986
1987
1988
1989
1990
1991
1992
1993
1994
1995
1996
1997
1998
1999
2000
2001
2002
2003
2004
kg/h
a n
itro
gen
Total nitrogen, tillage Total nitrogen, grass
(b)
0
20
40
60
80
100
1983
1984
1985
1986
1987
1988
1989
1990
1991
1992
1993
1994
1995
1996
1997
1998
1999
2000
2001
2002
2003
2004
kg/h
a n
itro
gen
Straight nitrogen on tillage Compound nitrogen on tillage
Straight nitrogen on grass Compound nitrogen on grass
Figure B2.4 Overall application rates (kg/ha) of (a) total nitrogen, (b) straight and compoundnitrogen to grassland, and (c) phosphate and potash on tillage crops and grassland, Scotland 1983 - 2004
(c)
0
10
20
30
40
50
60
70
80
1983
1984
1985
1986
1987
1988
1989
1990
1991
1992
1993
1994
1995
1996
1997
1998
1999
2000
2001
2002
2003
2004
kg/h
a n
utr
ient
Phosphate on tillage Potash on tillage
Phosphate on grass Potash on grass
BSFP final inner 10/12/05 11:05 am Page 39

40
Figure B2.5 Overall application rates (kg/ha) of (a) total nitrogen to tillage crops, and (b) total nitrogen to grassland in Scotland and in England & Wales 1983 - 2004
(a)
0
25
50
75
100
125
150
175
1983
1984
1985
1986
1987
1988
1989
1990
1991
1992
1993
1994
1995
1996
1997
1998
1999
2000
2001
2002
2003
2004
kg/h
a n
itro
gen
Tillage, Scotland Tillage, England & Wales
(b)
0
25
50
75
100
125
150
1983
1984
1985
1986
1987
1988
1989
1990
1991
1992
1993
1994
1995
1996
1997
1998
1999
2000
2001
2002
2003
2004
kg/h
a n
itro
gen
Grassland, Scotland Grassland, England & Wales
BSFP final inner 10/12/05 11:05 am Page 40

41
B2.3.2 PHOSPHATE AND POTASH USE
Overall rates of phosphate and potash on tillage crops tended to fluctuate between 1983 and1988 but have been relatively stable since 1989 (Figure B2.4(c)) with an average of 65 kg/hafor phosphate and 72 kg/ha for potash.
Overall application rates of phosphate to tillage crops are higher in Scotland (Figure B2.6(a)) andthe difference has increased over the last six years as rates have fallen significantly in England& Wales. Potash rates were very similar in both countries between 1983-88 (Figure B2.6(b)).Between 1989 and 1996 about 10 kg/ha more potash was applied in Scotland. As with phosphatethis difference has increased in recent years as rates in England & Wales have declined.
Overall rates of phosphate and potash on grassland declined from 1983 to 1986. Since thenrates have fluctuated from year to year but the average has remained fairly static at around 28 kg/ha for phosphate and 33 kg/ha for potash. Phosphate applications to grass in England &Wales have been consistently lower (Figure B2.7(a)). For grassland rates of potash weregenerally similar until 1997, since then rates in England & Wales have declined more rapidlythan those in Scotland (Figure B2.7(b)).
BSFP final inner 10/12/05 11:05 am Page 41

42
Figure B2.6 Overall application rates (kg/ha) of (a) phosphate and (b) potash to tillage cropsin Scotland and in England & Wales 1983 - 2004
(a)
0
10
20
30
40
50
60
70
80
1983
1984
1985
1986
1987
1988
1989
1990
1991
1992
1993
1994
1995
1996
1997
1998
1999
2000
2001
2002
2003
2004
kg/h
a p
hosphate
Tillage, Scotland Tillage, England & Wales
(b)
0
10
20
30
40
50
60
70
80
1983
1984
1985
1986
1987
1988
1989
1990
1991
1992
1993
1994
1995
1996
1997
1998
1999
2000
2001
2002
2003
2004
kg/h
a p
ota
sh
Tillage, Scotland Tillage, England & Wales
BSFP final inner 10/12/05 11:05 am Page 42

43
Figure B2.7 Overall application rates (kg/ha) of (a) phosphate and (b) potash to grassland inScotland and in England & Wales 1983 - 2004
(a)
0
5
10
15
20
25
30
35
401983
1984
1985
1986
1987
1988
1989
1990
1991
1992
1993
1994
1995
1996
1997
1998
1999
2000
2001
2002
2003
2004
kg/h
a p
hosphate
Grass, Scotland Grass, England & Wales
(b)
0
5
10
15
20
25
30
35
40
1983
1984
1985
1986
1987
1988
1989
1990
1991
1992
1993
1994
1995
1996
1997
1998
1999
2000
2001
2002
2003
2004
kg/h
a p
ota
sh
Grass, Scotland Grass, England & Wales
BSFP final inner 10/12/05 11:05 am Page 43

44
SECTION C - TABLESCONTENTS
GREAT BRITAIN TABLES 2004
GB 1.1 Total fertiliser use, Great Britain 46GB 1.2 Use of straight fertiliser, Great Britain 47GB 1.3 Use of compound fertiliser, Great Britain 48GB 1.4 Use of lime, Great Britain 49GB 2.1 Average fertiliser practice by grassland utilisation, Great Britain 50GB 3.0 Product and nutrient use by month of application, Great Britain 51GB 3.1 Product type as percentage of all product used by crop group, Great Britain 52GB 3.2 Use of product type by crop group, Great Britain 53GB 3.3 Product use by month of application, Great Britain 54
ENGLAND AND WALES TABLES 2004
EW 1.1 Total fertiliser use, England & Wales 55EW 1.2 Use of straight fertiliser, England & Wales 56EW 1.3 Use of compound fertiliser, England & Wales 57EW 1.4 Use of lime, England & Wales 58EW 1.5 Percentage of crop area by field application rate - N, England & Wales 59EW 1.6 Percentage of crop area by field application rate - P2O5, England & Wales 60EW 1.7 Percentage of crop area by field application rate - K2O, England & Wales 61EW 2.1 Average fertiliser practice by grassland utilisation, England & Wales 62EW 2.2 Percentage of grass area by field application rate - N, England & Wales 63EW 2.3 Percentage of grass area by field application rate - P2O5, England & Wales 64EW 2.4 Percentage of grass area by field application rate - K2O, England & Wales 65EW 3.0 Product and nutrient use by month of application, England & Wales 66EW 3.1 Product type as percentage of all product used by crop group, England & Wales 67EW 3.2 Use of product type by crop group, England & Wales 68EW 3.3 Product use by month of application, England & Wales 69EW 4.1 Average fertiliser practice on tillage and grassland by BSFP region 70EW 5.1 Average fertiliser practice on dairy farms, England & Wales 71EW 5.2 Average fertiliser practice on cattle and sheep farms, England & Wales 72EW 5.3 Average fertiliser practice on other livestock/mixed farms, England & Wales 73EW 5.4 Average fertiliser practice on cropping/horticultural farms, England & Wales 74
Note: 1. Row percentages may not sum to exactly to 100 due to rounding.2. No estimates are shown for crops with less than 5 fields in the sample. Nevertheless,
some estimates are based on very few fields in the sample and should be treated withgreat caution.
3. FYM refers to any form of organic manure applied.
BSFP final inner 10/12/05 11:05 am Page 44

45
SCOTLAND TABLES 2004
SC 1.1 Total fertiliser use, Scotland 75SC 1.2 Use of straight fertiliser, Scotland 76SC 1.3 Use of compound fertiliser, Scotland 77SC 1.4 Use of lime, Scotland 78SC 1.5 Percentage of crop area by field application rate - N, Scotland 79SC 1.6 Percentage of crop area by field application rate - P2O5, Scotland 80SC 1.7 Percentage of crop area by field application rate - K2O, Scotland 81SC 2.1 Average fertiliser practice by grassland utilisation, Scotland 82SC 2.2 Percentage of grass area by field application rate - N, Scotland 83SC 2.3 Percentage of grass area by field application rate - P2O5, Scotland 84SC 2.4 Percentage of grass area by field application rate - K2O, Scotland 85SC 3.0 Product and nutrient use by month of application, Scotland 86SC 3.1 Product type as percentage of all product used by crop group, Scotland 87SC 3.2 Use of product type by crop group, Scotland 88SC 3.3 Product use by month of application, Scotland 89SC 4.1 Average fertiliser practice, North East Scotland 90SC 4.2 Average fertiliser practice, South East Scotland 91SC 4.3 Average fertiliser practice, South West Scotland 92SC 5.1 Average fertiliser practice on general cropping farms, Scotland 93SC 5.2 Average fertiliser practice on dairy farms, Scotland 94SC 5.3 Average fertiliser practice on mixed farms, Scotland 95SC 5.4 Average fertiliser practice on farms in Less Favoured Areas, Scotland 96
Note: 1. Row percentages may not sum to exactly to 100 due to rounding.2. No estimates are shown for crops with less than 5 fields in the sample. Nevertheless,
some estimates are based on very few fields in the sample and should be treated withgreat caution.
3. FYM refers to any form of organic manure applied.
BSFP final inner 10/12/05 11:05 am Page 45

46
Source: British Survey of Fertiliser Practice 2004
N P2O5 K2O FYM N P2O5 K2O N P2O5 K2O
Table GB1.1 Total fertiliser use, Great Britain 2004
Crop area receiving dressing Average field rate Overall application rate Fields in(%) (kg/ha) (kg/ha) sample
Spring wheat 75 41 47 26 145 50 63 108 21 29 52
Winter wheat 99 61 61 15 199 63 78 197 39 48 2055
Spring barley 98 84 87 26 106 53 65 104 44 57 792
Winter barley 99 74 78 18 145 61 79 144 46 62 628
Oats 90 71 70 21 108 58 73 97 41 51 174
Rye/Triticale/Durum wheat 56 42 47 47 116 61 78 65 26 37 34
Seed potatoes 91 91 91 24 122 177 208 111 161 189 21
Early potatoes 100 100 100 20 167 162 245 167 162 245 8
2nd Early/Maincrop potatoes 97 86 87 29 158 146 231 154 125 201 144
Sugar beet 92 51 80 25 103 71 130 95 36 104 192
Spring oilseed rape 100 61 58 15 136 66 72 136 41 42 87
Winter oilseed rape 99 63 65 13 211 61 72 210 39 46 437
Linseed 74 40 42 15 81 49 53 60 19 22 31
Forage maize 83 68 54 90 61 60 82 51 41 45 152
Rootcrops for stockfeed 91 85 86 77 96 108 102 87 92 88 69
Leafy forage crops 63 68 68 62 137 43 73 86 29 50 39
Arable silage/Other fodder crops 62 58 62 67 88 35 44 54 21 27 38
Peas - human consumption 4 43 47 7 67 63 64 3 27 30 55
Peas - animal consumption 7 32 39 7 30 57 73 2 18 29 102
Beans - animal consumption 11 40 44 7 35 59 72 4 23 32 182
Vegetables (brassicae) 98 86 91 15 197 71 137 193 61 125 32
Vegetable (other) 78 81 82 14 105 77 129 82 63 106 58
Soft fruit 99 99 78 2 63 59 38 63 58 30 21
Top fruit 85 46 57 0 53 36 90 45 16 51 54
Other tillage 34 24 34 8 77 48 96 26 12 33 67
All tillage 91 65 67 19 166 63 82 152 41 55 5524
Grass under 5 years old 85 69 71 42 142 38 56 120 26 40 1092
Grass 5 years and over 67 57 57 38 101 27 33 68 16 19 2724
All grass 70 59 59 39 109 29 38 77 17 22 3816
All crops and grass 80 61 63 30 138 45 59 110 28 37 9340
BSFP final inner 10/12/05 11:05 am Page 46

47
Source: British Survey of Fertiliser Practice 2004
N P2O5 K2O N P2O5 K2O N P2O5 K2O
Table GB1.2 Use of straight fertiliser, Great Britain 2004
Crop area receiving dressing Average field rate Overall application rate Fields in(%) (kg/ha) (kg/ha) sample
Spring wheat 69 0 4 138 0 87 94 0 4 52
Winter wheat 95 5 8 195 79 91 186 4 7 2055
Spring barley 68 0 4 87 75 85 59 0 4 792
Winter barley 89 3 7 140 83 88 125 3 6 628
Oats 74 2 5 111 72 91 82 1 4 174
Rye/Triticale/Durum wheat 45 0 6 115 0 86 52 0 5 34
Seed potatoes 7 0 10 80 0 207 6 0 20 21
Early potatoes 60 8 8 105 126 251 64 10 21 8
2nd Early/Maincrop potatoes 49 0 17 101 0 200 49 0 35 144
Sugar beet 84 2 33 102 105 136 85 2 45 192
Spring oilseed rape 92 5 4 130 67 106 119 4 4 87
Winter oilseed rape 97 4 10 202 87 90 197 4 9 437
Linseed 67 0 2 77 0 60 51 0 1 31
Forage maize 34 0 18 71 0 105 24 0 19 152
Rootcrops for stockfeed 20 0 4 123 0 155 24 0 6 69
Leafy forage crops 38 0 0 49 0 0 19 0 0 39
Arable silage/Other fodder crops 24 0 4 110 0 74 26 0 3 38
Peas - human consumption 2 5 9 87 90 57 1 4 5 55
Peas - animal consumption 5 6 14 30 60 80 2 4 11 102
Beans - animal consumption 5 5 9 58 91 90 3 4 8 182
Vegetables (brassicae) 78 0 0 93 0 0 72 0 0 32
Vegetable (other) 69 1 9 95 130 120 65 1 11 58
Soft fruit 66 57 21 66 70 113 43 40 23 21
Top fruit 71 24 37 59 36 109 42 9 41 54
Other tillage 26 0 8 79 0 148 21 0 13 67
All tillage 80 4 9 164 78 101 132 3 9 5524
Grass under 5 years old 41 0 2 120 0 104 50 0 2 1092
Grass 5 years and over 22 0 0 103 0 0 22 0 0 2724
All grass 25 0 1 107 0 95 27 0 1 3816
All crops and grass 49 2 4 148 77 101 73 1 4 9340
BSFP final inner 10/12/05 11:05 am Page 47

48
Source: British Survey of Fertiliser Practice 2004
N P2O5 K2O N P2O5 K2O N P2O5 K2O
Table GB1.3 Use of compound fertiliser, Great Britain 2004
Crop area receiving dressing Average field rate Overall application rate Fields in(%) (kg/ha) (kg/ha) sample
Spring wheat 26 41 45 53 50 56 14 21 26 52
Winter wheat 18 56 54 63 62 74 11 35 40 2055
Spring barley 69 83 84 66 53 64 45 44 53 792
Winter barley 29 71 72 66 60 77 19 43 56 628
Oats 23 69 68 63 57 69 15 40 47 174
Rye/Triticale/Durum wheat 15 42 44 85 61 70 13 26 31 34
Seed potatoes 91 91 81 116 177 208 105 161 169 21
Early potatoes 92 92 92 113 165 245 103 152 224 8
2nd Early/Maincrop potatoes 80 86 76 131 146 218 105 125 167 144
Sugar beet 15 49 51 64 70 116 10 34 59 192
Spring oilseed rape 23 56 55 75 66 69 17 37 38 87
Winter oilseed rape 26 60 56 49 59 67 13 35 37 437
Linseed 14 40 40 64 49 53 9 19 21 31
Forage maize 68 68 37 40 60 69 27 41 26 152
Rootcrops for stockfeed 77 85 83 81 108 100 63 92 82 69
Leafy forage crops 57 68 68 118 43 73 68 29 50 39
Arable silage/Other fodder crops 47 58 58 61 35 42 28 21 25 38
Peas - human consumption 3 38 38 56 59 66 2 22 25 55
Peas - animal consumption 2 26 26 27 55 66 1 14 17 102
Beans - animal consumption 6 35 37 12 55 64 1 19 23 182
Vegetables (brassicae) 91 86 91 132 71 137 121 61 125 32
Vegetable (other) 21 80 79 79 77 120 17 62 95 58
Soft fruit 77 77 58 25 24 11 20 18 6 21
Top fruit 30 22 34 11 36 30 3 8 10 54
Other tillage 11 24 26 51 48 79 5 12 20 67
All tillage 29 61 60 67 62 77 20 38 46 5524
Grass under 5 years old 66 57 56 107 27 32 71 15 18 1092
Grass 5 years and over 56 68 70 82 38 54 46 26 38 2724
All grass 57 59 59 87 29 37 50 17 22 3816
All crops and grass 45 60 59 81 44 55 37 26 32 9340
BSFP final inner 10/12/05 11:05 am Page 48

49
Source: British Survey of Fertiliser Practice 2004
Ground Ground Magnesian Sugar beet Ground Ground Magnesian Sugar beet Fields Fields inlimestone chalk limestone lime Other All limestone chalk limestone lime Other All limed sample
Table GB1.4 Use of lime, Great Britain 2004
Crop area receiving dressing (%) Average field rate of CaO equivalent (tonnes/ha)
Spring wheat - - - - - - - - - - - - 1 52
Winter wheat 3.8 1.2 0.4 0.3 0.4 6.1 4.2 4.3 4.5 8.2 0.7 4.4 117 2055
Spring barley 6.6 0.1 3.5 0.1 1.0 11.3 4.5 5.8 4.1 6.3 20.7 5.9 104 792
Winter barley 5.5 0.6 1.2 0.5 0.6 8.4 4.1 3.7 4.6 4.6 2.6 4.2 59 628
Oats 0.7 1.5 1.5 - 0.2 4.0 4.6 5.1 5.0 - 0.2 4.7 10 174
Rye/Triticale/Durum wheat - - - - - - - - - - - - 4 34
Seed potatoes - - - - - - - - - - - - 0 21
Early potatoes - - - - - - - - - - - - 0 8
2nd Early/Maincrop potatoes - - - - - - - - - - - - 1 144
Sugar beet 9.7 2.1 1.4 8.9 4.7 26.7 4.8 4.4 2.9 7.8 5.0 5.7 53 192
Spring oilseed rape 4.4 0.8 5.1 0.6 - 10.9 3.7 5.0 4.7 4.9 - 4.4 8 87
Winter oilseed rape 7.5 1.3 1.8 0.6 1.7 12.9 4.1 3.7 4.9 7.7 2.6 4.2 39 437
Linseed - - - - - - - - - - - - 3 31
Forage maize 12.6 2.7 0.6 0.2 0.4 16.6 4.3 4.9 3.7 4.9 8.2 4.5 36 152
Rootcrops for stockfeed 6.6 - 2.8 1.1 1.2 11.7 4.0 - 4.9 4.7 4.9 4.4 11 69
Leafy forage crops 8.9 - 4.9 - - 13.8 4.9 - 4.9 - - 4.9 7 39
Arable silage/Other fodder crops 12.3 - 5.2 - - 17.5 5.4 - 5.9 - - 5.6 9 38
Peas - human consumption 3.1 5.6 2.5 - - 11.2 8.0 1.7 4.5 - - 4.1 8 55
Peas - animal consumption - - - - - - - - - - - - 3 102
Beans - animal consumption 1.9 1.9 - - 0.6 4.4 3.0 2.9 - - 0.5 2.6 11 182
Vegetables (brassicae) 11.0 - 2.1 - - 13.0 4.4 - 3.0 - - 4.2 5 32
Vegetable (other) 0.4 8.8 - - 13.8 23.0 4.9 4.6 - - 3.1 3.1 15 58
Soft fruit - - - - - - - - - - - - 0 21
Top fruit - - - - - - - - - - - - 2 54
Other tillage 2.0 - 1.0 - 2.9 5.9 2.5 - 0.3 - 6.2 4.0 5 67
All tillage 4.9 1.1 1.2 0.6 0.9 8.7 4.2 4.1 4.6 7.5 7.1 4.9 511 5524
Grass under 5 years old 4.6 0.1 1.4 - 1.5 7.5 4.4 3.7 3.7 - 3.2 4.0 104 1092
Grass 5 years and over 1.8 - 0.8 0.1 0.5 3.2 6.3 4.2 4.4 5.4 4.2 5.5 134 2724
All grass 2.3 - 0.9 - 0.7 4.0 5.6 4.1 4.2 5.4 3.8 5.0 238 3816
All crops and grass 3.5 0.5 1.0 0.3 0.8 6.1 4.8 4.1 4.4 7.3 5.6 4.9 749 9340
BSFP final inner 10/12/05 11:05 am Page 49

50
N P2O5 K2O FYM N P2O5 K2O N P2O5 K2O
Table GB2.1 Average fertiliser practice by grassland utilisation, Great Britain 2004
Crop area receiving dressing Average field rate Overall application rate Fields in(%) (kg/ha) (kg/ha) sample
Grazed not mown 63 54 52 27 95 26 27 60 14 14 1880
Grazed mown 83 69 72 62 125 33 48 104 23 34 1557
All grazings 70 59 59 39 107 29 36 75 17 21 3437
Cut for silage - grazed 88 75 79 69 134 35 51 119 26 40 1141
Cut for silage - not grazed 87 69 80 57 155 42 68 135 29 54 246
All cut for silage 88 74 79 67 137 36 53 121 26 42 1387
Cut for hay - grazed 66 51 50 39 91 28 36 60 14 18 463
Cut for hay - not grazed 71 41 46 34 88 30 33 63 13 15 92
All cut for hay 67 49 50 39 91 29 36 61 14 18 555
All mowings 83 68 72 60 127 34 50 106 23 36 1876
All grass 70 59 59 39 109 29 38 77 17 22 3816
Source: British Survey of Fertiliser Practice 2004
BSFP final inner 10/12/05 11:05 am Page 50

51
Source: British Survey of Fertiliser Practice 2004
Sep Oct Nov Dec Jan Feb Mar Apr May Jun Jul Aug Total Productrow %( 000 tonnes)
Table GB3.0 Product and nutrient by month of application, Great Britain 2004
(a) Product use
Sep Oct Nov Dec Jan Feb Mar Apr May Jun Jul Aug Total Nutrientrow %( 000 tonnes)
(b) Nutrient use
Note: Product use refers to the total tonnage of the products used by farmers in the survey year 2004;nutrient use refers to the tonnage of each nutrient contained in the products used.(e.g. 100 kg of a 20 : 10 : 10 compound contains 20 kg of N, 10 kg of P2O5, and 10 kg of K2O, while 100 kg of ammonium nitrate, one of the straight N products, contains typically 34.5 kg of N).
Straight N 1 0 0 0 0 6 29 38 18 4 3 1 2002
Straight P 24 14 6 3 9 19 7 6 0 3 9 35
Straight K 9 12 16 2 3 19 19 13 4 1 1 1 93
Compound 6 6 2 1 1 5 22 27 13 8 4 5 2386
All Fertilisers 4 3 1 1 1 6 25 32 15 6 3 3 4515
N 1 0 0 0 0 5 28 37 17 6 4 2 1159
P2O5 11 10 3 2 1 7 22 23 10 4 2 6 294
K2O 10 10 4 2 2 9 21 22 10 5 3 5 389
Total 4 4 1 1 1 6 25 31 15 6 3 3 1841
BSFP final inner 10/12/05 11:05 am Page 51
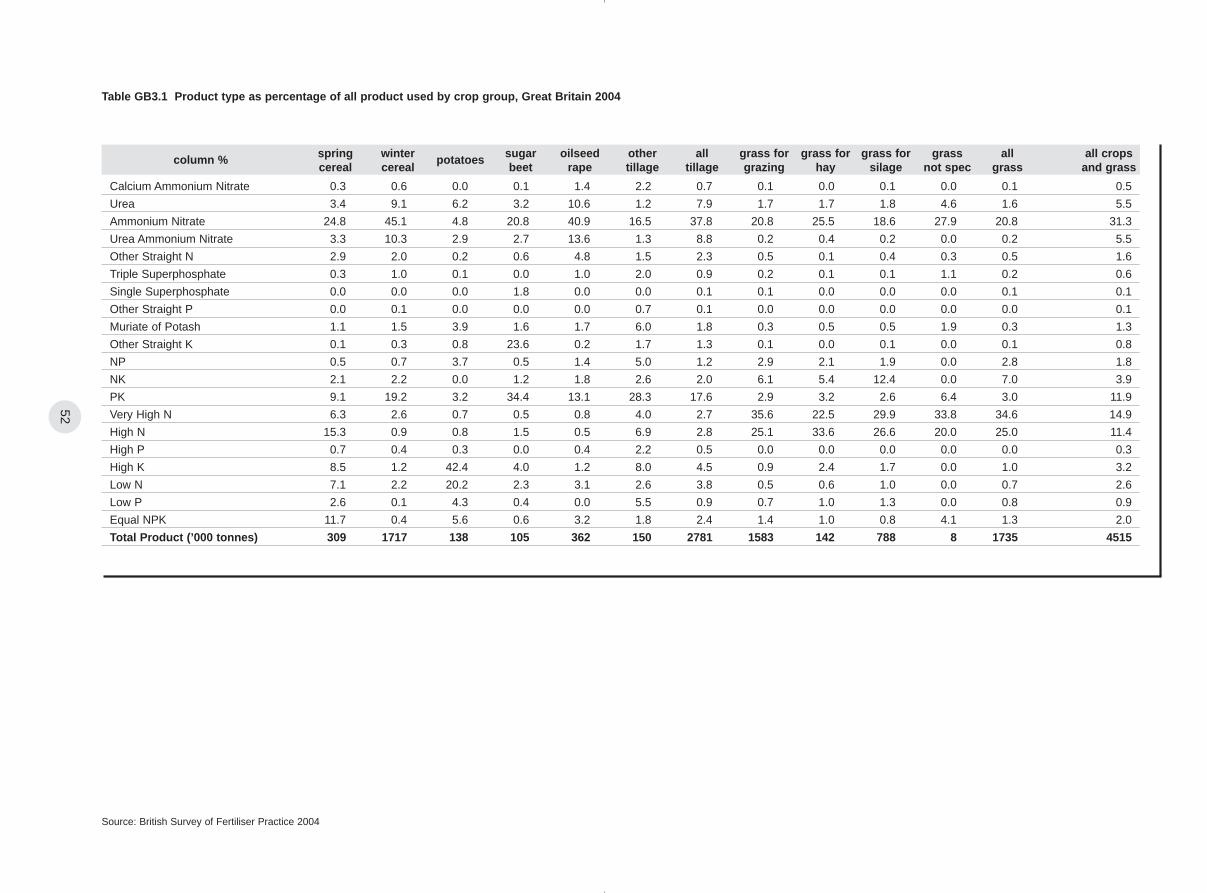
52
column % spring winter potatoes sugar oilseed other all grass for grass for grass for grass all all cropscereal cereal beet rape tillage tillage grazing hay silage not spec grass and grass
Table GB3.1 Product type as percentage of all product used by crop group, Great Britain 2004
Source: British Survey of Fertiliser Practice 2004
Calcium Ammonium Nitrate 0.3 0.6 0.0 0.1 1.4 2.2 0.7 0.1 0.0 0.1 0.0 0.1 0.5
Urea 3.4 9.1 6.2 3.2 10.6 1.2 7.9 1.7 1.7 1.8 4.6 1.6 5.5
Ammonium Nitrate 24.8 45.1 4.8 20.8 40.9 16.5 37.8 20.8 25.5 18.6 27.9 20.8 31.3
Urea Ammonium Nitrate 3.3 10.3 2.9 2.7 13.6 1.3 8.8 0.2 0.4 0.2 0.0 0.2 5.5
Other Straight N 2.9 2.0 0.2 0.6 4.8 1.5 2.3 0.5 0.1 0.4 0.3 0.5 1.6
Triple Superphosphate 0.3 1.0 0.1 0.0 1.0 2.0 0.9 0.2 0.1 0.1 1.1 0.2 0.6
Single Superphosphate 0.0 0.0 0.0 1.8 0.0 0.0 0.1 0.1 0.0 0.0 0.0 0.1 0.1
Other Straight P 0.0 0.1 0.0 0.0 0.0 0.7 0.1 0.0 0.0 0.0 0.0 0.0 0.1
Muriate of Potash 1.1 1.5 3.9 1.6 1.7 6.0 1.8 0.3 0.5 0.5 1.9 0.3 1.3
Other Straight K 0.1 0.3 0.8 23.6 0.2 1.7 1.3 0.1 0.0 0.1 0.0 0.1 0.8
NP 0.5 0.7 3.7 0.5 1.4 5.0 1.2 2.9 2.1 1.9 0.0 2.8 1.8
NK 2.1 2.2 0.0 1.2 1.8 2.6 2.0 6.1 5.4 12.4 0.0 7.0 3.9
PK 9.1 19.2 3.2 34.4 13.1 28.3 17.6 2.9 3.2 2.6 6.4 3.0 11.9
Very High N 6.3 2.6 0.7 0.5 0.8 4.0 2.7 35.6 22.5 29.9 33.8 34.6 14.9
High N 15.3 0.9 0.8 1.5 0.5 6.9 2.8 25.1 33.6 26.6 20.0 25.0 11.4
High P 0.7 0.4 0.3 0.0 0.4 2.2 0.5 0.0 0.0 0.0 0.0 0.0 0.3
High K 8.5 1.2 42.4 4.0 1.2 8.0 4.5 0.9 2.4 1.7 0.0 1.0 3.2
Low N 7.1 2.2 20.2 2.3 3.1 2.6 3.8 0.5 0.6 1.0 0.0 0.7 2.6
Low P 2.6 0.1 4.3 0.4 0.0 5.5 0.9 0.7 1.0 1.3 0.0 0.8 0.9
Equal NPK 11.7 0.4 5.6 0.6 3.2 1.8 2.4 1.4 1.0 0.8 4.1 1.3 2.0
Total Product (’000 tonnes) 309 1717 138 105 362 150 2781 1583 142 788 8 1735 4515
BSFP final inner 10/12/05 11:05 am Page 52

53
Table GB3.2 Use of product type by crop group, Great Britain 2004
Source: British Survey of Fertiliser Practice 2004
row % spring winter potatoes sugar oilseed other all grass for grass for grass for grass all total productcereal cereal beet rape tillage tillage grazing hay silage not spec grass ( 000 tonnes)
Calcium Ammonium Nitrate 4.3 45.0 0.0 0.4 23.8 15.2 88.8 10.5 0.2 2.8 0.0 11.2 22
Urea 4.2 63.3 3.5 1.4 15.6 0.7 88.6 10.7 1.0 5.6 0.1 11.4 247
Ammonium Nitrate 5.4 54.8 0.5 1.6 10.5 1.8 74.4 23.3 2.6 10.4 0.2 25.6 1413
Urea Ammonium Nitrate 4.1 71.3 1.6 1.1 19.9 0.8 98.9 1.1 0.3 0.7 0.0 1.1 248
Other Straight N 12.5 46.8 0.3 0.8 24.5 3.1 88.1 10.2 0.3 4.2 0.0 11.9 72
Triple Superphosphate 3.1 62.8 0.3 0.1 13.4 10.8 90.6 8.8 0.4 1.9 0.3 9.4 28
Single Superphosphate 0.0 0.0 0.0 54.5 0.0 0.0 54.5 45.5 0.0 0.0 0.0 45.5 3
Other Straight P 0.0 42.6 0.0 1.5 3.3 36.6 84.0 16.0 0.0 0.0 0.0 16.0 3
Muriate of Potash 6.0 45.1 9.4 2.9 11.0 15.8 90.2 8.6 1.1 6.7 0.3 9.8 57
Other Straight K 0.8 14.4 3.2 69.4 2.1 6.9 96.8 2.8 0.0 2.7 0.0 3.2 36
NP 1.9 15.4 6.3 0.6 6.4 9.3 40.0 57.6 3.7 19.0 0.0 60.0 80
NK 3.6 21.7 0.0 0.7 3.7 2.2 32.0 54.5 4.3 55.0 0.0 68.0 177
PK 5.2 61.0 0.8 6.7 8.8 7.9 90.5 8.6 0.8 3.8 0.1 9.5 539
Very High N 2.9 6.7 0.1 0.1 0.4 0.9 11.1 83.4 4.8 34.8 0.4 88.9 675
High N 9.2 3.2 0.2 0.3 0.4 2.0 15.3 77.4 9.3 40.9 0.3 84.7 513
High P 14.7 47.8 3.0 0.0 9.9 23.7 99.1 0.9 0.0 0.0 0.0 0.9 14
High K 18.3 14.7 40.9 3.0 3.1 8.4 88.2 10.3 2.3 9.6 0.0 11.8 143
Low N 18.8 32.4 23.9 2.1 9.5 3.3 90.0 7.1 0.7 6.6 0.0 10.0 116
Low P 20.3 6.3 15.1 1.0 0.4 21.1 64.2 27.6 3.5 25.6 0.0 35.8 39
Equal NPK 40.7 8.5 8.6 0.7 13.0 3.0 74.5 24.1 1.7 7.4 0.4 25.5 89
All Fertilisers 6.8 38.0 3.0 2.4 8.0 3.4 61.7 34.9 3.2 17.4 0.2 38.3 4515
BSFP final inner 10/12/05 11:05 am Page 53

54
total Productrow % Jan Feb Mar Apr May Jun Jul Aug Sep Oct Nov Dec( 000 tonnes)
Table GB3.3 Product use by month of application, Great Britain 2004
Source: British Survey of Fertiliser Practice 2004
Calcium Ammonium Nitrate 0.0 5.3 31.4 44.4 12.4 0.0 4.0 0.7 0.0 0.0 0.0 1.7 22
Urea 0.0 7.7 27.8 38.4 17.0 3.8 4.4 0.1 0.5 0.2 0.0 0.2 247
Ammonium Nitrate 0.0 4.6 28.5 38.6 18.8 4.9 2.4 1.3 0.6 0.2 0.1 0.0 1413
Urea Ammonium Nitrate 0.3 8.6 31.1 38.2 15.9 2.3 1.7 1.0 0.7 0.3 0.0 0.0 248
Other Straight N 0.2 14.2 46.7 23.9 6.8 5.5 1.9 0.3 0.5 0.0 0.0 0.0 72
Triple Superphosphate 0.0 10.3 17.6 7.4 6.3 0.4 3.5 6.8 29.1 15.0 2.7 1.1 28
Single Superphosphate 0.0 0.0 19.7 0.0 6.5 0.0 0.0 0.0 0.0 17.6 36.9 19.3 3
Other Straight P 0.0 8.8 29.3 16.0 0.0 0.0 0.0 42.6 0.0 0.0 3.3 0.0 3
Muriate of Potash 3.3 17.4 24.7 18.1 6.2 1.0 0.1 1.5 3.9 14.0 7.8 2.0 57
Other Straight K 3.0 21.5 9.1 4.4 0.0 0.4 1.9 0.0 18.2 10.0 28.7 2.8 36
NP 0.0 8.5 42.8 29.2 9.6 3.2 2.4 1.2 1.5 1.5 0.0 0.0 80
NK 0.0 6.8 13.1 15.0 28.7 21.6 10.5 2.8 0.5 0.0 0.0 0.9 177
PK 3.6 11.0 14.2 5.1 3.9 0.9 0.6 6.9 20.3 21.6 8.4 3.6 539
Very High N 0.1 2.2 23.9 31.4 16.2 12.7 7.4 5.2 0.8 0.1 0.0 0.0 675
High N 0.1 2.9 20.1 41.1 19.1 8.2 4.6 2.0 0.7 1.2 0.1 0.0 513
High P 0.0 4.8 19.2 7.2 29.2 0.0 0.0 11.1 28.4 0.2 0.0 0.0 14
High K 0.0 6.1 35.7 48.9 6.4 0.5 0.0 0.5 1.0 0.9 0.0 0.0 143
Low N 0.0 3.7 32.6 30.0 4.0 0.7 1.3 7.2 12.3 7.2 0.9 0.0 116
Low P 0.0 2.8 20.5 40.8 16.1 13.9 0.2 4.2 0.5 1.2 0.0 0.0 39
Equal NPK 0.0 3.3 30.3 35.4 10.1 4.8 0.5 8.7 3.0 2.9 0.8 0.0 89
All Fertilisers 0.6 5.8 25.2 31.7 15.0 6.0 3.4 3.0 3.8 3.5 1.5 0.6 4515
BSFP final inner 10/12/05 11:05 am Page 54

55
Source: British Survey of Fertiliser Practice 2004
N P2O5 K2O FYM N P2O5 K2O N P2O5 K2O
Table EW1.1 Total fertiliser use, England & Wales 2004
Crop area receiving dressing Average field rate Overall application rate Fields in(%) (kg/ha) (kg/ha) sample
Spring wheat 73 33 40 30 147 47 59 107 16 23 40
Winter wheat 99 59 60 15 199 63 77 197 37 46 1855
Spring barley 97 72 78 21 108 45 62 105 32 49 395
Winter barley 99 72 76 19 140 59 78 139 42 59 526
Oats 91 66 66 21 110 59 76 100 39 50 131
Rye/Triticale/Durum wheat 56 40 45 45 116 60 79 65 24 35 30
Seed potatoes - - - - - - - - - - 1
Early potatoes 100 100 100 20 167 162 245 167 162 245 8
2nd Early/Maincrop potatoes 98 85 86 32 162 150 244 158 127 210 120
Sugar beet 92 51 80 25 103 71 130 95 36 104 192
Spring oilseed rape 100 57 54 15 131 64 70 131 36 38 75
Winter oilseed rape 99 61 62 13 211 61 73 209 37 45 382
Linseed 78 42 44 13 81 49 53 63 20 23 29
Forage maize 83 68 54 90 61 60 83 51 41 45 151
Rootcrops for stockfeed 82 67 71 74 113 81 111 93 54 79 33
Leafy forage crops 66 67 67 65 151 33 74 100 22 50 22
Arable silage/Other fodder crops 65 62 66 81 90 34 41 59 21 27 26
Peas - human consumption 5 46 50 8 67 63 64 3 29 32 49
Peas - animal consumption 7 31 39 7 29 57 73 2 18 28 99
Beans - animal consumption 11 39 44 7 32 59 72 3 23 32 179
Vegetables (brassicae) 98 85 91 13 197 70 136 193 60 123 28
Vegetable (other) 79 81 82 15 107 75 132 85 60 109 51
Soft fruit 99 99 77 0 65 60 37 65 59 28 16
Top fruit 85 46 57 0 53 36 90 45 16 51 54
Other tillage 34 24 34 8 77 48 96 26 12 33 67
All tillage 91 61 63 18 170 63 83 154 38 53 4559
Grass under 5 years old 83 64 69 49 151 36 58 126 23 40 724
Grass 5 years and over 65 54 54 41 99 26 32 65 14 17 2225
All grass 68 55 56 42 108 28 37 73 15 21 2949
All crops and grass 78 58 59 31 141 44 59 110 26 35 7508
BSFP final inner 10/12/05 11:05 am Page 55

56
Source: British Survey of Fertiliser Practice 2004
N P2O5 K2O N P2O5 K2O N P2O5 K2O
Table EW1.2 Use of straight fertiliser, England & Wales 2004
Crop area receiving dressing Average field rate Overall application rate Fields in(%) (kg/ha) (kg/ha) sample
Spring wheat 66 0 4 144 0 75 95 0 3 40
Winter wheat 96 5 8 195 80 88 187 4 7 1855
Spring barley 68 1 6 98 75 83 67 1 5 395
Winter barley 89 4 8 137 83 86 122 3 7 526
Oats 82 2 6 112 72 91 91 2 5 131
Rye/Triticale/Durum wheat 45 0 7 114 0 86 52 0 6 30
Seed potatoes - - - - - - - - - 1
Early potatoes 60 8 8 105 126 251 64 10 21 8
2nd Early/Maincrop potatoes 51 0 20 99 0 201 51 0 39 120
Sugar beet 84 2 33 102 105 136 85 2 45 192
Spring oilseed rape 94 6 4 130 67 106 122 4 5 75
Winter oilseed rape 97 4 10 204 87 90 198 4 9 382
Linseed 70 0 2 77 0 60 54 0 1 29
Forage maize 34 0 19 71 0 105 24 0 19 151
Rootcrops for stockfeed 40 0 8 127 0 155 51 0 12 33
Leafy forage crops 44 0 0 47 0 0 20 0 0 22
Arable silage/Other fodder crops 26 0 4 109 0 75 29 0 3 26
Peas - human consumption 2 5 10 87 90 57 1 5 6 49
Peas - animal consumption 5 6 15 30 60 80 2 4 12 99
Beans - animal consumption 5 5 9 53 91 90 3 5 8 179
Vegetables (brassicae) 77 0 0 92 0 0 71 0 0 28
Vegetable (other) 73 1 8 97 130 109 70 1 9 51
Soft fruit 70 60 22 66 70 113 46 42 25 16
Top fruit 71 24 37 59 36 109 42 9 41 54
Other tillage 26 0 8 79 0 148 21 0 13 67
All tillage 82 4 10 169 79 100 138 3 10 4559
Grass under 5 years old 47 0 2 129 0 106 60 0 2 724
Grass 5 years and over 22 0 0 104 0 0 23 0 0 2225
All grass 26 0 1 110 0 96 28 0 1 2949
All crops and grass 51 2 5 153 78 100 78 2 5 7508
BSFP final inner 10/12/05 11:05 am Page 56

57
Source: British Survey of Fertiliser Practice 2004
N P2O5 K2O N P2O5 K2O N P2O5 K2O
Table EW1.3 Use of compound fertiliser, England & Wales 2004
Crop area receiving dressing Average field rate Overall application rate Fields in(%) (kg/ha) (kg/ha) sample
Spring wheat 18 33 38 62 47 54 11 16 21 40
Winter wheat 16 54 53 67 61 74 11 33 39 1855
Spring barley 49 71 72 78 44 60 38 32 43 395
Winter barley 23 68 69 74 58 76 17 39 53 526
Oats 12 64 63 74 58 70 9 37 44 131
Rye/Triticale/Durum wheat 15 40 42 85 60 70 13 24 30 30
Seed potatoes - - - - - - - - - 1
Early potatoes 92 92 92 113 165 245 103 152 224 8
2nd Early/Maincrop potatoes 78 84 74 137 150 230 108 126 171 120
Sugar beet 15 49 51 64 70 116 10 34 59 192
Spring oilseed rape 14 51 49 68 64 67 9 32 33 75
Winter oilseed rape 22 57 53 53 58 68 11 33 36 382
Linseed 15 42 42 64 49 53 9 20 22 29
Forage maize 67 68 37 39 60 70 27 41 26 151
Rootcrops for stockfeed 54 67 63 78 81 105 42 54 67 33
Leafy forage crops 63 67 67 126 33 74 79 22 50 22
Arable silage/Other fodder crops 47 62 62 63 34 38 30 21 24 26
Peas - human consumption 3 41 41 56 59 66 2 24 27 49
Peas - animal consumption 2 25 25 27 54 65 1 14 16 99
Beans - animal consumption 5 34 36 12 55 64 1 19 23 179
Vegetables (brassicae) 91 85 91 134 70 136 122 60 123 28
Vegetable (other) 17 80 80 87 74 124 15 59 100 51
Soft fruit 76 76 55 25 23 6 19 17 3 16
Top fruit 30 22 34 11 36 30 3 8 10 54
Other tillage 11 24 26 51 48 79 5 12 20 67
All tillage 22 57 55 72 61 78 16 35 43 4559
Grass under 5 years old 62 63 68 106 36 56 66 23 38 724
Grass 5 years and over 53 53 54 78 26 31 42 14 17 2225
All grass 55 55 56 83 27 36 45 15 20 2949
All crops and grass 40 56 55 80 43 55 32 24 30 7508
BSFP final inner 10/12/05 11:05 am Page 57
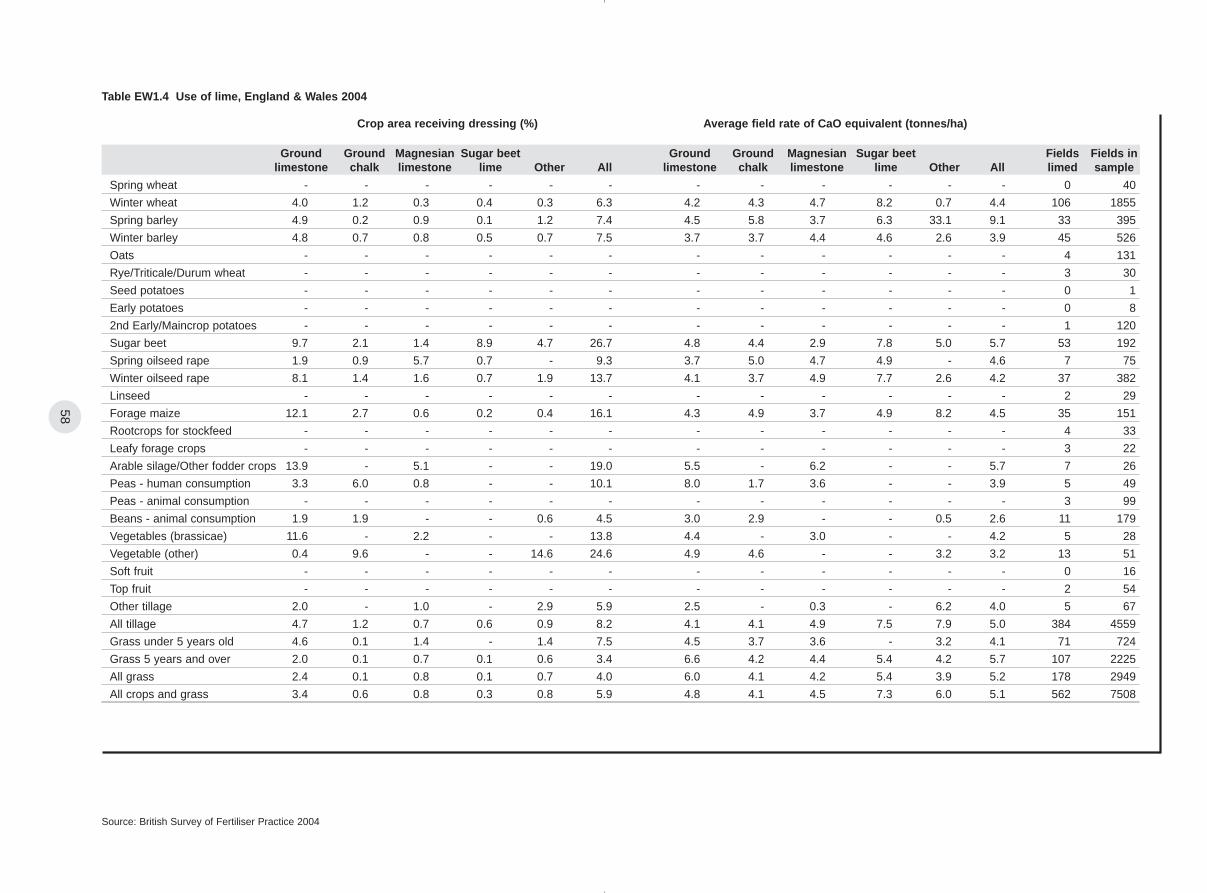
58
Source: British Survey of Fertiliser Practice 2004
Ground Ground Magnesian Sugar beet Ground Ground Magnesian Sugar beet Fields Fields inlimestone chalk limestone lime Other All limestone chalk limestone lime Other All limed sample
Table EW1.4 Use of lime, England & Wales 2004
Crop area receiving dressing (%) Average field rate of CaO equivalent (tonnes/ha)
Spring wheat - - - - - - - - - - - - 0 40
Winter wheat 4.0 1.2 0.3 0.4 0.3 6.3 4.2 4.3 4.7 8.2 0.7 4.4 106 1855
Spring barley 4.9 0.2 0.9 0.1 1.2 7.4 4.5 5.8 3.7 6.3 33.1 9.1 33 395
Winter barley 4.8 0.7 0.8 0.5 0.7 7.5 3.7 3.7 4.4 4.6 2.6 3.9 45 526
Oats - - - - - - - - - - - - 4 131
Rye/Triticale/Durum wheat - - - - - - - - - - - - 3 30
Seed potatoes - - - - - - - - - - - - 0 1
Early potatoes - - - - - - - - - - - - 0 8
2nd Early/Maincrop potatoes - - - - - - - - - - - - 1 120
Sugar beet 9.7 2.1 1.4 8.9 4.7 26.7 4.8 4.4 2.9 7.8 5.0 5.7 53 192
Spring oilseed rape 1.9 0.9 5.7 0.7 - 9.3 3.7 5.0 4.7 4.9 - 4.6 7 75
Winter oilseed rape 8.1 1.4 1.6 0.7 1.9 13.7 4.1 3.7 4.9 7.7 2.6 4.2 37 382
Linseed - - - - - - - - - - - - 2 29
Forage maize 12.1 2.7 0.6 0.2 0.4 16.1 4.3 4.9 3.7 4.9 8.2 4.5 35 151
Rootcrops for stockfeed - - - - - - - - - - - - 4 33
Leafy forage crops - - - - - - - - - - - - 3 22
Arable silage/Other fodder crops 13.9 - 5.1 - - 19.0 5.5 - 6.2 - - 5.7 7 26
Peas - human consumption 3.3 6.0 0.8 - - 10.1 8.0 1.7 3.6 - - 3.9 5 49
Peas - animal consumption - - - - - - - - - - - - 3 99
Beans - animal consumption 1.9 1.9 - - 0.6 4.5 3.0 2.9 - - 0.5 2.6 11 179
Vegetables (brassicae) 11.6 - 2.2 - - 13.8 4.4 - 3.0 - - 4.2 5 28
Vegetable (other) 0.4 9.6 - - 14.6 24.6 4.9 4.6 - - 3.2 3.2 13 51
Soft fruit - - - - - - - - - - - - 0 16
Top fruit - - - - - - - - - - - - 2 54
Other tillage 2.0 - 1.0 - 2.9 5.9 2.5 - 0.3 - 6.2 4.0 5 67
All tillage 4.7 1.2 0.7 0.6 0.9 8.2 4.1 4.1 4.9 7.5 7.9 5.0 384 4559
Grass under 5 years old 4.6 0.1 1.4 - 1.4 7.5 4.5 3.7 3.6 - 3.2 4.1 71 724
Grass 5 years and over 2.0 0.1 0.7 0.1 0.6 3.4 6.6 4.2 4.4 5.4 4.2 5.7 107 2225
All grass 2.4 0.1 0.8 0.1 0.7 4.0 6.0 4.1 4.2 5.4 3.9 5.2 178 2949
All crops and grass 3.4 0.6 0.8 0.3 0.8 5.9 4.8 4.1 4.5 7.3 6.0 5.1 562 7508
BSFP final inner 10/12/05 11:05 am Page 58

59
Source: British Survey of Fertiliser Practice 2004
kg/ha Fields inrow % 0 <25 25- 50- 75- 100- 125- 150- 175- 200- 225- 250- 275- 300- 325- 350- 375- 400+ sample
Table EW1.5 Percentage of crop area by field application rate - N, England & Wales 2004
Spring wheat 27 0 9 5 0 2 11 16 18 10 - - - - - - - - 40
Winter wheat 1 0 1 3 4 3 6 11 18 24 13 7 4 2 2 1 1 - 1855
Spring barley 3 2 5 8 18 29 27 6 1 2 1 - - - - - - - 395
Winter barley 1 0 5 5 5 12 26 26 13 2 3 1 - - - - - - 526
Oats 9 1 6 12 13 25 21 9 3 2 - - - - - - - - 131
Rye/Triticale/Durum wheat 44 0 0 4 25 1 8 17 - - - - - - - - - - 30
Seed potatoes - - - - - - - - - - - - - - - - - - 1
Early potatoes 0 7 0 0 0 0 12 24 33 24 - - - - - - - - 8
2nd Early/Maincrop potatoes 2 2 4 9 4 9 10 18 11 10 11 5 2 3 - - - - 120
Sugar beet 8 3 12 5 15 29 15 9 1 1 0 1 - - - - - - 192
Spring oilseed rape 0 2 2 11 14 18 15 17 10 6 5 - - - - - - - 75
Winter oilseed rape 1 0 0 2 2 3 3 10 15 27 18 6 8 2 1 1 - - 382
Linseed 22 2 11 18 32 5 7 3 - - - - - - - - - - 29
Forage maize 17 20 14 18 15 10 5 1 1 - - - - - - - - - 151
Rootcrops for stockfeed 18 0 11 27 3 13 2 7 8 9 0 0 0 0 2 - - - 33
Leafy forage crops 34 3 1 5 3 1 6 3 41 - - - - - - - - - 22
Arable silage/Other fodder crops 35 0 11 20 22 0 3 2 0 3 4 - - - - - - - 26
Peas - human consumption 95 0 0 3 2 - - - - - - - - - - - - - 49
Peas - animal consumption 93 1 5 1 - - - - - - - - - - - - - - 99
Beans - animal consumption 89 6 4 - - - - - - - - - - - - - - - 179
Vegetables (brassicae) 2 0 0 4 0 5 21 9 7 10 24 9 7 0 2 - - - 28
Vegetable (other) 21 1 19 6 14 4 16 8 11 - - - - - - - - - 51
Soft fruit 1 3 14 60 22 - - - - - - - - - - - - - 16
Top fruit 15 34 10 6 21 11 3 0 0 0 1 - - - - - - - 54
Other tillage 66 2 5 18 2 0 2 1 2 - - - - - - - - - 67
All tillage 9 2 3 5 6 8 10 11 12 15 9 4 3 1 1 1 - - 4559
Grass under 5 years old 17 1 4 11 11 10 10 7 4 6 6 3 2 3 2 1 1 - 724
Grass 5 years and over 35 1 13 16 11 6 5 4 2 2 2 1 1 1 - - - - 2225
All grass 32 1 12 15 11 6 6 4 2 3 2 1 1 1 1 - - - 2949
All crops and grass 22 1 8 11 9 7 8 7 7 8 5 3 2 1 1 - - - 7508
BSFP final inner 10/12/05 11:05 am Page 59

60
Source: British Survey of Fertiliser Practice 2004
kg/ha Fields inrow % 0 <25 25- 50- 75- 100- 125- 150- 175- 200- 225- 250- 275- 300- 325- 350- 375- 400+ sample
Table EW1.6 Percentage of crop area by field application rate - P2O5, England & Wales 2004
Spring wheat 67 3 19 9 1 0 0 1 - - - - - - - - - - 40
Winter wheat 41 4 11 26 15 3 1 0 - - - - - - - - - - 1855
Spring barley 28 17 21 27 7 1 0 0 - - - - - - - - - - 395
Winter barley 28 5 16 32 14 4 0 0 - - - - - - - - - - 526
Oats 34 8 14 25 16 4 0 0 - - - - - - - - - - 131
Rye/Triticale/Durum wheat 60 0 8 22 6 4 0 0 - - - - - - - - - - 30
Seed potatoes - - - - - - - - - - - - - - - - - - 1
Early potatoes 0 7 0 9 0 0 20 12 15 25 13 - - - - - - - 8
2nd Early/Maincrop potatoes 15 6 5 8 5 5 6 17 10 5 9 5 1 3 - - - - 120
Sugar beet 49 4 14 15 6 6 4 2 - - - - - - - - - - 192
Spring oilseed rape 43 5 13 21 11 5 2 - - - - - - - - - - - 75
Winter oilseed rape 39 4 12 30 12 2 - - - - - - - - - - - - 382
Linseed 58 0 23 19 - - - - - - - - - - - - - - 29
Forage maize 32 16 8 27 8 4 4 1 - - - - - - - - - - 151
Rootcrops for stockfeed 33 4 20 8 11 7 5 12 - - - - - - - - - - 33
Leafy forage crops 33 8 46 10 2 1 - - - - - - - - - - - - 22
Arable silage/Other fodder crops 38 24 14 16 8 - - - - - - - - - - - - - 26
Peas - human consumption 54 0 17 25 2 2 - - - - - - - - - - - - 49
Peas - animal consumption 69 3 3 20 4 0 1 - - - - - - - - - - - 99
Beans - animal consumption 61 2 11 18 6 2 - - - - - - - - - - - - 179
Vegetables (brassicae) 15 7 12 24 32 11 - - - - - - - - - - - - 28
Vegetable (other) 19 0 34 24 9 4 5 2 1 2 1 0 0 1 - - - - 51
Soft fruit 1 15 2 44 37 - - - - - - - - - - - - - 16
Top fruit 54 29 2 11 0 1 0 0 3 - - - - - - - - - 54
Other tillage 76 5 8 9 0 1 1 - - - - - - - - - - - 67
All tillage 39 6 13 25 12 3 1 1 - - - - - - - - - - 4559
Grass under 5 years old 36 21 27 9 5 1 - - - - - - - - - - - - 724
Grass 5 years and over 46 28 21 3 1 - - - - - - - - - - - - - 2225
All grass 45 27 22 4 1 - - - - - - - - - - - - - 2949
All crops and grass 42 17 18 14 6 2 - - - - - - - - - - - - 7508
BSFP final inner 10/12/05 11:05 am Page 60
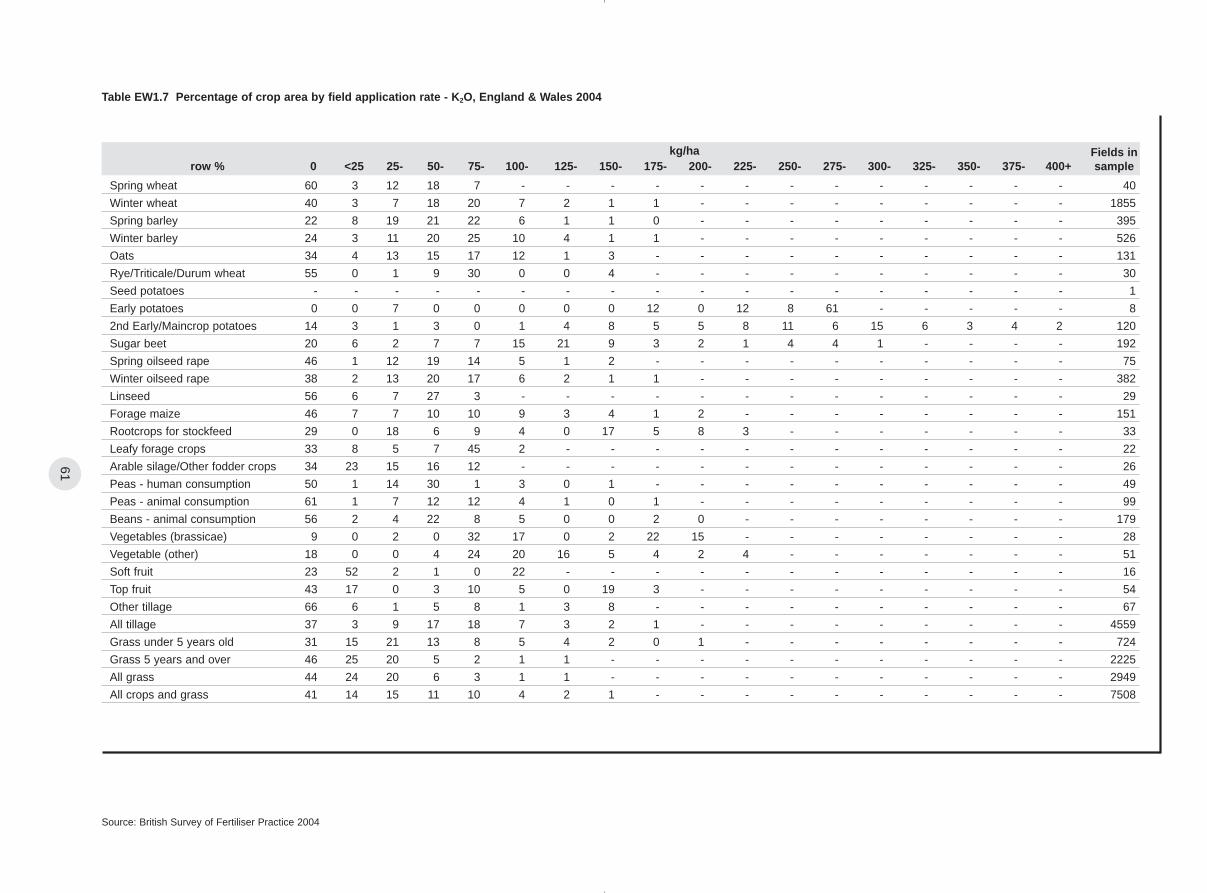
61
Source: British Survey of Fertiliser Practice 2004
kg/ha Fields inrow % 0 <25 25- 50- 75- 100- 125- 150- 175- 200- 225- 250- 275- 300- 325- 350- 375- 400+ sample
Table EW1.7 Percentage of crop area by field application rate - K2O, England & Wales 2004
Spring wheat 60 3 12 18 7 - - - - - - - - - - - - - 40
Winter wheat 40 3 7 18 20 7 2 1 1 - - - - - - - - - 1855
Spring barley 22 8 19 21 22 6 1 1 0 - - - - - - - - - 395
Winter barley 24 3 11 20 25 10 4 1 1 - - - - - - - - - 526
Oats 34 4 13 15 17 12 1 3 - - - - - - - - - - 131
Rye/Triticale/Durum wheat 55 0 1 9 30 0 0 4 - - - - - - - - - - 30
Seed potatoes - - - - - - - - - - - - - - - - - - 1
Early potatoes 0 0 7 0 0 0 0 0 12 0 12 8 61 - - - - - 8
2nd Early/Maincrop potatoes 14 3 1 3 0 1 4 8 5 5 8 11 6 15 6 3 4 2 120
Sugar beet 20 6 2 7 7 15 21 9 3 2 1 4 4 1 - - - - 192
Spring oilseed rape 46 1 12 19 14 5 1 2 - - - - - - - - - - 75
Winter oilseed rape 38 2 13 20 17 6 2 1 1 - - - - - - - - - 382
Linseed 56 6 7 27 3 - - - - - - - - - - - - - 29
Forage maize 46 7 7 10 10 9 3 4 1 2 - - - - - - - - 151
Rootcrops for stockfeed 29 0 18 6 9 4 0 17 5 8 3 - - - - - - - 33
Leafy forage crops 33 8 5 7 45 2 - - - - - - - - - - - - 22
Arable silage/Other fodder crops 34 23 15 16 12 - - - - - - - - - - - - - 26
Peas - human consumption 50 1 14 30 1 3 0 1 - - - - - - - - - - 49
Peas - animal consumption 61 1 7 12 12 4 1 0 1 - - - - - - - - - 99
Beans - animal consumption 56 2 4 22 8 5 0 0 2 0 - - - - - - - - 179
Vegetables (brassicae) 9 0 2 0 32 17 0 2 22 15 - - - - - - - - 28
Vegetable (other) 18 0 0 4 24 20 16 5 4 2 4 - - - - - - - 51
Soft fruit 23 52 2 1 0 22 - - - - - - - - - - - - 16
Top fruit 43 17 0 3 10 5 0 19 3 - - - - - - - - - 54
Other tillage 66 6 1 5 8 1 3 8 - - - - - - - - - - 67
All tillage 37 3 9 17 18 7 3 2 1 - - - - - - - - - 4559
Grass under 5 years old 31 15 21 13 8 5 4 2 0 1 - - - - - - - - 724
Grass 5 years and over 46 25 20 5 2 1 1 - - - - - - - - - - - 2225
All grass 44 24 20 6 3 1 1 - - - - - - - - - - - 2949
All crops and grass 41 14 15 11 10 4 2 1 - - - - - - - - - - 7508
BSFP final inner 10/12/05 11:05 am Page 61

62
Source: British Survey of Fertiliser Practice 2004
N P2O5 K2O FYM N P2O5 K2O N P2O5 K2O
Table EW2.1 Average fertiliser practice by grassland utilisation, England & Wales 2004
Crop area receiving dressing Average field rate Overall application rate Fields in(%) (kg/ha) (kg/ha) sample
Grazed not mown 60 49 48 30 95 25 27 56 12 13 1382
Grazed mown 82 66 69 63 122 31 45 99 20 31 1318
All grazings 68 55 56 41 106 27 35 72 15 20 2700
Cut for silage - grazed 87 73 77 70 132 32 49 115 23 37 947
Cut for silage - not grazed 86 61 77 62 152 37 68 131 22 52 139
All cut for silage 87 71 77 69 134 33 51 117 23 39 1086
Cut for hay - grazed 65 48 48 40 90 28 36 58 13 17 413
Cut for hay - not grazed 70 38 43 35 84 28 32 59 11 14 76
All cut for hay 65 47 47 39 89 28 35 59 13 17 489
All mowings 82 65 69 61 124 31 47 101 20 33 1517
All grass 68 55 56 42 108 28 37 73 15 21 2949
BSFP final inner 10/12/05 11:05 am Page 62

63
Source: British Survey of Fertiliser Practice 2004
kg/ha Fields inrow % 0 <25 25- 50- 75- 100- 125- 150- 175- 200- 225- 250- 275- 300- 325- 350- 375- 400+ sample
Table EW2.2 Percentage of grass area by field application rate - N, England & Wales 2004
Grazed not mown 40 1 15 16 9 4 4 3 2 1 1 1 1 1 1 - - - 1382
Grazed mown 18 1 8 14 14 9 10 8 4 5 3 2 1 1 - - - - 1318
All grazings 32 1 12 16 11 6 6 4 2 3 2 1 1 1 - - - - 2700
Cut for silage - grazed 13 1 8 12 14 10 11 9 5 7 4 2 1 1 0 0 0 1 947
Cut for silage - not grazed 14 1 10 11 10 14 5 4 3 4 7 0 4 7 3 0 2 - 139
All cut for silage 13 1 8 12 14 11 10 9 5 6 5 2 1 2 1 0 1 - 1086
Cut for hay - grazed 35 2 10 17 14 5 8 5 2 0 1 0 1 - - - - - 413
Cut for hay - not grazed 30 0 14 14 16 21 1 2 0 2 0 - - - - - - - 76
All cut for hay 35 2 11 16 14 7 7 4 2 1 1 0 1 - - - - - 489
All mowings 18 1 9 14 14 10 10 7 4 5 4 2 1 1 - - - - 1517
All grass 32 1 12 15 11 6 6 4 2 3 2 1 1 1 1 - - - 2949
BSFP final inner 10/12/05 11:05 am Page 63

64
Source: British Survey of Fertiliser Practice 2004
kg/ha Fields inrow % 0 <25 25- 50- 75- 100- 125- 150- 175- 200- 225- 250- 275- 300- 325- 350- 375- 400+ sample
Table EW2.3 Percentage of grass area by field application rate - P2O5, England & Wales 2004
Grazed not mown 51 29 17 3 1 - - - - - - - - - - - - - 1382
Grazed mown 34 26 31 7 2 1 - - - - - - - - - - - - 1318
All grazings 45 28 22 4 1 - - - - - - - - - - - - - 2700
Cut for silage - grazed 27 26 34 8 3 1 - - - - - - - - - - - - 947
Cut for silage - not grazed 39 26 20 6 6 4 - - - - - - - - - - - - 139
All cut for silage 29 26 33 8 3 1 - - - - - - - - - - - - 1086
Cut for hay - grazed 52 22 21 3 1 - - - - - - - - - - - - - 413
Cut for hay - not grazed 62 13 23 2 - - - - - - - - - - - - - - 76
All cut for hay 53 21 21 3 1 - - - - - - - - - - - - - 489
All mowings 35 26 29 6 3 - - - - - - - - - - - - - 1517
All grass 45 27 22 4 1 - - - - - - - - - - - - - 2949
BSFP final inner 10/12/05 11:05 am Page 64

65
Source: British Survey of Fertiliser Practice 2004
kg/ha Fields inrow % 0 <25 25- 50- 75- 100- 125- 150- 175- 200- 225- 250- 275- 300- 325- 350- 375- 400+ sample
Table EW2.4 Percentage of grass area by field application rate - K2O, England & Wales 2004
Grazed not mown 52 27 16 3 1 - - - - - - - - - - - - - 1382
Grazed mown 31 19 27 10 7 3 2 - - - - - - - - - - - 1318
All grazings 44 24 20 6 3 1 1 - - - - - - - - - - - 2700
Cut for silage - grazed 23 19 30 12 9 4 3 - - - - - - - - - - - 947
Cut for silage - not grazed 23 18 20 12 8 4 6 4 1 4 - - - - - - - - 139
All cut for silage 23 19 28 12 8 4 3 1 0 1 - - - - - - - - 1086
Cut for hay - grazed 52 19 20 4 2 2 1 - - - - - - - - - - - 413
Cut for hay - not grazed 57 17 18 5 2 0 0 1 - - - - - - - - - - 76
All cut for hay 53 19 20 4 2 1 1 - - - - - - - - - - - 489
All mowings 31 19 26 10 6 3 2 1 0 1 - - - - - - - - 1517
All grass 44 24 20 6 3 1 1 - - - - - - - - - - - 2949
BSFP final inner 10/12/05 11:05 am Page 65

66
Source: British Survey of Fertiliser Practice 2004
Sep Oct Nov Dec Jan Feb Mar Apr May Jun Jul Aug Total Productrow %( 000 tonnes)
Table EW3.0 Product and nutrient use by month of application, England & Wales 2004
(a) Product use
Straight N 1 0 0 0 0 6 30 37 17 4 3 1 1800
Straight P 25 15 7 3 0 9 19 4 5 0 3 10 32
Straight K 10 13 17 2 3 18 19 12 3 1 0 1 87
Compound 7 6 2 1 1 6 23 24 14 7 4 5 1855
All Fertilisers 4 4 2 1 1 7 26 30 15 6 3 3 3775
Sep Oct Nov Dec Jan Feb Mar Apr May Jun Jul Aug Total Nutrientrow %( 000 tonnes)
(b) Nutrient use
N 1 0 0 0 0 6 29 36 17 6 3 2 989
P2O5 12 10 4 2 1 8 22 19 9 3 2 6 230
K2O 10 11 4 2 2 10 21 18 10 5 2 5 317
Total 4 4 1 1 1 7 26 30 15 5 3 3 1536
Note: Product use refers to the total tonnage of the products used by farmers in the survey year 2004;Nutrient use refers to the tonnage of each nutrient contained in the products used.(e.g. 100 kg of a 20 : 10 : 10 compound contains 20 kg of N, 10 kg of P2O5, and 10 kg of K2O, while 100 kg of ammonium nitrate, one of the straight N products, contains typically 34.5 kg of N).
BSFP final inner 10/12/05 11:05 am Page 66

67
column % spring winter potatoes sugar oilseed other all grass for grass for grass for grass all all cropscereal cereal beet rape tillage tillage grazing hay silage not spec grass and grass
Table EW3.1 Product type as percentage of all product used by crop group, England & Wales 2004
Calcium Ammonium Nitrate 0.6 0.6 0.0 0.1 1.4 2.3 0.7 0.1 0.0 0.0 0.0 0.1 0.5
Urea 2.4 9.4 7.2 3.2 10.8 1.3 8.3 1.7 1.9 2.0 5.0 1.7 5.9
Ammonium Nitrate 30.6 45.3 5.3 20.8 40.3 17.2 39.1 23.1 26.8 21.0 28.8 23.2 33.4
Urea Ammonium Nitrate 6.3 10.9 2.4 2.7 15.0 1.4 9.8 0.2 0.5 0.3 0.0 0.2 6.4
Other Straight N 1.3 1.6 0.0 0.6 4.9 1.6 1.9 0.5 0.1 0.5 0.3 0.6 1.4
Triple Superphosphate 0.6 1.1 0.1 0.0 1.1 2.2 1.0 0.1 0.0 0.0 0.0 0.1 0.7
Single Superphosphate 0.0 0.0 0.0 1.8 0.0 0.0 0.1 0.1 0.0 0.0 0.0 0.1 0.1
Other Straight P 0.0 0.1 0.0 0.0 0.0 0.8 0.1 0.0 0.0 0.0 0.0 0.0 0.1
Muriate of Potash 1.6 1.5 4.2 1.6 1.9 6.4 2.0 0.3 0.5 0.5 2.1 0.4 1.4
Other Straight K 0.2 0.3 0.9 23.6 0.2 1.6 1.4 0.0 0.0 0.0 0.0 0.0 0.9
NP 0.2 0.7 3.7 0.5 1.3 5.3 1.2 2.4 1.7 1.6 0.0 2.4 1.6
NK 3.5 2.2 0.0 1.2 1.9 2.7 2.1 7.2 5.9 14.7 0.0 8.4 4.3
PK 14.5 19.6 3.7 34.4 14.1 29.7 19.0 2.6 3.3 2.5 6.9 2.7 13.1
Very High N 10.5 2.7 0.8 0.5 0.9 4.2 2.8 33.4 21.7 28.2 36.7 32.3 13.4
High N 17.8 0.9 0.9 1.5 0.2 6.9 2.2 25.1 33.3 24.2 18.7 24.5 10.2
High P 0.0 0.3 0.1 0.0 0.4 0.1 0.3 0.0 0.0 0.0 0.0 0.0 0.2
High K 3.8 1.1 42.1 4.0 1.2 7.6 3.8 1.0 2.6 1.9 0.0 1.1 2.8
Low N 1.3 1.2 17.3 2.3 1.7 1.8 2.2 0.4 0.4 0.9 0.0 0.6 1.6
Low P 1.5 0.2 5.0 0.4 0.0 5.7 0.8 0.4 0.7 0.9 0.0 0.5 0.7
Equal NPK 3.3 0.4 6.2 0.6 2.5 1.1 1.2 1.1 0.7 0.8 1.4 1.1 1.1
Total Product (’000 tonnes) 153 1579 119 105 329 139 2424 1246 128 624 7 1351 3775
Source: British Survey of Fertiliser Practice 2004
BSFP final inner 10/12/05 11:05 am Page 67

68
Table EW3.2 Use of product type by crop group, England & Wales 2004
Source: British Survey of Fertiliser Practice 2004
row % spring winter potatoes sugar oilseed other all grass for grass for grass for grass all total productcereal cereal beet rape tillage tillage grazing hay silage not spec grass ( 000 tonnes)
Calcium Ammonium Nitrate 4.4 45.4 0.0 0.5 23.9 15.8 89.9 9.2 0.3 0.8 0.0 10.1 20
Urea 1.6 66.3 3.8 1.5 15.8 0.8 89.8 9.4 1.1 5.5 0.2 10.2 224
Ammonium Nitrate 3.7 56.7 0.5 1.7 10.5 1.9 75.1 22.8 2.7 10.4 0.2 24.9 1261
Urea Ammonium Nitrate 4.0 71.2 1.2 1.2 20.4 0.8 98.9 1.1 0.3 0.7 0.0 1.1 241
Other Straight N 3.8 46.2 0.0 1.1 30.1 4.2 85.4 12.6 0.3 5.3 0.0 14.6 54
Triple Superphosphate 3.3 65.4 0.4 0.1 14.1 11.6 94.9 4.7 0.0 1.0 0.0 5.1 26
Single Superphosphate 0.0 0.0 0.0 58.3 0.0 0.0 58.3 41.7 0.0 0.0 0.0 41.7 3
Other Straight P 0.0 42.6 0.0 1.5 3.3 36.6 84.0 16.0 0.0 0.0 0.0 16.0 3
Muriate of Potash 4.8 44.4 9.6 3.2 11.7 17.2 90.9 7.9 1.2 5.8 0.3 9.1 52
Other Straight K 0.8 14.8 3.2 71.2 2.2 6.4 98.7 0.9 0.0 0.8 0.0 1.3 35
NP 0.6 18.7 7.4 0.8 7.1 12.2 46.7 50.1 3.6 16.0 0.0 53.3 60
NK 3.2 20.8 0.0 0.8 3.7 2.3 30.9 55.0 4.6 55.9 0.0 69.1 164
PK 4.5 62.3 0.9 7.3 9.4 8.3 92.7 6.6 0.8 3.1 0.1 7.3 496
Very High N 3.2 8.5 0.2 0.1 0.6 1.2 13.7 82.4 5.5 34.9 0.5 86.3 505
High N 7.0 3.7 0.3 0.4 0.2 2.5 14.1 81.1 11.1 39.3 0.3 85.9 385
High P 0.0 73.2 2.5 0.0 21.8 2.6 100.0 0.0 0.0 0.0 0.0 0.0 6
High K 5.4 16.7 46.7 4.0 3.8 9.8 86.4 11.8 3.1 10.9 0.0 13.6 107
Low N 3.3 32.6 34.1 4.1 9.2 4.3 87.5 7.4 0.9 9.6 0.0 12.5 60
Low P 8.4 9.3 22.3 1.5 0.6 30.1 72.2 19.2 3.1 20.7 0.0 27.8 27
Equal NPK 11.7 13.5 17.1 1.5 18.9 3.5 66.2 32.6 2.0 11.5 0.2 33.8 43
All Fertilisers 4.0 41.8 3.1 2.9 8.7 3.7 64.3 32.9 3.4 16.5 0.2 35.7 3775
BSFP final inner 10/12/05 11:05 am Page 68

69
total Productrow % Jan Feb Mar Apr May Jun Jul Aug Sep Oct Nov Dec( 000 tonnes)
Table EW3.3 Product use by month of application, England & Wales 2004
Calcium Ammonium Nitrate 0.0 3.8 33.4 46.9 11.2 0.0 2.2 0.8 0.0 0.0 0.0 1.9 20
Urea 0.0 8.2 28.7 38.8 15.3 4.0 4.3 0.0 0.5 0.1 0.0 0.2 224
Ammonium Nitrate 0.0 5.0 29.4 37.5 18.7 4.9 2.4 1.4 0.5 0.2 0.1 0.0 1261
Urea Ammonium Nitrate 0.3 8.8 31.7 36.9 16.3 2.3 1.8 1.0 0.7 0.3 0.0 0.0 241
Other Straight N 0.3 17.5 52.0 16.6 2.9 7.2 2.5 0.4 0.6 0.0 0.0 0.0 54
Triple Superphosphate 0.0 10.6 17.5 3.4 6.4 0.4 3.7 7.3 30.8 15.6 2.9 1.1 26
Single Superphosphate 0.0 0.0 21.1 0.0 0.0 0.0 0.0 0.0 0.0 18.8 39.4 20.6 3
Other Straight P 0.0 8.8 29.3 16.0 0.0 0.0 0.0 42.6 0.0 0.0 3.3 0.0 3
Muriate of Potash 3.6 16.1 25.7 16.7 5.6 0.8 0.0 1.7 4.3 14.9 8.5 2.1 52
Other Straight K 3.1 22.0 9.3 4.5 0.0 0.4 0.0 0.0 18.7 10.3 29.5 2.2 35
NP 0.0 10.1 43.3 26.6 11.3 1.8 3.2 0.7 1.4 1.6 0.0 0.0 60
NK 0.0 6.8 12.1 14.8 29.7 21.4 10.6 3.0 0.6 0.0 0.0 1.0 164
PK 3.8 11.7 13.8 5.1 3.8 0.9 0.5 7.1 20.9 20.7 7.6 4.0 496
Very High N 0.1 2.8 28.7 28.2 16.3 12.0 5.7 5.1 0.9 0.1 0.0 0.1 505
High N 0.2 3.9 22.4 36.5 20.5 7.3 4.5 2.4 0.8 1.6 0.1 0.0 385
High P 0.0 10.5 8.7 0.4 25.1 0.0 0.0 24.3 31 0.0 0.0 0.0 6
High K 0.0 7.1 39.9 45.7 4.9 0.6 0.0 0.7 1.1 0.1 0.0 0.0 107
Low N 0.0 4.1 38.7 26.8 1.2 1.3 1.7 6.6 10.6 8.2 0.9 0.0 60
Low P 0.0 4.1 23.1 52.2 4.1 8.4 0.2 5.3 0.7 1.8 0.0 0.0 27
Equal NPK 0.0 6.6 28.7 26.6 14.3 1.4 0.8 14.0 3.0 3.0 1.7 0.0 43
All Fertilisers 0.7 6.6 26.5 29.6 15.0 5.6 3.1 3.0 4 3.6 1.5 0.7 3775
Source: British Survey of Fertiliser Practice 2004
BSFP final inner 10/12/05 11:05 am Page 69

70
Wessex All tillage 92 66 65 36 181 64 77 167 42 50 315
All grass 66 35 44 38 150 28 42 99 10 18 182
All crops & grass 78 49 54 37 167 50 62 131 25 33 497
Anglia All tillage 88 53 44 7 162 70 91 143 37 40 864
All grass 56 20 21 3 84 36 45 47 7 9 72
All crops & grass 85 50 42 7 158 69 89 135 34 37 936
Northern All tillage 94 86 90 30 155 58 78 146 50 71 257
All grass 71 65 66 48 89 26 30 63 17 20 496
All crops & grass 75 69 71 45 104 33 40 78 23 29 753
North East All tillage 93 58 67 18 185 63 90 171 37 61 803
All grass 60 48 49 39 126 30 41 75 14 20 351
All crops & grass 78 54 59 28 164 49 72 127 26 42 1154
North Mercia All tillage 88 63 74 43 151 49 86 133 31 64 225
All grass 64 45 48 47 102 23 36 66 10 17 211
All crops & grass 72 51 57 45 122 34 58 88 17 33 436
South Mercia All tillage 90 62 67 20 164 62 78 147 39 52 305
All grass 68 38 38 15 112 27 34 76 10 13 178
All crops & grass 80 51 54 17 144 51 64 115 26 34 483
East Midland All tillage 93 59 61 10 174 62 76 163 37 47 946
All grass 53 29 31 30 126 26 33 67 8 10 247
All crops & grass 83 51 54 15 166 57 70 138 29 37 1193
South East All tillage 88 58 65 13 181 60 82 160 35 53 485
All grass 49 28 27 12 99 25 31 49 7 8 223
All crops & grass 72 46 49 13 158 51 71 114 23 35 708
South West All tillage 82 76 75 41 136 67 89 112 51 67 216
All grass 79 71 71 67 130 33 49 103 24 35 329
All crops & grass 80 72 72 60 132 42 59 105 30 42 545
Wales All tillage 97 76 83 58 119 51 72 115 38 60 143
All grass 77 73 72 48 96 28 36 75 20 26 660
All crops & grass 79 73 73 49 98 29 39 77 21 28 803
Source: British Survey of Fertiliser Practice 2004
N P2O5 K2O FYM N P2O5 K2O N P2O5 K2O
Table EW4.1 Average fertiliser practice on tillage and grassland by BSFP region, 2004
Crop area receiving dressing Average field rate Overall application rate Fields in(%) (kg/ha) (kg/ha) sample
BSFP final inner 10/12/05 11:05 am Page 70

71
Source: British Survey of Fertiliser Practice 2004
N P2O5 K2O FYM N P2O5 K2O N P2O5 K2O
Table EW5.1 Average fertiliser practice on dairy farms, England & Wales 2004
Crop area receiving dressing Average field rate Overall application rate Fields in(%) (kg/ha) (kg/ha) sample
Spring wheat 60 60 60 98 80 41 33 49 25 20 8
Winter wheat 98 68 74 49 155 56 73 152 38 54 81
Spring barley 91 80 85 76 73 34 43 66 27 36 43
Winter barley 98 89 89 67 122 51 58 120 46 52 37
Oats 76 32 32 70 60 36 43 46 12 14 10
Rye/Triticale/Durum wheat - - - - - - - - - - 2
Seed potatoes - - - - - - - - - - 0
Early potatoes - - - - - - - - - - 0
2nd Early/Maincrop potatoes - - - - - - - - - - 2
Sugar beet - - - - - - - - - - 1
Spring oilseed rape - - - - - - - - - - 2
Winter oilseed rape - - - - - - - - - - 3
Linseed - - - - - - - - - - 0
Forage maize 88 81 55 98 54 56 82 48 46 45 78
Rootcrops for stockfeed 40 29 51 90 91 35 107 36 10 54 6
Leafy forage crops 90 90 90 82 118 35 38 106 32 34 6
Arable silage/Other fodder crops 60 60 60 87 68 28 32 41 17 19 12
Peas - human consumption - - - - - - - - - - 0
Peas - animal consumption - - - - - - - - - - 2
Beans - animal consumption 0 42 30 45 0 65 38 0 28 11 5
Vegetables (brassicae) - - - - - - - - - - 0
Vegetable (other) - - - - - - - - - - 0
Soft fruit - - - - - - - - - - 0
Top fruit - - - - - - - - - - 0
Other tillage - - - - - - - - - - 2
All tillage 87 73 66 77 98 52 70 86 38 46 300
Grass under 5 years old 90 69 80 74 186 36 61 167 25 49 241
Grass 5 years and over 81 61 64 69 147 29 45 118 18 29 534
All grass 83 63 67 70 156 31 49 129 19 33 775
All crops and grass 83 64 67 71 149 34 52 124 22 35 1075
BSFP final inner 10/12/05 11:05 am Page 71

72
Source: British Survey of Fertiliser Practice 2004
N P2O5 K2O FYM N P2O5 K2O N P2O5 K2O
Table EW5.2 Average fertiliser practice on cattle and sheep farms, England & Wales 2004
Crop area receiving dressing Average field rate Overall application rate Fields in(%) (kg/ha) (kg/ha) sample
Spring wheat - - - - - - - - - - 2
Winter wheat 100 65 64 33 175 62 81 175 40 52 55
Spring barley 98 80 86 43 92 47 56 90 37 48 53
Winter barley 95 74 80 68 122 65 70 117 48 56 49
Oats 82 69 74 59 85 49 55 70 34 41 19
Rye/Triticale/Durum wheat - - - - - - - - - - 1
Seed potatoes - - - - - - - - - - 0
Early potatoes - - - - - - - - - - 0
2nd Early/Maincrop potatoes - - - - - - - - - - 1
Sugar beet - - - - - - - - - - 0
Spring oilseed rape - - - - - - - - - - 1
Winter oilseed rape 100 56 56 13 207 67 86 207 38 48 5
Linseed - - - - - - - - - - 0
Forage maize 64 54 40 83 73 65 72 47 35 29 23
Rootcrops for stockfeed 92 92 92 77 73 70 75 67 64 69 11
Leafy forage crops 52 52 52 29 70 43 43 36 22 22 8
Arable silage/Other fodder crops - - - - - - - - - - 4
Peas - human consumption - - - - - - - - - - 0
Peas - animal consumption - - - - - - - - - - 0
Beans - animal consumption 0 44 54 0 0 38 58 0 17 31 6
Vegetables (brassicae) - - - - - - - - - - 0
Vegetable (other) - - - - - - - - - - 1
Soft fruit - - - - - - - - - - 0
Top fruit - - - - - - - - - - 1
Other tillage - - - - - - - - - - 3
All tillage 90 69 72 51 124 58 68 112 40 48 243
Grass under 5 years old 83 68 70 46 108 37 51 90 25 36 213
Grass 5 years and over 63 57 57 40 75 24 26 47 14 15 1106
All grass 64 58 58 40 78 25 28 50 15 16 1319
All crops and grass 65 59 58 41 80 27 30 52 16 18 1562
BSFP final inner 10/12/05 11:05 am Page 72

73
Source: British Survey of Fertiliser Practice 2004
N P2O5 K2O FYM N P2O5 K2O N P2O5 K2O
Table EW5.3 Average fertiliser practice on other livestock/mixed farms, England & Wales 2004
Crop area receiving dressing Average field rate Overall application rate Fields in(%) (kg/ha) (kg/ha) sample
Spring wheat 35 11 11 11 154 99 64 54 10 7 10
Winter wheat 97 47 47 34 176 57 76 170 27 36 286
Spring barley 95 70 70 41 102 37 51 97 26 35 67
Winter barley 98 74 75 22 146 55 75 143 41 56 99
Oats 85 59 55 48 100 49 67 85 29 37 37
Rye/Triticale/Durum wheat 36 27 27 36 109 45 59 40 12 16 15
Seed potatoes - - - - - - - - - - 0
Early potatoes - - - - - - - - - - 0
2nd Early/Maincrop potatoes 88 72 72 47 187 253 337 165 183 243 12
Sugar beet 85 39 46 34 107 50 122 92 19 57 15
Spring oilseed rape 100 53 55 40 131 78 82 131 42 45 13
Winter oilseed rape 100 55 52 42 194 49 71 194 27 36 45
Linseed - - - - - - - - - - 3
Forage maize 75 42 46 69 87 102 114 65 43 53 39
Rootcrops for stockfeed 86 52 52 91 176 147 194 151 77 101 7
Leafy forage crops - - - - - - - - - - 3
Arable silage/Other fodder crops 57 72 72 73 73 26 33 41 19 23 5
Peas - human consumption 0 0 0 17 0 0 0 0 0 0 7
Peas - animal consumption 18 49 49 50 63 40 57 11 19 28 5
Beans - animal consumption 4 28 35 20 25 51 67 1 15 23 25
Vegetables (brassicae) - - - - - - - - - - 0
Vegetable (other) 31 31 31 69 97 40 90 30 12 28 6
Soft fruit - - - - - - - - - - 2
Top fruit - - - - - - - - - - 3
Other tillage 16 10 10 1 75 54 70 12 6 7 9
All tillage 87 51 51 35 155 58 79 134 30 40 713
Grass under 5 years old 73 52 59 34 163 40 61 119 21 36 128
Grass 5 years and over 58 37 35 17 111 28 32 64 10 11 208
All grass 62 41 42 21 127 32 43 79 13 18 336
All crops and grass 74 46 47 28 144 46 63 107 22 29 1049
BSFP final inner 10/12/05 11:05 am Page 73

74
Source: British Survey of Fertiliser Practice 2004
N P2O5 K2O FYM N P2O5 K2O N P2O5 K2O
Table EW5.4 Average fertiliser practice on cropping/horticultural farms, England & Wales 2004
Crop area receiving dressing Average field rate Overall application rate Fields in(%) (kg/ha) (kg/ha) sample
Spring wheat 100 39 51 21 157 43 67 157 16 34 20
Winter wheat 99 61 61 11 204 64 78 203 39 47 1433
Spring barley 98 71 79 10 114 47 67 112 33 52 232
Winter barley 100 70 75 11 141 60 80 141 42 60 341
Oats 97 71 71 2 119 64 82 114 46 58 65
Rye/Triticale/Durum wheat 89 68 74 42 121 68 89 107 46 66 12
Seed potatoes - - - - - - - - - - 1
Early potatoes 100 100 100 20 167 162 245 167 162 245 8
2nd Early/Maincrop potatoes 98 85 87 30 160 142 237 157 121 206 105
Sugar beet 92 52 82 24 103 73 130 95 38 107 176
Spring oilseed rape 100 57 53 11 131 62 68 131 36 36 59
Winter oilseed rape 99 62 64 9 213 62 72 211 38 46 329
Linseed 76 42 45 10 79 49 52 60 21 23 26
Forage maize 93 58 85 89 51 29 60 47 17 52 11
Rootcrops for stockfeed 93 71 70 37 127 66 127 119 47 89 9
Leafy forage crops 75 80 80 72 185 30 91 139 24 73 5
Arable silage/Other fodder crops 84 29 58 67 127 80 78 108 23 45 5
Peas - human consumption 5 49 54 7 67 63 64 3 31 35 42
Peas - animal consumption 7 30 38 5 28 58 73 2 17 28 91
Beans - animal consumption 12 41 45 5 32 60 73 4 25 33 144
Vegetables (brassicae) 98 85 91 13 197 70 136 193 60 123 28
Vegetable (other) 84 86 88 8 108 76 134 91 65 117 44
Soft fruit 99 99 74 0 69 66 41 68 65 30 14
Top fruit 92 47 58 0 53 26 85 49 12 49 50
Other tillage 40 31 43 9 80 48 102 32 15 44 53
All tillage 92 61 65 12 178 64 85 163 39 55 3303
Grass under 5 years old 83 57 55 16 120 34 57 99 19 31 142
Grass 5 years and over 55 30 31 4 98 28 39 54 8 12 377
All grass 61 36 36 7 105 30 46 65 11 17 519
All crops and grass 87 58 61 11 171 61 82 149 35 50 3822
BSFP final inner 10/12/05 11:05 am Page 74

75
Source: British Survey of Fertiliser Practice 2004
N P2O5 K2O FYM N P2O5 K2O N P2O5 K2O
Table SC1.1 Total fertiliser use, Scotland 2004
Crop area receiving dressing Average field rate Overall application rate Fields in(%) (kg/ha) (kg/ha) sample
Spring wheat 87 84 84 8 135 58 75 118 48 63 12
Winter wheat 95 90 90 16 201 71 87 192 64 78 200
Spring barley 99 97 97 31 104 60 68 103 58 66 397
Winter barley 100 98 98 12 189 75 89 189 74 87 102
Oats 83 86 86 22 100 55 67 83 47 57 43
Rye/Triticale/Durum wheat - - - - - - - - - - 4
Seed potatoes 90 90 90 25 120 175 204 109 158 185 20
Early potatoes - - - - - - - - - - 0
2nd Early/Maincrop potatoes 95 95 95 8 131 122 152 125 115 144 24
Sugar beet - - - - - - - - - - 0
Spring oilseed rape 100 100 100 11 171 77 78 171 77 78 12
Winter oilseed rape 100 92 92 9 217 63 63 217 58 58 55
Linseed - - - - - - - - - - 2
Forage maize - - - - - - - - - - 1
Rootcrops for stockfeed 98 100 100 80 84 125 96 82 125 96 36
Leafy forage crops 55 72 72 55 86 71 69 47 51 49 17
Arable silage/Other fodder crops 47 45 47 11 74 43 65 35 19 30 12
Peas - human consumption 0 0 0 0 0 0 0 0 0 0 6
Peas - animal consumption - - - - - - - - - - 3
Beans - animal consumption - - - - - - - - - - 3
Vegetables (brassicae) - - - - - - - - - - 4
Vegetable (other) 67 83 83 0 72 108 89 48 90 74 7
Soft fruit 100 100 100 27 31 38 54 31 38 54 5
Top fruit - - - - - - - - - - 0
Other tillage - - - - - - - - - - 0
All tillage 96 93 93 24 140 67 77 134 63 72 965
Grass under 5 years old 89 81 77 26 121 41 53 107 33 41 368
Grass 5 years and over 79 75 73 26 109 33 36 87 25 26 499
All grass 82 77 75 26 113 36 41 93 27 30 867
All crops and grass 87 83 82 25 124 49 56 108 41 46 1832
BSFP final inner 10/12/05 11:05 am Page 75

76
Source: British Survey of Fertiliser Practice 2004
N P2O5 K2O N P2O5 K2O N P2O5 K2O
Table SC1.2 Use of straight fertiliser, Scotland 2004
Crop area receiving dressing Average field rate Overall application rate Fields in(%) (kg/ha) (kg/ha) sample
Spring wheat 81 0 9 111 0 113 90 0 11 12
Winter wheat 91 3 9 188 74 127 170 2 12 200
Spring barley 67 0 2 75 0 89 50 0 2 397
Winter barley 96 0 2 162 0 123 155 0 3 102
Oats 46 0 0 106 0 0 49 0 0 43
Rye/Triticale/Durum wheat - - - - - - - - - 4
Seed potatoes 3 0 10 19 0 207 1 0 21 20
Early potatoes - - - - - - - - - 0
2nd Early/Maincrop potatoes 33 0 3 113 0 162 38 0 5 24
Sugar beet - - - - - - - - - 0
Spring oilseed rape 68 0 0 128 0 0 87 0 0 12
Winter oilseed rape 100 3 6 189 74 75 189 1 4 55
Linseed - - - - - - - - - 2
Forage maize - - - - - - - - - 1
Rootcrops for stockfeed 2 0 0 47 0 0 1 0 0 36
Leafy forage crops 21 0 0 65 0 0 14 0 0 17
Arable silage/Other fodder crops 11 0 2 115 0 65 13 0 1 12
Peas - human consumption 0 0 0 0 0 0 0 0 0 6
Peas - animal consumption - - - - - - - - - 3
Beans - animal consumption - - - - - - - - - 3
Vegetables (brassicae) - - - - - - - - - 4
Vegetable (other) 23 0 15 51 0 186 12 0 28 7
Soft fruit - - - - - - - - - 5
Top fruit - - - - - - - - - 0
Other tillage - - - - - - - - - 0
All tillage 72 1 4 126 74 115 90 0 4 965
Grass under 5 years old 29 1 2 83 65 97 24 0 2 368
Grass 5 years and over 19 1 0 96 107 0 19 1 0 499
All grass 22 1 1 91 95 91 20 1 1 867
All crops and grass 41 1 2 114 86 109 46 0 2 1832
BSFP final inner 10/12/05 11:05 am Page 76

77
Source: British Survey of Fertiliser Practice 2004
N P2O5 K2O N P2O5 K2O N P2O5 K2O
Table SC1.3 Use of compound fertiliser, Scotland 2004
Crop area receiving dressing Average field rate Overall application rate Fields in(%) (kg/ha) (kg/ha) sample
Spring wheat 71 84 84 39 58 63 27 48 53 12
Winter wheat 49 87 84 44 70 79 22 62 66 200
Spring barley 91 97 97 58 60 67 53 58 64 397
Winter barley 75 98 98 45 75 86 34 74 84 102
Oats 63 86 86 55 55 67 35 47 57 43
Rye/Triticale/Durum wheat - - - - - - - - - 4
Seed potatoes 90 90 81 119 175 204 108 158 164 20
Early potatoes - - - - - - - - - 0
2nd Early/Maincrop potatoes 95 95 91 92 122 152 87 115 139 24
Sugar beet - - - - - - - - - 0
Spring oilseed rape 100 100 100 84 77 78 84 77 78 12
Winter oilseed rape 75 92 86 37 63 62 27 58 53 55
Linseed - - - - - - - - - 2
Forage maize - - - - - - - - - 1
Rootcrops for stockfeed 98 100 100 83 125 96 81 125 96 36
Leafy forage crops 40 72 72 82 71 69 33 51 49 17
Arable silage/Other fodder crops 45 45 45 48 43 65 22 19 29 12
Peas - human consumption 0 0 0 0 0 0 0 0 0 6
Peas - animal consumption - - - - - - - - - 3
Beans - animal consumption - - - - - - - - - 3
Vegetables (brassicae) - - - - - - - - - 4
Vegetable (other) 67 83 68 54 108 68 36 90 46 7
Soft fruit 100 100 100 31 38 54 31 38 54 5
Top fruit - - - - - - - - - 0
Other tillage - - - - - - - - - 0
All tillage 78 93 91 56 67 74 44 62 68 965
Grass under 5 years old 76 81 76 109 41 52 83 33 39 368
Grass 5 years and over 70 75 73 98 33 35 68 24 26 499
All grass 72 77 74 101 35 40 73 27 30 867
All crops and grass 74 83 80 84 48 55 62 40 44 1832
BSFP final inner 10/12/05 11:05 am Page 77

78
Source: British Survey of Fertiliser Practice 2004
Ground Ground Magnesian Sugar beet Ground Ground Magnesian Sugar beet Fields Fields inlimestone chalk limestone lime Other All limestone chalk limestone lime Other All limed sample
Table SC1.4 Use of lime, Scotland 2004
Crop area receiving dressing (%) Average field rate of CaO equivalent (tonnes/ha)
Spring wheat - - - - - - - - - - - - 1 12
Winter wheat 1.0 - 1.7 - 1.2 3.9 3.9 - 4.1 - 0.7 3.0 11 200
Spring barley 8.5 - 6.4 - 0.8 15.7 4.5 - 4.2 - 1.2 4.2 71 397
Winter barley 12.0 - 4.3 - - 16.3 5.3 - 5.0 - - 5.2 14 102
Oats 2.7 - 7.2 - - 9.9 4.5 - 5.0 - - 4.8 6 43
Rye/Triticale/Durum wheat - - - - - - - - - - - - 1 4
Seed potatoes - - - - - - - - - - - - 0 20
Early potatoes - - - - - - - - - - - - 0 0
2nd Early/Maincrop potatoes - - - - - - - - - - - - 0 24
Sugar beet - - - - - - - - - - - - 0 0
Spring oilseed rape - - - - - - - - - - - - 1 12
Winter oilseed rape - - - - - - - - - - - - 2 55
Linseed - - - - - - - - - - - - 1 2
Forage maize - - - - - - - - - - - - 1 1
Rootcrops for stockfeed 6.2 - 5.3 - - 11.6 3.5 - 4.9 - - 4.1 7 36
Leafy forage crops - - - - - - - - - - - - 4 17
Arable silage/Other fodder crops - - - - - - - - - - - - 2 12
Peas - human consumption - - - - - - - - - - - - 3 6
Peas - animal consumption - - - - - - - - - - - - 0 3
Beans - animal consumption - - - - - - - - - - - - 0 3
Vegetables (brassicae) - - - - - - - - - - - - 0 4
Vegetable (other) - - - - - - - - - - - - 2 7
Soft fruit - - - - - - - - - - - - 0 5
Top fruit - - - - - - - - - - - - 0 0
Other tillage - - - - - - - - - - - - 0 0
All tillage 6.3 - 4.9 - 0.8 12.1 4.6 - 4.4 - 1.5 4.3 127 965
Grass under 5 years old 4.4 - 1.6 - 1.5 7.5 4.0 - 4.0 - 3.1 3.8 33 368
Grass 5 years and over 0.8 - 1.1 - 0.1 2.0 2.1 - 4.7 - 2.9 3.5 27 499
All grass 1.9 - 1.2 - 0.5 3.6 3.4 - 4.4 - 3.1 3.7 60 867
All crops and grass 3.5 - 2.6 - 0.6 6.8 4.2 - 4.4 - 2.3 4.1 187 1832
BSFP final inner 10/12/05 11:05 am Page 78
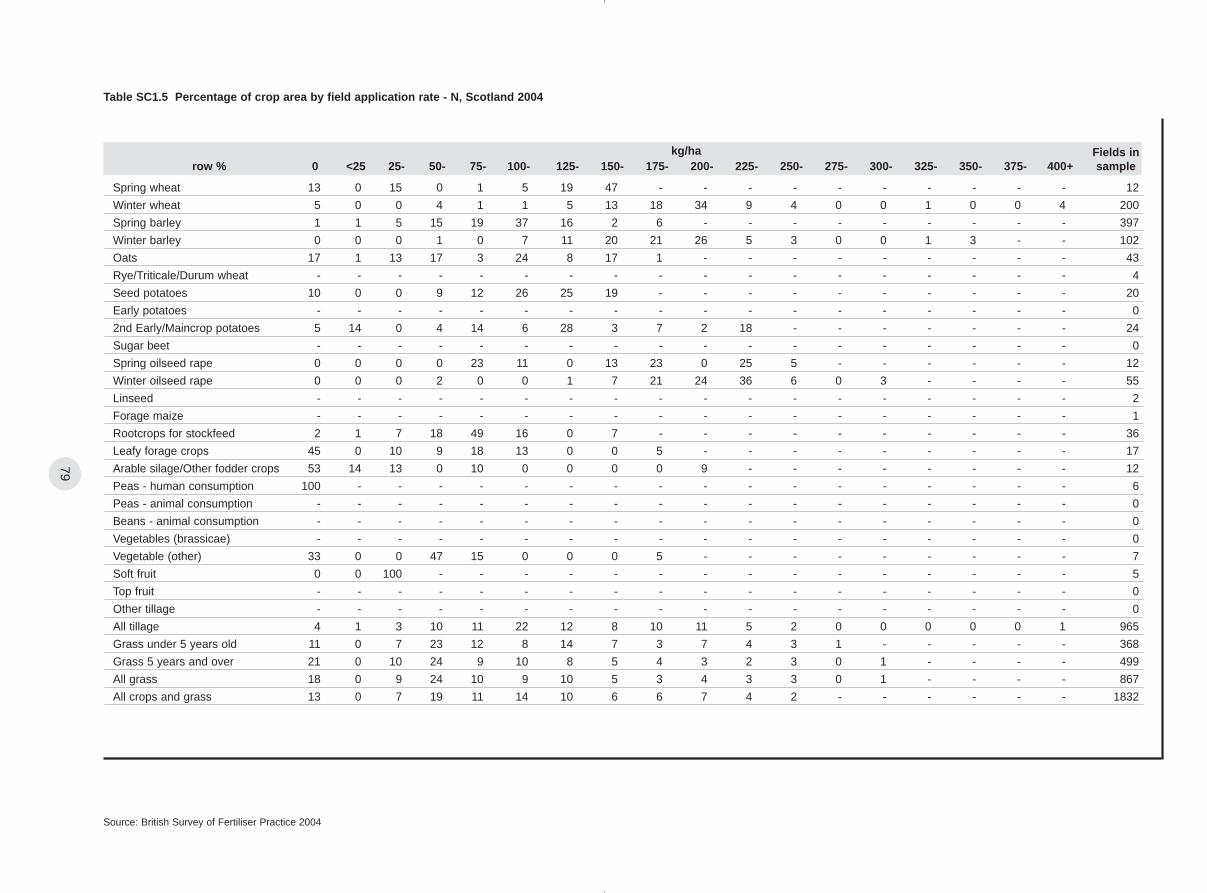
79
Source: British Survey of Fertiliser Practice 2004
kg/ha Fields inrow % 0 <25 25- 50- 75- 100- 125- 150- 175- 200- 225- 250- 275- 300- 325- 350- 375- 400+ sample
Table SC1.5 Percentage of crop area by field application rate - N, Scotland 2004
Spring wheat 13 0 15 0 1 5 19 47 - - - - - - - - - - 12
Winter wheat 5 0 0 4 1 1 5 13 18 34 9 4 0 0 1 0 0 4 200
Spring barley 1 1 5 15 19 37 16 2 6 - - - - - - - - - 397
Winter barley 0 0 0 1 0 7 11 20 21 26 5 3 0 0 1 3 - - 102
Oats 17 1 13 17 3 24 8 17 1 - - - - - - - - - 43
Rye/Triticale/Durum wheat - - - - - - - - - - - - - - - - - - 4
Seed potatoes 10 0 0 9 12 26 25 19 - - - - - - - - - - 20
Early potatoes - - - - - - - - - - - - - - - - - - 0
2nd Early/Maincrop potatoes 5 14 0 4 14 6 28 3 7 2 18 - - - - - - - 24
Sugar beet - - - - - - - - - - - - - - - - - - 0
Spring oilseed rape 0 0 0 0 23 11 0 13 23 0 25 5 - - - - - - 12
Winter oilseed rape 0 0 0 2 0 0 1 7 21 24 36 6 0 3 - - - - 55
Linseed - - - - - - - - - - - - - - - - - - 2
Forage maize - - - - - - - - - - - - - - - - - - 1
Rootcrops for stockfeed 2 1 7 18 49 16 0 7 - - - - - - - - - - 36
Leafy forage crops 45 0 10 9 18 13 0 0 5 - - - - - - - - - 17
Arable silage/Other fodder crops 53 14 13 0 10 0 0 0 0 9 - - - - - - - - 12
Peas - human consumption 100 - - - - - - - - - - - - - - - - - 6
Peas - animal consumption - - - - - - - - - - - - - - - - - - 0
Beans - animal consumption - - - - - - - - - - - - - - - - - - 0
Vegetables (brassicae) - - - - - - - - - - - - - - - - - - 0
Vegetable (other) 33 0 0 47 15 0 0 0 5 - - - - - - - - - 7
Soft fruit 0 0 100 - - - - - - - - - - - - - - - 5
Top fruit - - - - - - - - - - - - - - - - - - 0
Other tillage - - - - - - - - - - - - - - - - - - 0
All tillage 4 1 3 10 11 22 12 8 10 11 5 2 0 0 0 0 0 1 965
Grass under 5 years old 11 0 7 23 12 8 14 7 3 7 4 3 1 - - - - - 368
Grass 5 years and over 21 0 10 24 9 10 8 5 4 3 2 3 0 1 - - - - 499
All grass 18 0 9 24 10 9 10 5 3 4 3 3 0 1 - - - - 867
All crops and grass 13 0 7 19 11 14 10 6 6 7 4 2 - - - - - - 1832
BSFP final inner 10/12/05 11:05 am Page 79

80
Source: British Survey of Fertiliser Practice 2004
kg/ha Fields inrow % 0 <25 25- 50- 75- 100- 125- 150- 175- 200- 225- 250- 275- 300- 325- 350- 375- 400+ sample
Table SC1.6 Percentage of crop area by field application rate - P2O5, Scotland 2004
Spring wheat 16 10 32 7 29 6 - - - - - - - - - - - - 12
Winter wheat 10 9 4 28 43 6 - - - - - - - - - - - - 200
Spring barley 3 4 18 53 18 4 - - - - - - - - - - - - 397
Winter barley 2 0 5 36 49 8 - - - - - - - - - - - - 102
Oats 14 9 22 33 20 2 - - - - - - - - - - - - 43
Rye/Triticale/Durum wheat - - - - - - - - - - - - - - - - - - 4
Seed potatoes 10 0 0 0 3 0 24 22 11 23 8 - - - - - - - 20
Early potatoes - - - - - - - - - - - - - - - - - - 0
2nd Early/Maincrop potatoes 5 26 4 9 6 2 16 0 4 10 15 3 - - - - - - 24
Sugar beet - - - - - - - - - - - - - - - - - - 0
Spring oilseed rape 0 9 0 42 24 25 - - - - - - - - - - - - 12
Winter oilseed rape 8 7 15 41 22 6 - - - - - - - - - - - - 55
Linseed - - - - - - - - - - - - - - - - - - 2
Forage maize - - - - - - - - - - - - - - - - - - 1
Rootcrops for stockfeed 0 1 2 2 29 14 9 34 9 - - - - - - - - - 36
Leafy forage crops 28 0 11 35 6 19 0 0 1 - - - - - - - - - 17
Arable silage/Other fodder crops 55 14 11 19 - - - - - - - - - - - - - - 12
Peas - human consumption 100 - - - - - - - - - - - - - - - - - 6
Peas - animal consumption - - - - - - - - - - - - - - - - - - 0
Beans - animal consumption - - - - - - - - - - - - - - - - - - 0
Vegetables (brassicae) - - - - - - - - - - - - - - - - - - 0
Vegetable (other) 17 0 0 19 0 41 15 5 - - - - - - - - - - 7
Soft fruit 0 0 100 - - - - - - - - - - - - - - - 5
Top fruit - - - - - - - - - - - - - - - - - - 0
Other tillage - - - - - - - - - - - - - - - - - - 0
All tillage 7 6 13 42 25 5 1 1 - - - - - - - - - - 965
Grass under 5 years old 19 21 33 21 5 0 0 1 - - - - - - - - - - 368
Grass 5 years and over 25 30 32 10 2 0 0 1 - - - - - - - - - - 499
All grass 23 27 32 13 3 0 0 1 - - - - - - - - - - 867
All crops and grass 17 19 25 24 11 2 0 1 - - - - - - - - - - 1832
BSFP final inner 10/12/05 11:05 am Page 80

81
Source: British Survey of Fertiliser Practice 2004
kg/ha Fields inrow % 0 <25 25- 50- 75- 100- 125- 150- 175- 200- 225- 250- 275- 300- 325- 350- 375- 400+ sample
Table SC1.7 Percentage of crop area by field application rate - K2O, Scotland 2004
Spring wheat 16 9 22 0 38 0 0 15 - - - - - - - - - - 12
Winter wheat 10 9 0 14 38 23 2 0 3 - - - - - - - - - 200
Spring barley 3 5 15 37 28 8 4 - - - - - - - - - - - 397
Winter barley 2 0 1 12 66 16 1 0 2 - - - - - - - - - 102
Oats 14 9 25 13 26 13 - - - - - - - - - - - - 43
Rye/Triticale/Durum wheat - - - - - - - - - - - - - - - - - - 4
Seed potatoes 10 0 0 0 0 5 4 6 13 32 27 3 - - - - - - 20
Early potatoes - - - - - - - - - - - - - - - - - - 0
2nd Early/Maincrop potatoes 5 26 0 4 9 6 0 3 6 8 5 19 0 8 - - - - 24
Sugar beet - - - - - - - - - - - - - - - - - - 0
Spring oilseed rape 0 9 0 31 13 47 - - - - - - - - - - - - 12
Winter oilseed rape 8 10 14 30 31 6 - - - - - - - - - - - - 55
Linseed - - - - - - - - - - - - - - - - - - 2
Forage maize - - - - - - - - - - - - - - - - - - 1
Rootcrops for stockfeed 0 3 4 10 45 18 6 12 0 2 - - - - - - - - 36
Leafy forage crops 28 0 39 8 5 15 5 - - - - - - - - - - - 17
Arable silage/Other fodder crops 53 14 11 2 0 19 - - - - - - - - - - - - 12
Peas - human consumption 100 - - - - - - - - - - - - - - - - - 6
Peas - animal consumption - - - - - - - - - - - - - - - - - - 0
Beans - animal consumption - - - - - - - - - - - - - - - - - - 0
Vegetables (brassicae) - - - - - - - - - - - - - - - - - - 0
Vegetable (other) 17 0 0 57 0 0 3 8 15 - - - - - - - - - 7
Soft fruit 0 0 0 100 - - - - - - - - - - - - - - 5
Top fruit - - - - - - - - - - - - - - - - - - 0
Other tillage - - - - - - - - - - - - - - - - - - 0
All tillage 7 6 10 27 32 12 2 0 1 1 1 - - - - - - - 965
Grass under 5 years old 23 14 30 14 9 5 3 1 - - - - - - - - - - 368
Grass 5 years and over 27 28 28 9 5 1 1 - - - - - - - - - - - 499
All grass 25 24 29 10 6 2 2 - - - - - - - - - - - 867
All crops and grass 18 18 22 16 16 6 2 0 1 - - - - - - - - - 1832
BSFP final inner 10/12/05 11:05 am Page 81

82
Source: British Survey of Fertiliser Practice 2004
Grazed not mown 79 73 68 13 95 30 29 75 21 20 498
Grazed mown 93 90 92 58 143 45 60 133 40 55 239
All grazings 82 77 74 25 109 34 38 89 26 28 737
Cut for silage - grazed 93 89 91 62 148 46 62 137 41 56 194
Cut for silage - not grazed 90 85 88 46 162 52 68 145 45 60 107
All cut for silage 92 88 90 58 152 48 63 139 42 57 301
Cut for hay - grazed 99 98 98 22 103 35 41 102 34 40 50
Cut for hay - not grazed 83 83 83 29 129 46 36 107 38 30 16
All cut for hay 96 95 95 23 107 37 40 103 35 38 66
All mowings 92 88 91 55 147 47 61 135 41 55 359
All grass 82 77 75 26 113 36 41 93 27 30 867
N P2O5 K2O FYM N P2O5 K2O N P2O5 K2O
Table SC2.1 Average fertiliser practice by grassland utilisation, Scotland 2004
Crop area receiving dressing Average field rate Overall application rate Fields in(%) (kg/ha) (kg/ha) sample
BSFP final inner 10/12/05 11:05 am Page 82

83
Source: British Survey of Fertiliser Practice 2004
kg/ha Fields inrow % 0 <25 25- 50- 75- 100- 125- 150- 175- 200- 225- 250- 275- 300- 325- 350- 375- 400+ sample
Table SC2.2 Percentage of grass area by field application rate - N, Scotland 2004
Grazed not mown 21 0 12 31 8 10 7 3 2 1 1 2 0 1 - - - - 498
Grazed mown 7 0 3 10 16 9 16 9 6 11 5 3 2 0 1 - - - 239
All grazings 18 0 10 25 10 10 9 5 3 3 2 2 0 1 - - - - 737
Cut for silage - grazed 7 0 2 9 15 8 17 10 7 12 6 4 2 0 1 - - - 194
Cut for silage - not grazed 10 0 1 7 8 7 18 11 7 11 8 9 1 1 1 - - - 107
All cut for silage 8 0 2 8 13 8 17 10 7 12 7 5 2 1 1 - - - 301
Cut for hay - grazed 1 0 7 18 25 15 13 16 2 0 1 - - - - - - - 50
Cut for hay - not grazed 17 0 0 17 16 2 22 10 2 0 14 - - - - - - - 16
All cut for hay 4 0 6 18 23 13 15 15 2 0 4 - - - - - - - 66
All mowings 8 0 2 9 15 9 17 10 6 11 6 5 2 0 1 - - - 359
All grass 18 0 9 24 10 9 10 5 3 4 3 3 0 1 - - - - 867
BSFP final inner 10/12/05 11:05 am Page 83

84
Source: British Survey of Fertiliser Practice 2004
kg/ha Fields inrow % 0 <25 25- 50- 75- 100- 125- 150- 175- 200- 225- 250- 275- 300- 325- 350- 375- 400+ sample
Table SC2.3 Percentage of grass area by field application rate - P2O5, Scotland 2004
Grazed not mown 27 32 31 7 1 0 0 1 - - - - - - - - - - 498
Grazed mown 10 17 37 28 7 0 0 1 - - - - - - - - - - 239
All grazings 23 29 33 12 3 0 0 1 - - - - - - - - - - 737
Cut for silage - grazed 11 15 36 30 7 0 0 1 - - - - - - - - - - 194
Cut for silage - not grazed 15 12 33 28 11 0 0 0 0 2 - - - - - - - - 107
All cut for silage 12 14 35 29 8 0 0 1 0 1 - - - - - - - - 301
Cut for hay - grazed 2 31 50 12 2 2 - - - - - - - - - - - - 50
Cut for hay - not grazed 17 14 33 36 - - - - - - - - - - - - - - 16
All cut for hay 5 28 47 17 2 - - - - - - - - - - - - - 66
All mowings 12 16 35 28 7 0 0 1 0 1 - - - - - - - - 359
All grass 23 27 32 13 3 0 0 1 - - - - - - - - - - 867
BSFP final inner 10/12/05 11:05 am Page 84

85
Source: British Survey of Fertiliser Practice 2004
kg/ha Fields inrow % 0 <25 25- 50- 75- 100- 125- 150- 175- 200- 225- 250- 275- 300- 325- 350- 375- 400+ sample
Table SC2.4 Percentage of grass area by field application rate - K2O, Scotland 2004
Grazed not mown 32 30 30 6 1 0 1 - - - - - - - - - - - 498
Grazed mown 8 11 32 20 15 7 5 0 1 - - - - - - - - - 239
All grazings 26 25 30 10 5 2 2 - - - - - - - - - - - 737
Cut for silage - grazed 9 10 30 20 17 8 5 1 1 - - - - - - - - - 194
Cut for silage - not grazed 12 13 16 19 25 8 4 0 0 2 - - - - - - - - 107
All cut for silage 10 11 27 20 19 8 5 0 1 1 - - - - - - - - 301
Cut for hay - grazed 2 14 58 18 5 2 - - - - - - - - - - - - 50
Cut for hay - not grazed 17 26 34 18 5 - - - - - - - - - - - - - 16
All cut for hay 5 17 54 18 5 2 - - - - - - - - - - - - 66
All mowings 9 12 28 20 18 7 4 0 0 1 - - - - - - - - 359
All grass 25 24 29 10 6 2 2 - - - - - - - - - - - 867
BSFP final inner 10/12/05 11:05 am Page 85

86
Source: British Survey of Fertiliser Practice 2004
Sep Oct Nov Dec Jan Feb Mar Apr May Jun Jul Aug Total Productrow %( 000 tonnes)
Table SC3.0 Product and nutrient use by month of application, Scotland 2004
(a) Product use
Straight N 1 1 0 0 0 2 21 47 21 4 2 1 202
Straight P 6 7 0 0 0 5 16 53 14 0 0 0 2
Straight K 0 3 0 4 0 27 12 28 11 3 13 0 6
Compound 4 4 2 0 0 1 18 40 13 10 6 4 530
All Fertilisers 3 3 1 0 0 2 19 42 15 8 5 3 741
Sep Oct Nov Dec Jan Feb Mar Apr May Jun Jul Aug Total Nutrientrow %( 000 tonnes)
(b) Nutrient use
N 1 1 0 0 0 1 18 45 17 9 5 2 170
P2O5 7 6 3 0 0 2 21 36 11 6 3 4 64
K2O 6 7 3 0 0 3 20 36 11 8 4 3 72
Total 4 3 1 0 0 2 19 41 15 8 4 3 306
Note: Product use refers to the total tonnage of the products used by farmers in the survey year 2001;Nutrient use refers to the tonnage of each nutrient contained in the products used.(e.g. 100 kg of a 20 : 10 : 10 compound contains 20 kg of N, 10 kg of P2O5, and 10 kg of K2O, while 100 kg of ammonium nitrate, one of the straight N products, contains typically 34.5 kg of N).
BSFP final inner 10/12/05 11:05 am Page 86

87
column % spring winter potatoes sugar oilseed other all grass for grass for grass for grass all all cropscereal cereal beet rape tillage tillage grazing hay silage not spec grass and grass
Table SC3.1 Product type as percentage of all product used by crop group, Scotland 2004
Calcium Ammonium Nitrate 0.0 0.6 0.0 0.0 1.4 2.0 0.5 0.1 0.0 0.3 0.0 0.1 0.3
Urea 4.4 5.4 0.0 0.0 9.4 0.2 4.9 1.5 0.3 0.9 0.0 1.4 3.1
Ammonium Nitrate 19.0 42.3 1.4 0.0 46.5 7.7 29.3 12.5 14.2 9.6 17.1 12.4 20.6
Urea Ammonium Nitrate 0.3 3.6 6.1 0.0 0.4 0.0 1.9 0.0 0.0 0.1 0.0 0.0 0.9
Other Straight N 4.4 6.3 1.2 0.0 3.8 0.0 4.8 0.2 0.2 0.1 0.0 0.2 2.4
Triple Superphosphate 0.0 0.4 0.0 0.0 0.3 0.0 0.2 0.4 0.7 0.2 13.3 0.3 0.3
Single Superphosphate 0.0 0.0 0.0 0.0 0.0 0.0 0.0 0.1 0.0 0.0 0.0 0.1 0.0
Other Straight P 0.0 0.0 0.0 0.0 0.0 0.0 0.0 0.0 0.0 0.0 0.0 0.0 0.0
Muriate of Potash 0.6 1.8 1.9 0.0 0.5 0.1 1.1 0.2 0.0 0.5 0.0 0.2 0.6
Other Straight K 0.0 0.0 0.0 0.0 0.0 2.1 0.1 0.2 0.0 0.4 0.0 0.2 0.1
NP 0.7 0.8 3.1 0.0 2.6 1.1 1.1 4.7 5.2 3.4 0.0 4.1 2.7
NK 0.7 3.2 0.0 0.0 1.3 0.8 1.7 1.9 0.7 3.6 0.0 1.9 1.8
PK 3.9 14.4 0.0 0.0 3.1 10.1 7.9 4.0 2.0 3.1 0.0 4.0 5.8
Very High N 2.2 1.7 0.0 0.0 0.0 0.7 1.7 43.5 30.0 36.0 0.0 42.6 22.9
High N 12.9 1.5 0.0 0.0 3.1 6.8 6.7 25.0 36.2 35.8 34.3 27.0 17.2
High P 1.3 1.5 1.4 0.0 0.0 29.6 2.1 0.0 0.0 0.0 0.0 0.0 1.0
High K 13.0 2.2 44.8 0.0 0.8 13.3 9.3 0.6 0.5 1.2 0.0 0.6 4.8
Low N 12.8 13.0 38.9 0.0 16.5 12.0 14.5 1.1 1.9 1.2 0.0 1.1 7.5
Low P 3.7 0.0 0.0 0.0 0.0 2.9 1.7 1.7 3.7 2.8 0.0 1.7 1.7
Equal NPK 19.9 1.3 1.2 0.0 10.0 10.7 10.5 2.2 4.4 1.0 35.2 2.1 6.1
Total Product (’000 tonnes) 156 138 18 0 33 11 357 337 14 164 1 384 741
Source: British Survey of Fertiliser Practice 2004
BSFP final inner 10/12/05 11:05 am Page 87

88
Table SC3.2 Use of product type by crop group, Scotland 2004
Source: British Survey of Fertiliser Practice 2004
row % spring winter potatoes sugar oilseed other all grass for grass for grass for grass all total productcereal cereal beet rape tillage tillage grazing hay silage not spec grass ( 000 tonnes)
Calcium Ammonium Nitrate 3.6 41.2 0.0 0.0 22.9 10.2 78.0 22.0 0.0 22.0 0.0 22.0 2
Urea 30.0 32.9 0.0 0.0 13.7 0.1 76.7 22.9 0.2 6.1 0.0 23.3 23
Ammonium Nitrate 19.5 38.3 0.2 0.0 10.2 0.5 68.6 27.6 1.3 10.3 0.1 31.4 152
Urea Ammonium Nitrate 7.6 72.6 16.2 0.0 1.9 0.0 98.5 0.0 0.0 1.5 0.0 1.5 7
Other Straight N 38.2 48.5 1.2 0.0 8.0 0.0 95.9 3.0 0.2 0.9 0.0 4.1 18
Triple Superphosphate 0.0 29.1 0.0 0.0 5.3 0.0 34.4 61.4 5.1 13.7 4.2 65.6 2
Single Superphosphate 0.0 0.0 0.0 0.0 0.0 0.0 0.0 100.0 0.0 0.0 0.0 100.0 0
Other Straight P 0.0 0.0 0.0 0.0 0.0 0.0 0.0 0.0 0.0 0.0 0.0 0.0 0
Muriate of Potash 19.2 52.2 7.2 0.0 3.4 0.1 82.1 17.1 0.0 17.1 0.0 17.9 5
Other Straight K 0.0 0.0 0.0 0.0 0.0 25.0 25.0 75.0 0.0 75.0 0.0 75.0 1
NP 5.9 5.5 2.9 0.0 4.4 0.6 19.3 80.7 3.8 28.1 0.0 80.7 20
NK 8.3 33.2 0.0 0.0 3.4 0.7 45.6 47.2 0.7 44.7 0.0 54.4 13
PK 14.0 46.0 0.0 0.0 2.4 2.5 64.9 31.4 0.7 11.7 0.0 35.1 43
Very High N 2.1 1.4 0.0 0.0 0.0 0.0 3.5 86.5 2.5 34.8 0.0 96.5 170
High N 15.7 1.6 0.0 0.0 0.8 0.6 18.7 66.2 4.0 45.9 0.2 81.3 128
High P 27.0 26.5 3.4 0.0 0.0 41.4 98.4 1.6 0.0 0.0 0.0 1.6 8
High K 57.3 8.5 23.2 0.0 0.8 4.0 93.7 6.1 0.2 5.7 0.0 6.3 35
Low N 35.6 32.1 12.8 0.0 9.9 2.3 92.8 6.8 0.5 3.5 0.0 7.2 56
Low P 45.0 0.0 0.0 0.0 0.0 2.4 47.4 45.1 4.1 35.6 0.0 52.6 13
Equal NPK 68.2 3.9 0.5 0.0 7.3 2.5 82.4 16.1 1.4 3.4 0.5 17.6 45
All Fertilisers 21.1 18.7 2.5 0.0 4.6 1.5 48.4 45.3 1.9 22.0 0.1 51.6 741
BSFP final inner 10/12/05 11:05 am Page 88

89
total Productrow % Jan Feb Mar Apr May Jun Jul Aug Sep Oct Nov Dec( 000 tonnes)
Table SC3.3 Product use by month of application, Scotland 2004
Calcium Ammonium Nitrate 0.0 19.9 12.8 21.1 24.2 0.0 22.0 0.0 0.0 0.0 0.0 0.0 2
Urea 0.0 2.6 18.4 35.2 34.0 2.0 5.5 1.3 0.0 1.0 0.0 0.0 23
Ammonium Nitrate 0.0 1.6 21.3 47.3 19.9 5.1 2.2 0.8 1.2 0.6 0.0 0.0 152
Urea Ammonium Nitrate 0.0 1.7 9.4 85.6 2.5 0.8 0.0 0.0 0.0 0.0 0.0 0.0 7
Other Straight N 0.0 4.8 31.3 45.1 18.2 0.6 0.0 0.0 0.0 0.0 0.0 0.0 18
Triple Superphosphate 0.0 5.3 18.0 58.9 4.2 0.0 0.0 0.0 6.2 7.4 0.0 0.0 2
Single Superphosphate 0.0 0.0 0.0 0.0 100.0 0.0 0.0 0.0 0.0 0.0 0.0 0.0 0
Other Straight P 0.0 0.0 0.0 0.0 0.0 0.0 0.0 0.0 0.0 0.0 0.0 0.0 0
Muriate of Potash 0.3 31.6 14.0 33.5 12.7 3.1 0.8 0.0 0.0 3.9 0.0 0.0 5
Other Straight K 0.0 0.0 0.0 0.0 0.0 0.0 75.0 0.0 0.0 0.0 0.0 25.0 1
NP 0.0 3.6 41.5 37.3 4.4 7.4 0.0 2.9 1.9 1.0 0.0 0.0 20
NK 0.0 6.6 25.8 17.3 16.1 24.6 9.4 0.0 0.1 0.0 0.0 0.0 13
PK 0.3 3.3 18.6 4.3 4.3 1.3 1.6 3.7 13.1 30.8 18.6 0.0 43
Very High N 0.0 0.2 9.6 40.8 16.1 14.7 12.5 5.4 0.7 0.0 0.0 0.0 170
High N 0.0 0.0 13.1 55.0 15.0 11.0 4.9 0.7 0.3 0.0 0.0 0.0 128
High P 0.0 0.0 28.0 13.0 32.5 0.0 0.0 0.0 26.2 0.3 0.0 0.0 8
High K 0.0 3.0 22.9 58.5 10.9 0.3 0.0 0.0 0.8 3.6 0.0 0.0 35
Low N 0.1 3.3 26.0 33.5 7.1 0.0 0.9 7.8 14.2 6.1 1.0 0.0 56
Low P 0.0 0.0 15.1 16.8 41.1 25.2 0.0 1.8 0.0 0.0 0.0 0.0 13
Equal NPK 0.0 0.3 31.9 43.8 6.1 8.0 0.2 3.7 3.1 2.8 0.0 0.0 45
All Fertilisers 0.0 1.7 18.6 42.2 15.1 8.0 4.8 2.7 2.8 2.8 1.2 0.0 741
Source: British Survey of Fertiliser Practice 2004
BSFP final inner 10/12/05 11:05 am Page 89
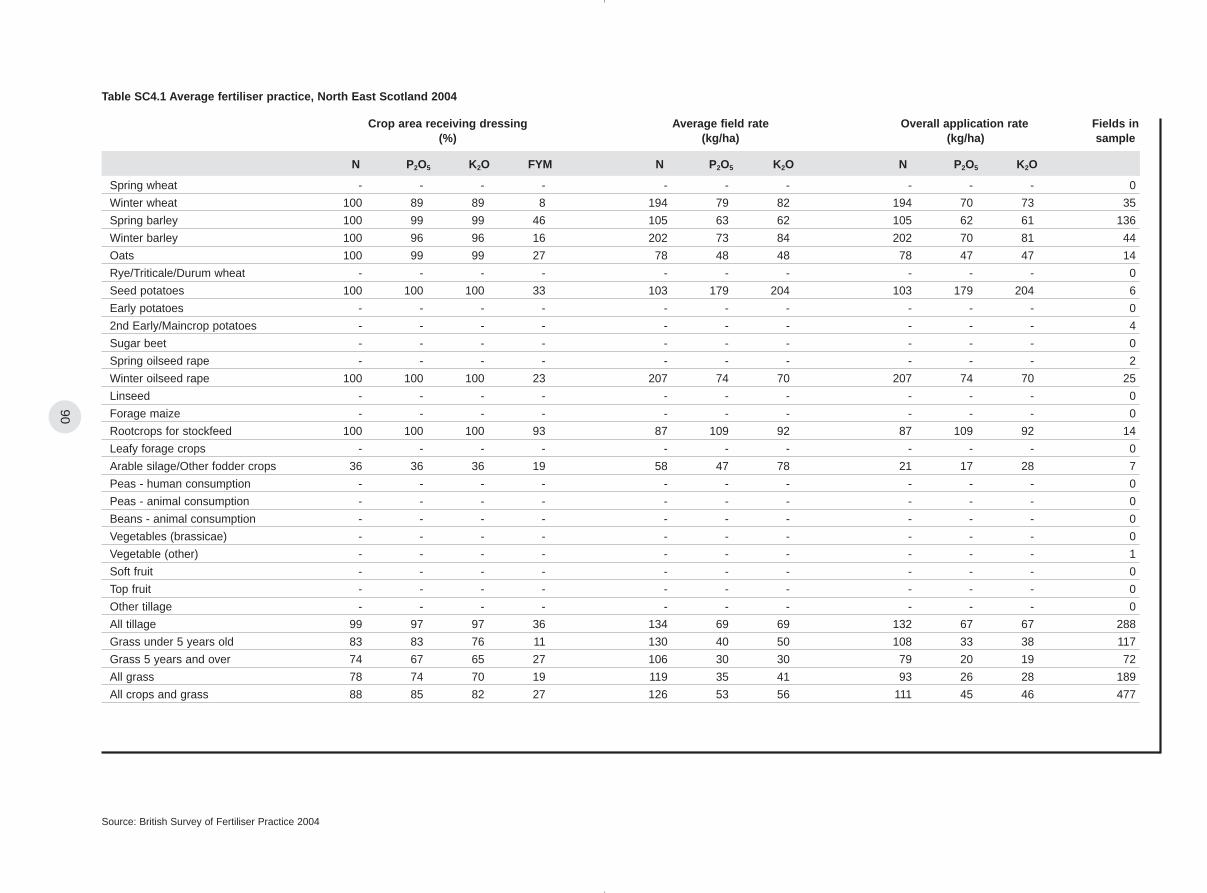
90
Source: British Survey of Fertiliser Practice 2004
N P2O5 K2O FYM N P2O5 K2O N P2O5 K2O
Table SC4.1 Average fertiliser practice, North East Scotland 2004
Crop area receiving dressing Average field rate Overall application rate Fields in(%) (kg/ha) (kg/ha) sample
Spring wheat - - - - - - - - - - 0
Winter wheat 100 89 89 8 194 79 82 194 70 73 35
Spring barley 100 99 99 46 105 63 62 105 62 61 136
Winter barley 100 96 96 16 202 73 84 202 70 81 44
Oats 100 99 99 27 78 48 48 78 47 47 14
Rye/Triticale/Durum wheat - - - - - - - - - - 0
Seed potatoes 100 100 100 33 103 179 204 103 179 204 6
Early potatoes - - - - - - - - - - 0
2nd Early/Maincrop potatoes - - - - - - - - - - 4
Sugar beet - - - - - - - - - - 0
Spring oilseed rape - - - - - - - - - - 2
Winter oilseed rape 100 100 100 23 207 74 70 207 74 70 25
Linseed - - - - - - - - - - 0
Forage maize - - - - - - - - - - 0
Rootcrops for stockfeed 100 100 100 93 87 109 92 87 109 92 14
Leafy forage crops - - - - - - - - - - 0
Arable silage/Other fodder crops 36 36 36 19 58 47 78 21 17 28 7
Peas - human consumption - - - - - - - - - - 0
Peas - animal consumption - - - - - - - - - - 0
Beans - animal consumption - - - - - - - - - - 0
Vegetables (brassicae) - - - - - - - - - - 0
Vegetable (other) - - - - - - - - - - 1
Soft fruit - - - - - - - - - - 0
Top fruit - - - - - - - - - - 0
Other tillage - - - - - - - - - - 0
All tillage 99 97 97 36 134 69 69 132 67 67 288
Grass under 5 years old 83 83 76 11 130 40 50 108 33 38 117
Grass 5 years and over 74 67 65 27 106 30 30 79 20 19 72
All grass 78 74 70 19 119 35 41 93 26 28 189
All crops and grass 88 85 82 27 126 53 56 111 45 46 477
BSFP final inner 10/12/05 11:05 am Page 90

91
Source: British Survey of Fertiliser Practice 2004
N P2O5 K2O FYM N P2O5 K2O N P2O5 K2O
Table SC4.2 Average fertiliser practice, South East Scotland 2004
Crop area receiving dressing Average field rate Overall application rate Fields in(%) (kg/ha) (kg/ha) sample
Spring wheat 100 81 81 3 142 57 77 142 46 62 10
Winter wheat 94 90 89 15 205 68 86 192 61 77 156
Spring barley 100 94 95 8 107 56 74 106 53 70 204
Winter barley 100 99 99 5 179 77 94 179 76 93 51
Oats 76 81 81 18 117 59 76 88 47 61 27
Rye/Triticale/Durum wheat - - - - - - - - - - 1
Seed potatoes 86 86 86 22 130 173 204 111 148 175 14
Early potatoes - - - - - - - - - - 0
2nd Early/Maincrop potatoes 100 99 99 13 111 101 149 111 100 147 19
Sugar beet - - - - - - - - - - 0
Spring oilseed rape 100 100 100 0 139 54 70 139 54 70 6
Winter oilseed rape 100 87 86 1 220 56 59 220 49 50 28
Linseed - - - - - - - - - - 2
Forage maize - - - - - - - - - - 0
Rootcrops for stockfeed 100 100 100 74 72 127 93 72 127 93 16
Leafy forage crops 48 68 68 48 90 73 71 43 50 48 14
Arable silage/Other fodder crops 60 56 60 0 87 40 54 53 22 33 5
Peas - human consumption 0 0 0 0 0 0 0 0 0 0 6
Peas - animal consumption - - - - - - - - - - 3
Beans - animal consumption - - - - - - - - - - 3
Vegetables (brassicae) - - - - - - - - - - 4
Vegetable (other) 44 71 71 0 106 116 127 46 83 91 6
Soft fruit 100 100 100 27 31 38 54 31 38 54 5
Top fruit - - - - - - - - - - 0
Other tillage - - - - - - - - - - 0
All tillage 94 90 90 11 148 65 82 139 58 74 580
Grass under 5 years old 88 72 66 14 105 38 50 93 27 33 153
Grass 5 years and over 71 63 55 6 87 34 34 61 21 18 211
All grass 78 67 60 9 95 36 41 74 24 24 364
All crops and grass 87 80 78 10 128 55 69 112 44 53 944
BSFP final inner 10/12/05 11:05 am Page 91

92
Source: British Survey of Fertiliser Practice 2004
N P2O5 K2O FYM N P2O5 K2O N P2O5 K2O
Table SC4.3 Average fertiliser practice, South West Scotland 2004
Crop area receiving dressing Average field rate Overall application rate Fields in(%) (kg/ha) (kg/ha) sample
Spring wheat - - - - - - - - - - 2
Winter wheat 100 100 100 45 183 77 103 183 77 103 8
Spring barley 95 97 97 68 81 57 57 77 55 55 43
Winter barley 100 100 100 25 129 91 100 129 91 100 7
Oats - - - - - - - - - - 3
Rye/Triticale/Durum wheat - - - - - - - - - - 0
Seed potatoes - - - - - - - - - - 0
Early potatoes - - - - - - - - - - 0
2nd Early/Maincrop potatoes - - - - - - - - - - 0
Sugar beet - - - - - - - - - - 0
Spring oilseed rape - - - - - - - - - - 3
Winter oilseed rape - - - - - - - - - - 1
Linseed - - - - - - - - - - 0
Forage maize - - - - - - - - - - 1
Rootcrops for stockfeed - - - - - - - - - - 4
Leafy forage crops - - - - - - - - - - 3
Arable silage/Other fodder crops - - - - - - - - - - 0
Peas - human consumption - - - - - - - - - - 0
Peas - animal consumption - - - - - - - - - - 0
Beans - animal consumption - - - - - - - - - - 0
Vegetables (brassicae) - - - - - - - - - - 0
Vegetable (other) - - - - - - - - - - 0
Soft fruit - - - - - - - - - - 0
Top fruit - - - - - - - - - - 0
Other tillage - - - - - - - - - - 0
All tillage 94 98 98 59 113 65 71 106 64 69 75
Grass under 5 years old 96 97 100 69 150 46 60 143 45 60 77
Grass 5 years and over 86 84 85 34 117 34 38 100 29 32 200
All grass 87 86 87 38 121 36 41 105 31 35 277
All crops and grass 87 87 88 40 120 38 43 105 33 38 352
BSFP final inner 10/12/05 11:05 am Page 92

93
Source: British Survey of Fertiliser Practice 2004
N P2O5 K2O FYM N P2O5 K2O N P2O5 K2O
Table SC5.1 Average fertiliser practice on general cropping farms, Scotland 2004
Crop area receiving dressing Average field rate Overall application rate Fields in(%) (kg/ha) (kg/ha) sample
Spring wheat 100 80 80 0 143 59 78 143 47 62 8
Winter wheat 95 90 89 12 207 69 85 196 62 76 149
Spring barley 100 98 99 20 112 62 73 112 61 72 210
Winter barley 100 97 97 4 204 81 92 204 79 90 62
Oats 77 81 81 17 120 62 78 92 50 63 24
Rye/Triticale/Durum wheat - - - - - - - - - - 2
Seed potatoes 90 90 90 26 120 173 207 108 155 186 18
Early potatoes - - - - - - - - - - 0
2nd Early/Maincrop potatoes 94 94 94 7 151 137 170 142 128 159 22
Sugar beet - - - - - - - - - - 0
Spring oilseed rape 100 100 100 0 180 77 82 180 77 82 11
Winter oilseed rape 100 92 92 4 219 64 65 219 59 60 43
Linseed - - - - - - - - - - 0
Forage maize - - - - - - - - - - 0
Rootcrops for stockfeed 100 100 100 77 95 136 119 95 136 119 8
Leafy forage crops 22 100 100 87 117 66 65 26 66 65 5
Arable silage/Other fodder crops - - - - - - - - - - 4
Peas - human consumption 0 0 0 0 0 0 0 0 0 0 6
Peas - animal consumption - - - - - - - - - - 1
Beans - animal consumption - - - - - - - - - - 2
Vegetables (brassicae) - - - - - - - - - - 4
Vegetable (other) 65 82 82 0 72 101 85 47 83 70 5
Soft fruit 100 100 100 27 31 38 54 31 38 54 5
Top fruit - - - - - - - - - - 0
Other tillage - - - - - - - - - - 0
All tillage 96 93 94 15 154 70 82 147 65 77 589
Grass under 5 years old 73 59 60 3 111 37 47 80 22 28 79
Grass 5 years and over 62 49 48 2 117 31 36 72 15 17 83
All grass 67 54 54 2 113 34 42 76 18 23 162
All crops and grass 90 86 86 12 148 65 77 133 56 66 751
BSFP final inner 10/12/05 11:05 am Page 93

94
Source: British Survey of Fertiliser Practice 2004
N P2O5 K2O FYM N P2O5 K2O N P2O5 K2O
Table SC5.2 Average fertiliser practice on dairy farms, Scotland 2004
Crop area receiving dressing Average field rate Overall application rate Fields in(%) (kg/ha) (kg/ha) sample
Spring wheat - - - - - - - - - - 1
Winter wheat 100 100 91 89 185 78 100 185 78 91 7
Spring barley 91 97 97 77 70 57 63 63 55 61 14
Winter barley - - - - - - - - - - 1
Oats - - - - - - - - - - 1
Rye/Triticale/Durum wheat - - - - - - - - - - 1
Seed potatoes - - - - - - - - - - 0
Early potatoes - - - - - - - - - - 0
2nd Early/Maincrop potatoes - - - - - - - - - - 0
Sugar beet - - - - - - - - - - 0
Spring oilseed rape - - - - - - - - - - 0
Winter oilseed rape - - - - - - - - - - 0
Linseed - - - - - - - - - - 0
Forage maize - - - - - - - - - - 1
Rootcrops for stockfeed - - - - - - - - - - 1
Leafy forage crops - - - - - - - - - - 0
Arable silage/Other fodder crops - - - - - - - - - - 0
Peas - human consumption - - - - - - - - - - 0
Peas - animal consumption - - - - - - - - - - 0
Beans - animal consumption - - - - - - - - - - 0
Vegetables (brassicae) - - - - - - - - - - 0
Vegetable (other) - - - - - - - - - - 0
Soft fruit - - - - - - - - - - 0
Top fruit - - - - - - - - - - 0
Other tillage - - - - - - - - - - 0
All tillage 94 98 95 84 111 64 74 105 63 70 27
Grass under 5 years old 100 93 98 78 150 55 75 150 51 74 34
Grass 5 years and over 98 92 95 49 171 42 48 167 39 46 65
All grass 98 92 96 56 165 46 55 163 42 53 99
All crops and grass 98 93 96 59 161 47 57 158 44 55 126
BSFP final inner 10/12/05 11:05 am Page 94

95
Source: British Survey of Fertiliser Practice 2004
N P2O5 K2O FYM N P2O5 K2O N P2O5 K2O
Table SC5.3 Average fertiliser practice on mixed farms, Scotland 2004
Crop area receiving dressing Average field rate Overall application rate Fields in(%) (kg/ha) (kg/ha) sample
Spring wheat - - - - - - - - - - 2
Winter wheat 100 86 97 12 148 82 93 148 71 90 43
Spring barley 100 90 90 42 91 57 60 91 51 54 89
Winter barley 100 98 98 24 159 63 82 159 62 81 34
Oats 100 97 97 21 57 30 30 57 29 29 12
Rye/Triticale/Durum wheat - - - - - - - - - - 0
Seed potatoes - - - - - - - - - - 2
Early potatoes - - - - - - - - - - 0
2nd Early/Maincrop potatoes - - - - - - - - - - 2
Sugar beet - - - - - - - - - - 0
Spring oilseed rape - - - - - - - - - - 1
Winter oilseed rape 100 92 84 53 197 60 40 197 56 33 12
Linseed - - - - - - - - - - 2
Forage maize - - - - - - - - - - 0
Rootcrops for stockfeed 100 100 100 84 74 115 97 74 115 97 13
Leafy forage crops - - - - - - - - - - 3
Arable silage/Other fodder crops - - - - - - - - - - 3
Peas - human consumption - - - - - - - - - - 0
Peas - animal consumption - - - - - - - - - - 2
Beans - animal consumption - - - - - - - - - - 1
Vegetables (brassicae) - - - - - - - - - - 0
Vegetable (other) - - - - - - - - - - 2
Soft fruit - - - - - - - - - - 0
Top fruit - - - - - - - - - - 0
Other tillage - - - - - - - - - - 0
All tillage 99 91 92 36 110 62 68 109 57 63 223
Grass under 5 years old 92 86 79 13 112 37 47 103 32 37 101
Grass 5 years and over 80 71 64 20 89 25 31 71 18 20 75
All grass 86 78 71 16 101 32 39 87 25 28 176
All crops and grass 90 83 79 24 105 44 52 95 36 41 399
BSFP final inner 10/12/05 11:05 am Page 95

96
Source: British Survey of Fertiliser Practice 2004
N P2O5 K2O FYM N P2O5 K2O N P2O5 K2O
Table SC5.4 Average fertilser practice on farms in Less Favoured Areas, Scotland 2004
Crop area receiving dressing Average field rate Overall application rate Fields in(%) (kg/ha) (kg/ha) sample
Spring wheat - - - - - - - - - - 1
Winter wheat - - - - - - - - - - 1
Spring barley 99 99 99 62 87 51 56 86 51 55 84
Winter barley 100 100 100 94 127 77 77 127 77 77 5
Oats 100 100 100 36 67 48 55 67 48 55 6
Rye/Triticale/Durum wheat - - - - - - - - - - 1
Seed potatoes - - - - - - - - - - 0
Early potatoes - - - - - - - - - - 0
2nd Early/Maincrop potatoes - - - - - - - - - - 0
Sugar beet - - - - - - - - - - 0
Spring oilseed rape - - - - - - - - - - 0
Winter oilseed rape - - - - - - - - - - 0
Linseed - - - - - - - - - - 0
Forage maize - - - - - - - - - - 0
Rootcrops for stockfeed 100 100 100 77 86 128 90 86 128 90 14
Leafy forage crops 62 62 62 41 75 75 71 46 47 44 9
Arable silage/Other fodder crops 26 26 26 26 40 40 40 10 10 10 5
Peas - human consumption - - - - - - - - - - 0
Peas - animal consumption - - - - - - - - - - 0
Beans - animal consumption - - - - - - - - - - 0
Vegetables (brassicae) - - - - - - - - - - 0
Vegetable (other) - - - - - - - - - - 0
Soft fruit - - - - - - - - - - 0
Top fruit - - - - - - - - - - 0
Other tillage - - - - - - - - - - 0
All tillage 94 96 96 60 86 57 59 81 55 56 126
Grass under 5 years old 90 83 77 27 119 40 50 108 33 38 154
Grass 5 years and over 77 75 73 24 94 32 32 72 24 24 276
All grass 80 77 74 25 100 34 36 80 26 27 430
All crops and grass 81 79 76 28 99 36 39 80 29 29 556
BSFP final inner 10/12/05 11:05 am Page 96
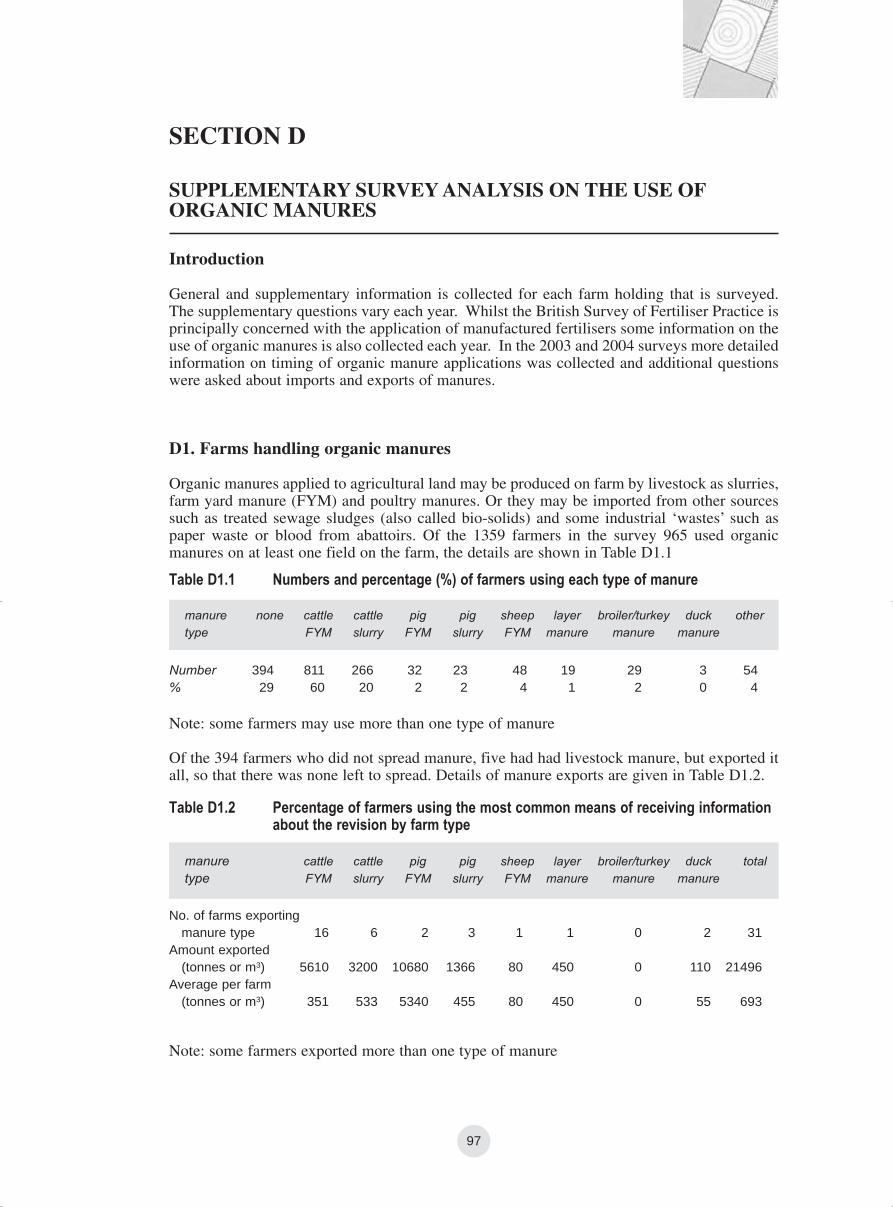
97
SECTION D
SUPPLEMENTARY SURVEY ANALYSIS ON THE USE OFORGANIC MANURES
Introduction
General and supplementary information is collected for each farm holding that is surveyed.The supplementary questions vary each year. Whilst the British Survey of Fertiliser Practice isprincipally concerned with the application of manufactured fertilisers some information on theuse of organic manures is also collected each year. In the 2003 and 2004 surveys more detailedinformation on timing of organic manure applications was collected and additional questionswere asked about imports and exports of manures.
D1. Farms handling organic manures
Organic manures applied to agricultural land may be produced on farm by livestock as slurries,farm yard manure (FYM) and poultry manures. Or they may be imported from other sourcessuch as treated sewage sludges (also called bio-solids) and some industrial ‘wastes’ such aspaper waste or blood from abattoirs. Of the 1359 farmers in the survey 965 used organicmanures on at least one field on the farm, the details are shown in Table D1.1
Note: some farmers may use more than one type of manure
Of the 394 farmers who did not spread manure, five had had livestock manure, but exported itall, so that there was none left to spread. Details of manure exports are given in Table D1.2.
Note: some farmers exported more than one type of manure
Table D1.1 Numbers and percentage (%) of farmers using each type of manure
Number 394 811 266 32 23 48 19 29 3 54% 29 60 20 2 2 4 1 2 0 4
manure none cattle cattle pig pig sheep layer broiler/turkey duck other
type FYM slurry FYM slurry FYM manure manure manure
Table D1.2 Percentage of farmers using the most common means of receiving informationabout the revision by farm type
No. of farms exporting manure type 16 6 2 3 1 1 0 2 31
Amount exported (tonnes or m3) 5610 3200 10680 1366 80 450 0 110 21496
Average per farm (tonnes or m3) 351 533 5340 455 80 450 0 55 693
manure cattle cattle pig pig sheep layer broiler/turkey duck total
type FYM slurry FYM slurry FYM manure manure manure
BSFP final inner 10/12/05 11:05 am Page 97

98
This indicates that only 29 (2%) of the farmers surveyed exported manures and that cattle FYMis exported most often, although the amount exported is greatest for pig FYM where two farmsexport a large amount.
Of the 965 farmers who used manure, 115 had imported some/all of it; the details are given inTable D1.3.
Note: some farmers imported more than one type of manure.
The amount of imported non-farm manures was more than double that in 2003, mainly due toincreases in digested cake and lime stabilised sewage sludges. Cattle FYM and poultry manurecontinued to be the farm produced manures most likely to be imported.
For liquid organic manure applications during the current season the most common method ofapplication is broadcasting (Table D1.4). Looking specifically at cattle and pig slurryapplications bandspreading is more likely to be used for pig slurry than cattle slurry (TableD1.5) whilst rain guns are most often used when both types of slurry are spread on the samefarm.
Table D1.3a Number of farmers importing farm manures (solids and liquids), showing quantity imported
No. of farms importing manure type 17 8 6 2 1 0 7 24 65
Amount imported (tonnes or m3) 6710 2850 7314 841 120 0 4240 7315 29390
Average per farm (tonnes or m3) 395 356 1219 421 120 0 606 305 452
manure cattle pig cattle pig sheep duck layer broiler/turkey total
type FYM FYM slurry slurry manure manure manure manure
Table D1.3b Number of farmers importing non-farm manures (solids and liquids), showing quantity imported
No. of farms importing manure type 2 23 5 10 2 10 50
Amount imported (tonnes or m3) 1488 21742 3560 12668 3000 11812 52782
Average per farm (tonnes or m3) 744 945 712 1267 1500 1181 1056
sewage sludge composted
manure digested digested thermally lime green other total
type liquid cake dried stabilised manure
BSFP final inner 10/12/05 11:05 am Page 98

99
Assessment of how often organic manures are incorporated into the soil is complicated by thefact that some farmers make more than one application or apply more than one type of manureand may incorporate each of these differently. Table D1.6 shows the best estimate ofincorporation using information for the current season recorded. Details about how quicklymanures were incorporated (Table D1.7) shows that over 50% of poultry manure isincorporated within 24 hours, whilst only 20% of FYM and 25% of slurry is incorporated thisquickly.
Table D1.4 Number and percentage (%) of farms using each type of application method where any slurry was applied, by country and robust type
14.6 21.1 53.2 21.6
England & Wales
1 Cereals 21 76.2 17.6 1.0 0.0 5.2 0.02 General cropping 8 100.0 0.0 0.0 0.0 0.0 0.04 Pigs and poultry 3 34.0 3.3 25.0 0.0 32.7 5.05 Dairy 138 91.0 3.6 2.3 0.7 1.9 0.66 Cattle and sheep 78 94.7 3.7 0.0 0.0 1.3 0.37 Sheep and cattle (lowland) 41 84.6 6.1 0.0 1.5 2.4 5.48 Mixed 30 82.8 8.8 3.3 0.0 0.0 5.0
Scotland
1 Cereals 2 100.0 0.0 0.0 0.0 0.0 0.02 General cropping 3 100.0 0.0 0.0 0.0 0.0 0.05 Dairy 14 96.4 2.1 0.0 0.0 0.0 1.46 Cattle and sheep 28 93.8 6.3 0.0 0.0 0.0 0.07 Sheep and cattle (lowland) 3 100.0 0.0 0.0 0.0 0.0 0.08 Mixed 6 100.0 0.0 0.0 0.0 0.0 0.0
robust number of broadcast band shallow deep rain gun rotating
type farms spread injection injection bloom
Table D1.5 Number and percentage (%) of farms using each type of application method,by slurry type
14.6 21.1 53.2 21.6
Cattle slurry 236 92.6 2.7 0.9 0.4 1.5 1.9Pig slurry 14 80.0 12.9 5.4 0.0 0.7 1.1Both 9 80.2 8.9 0.0 0.0 10.9 0.0Total 250 91.9 3.2 1.2 0.4 1.5 1.9
slurry number of broadcast band shallow deep rain gun rotating
type farms spread injection injection bloom
Table D1.6 Degree of incorporation of organic manures/slurries applied in current season
FYM 59 84Poultry manure 72 77Slurry 60 36Total 59 72
manure % of farms % of all applied
type incorporating manure/slurry manure/slurry being incorporated
BSFP final inner 10/12/05 11:05 am Page 99

100
Farmers were asked to indicate what proportion of their livestock manures had been spread bya contractor. On farms that had used a contractor, 84% of the poultry manure was spread in thisway, this represents 37% of the poultry manure spread in the current season (Table D1.8). FYMand slurry were less likely to be spread by a contractor.
Table D1.7 Frequency of incorporation time by manure/slurry type
FYM 13 87 274 124 498Poultry manure 2 11 9 2 24Slurry 6 19 45 30 100
number of farms
incorporation time
</= 6 hours 6-24 hours 1 day - 1 week > 1 week total
Table D1.8 Use of contractors to spread manure/slurry in current season
FYM 75 22Poultry manure 84 37Slurry 51 17
manure % of slurry/manure type sread by % of total slurry/manure type
type contractors where contractors are used spread by contractors
D2. Use of organic manures
At a field level farmers were asked about how often fields received organic manures. Of the10315 fields belonging to farms who used manures, 3240 fields (31%) never received manure,for those that had received manure in the past, the average frequency of application is shownin Table D2.1.
Table D2.1 Average number of years between organic manure applications
% of fields 16 6 6 7 6 3 19 31 5
1 year 2 years 3 years 4 years 5 years 6 years >6 years never don’t know
For the 3883 fields that received organic manures in the 2003/04 season, data were collectedon what type was applied. The proportion of fields receiving each of the main types of manureis shown in Table D2.2.
Table D2.2 Percentage of fields receiving each organic manure type
% of fields 59 28 2 3 2 1 1 2 3
manure cattle cattle pig pig sheep layer duck broiler/turkey other
type FYM slurry FYM slurry FYM manure manure manure
Note: some fields may receive more than one type of manure.
The rate of application of manure was described as low, medium or high using the guidelinesin Table D2.3. and the results are shown in Table D2.4
BSFP final inner 10/12/05 11:05 am Page 100

101
Over all manure types over 40% of applications were described as low and nearly 50% asmedium. Of the individual manure types pig FYM and broiler/turkey manure were most likelyto be applied at high rates (18%).
The time of year when manure was applied is shown in Figure D2.1. Excluding cattle manuresmost fields (56%) received manures in the autumn. This is in direct contrast to the 2002/03season when in general spring applications were as frequent as those made in the autumn. Thismay reflect the drier weather during October in 2003 compared with 2002. For cattle slurrymore applications were made in the winter and spring than the autumn, whilst for cattle FYMapplications were similar in autumn, winter and spring.
Table D2.3 Typical rates of manure application
manure:pig t/ha <15 15-30 >30cattle/sheep t/ha <15 15-30 >30poultry layer t/ha <6 6-11 >11broiler/turkey litter t/ha <4 4-7 >7
slurry:pig m3/ha <25 25-45 >45dairy/beef/sheep m3/ha <35 35-65 >65
sewage sludge:liquid digested m3/ha <55 55-100 >100cake digested t/ha <15 15-25 >25thermally dried t/ha <4 4-7 >7lime-stabilised t/ha <15 15-25 >25
other:strainer box m3/ha <70 70-135 >135weeping wall m3/ha <55 55-100 >100dirty water m3/ha <440 440-800 >800
manure units typical application rates
type low medium high
Table D2.4 Number of fields receiving low, medium or high rates of each organic manure type
MManure
Low 832 541 23 73 48 26 0 18 52 1613Medium 1137 465 33 42 20 10 109 32 52 1900High 246 60 12 16 7 1 3 11 14 370
Total 2215 1066 68 131 75 37 112 61 118 3883
manure cattle cattle pig pig sheep layer duck broiler/turkey other total
type FYM slurry FYM slurry manure manure manure manure
BSFP final inner 10/12/05 11:05 am Page 101

102
D3. Fertiliser value of organic manures
Organic manures are valuable sources of the major plant nutrients (nitrogen, phosphorus andpotassium) and where used applications of manufactured fertiliser can be reduced16. In theSurvey farmers were not asked directly whether they had made an adjustment to fertiliserinputs because of manure use, however an indication of possible adjustments has been derivedby comparing fields that received manure with those which did not. Table D3.1 shows theoverall fertiliser rates for the main tillage crops in Great Britain with and without manureinputs. (Organic farms, which use no mineral fertilisers, have been excluded from the TableD3.1 and D3.2.)
Figure D2.1 Percentage of fields receiving each organic manure type by season
0% 10% 20% 30% 40% 50% 60% 70% 80% 90% 100%
Other
Poultry manure
Sheep FYM
Pig Slurry
Pig FYM
Cattle Slurry
Cattle FYM
Autumn Winter Spring Summer
Table D3.1 Overall field rate of fertiliser application to tillage crops in Great Britain, with and without applications of organic manure
Winter wheat 191 199 30 40 49 48Spring barley 93 109 46 44 53 59Winter barley 133 147 50 45 65 622nd early or maincrop potatoes 172 149 125 128 243 188Sugar beet 98 95 22 41 94 108Spring oilseed rape 140 135 10 46 9 47Winter oilseed rape 177 215 23 41 34 48Field peas (harvested dry) 7 2 22 18 36 28Field beans (harvested dry) 0 4 10 25 31 32Forage maize 46 93 39 56 42 72
nitrogen phosphate potash
with no with no with no
manure manure manure manure manure manure
16Anon (2000). Fertiliser Recommendations for Agricultural and Horticultural Crops. MAFF ReferenceBook 209 (Seventh edition). London: The Stationery Office.
BSFP final inner 10/12/05 11:05 am Page 102

103
The application of organic manures had an effect on whether fields received phosphate orpotash fertiliser, the dressing covers reducing by about 25% (phosphate) and 10% (potash) forbeans, sugar beet and oilseed rape (winter and spring sown). There was little impact on dressingcover for nitrogen.
In terms of overall application rate there was a reduction in fertiliser applications wheremanures were used for over half the crops. The largest nitrogen reduction occurred with foragemaize (this was also the only crop where the number of fields receiving organic manures wasgreater than the number without) followed by winter oilseed rape. Nitrogen use on cereals wasalso lower, but for potatoes and sugar beet it was higher where manures were used. The largestreduction in phosphate and potash use occurred with spring oilseed rape. For potash there wasalso a large reduction for forage maize. The results for arable crops are similar to those for theperiod 1994-1996 as reported by Chalmers (2001).
16Chalmers A G (2001) A Review of fertiliser, lime and organic manure use on farm crops in Great Britain from1983 to 1997. Soil Use and Management 17, 254-262.
Table D3.2 Average field rate of fertiliser application on grassland in England & Wales and in Scotland, with and without applications of organic manure
England & WalesDairyGrass less than five years old 177 218 31 61 56 79 168 65Grass five years and over 145 150 29 30 47 38 341 170All grass 154 164 29 35 50 47 509 235
Cattle and sheepGrass less than five years old 108 109 35 39 48 56 103 99Grass five years and over 79 70 26 23 29 23 526 534All grass 82 74 27 24 31 26 629 633
Other livestockGrass less than five years old 129 178 27 45 47 66 27 89Grass five years and over 93 115 21 30 25 34 34 155All grass 109 132 23 35 34 46 61 244
ScotlandDairyGrass less than five years old 154 136 59 41 77 68 22 12Grass five years and over 199 143 49 36 58 39 40 25All grass 183 142 52 37 65 43 62 37
MixedGrass less than five years old 143 109 50 36 61 44 64 181Grass five years and over 115 85 37 29 41 29 90 230All grass 123 92 40 31 47 33 154 411
nitrogen phosphate potash number of fieldswith no with no with no with no
manure manure manure manure manure manure manure manure
BSFP final inner 10/12/05 11:05 am Page 103

104
Data for grassland are presented separately because grass is managed differently according tothe amount of production required. Thus intensive milk production requires large volumes ofgrass and is likely to receive higher inputs of both manure and mineral fertilisers than beef orsheep systems. Table D3.2 shows the average field rate of fertiliser applied to grassland indifferent management systems (as defined by the ‘Robust farm types’) with and withoutapplications of manure. Average field rates have been used for grassland because grass fieldsoften receive no mineral fertiliser, not because of manure use, but because the amount of grassproduction required does not warrant fertiliser input.
In England & Wales 68% of all grass fields in the dairy sector had received manure, 82% offields cut for silage received manures. The difference in the average fertiliser rate on dairygrassland with or without manure was relatively small except on short term grass (<five yearsold). On cattle and sheep farms the number of fields receiving manure was similar to those notreceiving manure. There was little difference in the average rate of nitrogen, phosphate andpotash fertiliser whether or not manure was used. For mixed livestock farms the number offields receiving manures was fewer than the fields without manure. Mineral fertiliser inputswere consistently lower on those fields that had received manure.
In Scotland (as in England & Wales) fields on dairy farms are more likely to receive manurethan those on other farm types with 63% of grass fields on dairy farms receiving manurecompared with 27% on mixed farms. Irrespective of farm type, mineral fertiliser inputs wereconsistently higher on those fields that had received manure.
As so many fields on dairy farms receive manure a separate analysis was carried out to examinethe influence of grass management (Table D3.3). This shows that in both England & Wales andScotland fields cut for silage are most likely to receive manures. In England & Wales smallerdressings of mineral fertiliser were made to silage fields that received manure. For grazed grassthe amount of potash fertiliser was lower in the presence of manure in Scotland but not inEngland & Wales.
Table D3.3 Average field rate of fertiliser application on dairy grassland in England & Wales and in Scotland, with and without applications of organic manure
England & WalesAll hay 117 116 29 54 44 66 44 22All silage 163 187 30 54 60 77 301 68All grazings 152 163 29 32 47 42 457 221
ScotlandAll hay 79 63 30 31 41 31 1 1All silage 181 119 56 54 77 87 38 8All grazings 178 146 48 36 60 41 53 34
nitrogen phosphate potash number of fieldswith no with no with no with no
manure manure manure manure manure manure manure manure
BSFP final inner 10/12/05 11:05 am Page 104

105
In recent years there has been a great deal of promotional activity aimed at encouraging farmersto make adjustments to fertiliser inputs where manures are used. Thus some of the differencesbetween mineral fertiliser inputs categorised as with or without manures are less than mighthave been expected, although the extent to which individual farmers have accounted for thenutrients in the manures cannot be judged from these data. However when making thesecomparisons there are a number of factors which should be taken into account:
• the data presented for ‘with/without’ manure are not a paired comparison of otherwiseidentical fields
• fields which have not received manures may be on farms which have no manure and arethus managed in a different way
• in grassland systems fields which have not received manures may be managed differently(e.g. grazed only) compared with manured field which may be cut more than once as wellas grazed
• for tillage crops the overall fertiliser rate means that some fields are included which havereceived no fertiliser. For the ‘with manure’ data it may indicate that the manure wasjudged to supply all the fertiliser which was required
• for grassland the average fertiliser rate has been used so as to avoid distorting the data byinclusion of ‘unmanaged’ grass which receives no fertiliser although this has the effect ofexcluding any fields on which no fertiliser was applied because the manure was consideredsufficient, thus obscuring a substitution effect
• the data set of fields where manures are used includes fields which may have received onlya very small amount of manure (see section D2). On those fields receiving large dressingsthere may be a greater adjustment in mineral fertiliser
• where reductions in phosphate and potash fertiliser have not been made this may indicatea desire to build up soil reserves of these nutrients
• over a third of cattle/pig FYM applications were reported as <15 t/ha and over a third wereapplied in the autumn. A 15 t/ha dressing of cattle FYM applied to cereal stubble in theautumn will only supply 5-9 kg/ha of available nitrogen depending on soil type
D4. Spreading precision and record keeping
Precision in spreading both fertilisers and manures is important both for profitability and tominimise pollution. Farmers were asked a series of questions about the care taken in applicationof fertilisers and manures and in record keeping. The results are presented in this section.
About a third of farmers check the accuracy of mineral fertiliser spreaders with catch trays onan annual basis (Table D4.1), with 7% checking at each change of fertiliser type. Sixty percentof farmers took active measures to prevent contamination of water courses, ditches andhedgerow bottoms when spreading mineral fertiliser.
BSFP final inner 10/12/05 11:05 am Page 105

106
Computers and farm notebooks were the most common methods for recording fertiliser use(Table D4.2), whilst farm diaries were the most common method for organic manures. Nofertiliser records were kept on 13% of farms; this compares with 22% in 2001 when thisquestion was last asked in the survey.
Table D4.1 Frequency of spread pattern checks using a catch tray
Not answered 18At each change of fertiliser type 7Once a year 32Less than once a year 17It is factory set & doesn’t need checking 27
percentage
Table D4.2 Record keeping methods for fertiliser and manure applications on farms where each respective nutrient type was applied during the 2003 - 2004 crop year
Farm diary 443 35 196 20Farm notebook 560 44 117 12File record sheet 454 36 92 10Computer programme 576 46 104 11Other paper record 94 7 22 2No records kept 231 18 118 12Not answered 44 3 386 40
Total farms 1261 100 965 100
method applied fertiliser applied organic manure
number percentage number percentage
Note: more than one method may be used.
BSFP final inner 10/12/05 11:05 am Page 106

107
APPENDIX 1 - SURVEY STATISTICS
App 1.1 SAMPLING VARIATION
Table App 1.1 Standard errors of application rates for the major crops in 2004
Great Britain
total strt comp total total total strt comp total total
N N N P2O5 K2O N N N P2O5 K2O
standard error for overall standard error for fieldsapplication rate (kg/ha) average field in
rates (kg/ha) sample
winter wheat 2.5 2.9 1.5 1.4 1.7 2.4 2.5 4.2 1.1 1.5 2055oilseed rape 3.3 3.6 1.7 1.9 2.3 3.3 3.3 4.4 1.7 2.2 514winter barley 2.5 3.1 1.9 1.6 2.1 2.4 2.4 3.8 1.3 1.8 628spring barley 2.0 2.5 1.9 1.4 1.7 1.8 2.3 1.7 1.2 1.5 792m/c potatoes 7.4 6.2 8.1 8.4 11.3 6.8 9.1 7.7 7.9 10.2 144sugar beet 4.5 4.6 2.5 4.2 7.4 4.1 3.9 8.7 5.7 7.0 192all tillage crops 2.1 2.5 1.2 1.0 1.3 2.1 2.3 1.9 1.1 1.5 5524all grass 2.2 1.7 1.6 0.6 0.8 2.2 2.9 1.9 0.8 1.1 3816
England & Wales
total strt comp total total total strt comp total total
N N N P2O5 K2O N N N P2O5 K2O
standard error for overall standard error for fieldsapplication rate (kg/ha) average field in
rates (kg/ha) sample
winter wheat 2.7 3.2 1.6 1.4 1.8 2.6 2.7 5.0 1.2 1.7 1855oilseed rape 3.7 4.0 1.8 2.0 2.6 3.6 3.6 6.0 1.9 2.6 457winter barley 2.6 3.3 2.0 1.7 2.3 2.5 2.6 4.6 1.4 2.1 526spring barley 2.7 3.5 2.6 1.7 2.3 2.5 3.0 2.9 1.7 2.2 395m/c potatoes 8.1 6.8 9.1 9.2 12.5 7.4 9.5 8.6 8.6 11.0 120sugar beet 4.5 4.6 2.5 4.2 7.4 4.1 3.9 8.7 5.7 7.0 192all tillage crops 2.3 2.9 1.3 1.2 1.5 2.4 2.5 2.6 1.3 1.9 4559all grass 2.4 1.9 1.6 0.6 0.9 2.6 3.3 2.1 0.9 1.3 2949
Scotland
total strt comp total total total strt comp total total
N N N P2O5 K2O N N N P2O5 K2O
standard error for overall standard error for fieldsapplication rate (kg/ha) average field in
rates (kg/ha) sample
winter wheat 6.1 7.4 4.8 3.5 4.2 5.7 6.1 7.1 2.6 3.5 200oilseed rape 7.5 7.5 4.9 4.2 4.5 7.5 6.5 5.4 3.6 4.0 67winter barley 7.1 8.7 5.5 3.3 4.0 7.1 7.2 6.7 2.6 3.2 102spring barley 2.8 3.4 2.3 1.7 2.0 2.6 3.1 2.0 1.5 1.9 397m/c potatoes 17.5 13.7 16.9 21.2 25.8 16.4 29.0 16.5 20.6 24.8 24all tillage crops 3.9 4.5 2.2 1.7 2.0 3.8 4.7 2.0 1.8 2.0 965all grass 4.7 3.3 4.1 1.6 1.8 4.3 6.5 3.9 1.6 1.8 867
BSFP final inner 10/12/05 11:05 am Page 107

108
App 1.2 ESTIMATING THE STANDARD ERROR
The standard errors quoted in Table App 1.1 are a measure of the standard deviation of themean, and are used to judge the accuracy of the results for each cell in the table. This is astandard statistical process where the standard deviation of each cell is calculated first and thandivided by the square root of the number of data points within that cell.
App 1.3 AN ALTERNATIVE APPROACH TO ESTIMATION OF OVERALLRATES
It is in the nature of random sampling that the characteristics of each achieved sample willdiffer in several respects from one another, and from the underlying population. In particular,the proportion of different crops grown will differ in the achieved sample from that in thepopulation. The method of adjustment used here in these alternative estimates attempts tocounter this by ‘post-stratifying’ or ‘weighting’ by the distribution of area of the major cropsreported to the Agricultural Census (June 2004).
Table App 1.2 Re-estimation of overall total fertiliser use (kg/ha), Great Britain 2004
straight compound total total total
nitrogen nitrogen nitrogen phosphate potash
all tillage 132 20 152 41 55
revised estimate 128 20 148 41 57
all grass 27 50 77 17 22
revised estimate 27 51 78 18 23
all crops and grass 73 37 110 28 37
revised estimate 70 38 107 28 37
BSFP final inner 10/12/05 11:05 am Page 108

109
App 1.4 RESPONSE RATE
Tables App 1.3 and App 1.4 summarise information regarding the response received to the mainand reserve samples.
Table App 1.3 Response to main and reserve samples in 2004
Table App 1.4 Response to main and reserve samples for 2000 - 2004
Issued from main sample 1617 100Non-response
1437 13
Response to main sample 1180 87
Issued from reserve sample 1 437 27Non-response
1335 21
Response to reserve sample 1 102 6
Issued from reserve sample 2 335 21Non-response
1292 18
Response to reserve sample 2 43 3
Issued from reserve sample 3 292 18Non-response
1257 16
Response to reserve sample 3 35 2
Achieved sample response 1360 84
2004 % total
Net response rate 2000 2001 2002 2003 2004% % % % %
Overall achieved rate 94 89 91 84 84Refusal rate
17 11 9 16 16
Net response rate 2000 2001 2002 2003 2004% % % % %
Main sample 67 72 77 71 87Reserve sample(s) 45 28 23 29 13
Main reasons for refusal 2000 2001 2002 2003 2004% % % % %
Too busy 31 23 31 38 23Not interested 10 8 9 16 7Do not do surveys 7 3 5 10 4Want payment 2 1 1 1 1Too much paperwork 3 2 1 3 1Other
149 63 54 32 64
1Includes non-contact
BSFP final inner 10/12/05 11:05 am Page 109

110
APPENDIX 2
App 2.1 BSFP REGIONS18
IN ENGLAND AND WALES
18Defra administrative regions have been revised since April 1996 as a result of changes to county boundariesand nomenclature bought about by the introduction of unitary local authorities. The BSFP regions marked aboveare based on the 1995 MAFF administrative regions.
BSFP final inner 10/12/05 11:05 am Page 110

111
BSFP REGIONS
NORTHERN8 Cumbria21 Lancashire31 Northumberland30 Tyne and Wear
NORTH-EAST4 Cleveland12 Durham51 East Riding of Yorks and N Lincs50 North Yorkshire (Beverley)48 North Yorkshire (Northallerton)47 South Yorkshire49 West Yorkshire
NORTH MERCIA6 Cheshire44 Greater Manchester25 Merseyside35 Shropshire37 Staffordshire
SOUTH MERCIA14 Gloucestershire17 Hereford and Worcester43 Warwickshire46 West Midlands
EAST MIDLANDS9 Derbyshire22 Leicestershire24 Lincolnshire29 Northamptonshire32 Nottinghamshire
ANGLIA1 Bedfordshire5 Cambridgeshire13 Essex18 Hertfordshire28 Norfolk38 Suffolk
SOUTH-EAST2 Berkshire3 Buckinghamshire41 East Sussex26/27 Greater London15 Hampshire16 Isle of Wight20 Kent33 Oxfordshire40 Surrey42 West Sussex
WESSEX11 Dorset34 N Somerset and S Gloucestershire36 Somerset45 Wiltshire
SOUTH-WEST7 Cornwall10 Devon
Defra REGIONS
NORTHERN4 Cleveland8 Cumbria12 Durham51 East Riding of Yorks and N Lincs50 North Yorkshire (Beverley)48 North Yorkshire (Northallerton)47 South Yorkshire30 Tyne and Wear49 West Yorkshire
MIDLANDS & WESTERN6 Cheshire9 Derbyshire44 Greater Manchester17 Hereford and Worcester21 Lancashire22 Leicestershire25 Merseyside32 Nottinghamshire35 Shropshire37 Staffordshire43 Warwickshire46 West Midlands
EASTERN1 Bedfordshire5 Cambridgeshire13 Essex26 Greater London (E)18 Hertfordshire24 Lincolnshire28 Norfolk29 Northamptonshire38 Suffolk
SOUTH-EASTERN2 Berkshire3 Buckinghamshire41 East Sussex27 Greater London (SE)15 Hampshire16 Isle of Wight20 Kent33 Oxfordshire40 Surrey42 West Sussex
SOUTH-WESTERN7 Cornwall10 Devon11 Dorset39 Isles of Scilly34 N Somerset and S Gloucestershire14 Gloucestershire36 Somerset45 Wiltshire
Approximate English counties within BSFP and Defra Regions19
19Defra Statistics Dept, Foss House, York and Office for National Statistics (ONS) Geography User Guide,http://www.ons.gov.uk
App 2.2 COMPARISON OF BSFP AND DEFRA COUNTIES
BSFP final inner 10/12/05 11:05 am Page 111

112
COUNTY BSFP REGION DEFRA REGION
1 Bedfordshire Anglia Eastern2 Berkshire South-East South-Eastern3 Buckinghamshire South-East South-Eastern4 Cleveland North-East Northern5 Cambridgeshire Anglia Eastern6 Cheshire North Mercia Midlands & Western7 Cornwall South-West South-Western8 Cumbria Northern Northern9 Derbyshire East Midlands Midlands & Western10 Devon South-West South-Western11 Dorset Wessex South-Western12 Durham North-East Northern13 Essex Anglia Eastern14 Gloucestershire South Mercia South-Western15 Hampshire South-East South-Eastern16 Isle of Wight South-East South-Eastern17 Hereford & Worcester South Mercia Midlands & Western18 Hertfordshire Anglia Eastern20 Kent South-East South-Eastern21 Lancashire Northern Midlands & Western22 Leicestershire East Midlands Midlands & Western24 Lincolnshire Eastern East Midlands25 Merseyside North Mercia Midlands & Western26/27 Greater London (E) South-East Eastern28 Norfolk Anglia Eastern29 Northamptonshire East Midlands Eastern30 Tyne and Wear Northern Northern31 Northumberland Northern Northern32 Nottinghamshire East Midlands Midlands & Western33 Oxfordshire South-East South-Eastern34 N Somerset and S Gloucestershire Wessex South-Western35 Shropshire North Mercia Midlands & Western36 Somerset Wessex South-Western37 Staffordshire North Mercia Midlands & Western38 Suffolk Anglia Eastern39 Isles of Scilly South-Western40 Surrey South-East South-Eastern41 East Sussex South-East South-Eastern42 West Sussex South-East South-Eastern43 Warwickshire South Mercia Midlands & Western44 Greater Manchester North Mercia Midlands & Western45 Wiltshire Wessex South-Western46 West Midlands South Mercia Midlands & Western47 South Yorkshire North-East Northern48 North Yorkshire (Northallerton) North-East Northern49 West Yorkshire North-East Northern50 North Yorkshire (Beverley) North-East Northern51 East Riding of Yorks and North Lincs North-East Northern
App 2.3 ENGLISH COUNTIES WITHIN BSFP AND DEFRA REGIONS
List of English counties indicating the BSFP and Defra Regions20 within which they fall
20Defra Statistics Dept, Foss House, York and Office for National Statistics (ONS) Geography User Guide,http://www.ons.gov.uk
BSFP final inner 10/12/05 11:05 am Page 112

113
21SEERAD administrative regions have been revised since April 1996 as a result of changes to county boundariesand nomenclature bought about by the introduction of unitary local authorities. The BSFP regions marked aboveare based on the 1995 SOAFD administrative regions.
APPENDIX 3
App 3.1 BSFP REGIONS21
IN SCOTLAND
BSFP final inner 10/12/05 11:05 am Page 113
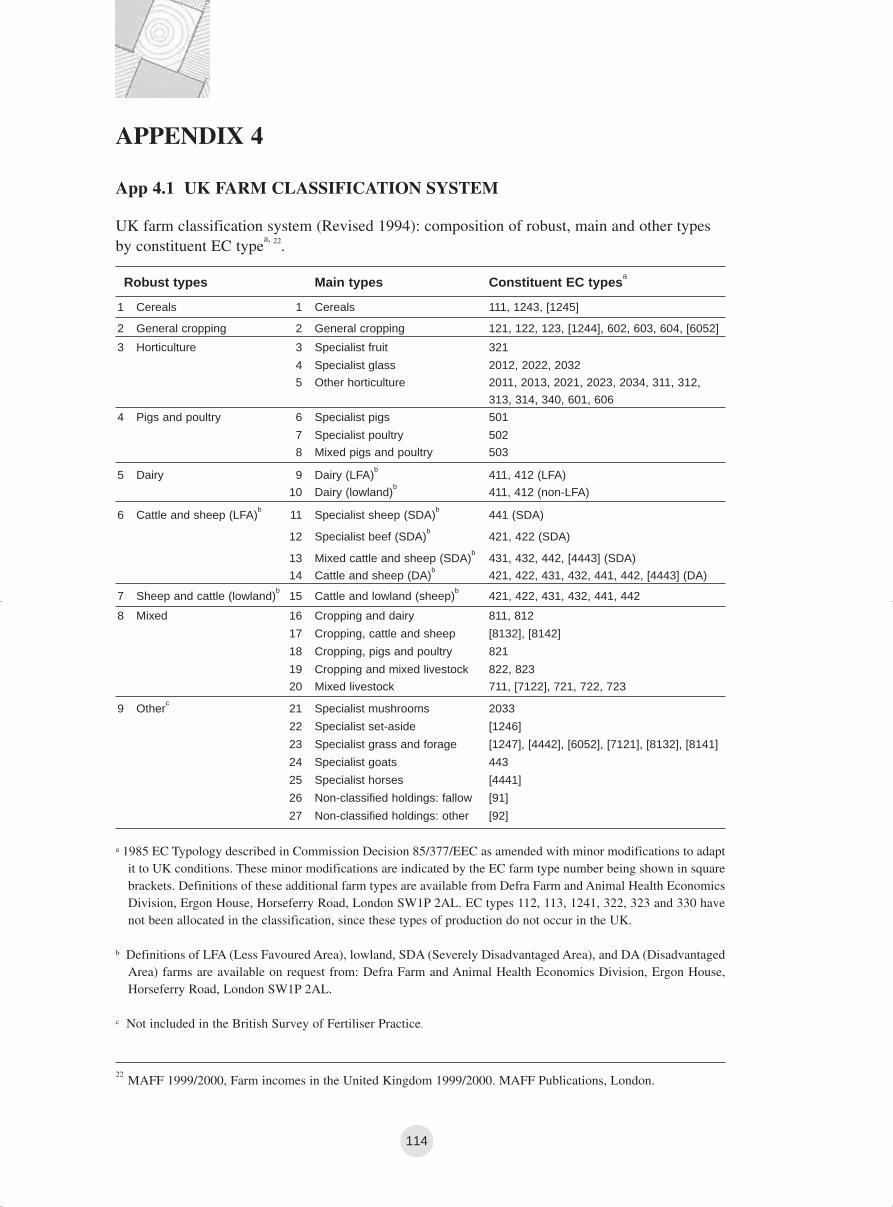
114
APPENDIX 4
App 4.1 UK FARM CLASSIFICATION SYSTEM
UK farm classification system (Revised 1994): composition of robust, main and other typesby constituent EC type
a, 22.
1 Cereals 1 Cereals 111, 1243, [1245]
2 General cropping 2 General cropping 121, 122, 123, [1244], 602, 603, 604, [6052]
3 Horticulture 3 Specialist fruit 321
4 Specialist glass 2012, 2022, 2032
5 Other horticulture 2011, 2013, 2021, 2023, 2034, 311, 312,
313, 314, 340, 601, 606
4 Pigs and poultry 6 Specialist pigs 501
7 Specialist poultry 502
8 Mixed pigs and poultry 503
5 Dairy 9 Dairy (LFA)b
411, 412 (LFA)
10 Dairy (lowland)b
411, 412 (non-LFA)
6 Cattle and sheep (LFA)b
11 Specialist sheep (SDA)b
441 (SDA)
12 Specialist beef (SDA)b
421, 422 (SDA)
13 Mixed cattle and sheep (SDA)b
431, 432, 442, [4443] (SDA)
14 Cattle and sheep (DA)b
421, 422, 431, 432, 441, 442, [4443] (DA)
7 Sheep and cattle (lowland)b
15 Cattle and lowland (sheep)b
421, 422, 431, 432, 441, 442
8 Mixed 16 Cropping and dairy 811, 812
17 Cropping, cattle and sheep [8132], [8142]
18 Cropping, pigs and poultry 821
19 Cropping and mixed livestock 822, 823
20 Mixed livestock 711, [7122], 721, 722, 723
9 Otherc
21 Specialist mushrooms 2033
22 Specialist set-aside [1246]
23 Specialist grass and forage [1247], [4442], [6052], [7121], [8132], [8141]
24 Specialist goats 443
25 Specialist horses [4441]
26 Non-classified holdings: fallow [91]
27 Non-classified holdings: other [92]
a 1985 EC Typology described in Commission Decision 85/377/EEC as amended with minor modifications to adaptit to UK conditions. These minor modifications are indicated by the EC farm type number being shown in squarebrackets. Definitions of these additional farm types are available from Defra Farm and Animal Health EconomicsDivision, Ergon House, Horseferry Road, London SW1P 2AL. EC types 112, 113, 1241, 322, 323 and 330 havenot been allocated in the classification, since these types of production do not occur in the UK.
b Definitions of LFA (Less Favoured Area), lowland, SDA (Severely Disadvantaged Area), and DA (DisadvantagedArea) farms are available on request from: Defra Farm and Animal Health Economics Division, Ergon House,Horseferry Road, London SW1P 2AL.
c Not included in the British Survey of Fertiliser Practice.
22MAFF 1999/2000, Farm incomes in the United Kingdom 1999/2000. MAFF Publications, London.
Robust types Main types Constituent EC typesa
BSFP final inner 10/12/05 11:05 am Page 114