the california bar examinationajud.assembly.ca.gov/sites/ajud.assembly.ca.gov/files/panel 1... ·...
TRANSCRIPT

The California Bar Examination
Admissions Examining Committee
• 6046. The board may establish an examining committee having the power:
• (a) To examine all applicants for admission to practice law.
• (b) To administer the requirements for admission to practice law.
• (c) To certify to the Supreme Court for admission those applicants who fulfill the requirements provided in this chapter.

Admissions Committee of Bar Examiners
• 10 Attorney Members (1 “Young” Lawyer)
Appointed by State Bar Board of Trustees
• 3 Public Members Appointed by Governor
• 3 Public Members Appointed by Senate
• 3 Public Members Appointed by Assembly
Admissions Exam Development
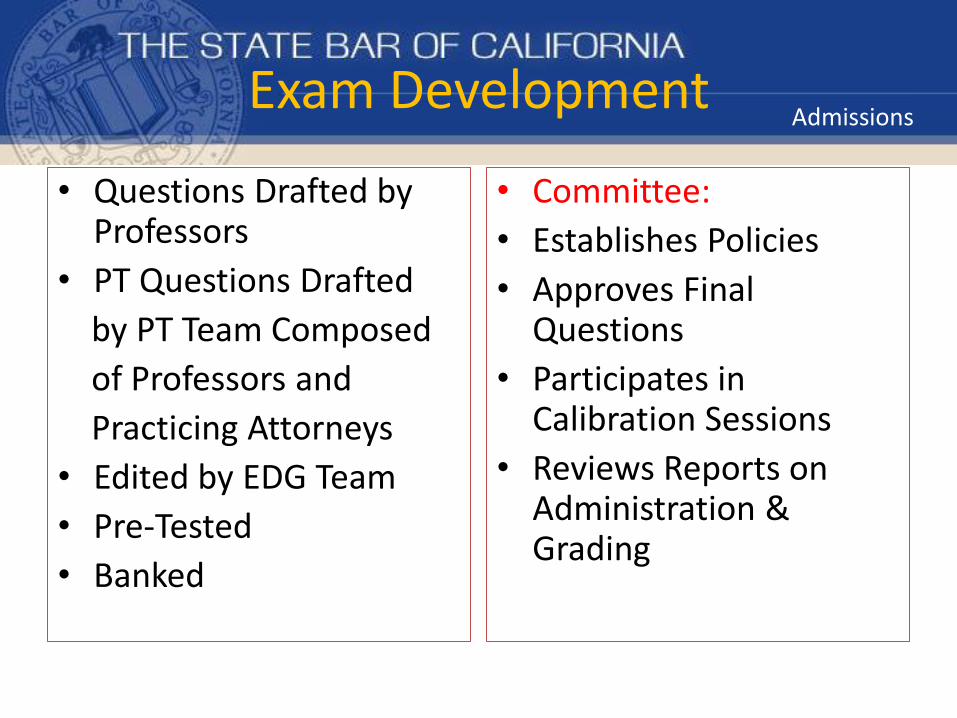
• Questions Drafted by Professors
• PT Questions Drafted
by PT Team Composed
of Professors and
Practicing Attorneys
• Edited by EDG Team
• Pre-Tested
• Banked
• Committee:
• Establishes Policies
• Approves Final Questions
• Participates in Calibration Sessions
• Reviews Reports on Administration & Grading

Admissions CALIFORNIA BAR EXAMINATION
Scope of Subjects Tested 1. Business Associations 7. Evidence
2. Civil Procedure 8. Professional Responsibility
3. Community Property 9. Real Property
4. Constitutional Law 10. Remedies
5. Contracts 11. Torts
6. Criminal Law and 12. Trusts
Procedure 13. Wills and Succession

Admissions EXAM COMPOSITION
GENERAL BAR EXAMINATION • Three Day (Current): 6, 1-hour Essay Questions; 2, 3-hour Performance Tests (PT), 200 Multiple-Choice Questions (MBE) Weighted: 65% Written and 35% MBE • Two-Day (July 2017) 5, 1-hour Essay Questions; 1, 90-Minutes PT MBE Weighted: 50% Written and 50% MBE

Admissions
• Answers Coded to Preserve
Anonymity & Rearrange
grading order
• 8 Grading Groups; 12-15
Graders in Each Grading Group
• 3 Calibration Sessions
• 40%-70% Point Scale
BAR EXAM GRADING

Admissions GRADING PHASES
• 1st Phase: 1440 Scaled Score (Combined Written and MBE) Passes
• 2nd Phase: 1390 – 1439 Answers Read a Second Time and Scores Averaged & Scaled
• 3rd Phase: Answers between 1390-1439 that Have More than a Ten Point Discrepancy Between 1st and 2nd Grade, Read Again & Resolved by Senior Grader (EDG Team)

Admissions Scoring Example from A RECENT July GBX
Measure Score/Decision Formula/Decision Rule
Raw Scores
Essay Question
1 55
2 65
3 60
4 65
5 60
6 70
Performance Task
1 60
2 65
Total Written Score 625 (Sum of Essays 1-6) + (2* Sum of PT 1-2)
Scale Scores
Total Scale Written Score 1474.185 -469.44 + (3.1098 * Total Raw Written Score)
MBE Scale Score 1391.000
Total Scale Score 1445.070 (35*MBE) + (.65*Scale Written Score)
Final Decision Pass Is Total Scale Score > 1440?

Admissions CA Bar Examination
Key Trends in Performance
Admissions
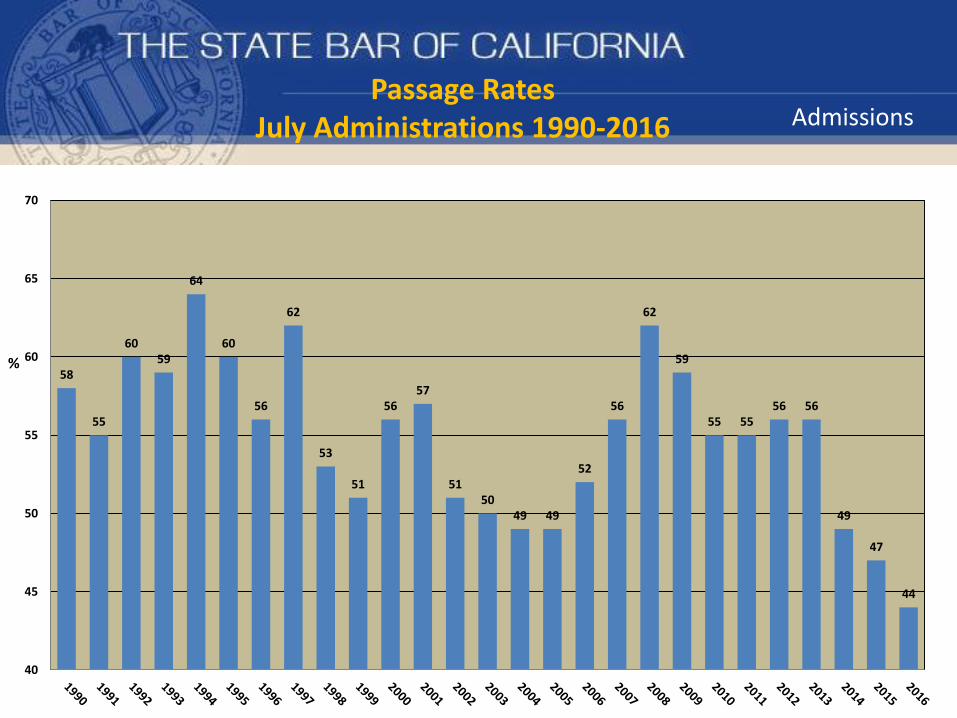
Passage Rates July Administrations 1990-2016
58
55
60 59
64
60
56
62
53
51
56 57
51 50
49 49
52
56
62
59
55 55 56 56
49
47
44
40
45
50
55
60
65
70
%

Admissions Average MBE Scores
July Administrations 1990-2016
1451
1454
1464 1465
1471
1458
1478
1446
1449
1460
1468
1445 1443
1434
1437
1452
1459
1476
1463
1454
1458 1460 1461
1436
1426
1423
1420
1430
1440
1450
1460
1470
1480

Admissions
Relationship between MBE Performance & CBE Passage Rates All Exams 1990-2016
30
35
40
45
50
55
60
65
1380 1400 1420 1440 1460 1480
% P
assi
ng
GB
X
Average MBE
CA Assembly Judiciary Committee Hearing Feb. 2017
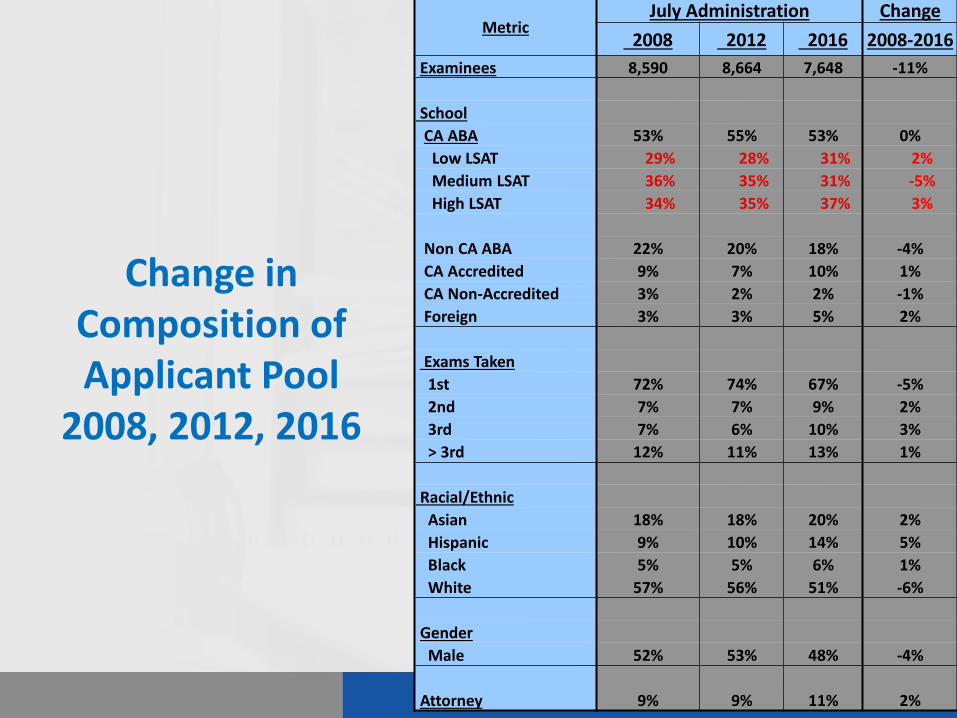
Change in Composition of Applicant Pool
2008, 2012, 2016
Metric July Administration Change
2008 2012 2016 2008-2016
Examinees 8,590 8,664 7,648 -11%
School
CA ABA 53% 55% 53% 0%
Low LSAT 29% 28% 31% 2%
Medium LSAT 36% 35% 31% -5%
High LSAT 34% 35% 37% 3%
Non CA ABA 22% 20% 18% -4%
CA Accredited 9% 7% 10% 1%
CA Non-Accredited 3% 2% 2% -1%
Foreign 3% 3% 5% 2%
Exams Taken
1st 72% 74% 67% -5%
2nd 7% 7% 9% 2%
3rd 7% 6% 10% 3%
> 3rd 12% 11% 13% 1%
Racial/Ethnic
Asian 18% 18% 20% 2%
Hispanic 9% 10% 14% 5%
Black 5% 5% 6% 1%
White 57% 56% 51% -6%
Gender
Male 52% 53% 48% -4%
Attorney 9% 9% 11% 2%

CA Assembly Judiciary Committee Hearing Feb. 2017
Comparison of California & U.S. Average MBE Score 2008 - 2016
139.0
140.5
142.0
143.5
145.0
146.5
148.0
2008 2009 2010 2011 2012 2013 2014 2015 2016
CA MBE National MBE
CA Assembly Judiciary Committee Hearing Feb. 2017
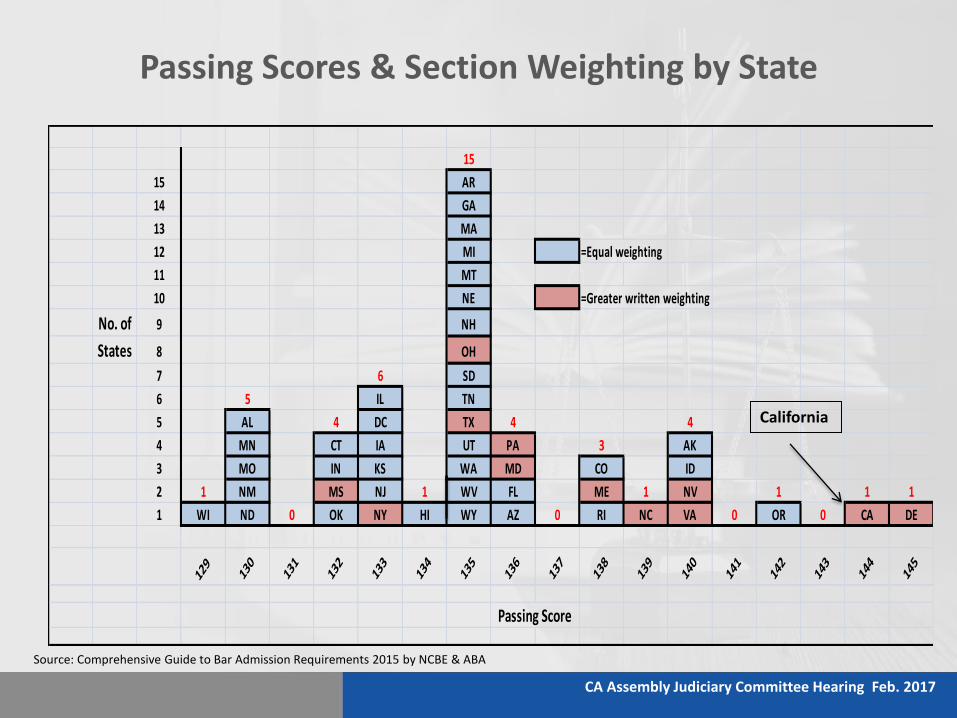
Passing Scores & Section Weighting by State
Source: Comprehensive Guide to Bar Admission Requirements 2015 by NCBE & ABA
15
15 AR
14 GA
13 MA
12 MI =Equal weighting
11 MT
10 NE =Greater written weighting
No. of 9 NH
States 8 OH
7 6 SD
6 5 IL TN
5 AL 4 DC TX 4 4
4 MN CT IA UT PA 3 AK
3 MO IN KS WA MD CO ID
2 1 NM MS NJ 1 WV FL ME 1 NV 1 1 1
1 WI ND 0 OK NY HI WY AZ 0 RI NC VA 0 OR 0 CA DE
129
130
131
132
133
134
135
136
137
138
139
140
141
142
143
144
145
Passing Score
California

CA Assembly Judiciary Committee Hearing Feb. 2017
Comparison of Bar Passage in 6 Large States ABA 1st Time Takers*
81%
66%
83%
69%
94%
80%
87%
73%
85%
74%
91%
79%
60%
65%
70%
75%
80%
85%
90%
95%
100%
2008 2012 2014 2015
CA
FL
MA
NJ
TX
NY
Decrease
15%
14%
14%
14%
11%
12%
*Source: ncbex.org/publications/statistics

CA Assembly Judiciary Committee Hearing Feb. 2017
Comparison of Estimated Pass Rates at Alternative Cut Points*
Year
1st Time Taker Repeater All Examinees
% Passing % Passing % Passing
144 135 133 144 135 133 144 135 133
2008 75% 89% 91% 28% 60% 68% 62% 81% 84%
2012 69% 86% 89% 18% 52% 61% 56% 77% 82%
2016 57% 76% 80% 17% 46% 54% 44% 66% 71%
2008-2016
18%
24%
13%
14%
11%
12%
11%
39%
14%
23%
14%
20%
18%
29%
15%
19%
13%
15% % Change
*July Examinations

CA Assembly Judiciary Committee Hearing Feb. 2017
Comparison of Actual & Estimated Passing Rates*
Year New York Actual % Passing @ 133
California Estimated
% Passing @ 133 Difference
2008 91% 96% +5%
2012 85% 95% +10%
2016 82% 87% +5%
2008-2016
9%
9%
Difference
* Within-State ABA July 1st Time Takers

CA Assembly Judiciary Committee Hearing Feb. 2017
Historic Relationship Between LSAT and Bar Passage*
20%
30%
40%
50%
60%
70%
80%
90%
148.0 150.0 152.0 154.0 156.0 158.0 160.0 162.0 164.0 166.0 168.0 170.0
%
P
a
s
s
Ave. MBE *Entries represent CA ABA School averages for years 1994 through 2007
r=.95