the canadian adagio project for mapping total atmospheric ... · the canadian adagio project for...
TRANSCRIPT
The Canadian ADAGIO Project for Mapping Total Atmospheric
Deposition
Amanda S. ColeEnvironment & Climate Change Canada (ECCC)
MMF-GTAD WorkshopGeneva, Switzerland
February 28, 2017

ADAGIO team
Amanda ColeAlain RobichaudVincent FortinAlexandru LupuMike MoranGuy RoyMike ShawRobert Vet
Marc Beauchemin

ADAGIO
• Atmospheric Deposition Analysis Generated by optimal Interpolation from Observations
• Goal: produce annual wet, dry and total deposition maps for sulphur and nitrogen for N. America
• Developing methodology using 2010 pilot year
• Working towards operational (routine) product

Methodology overview
Precipitation concentration maps
Wet deposition maps
Modelled dry deposition velocities
(GEM-MACH)
Air concentration maps
Dry deposition maps
Total deposition
maps
Measured air concentrations
Modelled air concentrations (GEM-MACH)
Measured precipitation
depth
Modelled precipitation depth (GEM)
Measured precipitation
concentrations
Modelled precipitation
concentrations (GEM-MACH)
Precipitation depth map
Optimal interpolation Optimal interpolation
Optimal interpolation (CaPA)
Modelled dry deposition of unmeasured
species

NOx SO2
NH3
HNO3p-NO3
-
p-NH4+
p-SO42-
Measurements: 2010 air (gas and particle) concentrations

Measurements: 2010 wet deposition concentrations
NO3-
NH4+
nss-SO42-
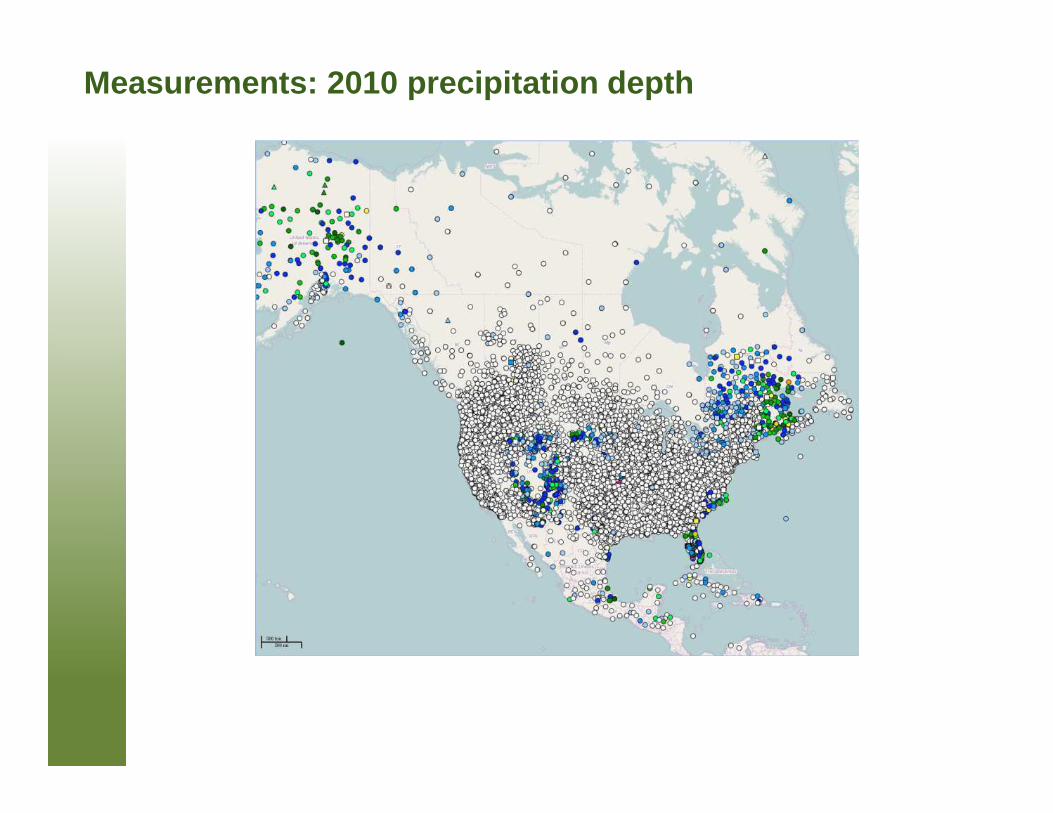
Measurements: 2010 precipitation depth

Measurements: analysis and quality control
• Seasonal mean (or PWM) concentrations
• Seasons aligned with Tuesdays to minimize artifacts from weekly samples: Mar. 2, Jun. 1, Aug. 31, Nov. 30
• Gas and particle concentrations:
• >75% of season has valid concentration data
• Wet concentrations:
• >90% of season has valid precipitation amount
• >70% of precipitation collected has valid concentration data
• Precipitation depth:
• Maximum wind speed for snow collectors
• All: remove duplicates

Methodology overview
Precipitation concentration maps
Wet deposition maps
Modelled dry deposition velocities
(GEM-MACH)
Air concentration maps
Dry deposition maps
Total deposition
maps
Measured air concentrations
Modelled air concentrations (GEM-MACH)
Measured precipitation
depth
Modelled precipitation depth (GEM)
Measured precipitation
concentrations
Modelled precipitation
concentrations (GEM-MACH)
Precipitation depth map
Optimal interpolation Optimal interpolation
Optimal interpolation (CaPA)
Modelled dry deposition of unmeasured
species

Model: GEM-MACH
• GEM-MACH (Global Environmental Multi-scale – Modelling Air quality and CHemistry) model: Environment and Climate Change Canada’s in-line meteorology‒chemistry model
• Met-only GEM model supplies initial conditions and meteorological lateral boundary conditions for GEM-MACH
• 10-km horizontal grid spacing, 80 vertical levels to 0.1 hPa
• One-way coupling (meteorology affects chemistry)
GEM-MACH GridGEM-LAM10 Grid

Model: GEM-MACH
• Full representation of oxidant and aerosol chemistry processes:
• gas, aqueous & heterogeneous chemistry mechanisms
• aerosol dynamics• dry and wet deposition (including in-
and below-cloud scavenging)
• 2-bin sectional representation of PM size distribution (i.e., 0-2.5 and 2.5-10 µm) with 8 chemical components
• 2010 simulation completed, hourly surface concentrations and wet and dry deposition fluxes archived
• V2 is now operational AQ model
Surface SO2 predicted by GEM-MACH v2 for January 2010

Methodology overview
Precipitation concentration maps
Wet deposition maps
Modelled dry deposition velocities
(GEM-MACH)
Air concentration maps
Dry deposition maps
Total deposition
maps
Measured air concentrations
Modelled air concentrations (GEM-MACH)
Measured precipitation
depth
Modelled precipitation depth (GEM)
Measured precipitation
concentrations
Modelled precipitation
concentrations (GEM-MACH)
Precipitation depth map
Optimal interpolation Optimal interpolation
Optimal interpolation (CaPA)
Modelled dry deposition of unmeasured
species

Optimal interpolation
• Concentrations (wet and dry) of each species and season
• Daily precipitation
( ))( bba H xzKxx −+=Final analysis (fusion) values
Model values (background)
Observations Observation operator
Weight matrix
Analysis increment

Sp
ring
2010 p-N
H4 +
modelanalysis increment
analysisobservations

Summer 2010 precipitation SO42-
mod
elan
alys
is in
crem
ent
analysisobservations

Summer 2010 precipitation depth
ModelAnalysis (CaPA = Canadian
Precipitation Analysis)
Sum of daily analysis products

Methodology overview
Precipitation concentration maps
Wet deposition maps
Modelled dry deposition velocities
(GEM-MACH)
Air concentration maps
Dry deposition maps
Total deposition
maps
Measured air concentrations
Modelled air concentrations (GEM-MACH)
Measured precipitation
depth
Modelled precipitation depth (GEM)
Measured precipitation
concentrations
Modelled precipitation
concentrations (GEM-MACH)
Precipitation depth map
Optimal interpolation Optimal interpolation
Optimal interpolation (CaPA)
Modelled dry deposition of unmeasured
species

Deposition calculation
• Wetflux = PWMconcentration OI × Precipitation(OI)
• Dryflux = Meanconcentration(OI) × V����
• V���� =
� !�"#�$ %(!&��$)
� !'&('�()"*)+&((!&��$)=
,�*(�"#�$ %(!&��$)
,�*('&('�()"*)+&((!&��$)
– Sum/mean values are over entire season
– Calculating the mean deposition velocity directly can cause biases
due to covariance between hourly concentrations and deposition
velocities

ADAGIO (Vdeff)5.0
4.5
4.0
3.5
3.0
2.5
2.0
1.5
1.0
0.5
Dry deposition of SO2
Analysis domain mean annual flux 10% lower than model, but maximum value 17% higher
model5.0
4.5
4.0
3.5
3.0
2.5
2.0
1.5
1.0
0.5

5.0
4.5
4.0
3.5
3.0
2.5
2.0
1.5
1.0
0.5
ADAGIO (Vdavg)
Dry deposition of SO2: average Vd
No correction for cross-correlation: • 29% lower than analysis with Vd
eff
• 36% lower than model
model5.0
4.5
4.0
3.5
3.0
2.5
2.0
1.5
1.0
0.5

Dry deposition of reduced N (kg/ha)
ADAGIO (Vdeff)10
9
8
7
6
5
4
3
2
1
model10
9
8
7
6
5
4
3
2
1

Dry deposition of oxidized N (kg/ha)
ADAGIO (Vdeff)10
9
8
7
6
5
4
3
2
1
model10
9
8
7
6
5
4
3
2
1

Wet deposition of S (kg/ha)
ADAGIO20
18
16
14
12
10
8
6
4
2
model20
18
16
14
12
10
8
6
4
2
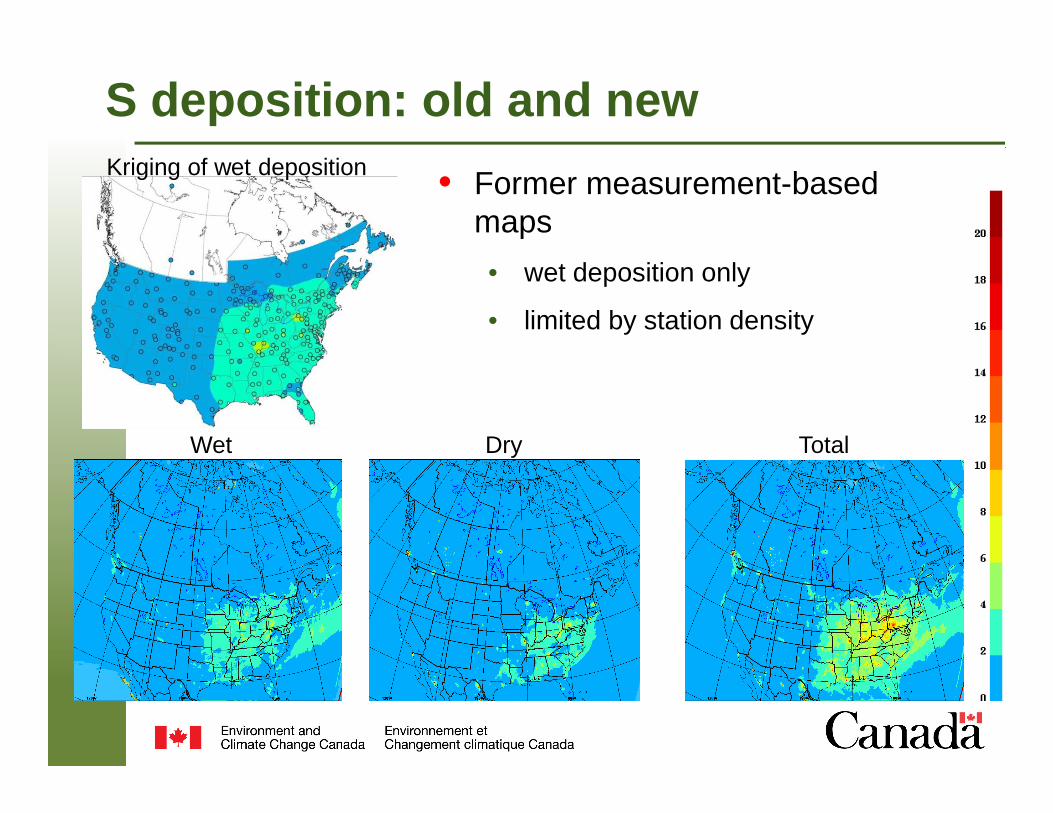
S deposition: old and new
Wet Dry Total
Kriging of wet deposition • Former measurement-based maps
• wet deposition only
• limited by station density

ADAGIO: Future directions
• OI testing and validation
• Quantitative comparison with TDEP in U.S. domain
• Incorporate satellite measurements of SO2 and NO2
• Additional species, e.g. Hg, O3
• Next model evaluation run: 2014
• Routine annual deposition maps using QC’dmeasurements and archived values from operational GEM-MACH runs

CaPA (Canadian Precipitation Analysis) for precipitation depth
• Optimal interpolation combines GEM model forecast with ground weather station data
• Operational version now includes radar data (not available for 2010 pilot)
• Precipitation amounts from precipitation chemistry sites now included
CaPA 2010 annual precipitation totals
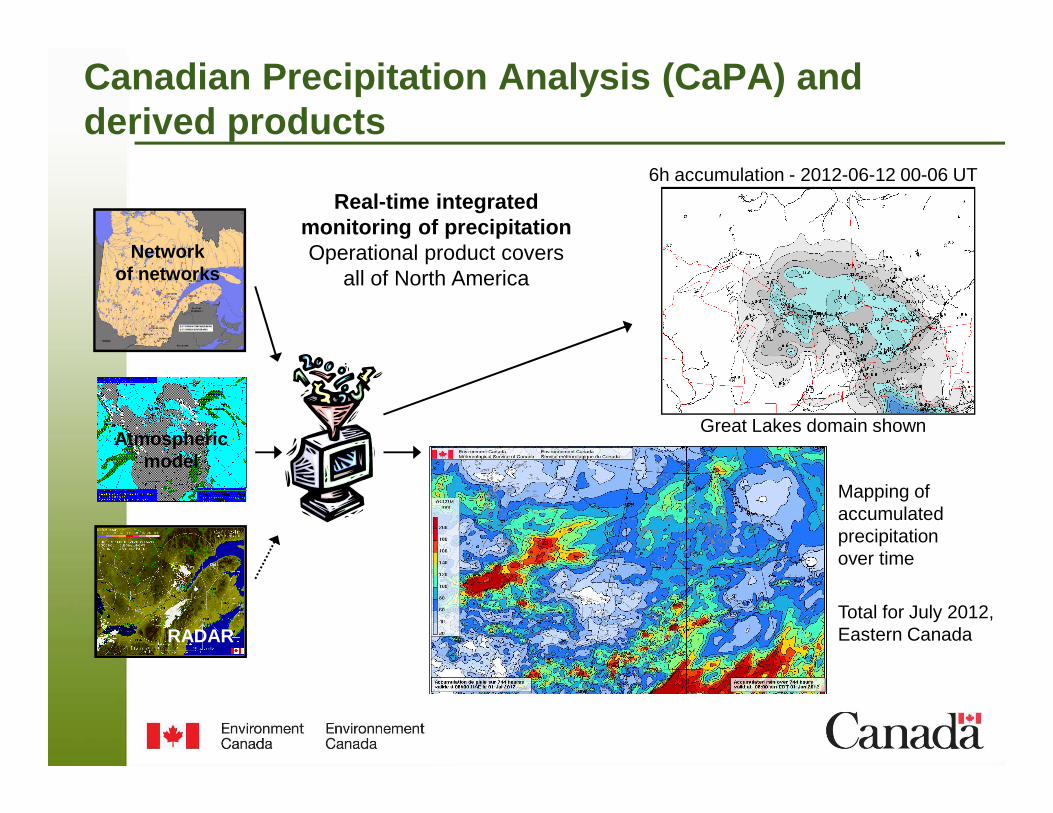
Canadian Precipitation Analysis (CaPA) and derived products
6h accumulation - 2012-06-12 00-06 UT
Great Lakes domain shown
Networkof networks
Atmosphericmodel
RADAR
Real-time integratedmonitoring of precipitationOperational product covers
all of North America
Mapping of accumulated precipitation over time
Total for July 2012,Eastern Canada

• Spatially and temporally continuous
• Biases compared to measurements
• Gaps: compounds, sources, sinks
• Superior precision and accuracy at measurement sites
• Miss “hotspots” between stations
• Gaps: compounds, time periods
analysis
Measurement-model fusion concept
model
observations