the causal effect of east asian ‘mastery’ teaching methods...
TRANSCRIPT

The causal effect of East Asian ‘mastery’ teaching methods on English children’s mathematics skills?
John Jerrim and Anna Vignoles
Department of Quantitative Social Science Working Paper No. 15-05
June 2015

Disclaimer Any opinions expressed here are those of the author(s) and not those of the UCL Institute of Education. Research published in this series may include views on policy, but the institute itself takes no institutional policy positions. DoQSS Workings Papers often represent preliminary work and are circulated to encourage discussion. Citation of such a paper should account for its provisional character. A revised version may be available directly from the author.
Department of Quantitative Social Science, UCL Institute of Education, University College London,
20 Bedford Way, London WC1H 0AL, UK
The causal effect of East Asian ‘mastery’ teaching methods on English children’s mathematics skills?
John Jerrim1 and Anna Vignoles2
Abstract
A small group of high-performing East Asian economies dominate the top of the Programme for International Student Assessment (PISA) rankings. Although there are many possible explanations for this, East Asian teaching methods and curriculum design are two factors to have particularly caught policymakers’ attention. Yet there is currently little evidence as to whether any particular East Asian teaching method actually represents an improvement over the status quo in England, and whether such methods can be successfully introduced into Western education systems. This paper provides new evidence on this issue by presenting results from two clustered Randomised Controlled Trials (RCT’s), where a Singaporean inspired ‘mastery’ approach to teaching mathematics was introduced into a selection of England’s primary and secondary schools. We find evidence of a modest but positive treatment effect. Moreover, even under conservative assumptions, the programme has the potential to offer substantial economic returns.
JEL codes: I2
Keywords: Maths Mastery; Randomised Controlled Trial; Singapore; PISA
Contact Details: John Jerrim ([email protected]) Department of Quantitative Social Science, Institute of Education, University of London, 20 Bedford Way London, WC1H 0AL
1 Department of Quantitative Social Science, Institute of Education, University College London, 20 Bedford Way, London WC1H 0AL ([email protected]) 2 Faculty of Education, University of Cambridge ([email protected])
3
Acknowledgements: This paper includes analysis from two evaluations of the Mathematics Mastery programme funded by the Education Endowment Foundation. The cost-benefit analysis included in this paper was not funded by the Education Endowment Foundation. Professor Richard Cowen, Institute of Education, provided advice on the appropriate mathematics tests to use for the RCT. Meg Wiggins, Anne Ingold and Helen Austerbury assisted with the secondary school testing. Valuable comments have been received from John Micklewright and Emla Fitzsimons. The intervention was delivered by ARK schools http://www.arkschools.org/. Funding was provided by the Education Endowment Foundation.
1. Introduction
The Programme for International Student Assessment (PISA) is a major cross-
national study of school children’s academic achievement. Since its inception in
2000, its ranking of the world’s education systems has drawn the attention of
academics, educationalists, journalists and policymakers alike. A small group of
high-performing East Asian economies (e.g. Singapore, Japan, Hong Kong, South
Korea) consistently dominate the top of these international ‘league tables’. This is
particularly true of mathematics, where children from such countries are, on average,
more than one school year ahead of their Western peers (Jerrim and Choi 2014).
Consequently, two of the most frequently asked questions by education
policymakers today are ‘what drives East Asian educational success’ and ‘what can
we do to catch up’?
Although there are many possible explanations for this phenomenon (Jerrim
2014), teaching methods and design of the curriculum have particularly caught
policymakers’ attention. For instance, to inform upcoming changes to the
mathematics curriculum in England, the Department for Education (2012) conducted
an extensive review of the mathematics syllabus in a number of East Asian
countries. Similarly, a selection of British officials have visited East Asian economies
to observe their teaching practises (Department for Education 2014), under the
presumption that this is driving their educational success. Indeed, as Liz Truss
(former Under Secretary of State for Education in England) noted of one such visit:
‘this represents a real opportunity for us to see at first hand the teaching methods
that have enabled their young people to achieve so well in maths.’ [Emphasis our
own].
4
Thus, despite difficulties in even defining the concept of an ‘East Asian teaching
method’, policymakers continue to believe this to be a key reason why mathematics
achievement is so much greater in the East than the West.
Yet simplistic attempts to ‘borrow policy’ from other countries is problematic
(Crossley and Watson 2009). Two particular issues stand out. The first is causality.
There are significant cultural, economic and historic differences between countries,
meaning it is almost impossible to tell from studies like PISA what is leading to the
differences observed. Consequently, there is very little evidence that East Asian
teaching methods, however defined, are actually superior to those currently being
used in England’s (or other Western countries) schools. Second, even if some East
Asian teaching methods are potentially more effective than the status quo, one
simply does not know whether they can be successfully implemented within the
English (or, indeed, other) educational systems.
This paper attempts to provide some robust evidence to begin to fill this
important gap in the literature. Specifically, it provides (to our knowledge) the first
evidence as to how introducing a particular East Asian inspired teaching method into
a Western schooling system influences children’s mathematics test scores. This is
done via estimation of the causal effect of the ‘Maths Mastery’ teaching programme
after it has been implemented within a selection of England’s primary and secondary
schools for one academic year. This particular programme is based upon
approaches to teaching mathematics in Singapore (ranked 2nd out of 65 economies
in the PISA 2012 mathematics rankings) and represents a radical change to
standard practise in England (see Guskey 2010). In particular, fewer topics are
covered in greater depth, with every child expected to reach a certain level (i.e. to
‘master the curriculum’) before the class progresses on to the next part of the
syllabus. The notion that Singaporean teachers place more emphasis on whole class
mastery of concepts is supported by the Teaching and Learning International Survey
(Micklewright et al 2014). This indicates that, whereas three-in-five teachers in
England differentiate their lessons for pupils with different abilities, only one in five
Singaporean teachers do. Greater emphasis is also placed upon children’s problem
solving skills, with this complemented by an integrated professional development
programme for teachers, and the sharing of best practise amongst a network of
schools.
5

This paper reports results from two field experiments designed to estimate the
causal effect of a one year exposure to this programme. A clustered Randomised
Controlled Trial (RCT) methodology is used, involving more than 10,000 pupils
enrolled in 90 English primary schools and 50 secondary schools during the 2012/13
and 2013/14 academic years. Both the primary and the secondary school trials
suggest a positive impact, though the latter did not reach statistically significance at
conventional thresholds. Combining results from across these two trials, and thus
increasing statistical power, we find indicative evidence of a modest though positive
treatment effect. It is noteworthy that the magnitude of the effect found is similar to
that for some other curriculum and pedagogical interventions also attempting to
improve basic skills. This includes the ‘The Literacy Hour’ - a change made to the
English curriculum made in the late 1990’s – which was found to have a small,
positive impact by Machin and McNally (2008).
These experimental results are complemented by estimates of the
programme’s economic costs and benefits. Specifically, we use a rich British panel
survey to estimate how a modest increase in age 10 mathematics test scores
(consistent with the effect found for the Maths Mastery programme) influences later
lifetime earnings. These labour market benefits are then compared to the costs of
the programme, with the Net Present Value (NPV) and Internal Rate of Return (IRR)
calculated under three scenarios (conservative, baseline and optimistic). We find
evidence of a high IRR (eight percent) even under conservative assumptions. This
illustrates how low cost interventions can potentially provide substantial economic
returns, even when effect sizes are small.
The paper proceeds as follows. Section 2 overviews the Maths Mastery (MM)
intervention, with our empirical methodology detailed in section 3. Section 4 provides
results from the two RCT’s, while section 5 compares economic costs to estimated
labour market benefits. Conclusions and directions for future research follow in
section 6.
2. The Maths Mastery intervention
Maths Mastery is delivered in England by the academy chain ARK. Our study
considers two particular versions of their programme; one appropriate for Year 1
pupils (age 5/6) and one appropriate for year 7 pupils (age 11/12). The introduction
6
of a ‘mastery curriculum’ is central to the MM approach. This is where the vast
majority of pupils’ progress through the curriculum at the same pace, with subject
matter and learning content broken into units with clearly defined goals.
Academically weaker pupils are expected to reach a basic standard in each unit
before the whole class moves on to the next topic together. In the meantime, more
able pupils are encouraged to explore the current learning unit in more depth. (This
is in contrast to standard practise in England, where more able pupils are
accelerated on to learning a new topic). It is thought that this approach reduces the
need to repeatedly revisit material, and promotes depth of understanding over
memorised procedures.
Other features of MM include a systematic approach to mathematical
language (Hoyles 1985), frequent use of objects and pictures to represent
mathematical concepts (Heddens 1986; Sowell 1989), and an emphasis on high
expectations and a ‘growth’ mind-set (Dweck 2006; Boaler 2010). For younger
children, this translates into prominent use of objects and pictures to illustrate
numbers. The approach also prioritises problem solving skills, and encourages deep
understanding of mathematics over procedural knowledge (Skemp 2006). Every
pupil is therefore expected to understand what they are doing, rather than just
learning to repeat routines. This in turn means they are better equipped to apply this
knowledge when solving numerical problems.
Figure 1 provides an example of the Maths Mastery approach. In this, children
are asked:
‘There are three consecutive numbers that add up to 42. What are these numbers?’
Young children in England would typically use an iterative ‘trial and improvement’
method to answer this question. In contrast, Maths Mastery emphasizes the
representation of numbers and connections between them. A prime example of this
is ‘bar-modelling’ as illustrated in Figure 1. (This technique is typically taught to
children from around age 6 or 7). Maths Mastery pupils will recognise that, as the
total is 42, the total without the ‘ones’ (i.e. the grey portions of the bars) equals 39.
Then, if the three sections add up to 39, each must be worth 13 (since 39 ÷ 3 = 13).
As the question states the numbers are sequential, children then immediately reach
7

the answer of 13, 14 and 15. Further details and examples can be found at
www.mathematicsmastery.org/.
<< Figure 1 >>
In the short-term, it is challenging for schools and teachers to move to such a
different approach. Therefore, to assist the transition, ARK offers schools the
following support during the first ‘moving to mastery’ year:
• Training and in-school support. Before the programme begins, school
leaders, maths coordinators and class teachers receive either one or two days
of training. This is followed by two in-school development visits, three multi-
school cluster workshops, and access to an online toolkit. (This includes
detailed information on continuous professional development resources,
assessments and leadership frameworks).
• Curriculum-embedded continuous professional development. Teachers
are supported to put the principles into practice through ‘lesson designs.’
These adapt to the needs of each class via the online toolkit, in the hope that
teachers can use lesson planning time to also develop as professionals.
• Collaboration and peer support. Teachers from different schools are
encouraged to collaborate to develop best practice (Mulford, Silins and
Leithwood 2004). This is via both face-to-face and online interaction, with a
focus upon sharing ideas and supporting one another in applying the
approach.
Within our two RCT’s, schools in receipt of the Maths Mastery treatment had access
to all such support. A timeline of when activities were provided to schools can be
found in Figure 2.
<< Figure 2 >>
It is important to understand that Maths Mastery is designed to take a long term view
of transforming maths achievement. The curriculum is cumulative, thus allowing
every child sufficient time to access age-appropriate concepts and skills. Starting in
Year 1, the main focus is to ensure all pupils have a firm understanding of number.
This then allows them to access and succeed in the other areas of mathematics.
Schools roll out the approach to subsequent year groups, with a view to transform
8
achievement by the end of Year 6 (i.e. five years after the programme was first
introduced in schools). It has not been possible to evaluate the cumulative effect of
Maths Mastery over five years using an experimental design3. Our evaluation
therefore considers the impact of a relatively small (one year) dose of the MM
intervention, immediately at the end of the first year.
3. Data and Methods
Primary school
A clustered Randomised Controlled Trial (RCT) was used to evaluate the Maths
Mastery (MM) primary school programme. Two school cohorts were purposefully
recruited4. Cohort A consisted of 40 schools where the trial was conducted during
the 2012/13 academic year, with a further 50 schools participating in 2013/14
(Cohort B). Half of these 90 schools were randomly assigned to receive the Maths
Mastery programme, with the other 45 schools assigned as controls. (This
randomisation and allocation was conducted by the independent evaluation). All
Year 1 pupils within treatment schools were taught using the Maths Mastery
approach, while the control schools were asked to proceed with ‘business as usual.5’
A total of 90 primary schools containing 5,108 pupils (2,647 treatment and
2,461 control) were therefore initially recruited into the trial. Seven of these schools
(three treatment and four control) dropped out of the study. Moreover, a small
number of children in each school did not complete the post-test, due to either
absence on the day of the post-test (e.g. through sickness) or having moved to
another school. Appendix A examines the issue of attrition in more detail. It
illustrates how attrition from the sample is not random, with lower-achieving children
more likely to drop out than other groups. Nevertheless, given the overall high
response rates (92 percent at the school level and 82 percent at the pupil level) the
impact of this attrition is likely to be small. Our final analysis includes the 2,386 pupils
in the treatment group and 2,244 in the control group for whom both pre and post-
test scores were available.
3 Most ethics committees would judge excluding access to a treatment over a sustained period of time to be unethical. 4 Private schools and those already using the Maths Mastery programme were ineligible to take part in the trial. 5 The protocol for this study is published online at: http://educationendowmentfoundation.org.uk/library/maths-mastery-primary
9

All children were tested at the start and end of the academic year using the
‘Number Knowledge’ test (Okamoto and Case 1996). This is an individually
administered oral test that takes about 10 minutes to complete, and was conducted
by trained staff from a specialist data collection organisation. This test has been
identified as highly predictive of achievement in primary mathematics (Gersten,
Jordan and Flojo 2005). Moreover, Cowan (2011) found this test to have high
reliability, with little evidence of either floor or ceiling effects. Further information on
the Number Knowledge test can be found at
http://clarku.edu/numberworlds/nw_TestInfo.htm). The test was selected for use by
the evaluation team, independently of ARK who developed and delivered the Maths
Mastery programme.
Figure 3 compares the distribution of Number Knowledge test scores for the
treatment and control groups. To facilitate interpretation, we have standardised this
measure to have a mean of zero and a standard deviation of one. Mean test scores
are slightly higher in the treatment group (0.06 standard deviations) compared to the
control group (-0.07 standard deviations), though this difference is not statistically
significant at conventional thresholds (t=1.41; p=0.16). Moreover, there is no
difference in median test scores between the treatment and control groups, both
standing at 0.06. Consequently, balance between the treatment and control groups
seems reasonable, at least in terms of baseline achievement, suggesting that the
randomisation process was satisfactory.
<< Figure 3 >>
The impact of the Maths Mastery primary school intervention will be
determined by the following OLS regression model:
𝑌𝑌𝑖𝑖𝑖𝑖𝑃𝑃𝑃𝑃𝑃𝑃𝑃𝑃 = 𝛼𝛼 + 𝛽𝛽.𝑇𝑇𝑇𝑇𝑇𝑇𝑇𝑇𝑇𝑇𝑖𝑖 + 𝛾𝛾.𝑌𝑌𝑖𝑖𝑖𝑖𝑃𝑃𝑃𝑃𝑃𝑃 + 𝜀𝜀𝑖𝑖𝑖𝑖 (1)
Where:
𝑌𝑌𝑝𝑝𝑃𝑃𝑃𝑃𝑃𝑃 = Child’s post-test score on the Number Knowledge post-test
𝑌𝑌𝑝𝑝𝑃𝑃𝑃𝑃 = Child’s baseline scores on the Number Knowledge pre-test
Treat = A binary variable indicating whether the child was enrolled in a treatment or control school (0 = control; 1 = treatment).
10

ε = Error term (with children clustered within school)
i = child i
j = school j
Note that by controlling for prior achievement, we improve statistical power and
account for the modest difference in prior achievement between treatment and
control groups. To allow for the clustering of pupils within schools, the STATA survey
(svy) command is used to make Huber-White adjustments to the estimated standard
errors. The coefficient of interest from equation (1) is 𝛽𝛽 – is there a positive effect of
the MM treatment?
Secondary school
A similar clustered RCT was used to evaluate the Maths Mastery secondary school
programme. A total of 50 schools were recruited to participate in the trial during the
2013/14 academic year. (Independent schools and those already using the Maths
Mastery programme were again ineligible for the trial). Half (25) of these schools
were randomly allocated by the evaluation team to treatment, with the remaining 25
schools allocated to control. All Year 7 pupils within the treatment schools received
the Maths Mastery programme during the 2013/14 academic year. The control
schools, on the other hand, were asked to proceed with ‘business as usual6.’
All Year 7 children enrolled in one of the 50 participating schools were
considered to be part of the MM trial7. 4,004 children were enrolled in the 25
treatment schools and 3,708 in the 25 control schools. Six schools (two treatment
and four control) dropped out of the study and did not complete the post-test. A small
number of pupils in the 44 participating schools also did not complete the post-test
due to either absence on the day of the test or because they had moved to another
school. Appendix B considers attrition from the secondary school trial in further
detail, and illustrates how lower-achieving, disadvantaged boys were more likely to
have dropped out of the study than other groups. Nevertheless, we continue to find
6 The protocol for this study is published online at http://educationendowmentfoundation.org.uk/projects/maths-mastery-secondary/ The trial has been registered with the independent ISRCTN website at: http://controlled-trials.com/ISRCTN70922140/ .
7 This information was drawn from administrative records and was defined using the autumn school census data of October 3rd 2013.
11
good balance on observable characteristics between treatment and control groups,
even after this non-random non-response has been taken into account (discussed in
further detail below). Moreover, one implication of the high overall school and pupil
response rates (88 percent and 77 percent respectively) is that the impact this has
upon our estimates will be limited. The final pupil sample size was 5,938; 3,251
pupils in the treatment group (81 percent of the original allocation) and 2,687 in the
control group (72 percent of the original allocation).
Children’s Key Stage 2 scores are used as the baseline test. All children in
England sit Key Stage 2 exams at the end of primary school, when they are age 10
or 11. These tests were thus completed by children three months before the Maths
Mastery secondary school RCT began8. The GL Assessment ‘Progress in Maths’
(PiM) 12 test (http://www.gl-assessment.co.uk/products/progress-maths) was used
as a post-test to examine children’s mathematics skills during one week at the end of
the academic year (Monday 30th June 2014 – Friday 4th July 2014). This test was
selected by the evaluation team and was administered using paper-and-pencil tests
by class teachers and took approximately one hour to complete. All scripts were
marked by an independent organisation, who were blind to treatment.
Certain features of the Progress in Mathematics test has important
implications for our analysis and how one interprets the results. Importantly, around
40 percent of PiM test questions were on material not covered as part of the Year 7
MM curriculum9. A clear advantage is therefore that this test is not too closely
aligned to the MM intervention, and hence there is low risk of the treatment group
having been ‘taught to the test’. Yet it also offers the interesting possibility of looking
at potential substitution effects. Specifically, two sub-scales have been created within
the PiM test. One is formed of test questions closely aligned to the MM curriculum
(60 percent of all test questions asked), with the other formed of questions that were
not (the remaining 40 percent of questions). (These questions were chosen by ARK
8 Pupils took these tests after randomisation. However, as these are high stakes tests, it is unlikely that the allocation of their future secondary school would have influenced their performance. (Indeed, the pupils would be very unlikely to know that they would have been part of the Maths Mastery trial at the point they were taking the Key Stage 2 tests). 9 Moreover, despite calculator work not being covered within the Year 7 MM curriculum, the PiM test included both a calculator and a non-calculator section. (Overall test scores are based one-third on the former and two-thirds on the latter). Appendix C investigates pupils’ performance on the calculator versus non-calculator sections of the PiM test.
12
blind to our analysis). It is expected that children in the treatment group will do no
better (and possibly worse) on test questions covering material not part of the MM
curriculum. In contrast, a positive treatment effect is expected on questions where
the MM programme places more time, effort and emphasis10. We investigate
whether this holds true within our analyses. (Appendix C additionally considers the
effect of the treatment on the calculator versus non-calculator section of the PiM
test).
Table 1 investigates balance between treatment and control groups in terms
of observable baseline characteristics. Figures before accounting for attrition can be
found in the panel on the left; those after accounting for attrition can be found in the
panel on the right. (We focus upon the ‘including attrition’ figures in our discussion
below). All information has been drawn directly from administrative data.
Standardised Key Stage 2 mathematics test scores (the pre-test conducted
approximately three months before the intervention began) equals 0.022 for the
control group and 0.036 for the treatment group; a small and insignificant difference
of just 0.014 standard deviations (t = 0.21; p = 0.83). Similarly, there is a difference
of just 0.02 standard deviations in Key Stage 2 reading test scores and Key Stage 1
Average Point Scores. These data also include some limited information on the
family background of children - in particular whether the child is eligible for Free
School Meals (an indicator of low income - see Hobbs and Vignoles 2013). There
are similar proportions of children eligible for Free School Meals (26 percent versus
28 percent) in both groups. There are also similar proportions of boys and girls (52
versus 49 percent) allocated to treatment and control. None of these differences are
statistically significant at conventional thresholds. Indeed, the only statistically
significant difference is the greater number of Asian children observed in treatment
schools (26 percent) than control schools (13 percent). Nevertheless, the overall
message is that good balance between treatment and control groups has been
achieved.
The impact of the MM secondary school intervention is determined by the
following OLS regression model:
10 Of course it is also possible that the MM programme impacts positively on fundamental mathematical understanding and hence children may do better on both parts of the test.
13
𝑌𝑌𝑖𝑖𝑖𝑖𝑃𝑃𝑃𝑃𝑃𝑃𝑃𝑃 = 𝛼𝛼 + 𝛽𝛽.𝑇𝑇𝑇𝑇𝑇𝑇𝑇𝑇𝑇𝑇𝑖𝑖 + 𝛾𝛾.𝑌𝑌𝑖𝑖𝑖𝑖𝑃𝑃𝑃𝑃𝑃𝑃 + 𝛿𝛿.𝐶𝐶𝑖𝑖𝑖𝑖 + 𝜀𝜀𝑖𝑖𝑖𝑖 (2)
Where:
𝑌𝑌𝑝𝑝𝑃𝑃𝑃𝑃𝑃𝑃 = Child’s post-test score on the Progress in Maths test
𝑌𝑌𝑝𝑝𝑃𝑃𝑃𝑃 = Child’s baseline scores on the Key Stage 2 and Key Stage 1 tests
Treat = A binary variable indicating whether the child was enrolled in a treatment or
control school (0 = control; 1 = treatment).
C = A series of additional control variables potentially associated with the outcome
(e.g. gender, Free School Meals eligibility, ethnicity).
ε = Error term (with children clustered within school)
i = child i
j = school j
Baseline test scores and other covariates are included as controls to increase
statistical power. Huber-White adjustments are again made to the estimated
standard errors to account for the clustering of children within schools.
Meta-analysis
The primary and secondary school trials have both been designed to detect a
reasonably sizeable effect, particularly given the relatively small one year dose of the
MM intervention. Specifically, assuming that (i) approximately half the variance in
post-test scores can be explained by baseline covariates; (ii) equal cluster sizes of
30 (primary) or 200 (secondary) pupils per school and (iii) an inter-cluster correlation
of approximately 0.15, then each trial could independently detect an effect of around
0.20 standard deviations. This is bigger than the apparent effect of other similar
changes that have previously been made to the school curriculum in England, such
as The Literacy Hour. (This altered the English curriculum in primary schools in the
late 1990’s to focus more upon basic reading skills. Machin and McNally 2008
reported an effect size of 0.08 standard deviations for a one year exposure to this
particular intervention).
14
Whilst recognising the limitations with meta-analyses, we nevertheless also
present a pooled estimate of the MM treatment. (The primary and secondary school
trials are assigned equal weight in this meta-analysis, with overall mathematics test
scores being the outcome of interest11). This has the advantage of boosting
statistical power and reducing the impact of sampling variation upon estimates.
However, a well-known limitation of such meta-analyses is that they combine
information from RCT’s that differ in non-trivial ways. In our application, this includes
the target population (primary versus secondary school pupils) and the outcome test
used (Number Knowledge versus Progress in Maths). Consequently, as Walker,
Hernandez and Kattan (2008) argue, such meta-analyses may therefore be seen as
a second-best alternative to the ‘gold standard’ of a single, highly powered trial. In
particular, there is more uncertainty with regards the population of interest (for whom
the effect size applies to) and the specificity of the outcome the programme
influences. We therefore present both the individual results from the two trials as well
as the combined meta-analysis.
4. Results
Primary school
Table 2 presents estimates from the OLS regression model examining the impact of
the primary school MM treatment. Results are presented for (a) all schools enrolled
in the trial and (b) separately for cohorts A and B. The estimated treatment effect is
approximately 0.10 standard deviations, with an almost identical figure for each of
the two cohorts. This reaches statistical significance at the ten percent level (t = 1.82;
p = 0.07), with the 95 percent confidence interval ranging from -0.01 to +0.21. There
is thus some evidence that introducing this particular East Asian teaching method
into England’s primary schools has had a positive effect upon children’s mathematics
skills. But the reasonably wide confidence interval suggests there is also a degree of
uncertainty around this result.
<< Table 2 >>
11 For the secondary school trial, the total test score will include children’s performance on both the calculator and non-calculator sections of the PiM test.
15
Figure 4 presents quantile regression estimates of equation (1), thus examining
heterogeneity in the treatment effect across the post-test distribution12. The dashed
horizontal line provides the OLS estimate, while circular markers gives the quantile
regression results. Grey shading indicates statistical significance at the ten percent
level.
<< Figure 4 >>
Estimates in the bottom part of the post-test distribution are generally a little smaller
than those in the top (around 0.08 standard deviations at p25 compared to 0.13 at
p75). Nevertheless, Figure 4 does little to suggest that the effect of the MM
programme was concentrated in one particular part of the mathematics achievement
distribution, though again we note there is some uncertainty around these estimates
(due, in particular, to sampling variation). In additional analysis, we also tested for an
interaction between the MM treatment and children’s baseline mathematics test
scores. The magnitude of this interaction was very small (less than 0.01 standard
deviations) and statistically insignificant at conventional thresholds (t=0.31; p=0.76).
Secondary school
Estimates for the MM secondary school trial can be found in Table 3. The left-hand
most column refers to results when total test scores are the outcome. The middle
and right hand columns then divides this into performance on questions that were
and were not covered within the MM curriculum.
<< Table 3 >>
Table 3 suggests that the MM secondary school intervention was associated with a
small increase in overall mathematics test scores (effect size = 0.06) though this did
not reach statistical significance at conventional thresholds. As perhaps expected,
the MM intervention did not have any impact upon children’s performance on
questions that covered topics outside the MM curriculum, with the estimated
treatment effect essentially being zero. Thus, despite substituting away from these
areas, there is no evidence that the reduction in children’s learning time had any
12 Standard errors for the quantile regression estimates have been produced by bootstrapping at the cluster (school) level.
16
detrimental impact upon their ability in these areas. In contrast, the treatment had a
more pronounced effect upon material that was focused upon within the MM
curriculum (effect size = 0.10), just reaching statistical significance at the five percent
level (t = 2.15; p = 0.04). This effect is of a similar magnitude to that found for overall
test scores in the primary school trial (0.099 standard deviations).
In additional analysis, we examined whether there was an interaction between
the MM treatment in secondary schools and (i) gender, (ii) Key Stage 2 (baseline)
test scores and (iii) eligibility for Free School Meals. All interactions were small and
did not approach statistical significance at either the five or ten percent level. This
held true for both overall test scores and sub-components of the PiM test. Quantile
regressions were also estimated, with estimates in the bottom part of the post-test
distribution generally a little bigger than those in the top (around 0.13 standard
deviations at p25 compared to 0.07 at p75). Nevertheless, overall evidence of
heterogeneity in the treatment effect across the achievement distribution was
generally rather weak.
Meta-analysis
The results presented thus far have pointed towards a small, positive effect of the
MM intervention. However, neither trial was sufficiently powered for the estimated
treatment effect to reach statistical significance at the five percent level. We
therefore also perform a meta-analysis of the two trials, combining information from
each to boost statistical power. Results from this meta-analysis suggest that a one-
year dose of Maths Mastery programme leads, on average, to a 0.077 standard
deviation increase in children’s mathematics test scores. This pooled estimate is
statistically significant at the five percent level (t =2.16; p = 0.03). This result of
course rests upon the assumption that it is reasonable to combine estimates across
the two trials, as discussed above.
5. Cost-benefit analysis
To calculate the economic costs and benefits of the MM intervention, we broadly
follow the approach of Machin and McNally (2008). Information on the cash costs of
schools implementing Maths Mastery have been provided by the charity responsible
for delivering the programme (ARK).
17

For two-form primary schools, there is an upfront cost of £6,000 for
participating in the programme. (This is an ‘at cost’ price charged by ARK to cover
basic infrastructure). Seven days of staff time are required for training; one day for
the headmaster, two days for the head of mathematics, and two days for two
mathematics teachers. To calculate the cost of headmasters’ time, we take the
median point on the headmaster pay scale in England and Wales (£75,22213). This
is then divided by 230 (the approximate number of working days in a year) to give a
headmaster day rate of £32714. We then inflate this figure by a fifth to allow for other
costs not directly incorporated into headmasters’ salaries (e.g. employer
contributions to pensions) giving a total cost of £39215. Analogous calculations have
been made for the head of mathematics (two days training at a final day rate of
£251)16 and the class teachers (a total of four days training at a final day rate of
£141)17. Total training costs therefore amount to £1,460. The total annual cost to the
primary school is £7,460. We then estimate the average number of pupils per
primary school as 57; the number of pupils initially enrolled into the primary trial
(5,108) divided the number of primary schools initially enrolled (90). The ‘per pupil’
cost of delivering the primary school intervention was therefore just £131 for the
year. So long as the programme does not negatively influence any other outcome,
only minimal economic returns will be needed to offset this low per pupil cost.
A similar exercise has been completed for secondary schools. The upfront
cost to a school of participating in the programme is £6,000 per annum. Ten days of
staff time is required for training; half a day for the headmaster; two and a half days
for the head of maths and one day for each maths teacher (there were on average
seven maths teachers per schools). Day rates were calculated as above. Thus total
training costs are therefore equal to £1,740 per school per annum. This gives a total
cost per secondary school of £7,740. There was, on average, 154 pupils per
13 This information has been drawn from http://www.education.gov.uk/get-into-teaching/about-teaching/salary/pay-and-benefits 14 The headmaster pay scale in England and Wales (outside of London) ranges from £107,210 to £43,232. We have assumed headmasters work 46 five day weeks per year (with the other six weeks as holiday). 15 We appreciate that this is a rather crude way of accounting for such additional costs. However, using a substantially higher or lower figure here does not radically alter our results. 16 We have assumed the head of maths to be on the ‘leading practitioner’ pay scale, which ranges from £38,215 to £58,096 (median £48,155). 17 It is assumed the teacher’s will be on the ‘main’ pay scale, which ranges from £22,023 to £32,187 (median 27,105).
18

secondary school (7,712 children across the 50 initially recruited schools). Thus the
per pupil cost equals £50 per annum.
These figures are first of all used to calculate the Cost Effectiveness Ratio
(CER); how much does it cost to raise children’s mathematics test scores by 0.01
standard deviations? Table 4 presents three different estimates, using either
‘optimistic’, ‘baseline’ or ‘conservative’ assumptions (these are explained in more
detail below). Using the most conservative numbers (small causal effect of the MM
programme and high costs per pupil) it costs £24 per 0.01 standard deviation
increase in children’s maths test scores. The analogous ‘lower bound’ figure using
‘optimistic’ assumptions (high causal effect of the programme and low per pupil cost)
is just £5. Although this range is quite wide (reflecting the inherent uncertainty in
such analyses), this should not distract from the general message that, under all
scenarios, the CER is relatively low.
<< Table 4 >>
Next, we proxy the economic benefit of the MM intervention using predicted
labour market earnings. Specifically, we estimate the impact of higher age 10
mathematics test scores on net labour market earnings at age 26, 30, 34 and 38
using the British Cohort Study. (This is a nationally representative longitudinal survey
of all individuals born in Great Britain during one particular week in 1970). This is
done via estimation of the following median regression model:
𝑊𝑊𝑇𝑇 = 𝛼𝛼 + 𝛽𝛽.𝑀𝑀10 + 𝛾𝛾.𝐶𝐶 + 𝛿𝛿. 𝐼𝐼𝐼𝐼10 + 𝜆𝜆.𝐸𝐸𝐸𝐸34 + 𝜀𝜀 (3)
Where:
W = Net labour market earnings (inflated into 2014 prices)
𝑀𝑀10= Mathematics test scores at age 10 (standardised to mean 0 and standard deviation 1)
C = A vector of basic control variables (gender, mother/father education and geographic location)
𝐼𝐼𝐼𝐼10= A measure of non-verbal IQ at age 10
𝐸𝐸𝐸𝐸34= Final level of educational attainment achieved by age 34
T = Age t
19
Three specifications are estimated. The first includes just age 10 mathematics test
scores and basic controls (i.e. 𝛿𝛿 and 𝜆𝜆 are constrained to 0). The second also
includes non-verbal IQ, while specification 3 adds final level of educational
attainment at age 34. Note that as the latter is likely to be partly determined by age
10 mathematics test scores, estimates from specification 3 may be treated as a
lower bound. In all three models the parameter of interest is 𝛽𝛽 – which indicates how
much median wages increase at age t given a one standard deviation increase in
age 10 mathematics test scores (conditional upon the other factors included in the
model). Estimates can be found in Table 5.
<< Table 5>>
Under specification 1, a one standard deviation increase in age 10 maths scores is
associated with a £2,819 increase in age 26 median wages. The analogous figures
at age 30 (£1,782) and age 34 (£2,482) are somewhat lower, before returning to a
similar level by age 38 (£2,943). As expected, the size of the estimated returns
declines at all ages when non-verbal IQ (specification 2) and the potentially
endogenous highest qualification at age 34 (specification 3) variables are included in
the model. Nevertheless, the same broad pattern of results is observed, with
somewhat higher returns observed in the age 26 and age 38 survey waves.
Moreover, across all specifications, the labour market rewards to higher age 10
maths skills remains substantial. For instance, median wages increase by around
£1,000 per annum for each standard deviation increase in age 10 maths scores,
even once respondents’ highest qualification at age 34 has been controlled.
The right hand side of Table 5 multiplies different estimates of the MM
treatment effect by the 𝛽𝛽 coefficients. This provides an indication of the nominal
(non-discounted) benefit of the MM programme at age t. It is clear that nominal
annual returns are sizeable. Using specification 2 and the meta-analysis effect size
of 0.077, we estimate the MM intervention to raise earnings by approximately £150
to £200 per year. Indeed, even conservative estimates (specification 3 and a MM
effect size of 0.055) puts nominal per pupil annual returns at £50 per annum. These
figures are non-trivial, given the low per-pupil costs reported above.
To formally investigate the likely cost-effectiveness of the MM programme, we
provide estimates of the NPV and IRR under three sets of assumptions:
20

Optimistic
• Estimated earnings returns to age 10 mathematics scores based upon specification 1 (high causal impact of mathematics on earnings)
• Effect of the MM programme = 0.099 standard deviations • Discount rate of two percent per annum • Cost per pupil = £50 (based upon secondary school)
Baseline
• Estimated earnings returns to age 10 mathematics scores based upon specification 2 (medium causal impact of mathematics on earnings)
• Effect of the MM programme = 0.077 standard deviations • Discount rate of three percent per annum • Cost per pupil = £91 (simple average of primary and secondary school)
Conservative
• Estimated earnings returns to age 10 mathematics scores based upon specification 3 (low causal impact of mathematics on earnings)
• Effect of the MM programme = 0.055 standard deviations • Discount rate of five percent per annum • Cost per pupil = £131 (based upon primary school)
Under all scenarios, we assume that the Maths Mastery intervention takes place at
age 10, all individuals work a 45 year career between ages 20 and 65, and there is
continuous labour market participation18. Results can be found in Figure 5.
<< Figure 5>>
The results in Figure 5 imply that the investment in Maths Mastery yields a positive
economic return. This holds true even under conservative assumptions regarding (a)
the causal impact of improved mathematics on earnings, (b) the effect of the
programme on children’s mathematics achievement and (c) the discount rate. In all
cases the Net Present Value is positive (ranging from £525 to £6,734), while the
Internal Rate of Return on this investment (ranging from 8 percent to 33 percent)
always compares relatively favourably to market rates of interest. Moreover,
18 We also assume that the estimated earnings impact holds every year between the upper and lower age bounds. For instance, under specification 3, we assume that a one standard deviation increase in maths test scores increases annual earnings by £910 each year between the ages 26 and 30. Then, between ages 30 and 34, this annual return decreases slightly to £724. The value at age 38 (£1,392) is assumed to hold through to retirement at age 65.
21

depending upon the assumptions made, the programme will have repaid its costs
between 11 and 15 years after it has been implemented.
There are, of course, significant limitations to cost benefit analyses such as
these. Costs are measured with error, with certain resources unlikely to have been
fully accounted. We also assume that individuals work continuously for 45 years; this
will not always be the case (particularly for women and for lower achievers).
Moreover, the assumptions made also require the labour market returns to improved
mathematics skills to remain constant over time. Clearly, in general equilibrium, if
sufficient numbers of children improve their mathematics achievement, the price
employers will be willing to pay for such skills may decline. Finally, we are also
assuming that our meta-analysis estimate is plausible, given the similarity of the two
trials, and the fact that a similar effect size is found for both (albeit neither individually
reaching statistical significance at the 5% level). Despite these limitations we note
that, even under quite conservative assumptions, Maths Mastery appears to provide
a reasonable return on investment. Maths Mastery thus shows promise as a cost-
effective way to raise mathematics achievement in England’s schools.
6. Conclusions
East Asian economies dominate the top of important international educational
achievement rankings. Two of the most frequently asked questions by education
policymakers have therefore become ‘what is behind these countries phenomenal
educational success’ and ‘what can we in the West do to catch up’? Although there
are likely to be a wide range of explanations for these countries’ success (Jerrim and
Choi 2013; Jerrim 2014), the impact and implementation of ‘East Asian teaching
methods’, often loosely and ill-defined, have particularly caught Western
policymakers’ attention. Yet despite this interest, there is currently little evidence as
to whether the introduction of any particular East Asian teaching method would
represent an improvement over the current status quo in many Western countries.
This study provides evidence from two RCT’s to start to fill this gap in the literature. It
provides an estimate of the causal impact of the ‘Maths Mastery’ programme – a
22

method of teaching mathematics to school children modelled on the approach used
in Singapore. By combining evidence from across two Randomised Controlled Trials,
we find consistent evidence of small yet positive treatment effects (reaching the 5
percent significance level within our meta-analysis). The subsequent cost-benefit
analysis reveals that, even under conservative assumptions, such an approach is
likely to offer non-trivial economic returns (largely due to the low costs per pupil).
These findings have potentially important implications for education policy and
practice. On the one hand, the small effect size suggests it is unlikely that
widespread introduction of this particular East Asian teaching method would
springboard Western countries like England to the top of the PISA educational
achievement rankings. In other words, it cannot be seen as a ‘silver bullet’ that will
guarantee a country success in mathematics. Yet this does not mean that
implementing this teaching method is not a worthwhile investment to make. Even
small effect sizes can be economically efficient, with the combination of several such
interventions potentially having a large impact overall. Thus, although we advise
policymakers that further evidence is still needed, the Maths Mastery programme
nevertheless shows signs of promise, and should now be tested over a longer time
horizon and a greater number of schools.
This recommendation should, of course, be interpreted in light of the
limitations of this study. Four particular issues stand out. First, we have estimated
the effect of a small (one year) ‘dose’ of the Maths Mastery programme, with our
evaluation conducted after the first year it has been implemented in schools. More
evidence is needed on its impact after teachers have become more familiar with its
novel approach, and after children have been exposed to the programme for a
prolonged period of time. Second, impact has only been measured straight after the
intervention has finished. Longer-term measurement of the lasting impact of this
teaching method is needed. Third is the issue of external validity; schools were
purposefully recruited into the two trials and were not randomly sampled from a well-
defined population. Although this limitation is common to many RCT’s, further work
should consider the extent to which our findings generalise to the population of
England’s schools. (Appendix D explores the issue of external validity in more detail,
and illustrates how our samples contain a disproportionate number of lower
achieving children from disadvantaged backgrounds). Finally, we remind the reader
23
that statistical significance was only reached within our meta-analysis, and that
individually the primary and secondary school trials were lacking the necessary
statistical power. Future work should look at ways to improve the precision of
estimates at different stages of the Maths Mastery programme (e.g. primary versus
secondary school), including through the use of quasi-experimental methods.
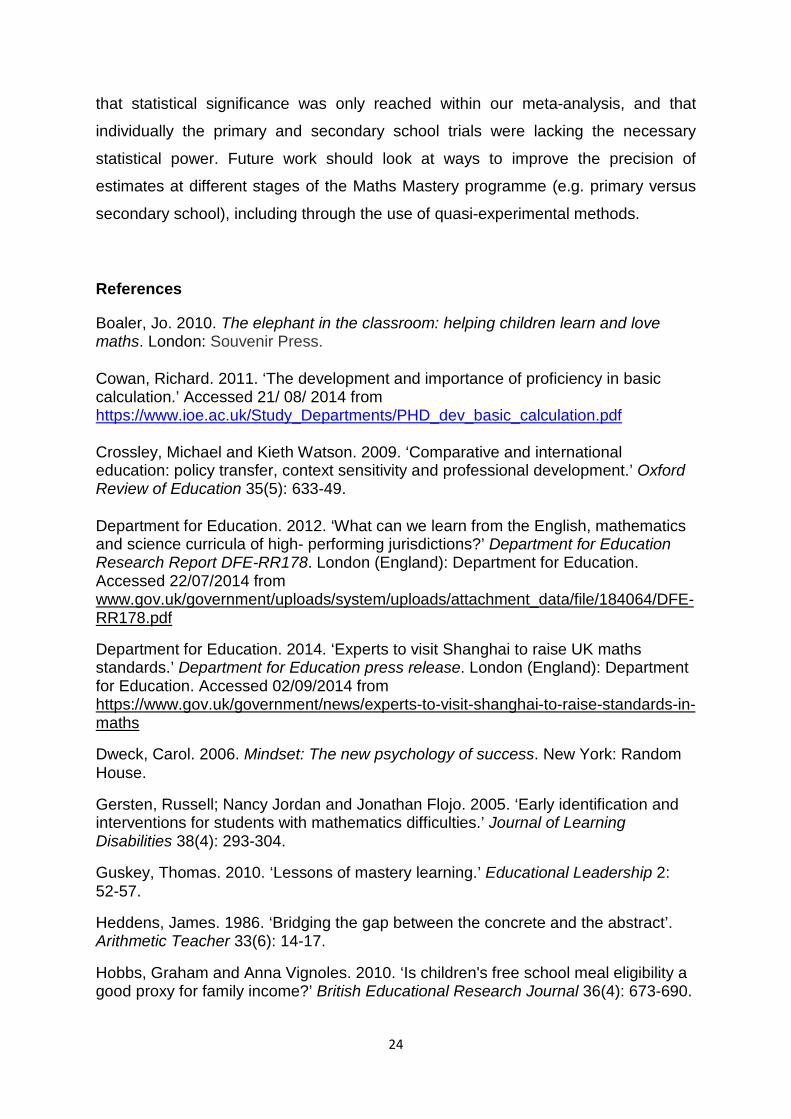
References
Boaler, Jo. 2010. The elephant in the classroom: helping children learn and love maths. London: Souvenir Press.
Cowan, Richard. 2011. ‘The development and importance of proficiency in basic calculation.’ Accessed 21/ 08/ 2014 from https://www.ioe.ac.uk/Study_Departments/PHD_dev_basic_calculation.pdf
Crossley, Michael and Kieth Watson. 2009. ‘Comparative and international education: policy transfer, context sensitivity and professional development.’ Oxford Review of Education 35(5): 633-49.
Department for Education. 2012. ‘What can we learn from the English, mathematics and science curricula of high- performing jurisdictions?’ Department for Education Research Report DFE-RR178. London (England): Department for Education. Accessed 22/07/2014 from www.gov.uk/government/uploads/system/uploads/attachment_data/file/184064/DFE-RR178.pdf
Department for Education. 2014. ‘Experts to visit Shanghai to raise UK maths standards.’ Department for Education press release. London (England): Department for Education. Accessed 02/09/2014 from https://www.gov.uk/government/news/experts-to-visit-shanghai-to-raise-standards-in-maths
Dweck, Carol. 2006. Mindset: The new psychology of success. New York: Random House.
Gersten, Russell; Nancy Jordan and Jonathan Flojo. 2005. ‘Early identification and interventions for students with mathematics difficulties.’ Journal of Learning Disabilities 38(4): 293-304.
Guskey, Thomas. 2010. ‘Lessons of mastery learning.’ Educational Leadership 2: 52-57.
Heddens, James. 1986. ‘Bridging the gap between the concrete and the abstract’. Arithmetic Teacher 33(6): 14-17.
Hobbs, Graham and Anna Vignoles. 2010. ‘Is children's free school meal eligibility a good proxy for family income?’ British Educational Research Journal 36(4): 673-690.
24

Hoyles, Celia. 1985. ‘What is the point of group discussion in mathematics.’ Educational Studies in Mathematics 16(2): 205-214. Jerrim, John and Alvaro Choi. 2014. ‘The mathematics skills of school children: how does the UK compare to the high performing East Asian nations?’ Journal of Education Policy 29(3): 349-76.
Jerrim, John. 2014. ‘Why do East Asian children perform so well in PISA? An investigation of Western-born children of East Asian descent.’ DoQSS working paper 14/16. Accessed 16/10/2014 from https://ideas.repec.org/p/qss/dqsswp/1416.html
Machin, Stephen and Sandra McNally. 2008. ‘The literacy hour.’ Journal of Public Economics 92: 1441 –62.
Micklewright, John; John Jerrim, Anna Vignoles, Andrew Jenkins, Rebecca Allen, Sonia Ilie, Elodie Bellarbre, Fabian Barrera and Christopher Hein. 2014. ‘Teachers in England’s secondary schools: Evidence from TALIS 2013.’ Department for Education Research Report DFE-RR302. Accessed 24/10/2014 from https://www.gov.uk/government/publications/teachers-in-secondary-schools-evidence-from-talis-2013 Mulford, William; Halia Silins and Kenneth Leithwood. 2004. Leadership for organisational learning and student outcomes. Springer. Okamoto, Yukari and Robbie Case. 1996. ‘Exploring the microstructure of children’s central conceptual structures in the domain of number.’ Monographs of the Society for Research in Child Development 61(1-2): 27–59. Skemp, Richard. 2006. ‘Relational understanding and instrumental understanding.’ Mathematics Teaching 12(2) 88-95. Sowell, Evelyn. 1989. ‘Effects of manipulative materials in mathematics instruction’. Journal for Research in Mathematics Education 20(5): 498-505.
Walker, Esteban; Adrian Hernandez and Michael Kattan. 2008. ‘Meta-analysis: Its strengths and limitations.’ Cleveland Clinical Journal of Medicine 75(6): 431-39.
25

Table 1. Balance between treatment and control groups: Maths Mastery secondary school trial
As randomised Including attrition
Control Treat T - C Control Treat T - C Eligible for FSM No % 72 70 -2 74 72 -2 Yes % 28 30 2 26 28 2 Gender
Female % 46 49 3 48 51 3 Male % 54 51 -3 52 49 -3 Ethnic Group
White % 50 47 -3 51 47 -4 Asian % 13 26 13* 13 26 13* Black % 21 16 -5 21 17 -4 Mixed % 8 7 -1 7 6 -1 Chinese % 0 0 0 0 0 0 Other / unclassified % 7 4 -3 7 4 -3
Standardised KS1 APS 0.007 -0.006 -0.013 0.041 0.065 0.024
Standardised KS2 mathematics score 0.014 -0.013 -
0.027 0.022 0.036 0.014
Standardised KS2 reading score -0.001 0.001 0.002 0.025 0.045 0.020 School n 25 25 21 23 Pupil n 3,708 4,004 2,687 3,251
Notes: Authors’ calculations using the National Pupil Database. KS1 APS and KS2 scores have been standardised to have a mean of 0 and standard deviation of 1 (across pupils within the 50 schools as initially randomised). Figures reported for children where data available. * and ** indicate significant difference between treatment and control groups at the 10 and 5 percent level respectively.
26

Table 2. The impact of the Maths Mastery primary school programme on children’s ‘Number Knowledge’ maths test scores
Cohort A Cohort B Overall Beta SE Beta SE Beta SE Intervention Group (Ref: Control)
Treatment 0.091 0.075 0.105 0.078 0.099* 0.054 Pre-test score 0.695** 0.024 0.711** 0.025 0.704** 0.016 Constant -0.055 0.052 -0.048 0.050 -0.051 0.036
N 1,868 2,308 4,176
Notes: Authors’ calculations. Dependent variable is total Number Knowledge score (standardised to mean 0 and standard deviation 1). Treatment effect presented in the column labelled ‘Beta.’ SE stands for standard error. * and ** indicate statistical significance at the 10 percent and 5 percent levels. Standard errors clustered at the school level.
27

Table 3. The impact of the Maths Mastery secondary school programme on children’s ‘Progress in Maths’ test scores
Total Progress in Maths score
Not covered in MM Covered in MM
Beta SE Beta SE Beta SE Intervention Group (Ref: Control)
Treatment 0.055 0.046 -0.003 0.041 0.100** 0.047 Key Stage 1 mathematics (Ref: Level 1)
Level 2a 0.21** 0.05 0.208** 0.054 0.222** 0.049 Level 2b 0.14** 0.04 0.161** 0.045 0.130** 0.041 Level 2c 0.06* 0.03 0.077** 0.037 0.046 0.034 Level 3 0.32** 0.06 0.305** 0.066 0.351** 0.064 Key Stage 1 Average Points Score 0.09** 0.02 0.092** 0.023 0.080** 0.021 Key Stage 2 Mathematics test score 0.66** 0.02 0.599** 0.019 0.667** 0.018
Key Stage 2 Mathematics test score squared 0.12** 0.01 0.080** 0.009 0.139** 0.010
Key Stage 2 English score 0.11** 0.01 0.107** 0.015 0.106** 0.015 Free School Meals (Ref: No) Yes -0.10** 0.02 -0.105** 0.021 -0.092** 0.021 Ethnic Group (Ref: Other) Asian -0.08 0.06 -0.094* 0.054 -0.070 0.071 Black -0.19** 0.05 -0.200** 0.043 -0.170** 0.060 Chinese 0 0.21 0.196 0.142 0.167* 0.091 Mixed -0.03 0.06 0.021 0.060 -0.058 0.063 Unclassified 0.08 0.09 0.078 0.116 0.059 0.091 White -0.08 0.05 -0.041 0.048 -0.103* 0.061 Gender (Ref: Female) Male -0.11** 0.02 -0.122** 0.023 -0.090** 0.022 English as Additional Language (Ref: No)
Yes 0.05** 0.03 0.067** 0.029 0.024 0.029 Constant -0.15** 0.06 -0.092 0.059 -0.180** 0.074 N 5,919 5,888 5,884
Notes: Authors’ calculations. Treatment effect presented in the column labelled ‘Beta.’ SE stands for standard error. * and ** indicate statistical significance at the 10 percent and 5 percent levels. Standard errors clustered at the school level.
28
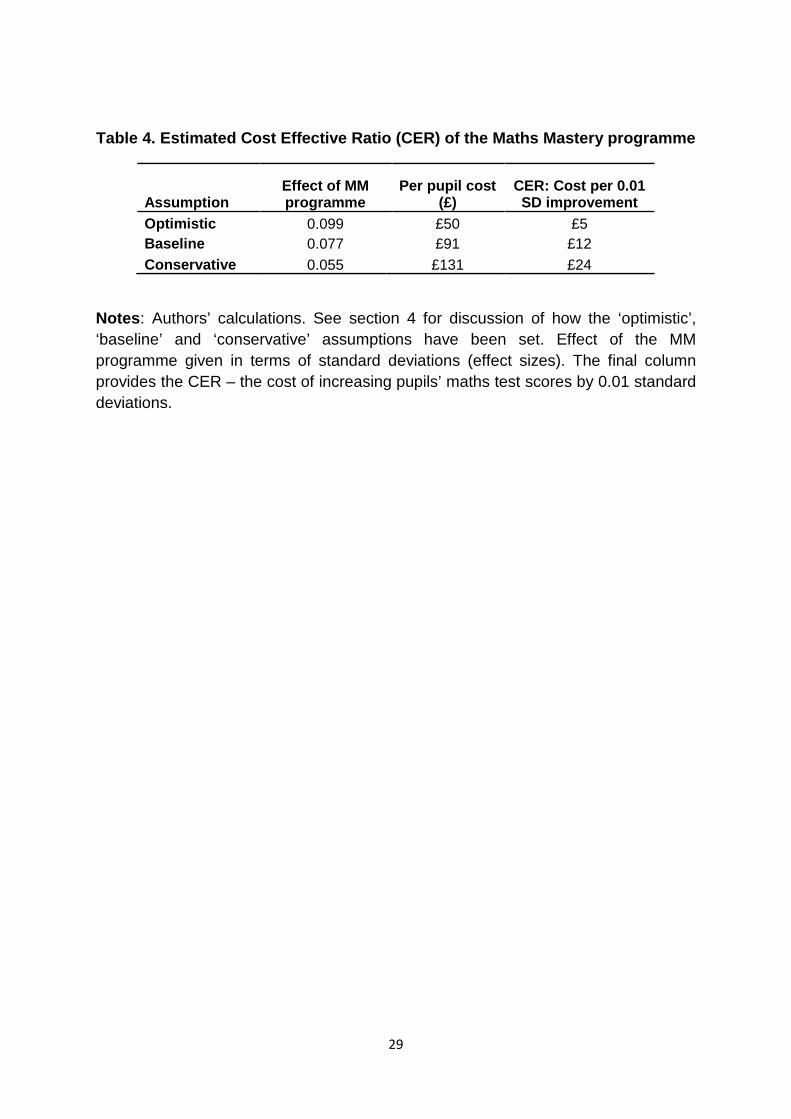
Table 4. Estimated Cost Effective Ratio (CER) of the Maths Mastery programme
Assumption Effect of MM programme
Per pupil cost (£)
CER: Cost per 0.01 SD improvement
Optimistic 0.099 £50 £5 Baseline 0.077 £91 £12 Conservative 0.055 £131 £24
Notes: Authors’ calculations. See section 4 for discussion of how the ‘optimistic’, ‘baseline’ and ‘conservative’ assumptions have been set. Effect of the MM programme given in terms of standard deviations (effect sizes). The final column provides the CER – the cost of increasing pupils’ maths test scores by 0.01 standard deviations.
29
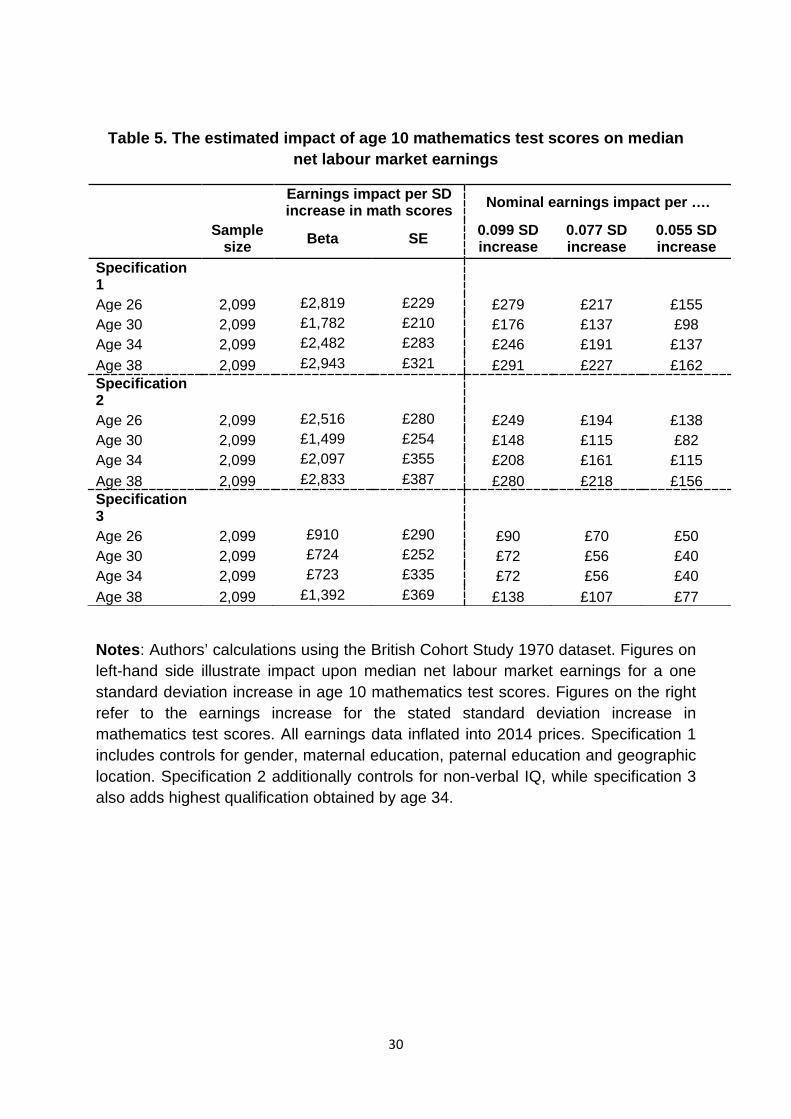
Table 5. The estimated impact of age 10 mathematics test scores on median net labour market earnings
Earnings impact per SD increase in math scores Nominal earnings impact per ….
Sample size Beta SE 0.099 SD
increase 0.077 SD increase
0.055 SD increase
Specification 1
Age 26 2,099 £2,819 £229 £279 £217 £155 Age 30 2,099 £1,782 £210 £176 £137 £98 Age 34 2,099 £2,482 £283 £246 £191 £137 Age 38 2,099 £2,943 £321 £291 £227 £162 Specification 2
Age 26 2,099 £2,516 £280 £249 £194 £138 Age 30 2,099 £1,499 £254 £148 £115 £82 Age 34 2,099 £2,097 £355 £208 £161 £115 Age 38 2,099 £2,833 £387 £280 £218 £156 Specification 3 Age 26 2,099 £910 £290 £90 £70 £50 Age 30 2,099 £724 £252 £72 £56 £40 Age 34 2,099 £723 £335 £72 £56 £40 Age 38 2,099 £1,392 £369 £138 £107 £77
Notes: Authors’ calculations using the British Cohort Study 1970 dataset. Figures on left-hand side illustrate impact upon median net labour market earnings for a one standard deviation increase in age 10 mathematics test scores. Figures on the right refer to the earnings increase for the stated standard deviation increase in mathematics test scores. All earnings data inflated into 2014 prices. Specification 1 includes controls for gender, maternal education, paternal education and geographic location. Specification 2 additionally controls for non-verbal IQ, while specification 3 also adds highest qualification obtained by age 34.
30
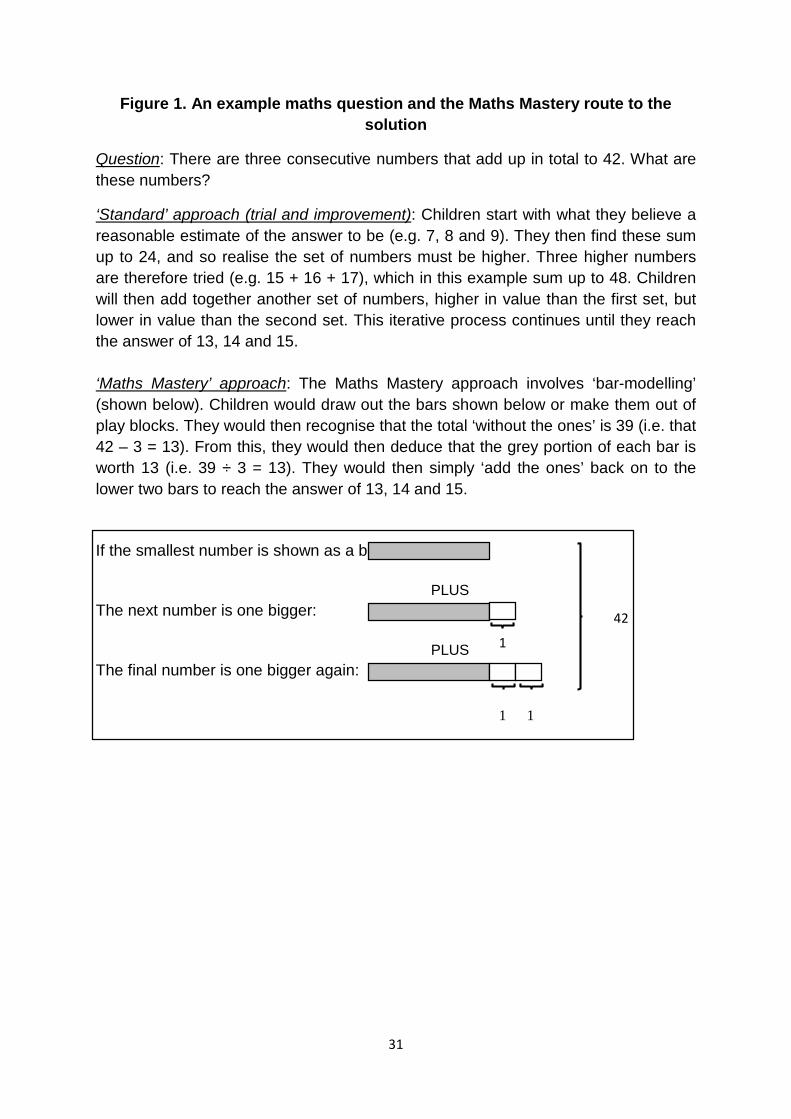
Figure 1. An example maths question and the Maths Mastery route to the solution
Question: There are three consecutive numbers that add up in total to 42. What are these numbers?
‘Standard’ approach (trial and improvement): Children start with what they believe a reasonable estimate of the answer to be (e.g. 7, 8 and 9). They then find these sum up to 24, and so realise the set of numbers must be higher. Three higher numbers are therefore tried (e.g. 15 + 16 + 17), which in this example sum up to 48. Children will then add together another set of numbers, higher in value than the first set, but lower in value than the second set. This iterative process continues until they reach the answer of 13, 14 and 15. ‘Maths Mastery’ approach: The Maths Mastery approach involves ‘bar-modelling’ (shown below). Children would draw out the bars shown below or make them out of play blocks. They would then recognise that the total ‘without the ones’ is 39 (i.e. that 42 – 3 = 13). From this, they would then deduce that the grey portion of each bar is worth 13 (i.e. 39 ÷ 3 = 13). They would then simply ‘add the ones’ back on to the lower two bars to reach the answer of 13, 14 and 15. If the smallest number is shown as a bar: PLUS The next number is one bigger: PLUS The final number is one bigger again:
42
1
1 1
31
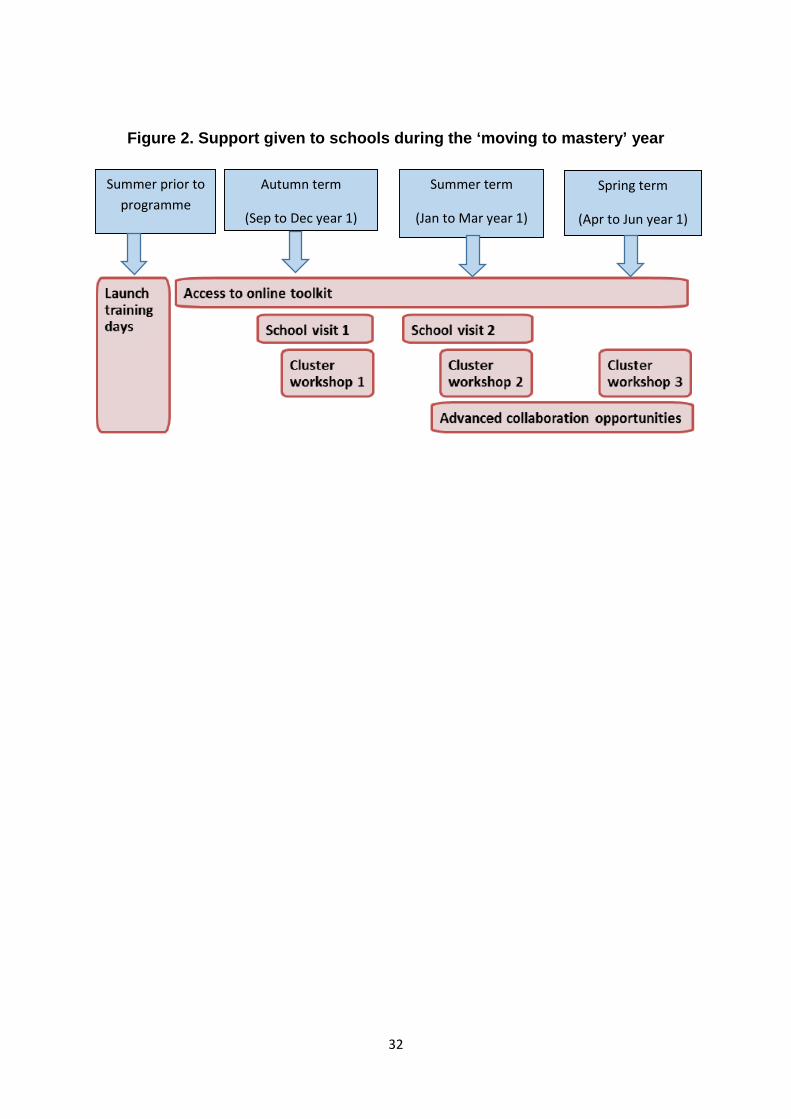
Figure 2. Support given to schools during the ‘moving to mastery’ year
Summer prior to programme
Autumn term
(Sep to Dec year 1)
Spring term
(Apr to Jun year 1)
Summer term
(Jan to Mar year 1)
32

Figure 3. A comparison of (standardised) baseline test scores between the primary school treatment and control groups
Notes: Authors’ calculations. Solid black line presents the baseline test score distribution for the control group. The dashed red line refers to the treatment group. Mean (median) scores equal -0.07 (0.06) for the control group and 0.06 (0.06) for the treatment group.
0.1
.2.3
.4.5
Den
sity
-4 -2 0 2 4Standardised Test Score
Control Treatment
33
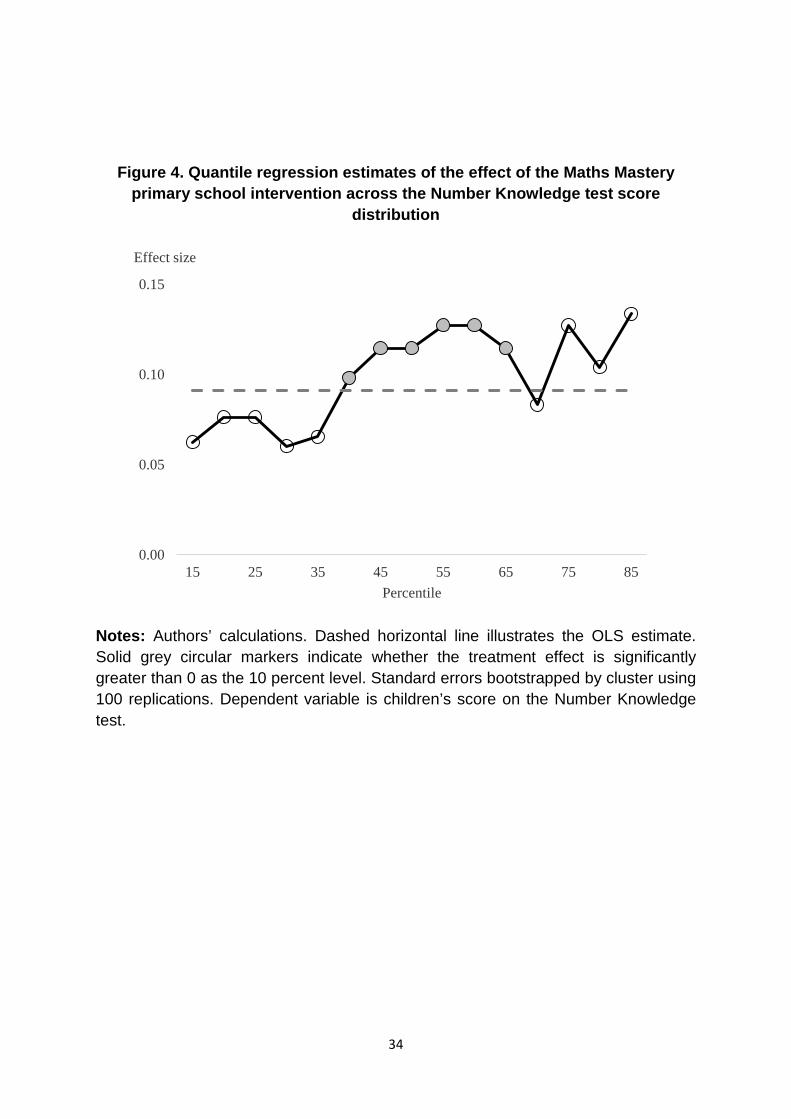
Figure 4. Quantile regression estimates of the effect of the Maths Mastery primary school intervention across the Number Knowledge test score
distribution
Notes: Authors’ calculations. Dashed horizontal line illustrates the OLS estimate. Solid grey circular markers indicate whether the treatment effect is significantly greater than 0 as the 10 percent level. Standard errors bootstrapped by cluster using 100 replications. Dependent variable is children’s score on the Number Knowledge test.
0.00
0.05
0.10
0.15
15 25 35 45 55 65 75 85
Effect size
Percentile
34
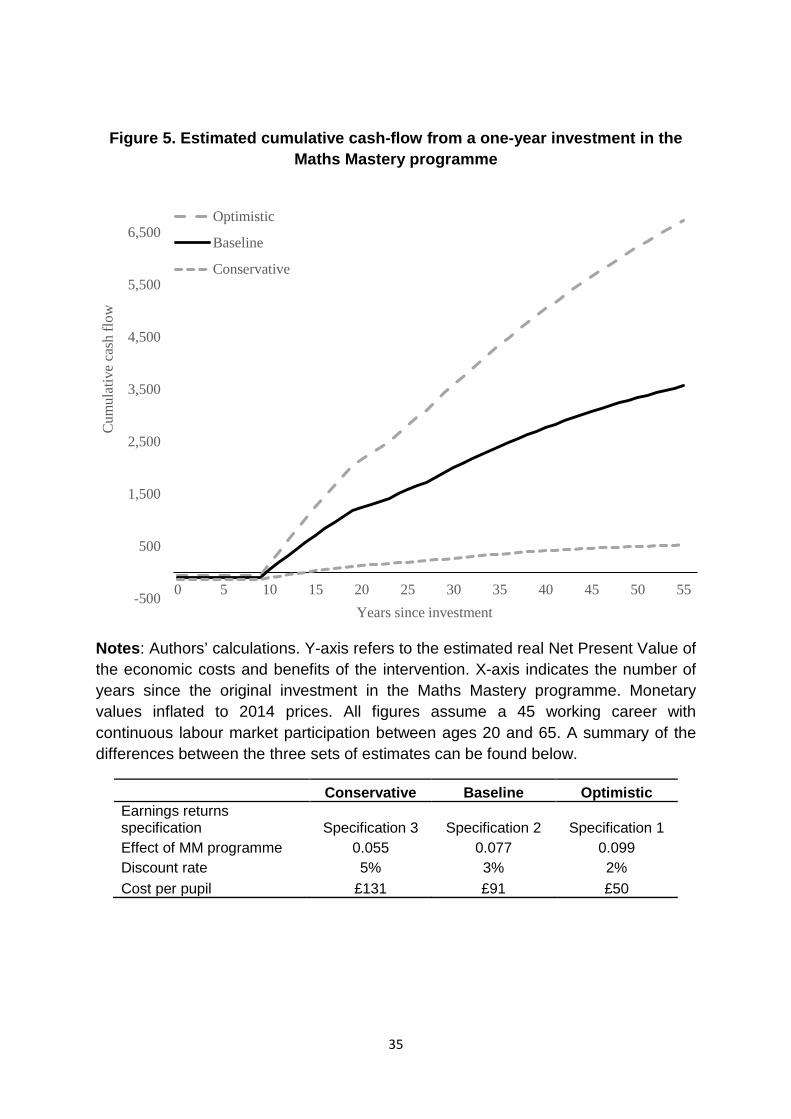
Figure 5. Estimated cumulative cash-flow from a one-year investment in the Maths Mastery programme
Notes: Authors’ calculations. Y-axis refers to the estimated real Net Present Value of the economic costs and benefits of the intervention. X-axis indicates the number of years since the original investment in the Maths Mastery programme. Monetary values inflated to 2014 prices. All figures assume a 45 working career with continuous labour market participation between ages 20 and 65. A summary of the differences between the three sets of estimates can be found below.
Conservative Baseline Optimistic Earnings returns specification Specification 3 Specification 2 Specification 1 Effect of MM programme 0.055 0.077 0.099 Discount rate 5% 3% 2% Cost per pupil £131 £91 £50
-500
500
1,500
2,500
3,500
4,500
5,500
6,500
0 5 10 15 20 25 30 35 40 45 50 55
Cum
ulat
ive
cash
flow
Years since investment
Optimistic
Baseline
Conservative
35
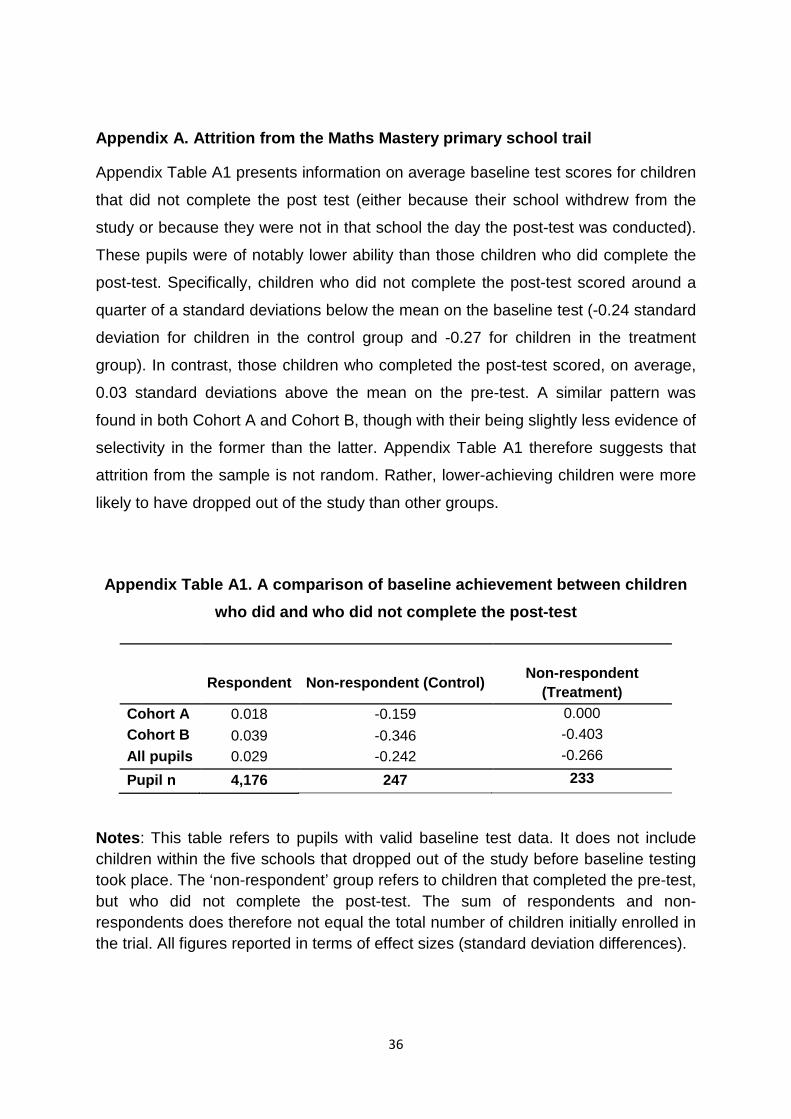
Appendix A. Attrition from the Maths Mastery primary school trail
Appendix Table A1 presents information on average baseline test scores for children
that did not complete the post test (either because their school withdrew from the
study or because they were not in that school the day the post-test was conducted).
These pupils were of notably lower ability than those children who did complete the
post-test. Specifically, children who did not complete the post-test scored around a
quarter of a standard deviations below the mean on the baseline test (-0.24 standard
deviation for children in the control group and -0.27 for children in the treatment
group). In contrast, those children who completed the post-test scored, on average,
0.03 standard deviations above the mean on the pre-test. A similar pattern was
found in both Cohort A and Cohort B, though with their being slightly less evidence of
selectivity in the former than the latter. Appendix Table A1 therefore suggests that
attrition from the sample is not random. Rather, lower-achieving children were more
likely to have dropped out of the study than other groups.
Appendix Table A1. A comparison of baseline achievement between children who did and who did not complete the post-test
Respondent Non-respondent (Control) Non-respondent (Treatment)
Cohort A 0.018 -0.159 0.000 Cohort B 0.039 -0.346 -0.403 All pupils 0.029 -0.242 -0.266
Pupil n 4,176 247 233
Notes: This table refers to pupils with valid baseline test data. It does not include children within the five schools that dropped out of the study before baseline testing took place. The ‘non-respondent’ group refers to children that completed the pre-test, but who did not complete the post-test. The sum of respondents and non-respondents does therefore not equal the total number of children initially enrolled in the trial. All figures reported in terms of effect sizes (standard deviation differences).
36
Appendix B. Attrition from the Maths Mastery secondary school trail
The National Pupil Database can be used to compare the characteristics of
respondents and non-respondents across the treatment and control groups. Results
are presented in Appendix Tables B1 and B2. The former illustrates that children
who did not complete the post-test tend to have lower levels of prior achievement.
This was particularly true for pupils within the treatment group. For instance, non-
respondents from the treatment group scored (on average) 0.24 standard deviations
below the sample mean on the Key Stage 2 maths test. This compares to 0.04
standard deviations above the mean for respondents in the treatment group.
Analogous figures for the control group were -0.01 and 0.02 standard deviations
respectively. Similar findings hold for other pre-test scores, including Key Stage 2
reading scores and Key Stage 1 average points scores. Moreover, Appendix Table
B2 suggests that boys and children in receipt of FSM were also more likely to have
missing post-test data than their female, non-FSM counterparts. Specifically, 37
percent of treatment group non-respondents were eligible for FSM, compared to just
28 percent of respondents. Likewise, 52 percent of control group respondents were
male, compared to 58 percent of non-respondents.
Together, Appendix Tables B1 and B2 suggest that attrition from the sample
is not random. Rather, lower-achieving, disadvantaged boys were more likely to
have dropped out of the study than other groups. It will therefore be important to
compare balance of observable characteristics between treatment and control
groups both before and after attrition has been taken into account.
37
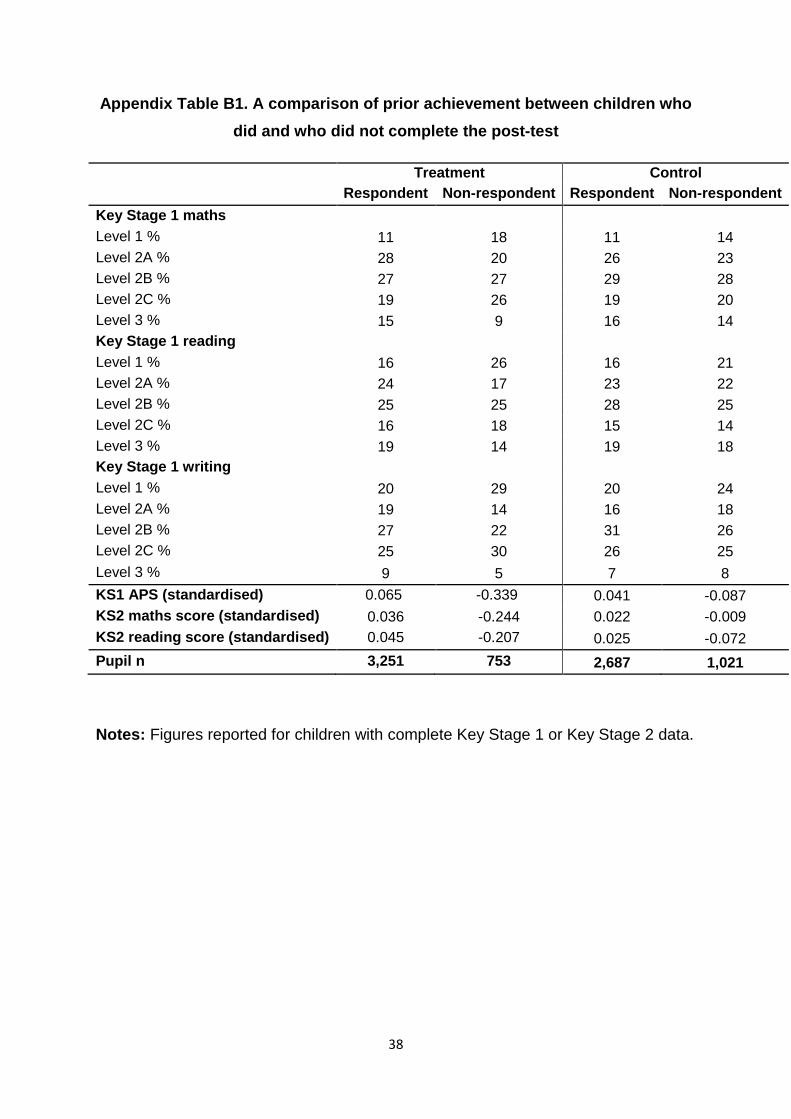
Appendix Table B1. A comparison of prior achievement between children who did and who did not complete the post-test
Treatment Control Respondent Non-respondent Respondent Non-respondent
Key Stage 1 maths Level 1 % 11 18 11 14
Level 2A % 28 20 26 23 Level 2B % 27 27 29 28 Level 2C % 19 26 19 20 Level 3 % 15 9 16 14 Key Stage 1 reading
Level 1 % 16 26 16 21 Level 2A % 24 17 23 22 Level 2B % 25 25 28 25 Level 2C % 16 18 15 14 Level 3 % 19 14 19 18 Key Stage 1 writing
Level 1 % 20 29 20 24 Level 2A % 19 14 16 18 Level 2B % 27 22 31 26 Level 2C % 25 30 26 25 Level 3 % 9 5 7 8 KS1 APS (standardised) 0.065 -0.339 0.041 -0.087 KS2 maths score (standardised) 0.036 -0.244 0.022 -0.009 KS2 reading score (standardised) 0.045 -0.207 0.025 -0.072 Pupil n 3,251 753 2,687 1,021
Notes: Figures reported for children with complete Key Stage 1 or Key Stage 2 data.
38

Appendix Table B2. A comparison of demographic characteristics between children who did and who did not complete the post-test
Treatment Control
Respondent Non-respondent Respondent Non-
respondent Eligible for FSM
No % 72 63 74 68 Yes % 28 37 26 32 Gender Female % 51 39 48 42 Male % 49 61 52 58 Ethnic Group White % 47 49 51 47 Asian % 26 23 13 13 Black % 17 16 21 21 Mixed % 6 8 7 11 Chinese % 0.4 0.1 0 1 Other / unclassified % 4 4 7 7 Pupil n 3,251 753 2,687 1,021
Notes: Figures reported for children with complete Key Stage 1 or Key Stage 2 data.
39
Appendix C. The effect of the MM intervention on the calculator versus non-calculator section of the PiM test
In section 3 we described how two sub-scales were developed within the PiM test.
The first of these sub-scales contained only questions covering content taught as
part of the MM curriculum. The other scale included only questions that covered
questions not taught as part of the MM curriculum.
This appendix performs a similar analysis, but looking at two alternative sub-
scales. Specifically, despite calculator work not being part of the Year 7 MM
curriculum, the PiM test included a both calculator and a non-calculator section.
(Overall test scores are based one-third on the former and two-thirds on the latter).
The two elements of the test also offer the interesting possibility of looking for
possible substitution effects. Specifically, the MM curriculum substitutes teaching
children how to use calculators with learning other, more problem-solving based
skills. Children in treatment schools may therefore do no better (and possibly worse)
on the calculator part of the test than children in control schools. In contrast, one
would expect a positive effect of the treatment on children’s scores in the non-
calculator section.
Table C1 presents our results. As perhaps expected, the MM intervention did
not have any impact upon children’s performance on the calculator section of the
post-test, with the estimated treatment effect standing at less than 0.01 standard
deviations. Thus, despite substituting away from learning calculator skills, there is no
evidence that this has had any detrimental impact upon children’s ability in this area.
In contrast, the MM treatment had a more pronounced effect upon children’s non-
calculator test scores (effect size = 0.077), though this only approached the
boundary of statistical significance at the ten percent level (t = 1.56; p = 0.13).
Nevertheless, this effect is of a similar magnitude to that found in the primary school
trial (0.099 standard deviations).
Moreover, quantile regression estimates pointed towards some interesting
differences in the treatment effect across the non-calculator test score distribution.
Appendix Figure C1 presents results for every 5th percentile between p15 and p85.
(A full set of parameter estimates is available upon request). The effect of the MM
intervention was approximately 0.10 in the bottom half of the distribution, with almost
40
all estimates significantly greater than zero at either the five percent (p15, p20, p25)
or ten percent (p30, p35, p40, p50) level. In contrast, the effect of the intervention is
notably smaller in the top half of the distribution (approximately +0.05 standard
deviations), with no estimate above p55 reaching statistical significance at even the
ten percent level. Together this suggests that, to the extent that the MM secondary
school intervention had an impact upon non-calculator test scores, it is doing so by
pushing up the lower tail of the achievement distribution. It is again important to
recognise that the confidence intervals around these results are reasonably wide,
and includes the possibility of a zero effect
41
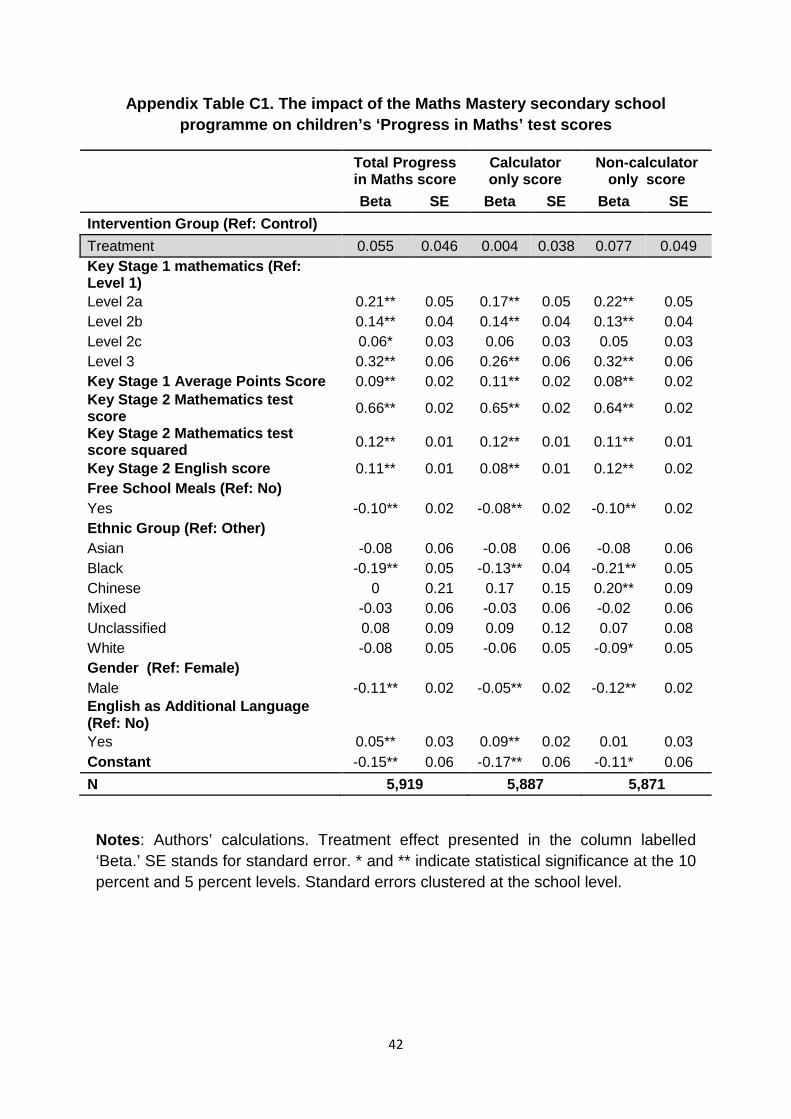
Appendix Table C1. The impact of the Maths Mastery secondary school programme on children’s ‘Progress in Maths’ test scores
Total Progress in Maths score
Calculator only score
Non-calculator only score
Beta SE Beta SE Beta SE Intervention Group (Ref: Control)
Treatment 0.055 0.046 0.004 0.038 0.077 0.049 Key Stage 1 mathematics (Ref: Level 1)
Level 2a 0.21** 0.05 0.17** 0.05 0.22** 0.05 Level 2b 0.14** 0.04 0.14** 0.04 0.13** 0.04 Level 2c 0.06* 0.03 0.06 0.03 0.05 0.03 Level 3 0.32** 0.06 0.26** 0.06 0.32** 0.06 Key Stage 1 Average Points Score 0.09** 0.02 0.11** 0.02 0.08** 0.02 Key Stage 2 Mathematics test score 0.66** 0.02 0.65** 0.02 0.64** 0.02
Key Stage 2 Mathematics test score squared 0.12** 0.01 0.12** 0.01 0.11** 0.01
Key Stage 2 English score 0.11** 0.01 0.08** 0.01 0.12** 0.02 Free School Meals (Ref: No) Yes -0.10** 0.02 -0.08** 0.02 -0.10** 0.02 Ethnic Group (Ref: Other) Asian -0.08 0.06 -0.08 0.06 -0.08 0.06 Black -0.19** 0.05 -0.13** 0.04 -0.21** 0.05 Chinese 0 0.21 0.17 0.15 0.20** 0.09 Mixed -0.03 0.06 -0.03 0.06 -0.02 0.06 Unclassified 0.08 0.09 0.09 0.12 0.07 0.08 White -0.08 0.05 -0.06 0.05 -0.09* 0.05 Gender (Ref: Female) Male -0.11** 0.02 -0.05** 0.02 -0.12** 0.02 English as Additional Language (Ref: No) Yes 0.05** 0.03 0.09** 0.02 0.01 0.03 Constant -0.15** 0.06 -0.17** 0.06 -0.11* 0.06 N 5,919 5,887 5,871
Notes: Authors’ calculations. Treatment effect presented in the column labelled ‘Beta.’ SE stands for standard error. * and ** indicate statistical significance at the 10 percent and 5 percent levels. Standard errors clustered at the school level.
42
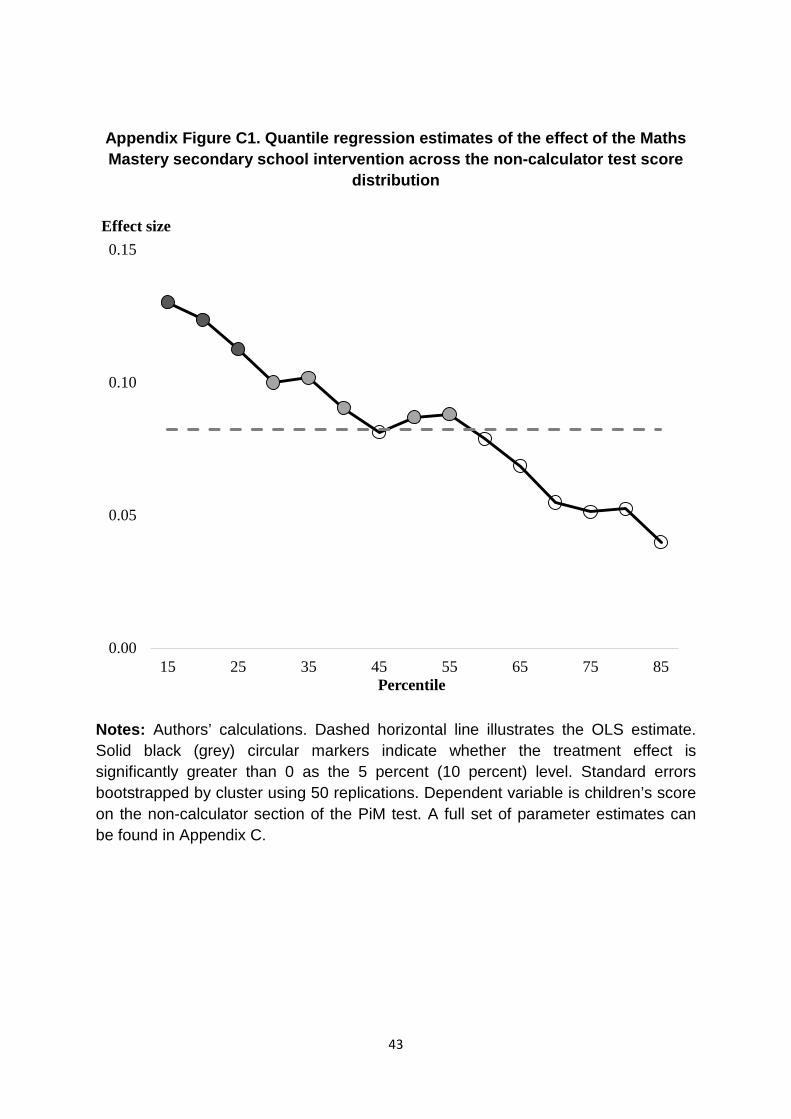
Appendix Figure C1. Quantile regression estimates of the effect of the Maths Mastery secondary school intervention across the non-calculator test score
distribution
Notes: Authors’ calculations. Dashed horizontal line illustrates the OLS estimate. Solid black (grey) circular markers indicate whether the treatment effect is significantly greater than 0 as the 5 percent (10 percent) level. Standard errors bootstrapped by cluster using 50 replications. Dependent variable is children’s score on the non-calculator section of the PiM test. A full set of parameter estimates can be found in Appendix C.
0.00
0.05
0.10
0.15
15 25 35 45 55 65 75 85
Effect size
Percentile
43

Appendix D. The external validity of the Maths Mastery primary school and secondary school RCT’s
Schools were not randomly selected into either the primary or secondary school trial.
Rather Ark, who were running the intervention, were allowed to purposefully recruit
schools. In this appendix we compare the characteristics of children participating in
the trial to the state school population for England, using administrative records.
Results are presented in Appendix Table D1.
Panel A provides evidence for the 90 schools initially randomised in the
primary school trial19. The left hand side refers to cohort A and the right hand side for
cohort B. The gender and month of birth distributions for children enrolled in the trial
is very close to that for the population as a whole. There are, however, a greater
proportion of children eligible for Free School Meals (a marker of low income)
enrolled in the trial than found in the national population. The final six rows refer to
children’s scores on the Foundation Stage Profile – six teacher-based assessments
of children’s development at approximately age 5. (We have standardised each of
these scales to mean 0 and standard deviation 1 across the population).
Interestingly, whereas cohort A children scored below the national mean on each of
these scales (typically by around 0.10 standard deviations), cohort B children tend to
score above the mean (again by around 0.10 standard deviations). This suggests
that cohort A included children with below average levels of early cognitive
development, while cohort B included children with above average levels at age 5.
The fact that a very similar effect size was nevertheless found for both cohorts (recall
Table 2) perhaps suggests that the positive effect may generalise across different
study populations.
The lower half of Panel B considers whether pupils within the 50 secondary
schools initially randomised have similar baseline test scores to pupils in the rest of
England. Trial participants were, on average, lower performing in Key Stage 1 (age
19 It has not been possible to link administrative records to individual pupils within the primary school trial. The figures presented are therefore based upon administrative records held by the school, based upon the autumn census enrolment data. Figures on pupil enrolment therefore differ slightly to those provided for the primary school trial sample provided in the main text.
44

7) and Key Stage 2 (age 11) examinations than the state school population as a
whole20. For instance, their KS1 average points scores (and KS2 maths test scores)
were approximately 0.2 standard deviations (0.1 standard deviations) below the
population mean. This seems to be driven, at least in part, by the fact the trial
particularly under-represented high achievers (relative to the population). For
instance, just 12 per cent of children participating in the trial were award Level 3 in
their Key Stage 1 maths test, compared to 19 per cent of all state school pupils in
England.
The top half of panel B presents a similar comparison for secondary schools
in terms of other observable characteristics. 29 per cent of children enrolled in the
trial were eligible for Free School Meals, compared to 18 per cent of pupils in the
population. This suggests that trial participants were much more likely to come from
a low-income background. Similarly, ethnic minorities were over-represented in the
trial – particularly Black (19 per cent in the sample versus 5 per cent in the
population) and Asian (20 per cent in the sample versus 10 per cent in the
population) groups.
20 Key Stage 1 and Key Stage 2 exams are national tests all state school children in England sit at age 7 and age 11.
45
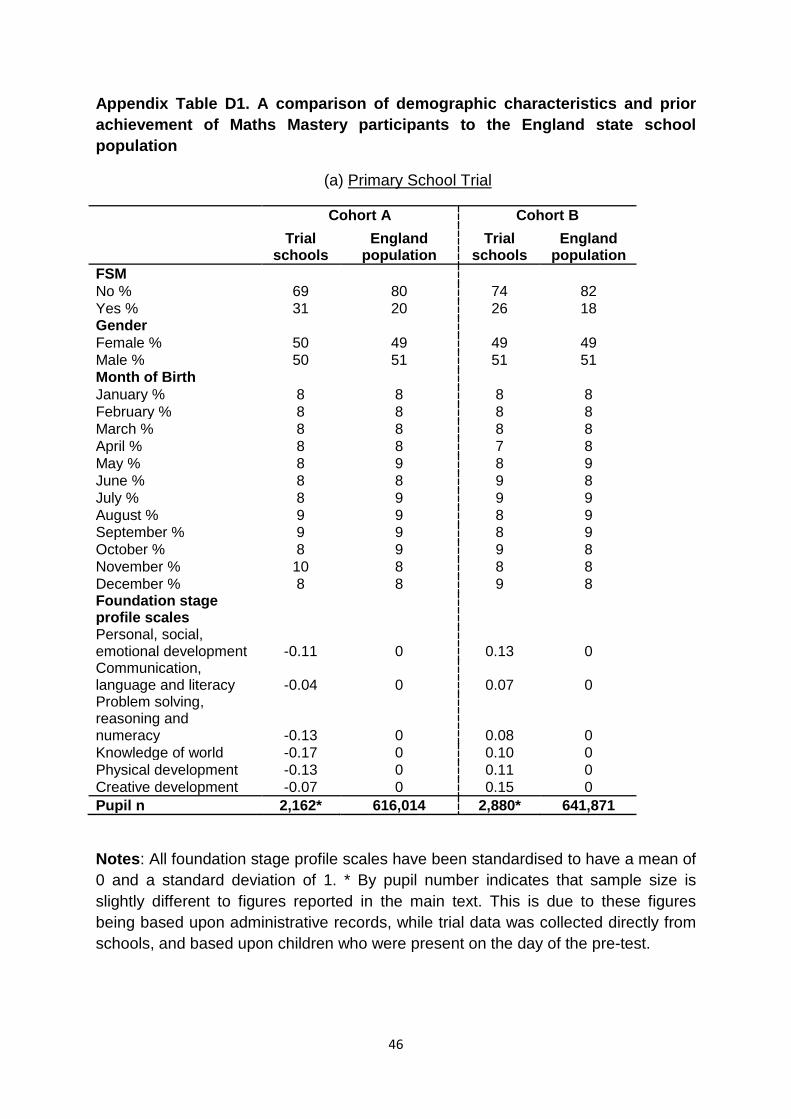
Appendix Table D1. A comparison of demographic characteristics and prior achievement of Maths Mastery participants to the England state school population
(a) Primary School Trial
Cohort A Cohort B
Trial
schools England
population Trial
schools England
population FSM
No % 69 80 74 82 Yes % 31 20 26 18 Gender
Female % 50 49 49 49 Male % 50 51 51 51 Month of Birth
January % 8 8 8 8 February % 8 8 8 8 March % 8 8 8 8 April % 8 8 7 8 May % 8 9 8 9 June % 8 8 9 8 July % 8 9 9 9 August % 9 9 8 9 September % 9 9 8 9 October % 8 9 9 8 November % 10 8 8 8 December % 8 8 9 8 Foundation stage profile scales
Personal, social, emotional development -0.11 0 0.13 0 Communication, language and literacy -0.04 0 0.07 0 Problem solving, reasoning and numeracy -0.13 0 0.08 0 Knowledge of world -0.17 0 0.10 0 Physical development -0.13 0 0.11 0 Creative development -0.07 0 0.15 0 Pupil n 2,162* 616,014 2,880* 641,871
Notes: All foundation stage profile scales have been standardised to have a mean of 0 and a standard deviation of 1. * By pupil number indicates that sample size is slightly different to figures reported in the main text. This is due to these figures being based upon administrative records, while trial data was collected directly from schools, and based upon children who were present on the day of the pre-test.
46

(b) Secondary School Trial
Trial participants England
Eligible for FSM No % 71 82
Yes % 29 18 Gender
Female % 48 49 Male % 52 51 Ethnic Group
White % 49 78 Asian % 20 10 Black % 19 5 Mixed % 7 5 Chinese % 0 0 Other / unclassified % 5 2 Mean (SD) KS1 total points score 14.6 (3.5) 15.3 (3.6)
Mean (SD) KS2 mathematics score 68.4 (20.9) 70 (21)
Mean (SD) KS2 reading score 31 (10.2) 33 (10)
Pupil n 7,712 531,145
Notes: Authors’ calculations using the National Pupil Database. Trial participants refers to pupils within the 50 schools initially recruited into the Maths Mastery secondary school trial. ‘England’ refers to the state school population of England as a whole. All percentages refer to column percentages. Key Stage 1 and Key Stage 2 test scores kept in original metric (i.e. they have not been standardised).
47