the ccomprehensive aannual ffinancial rreport
TRANSCRIPT

The
CCComprehensive
AAAnnual
FFFinancial
RRReport
For the Fiscal Year
July 1, 2012 – June 30, 2013
Office of the
COMMISSIONER OF FINANCE


COMPREHENSIVE ANNUAL FINANCIAL REPORT FOR THE CITY OF WHITE PLAINS, NEW YORK
FOR THE FISCAL YEAR JULY 1, 2012 – JUNE 30, 2013
PREPARED BY: THE OFFICE OF THE
COMMISSIONER OF FINANCE


CITY OF WHITE PLAINS, NEW YORK COMPREHENSIVE ANNUAL FINANCIAL REPORT Fiscal Year Ended June 30, 2013
TABLE OF CONTENTS Page INTRODUCTORY SECTION
Letter of Transmittal .................................................................................................................. 1 GFOA Certificate of Achievement for Excellence in Financial Reporting ................................... 8 Principal Officials ...................................................................................................................... 9 Organizational Chart ............................................................................................................... 10 Fiscal Performance Goals ....................................................................................................... 11
FINANCIAL SECTION
Independent Auditor’s Report ................................................................................................. 17 Management’s Discussion and Analysis ................................................................................. 19
Basic Financial Statements:
Government-wide Financial Statements: Statement of Net Position .............................................................................................. 32 Statement of Activities ................................................................................................... 34 Fund Financial Statements: Balance Sheet - Governmental Funds ........................................................................... 36 Reconciliation of the Balance Sheet - Governmental Funds to the Statement of Net Position ....................................................................................... 37 Statement of Revenues, Expenditures, and Changes in Fund Balances – Governmental Funds .............................................................................................. 38 Reconciliation of the Statement of Revenues, Expenditures and Changes in Fund Balances of Governmental Funds to the Statement of Activities .................... 39 Statement of Revenues, Expenditures and Changes in Fund Balance - Budget and Actual - General Fund ................................................. 40 Statement of Net Position - Proprietary Funds ............................................................... 41 Statement of Revenues, Expenses and Changes in Net Position - Proprietary Funds ................................................................................... 42 Statement of Cash Flows - Proprietary Funds ............................................................... 43 Statement of Assets and Liabilities - Fiduciary Fund ...................................................... 44 Notes to the Financial Statements ...................................................................................... 45 Required Supplementary Information: Schedule of Funding Progress – Other Postemployment Benefits Plan ............................. 73 Combining and Individual Fund Financial Statements and Schedules: Schedule of Revenues and Other Financial Sources Compared to Budget – General Fund ................................................................................................................ 77 Schedule of Expenditures and Other Financing Uses Compared to Budget – General Fund ................................................................................................................ 88 Combining Balance Sheet - Nonmajor Governmental Funds ............................................. 86
Combining Statement of Revenues, Expenditures and Changes in Fund Balances – Nonmajor Governmental Funds ..................................................................................... 90 Schedule of Revenues, Expenditures and Changes in Fund Balance – Budget and Actual - Library Fund .................................................................................. 93
CITY OF WHITE PLAINS, NEW YORK COMPREHENSIVE ANNUAL FINANCIAL REPORT Fiscal Year Ended June 30, 2013
TABLE OF CONTENTS (continued) Page FINANCIAL SECTION - (continued) Combining and Individual Fund Financial Statements and Schedules (continued): Schedule of Revenues, Expenditures and Changes in Fund Balance – Budget and Actual - Debt Service Fund ......................................................................... 94 Project-length Schedule - Capital Projects Fund ................................................................ 96 Schedule of Revenues and Expenses by Department - Enterprise Fund ......................... 101 Statement of Changes in Assets and Liabilities - Fiduciary Fund ..................................... 103 STATISTICAL SECTION (UNAUDITED)
Financial Trends: Net Position by Component - Last Ten Fiscal Years ........................................................ 106 Changes in Net Position - Last Ten Fiscal Years ............................................................. 108 Fund Balances, Governmental Funds - Last Ten Fiscal Years ......................................... 110 Changes in Fund Balances, Governmental Funds - Last Ten Fiscal Years ...................... 112 Tax Revenues by Source, Governmental Funds - Last Ten Fiscal Years ......................... 114
Revenue Capacity:
Assessed Valuation, State Equalization Rate, and Estimated Full Value of Real Property - Last Ten Fiscal Years ................................................................................. 116 Property Tax Rates per $1,000 Assessed Valuation - All Direct and Overlapping Governments - Last Ten Fiscal Years.......................................................................... 117 Principal Taxpayers .......................................................................................................... 118 Property Tax Levies and Collections - Last Ten Fiscal Years ........................................... 119 Constitutional Tax Limit .................................................................................................... 120
Debt Capacity:
Ratios of Outstanding Debt by Type - Last Ten Fiscal Years ........................................... 122 Direct and Overlapping Governmental Activities Debt - Last Ten Fiscal Years ................. 123 Computation of Legal Debt Margin ................................................................................... 124
Demographic and Economic Information -
Demographic and Economic Statistics - Last Ten Fiscal Years ........................................ 126 Principal Employers ......................................................................................................... 127
Operating Information:
Full-Time Equivalent Employees by Program - Last Ten Fiscal Years ............................. 129 Operating Indicators by Program - Last Ten Fiscal Years ................................................ 130 Capital Asset Statistics by Program - Last Ten Fiscal Years ............................................ 132

CITY OF WHITE PLAINS, NEW YORK COMPREHENSIVE ANNUAL FINANCIAL REPORT Fiscal Year Ended June 30, 2013
TABLE OF CONTENTS - (concluded) Page SINGLE AUDIT SECTION – FEDERAL PROGRAMS: Report on Internal Control Over Financial Reporting and on Compliance and Other Matters Based on an Audit of Financial Statements Performed in Accordance with Government Auditing Standards ............................................................................... 135 Report on Compliance for Each Major Federal Program and on Internal Control over Compliance in Accordance with OMB Circular A-133 ...................... 137 Schedule of Expenditures of Federal Awards ....................................................................... 139 Notes to Schedule of Expenditures of Federal Awards ......................................................... 141 Summary Schedule of Prior Audit Findings ........................................................................... 142 Schedule of Findings and Questioned Costs ........................................................................ 143


INTRODUCTORY
SECTION


DEPARTMENT OF FINANCE
MUNICIPAL BUILDING – 255 MAIN STREET – WHITE PLAINS, NEW YORK 10601 TEL: (914) 422-1235 – Fax: (914) 422-1273
THOMAS M. ROACH MICHAEL A. GENITO MAYOR COMMISSIONER
CAROL ENDRES DEPUTY COMMISSIONER
October 28, 2013 To the Honorable Mayor, Members of the Common Council and Citizens of the City of White Plains, New York: Section 58 of the City Charter requires that the Commissioner of Finance shall publish an audited annual financial report for the fiscal year ended June 30 no later than the stated meeting of the Common Council in December of the same year. In accordance with that requirement, submitted herewith is the audited Comprehensive Annual Financial Report (CAFR) for the City of White Plains, New York (City) for the fiscal year ended June 30, 2013. Management assumes full responsibility for the completeness and reliability of the information contained in this report, based upon a comprehensive framework of internal control that it has established for this purpose. Because the cost of internal control should not exceed anticipated benefits, the objective is to provide reasonable, rather than absolute, assurance that the financial statements are free of any material misstatements. O’Connor Davies, LLP, a firm of licensed certified public accountants, has issued an unmodified opinion on the City’s financial statements for the year ended June 30, 2013. The independent auditors’ report is located at the front of the financial section of this report. Management's discussion and analysis (MD&A) immediately follows the independent auditors’ report and provides a narrative introduction, overview and analysis of the basic financial statements. MD&A complements this letter of transmittal and should be read in conjunction with it. This report has also been prepared and organized to meet the requirements of the Government Finance Officers Association’s Certificate of Achievement for Excellence in Financial Reporting program. In accordance with those guidelines the report is presented with four major sections: Introductory Section, Financial Section, Statistical Section and Single Audit Section – Federal Programs. The City is compliant with the provisions of all applicable GASB statements and takes pride in its early application of the following: Statement No. 65, Items Previously Reported as Assets and Liabilities; Statement No. 66, Technical Corrections – 2012 – an amendment of GASB Statements No. 10 and No. 62; Statement No. 69, Government Combinations and Disposals of Government Operations and Statement No. 70, Accounting and Financial Reporting for
1

Nonexchange Financial Guarantees. The City could not at this time early implement Statement No. 68, Accounting and Financial Reporting for Pensions – an amendment of GASB Statement No. 27, due to the fact that the State of New York has not yet implemented Statement No. 67, Financial Reporting for Pension Plans – an amendment of GASB Statement No. 25 or Statement No. 68, or developed the information that the City needs from the State to implement Statement No. 68. PROFILE OF THE GOVERNMENT The City is located in the south central portion of Westchester County approximately 22 miles north of New York City. It currently encompasses an area of 10 square miles and serves a population of 56,862. Founded in 1683, the City became the seat of Westchester County government in 1778 by an act of the State Legislature. In 1866 it was incorporated as a village and in 1916 was incorporated as a city. The City operates under the Mayor-Council form of government with the Mayor serving as the Chief Executive Officer. Policy-making and legislative authority are vested in the Common Council, which includes the Mayor and six Council members, all of whom are elected at large for four year terms. The Mayor, with Common Council approval, appoints the commissioners and directors of the City’s departments. The Chief Fiscal Officer of the City is the Commissioner of Finance who is responsible for the supervision and administration of the financial affairs of the City. The City is empowered to levy a property tax on real properties located within its boundaries. It also functions in both a fiduciary and guarantor relationship with the County of Westchester and the White Plains City School District with respect to the collection and payment of real property taxes levied by such jurisdictions. The County of Westchester and the White Plains City School District are independent of the City municipal government legally, as well as in governance and operations and are therefore excluded from this report. The City provides a full range of services. General government services include vital statistics (birth and death certificates); City Court; business, occupational and a variety of other permits and licenses required under state or local law; building safety; traffic safety, zoning and planning. Public safety services include police, fire and emergency medical services. Public parking services are provided via various lots and garages. Public works services include street and sidewalk maintenance, storm water maintenance, snow and leaf removal, refuse collection and disposal, public water supply and distribution and sanitary sewers. The City has a comprehensive recreational program serving all age levels, with 150 acres of public parks and open space (including a waterfront park), 33 tennis courts, two outdoor swimming pools and an ice-skating rink. The White Plains Public Library provides services from an 80,000 square foot building in the downtown and through its membership in the Westchester Library System, a consortium of 38 other libraries located in Westchester County. The library sponsors hundreds of cultural, recreational, educational and public service programs throughout the year. Its public space includes meeting and program rooms, a Museum Gallery and “The Trove”, a state of the art children’s section. Public cable television is provided by the White Plains Cable Television Commission. Production facilities include a fully equipped studio, editing suite and a full complement of location equipment. All productions are cablecast on Cablevision channel 76 and Verizon channel 45, the Community Access Channels. The Cable Commission also manages City Government Access TV on Cablevision channel 75 and Verizon channel 47. These channels cablecast the City government's programs, announcements, regularly
2

scheduled Common Council meetings, Planning Board meetings and other City government meetings and events. The City maintains a system of budgetary controls to ensure compliance with legal provisions embodied in the annual appropriated budget approved by the Common Council. The level of budgetary control (i.e., the level at which expenditures cannot legally exceed the appropriated amount) is the major object of expenditure in a department within each fund. More information on the budgetary process can be found in Note 2 of the notes to the financial statements. The City has maintained a credit rating of Aa1 from Moody’s Investors Service since 1988. ASSESSING ECONOMIC CONDITION Local Economy The City is a suburb of New York City, located within the affluent County of Westchester. It serves as a major commuter hub as well as a suburban regional center due to its close proximity and accessibility to New York City. The City is headquarters for many corporations and functions as a major regional retail shopping center for the entire New York metropolitan area including Fairfield County, Connecticut. Access to New York City and the surrounding area is readily available by car, train, or bus. Major interstate highways such as I-287, I-95 and I-87 go through, or are a short drive from the City center, as are a number of state and local parkways and highways. Westchester County Airport is only seven miles from the City. In 2012, the airport served approximately 1.75 million passengers and had approximately 161,000 total aircraft operations (http://airport.westchester.gov accessed October 18, 2013). The City is also close to three major international airports: LaGuardia (25 miles), John F. Kennedy (32 miles) and Newark-Liberty (40 miles). According to the 2009-2011 American Community Survey, incomes within the City and the County compare quite favorably to New York State and the nation:
Income Type
City of White Plains
Westchester County
New York State
United States
Per Capita $43,493 $ 46,777 $31,206 $27,158
Median Household 75,104 79,228 55,972 51,484
Median Family 91,394 101,641 68,161 62,735
Per the U.S. Department of Labor Statistics, the (not seasonally adjusted) Consumer Price Index – All Urban Consumers, All Items for New York–Northern New Jersey–Long Island, NY-NJ-CT-PA rose 1.8% from June 2012 to June 2013, equivalent to the increase for the U.S. city average. Data provided by the U.S. Bureau of Labor Statistics shows a decline in unemployment rates (not seasonally adjusted) and that the City compares favorably to county, state and federal levels:
City of White Plains
Westchester County
New York State
United States
June 2013 5.7% 6.2% 7.6% 7.8%
June 2012 6.7% 7.4% 8.7% 8.4%
3
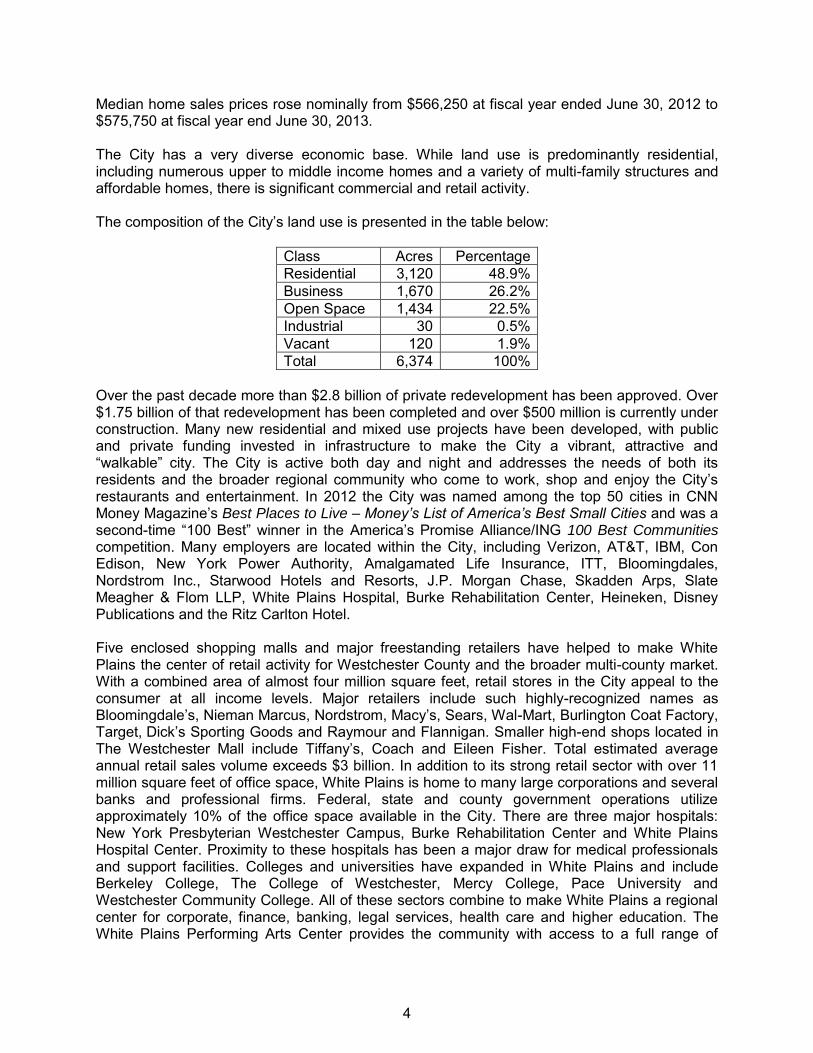
Median home sales prices rose nominally from $566,250 at fiscal year ended June 30, 2012 to $575,750 at fiscal year end June 30, 2013. The City has a very diverse economic base. While land use is predominantly residential, including numerous upper to middle income homes and a variety of multi-family structures and affordable homes, there is significant commercial and retail activity. The composition of the City’s land use is presented in the table below:
Class Acres Percentage
Residential 3,120 48.9%
Business 1,670 26.2%
Open Space 1,434 22.5%
Industrial 30 0.5%
Vacant 120 1.9%
Total 6,374 100%
Over the past decade more than $2.8 billion of private redevelopment has been approved. Over $1.75 billion of that redevelopment has been completed and over $500 million is currently under construction. Many new residential and mixed use projects have been developed, with public and private funding invested in infrastructure to make the City a vibrant, attractive and “walkable” city. The City is active both day and night and addresses the needs of both its residents and the broader regional community who come to work, shop and enjoy the City’s restaurants and entertainment. In 2012 the City was named among the top 50 cities in CNN Money Magazine’s Best Places to Live – Money’s List of America’s Best Small Cities and was a second-time “100 Best” winner in the America’s Promise Alliance/ING 100 Best Communities competition. Many employers are located within the City, including Verizon, AT&T, IBM, Con Edison, New York Power Authority, Amalgamated Life Insurance, ITT, Bloomingdales, Nordstrom Inc., Starwood Hotels and Resorts, J.P. Morgan Chase, Skadden Arps, Slate Meagher & Flom LLP, White Plains Hospital, Burke Rehabilitation Center, Heineken, Disney Publications and the Ritz Carlton Hotel. Five enclosed shopping malls and major freestanding retailers have helped to make White Plains the center of retail activity for Westchester County and the broader multi-county market. With a combined area of almost four million square feet, retail stores in the City appeal to the consumer at all income levels. Major retailers include such highly-recognized names as Bloomingdale’s, Nieman Marcus, Nordstrom, Macy’s, Sears, Wal-Mart, Burlington Coat Factory, Target, Dick’s Sporting Goods and Raymour and Flannigan. Smaller high-end shops located in The Westchester Mall include Tiffany’s, Coach and Eileen Fisher. Total estimated average annual retail sales volume exceeds $3 billion. In addition to its strong retail sector with over 11 million square feet of office space, White Plains is home to many large corporations and several banks and professional firms. Federal, state and county government operations utilize approximately 10% of the office space available in the City. There are three major hospitals: New York Presbyterian Westchester Campus, Burke Rehabilitation Center and White Plains Hospital Center. Proximity to these hospitals has been a major draw for medical professionals and support facilities. Colleges and universities have expanded in White Plains and include Berkeley College, The College of Westchester, Mercy College, Pace University and Westchester Community College. All of these sectors combine to make White Plains a regional center for corporate, finance, banking, legal services, health care and higher education. The White Plains Performing Arts Center provides the community with access to a full range of
4
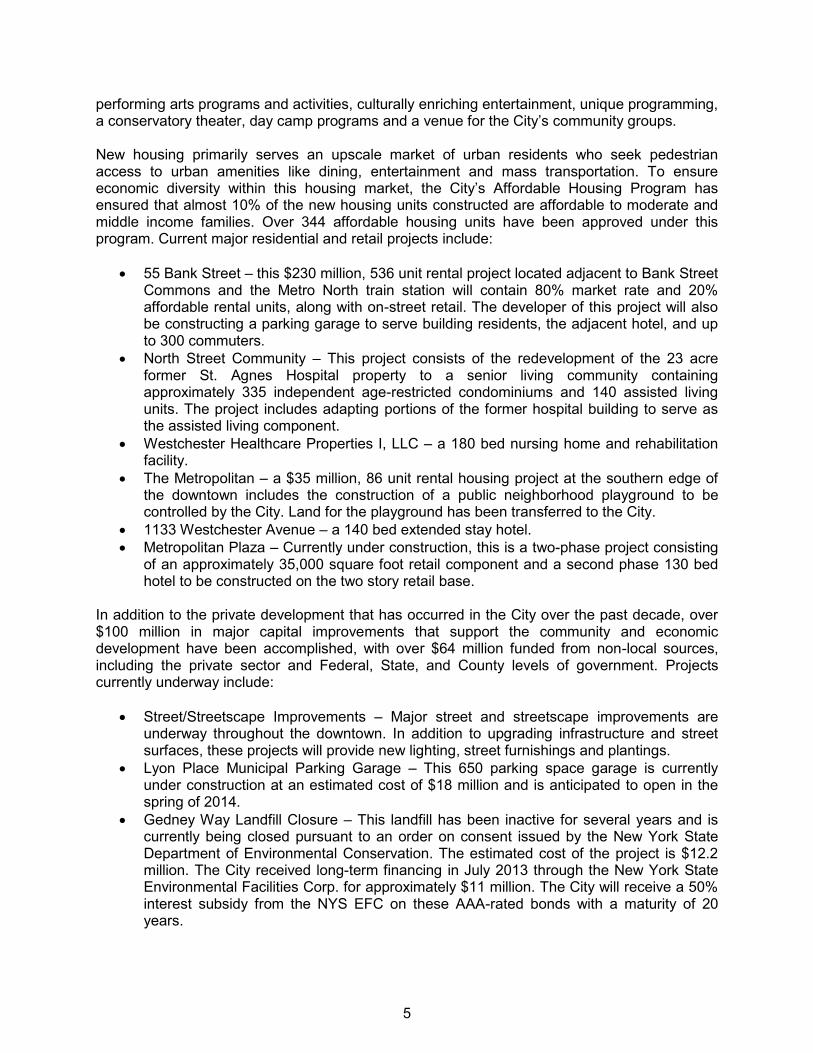
performing arts programs and activities, culturally enriching entertainment, unique programming, a conservatory theater, day camp programs and a venue for the City’s community groups. New housing primarily serves an upscale market of urban residents who seek pedestrian access to urban amenities like dining, entertainment and mass transportation. To ensure economic diversity within this housing market, the City’s Affordable Housing Program has ensured that almost 10% of the new housing units constructed are affordable to moderate and middle income families. Over 344 affordable housing units have been approved under this program. Current major residential and retail projects include:
55 Bank Street – this $230 million, 536 unit rental project located adjacent to Bank Street Commons and the Metro North train station will contain 80% market rate and 20% affordable rental units, along with on-street retail. The developer of this project will also be constructing a parking garage to serve building residents, the adjacent hotel, and up to 300 commuters.
North Street Community – This project consists of the redevelopment of the 23 acre former St. Agnes Hospital property to a senior living community containing approximately 335 independent age-restricted condominiums and 140 assisted living units. The project includes adapting portions of the former hospital building to serve as the assisted living component.
Westchester Healthcare Properties I, LLC – a 180 bed nursing home and rehabilitation facility.
The Metropolitan – a $35 million, 86 unit rental housing project at the southern edge of the downtown includes the construction of a public neighborhood playground to be controlled by the City. Land for the playground has been transferred to the City.
1133 Westchester Avenue – a 140 bed extended stay hotel.
Metropolitan Plaza – Currently under construction, this is a two-phase project consisting of an approximately 35,000 square foot retail component and a second phase 130 bed hotel to be constructed on the two story retail base.
In addition to the private development that has occurred in the City over the past decade, over $100 million in major capital improvements that support the community and economic development have been accomplished, with over $64 million funded from non-local sources, including the private sector and Federal, State, and County levels of government. Projects currently underway include:
Street/Streetscape Improvements – Major street and streetscape improvements are underway throughout the downtown. In addition to upgrading infrastructure and street surfaces, these projects will provide new lighting, street furnishings and plantings.
Lyon Place Municipal Parking Garage – This 650 parking space garage is currently under construction at an estimated cost of $18 million and is anticipated to open in the spring of 2014.
Gedney Way Landfill Closure – This landfill has been inactive for several years and is currently being closed pursuant to an order on consent issued by the New York State Department of Environmental Conservation. The estimated cost of the project is $12.2 million. The City received long-term financing in July 2013 through the New York State Environmental Facilities Corp. for approximately $11 million. The City will receive a 50% interest subsidy from the NYS EFC on these AAA-rated bonds with a maturity of 20 years.
5

The City’s economic base is further strengthened by its high quality transportation systems and easy commute to New York City and Fairfield County, Connecticut. Despite the national recession, projects continue to move forward in the residential, medical and housing sectors as noted above and the retail and office sectors are seeing the re-occupancy of major space. The City expects a gradual but full recovery in all sectors of its local economy over the next few years due to the diversity of its commercial base. Long-Term Financial Planning and Major Initiatives The City operates under the auspices of a comprehensive plan entitled White Plains Vision - A Plan for the 21st Century which serves as a planning guide for the City. Updates and revisions to this 1997 plan were adopted by the Common Council in July 2006 to recognize and incorporate changes in the economic, social and physical conditions of the City. The revised Comprehensive Plan will continue to serve as an important planning guide for the City well into the future. The City’s Planning Department also published a 2010-14 Consolidated Plan for Public Review. These and other documents concerning long-term economic development and land use planning are available on the City’s website at www.whiteplainsny.gov/planning. In addition to its economic development, the City has invested in its public infrastructure to make the City a vibrant, attractive and active community both day and night. The City maintains a Charter-required six-year Capital Improvement Program that serves as a planning document to ensure that its facilities, equipment and infrastructure are well maintained and operating in peak condition. Under the guidance of a Capital Projects Board, this process gives the City the ability to plan for its capital needs and allocate short- and long-term resources accordingly. The City identifies and quantifies the operational costs associated with its capital projects and budgets the necessary resources. The City’s Rolling Stock Committee monitors the condition of all City equipment and vehicles and makes recommendations on their replacement. The City maintains a vehicle replacement policy which serves as its fleet replacement guide over a ten-year period. Capital improvements totaling $18.1 million are noted in the adopted budget for fiscal year ending June 30, 2014: rolling stock ($2.4 million); public buildings ($2.7 million); public parking ($1.2 million); infrastructure ($3.1 million); water system ($7.5 million) and other projects ($1.2 million). Funding for these projects includes tax-supported debt ($7.7 million); self-liquidating debt ($9 million) and cash and grants ($1.4 million). Financial Policies The City operates under a host of comprehensive financial policies. The City maintains an investment policy adopted by the Common Council that complies with Sections 10 and 11 of New York State General Municipal Law, which emphasize a conservative financial approach to the investment of municipal funds and collateralization of deposits in excess of FDIC insurance coverage. The City’s investment policy is reviewed annually and amended as needed or desired. The City maintains a procurement policy adopted by the Common Council in accordance with Section 104-b of New York State General Municipal Law. This policy outlines all bidding and procurement procedures that City departments must adhere to when purchasing goods and services. The Department of Purchasing is responsible for the administration of this policy. The City is self-insured for general liability, Workers Compensation and other risks, purchasing insurance policies where it is prudent and cost effective. The City continuously assesses its
6
risks and annually reviews and determines the appropriate mix of self-insurance and outside coverage. The City maintains a set of Fiscal Performance Goals, which were adopted by the Common Council in 1981 and last amended April 1, 2013. These goals establish written policies for guiding the City’s financial management practices. While some performance goals are specific and limit certain types of financial activity, the goal statements are not intended to restrict management’s ability or responsibility to respond to emergency or service delivery needs above and/or beyond the limitations established by the fiscal performance goals. The fiscal performance goals follow this transmittal letter. The City continuously monitors its budget and prepares quarterly unaudited financial reports and multi-year financial forecasts. As a result, the City is able to plan for all of its projects and purchases in accordance with available financial resources. AWARDS AND ACKNOWLEDGMENTS The Government Finance Officers Association of the United States and Canada (GFOA) awarded a Certificate of Achievement for Excellence in Financial Reporting to the City for its Comprehensive Annual Financial Report for the fiscal year ended June 30, 2012. This was the 32nd consecutive year that the City has received this prestigious award. In order to be awarded a certificate of achievement, a governmental unit must publish an easily readable and efficiently organized comprehensive annual financial report whose contents must conform to GFOA standards. This report must satisfy both generally accepted accounting principles and applicable legal requirements. A certificate of achievement is valid for a period of one year only. We believe that our current report continues to meet the certificate of achievement program’s requirements and we are submitting it to GFOA to determine its eligibility for another certificate. The City also received the GFOA’s Distinguished Budget Presentation Award for its annual budget document for the 2012-2013 fiscal year. The City of White Plains was the first municipality in New York State to receive this award and the most recent one marks our 29th consecutive year. In order to qualify for the Distinguished Budget Presentation Award, the City’s budget document was judged to be proficient in several categories, including as a policy document, a financial plan, an operations guide and as a communication device. The City has submitted its 2013-2014 Annual Budget document to the GFOA and anticipates receiving the award for this document as well. The preparation of this report would not have been possible without the dedicated services of the entire finance department staff and the assistance of all City departments concerning information specific to their operations. Our gratitude is extended to our Mayor, the Common Council and the Chief of Staff, who continuously strive to enhance the quality of life for our citizens. The input from our independent auditor was invaluable and we commend them on their timely and professional completion of our audit. Most importantly, our heartfelt thanks go to our citizens and residents, for giving us the opportunity to serve our fine City. Respectfully Submitted,
Michael A. Genito Commissioner of Finance
7

8
Government Finance Officers Association
Certificate of Achievement
for Excellence in Financial Reporting
Presented to
City of White Plains
New York
For irs Comprehensive Annual Financial Report
for the Fiscal Year Ended
June 30, 2012
Executive Director/CEO

ELECTED OFFICIALS
MAYOR
Thomas M. Roach
COMMON COUNCIL
Beth N. Smayda, President
Benjamin Boykin II
John Kirkpatrick
Dennis Krolian
Milagros Lecuona
John M. Martin
FINANCE DEPARTMENT
Michael A. Genito, Commissioner
Carol Endres, Deputy Commissioner
John Freiberger, Accountant
Anthony Pena, Accountant
9

City Court
Judge
Board of
Ethics
Beautification
Committee
Budget &
Management
Advisory
Committee
Library
Trustees
Recreation
Advisory
Building Code
Appeals
Commission
Building Plan
Review Board
Design Review
Board
Examining
Board of
Plumbers
Examining
Board of
Stationary
Engineers
Memorials
Committee
Planning
Board
Urban
Renewal
Agency
Youth BoardZoning Board
of Appeals
AssessorBudget
Director
Cable TV
Access
Commission
City ClerkCommisioner
of Building
Commissioner
of Parking
Commissioner
of Planning
Commissioner
of Purchasing
Commissioner
of Public
Works
Commissioner
of Recreation
and Parks
Commissioner
of Traffic
Director of
Cable TV
Commission
Director of
Information
Services
Personnel
Officer
Commissioner
of Finance
Board of
Assessment
Review
Corporation
Counsel
Commissioner
of Public Safety
MAYOR
Board of
Electrical
Capital Projects
Board
Examining
Board of Motion
Pictures
Housing
Auhority
Traffic
Commission
Youth Bureau
Director
CITIZENS
Conservation
Board
Medical Board
COMMON COUNCIL
CITY OF WHITE PLAINS, NEW YORK
Organizational Chart
10

City of White Plains, New York Summary of Significant Accounting, Budgeting and Management Policies
April 1, 2013 ACCOUNTING AND BUDGETING PRACTICES AND INTERNAL CONTROL PROCEDURES: The following information, while technical in nature, is provided to inform the interested reader of significant accounting practices and internal control mechanisms adhered to by the City of White Plains and how they are utilized to ensure that government resources are managed and accounted for in compliance with applicable laws and regulations. Basis/Focus: The City's operating funds budgets, i.e. General Fund, Library Fund, Self-Insurance Fund, Water Fund, Sewer Rent Fund and Debt Service Fund are prepared on a basis consistent with Generally Accepted Accounting Principles (GAAP) as promulgated by the Governmental Accounting Standards Board (GASB) and the best practices and advisories set forth by the Government Finance Officers Association of the United States and Canada (GFOA). Governmental funds (General Fund, Debt Service Fund and Library Fund) are accounted for using the current financial resources measurement focus and the modified accrual basis of accounting. Under the modified accrual basis of accounting, revenues are recognized in the accounting period in which they become susceptible to accrual, that is, when they become both “measurable” and “available” to finance expenditures of the fiscal period. “Measurable” means the amount of the transaction can be determined and “available” means collectible within the current period or soon enough thereafter to be used to pay liabilities of the current period. Expenditures are recorded when the related liability is incurred, except for interest that has not matured on general long-term debt and compensated absences which are recognized when due. Proprietary Funds (Self-Insurance Fund, Water Fund and Sewer Rent Fund) are accounted for using the economic resources measurement focus and accrual basis of accounting. Under this method, revenues are recorded when earned and expenses are recorded at the time liabilities are incurred. Internal Controls: The City of White Plains employs a system where budgetary accounts are formally integrated with the City's general ledger accounts. As a result, budgetary financial statements present actual vs. budgetary comparisons, thus enhancing budgetary control and management decision making. The City also utilizes encumbrance accounting to assure effective budgetary control and accountability and to facilitate effective cash planning and control. Encumbrances are commitments related to unperformed (executory) contracts for goods or services and are recorded and reported as restrictions, commitments or assignments of fund balance. Outstanding encumbrances do not constitute expenditures or liabilities.
11

Other internal controls employed by the City in the management of its resources includes formal review procedures in the filling of vacant positions (Position Control), in the processing of purchase orders and contracts, payroll transactions, inventory and in the handling of cash. Funding for vacant positions is not provided in the City's budget. Budget Amendments: The City's Charter establishes the procedures for amending the operating and capital budgets during the fiscal year and for the processing of transfers between appropriations. The Common Council must formally approve amendments to the budget that increase overall spending or the spending level of individual departments. Transfers within the budgets of departments may be made by the Budget Department within specified limits as requested by department heads or deemed necessary by the Budget Director. The Budget Director may also employ a budgetary allotment system and may set aside an amount not to exceed twenty percent of unobligated appropriations for possible emergencies arising during the budget year. Independent Audit: The City of White Plains issues a Comprehensive Annual Financial Report (CAFR) which is audited by an independent certified public accountant. The City's financial records are also audited on a periodic basis by the Office of the Comptroller of the State of New York. The City of White Plains has earned the GFOA’s Certificate of Achievement for Excellence in Financial Reporting each year since 1981 and the GFOA’s Distinguished Budget Presentation Award each year since 1984. MANAGEMENT POLICIES - FISCAL PERFORMANCE GOALS The City's Fiscal Performance Goals, which were formally adopted by the Common Council on May 18, 1981 and subsequently amended on May 6, 1985, May 3, 2010 and April 1, 2013, represent ongoing policies to guide the City's financial management practices. While some of the performance goals are specific and will limit certain types of financial activity, the goal statements are not intended to restrict the Common Council's ability and responsibility to respond to emergencies or service delivery requirements above or beyond the limitations established by the Fiscal Performance Goals. The City's goals are: REVENUE PERFORMANCE GOALS
• The City will maintain a diversified and stable revenue system as protection from short-run fluctuations.
• The City will estimate annual revenues on an objective and reasonable basis. The City will develop a method to project revenues, expenditures/expenses and fund balance on a multi-year basis.
• The City will use one-time or special purpose revenues for capital expenditures, reduction of outstanding debt or for expenditures required by the revenue, and not to subsidize recurring operating and maintenance costs.
12
• The City will establish and annually re-evaluate all user charges and fees at a level related to the cost of providing the services.
• The City will endeavor to reduce reliance on the property tax by developing and expanding alternative revenue sources.
• The City will endeavor to improve and diversify the City’s mix of commercial and residential properties.
• The proprietary funds (Self-Insurance Fund, Water Fund and Sewer Rent Fund) will maintain revenues sufficient to support their respective full direct and indirect costs.
OPERATING EXPENDITURES PERFORMANCE GOALS
• The Budget Director will propose and the Common Council will adopt and maintain a balanced budget in which expenditures will not be allowed to exceed reasonable estimated resources and revenues.
• The City will pay for all current operating and maintenance expenses from current revenue sources.
• The operating budget will provide for the adequate maintenance of capital assets and equipment.
• The budget will provide for adequate funding of all employee benefit programs. • The City will maintain a budgetary control system that will enable it to adhere to the
adopted budget. • The City will maintain a system of financial and budgetary reporting that provides
comparative actual to budget results. • The City will develop and implement an effective risk management program to minimize
losses and reduce costs. The Common Council will ensure that adequate resources and insurance are in place. This shall include coverage for general and automobile liability, unemployment and Workers Compensation.
• The City will encourage delivery of services by other public and private organizations whenever and wherever greater efficiency and effectiveness can be expected, as well as to develop and internally use technology and productivity advancements that will help reduce or avoid increasing personnel costs. The intent is to control personnel costs as a proportion of the total budget, to more productively and creatively use available resources, and to avoid duplication of effort and resources.
RESERVE PERFORMANCE GOALS
• The City will establish annually in the operating budget a reserve for financing to: o provide for settlement of pending labor contract negotiations; o provide for temporary funding of unforeseen needs of an emergency or non-
recurring nature; o permit orderly budgetary adjustments when revenues are lost through the
actions of other governmental bodies; o provide the local match for public or private grants; and o meet unexpected small increases in service delivery costs.
13

• The reserve for financing will be budgeted at a level sufficient to provide for settlement of pending labor contract negotiations plus an amount not to exceed one percent (1%) of the proposed tax budget. Use of the contingency funds will only be by action of the Common Council. The reserve for financing shall be separate from any component of fund balance (restricted, committed or assigned) used to fund subsequent year’s expenditures.
• The City will maintain an employee position control reserve account. Funding will be provided from salary lines plus related benefits as positions become vacant during the fiscal year. Funding for personnel to fill authorized but unfilled budgetary salary positions will be provided from the position control reserve account. The Budget Department will be responsible for the control of the reserve account. The Personnel Department will be responsible for ensuring that positions are filled only when adequate funds are available in the reserve account.
• The City will maintain spendable fund balance in an amount necessary to maintain adequate cash flow to prevent the demand for short-term borrowing, the disruption of services to its citizens due to unexpected temporary revenue shortfalls or unpredicted one-time expenditures and the need for large increases in the property tax rate . The fund balance has been accumulated to provide stability and flexibility to respond to unexpected adversity and/or opportunities.
• The fund balance comprised of amounts restricted for tax stabilization or subsequent year’s expenditures, amounts assigned for subsequent year’s expenditures, plus unassigned fund balance shall be maintained at a minimum of fifteen percent (15%) of the General Fund total expenditures and shall be separate from the amount provided for in the reserve for financing.
• When the previously identified fund balance comprised of amounts restricted for tax stabilization or subsequent year’s expenditures, amounts assigned for subsequent year’s expenditures, plus unassigned fund balance falls below the 15% of total expenditures target, a plan shall be developed to replenish the deficient amount as soon as is necessary and/or reasonable, but in no event over a period greater than five years after the original determination was made that the amount was below target level.
• The Common Council is the highest level of decision-making authority and may restrict, commit, or assign portions of fund balance by adopted resolution and/or ordinance. The Common Council has designated the Commissioner of Finance as the official having authority to assign portions of fund balance categories based on generally accepted accounting principles. The City will expend funds in the following order: restricted first, the committed, then assigned, and lastly, unassigned.
INVESTMENT PERFORMANCE GOALS
The City’s primary investment performance objectives, in priority order, shall be legality, safety, liquidity and yield.
The City will develop a cash flow analysis of all funds on a regular basis. Collections, deposits and disbursements of all funds will be scheduled to ensure maximum cash availability.
14

The City will optimize the return on all cash investments. Where permitted by law, cash from several separate funds and sources will be pooled to
optimize investment yields. Interest will be credited to the sources of the invested monies.
The Department of Finance will provide quarterly information to the Common Council concerning investment performance.
CAPITAL IMPROVEMENTS PERFORMANCE GOALS
• Capital improvements will be based on long range projected needs rather than on immediate needs in order to minimize future maintenance, replacement, and capital costs.
• All capital improvements will be made in accordance with the City's approved five year capital improvement program (CIP). The CIP shall be updated annually.
• The development of the CIP will be coordinated with the operating budget in order to maintain a reasonably stable total tax levy.
• The City will identify the estimated cost and potential funding sources for each capital project proposed in the CIP before submission to review bodies and the Common Council.
• Future annual costs associated with a proposed capital improvement, including annual debt service and operating and maintenance costs will be estimated and included in the CIP and updated if necessary before a decision to implement a project is made by the Common Council.
• Federal, State and other intergovernmental and private funding sources shall be sought out and used as available to assist in financing capital improvements.
DEBT PERFORMANCE GOALS
• The City will limit long-term debt to only those capital improvements that cannot be financed from current revenues.
• The maturity of any debt will not exceed the period of probable usefulness (PPU) provided for in the New York State Local Finance Law.
• Thirty percent (30%) of the City's available general obligation debt limit shall be reserved for emergency purposes.
• As a means of further minimizing the impact of debt obligations on the City taxpayers: o The total net indebtedness (total general obligations less exclusions for water
projects, sewer projects and current debt principal appropriations) shall not exceed five percent (5%) of the full assessment value of taxable property;
o long-term net debt shall not exceed $2,000 per capita; o these limitations shall not apply to any debt incurred for emergency purposes.
• The City will avoid the issuance of budget, tax and revenue anticipation notes. • The City will issue debt that will be repaid from special assessments, specific revenues
(such as water rents, sewer rents, parking revenues, etc.) and/or any source other than property taxes (“self-liquidating debt”) whenever reasonable and appropriate.
15
• The City will prepare and distribute an official statement whenever required for the issuance of debt and maintain compliance with the annual reporting requirements of Securities and Exchange Commission (SEC) Rule 15c2-12 (municipal securities disclosure).
• The City shall encourage and maintain good relations with financial and bond rating agencies, and will follow a policy of full and open disclosure on every financial report and official statement.
FINANCIAL REPORTING PERFORMANCE GOALS
• The City will adhere to a policy of full and open public disclosure of all financial activity. The proposed tax budget will be prepared in a manner to maximize its understanding by citizens and elected officials. Copies of financial documents will be made publicly available. Opportunities will be provided for full citizen participation prior to final decisions on adopting the budget. Detailed budgetary information; i.e. specific sources of revenue and objects of expenditure, will be made publicly available.
• The City shall include in the proposed and adopted tax budget documents an explanation as to how the budget compares to the City’s Fiscal Performance Goals.
• The City's accounting system will maintain records on a basis consistent with generally accepted accounting principles.
• The Commissioner of Finance will prepare regular quarterly and annual financial reports presenting a summary of financial activity by major types of funds and programs.
• The City will prepare The Comprehensive Annual Financial Report in conformity with generally accepted accounting principles and financial reporting best practices.
• The City will employ an independent certified public accounting firm to perform an annual audit of all funds, authorities, agencies, and grant programs and will make the annual audited report publicly available. The audit shall be completed and submitted to the Common Council within 180 days of the close of the City's fiscal year.
• The annual audit of the City will be conducted in accordance with auditing standards generally accepted in the United States of America and Government Auditing Standards issued by the Comptroller General of the United States and in conformity with accounting principles generally accepted in the United States of America.
• The annual audit of the City will comply with the requirements of the U.S. Office of Management and Budget Circular A-133, Audits of States, Local Governments and Non-Profit Organizations (“Single Audit”).
• The City each year will submit its CAFR to the GFOA for the GFOA’s Certificate of Achievement for Excellence in Financial Reporting award program.
16

FINANCIAL
SECTION
17

18
O’CONNOR DAVIES, LLP500 Mamaroneck Avenue, Suite 301, Harrison, NY 10528 I Tel: 914.381.8900 I Fax: 914.381.8910 I www.odpkf.com
O’Connor Davies, LLP is a member firm of the PKF International Limited network of legally independent firms and does not accept any responsibility or liability for the actions or inactions on the part of any other individual member firm or firms.
Independent Auditors' Report
The Honorable Mayor and Common Councilof the City of White Plains, New York
Report on the Financial Statements
We have audited the accompanying financial statements of the governmental activities, the business-type activities, the aggregate discretely presented component units, each major fund and the aggregate remaining fund information of the City of White Plains, New York (“City”) as of and for the year ended June 30, 2013, and the related notes to the financial statements, which collectively comprise the City’s basic financial statements as listed in the table of contents.
Management’s Responsibility for the Financial Statements
Management is responsible for the preparation and fair presentation of these financial statements in accordance with accounting principles generally accepted in the United States of America; this includes the design, implementation and maintenance of internal control relevant to the preparation and fair presentation of financial statements that are free from material misstatement, whether due to fraud or error.
Auditors’ Responsibility
Our responsibility is to express opinions on these financial statements based on our audit. We conducted our audit in accordance with auditing standards generally accepted in the United States of America and the standards applicable to financial audits contained in Government Auditing Standards, issued by the Comptroller General of the United States. Those standards require that we plan and perform the audit to obtain reasonable assurance about whether the financial statements are free from material misstatement.
An audit involves performing procedures to obtain audit evidence about the amounts and disclosures in the financial statements. The procedures selected depend on the auditors’ judgment, including the assessment of the risks of material misstatement of the financial statements, whether due to fraud or error. In making those risk assessments, the auditor considers internal control relevant to the entity’s preparation and fair presentation of the financial statements in order to design audit procedures that are appropriate in the circumstances, but not for the purpose of expressing an opinion on the effectiveness of the entity’s internal control. Accordingly, we express no such opinion. An audit also includes evaluating the appropriateness of accounting policies used and the reasonableness of significant accounting estimates made by management, as well as evaluating the overall presentation of the financial statements.
We believe that the audit evidence we have obtained is sufficient and appropriate to provide a basis for our audit opinions.
Opinions
In our opinion, the financial statements referred to above present fairly, in all material respects, the respective financial position of the governmental activities, the business-type activities, the aggregate discretely presented component units, each major fund and the aggregate remaining fund information of the City, as ofJune 30, 2013, and the respective changes in financial position and, where applicable, cash flows thereof and the respective budgetary comparison for the General Fund for the year then ended in accordance with accounting principles generally accepted in the United States of America.
19

Other Matters
Required Supplementary Information
Accounting principles generally accepted in the United States of America require that Management’s Discussion and Analysis and the Schedule of Funding Progress – Other Post Employment Benefits be presented to supplement the basic financial statements. Such information, although not a part of the basic financial statements, is required by the Governmental Accounting Standards Board, who considers it to be an essential part of financial reporting for placing the basic financial statements in an appropriate operational, economic or historical context. We have applied certain limited procedures to the required supplementary information in accordance with auditing standards generally accepted in the United States of America, which consisted of inquiries of management about the methods of preparing the information and comparing the information for consistency with management’s responses to our inquiries, the basic financial statements and other knowledge we obtained during our audit of the basic financial statements. We do not express an opinion or provide any assurance on the information because the limited procedures do not provide us with sufficient evidence to express an opinion or provide any assurance.
Supplementary and Other Information
Our audit was conducted for the purpose of forming opinions on the financial statements that collectively comprise the City’s basic financial statements. The combining and individual fund financial statements and schedules, the schedule of expenditures of federal awards as required by U.S. Office of Management and Budget Circular A-133, Audits of States, Local Governments and Non-Profit Organizations and the introductory and statistical sections are presented for purposes of additional analysis and are not a required part of the basic financial statements.
The combining and individual fund financial statements and schedules and the schedule of expenditures of federal awards are the responsibility of management and were derived from and relate directly to the underlying accounting and other records used to prepare the basic financial statements. Such information has been subjected to the auditing procedures applied in the audit of the basic financial statements and certain additional procedures, including comparing and reconciling such information directly to the underlying accounting and other records used to prepare the basic financial statements or to the basic financial statements themselves, and other additional procedures in accordance with auditing standards generally accepted in the United States of America. In our opinion, the information is fairly stated, in all material respects, in relation to the basic financial statements as a whole.
The introductory and statistical sections have not been subjected to the auditing procedures applied in the audit of the basic financial statements and, accordingly, we do not express an opinion or provide any assurance on them.
Other Reporting Required by Government Auditing Standards
In accordance with Government Auditing Standards, we have also issued our report dated October 28, 2013 on our consideration of the City’s internal control over financial reporting and on our tests of its compliance with certain provisions of laws, regulations, contracts and grant agreements and other matters. The purpose of that report is to describe the scope of our testing of internal control over financial reporting and compliance and the results of that testing, and not to provide an opinion on the internal control over financial reporting or on compliance. That report is an integral part of an audit performed in accordance with Government Auditing Standards in considering the City’s internal control over financial reporting and compliance.
O'Connor Davies, LLPHarrison, New YorkOctober 28, 2013
20
CITY OF WHITE PLAINS, NEW YORK MANAGEMENT’S DISCUSSION AND ANALYSIS Fiscal Year Ended June 30, 2013
The City of White Plains, New York (“City”) presents this Management’s Discussion and Analysis (“MD&A”) as an overview of the City’s financial activities for the fiscal year ended June 30, 2013. This MD&A focuses on current year activities, resulting changes to net position and currently known facts. This MD&A should be read in conjunction with the transmittal letter and the City’s financial statements, including the notes to the financial statements. Financial Highlights
The City’s total net position (assets and deferred outflows of resources, less liabilities and deferred inflows of resources) at June 30, 2013 was $139.3 million. The net position of governmental activities was $107.7 million (including an unrestricted net position deficit of $78 million), and the net position of business-type activities was $31.6 million (including an unrestricted net position of $6.1 million).
The City’s total net position decreased $24 million (14.7%) from the prior fiscal year. The net position of governmental activities decreased $24.9 million (18.8%) and net position of business-type activities increased $1 million (3.2%).
General revenues for the year ended June 30, 2013 were $117.4 million compared to $116.2 million for year ended June 30, 2012; an increase of $1.2 million (1%). Program revenues of $67.6 million for the year ended June 30, 2013 were $8.9 million (15.2%) higher than the $58.7 million of program revenues reported for the prior fiscal year.
Primary government expenses of $208.8 million reported for fiscal year ended June 30, 2013 increased $11.1 million (5.6%) over primary government expenses of $197.7 million reported for the year ended June 30, 2012.
Net program expenses of $141.3 million were reported for the primary government for fiscal year ended June 30, 2013. This compares with $139 million of net program expenses reported for fiscal year ended June 30, 2012.
At June 30, 2013, the City’s governmental funds reported combined fund balances of $33.3 million. Of this amount, $1.7 million is not in spendable form or is required to be maintained intact; $15.8 million is legally restricted; $1million has been committed by Common Council ordinance and $13.7 million has been assigned by the Common Council or Commissioner of Finance, leaving $1.1 million as unassigned.
The City’s total bonded debt at June 30, 2013 was $112.8 million, an increase of $3.7 million (3.4%) from the $109.2 million outstanding at the prior fiscal year end.
Overview of the Financial Statements This discussion and analysis is intended to serve as an introduction to the City’s basic financial statements, which consist of three components: 1) the government-wide financial statements, 2) the fund financial statements and 3) the notes to financial statements. This report also includes supplementary information, which is intended to give the reader additional detail in support of the basic financial statements.
21

Supplementary Information
Other than MD&A
Government-Wide
Financial Statements
Fund Financial
Statements
Management's Discussion & Analysis
Notes to the Financial Statements
Required Supplementary Information
Government-wide Financial Statements The government-wide financial statements are designed to provide readers with a broad overview of the City’s finances in a manner similar to a private-sector business. The statement of net position presents financial information on all of the City’s assets, liabilities, and deferred inflows/outflows of resources, with the difference reported as net position. Over time, increases or decreases in net position may serve as a useful indicator of whether the financial position of the City is improving or deteriorating. The statement of activities presents information showing how the City’s net position changed during the most recent fiscal year. All changes in net position are reported as soon as the underlying event giving rise to the change occurs, regardless of the timing of related cash flows. Thus, revenues and expenses are reported for some items that will only result in cash flows in future fiscal periods (e.g., uncollected taxes and earned but unused vacation leave). Each of the government-wide financial statements distinguishes “governmental activities” of the City that are principally supported by taxes and intergovernmental revenues from “business-type activities” of the City that recover all or a significant portion of their costs through external user fees and charges. Governmental activities includes basic services provided by the City, such as the work of elected officials and general government services (licenses and permits; birth, death and marriage certificates, etc.), public works, parking, public safety, recreation and culture, and community services. The City’s business-type activities include the supply and distribution of clean drinking water and the provision of sanitary sewer services. The City’s government-wide financial statements include not only the statements of the City itself (known as the primary government), but that of its legally separate component units for which the City is financially accountable and for which there exists a financial benefit or burden to the City. Financial information for these component units is reported separately (“discretely presented”) from the financial information presented for the primary government. The White Plains Urban Renewal Agency and the White Plains Cable Television Commission are reported in the government-wide financial statements as discretely presented component units. Fund Financial Statements A fund is defined as a fiscal and accounting entity with a self-balancing set of accounts recording
22

cash and other financial resources, together with all related liabilities and residual equities or balances, and changes therein, which are segregated for the purpose of carrying on specific activities or attaining certain objectives in accordance with special regulations, restrictions or limitations. The City, like other governments, uses fund accounting to ensure and demonstrate compliance with finance-related legal requirements. All of the City’s funds can be divided into three categories: governmental funds, proprietary funds and fiduciary funds. Governmental Funds Most of the City’s basic services are reported in the governmental funds. The activities reported are essentially the same as those presented in the governmental activities section of the government-wide financial statements. However, unlike the government-wide financial statements, the governmental fund financial statements focus on near-term inflows and outflows of spendable resources (the budget), as well as on balances of spendable resources available at year end (fund balance). Such information may be useful in assessing a government’s near-term financing requirements. Since the focus of governmental funds is narrower than that of the government-wide financial statements, it is useful to compare the information presented for governmental funds with similar information presented for governmental activities in the government-wide financial statements. By doing so, readers may better understand the long-term impact of the City's near-term financing decisions. Both the governmental fund balance sheet and the governmental fund statement of revenues, expenditures and changes in fund balances provide a reconciliation to facilitate this comparison between governmental funds and governmental activities. The City maintains 18 individual governmental funds (a General Fund, Capital Projects Fund, Debt Service Fund, Permanent Fund and 14 Special Revenue Funds). The General Fund and the Capital Projects Fund are considered “major” funds and the remaining 16 governmental funds are considered “nonmajor” funds. The major funds are presented separately and the nonmajor funds are combined and reported in the aggregate in the governmental funds balance sheet and in the governmental funds statement of revenues, expenditures and changes in fund balance. The nonmajor funds are presented separately in the combining and individual fund financial statements. The City adopts annual budgets for its General Fund, Library Fund and Debt Service Fund. A budgetary comparison statement has been provided for the General Fund and budgetary comparison schedules have been provided for the Library Fund and Debt Service Fund to demonstrate compliance with their respective adopted budgets. Multi-year capital projects budgets are adopted individually in accordance with the City’s Capital Improvement Program. Proprietary Funds Proprietary funds are operated and accounted for much like a private-sector business. The proprietary fund category includes “enterprise funds”, which are used to report an activity for which a fee is charged predominantly to external users of goods or services, and “internal service funds”, which are used to report an activity for which a fee is charged predominantly to internal users of goods or services. The Water Fund and the Sewer Rent Fund are enterprise funds, charging customers for the use of City-provided water and sanitary sewers, respectively. The services provided by the Water Fund and the Sewer Rent Fund have been classified as business-type activities in the government-wide financial statements because they predominantly benefit external customers.
23

The Self Insurance Fund is an internal service fund, charging other City departments for costs related to risk management and insurance services. The services provided by the Self Insurance Fund have been classified as governmental activities in the government-wide financial statements because they predominantly benefit governmental, rather than business-type, functions. Proprietary funds provide the same type of information as the government-wide financial statements, only in more detail and with the addition of a statement of cash flows. Fiduciary Funds Fiduciary funds are used to report assets held in a trustee or agency capacity for others. Fiduciary funds are not reflected in the government-wide financial statements because the resources of those funds are not available to support City programs. The City maintains one fiduciary fund: the Agency Fund. The resources of the Agency Fund are held by the City in a custodial capacity for individuals, private organizations and other governments. Notes to the financial statements The notes to the financial statements provide additional information that is essential for fair presentation and that is not otherwise displayed on the face of the financial statements. As such, the notes are an integral part of the basic financial statements and should be read in conjunction with the financial statements. The notes focus on the primary government – specifically, its governmental activities, business-type activities, major funds and nonmajor funds in the aggregate. Information concerning the City’s component units is also provided in the notes. Other Information In addition to the basic financial statements and notes to the financial statements, this report also presents required supplementary information (RSI) concerning the City’s progress in funding its obligation to provide OPEB benefits to its employees. RSI immediately follows the notes to the financial statements. This report also includes supplementary information (SI), which immediately follows RSI and gives the reader further detail on the information presented in the basic financial statements. Included in SI are the individual and combining nonmajor governmental fund financial statements and schedules; the project length schedule for the Capital Projects Fund and the OMB Circular A-133, Audits of States, Local Governments and Non-Profit Organizations compliance audit of federal awards programs. Government-wide Financial Analysis The largest portion of the City’s net position reflects its investment in capital assets (land, buildings and facilities, machinery and equipment, rolling stock and infrastructure), less accumulated depreciation and any outstanding debt that was used to acquire those assets. The City uses these capital assets to provide a variety of services to its citizens and as a result these assets are not available for future spending. Although the City’s investment in capital assets is reported net of related debt, the resources used to repay this debt must be provided from other sources, since the capital assets themselves cannot be used to liquidate these liabilities.
24

Total Total
Governmental Business-type Primary Governmental Business-type Primary
Activities Activities Government Activities Activities Government
Current assets 76,962,972$ 10,059,074$ 87,022,046$ 78,573,925$ 9,982,919$ 88,556,844$
Capital assets, net 261,909,846 38,437,058 300,346,904 254,659,150 39,322,120 293,981,270
Total assets 338,872,818 48,496,132 387,368,950 333,233,075 49,305,039 382,538,114
Deferred outflows of resources 1,024,213 131,563 1,155,776 1,154,928 146,370 1,301,298
Current liabilities 34,574,778 1,812,270 36,387,048 32,961,023 3,502,673 36,463,696
Long-term liabilities 196,921,085 15,240,119 212,161,204 168,817,098 15,341,116 184,158,214
Total liabilities 231,495,863 17,052,389 248,548,252 201,778,121 18,843,789 220,621,910
Deferred inflows of resources 721,820 - 721,820 - - -
Net Position:
Net investment in capital assets 173,961,957 25,513,639 199,475,596 174,505,406 25,738,798 200,244,204
Restricted 11,709,998 - 11,709,998 10,356,209 - 10,356,209
Unrestricted (77,992,607) 6,061,667 (71,930,940) (52,251,733) 4,868,822 (47,382,911)
Total Net Position 107,679,348$ 31,575,306$ 139,254,654$ 132,609,882$ 30,607,620$ 163,217,502$
City of White Plains, New York
Net Position
June 30, 2013 June 30, 2012
A portion of the City’s net position is restricted, representing external restrictions imposed by creditors, grantors, contributors, or laws or regulations of other governments, or imposed by law through constitutional provisions or enabling legislation. From fiscal 2012 to fiscal 2013, the restricted portion of net position increased by $1.3 million. The City’s unrestricted net position decreased $24.5 million from the prior fiscal year primarily due to the recording of the City’s 2013 OPEB obligation of $21.3 million.
25
Total Total
Governmental Business-type Primary Governmental Business-type Primary
Activities Activities Government Activities Activities Government
Revenues:
Program revenues:
Charges for services 37,248,385$ 14,161,018$ 51,409,403$ 36,578,201$ 11,870,537$ 48,448,738$
Operating grants and
contributions 15,142,295 85,226 15,227,521 9,837,674 - 9,837,674
Capital grants and
contributions 879,328 - 879,328 489,980 - 489,980
General revenues:
Taxes and related items 107,181,963 - 107,181,963 105,447,965 - 105,447,965
Intergovernmental 7,013,667 - 7,013,667 6,728,416 - 6,728,416
Other 2,802,652 355,796 3,158,448 3,744,381 280,384 4,024,765
Transfers - - - - - -
Total Revenues 170,268,290 14,602,040 184,870,330 162,826,617 12,150,921 174,977,538
Expenses:
Council and Boards 644,007 - 644,007 609,669 - 609,669
General Government 28,761,320 - 28,761,320 29,121,245 - 29,121,245
Public Works 43,592,762 - 43,592,762 40,343,689 - 40,343,689
Parking 15,140,993 - 15,140,993 12,404,604 - 12,404,604
Public Safety 75,140,524 - 75,140,524 70,987,760 - 70,987,760
Community Services 28,644,014 - 28,644,014 29,082,143 - 29,082,143
Interest 3,275,204 - 3,275,204 2,795,816 - 2,795,816
Water - 11,691,872 11,691,872 - 10,499,382 10,499,382
Sewer - 1,942,482 1,942,482 - 1,891,531 1,891,531
Total Expenses 195,198,824 13,634,354 208,833,178 185,344,926 12,390,913 197,735,839
Change in Net Position (24,930,534) 967,686 (23,962,848) (22,518,309) (239,992) (22,758,301)
Net Position - Beginning 132,609,882 30,607,620 163,217,502 155,128,191 30,847,612 185,975,803
Net Position, Ending 107,679,348$ 31,575,306$ 139,254,654$ 132,609,882$ 30,607,620$ 163,217,502$
City of White Plains, New York
Changes in Net Position
June 30, 2013 June 30, 2012
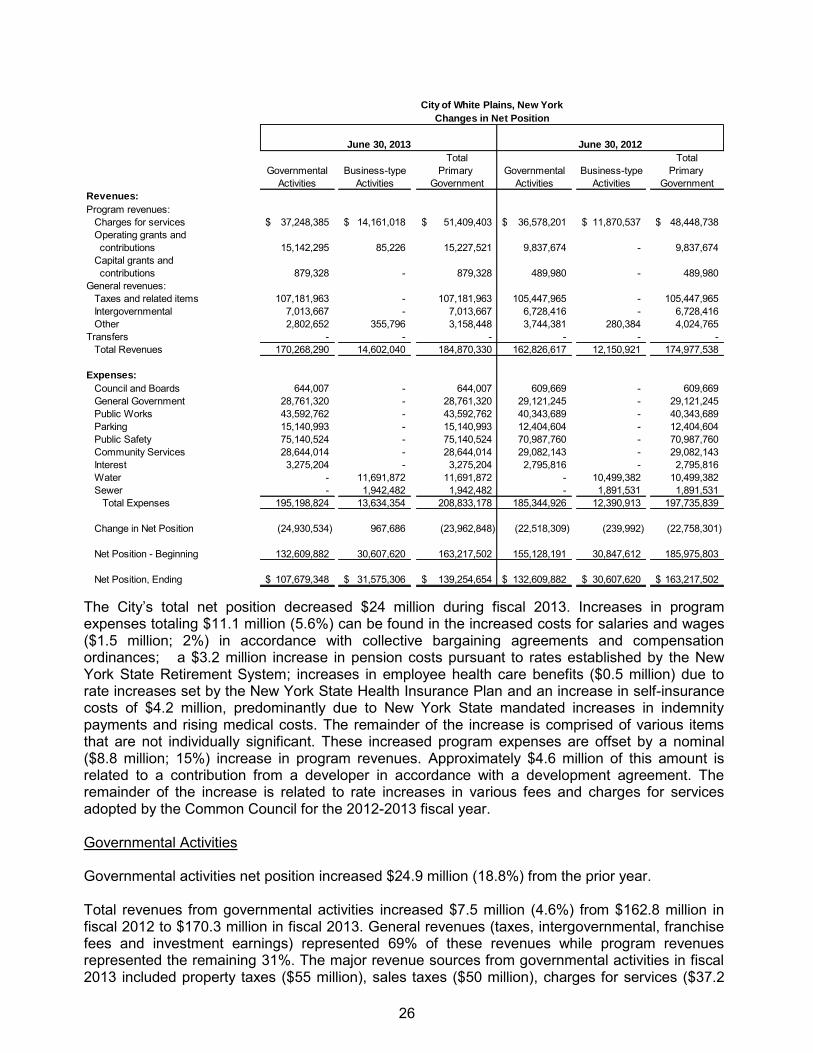
The City’s total net position decreased $24 million during fiscal 2013. Increases in program expenses totaling $11.1 million (5.6%) can be found in the increased costs for salaries and wages ($1.5 million; 2%) in accordance with collective bargaining agreements and compensation ordinances; a $3.2 million increase in pension costs pursuant to rates established by the New York State Retirement System; increases in employee health care benefits ($0.5 million) due to rate increases set by the New York State Health Insurance Plan and an increase in self-insurance costs of $4.2 million, predominantly due to New York State mandated increases in indemnity payments and rising medical costs. The remainder of the increase is comprised of various items that are not individually significant. These increased program expenses are offset by a nominal ($8.8 million; 15%) increase in program revenues. Approximately $4.6 million of this amount is related to a contribution from a developer in accordance with a development agreement. The remainder of the increase is related to rate increases in various fees and charges for services adopted by the Common Council for the 2012-2013 fiscal year. Governmental Activities Governmental activities net position increased $24.9 million (18.8%) from the prior year. Total revenues from governmental activities increased $7.5 million (4.6%) from $162.8 million in fiscal 2012 to $170.3 million in fiscal 2013. General revenues (taxes, intergovernmental, franchise fees and investment earnings) represented 69% of these revenues while program revenues represented the remaining 31%. The major revenue sources from governmental activities in fiscal 2013 included property taxes ($55 million), sales taxes ($50 million), charges for services ($37.2
26

million) and operating grants and contributions ($15.1 million). Property tax revenues increased $2.9 million (5.6%) due to a fiscal 2013 property tax rate increase of 4.7%. Charges for services increased $.7 million due to increases in parking, recreation and parks and youth bureau fees. Operating grants and contributions increased $5.3 million (54.1%) due to the final payment from the Urban Renewal Agency for the sale of property located on Bank Street.
Program expenses increased $9.9 million (5.3%) over fiscal 2012. As noted earlier, the most significant increases in program expenses can be found in the rising rates for pensions, health care benefits and risk/insurance.
27
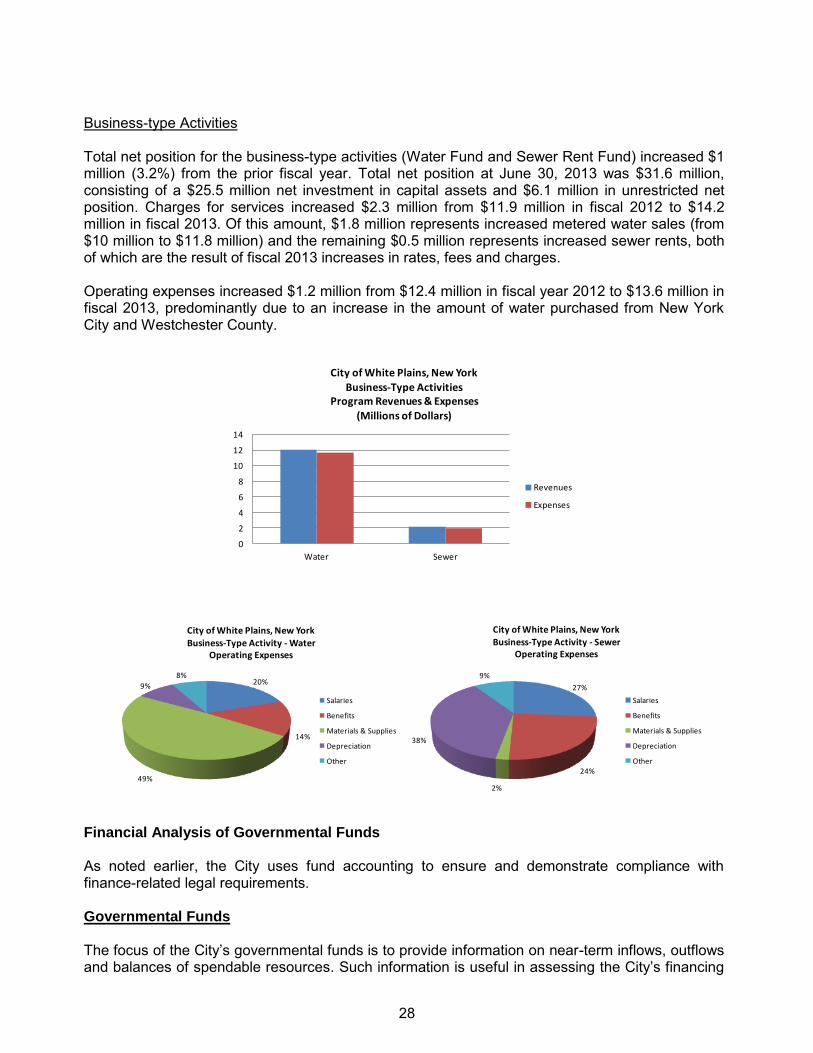
Business-type Activities Total net position for the business-type activities (Water Fund and Sewer Rent Fund) increased $1 million (3.2%) from the prior fiscal year. Total net position at June 30, 2013 was $31.6 million, consisting of a $25.5 million net investment in capital assets and $6.1 million in unrestricted net position. Charges for services increased $2.3 million from $11.9 million in fiscal 2012 to $14.2 million in fiscal 2013. Of this amount, $1.8 million represents increased metered water sales (from $10 million to $11.8 million) and the remaining $0.5 million represents increased sewer rents, both of which are the result of fiscal 2013 increases in rates, fees and charges. Operating expenses increased $1.2 million from $12.4 million in fiscal year 2012 to $13.6 million in fiscal 2013, predominantly due to an increase in the amount of water purchased from New York City and Westchester County.
0
2
4
6
8
10
12
14
Water Sewer
City of White Plains, New YorkBusiness-Type Activities
Program Revenues & Expenses(Millions of Dollars)
Revenues
Expenses
20%
14%
49%
9%
8%
City of White Plains, New YorkBusiness-Type Activity - Water
Operating Expenses
Salaries
Benefits
Materials & Supplies
Depreciation
Other
27%
24%
2%
38%
9%
City of White Plains, New YorkBusiness-Type Activity - Sewer
Operating Expenses
Salaries
Benefits
Materials & Supplies
Depreciation
Other
Financial Analysis of Governmental Funds As noted earlier, the City uses fund accounting to ensure and demonstrate compliance with finance-related legal requirements. Governmental Funds The focus of the City’s governmental funds is to provide information on near-term inflows, outflows and balances of spendable resources. Such information is useful in assessing the City’s financing
28

requirements. In particular, spendable fund balance may be a useful measure of a government’s net resources available for spending at the end of the fiscal year. At June 30, 2013, the City’s governmental funds reported combined fund balances of $33.3 million. Of this amount, $1.7 million is nonspendable because it is not in spendable form (inventory, prepaid items, and long-term receivables) or represents an amount required to be maintained intact in perpetuity (endowment). The remaining $31.6 million of fund balance is in spendable form as follows; $15.8 million is restricted to specific uses by laws or regulations, debt covenants, grantors, contributors and/or enabling legislation; $1 million has been committed by the Common Council for costs related to contracts, recreation and open space and parking improvements; $13.7 million has been assigned by the Common Council or the Commissioner of Finance for purchase orders, tax certiorari and for subsequent year’s expenditures, leaving $1.1 million of fund balance unassigned to any specific purpose. Significant changes that account for the $4.3 million decrease in the City’s governmental fund balances from fiscal year 2012 ($37.6 million) to fiscal year 2012 ($33.3 million) can be found in the restricted component of fund balance. A decrease of $5.3 million in the amount restricted for capital projects (predominantly unspent proceeds of bonds) was offset by an increase of $1 million in the amount restricted for debt service.
General Fund The City’s main operating fund is the General Fund and the majority of the City’s programs and activities are supported by this fund. At June 30, 2013, total fund balance of the General Fund was $32.4 million, an increase of $5.1 million (18.7%) from the prior fiscal year. Of the $32.4 million total fund balance, $1.7 million is not in spendable form (inventory, prepaid items, and long-term receivables). The remaining $30.7 million of fund balance is in spendable form as follows; $10.1 million is restricted to specific uses by enabling legislation (tax stabilization arrangement); $0.7 million has been committed by the Common Council for recreation and open space purposes and $1.5 million and $5.8 million has been assigned by the Commissioner of Finance for purchases on order and tax certiorari, respectively. The Common Council has assigned $5.2 million for subsequent year’s expenditures (2013-2014 budget appropriation) and $1.3 million for the payment of a State loan in the 2013-2014 fiscal year. The remaining $6.1 million represents unassigned fund balance. Revenues of the General Fund exceeded expenditures by $14.5 million. When offset by other financing uses (net) of $9.4 million, fund balance increased $5.1 million from $27.3 million to $32.4 million. Comparing fiscal 2012 to 2013, total General Fund revenues increased $7.3 million (5.1%) from $142.4 million to $149.7 million. Of this amount, $2.3 million represents increased property tax revenues that can be attributed to a 2013 property tax rate increase of 4.7%. The remaining increases can be found in intergovernmental ($1.5 million), charges for services ($0.6 million), licenses and permits, and miscellaneous revenues ($4.3 million). Various rates associated with charges for services and license and permit fees were increased in fiscal year 2013. The increase in miscellaneous revenues represents a contribution from the Urban Renewal Agency for the sale of property. Total General Fund expenditures for fiscal 2013 were $5.8 million (4.5%) higher than the $129.4 million reported for fiscal 2012. Salary and wages increased $1.3 million due to contracted increases and employee benefits increased $3.6 million (9.4%) due to increased pension rates charged by the New York State Retirement System. Materials and supplies were up $0.3 million,
29
primarily to replenish road salt supplies. Direct costs increased $0.5 million, predominantly due to carting services needed for debris removal from super storm Sandy. Capital Projects Fund The Capital Projects Fund at June 30, 2013 had a total deficit fund balance of $5.1 million. This deficit will be eliminated when permanent financing is obtained for the associated projects. Proprietary Funds The City’s proprietary funds consist of two enterprise funds (Water Fund and Sewer Rent Fund) and one internal service fund (Self Insurance Fund). Factors concerning the finances of the Water Fund and the Sewer Rent Fund have already been addressed in the discussion on the City’s business-type activities. The total net position of the Self Insurance Fund at June 30, 2013 was a negative unrestricted $2.9 million, a $2.5 million increase from the $0.4 million deficit net position reported at June 30, 2012. Comparing fiscal 2012 to 2013, total revenues decreased $0.6 million (10.2%) from $5.9 million to $5.3 million. Total operating expenses increased $3.7 million (88.1%) from $4.2 million to $7.9 million. General Fund Budgetary Highlights The General Fund’s original appropriations budget of $146.8 million was increased $1.1 million (.7%) to $147.9 million through amendments during the fiscal year, to account for various grants awarded and adjustments to interfund service charges required after budget adoption. The final budget of $149.5 million included an amendment increasing transfers to the debt service fund by $1 million. Actual expenditures and other financing uses for fiscal year ended June 30, 2013 were $144.7 million, coming under the final amended budget by $4.8 million (3.3%). The City typically realizes various expenditure savings throughout the year due to its very conservative budgeting practices and its use of a position control account to monitor and control personnel costs. The City also experienced a very mild winter that helped reduce costs that would normally be higher to address snow, ice, sleet and freezing temperatures. Excluding appropriated fund balance, the difference between the City’s original revenue and other financing sources budget of $139 million and final budget of $140.7 million reflects the recognition of grant awards and contributions received after budget adoption. The City’s actual total revenues and other financing sources for fiscal year ended June 30, 2013 (exclusive of appropriated fund balance) were $149.7 million, a variance of $10.7 million (7.7%) over the original budget and $9.1 million (6.4%) over the final amended budget. A $4.2 million variance of actual sales tax revenues over the final amended budget, together with a $4.4 million variance of actual miscellaneous revenues (contribution from developer) over the final amended budget accounts for essentially all of this variance. As part of its conservative budgeting practices, the City does not budget for that portion of sales tax revenues restricted by law to a contingency and tax stabilization account (“rainy day fund”), which accounts for the positive variance in sales tax revenues. Capital Assets and Debt Administration Capital Assets At June 30, 2013, the City’s investment in capital assets, net of accumulated depreciation for its
30

governmental and business-type activities totaled $300 million, a increase of $6 million from the prior fiscal year. This reflects the City’s investment in all of its capital assets including land, buildings and facilities, machinery and equipment, rolling stock, infrastructure and construction-in-progress. Major capital activities during the 2013 fiscal year included:
Closure (still in progress) of the Gedney Way Landfill ($8.2 million)
Construction and reconstruction of parking facilities ($2.6 million)
Property acquisition and improvements ($4 million)
Depreciation expense of $6.4 million charged against buildings and facilities
Depreciation expense of $6.6 million charged against infrastructure Further information on the City’s capital asset activity for the fiscal year ended June 30, 2013 can be found in Note 3 of the notes to the financial statements. Long-term Debt At June 30, 2013, the City had total bonded debt outstanding of $110.5 million, an increase of $3.9 million from the prior year, reflecting the issuance of $9.7 million of new serial bonds, offset by debt liquidated pursuant to amortization schedules. New York State laws provide that the City can only issue general obligation bonds backed by the full faith and credit of the City. Debt of the City’s enterprise funds (Water Fund and Sewer Rent Fund) represented $12.7 million of total debt outstanding at fiscal year end. During the year, the City issued $9.9 million of general obligation bonds to fund various capital projects, including the acquisition of real property, construction of a municipal garage, building renovations and the purchase of rolling stock. At June 30, 2013 the City had authorized but unissued long-term debt in the amount of $37.5 million, including $15.8 million for a new parking facility; $11.3 million for landfill closure: $3.7 million for water system improvements; $1.3 million for library renovations and $5.4 million for various other capital improvements. The City is subject to a constitutional debt limit pursuant to Article VIII of the State Constitution and Title 9 of Article 2 of the Local Finance Law. This debt limit is equal to 7% of the latest five-year average full valuation of all taxable real property within the City. At June 30, 2013, the City exhausted 14.5% of its constitutional debt capacity and had the authority to issue up to an additional $536 million of general obligation long-term debt. Pursuant to the New York State Local Finance Law and the City Charter, the City authorizes the issuance of bonds by the adoption of a bond ordinance approved by two-thirds of the members of the Common Council. Customarily, the Common Council has delegated to the Commissioner of Finance, as Chief Fiscal Officer of the City, the power to authorize and sell bond anticipation notes. The Common Council has also delegated to the Commissioner of Finance the power to prescribe the details, form and content of, and to sell serial bonds authorized by the Common Council. Additional information on the City’s long-term debt can be found in Note 3 of the notes to the financial statements. Economic Factors and Next Year’s Budgets and Rates The following economic factors currently affect the City and were considered in developing the annual budget for the forthcoming fiscal year ending June 30, 2014:
31
It is important to preserve the City’s Aa1 credit rating.
The City must continue to budget estimated revenues and appropriations in a conservative manner and adhere to the City’s adopted fiscal performance goals.
The economic recession has abated somewhat, but recovery will be slow and incremental.
All fees and charges must be reviewed and set to appropriate levels.
The tax stabilization account will continue to benefit future budgets.
The City’s real property tax base continues to decline, but at a slower rate. Declines in housing prices and sales will continue to strain mortgage tax revenues and property values.
Salaries and employee benefits costs will continue to increase pursuant to collective bargaining agreements and rising pension and health care rates.
Interest rates are expected to remain at historically low levels. This presents both a challenge in terms of interest earnings and an opportunity in terms of debt management.
Tax certiorari challenges will remain at current levels. The City will not issue debt to finance tax certiorari settled or adjudged.
The City will continue to manage its risk through self-insurance.
A reserve for financing (contingent account) not to exceed 1% of the operating budget will continue to be provided in accordance with the City’s fiscal performance goals.
Departmental budgets must be reduced to adjust for the decline in major revenues and the current and foreseeable state of the economy.
The budget will adhere to the requirements of the Property Tax Levy Limit (“Tax Cap”) law enacted in 2011 and affecting current and forthcoming budgets. The law limits property tax levy increases, with some exceptions, to no more than 2% or the rate of inflation, whichever is less.
Fund balance will be appropriated to minimize the impact of a property tax increase. Requests for Information This comprehensive annual financial report is designed to provide a general overview of the City’s finances for all those who are interested. Questions concerning any of the information provided in this report, or requests for additional information, should be addressed to Michael A. Genito, Commissioner of Finance, City of White Plains, 255 Main Street, Room 102, White Plains, New York 10601, or by e-mail to [email protected].
32

BASIC FINANCIAL STATEMENTS
33

CITY OF WHITE PLAINS, NEW YORKSTATEMENT OF NET POSITIONJUNE 30, 2013
Governmental Business-typeActivities Activities Total
ASSETS Cash and cash equivalents 54,548,150$ 3,870,307$ 58,418,457$ Investments 7,121,661 - 7,121,661 Taxes receivable 3,548,867 - 3,548,867 Other receivables (net of allowance for uncollectibles) 7,459,612 6,383,743 13,843,355 Due from other governments and agencies 3,182,708 - 3,182,708 Internal balances 194,976 (194,976) - Inventory of supplies, at cost 842,194 - 842,194 Prepaid items 64,804 - 64,804 Capital assets, not being depreciated: Land 51,140,142 712,806 51,852,948 Construction-in-progress 16,238,332 3,599,742 19,838,074 Capital assets, net of accumulated depreciation: Buildings and facilities 124,259,274 3,784,922 128,044,196 Machinery and equipment 1,752,428 21,876 1,774,304 Rolling stock 8,420,744 491,381 8,912,125 Infrastructure 60,098,926 29,826,331 89,925,257 Total Assets 338,872,818 48,496,132 387,368,950
DEFERRED OUTFLOWS OF RESOURCES Deferred charges on refunding bonds 1,024,213 131,563 1,155,776
LIABILITIES Accounts payable 3,743,399 1,433,758 5,177,157 Contract retainage payable 637,132 12,482 649,614 Accrued liabilities 2,753,475 61,818 2,815,293 Accrued interest payable 730,409 139,104 869,513 Deposits 2,285,203 24,749 2,309,952 Due to other governments and agencies 16,276,980 - 16,276,980 Unearned revenue 3,637,969 - 3,637,969 Due to retirement systems 4,510,211 140,359 4,650,570 Noncurrent liabilities: Due within one year 12,855,034 937,666 13,792,700 Due in more than one year 184,066,051 14,302,453 198,368,504 Total Liabilities 231,495,863 17,052,389 248,548,252
DEFERRED INFLOWS OF RESOURCES Real property taxes received in advance of lien date 721,820 - 721,820
NET POSITION Net investment in capital assets 173,961,957 25,513,639 199,475,596 Restricted for: Capital projects 948,441 - 948,441 Debt service 1,680,991 - 1,680,991 Public safety 318,670 - 318,670 Community services 3,075,345 - 3,075,345 Nonrecurring repairs 626,822 - 626,822 Tax stabilization 5,048,663 - 5,048,663 Permanent Fund: Expendable 1,066 - 1,066 Nonexpendable 10,000 - 10,000 Unrestricted (77,992,607) 6,061,667 (71,930,940) Total Net Position 107,679,348$ 31,575,306$ 139,254,654$
Primary Government
The notes to the financial statements are and integral part of this statement
34

Urban Renewal CableAgency Television
-$ 430,085$ 5,013,306 -
- - - 232,719- - - - - - - -
2,743,760 - - -
- 62,207- 13,908- 24,989- -
7,757,066 763,908
- -
4,841,894 7,736- - - 10,728- - - 11,260- - - 100,000- 19,148
- 415- 257,349
4,841,894 406,636
- -
2,743,760 101,104
- - - - - - - - - - - -
- - - -
171,412 256,1682,915,172$ 357,272$
Component Units
35

CITY OF WHITE PLAINS, NEW YORKSTATEMENT OF ACTIVITIESFOR THE FISCAL YEAR ENDED JUNE 30, 2013
Operating CapitalCharges for Grants and Grants and
Expenses Services Contributions ContributionsFunctions/Programs:Primary government: Governmental activities: Council and boards 644,007$ -$ -$ -$ General government 28,761,320 3,686,259 4,840,219 65,000 Public works 43,592,762 1,593,371 1,518,928 650,528 Parking department 15,140,993 21,476,133 43,113 - Public safety 75,140,524 3,275,538 184,183 145,888 Community services 28,644,014 7,217,084 8,555,852 - Interest 3,275,204 - - 17,912 Total Governmental Activities 195,198,824 37,248,385 15,142,295 879,328
Business-type activities: Water 11,691,872 11,981,058 80,519 - Sewer 1,942,482 2,179,960 4,707 - Total Business-type Activities 13,634,354 14,161,018 85,226 -
Total Primary Government 208,833,178$ 51,409,403$ 15,227,521$ 879,328$
Component units: Urban Renewal Agency 5,119,765$ -$ -$ -$ Cable Television 724,199 603,829 - -
Total Component Units 5,843,964$ 603,829$ -$ -$
General Revenues:Taxes and related items:
Property taxSales taxHotel occupancy taxUtilities gross receipts tax
Intergovernmental - unrestrictedFranchise taxesUnrestricted investment earningsGain on sale of capital assetsMiscellaneousGain on sale of property Total General Revenues
Change in Net Position
Net Position - Beginning
Net Position - Ending
Program Revenues
The notes to the financial statements are an integral part of this statement.
36

Governmental Business-type Urban Renewal CableActivities Activities Total Agency Television
(644,007)$ -$ (644,007)$ -$ -$ (20,169,842) - (20,169,842) - - (39,829,935) - (39,829,935) - -
6,378,253 - 6,378,253 - - (71,534,915) - (71,534,915) - - (12,871,078) - (12,871,078) - -
(3,257,292) - (3,257,292) - - (141,928,816) - (141,928,816) - -
- 369,705 369,705 - - - 242,185 242,185 - - - 611,890 611,890 - -
(141,928,816) 611,890 (141,316,926) - -
- - - (5,119,765) - - - - - (120,370)
- - - (5,119,765) (120,370)
55,005,614 - 55,005,614 - - 49,913,997 - 49,913,997 - -
997,932 - 997,932 - - 1,264,420 - 1,264,420 - - 7,013,667 - 7,013,667 - -
729,899 - 729,899 - - 120,486 20,807 141,293 335,243 1,999
47,900 - 47,900 - - 1,904,367 334,989 2,239,356 41,018 11,483
- - - 4,600,004 - 116,998,282 355,796 117,354,078 4,976,265 13,482
(24,930,534) 967,686 (23,962,848) (143,500) (106,888)
132,609,882 30,607,620 163,217,502 3,058,672 464,160
107,679,348$ 31,575,306$ 139,254,654$ 2,915,172$ 357,272$
Net (Expense) Revenue and Changes in Net Position
Primary Government Component Units
37

CITY OF WHITE PLAINS, NEW YORKBALANCE SHEETGOVERNMENTAL FUNDSJUNE 30, 2013
Capital Nonmajor Total General Projects Governmental Governmental
Fund Fund Funds FundsASSETS Cash and cash equivalents 42,166,272$ 77,786$ 6,303,130$ 48,547,188$ Investments 4,218,316 - 840,057 5,058,373 Taxes receivable (net of allowance for uncollectibles) 3,548,867 - - 3,548,867 Other receivables (net of allowance for uncollectibles) 5,777,995 - 1,269,825 7,047,820 Due from other governments and agencies 2,589,370 76,165 517,173 3,182,708 Due from other funds 3,291,453 - - 3,291,453 Inventory of supplies, at cost 842,194 - - 842,194 Prepaid items 64,804 - - 64,804 Total Assets 62,499,271$ 153,951$ 8,930,185$ 71,583,407$
LIABILITIES Liabilities: Accounts payable 1,618,251$ 1,672,668$ 395,782$ 3,686,701$ Contract retainage payable 8,851 628,281 - 637,132 Accrued liabilities 2,347,577 - 401,999 2,749,576 Deposits 2,280,481 - 4,722 2,285,203 Due to other governments and agencies 16,276,980 - - 16,276,980 Due to other funds - 2,900,000 391,453 3,291,453 Unearned revenue - other 2,119,116 - 1,518,853 3,637,969 Due to retirement systems 4,264,394 - 235,974 4,500,368 Total Liabilities 28,915,650 5,200,949 2,948,783 37,065,382
DEFERRED INFLOWS OF RESOURCES Real property taxes levied but uncollected 478,457 - - 478,457 Real property taxes received in advance of lien date 721,820 - - 721,820 Total Deferred Inflows of Resources 1,200,277 - - 1,200,277
FUND BALANCES Nonspendable - not in spendable form: Inventory 842,194 - - 842,194 Prepaid items 64,804 - - 64,804 Long-term receivables 768,534 - - 768,534 Nonspendable endowment - - 10,000 10,000 Restricted: Library - - 111,508 111,508 Nonrecurring repairs - - 626,822 626,822 Tax stabilization 5,048,663 - - 5,048,663 Tax stabilization-for subsequent year's expenditures 5,100,000 - - 5,100,000 Debt service - - 1,680,991 1,680,991 Grantors and donors restrictions - - 2,894,199 2,894,199 Police purposes - - 318,670 318,670 Capital projects - - - - Committed: Recreation and open space 689,451 - 322,826 1,012,277 Recreation and open space-for subsequent year's expenditures 37,854 - - 37,854 Parking improvements - - 16,386 16,386 Assigned: Purchases on order 1,523,191 - - 1,523,191 Tax certiorari 5,750,000 - - 5,750,000 Retirement system loan 1,273,994 - - 1,273,994 For subsequent year's expenditures 5,150,000 - - 5,150,000 Unassigned 6,134,659 (5,046,998) - 1,087,661 Total Fund Balances 32,383,344 (5,046,998) 5,981,402 33,317,748 Total Liabilities and Fund Balances 62,499,271$ 153,951$ 8,930,185$ 71,583,407$
The notes to the financial statements are an integral part of this statement.
38

CITY OF WHITE PLAINS, NEW YORKRECONCILIATION OF THE BALANCE SHEET OF GOVERNMENTAL FUNDS TO THE STATEMENT OF NET POSITIONJUNE 30, 2013
Amounts reported for governmental activities in the statementof net position are different because:
Total Fund Balances - Governmental Funds $ 33,317,748
Capital assets used in governmental activities are not financial resources and therefore, are not reported in the funds. 261,909,846
The internal service fund is used by management to charge the cost of workers' compensation, general liability and unemployment benefits to individual funds. The assets and liabilities of the internal service fund are included in governmental activities in the statement of net position. (2,669,211)
Other long-term assets that are not available to pay for current period expenditures and, therefore, are either unearned or not reported in the funds.
Real property taxes 478,457Accrued property tax interest receivable 402,198
Long-term liabilities that are not due and payable in the current period, and therefore, are not reported in the funds:
Bonds payable (97,809,152)Uamortized premium on refunding bonds (1,959,739)Deferred loss on refunding bonds 1,024,213Retirement incentives and other pension obligations (1,782,665)Tax certiorari payable (7,716,000)Compensated absences (4,779,938)Accrued interest payable (730,409)Other post employment benefit obligations payable (72,006,000)
Net Position of Governmental Activities $ 107,679,348
39

CITY OF WHITE PLAINS, NEW YORKSTATEMENT OF REVENUES, EXPENDITURES AND CHANGES IN FUND BALANCESGOVERNMENTAL FUNDSFOR THE FISCAL YEAR ENDED JUNE 30, 2013
Capital Nonmajor Total General Projects Governmental Governmental
Fund Fund Funds FundsREVENUES Taxes and related items 101,545,393$ -$ 5,625,535$ 107,170,928$ Intergovernmental 8,954,058 861,416 8,300,118 18,115,592 Charges for services 17,830,678 - - 17,830,678 Licenses and permits 4,908,105 - - 4,908,105 Fines and forfeitures 8,231,706 - - 8,231,706 Interest 88,575 - 2,714 91,289 Fees and program income - - 5,360,352 5,360,352 Miscellaneous 8,177,118 - 343,061 8,520,179 Total Revenues 149,735,633 861,416 19,631,780 170,228,829
EXPENDITURES Current: Council and boards 530,784 - - 530,784 General government 28,524,802 - - 28,524,802 Public works 28,455,868 - - 28,455,868 Parking 12,222,118 - - 12,222,118 Public safety 59,239,942 - 775,685 60,015,627 Community services 6,214,995 - 18,280,328 24,495,323 Debt Service: Principal - - 5,164,308 5,164,308 Interest and fiscal charges - - 3,408,724 3,408,724 Capital Outlay - 21,384,220 - 21,384,220 Total Expenditures 135,188,509 21,384,220 27,629,045 184,201,774
Excess (Deficiency) of Revenues Over Expenditures 14,547,124 (20,522,804) (7,997,265) (13,972,945)
OTHER FINANCING SOURCES (USES)
Bonds issued - 9,740,500 - 9,740,500Transfers in 545 558,000 9,529,901 10,088,446Transfers out (9,469,972) (142,939) (475,535) (10,088,446) Total Other Financing Sources (Uses) (9,469,427) 10,155,561 9,054,366 9,740,500
Net Change in Fund Balances 5,077,697 (10,367,243) 1,057,101 (4,232,445)
Fund Balances - Beginning of Year 27,305,647 5,320,245 4,924,301 37,550,193
Fund Balances (Deficits) - End of Year 32,383,344$ (5,046,998)$ 5,981,402$ 33,317,748$
The notes to the financial statements are and integral part of this statement.
40

CITY OF WHITE PLAINS, NEW YORKRECONCILIATION OF THE STATEMENT OF REVENUES, EXPENDITURES, AND CHANGES IN FUND BALANCES OF GOVERNMENTAL FUNDS TO THE STATEMENT OF ACTIVITIESFOR THE FISCAL YEAR ENDED JUNE 30, 2013
Amounts reported for governmental activities in the statement of activities aredifferent because:
Net Change in Fund Balances - Total Governmental Funds $ (4,232,445)
Governmental funds report capital outlays as expenditures. However, in the statement of activities, the cost of these assets is allocated over their estimated useful lives and reported as depreciation expense. This is the amount by which capital outlays exceeded depreciation expense in the current period.
Capital outlay expenditures 20,587,527Depreciation expense (13,336,831)
7,250,696
Revenues in the statement of activities that do not provide current financial resources are not reported as revenues in the funds.
Real property taxes (4,145)
Bond proceeds provide current financial resources to governmental funds, but issuing debt increases long-term liabilities in the statement of net position. Repayment of bond principal is an expenditure in the governmental funds, but repayment reduces long-term liabilities in the statement of net position. Also, governmental funds report the effect of premiums, discounts, and similar items when debt is first issued, whereas these amounts are deferred and amortized in the statement of activities.
Principal paid on bonds 5,164,308Amortization of loss on refunding and premium 110,357Bonds issued (9,740,500)
(4,465,835)
The Self-Insurance Fund is an internal service fund used by management to charge the costs of workers' compensation, general liability and unemployment benefits to the individual funds. The net revenue of this fund is reported with governmental activities. (2,455,118)
Some expenses reported in the statement of activities do not require the use of current financial resources and, therefore, are not reported as expenditures in the governmental funds.
Accrued interest 23,164Retirement incentives and other pension obligations 575,218Compensated absences 145,970Other post employment benefit obligations (20,648,000)Tax certiorari (1,120,039)
(21,023,687)
Change in Net Position of Governmental Activities $ (24,930,534)
41
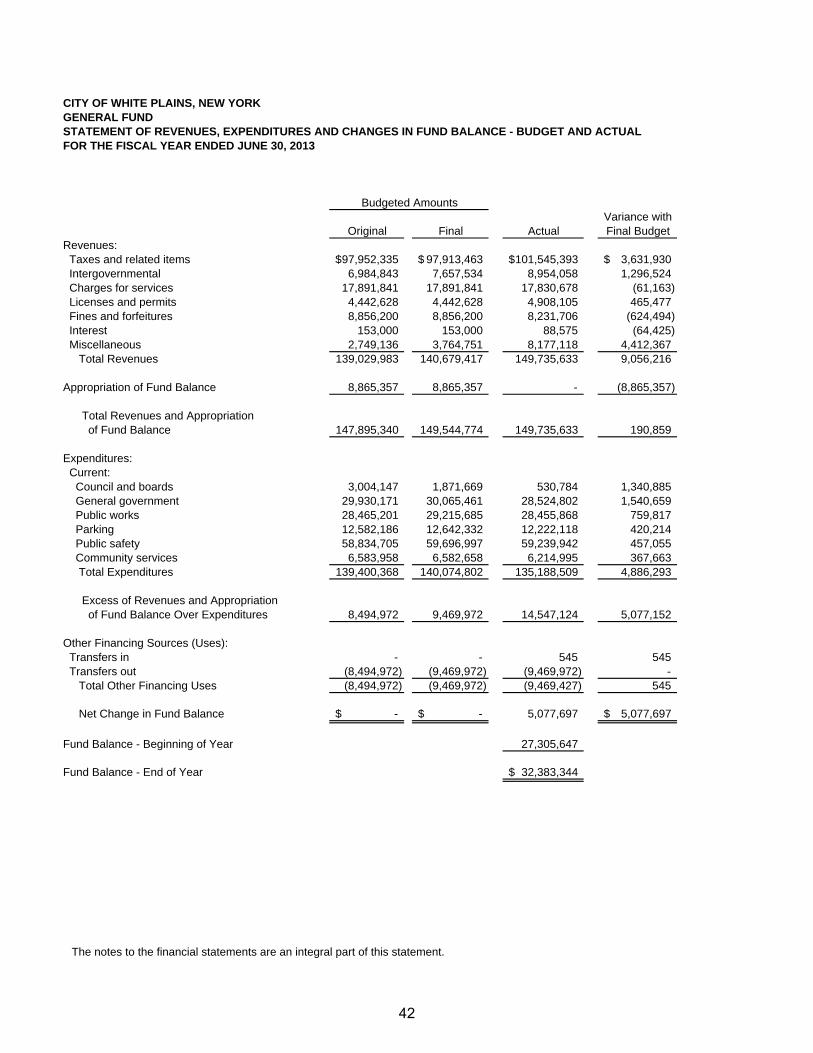
CITY OF WHITE PLAINS, NEW YORKGENERAL FUNDSTATEMENT OF REVENUES, EXPENDITURES AND CHANGES IN FUND BALANCE - BUDGET AND ACTUALFOR THE FISCAL YEAR ENDED JUNE 30, 2013
Variance withOriginal Final Actual Final Budget
Revenues: Taxes and related items 97,952,335$ 97,913,463$ 101,545,393$ 3,631,930$ Intergovernmental 6,984,843 7,657,534 8,954,058 1,296,524 Charges for services 17,891,841 17,891,841 17,830,678 (61,163) Licenses and permits 4,442,628 4,442,628 4,908,105 465,477 Fines and forfeitures 8,856,200 8,856,200 8,231,706 (624,494) Interest 153,000 153,000 88,575 (64,425) Miscellaneous 2,749,136 3,764,751 8,177,118 4,412,367 Total Revenues 139,029,983 140,679,417 149,735,633 9,056,216
Appropriation of Fund Balance 8,865,357 8,865,357 - (8,865,357)
Total Revenues and Appropriation of Fund Balance 147,895,340 149,544,774 149,735,633 190,859
Expenditures: Current: Council and boards 3,004,147 1,871,669 530,784 1,340,885 General government 29,930,171 30,065,461 28,524,802 1,540,659 Public works 28,465,201 29,215,685 28,455,868 759,817 Parking 12,582,186 12,642,332 12,222,118 420,214 Public safety 58,834,705 59,696,997 59,239,942 457,055 Community services 6,583,958 6,582,658 6,214,995 367,663 Total Expenditures 139,400,368 140,074,802 135,188,509 4,886,293
Excess of Revenues and Appropriation of Fund Balance Over Expenditures 8,494,972 9,469,972 14,547,124 5,077,152
Other Financing Sources (Uses): Transfers in - - 545 545 Transfers out (8,494,972) (9,469,972) (9,469,972) - Total Other Financing Uses (8,494,972) (9,469,972) (9,469,427) 545
Net Change in Fund Balance -$ -$ 5,077,697 5,077,697$
Fund Balance - Beginning of Year 27,305,647
Fund Balance - End of Year 32,383,344$
Budgeted Amounts
The notes to the financial statements are an integral part of this statement.
42

CITY OF WHITE PLAINS, NEW YORKSTATEMENT OF NET POSITIONPROPRIETARY FUNDSJUNE 30, 2013
GovernmentalActivities -
Internal ServiceFund
Sewer Rent Self InsuranceWater Fund Fund Totals Fund
ASSETS Current Assets: Cash and cash equivalents 2,683,917$ 1,186,390$ 3,870,307$ 6,000,962$ Investments - - - 2,063,288 Receivables 5,350,127 1,033,616 6,383,743 9,594 Total Current Assets 8,034,044 2,220,006 10,254,050 8,073,844
Noncurrent Assets - Capital Assets: Land 712,806 - 712,806 - Building and facilities 6,179,395 - 6,179,395 - Machinery and equipment 662,353 - 662,353 - Rolling stock 938,635 230,116 1,168,751 - Infrastructure 39,849,454 27,353,533 67,202,987 - Construction-in-progress 3,332,962 266,780 3,599,742 - Less accumulated depreciation (20,613,122) (20,475,854) (41,088,976) - Total Noncurrent Assets 31,062,483 7,374,575 38,437,058 - Total Assets 39,096,527 9,594,581 48,691,108 8,073,844
DEFERRED OUTFLOWS OF RESOURCES Deferred charges on refunding bonds 126,753 4,810 131,563 -
LIABILITIESCurrent Liabilities: Accounts payable 1,415,998 17,760 1,433,758 56,698 Contract retainage payable 12,482 - 12,482 - Accrued liabilities 51,627 10,191 61,818 3,899 Accrued interest payable 128,686 10,418 139,104 - Deposits 24,322 427 24,749 - Due to retirement system 115,215 25,144 140,359 9,843 Bonds payable - current 830,353 96,699 927,052 - Compensated absences - current 8,874 1,740 10,614 14,391 Claims payable - current - - - 1,900,000 Total Current Liabilities 2,587,557 162,379 2,749,936 1,984,831
Noncurrent Liabilities: Bonds payable, less current maturities 10,937,592 1,190,338 12,127,930 - Compensated absences, less current portion 79,862 15,661 95,523 - Claims payable, less current portion - - - 8,703,200 Other post employment benefit obligations payable 1,671,000 408,000 2,079,000 250,000 Total Noncurrent Liabilities 12,688,454 1,613,999 14,302,453 8,953,200 Total Liabilities 15,276,011 1,776,378 17,052,389 10,938,031
NET POSITIONNet investment in capital assets 19,421,291 6,092,348 25,513,639 - Unrestricted 4,525,978 1,730,665 6,256,643 (2,864,187)
Total Net Position (Deficit) 23,947,269$ 7,823,013$ 31,770,282 (2,864,187)$
Adjustment to reflect the consolidation of internal service fund activity related to enterprise fund (194,976)
Net Position of Business-type Activities 31,575,306$
Business-type Activities-Enterprise Funds
The notes to the financial statements are an integral part of this statement.
43

CITY OF WHITE PLAINS, NEW YORKSTATEMENT OF REVENUES, EXPENSES, AND CHANGES IN NET POSITIONPROPRIETARY FUNDSFOR THE FISCAL YEAR ENDED JUNE 30, 2013
GovernmentalActivities -
Internal ServiceFund
Sewer Rent Self InsuranceWater Fund Fund Totals Fund
Operating Revenues: Charges for services: Metered water sales 11,981,058$ -$ 11,981,058$ -$ Sewer rents - 2,179,960 2,179,960 - Self insurance services - - - 5,314,464 Intergovernmental 80,519 4,707 85,226 - Miscellaneous 105,890 22,977 128,867 72,813 Total Operating Revenues 12,167,467 2,207,644 14,375,111 5,387,277
Operating Expenses: Personal services 2,197,869 494,480 2,692,349 187,974 Employee benefits 1,185,208 299,477 1,484,685 81,042 Other post employment benefit obligations 416,000 156,000 572,000 63,000 Materials and supplies 5,448,600 39,764 5,488,364 730 Direct costs 889,635 175,329 1,064,964 7,536,629 Equipment 499 - - - Depreciation 977,434 706,171 1,683,605 - Total Operating Expenses 11,115,245 1,871,221 12,986,466 7,869,375 Operating Income (Loss) 1,052,222 336,423 1,388,645 (2,482,098)
Nonoperating Revenues (Expenses): Interest income 5,156 - 5,156 45,532 Interest expense (402,902) (41,765) (444,667) - Total Nonoperating Revenues (Expenses) (397,746) (41,765) (439,511) 45,532
Change in Net Position 654,476 294,658 949,134 (2,436,566)
Net Position - Beginning of Year 23,292,793 7,528,355 30,821,148 (427,621)
Net Position - End of Year 23,947,269$ 7,823,013$ 31,770,282$ (2,864,187)$
Change in Net Position 949,134$
Adjustment to reflect the consolidation of internal service fund activity related to enterprise funds 18,552
Change in Net Position of Business-type Activities 967,686$
Business-type Activities-Enterprise Funds
The notes to the financial statements are an integral part of this statement.
44

CITY OF WHITE PLAINS, NEW YORKSTATEMENT OF CASH FLOWSPROPRIETARY FUNDSFOR THE FISCAL YEAR ENDED JUNE 30, 2013
GovernmentalActivities -
Internal ServiceFund
Sewer Rent Self InsuranceWater Fund Fund Totals Fund
CASH FLOWS FROM OPERATING ACTIVITIES Cash received for services provided 11,088,619$ 1,984,105$ 13,072,724$ 5,308,551$ Cash payments for contractual services (7,969,799) (301,838) (8,271,637) (4,937,141) Cash payments to employees for salaries and benefits (3,366,024) (788,623) (4,154,647) (269,264) Other operating revenue 186,409 27,684 214,093 72,813 Net Cash From Operating Activities (60,795) 921,328 860,533 174,959
CASH FLOWS FROM CAPITAL AND RELATED FINANCING ACTIVITIES Interest paid on capital debt (409,960) (47,685) (457,645) - Principal paid on capital debt (719,345) (72,347) (791,692) - Proceeds from serial bonds 151,500 - 151,500 - Purchase of capital assets (797,687) (856) (798,543) - Net Cash From Capital and Related Financing Activities (1,775,492) (120,888) (1,896,380) -
CASH FLOWS FROM INVESTING ACTIVITIES Purchase of investments - - - (4,428,034) Proceeds from sale of investments - - - 3,276,071 Interest on investments 5,156 - 5,156 45,532 Net Cash From Investing Activities 5,156 - 5,156 (1,106,431)
Net Change in Cash and Cash Equivalents (1,831,131) 800,440 (1,030,691) (931,472)
Cash and Cash Equivalents - Beginning of Year 4,515,048 385,950 4,900,998 6,932,434
Cash and Cash Equivalents - End of Year 2,683,917$ 1,186,390$ 3,870,307$ 6,000,962$
Reconciliation of Income (Loss) From Operations to Net Cash FromOperating Activities:
Income (loss) from operations 1,052,222$ 336,423$ 1,388,645$ (2,482,098)$
Adjustments to reconcile operating income (loss) from operations tonet cash from operating activities:
Depreciation and amortization expense 977,434 706,171 1,683,605 - Changes in assets and liabilities: Deposits receivable - - - 140,746 Accounts receivable (892,439) (195,855) (1,088,294) (5,913) Accounts payable (1,626,191) (67,922) (1,694,113) (201,327) Contract retainage payable (7,244) (18,811) (26,055) - Accrued liabilities 2,538 425 2,963 145 Claims payable - - - 2,660,799 Deposits payable 2,369 (12) 2,357 - Due to retirement system 15,000 2,712 17,712 1,391 Compensated absences (484) 2,197 1,713 (1,784) Other post employment benefit obligations payable 416,000 156,000 572,000 63,000 Total Adjustments (1,113,017) 584,905 (528,112) 2,657,057
Net Cash From Operating Activities (60,795)$ 921,328$ 860,533$ 174,959$
Business-type Activities-Enterprise Funds
The notes to the financial statements are an integral part of this statement.
45
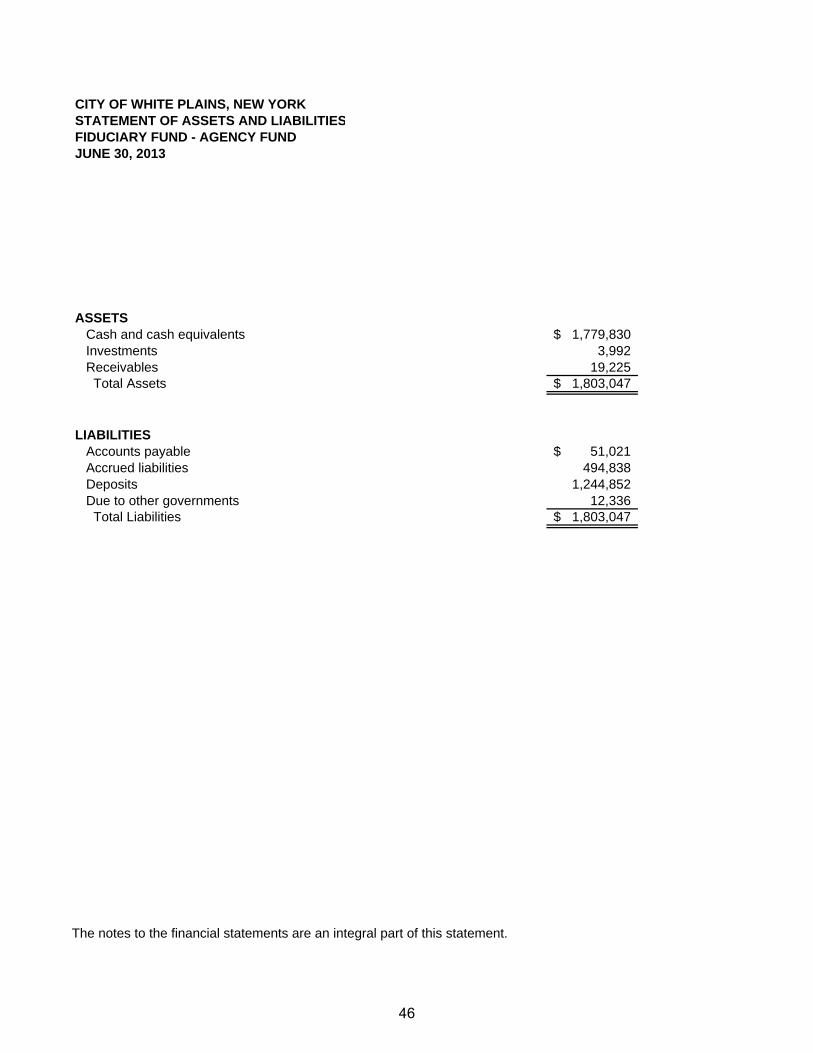
CITY OF WHITE PLAINS, NEW YORKSTATEMENT OF ASSETS AND LIABILITIESFIDUCIARY FUND - AGENCY FUNDJUNE 30, 2013
ASSETS Cash and cash equivalents 1,779,830$ Investments 3,992 Receivables 19,225 Total Assets 1,803,047$
LIABILITIES Accounts payable 51,021$ Accrued liabilities 494,838 Deposits 1,244,852 Due to other governments 12,336 Total Liabilities 1,803,047$
The notes to the financial statements are an integral part of this statement.
46

Note 1: Summary of Significant Accounting Policies The City of White Plains, New York (City) was incorporated in 1916 and covers an area of approximately 10 square miles. The City has been the seat of the Westchester County government since 1778. The City operates in accordance with its Charter under an elected Mayor and Common Council. The six members of the Council are elected at large and serve for four year terms, as does the Mayor. The Common Council functions as the policy-making and legislative body of the City and the Mayor serves as the Chief Executive Officer. The City provides services to its 56,862 (source: U.S. Census Bureau, 2009-2011 American Community Survey) residents in many areas, including various general government services, public works, parking, public safety and community services. The accounting policies of the City conform to generally accepted accounting principles as applicable to governmental units. The Governmental Accounting Standards Board (GASB) is the accepted standard setting body for establishing governmental accounting and financial reporting principles. The more significant of the City’s accounting policies are described below. A. Reporting Entity These financial statements present the primary government and its component units following the principles of GASB Statement No. 14, The Financial Reporting Entity, as amended by Statement No. 61, The Financial Reporting Entity: Omnibus – an amendment of GASB Statements No. 14 and No. 34. Component units are legally separate organizations for which the elected officials of the primary government are financially accountable. In addition, component units can be other organizations for which the nature and significance of their relationship with a primary government are such that exclusion would cause the reporting entity's financial statements to be misleading or incomplete. While it is desirable for users to be able to distinguish between the primary government and its component units, there are nevertheless some component units that, despite being legally separate from the primary government, are so intertwined with the primary government that they are, in substance, the same as the primary government. These component units are reported as part of the primary government and are known as blended component units. The City does not report any blended component units. Most component units are discretely presented, meaning that financial data for the component unit(s) is presented in one or more column(s) separate from the financial data of the primary government. The City’s discretely presented component units include the White Plains Urban Renewal Agency (Urban Renewal Agency), the White Plains Cable Television Access Commission (Cable TV Commission), the White Plains Center Local Development Corporation (Local Development Corporation) and the White Plains Housing Development Corporation (Housing Development Corporation). The governing bodies of these component units are not substantively the same as the City’s and they do not provide services entirely or almost entirely to the City as described below. None of the component units issue a separate financial report. The Urban Renewal Agency was created in 1964 pursuant to an act of the New York State Legislature, General Municipal Law, Article 15-B, Title 14, which provided for the following:
1. The purpose of the Urban Renewal Agency is to eliminate or prevent the development and spread of deterioration and blight through the clearance, re-planning, reconstruction, rehabilitation, conservation or renewal of areas designated for residential, commercial, industrial, community, public and other uses.
2. The Urban Renewal Agency shall be perpetual in duration and shall consist of five Agency members who are appointed and serve at the pleasure of the Mayor. The Mayor may also
47
appoint himself/herself as one of the members and is currently serving as Chairman. The City provides support to the Urban Renewal Agency in the form of office space.
The Cable TV Commission was established in 1981 as a Type A not-for-profit corporation under Section 402 of the Not-for-Profit Corporation Law and Section 501(c)(1) of the IRS Code, to implement the provisions of franchise agreements between the City and cable television providers. The Cable TV Commission oversees the operations of the City’s cable television production facilities, which include a fully equipped studio, editing suite, and a full complement of location equipment. Productions are televised on the Community Access Channel. The Cable TV Commission also manages the City’s Government Access Channel, which televises the City government programs, announcements and Common Council meetings. The Cable TV Commission is reported as a discretely presented component unit because the Mayor appoints its governing body and can remove its members at will. The City guarantees debt obligations of the Commission. At June 30, 2013, there was no debt authorized or outstanding for the Cable TV Commission. The Local Development Corporation is a not-for-profit local development corporation established pursuant to Section 1411 of the Not-for-Profit Corporation Law of the State of New York. The Local Development Corporation was formed and operated exclusively for charitable purposes within the meaning of Section 501(c)(3) of the Internal Revenue Code to lessen the burdens of City government by engaging in the following transactions:
1. Contract with the City for the demolition of an existing garage;
2. Contract with a developer for the construction of the White Plains Center Parking Garage (City Center Garage);
3. To provide for future reconstruction and additions to the City Center Garage;
4. Enter into various leases and subleases with the City regarding the City Center Garage;
5. Contract with the City for the operation and maintenance of the City Center Garage.
The Local Development Corporation is a discretely presented component unit because the Board of Directors consists of the Mayor, the Commissioner of Building and the Commissioner of Public Works and is fiscally dependent on the City. The Local Development Corporation is a public instrumentality separate from the City. The Corporation has no reportable operations, assets or liabilities as of and for the fiscal year ended June 30, 2013. The White Plains Housing Development Corporation is a discretely presented component unit because the officers of the Corporation are appointed officials of the City serving ex officio, who can be removed by a majority vote of the Common Council. The Corporation is a not-for-profit corporation that was created in 1994, under the laws of the State of New York for the purpose of:
1. Functioning as an instrumentality for the City, a political subdivision of the State, and a Public Housing Agency under the United States Housing Act of 1937 and defined in regulations issued by the United States Department of Housing and Urban Development.
2. Engaging or assisting in the acquisition of land and construction and equipping of rental apartment facilities located in the City for, but not limited to elderly, handicapped, and low-income individuals and families.
3. Issuing Housing Revenue Bonds for the defeasance or refunding of the outstanding revenue bonds of the White Plains Battle Hill Housing Corporation and the White Plains Armory Plaza Housing Development Corporation.
48

The only financial transactions of the Corporation are conduit debt transactions, which are not recorded as liabilities of the Corporation. As such, the Corporation has no reportable operations, assets or liabilities as of and for the fiscal year ended June 30, 2013. B. Government-Wide Financial Statements The government-wide financial statements (i.e., the statement of net position and the statement of activities) report information on all of the non-fiduciary activities of the primary government as a whole and its component units. For the most part, the effect of interfund activity has been removed from these statements, except for interfund services provided and used. Governmental activities, which normally are supported by taxes and intergovernmental revenues, are reported separately from business-type activities, which rely to a significant extent on fees and charges for services. Likewise, the primary government is reported separately from certain legally separate component units for which the primary government is financially accountable. The statement of net position presents the financial position of the City and its component units at the end of the fiscal year. The statement of activities demonstrates the degree to which the direct expenses of a given function or segment is offset by program revenues. Direct expenses are those that are clearly identifiable with a specific function or segment. Program revenues include: 1) charges to customers or applicants who purchase, use or directly benefit from goods, services or privileges provided by a given function or segment, 2) grants and contributions that are restricted to meet the operational or capital requirements of a particular function or segment and 3) interest earned on grants that is required to be used to support a particular program. Taxes and other items not identified as program revenues are reported as general revenues. The City does not allocate indirect expenses to specific functions in the statement of activities. Separate financial statements are provided for governmental funds, proprietary funds and fiduciary funds, even though the latter are excluded from the government-wide financial statements. Major individual governmental and enterprise funds are reported as separate columns in the fund financial statements. Proprietary funds distinguish operating revenues and expenses from non-operating items. Operating revenues generally result from providing and delivering services and/or goods in connection with the proprietary fund’s principal ongoing operations. Operating expenses include the cost of personnel (salaries and benefits), materials and supplies, direct costs, equipment and depreciation of capital assets. All revenues and expenses not meeting this definition are reported as non-operating revenues (such as interest income) and expenses (such as interest expense). C. Fund Financial Statements The accounts of the City are organized and operated on a fund basis. A fund is defined as a fiscal and accounting entity with a self-balancing set of accounts comprised of its assets, deferred outflows of resources, liabilities, deferred inflows of resources, fund balances/net position, revenues and expenditures/expenses. Fund accounting segregates funds according to their intended purpose and is used to aid management in demonstrating compliance with finance-related legal and contractual provisions. The City maintains the minimum number of funds consistent with legal and managerial requirements. The focus of the governmental funds financial statements is on major funds as that term is defined in professional pronouncements. Each major fund is presented in a separate column, with nonmajor funds aggregated and presented in a single column. Proprietary and fiduciary funds are reported by type. A reconciliation is presented on the page following the governmental funds statements that briefly explains the adjustments necessary to convert the fund-based financial statements into the governmental activities column of the government-wide presentation, due to the fact that governmental funds statements are presented on a different measurement focus and basis of accounting than the government-wide statements’ governmental
49

activities column. The City’s resources are reflected in the fund financial statements in three broad fund categories, in accordance with generally accepted accounting principles as follows: 1. Governmental Funds - Governmental Funds are those through which most general government functions are financed. The acquisition, use and balances of expendable financial resources and the related liabilities are accounted for through governmental funds. Following are the City’s major governmental funds:
General Fund - The General Fund is the primary operating fund of the City and is used to account for and report all financial resources not accounted for and reported in another fund. Capital Projects Fund - The Capital Projects Fund is used to account for and report financial resources that are restricted, committed, or assigned to expenditure for capital outlays, including the acquisition or construction of capital facilities and other capital assets. The Capital Projects Fund excludes those types of capital-related outflows financed by proprietary funds or for assets that will be held in trust for individuals, private organizations, or other governments.
The City reports the following nonmajor governmental funds:
Special Revenue Funds - Special revenue funds are used to account for and report the proceeds of specific revenue sources that are restricted or committed to expenditure for specified purposes other than debt service or capital projects. The City’s special revenue funds include: Library Fund - to account for property taxes and other resources used to support the operation and maintenance of the City library. Section 259(1) of the New York State Education Law requires that monies received from taxes and other public sources for the support of a public library shall be kept as a separate library fund. RESTORE Grant Fund - to account for a New York State grant that provides assistance to low income senior citizens for housing repairs. Community Development Block Grant Fund - to account for Federal Community Development Block Grant (CDBG) funds used to provide programs and activities that will benefit low and moderate income families through the prevention or elimination of slums and blight. Section 8 Housing Assistance Program Fund - to account for Federal grants used to subsidize rental housing for low and moderate income senior citizens and other families within the City. Public Safety Grant Fund - to account for grant monies received from Federal, State and local governments for the enhancement of public safety activities. Youth Development Fund - to account for grant monies received from Federal, State and local governments and private contributions for youth development programs designed to build skills and competencies among the City’s youth. City Center Garage Fund - to account for parking revenues that are restricted for operating and maintenance costs associated with the City Center Garage. War Memorial Fund - to account for funds specifically identified by the donors to be used for
50
a memorial to those who have perished in wars. Community Services Fund - to account for funds specifically identified by the donors to be used to send underprivileged and economically disadvantaged children to day camp. Recreation Parkland Fund - to account for funds specifically identified by the donors to be used in acquiring and/or developing recreational facilities and open space in the City. Police Activities Fund - to account for Federal forfeiture proceeds to be used to support community policing activities, training and law enforcement operations. Mayor’s Youth Council Fund - to account for monies specifically identified by the donors to benefit the youth of the City. Housing Authority Enhancement Fund - to account for monies specifically identified by the donors to be used to enhance public housing occupancy. Parking Fund - to account for fees received in lieu of providing required off-street parking in the central parking area, which are used to increase the quantity/quality of parking spaces available to serve properties in that area. Debt Service Fund – The Debt Service Fund is used to account for and report financial resources that are restricted, committed, or assigned to expenditure for principal and interest and for financial resources that are being accumulated for principal and interest maturing in future years. Permanent Fund - The Goldie Zeitlin Memorial Fund is a permanent fund of the City, used to account for and report resources that are restricted to the extent that only earnings, and not the principal of a $10,000 endowment, may be used to support the City’s programs related to urban concerns.
2. Proprietary Funds - Proprietary fund reporting focuses on the determination of operating income, changes in net position (or cost recovery), financial position and cash flows. The proprietary fund category includes enterprise funds and internal service funds. Enterprise funds may be used to report any activity for which a fee is charged, predominantly to external users, for goods or services. Internal service funds may be used to report any activity that provides goods or services to other funds, departments, or agencies of the primary government and its component units, or to other governments, on a cost-reimbursement basis. Internal service funds should be used only if the reporting government is the predominant participant in the activity. The City reports the operations of its Water Fund and its Sewer Rent Fund as enterprise funds and has established its Self Insurance Fund as an internal service fund. 3. Fiduciary Funds - Fiduciary funds are used to report assets held in a trustee or agency capacity for others and therefore cannot be used to support the government's own programs. Fiduciary funds are not included in the government-wide financial statements on the basis that the City cannot use the resources of fiduciary activities to support City programs. The City’s only fiduciary fund is the Agency Fund, which is primarily used to account for employee payroll tax withholdings and various deposits that are payable to other jurisdictions or individuals. D. Measurement Focus, Basis of Accounting, and Financial Statement Presentation The accounting and financial reporting treatment is determined by the applicable measurement focus and basis of accounting. Measurement focus indicates the type of resources being measured such as current financial resources (current assets and current liabilities) or economic resources (all
51
assets and liabilities). The basis of accounting indicates the timing of transactions or events for recognition in the financial reports. The government-wide, proprietary funds and component unit financial statements are reported using the economic resources measurement focus and the accrual basis of accounting. The Agency Fund has no measurement focus but utilizes the accrual basis of accounting. Under the accrual basis of accounting, revenues are recorded when earned and expenses are recorded when a liability is incurred, regardless of the timing of related cash flows. Property taxes are recognized as revenues in the year for which they are levied. Grants and similar items are recognized as revenue as soon as all eligibility requirements imposed by the provider have been met. Governmental fund financial statements are reported using the current financial resources measurement focus and the modified accrual basis of accounting. Under the modified accrual basis of accounting, revenues are recognized as soon as they are both measurable and available. Revenues are considered to be available when they are collectible within the current period or soon enough thereafter to pay liabilities of the current period. For this purpose, the government considers revenues to be available if they are collected within 60 days of the end of the current fiscal period. Expenditures generally are recorded when a liability is incurred, as under accrual accounting. However, debt service expenditures, as well as expenditures related to certain pension obligations, compensated absences, claims and judgments, and other post employment benefit obligations are recorded only when payment is due. General capital asset acquisitions are reported as expenditures in governmental funds. Issuance of long-term debt and acquisitions under capital leases are reported as other financing sources. Property taxes, franchise taxes, licenses and interest associated with the current fiscal period are all considered to be susceptible to accrual and have been recognized as revenues of the current fiscal period. Other receipts become measurable and available when cash is received by the City and are recognized as revenue at that time. Entitlements are recorded at the time of receipt or earlier if the susceptible-to-accrual criteria are met. Expenditure driven grants are recognized as revenue when the qualifying expenditures have been incurred and all other grant requirements have been met. E. Assets, Liabilities and Net Position or Fund Balances 1. Deposits and Investments The City’s cash and cash equivalents balances consist of funds deposited in demand deposit accounts, time deposit accounts, certificates of deposit with original maturities of less than three months and petty cash and change funds. State statutes govern the City’s investment policies. The City has adopted its own written investment policy which provides for the deposit of funds in FDIC insured commercial banks or trust companies licensed to do business in New York State. Permissible investments include obligations of the U.S. Treasury, U.S. Agencies, repurchase agreements, obligations of New York State or its political subdivisions and municipal joint cooperative investments authorized under New York State General Municipal Law. Custodial credit risk is the risk that in the event of a bank failure, the City’s deposits may not be returned to it. GASB Statement No. 40, Deposit and Investment Risk Disclosures, directs that deposits be disclosed as exposed to custodial credit risk if they are not covered by FDIC insurance and the deposits are either uncollateralized, collateralized by securities held by the pledging financial institution or collateralized by securities held by the pledging financial institution’s trust department but not in the City’s name. The City’s aggregate bank balances that were not covered by FDIC insurance were not exposed to custodial credit risk at June 30, 2013. In order to minimize the credit risk of deposits and investments, the City adopted and adheres to the guidelines established in its investment policy. This policy specifically States the primary objectives of the City’s investment activities. In priority order, they are: to conform to all applicable laws; to
52

adequately safeguard principal; to provide sufficient liquidity to meet all operating requirements and lastly, to obtain a reasonable rate of return. It is also the policy of the City to diversify its deposits and investments by financial institution, by investment instrument and by maturity. These objectives, as outlined in the City’s investment policy, along with collateralization of all deposits in excess of FDIC coverage, are strictly adhered to so as to minimize exposure to credit risk. In accordance with the investment policy, collateral is required for demand deposit accounts, time deposit accounts and certificates of deposit at 100% of all deposits not covered by FDIC insurance. The City has entered into custodial agreements with the various banks that hold their deposits. These agreements authorize the obligations that may be pledged as collateral, which include, among other instruments, obligations of the United States and its agencies, and obligations of the State and its municipal and school district political subdivisions. The City was invested in demand deposit accounts, time deposit accounts and certificates of deposit and, accordingly, was not exposed to any interest rate risk or credit risk at June 30, 2013. In addition to the above named investments the City was also invested in two United States Treasury Bonds. These two securities can pose a potential interest rate risk, since the fixed rate of interest is locked in for an extended period of time. Management monitors these securities periodically to determine if the fixed interest rate poses any risk to the City. At this time, the potential risk is extremely limited given the current market interest rates and the $215,000 principal involved. The following segmented time distribution shows that all maturities are over three years at this time:
a. Maturities within six months to three years: None b. Maturities over three years:
Description Amount Rate Maturity United States Treasury Bond $100,000 8.75% 5/15/2017 United States Treasury Bond $115,000 6.00% 2/15/2026
The City utilizes a pooled investment concept for all its funds to maximize its investment returns. Investment income from this pooling is allocated to the respective funds based upon the sources of funds invested. The City participates in a joint municipal cooperative investment pool established pursuant to New York State General Municipal Law Article 3-A that meets the definition of a 2a7-like pool as defined by GASB Statement No. 31, Accounting and Financial Reporting for Certain Investments and for External Investment Pools. The sponsoring agency of the pool is another governmental unit which, acting through its chief fiscal officer, is primarily responsible for executing the provisions of the cooperative agreement. This pool is authorized to invest in various securities issued by the United States and its agencies. The amount reported represents the amortized cost of the cooperative shares and is considered to approximate fair value. The fair value of the City’s position in the cooperative is the same as the value of the pool’s shares. Additional information concerning the cooperative investment pool is presented in the annual report of the New York Liquid Asset Fund (NYLAF), which may be obtained from Bankers Trust Company, N.A., 453 7th Street, P.O. Box 897, Des Moines, IA 50304. NYLAF is rated AAAm by Standard & Poor’s Financial Services. Local government investment cooperatives in this rating category meet the highest standards for credit quality, conservative investment policies and safety of principal. The cooperative invests in a high quality portfolio of investments legally permissible for municipalities and school districts pursuant to New York State General Municipal Law.
53
2. Receivables Real property taxes attach as an enforceable lien on real property and are levied as of January 1st for Westchester County taxes and July 1st for the City of White Plains and the White Plains City School District taxes. The City collects County taxes, which are due in one installment on April 1st and are payable without penalty through April 30th. The City also collects City and School District taxes, which are due in two installments (in July and January) and are payable without penalty until the end of each respective month. In accordance with Westchester County Tax Law (Section 283 of the Westchester County Administrative Code), the City functions in both a fiduciary and guarantor relationship with the County of Westchester and the White Plains City School District with respect to the collection and payment of real property taxes levied by such jurisdictions. The City must remit to the County 60% of the amount levied by May 25th and the balance of 40% on or before October 15th. With respect to School District taxes, the City must satisfy the warrant no later than February 20th of the second year after the fiscal year for which such taxes were levied. Thus, the City’s fiduciary responsibility for School District taxes is from the date of the levy until two years after said date, at which time the City must satisfy its obligation to the School District regardless of the amounts collected. The collection of School District taxes is deemed a financing transaction until the warrants are satisfied. Since the County tax warrant must be paid in full by October 15th, uncollected County taxes have been accounted for in a manner similar to City taxes. The combined tax rate to finance City general governmental services and the payment of principal and interest on long-term debt for the fiscal year ending June 30, 2013, was $184.47 per $1,000 of taxable assessed value. Other receivables include amounts due from other governments and individuals for services provided by the City. Receivables are recorded and revenues are recognized as earned or as specific program expenses/expenditures are incurred. Allowances are recorded when appropriate. 3. Due From/To Other Funds During the course of its operations, the City had numerous transactions between funds to finance operations, provide services and construct assets. Balances of interfund amounts receivable or payable have been recorded in the fund financial statements to the extent that certain transactions between funds had not been paid or received as of June 30, 2013. Any residual balances outstanding between the governmental activities and business-type activities are reported in the government-wide financial statements as internal balances. 4. Inventory and Prepaid Items Inventories are valued at cost using the first-in/first-out (FIFO) method and consist of expendable supplies and vehicle repair parts, and are reported in both the government-wide and fund financial statements. The cost of such inventories is recorded as expenditures when consumed rather than when purchased (the consumption method). Certain payments to vendors reflect costs applicable to future accounting periods and are reported as prepaid items using the consumption method in both the government-wide and fund financial statements. Amounts reported as inventories and prepaid items in the fund financial statements are offset by the same amount in the component of nonspendable fund balance - not in spendable form to indicate that these amounts do not constitute available spendable resources, even though they are a component of current assets. 5. Capital Assets
54

Capital assets include property, plant, equipment and infrastructure (e.g. roads, bridges, sidewalks, and similar items) assets, and are reported in the applicable governmental or business-type activities columns in the government-wide financial statements. A capital asset is defined by the City as an asset with an initial, individual cost of more than $10,000 and an estimated useful life in excess of three years. Such assets are recorded at historical cost or estimated historical cost if purchased or constructed. Donated capital assets are recorded at estimated fair market value at the date of donation. In the case of the initial capitalization of general infrastructure assets (those reported by governmental activities), the City chose to include all such items regardless of their acquisition date or amount. The City was able to estimate the historical cost for the initial reporting of these assets by estimating the current replacement cost of the infrastructure to be capitalized and using an appropriate price-level index to deflate the cost to the acquisition year. Major outlays for capital assets and improvements are capitalized as projects are completed. The costs of normal maintenance and repairs that do not materially add to the value or useful life of the asset are not capitalized. Land and construction-in-progress are not depreciated. Property, plant, equipment and infrastructure of the primary government and the component units are depreciated using the straight line method over the following estimated useful lives.
Class Life in YearsBuilding and Facilities 10 - 50Machinery and Equipment 10 -20Rolling Stock 3 -15Infrastructure 75 -100
The costs associated with the acquisition or construction of capital assets are shown as capital outlay expenditures on the governmental funds financial statements. Capital assets are not shown on the governmental funds balance sheet. 6. Deferred Outflows of Resources In accordance with GASB Statement No. 63, Financial Reporting of Deferred Outflows of Resources, Deferred Inflows of Resources, and Net Position and GASB Statement No. 65, Items Previously Reported as Assets and Liabilities, a deferred outflow of resources is a consumption of net position by the government that is applicable to a future reporting period. The City reported $1,155,776 of deferred outflows of resources at June 30, 2013, representing the financial effect of a deferred charge on the advance refunding of general obligation serial bonds. A deferred outflow of resources (deferred charge) results from the difference in the carrying value of refunded debt and its reacquisition price. This amount is deferred and amortized over the shorter of the life of the refunded or refunding debt. 7. Deferred Inflows of Resources/Unearned Revenues GASB Statement No. 63, Financial Reporting of Deferred Outflows of Resources, Deferred Inflows of Resources, and Net Position and GASB Statement No. 65, Items Previously Reported as Assets and Liabilities require the removal from liabilities and separate presentation of deferred inflows of resources in the statement of net position. A deferred inflow of resources is an acquisition of net position by the government that is applicable to a future reporting period. At June 30, 2013 the City reported deferred inflows of $1,200,277, with $721,820 of this amount representing real property taxes received in advance of the lien date and $478,457 representing real property taxes levied but not yet collected in the current and prior fiscal years.
55

Unearned revenues arise when assets are recognized before revenue recognition criteria have been satisfied. In the government-wide financial statements, unearned revenues consist of revenue received in advance and/or amounts from grants received before the eligibility requirements have been met. Unearned revenues in the fund financial statements are those where asset recognition criteria have been met, but for which revenue recognition criteria have not been met. The City has reported $3,637,969 of unearned revenues at June 30, 2013 in the fund financial statements. Of this amount, $2,119,116 is found in the General Fund for parking permits ($1,562,810), prepaid rents ($35,047) and miscellaneous fees ($521,259) received in advance. The remaining balance of unearned revenues represents $284,955 in the City Center Garage Fund for parking permit fees received in advance and $1,167,949 in the Community Development Fund; $25,800 in the Youth Development Fund; $4,314 in the Public Safety Grant Fund and $35,835 in the Section 8 Housing Assistance Program Fund for unearned revenues related to loans receivable. Such amounts have been deemed to be measurable but not available pursuant to generally accepted accounting principles. 8. Long-Term Obligations Long-term debt and other long-term obligations are reported as liabilities in the government-wide and the proprietary fund type statement of net position. Bond premiums, discounts and any prepaid bond insurance costs are deferred and amortized over the life of the bonds using the straight line method, while bond issuance costs are recognized as an expense in the period incurred. Bonds payable are reported net of the applicable bond premium or discount in accordance with GASB Statement No. 65, Items Previously Reported as Assets and Liabilities. In the fund financial statements, governmental fund types recognize bond premiums and discounts, as well as bond issuance costs, during the current period. The face amount of debt issued and any premiums received are reported as other financing sources. Issuance discounts are reported as other financing uses. Issuance costs, whether or not withheld from the actual debt proceeds received, are reported as Capital Projects Fund expenditures. 9. Compensated Absences Vacation The City’s leave policy permits employees to accumulate limited earned but unused vacation benefits, which are eligible for payment upon separation from City service. The liability for such leave is reported in the government-wide and the proprietary fund financial statements as current and long-term liabilities. A liability for those amounts is recorded in the governmental funds only if the liability has matured through employee resignation or retirement. The liability for compensated absences includes salary-related benefits, where applicable. Sick Leave An employee’s accumulated sick leave lapses upon separation from City service with no further obligation, financial or otherwise, on the part of the City. 10. Net Position Net position is an element of the statement of net position and is measured by the difference between (a) assets and deferred outflows of resources and (b) liabilities and deferred inflows of resources. Net position is reported as restricted when constraints placed on net position use are either (a) externally imposed by creditors (such as through debt covenants), grantors, contributors, or laws or regulations of other governments, or (b) imposed by law through constitutional provisions or enabling legislation.
56

Net position on the government-wide and proprietary funds statement of net position falls within three categories: 1) net investment in capital assets, 2) restricted and 3) unrestricted (the remaining balance). 11. Fund Balances In fiscal 2010, the City early implemented GASB Statement No. 54, Fund Balance Reporting and Governmental Fund Type Definitions. GASB Statement No. 54 changed the terminology and classification of fund balance to reflect spending constraints on resources, rather than availability for appropriation. This approach is intended to provide users more consistent and understandable information about a fund’s net resources. Under GASB Statement No. 54, fund balance is classified as either nonspendable or spendable. Nonspendable fund balance represents amounts that cannot be spent due to form (such as inventories and prepaid amounts), or amounts that must be maintained intact legally or contractually (such as the principal portion of a permanent fund). Spendable fund balance is further classified as 1) restricted, 2) committed, 3) assigned, and/or 4) unassigned. The restricted fund balance category includes amounts that can be spent only for specific purposes stipulated by constitution, external resource providers, or through enabling legislation. The committed fund balance classification includes amounts that can be used only for the specific purposes determined by a formal action of the government’s highest level of decision-making authority. The Common Council is the highest level of decision-making authority that can, by adoption of an ordinance prior to the end of the fiscal year, commit fund balance. Amounts in the assigned fund balance classification are intended to be used by the government for specific purposes that do not meet the criteria to be classified as restricted or committed. In governmental funds other than the General Fund, assigned fund balance represents the remaining amount that is not restricted or committed. By resolution dated May 3, 2010, the Common Council amended the City’s Reserve Performance Goals to comply with GASB Statement No. 54, authorizing the Commissioner of Finance to assign fund balance. The Common Council may also assign fund balance as it does when appropriating fund balance for subsequent year’s expenditures with the adoption of the annual budget. Unassigned fund balance is the residual classification for the government’s General Fund and includes all spendable amounts not contained in the other classifications. For all governmental funds other than the General Fund, any unassigned fund balance would necessarily be negative, since the fund’s liabilities and deferred inflows of resources, together with the amounts already classified as nonspendable, restricted and committed would exceed the fund’s assets and deferred outflows of resources. The City’s Reserve Performance Goals, adopted as amended by the Common Council on April 1, 2013 provide that unless otherwise required by law or agreement, funds will be spent in the following order: restricted first, then committed, then assigned and lastly, unassigned. The City’s Reserve Performance Goals require that the General Fund’s combined total of fund balance restricted for tax stabilization, plus fund balance restricted for subsequent year's expenditures, plus fund balance assigned for subsequent year's expenditures, plus unassigned fund balance shall be maintained at a minimum of fifteen percent (15%) of General Fund total expenditures, excluding the amount provided for in the Reserve for Financing account. Should the combined amounts of these fund balance components fall below the 15% target, fund balance
57

would be replenished as soon as possible, but no later than five years from the date that the deficiency was determined. 12. Stabilization Arrangement By ordinance adopted May 10, 2010 and in accordance with Section 6-e of New York State General Municipal Law, the City established and maintains a contingency and tax stabilization reserve fund (rainy day fund). The principal resource for this fund is a one-quarter of one percent (0.25%) tax on gross taxable retail sales (sales tax). Other resources include interest earned or capital gains realized on deposits or investments, and other resources as the Common Council might authorize by adopted resolution or ordinance. As provided in General Municipal Law, amounts may be withdrawn from the fund upon recommendation of the Mayor and by at least two-thirds of the voting strength of the Common Council:
To finance unanticipated revenue loss chargeable to the eligible portion of the annual budget, provided that the maximum amount that may be used to finance such unanticipated revenue loss shall equal either the amount of the revenue actually received for the base year or the amount of the estimated revenue for the current fiscal year, whichever is less, minus the amount of the revenue actually received for the current fiscal year, and only to finance that portion of the unanticipated revenue loss which, as a matter of law, cannot be financed with amounts available in any other account or fund, and/or,
To finance an unanticipated expenditure chargeable to the eligible portion of the annual budget, provided that the maximum amount that may be used to finance an unanticipated expenditure shall equal the sum of the amount of the unanticipated expenditure and the amount appropriated for that purpose for the current fiscal year minus either the amount appropriated for that purpose for the current fiscal year or the actual expenditure for the same purpose in the base year, whichever is greater, and only to finance that portion of an unanticipated expenditure which, as a matter of law, cannot be financed with amounts available in any other account or fund, and/or,
To lessen or prevent any projected increase in excess of 2.5% in the amount of the real property tax levy needed to finance the eligible portion of the annual budget for the next succeeding fiscal year. The maximum amount that may be used for this purpose shall equal the difference between the projected amount of such real property tax levy and 102.5% of the amount of the real property tax levy needed to finance the eligible portion of the annual budget for the current fiscal year.
When preparing the annual budget, if the current balance of the contingency and tax stabilization reserve fund exceeds 10% of the eligible portion of the annual budget for the current fiscal year, such excess shall be used to reduce the amount of real property taxes needed to finance the eligible portion of the annual budget for the next succeeding fiscal year. Not later than 60 days after the start of each fiscal year (not later than August 29) and at such times as may be required by the Common Council, the Commissioner of Finance will transmit to the Common Council a detailed report of the operation and condition of the fund during the preceding fiscal year that includes a statement of receipts and disbursements and a statement of the balance of the fund as of the last day of the preceding fiscal year. Not later than 30 days prior to the last date provided by law for the filing of the proposed budget (30 days prior to the stated meeting of the Common Council in April), the Finance Commissioner will transmit to the Budget Director a statement of the current balance of the fund. The City accounts for the contingency and tax stabilization reserve fund as restricted fund balance in the General Fund. The balance in the fund at June 30, 2013 was $5,048,663.
58

13. Encumbrances In governmental funds, encumbrance accounting under which purchase orders, contracts and other commitments for the expenditure of monies are recorded is generally employed as an extension of formal budgetary integration, and encumbrances outstanding at fiscal year end in the General Fund, Library Fund and Capital Projects Fund are reported as a restriction, commitment, or assignment of fund balance. 14. Estimates and Assumptions The preparation of financial statements in conformity with generally accepted accounting principles requires management to make estimates and assumptions that affect the reported amounts of assets and liabilities and disclosure of contingent assets and liabilities at the date of the financial statements. Estimates also affect the reported amounts of revenues and expenditures/expenses during the reporting period. Actual amounts could differ from those estimates. 15. Subsequent Events Evaluation by Management Management has evaluated subsequent events for disclosure and/or recognition in the financial statements through the date that the financial statements were available to be issued, which date is October 28, 2013. Note 2: Stewardship, Compliance and Accountability A. Budgetary Information The procedures for establishing the budgetary data reflected in the financial statements are as follows: 1. Formal annual operating budgets are adopted by the Common Council for the General Fund, Library Fund, Water Fund, Sewer Rent Fund, Debt Service Fund and Self Insurance Fund. General Fund, Library Fund and Debt Service Fund budgets are prepared on a basis consistent with generally accepted accounting principles (GAAP) and serve as management control devices during the fiscal year. The Capital Projects Fund is budgeted on a project basis with Common Council approval. Other special revenue funds and the permanent fund do not have annual budgets, since grant awards and revenues received under other contractual requirements recorded in these funds span more than a single fiscal year. 2. Prior to January 15th of each year, the Budget Director furnishes to the heads of departments, offices and other spending agencies, instructions for the submission of budget estimates for the General Fund, Library Fund, Water Fund, Sewer Rent Fund, Debt Service Fund and Self Insurance Fund. 3. Not later than February 15th, estimates of the expenditure requirements and projected revenues for the new budget year are submitted to the Budget Director. Immediately thereafter, the Budget Director conducts departmental budget hearings to review said estimates, after which he/she may revise the estimates based upon the needs of the various spending agencies and the probable total revenue available to the City. 4. The Budget Director presents the proposed budgets to the Mayor and the members of the Common Council at the first stated meeting of the Common Council in April. Immediately thereafter,
59
the Common Council commences consideration and review of the proposed budgets. 5. Public sessions are held by the Common Council during the months of April and May on the proposed budgets. 6. The budgets are legally enacted through adoption of ordinances by the Common Council on or before May 30th. The budgets are not subject to referendum. 7. The Commissioner of Finance may not disburse funds unless appropriated and may not disburse funds in excess of such appropriations. With the exception of personal services and related employee benefits, department heads are authorized, in all funds, to transfer budgeted amounts up to $5,000 between major objects of expenditure within their department, which is the legal level of budgetary control, with the approval of the Budget Director. Transfers in excess of $5,000 between major objects of expenditures within a department, transfers of personal services and related employee benefits, transfers between departments and any revisions that alter the total expenditures of any fund must be approved by the Common Council. 8. Appropriations in all budgeted funds lapse at the end of the fiscal year, except that outstanding encumbrances are re-appropriated in the subsequent year pursuant to the Uniform System of Accounts promulgated by the Office of the State Comptroller. B. Constitutional Tax Levy Limitation The amount that may be raised by the City for real property taxes in any fiscal year, for purposes other than for debt service on City indebtedness, is limited by the Constitution of the State of New York to 2% of the five-year average full valuation of taxable real property located within the City. For the fiscal year 2012-2013, the maximum tax amount that could have been raised was $202,580,220, which exceeded the levy by $151,745,435. C. Real Property Tax Cap On June 24, 2011, Governor Andrew Cuomo signed Chapter 97 of the Laws of 2011 (Tax Cap Law). This law applies to all local governments in New York State. The Tax Cap Law restricts the amount of real property taxes that may be levied by the City in a particular year, beginning with the 2012-2013 fiscal year and expires on June 16, 2016. The growth in the annual levy is limited to the lesser of two percent or the annual change in the national unadjusted Consumer Price Index for All Urban Consumers – All Items (CPI-U), subject to certain limited exceptions and adjustments. Exclusions are limited to 1) costs resulting from court orders or judgments against the local government arising out of tort actions to be paid in the coming fiscal year that exceed five percent of the total prior year’s tax levy, and 2) the portion, if any, of employer pension costs that exceed the annual growth in the average actuarial contribution rate for the Employees’ Retirement System (ERS) and/or the Police and Fire Retirement System (PFRS) by two percentage points. The law provides that the City may override and exceed the tax levy limit by adopting a local law with a 60% affirmative vote of the total voting power of the Common Council (five affirmative votes). Such local law must be adopted prior to the adoption of the annual budget affected by the tax levy. D. Capital Projects Fund Deficits Individual projects within the Capital Projects Fund reported deficits at year end. These temporary deficits arise when total project expenditures and transfers out exceed total project resources
60

(revenues, grants and aid, long-term debt proceeds and transfers in) and will be eliminated as project resources are obtained. Note 3: Detailed Notes on all Funds A. Taxes Receivable Taxes receivable at June 30, 2013 consisted of the following:
Current Year Prior Years TotalCity 294,738$ 262,725$ 557,463$ School 867,489 423,193 1,290,682County 388,520 271,946 660,466Liens and other Charges - 1,040,256 1,040,256 Total 1,550,747$ 1,998,120$ 3,548,867$
Taxes receivable are partially offset in the fund financial statements by unearned tax revenues of $478,457, which represents an estimate of the receivable that will not be collected within the first 60 days of the subsequent year. Other receivables at June 30, 2013 of the City’s governmental activities consisted of rehabilitation loans, charges for services, utility gross receipts and miscellaneous items. The receivables of the business-type activities consisted of water charges and sewer rents. B. Due From/To Other Funds The balances reflected as due from/to other funds at June 30, 2013 are as follows:
Receivable Fund Payable Fund AmountGeneral Community Development 15,000$
Public Safety Grant 42,000 Youth Development 334,453 Capital Projects Fund 2,900,000
3,291,453$
The outstanding balances between funds result mainly from the time lag between the dates that interfund goods and services are provided or reimbursable expenditures occur and payments between funds are made.
THIS SPACE LEFT BLANK INTENTIONALLY
61
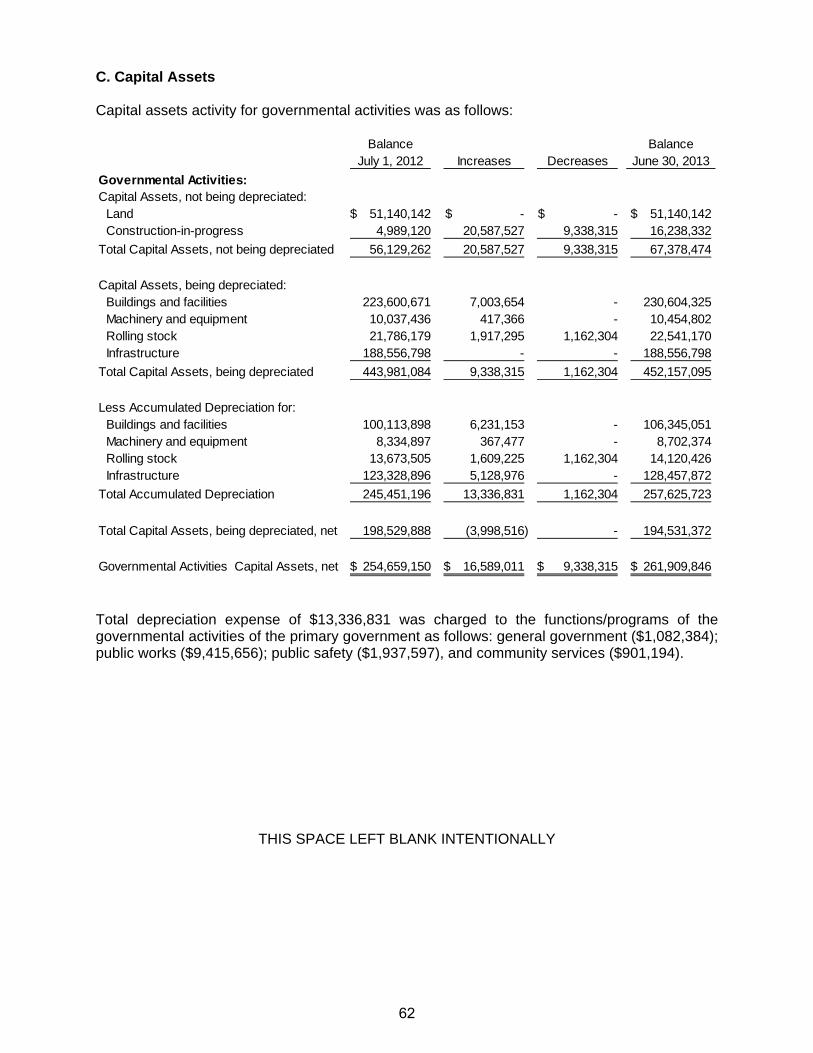
C. Capital Assets Capital assets activity for governmental activities was as follows:
Balance Balance
July 1, 2012 Increases Decreases June 30, 2013
Governmental Activities:Capital Assets, not being depreciated:
Land 51,140,142$ -$ -$ 51,140,142$ Construction-in-progress 4,989,120 20,587,527 9,338,315 16,238,332
Total Capital Assets, not being depreciated 56,129,262 20,587,527 9,338,315 67,378,474
Capital Assets, being depreciated:Buildings and facilities 223,600,671 7,003,654 - 230,604,325 Machinery and equipment 10,037,436 417,366 - 10,454,802 Rolling stock 21,786,179 1,917,295 1,162,304 22,541,170 Infrastructure 188,556,798 - - 188,556,798
Total Capital Assets, being depreciated 443,981,084 9,338,315 1,162,304 452,157,095
Less Accumulated Depreciation for:Buildings and facilities 100,113,898 6,231,153 - 106,345,051 Machinery and equipment 8,334,897 367,477 - 8,702,374 Rolling stock 13,673,505 1,609,225 1,162,304 14,120,426 Infrastructure 123,328,896 5,128,976 - 128,457,872
Total Accumulated Depreciation 245,451,196 13,336,831 1,162,304 257,625,723
Total Capital Assets, being depreciated, net 198,529,888 (3,998,516) - 194,531,372
Governmental Activities Capital Assets, net 254,659,150$ 16,589,011$ 9,338,315$ 261,909,846$
Total depreciation expense of $13,336,831 was charged to the functions/programs of the governmental activities of the primary government as follows: general government ($1,082,384); public works ($9,415,656); public safety ($1,937,597), and community services ($901,194).
THIS SPACE LEFT BLANK INTENTIONALLY
62

Capital assets activity for business-type activities was as follows:
Balance BalanceJuly 1, 2012 Increases Decreases June 30, 2013
Business-type Activities:Capital Assets, not being depreciated:
Land 712,806$ -$ -$ 712,806$ Construction-in-progress 4,899,832 738,543 2,038,633 3,599,742
Total Capital Assets, not being depreciated 5,612,638 738,543 2,038,633 4,312,548
Capital Assets, being depreciated:Buildings and facilities 6,179,395 - - 6,179,395 Machinery and equipment 662,353 - - 662,353 Rolling stock 1,045,585 140,247 17,081 1,168,751 Infrastructure 65,244,601 1,958,386 - 67,202,987
Total Capital Assets, being depreciated 73,131,934 2,098,633 17,081 75,213,486
Less Accumulated Depreciation for:Buildings and facilities 2,267,094 127,379 - 2,394,473 Machinery and equipment 636,651 3,826 - 640,477 Rolling stock 610,840 83,611 17,081 677,370 Infrastructure 35,907,867 1,468,789 - 37,376,656
Total Accumulated Depreciation 39,422,452 1,683,605 17,081 41,088,976
Total Capital Assets, being depreciated, net 33,709,482 415,028 - 34,124,510
Business-type Activities Capital Assets, net 39,322,120$ 1,153,571$ 2,038,633$ 38,437,058$
Total depreciation expense of $1,683,605 was charged to the business-type activities as follows: Water Fund ($977,434) and Sewer Rent Fund ($706,171). Construction Commitments The City has active construction projects as of June 30, 2013 that includes both new construction and renovations to its existing properties. At year end, the City had $20,017,147 in construction commitments. Capital Assets - Discretely Presented Component Units Capital assets activity for the Urban Renewal Agency for the year ended June 30, 2013 was as follows:
Balance Balance
July 1, 2012 Increases Decreases June 30, 2013 Capital Assets-Land 2,893,760$ -$ 150,000$ 2,743,760$
63
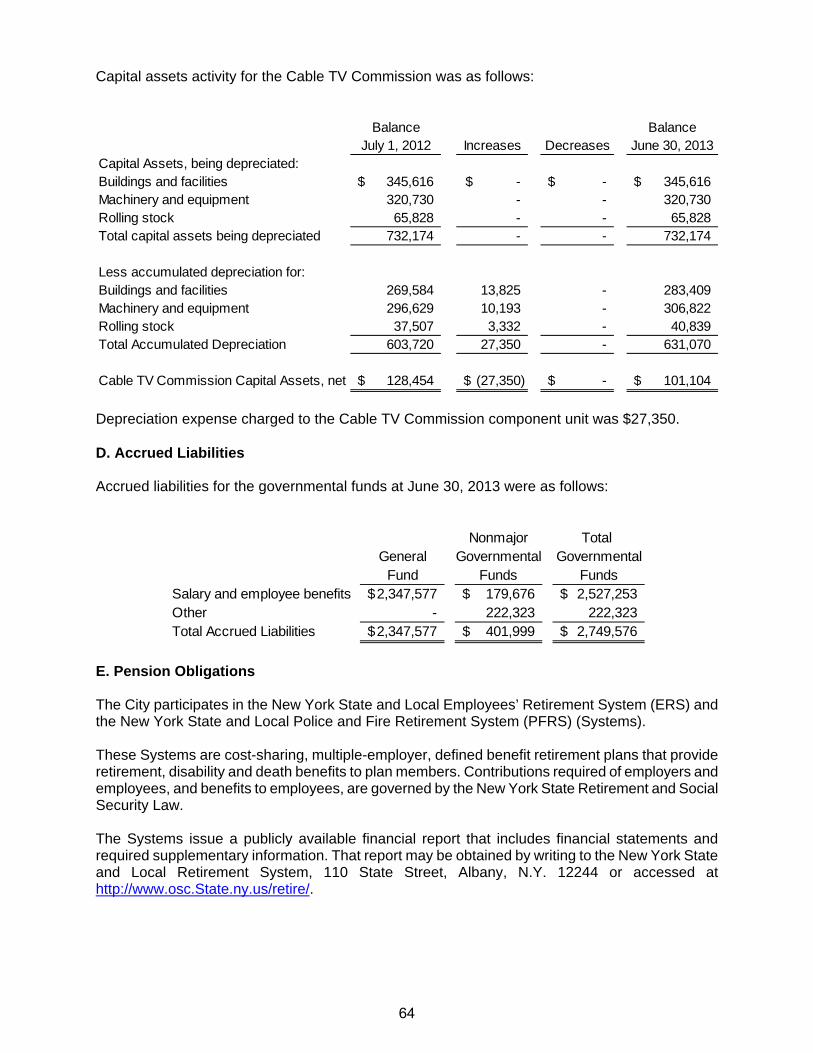
Capital assets activity for the Cable TV Commission was as follows:
Balance BalanceJuly 1, 2012 Increases Decreases June 30, 2013
Capital Assets, being depreciated:Buildings and facilities 345,616$ -$ -$ 345,616$ Machinery and equipment 320,730 - - 320,730Rolling stock 65,828 - - 65,828Total capital assets being depreciated 732,174 - - 732,174
Less accumulated depreciation for:Buildings and facilities 269,584 13,825 - 283,409Machinery and equipment 296,629 10,193 - 306,822Rolling stock 37,507 3,332 - 40,839Total Accumulated Depreciation 603,720 27,350 - 631,070
Cable TV Commission Capital Assets, net 128,454$ (27,350)$ -$ 101,104$
Depreciation expense charged to the Cable TV Commission component unit was $27,350. D. Accrued Liabilities Accrued liabilities for the governmental funds at June 30, 2013 were as follows:
Nonmajor Total General Governmental Governmental
Fund Funds FundsSalary and employee benefits 2,347,577$ 179,676$ 2,527,253$ Other - 222,323 222,323Total Accrued Liabilities 2,347,577$ 401,999$ 2,749,576$
E. Pension Obligations The City participates in the New York State and Local Employees’ Retirement System (ERS) and the New York State and Local Police and Fire Retirement System (PFRS) (Systems). These Systems are cost-sharing, multiple-employer, defined benefit retirement plans that provide retirement, disability and death benefits to plan members. Contributions required of employers and employees, and benefits to employees, are governed by the New York State Retirement and Social Security Law. The Systems issue a publicly available financial report that includes financial statements and required supplementary information. That report may be obtained by writing to the New York State and Local Retirement System, 110 State Street, Albany, N.Y. 12244 or accessed at http://www.osc.State.ny.us/retire/.
64
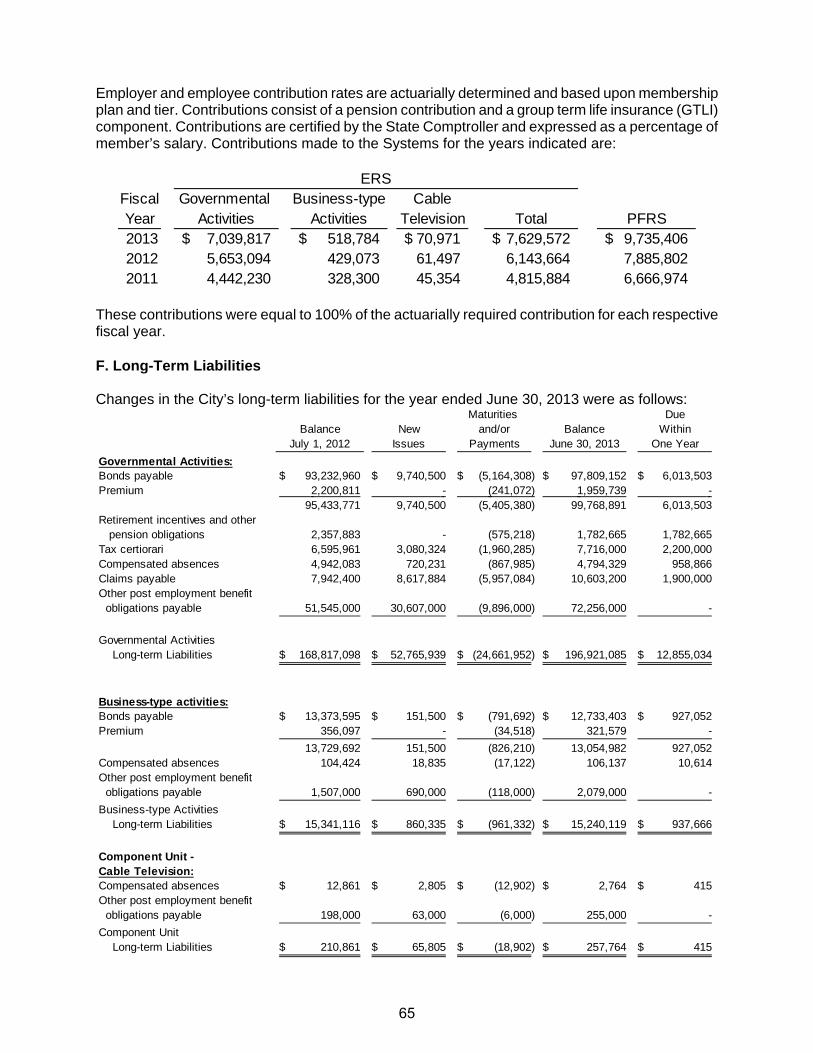
Employer and employee contribution rates are actuarially determined and based upon membership plan and tier. Contributions consist of a pension contribution and a group term life insurance (GTLI) component. Contributions are certified by the State Comptroller and expressed as a percentage of member’s salary. Contributions made to the Systems for the years indicated are:
Fiscal Governmental Business-type CableYear Activities Activities Television Total PFRS2013 7,039,817$ 518,784$ 70,971$ 7,629,572$ 9,735,406$ 2012 5,653,094 429,073 61,497 6,143,664 7,885,8022011 4,442,230 328,300 45,354 4,815,884 6,666,974
ERS
These contributions were equal to 100% of the actuarially required contribution for each respective fiscal year. F. Long-Term Liabilities Changes in the City’s long-term liabilities for the year ended June 30, 2013 were as follows:
Maturities DueBalance New and/or Balance Within
July 1, 2012 Issues Payments June 30, 2013 One Year
Governmental Activities:Bonds payable 93,232,960$ 9,740,500$ (5,164,308)$ 97,809,152$ 6,013,503$ Premium 2,200,811 - (241,072) 1,959,739 -
95,433,771 9,740,500 (5,405,380) 99,768,891 6,013,503 Retirement incentives and other pension obligations 2,357,883 - (575,218) 1,782,665 1,782,665 Tax certiorari 6,595,961 3,080,324 (1,960,285) 7,716,000 2,200,000 Compensated absences 4,942,083 720,231 (867,985) 4,794,329 958,866 Claims payable 7,942,400 8,617,884 (5,957,084) 10,603,200 1,900,000 Other post employment benefit obligations payable 51,545,000 30,607,000 (9,896,000) 72,256,000 -
Governmental Activities Long-term Liabilities 168,817,098$ 52,765,939$ (24,661,952)$ 196,921,085$ 12,855,034$
Business-type activities:Bonds payable 13,373,595$ 151,500$ (791,692)$ 12,733,403$ 927,052$ Premium 356,097 - (34,518) 321,579 -
13,729,692 151,500 (826,210) 13,054,982 927,052 Compensated absences 104,424 18,835 (17,122) 106,137 10,614 Other post employment benefit obligations payable 1,507,000 690,000 (118,000) 2,079,000 -
Business-type Activities Long-term Liabilities 15,341,116$ 860,335$ (961,332)$ 15,240,119$ 937,666$
Component Unit - Cable Television:Compensated absences 12,861$ 2,805$ (12,902)$ 2,764$ 415$ Other post employment benefit obligations payable 198,000 63,000 (6,000) 255,000 -
Component Unit Long-term Liabilities 210,861$ 65,805$ (18,902)$ 257,764$ 415$
65

Governmental fund liabilities for bonds are liquidated by the Debt Service Fund, which is primarily funded by the General Fund. The liabilities for retirement incentives and other pension obligations and tax certiorari are liquidated by the General Fund. Each governmental fund’s liability for compensated absences and other post employment benefit obligations is liquidated by the respective fund. Bonds Payable The primary government issues general obligation (GO) bonds to provide funds for major capital projects. GO bonds have been issued for both governmental and business-type activities. GO bonds at June 30, 2013 for governmental activities were comprised of the following individual issues: Governmental Activities: Interest
Sale Original Rates to Final Outstanding Serial Bond Description Date Borrowing Maturity Maturity June 30, 2013
Public Improvements (Taxable Bond) 2003 360,000$ 5.15 % 2014 36,000$ Public Improvements 2005 1,244,713 3.625 2014 163,951 Public Improvements (Library) 2005 940,065 3.625 2014 123,823 Public Improvements 2006 3,574,000 4.00-4.25 2021 2,165,000 Public Improvements (Refunding) 2007 12,470,000 4.00-5.00 2022 12,280,000 Public Improvements 2007 8,144,500 4.00-4.25 2027 6,317,181 Public Improvements (Series A) 2008 3,835,000 3.375-4.00 2028 2,863,365 Public Improvements (Series B) 2008 18,750,000 4.125-4.375 2033 16,275,000 Public Improvements (Series C) 2008 250,000 6.25-6.75 2033 200,000 Public Improvements 2010 6,087,050 2.00-4.00 2030 5,390,392 Judgements and Claims 2010 750,000 2.00-4.00 2030 664,164 Public Improvements (Library) 2010 37,500 2.00-4.00 2030 33,208 Public Improvements (Refunding) 2010 5,595,000 2.00-4.00 2016 2,285,000 Public Improvements (Refunding) 2011 3,094,045 3.00-5.00 2018 2,620,063 Public Improvements 2011 11,003,375 2.00-3.125 2026 10,523,458 Judgements and Claims 2011 6,945,000 2.00-3.125 2026 6,642,091 Public Improvements (Library) 2011 806,625 2.00-3.125 2026 771,445 Public Improvements (Refunding) 2012 6,860,145 1.75-5.00 2029 6,815,964 Public Improvements (Refunding-Library) 2012 2,216,408 1.75-5.00 2025 2,193,492 Public Improvements 2012 8,799,055 2.00-3.00 2027 8,799,055 Public Improvements (Library) 2012 906,000 2.00-3.00 2027 906,000 Public Improvements 2013 9,578,500 2.25-3.00 2028 9,578,500 Public Improvements (Library) 2013 162,000 2.25-3.00 2028 162,000
97,809,152$
GO bonds at June 30, 2013 for business-type activities are as follows: Business-type Activities: Interest
Sale Original Rates to Final Outstanding Serial Bond Description Date Borrowing Maturity Maturity June 30, 2013
Public Improvements 2005 662,222$ 3.625 2014 87,226$ Public Improvements 2006 2,700,000 4.00-4.25 2021 1,160,000 Public Improvements 2007 3,365,000 4.00-4.25 2027 2,682,819 Public Improvements (Series A) 2008 1,000,000 3.375-4.00 2028 746,635 Public Improvements 2010 3,198,275 2.00-4.00 2030 2,832,236 Public Improvements (Refunding) 2010 215,000 2.00-4.00 2016 105,000 Public Improvements (Refunding) 2011 430,955 3.00-5.00 2018 364,937 Public Improvements 2011 275,000 2.00-3.125 2026 263,006 Public Improvements (Refunding) 2012 2,013,447 1.75-5.00 2025 1,995,544 Public Improvements 2012 2,344,500 2.00-3.00 2027 2,344,500 Public Improvements 2013 151,500 2.25-3.00 2028 151,500
12,733,403$
66
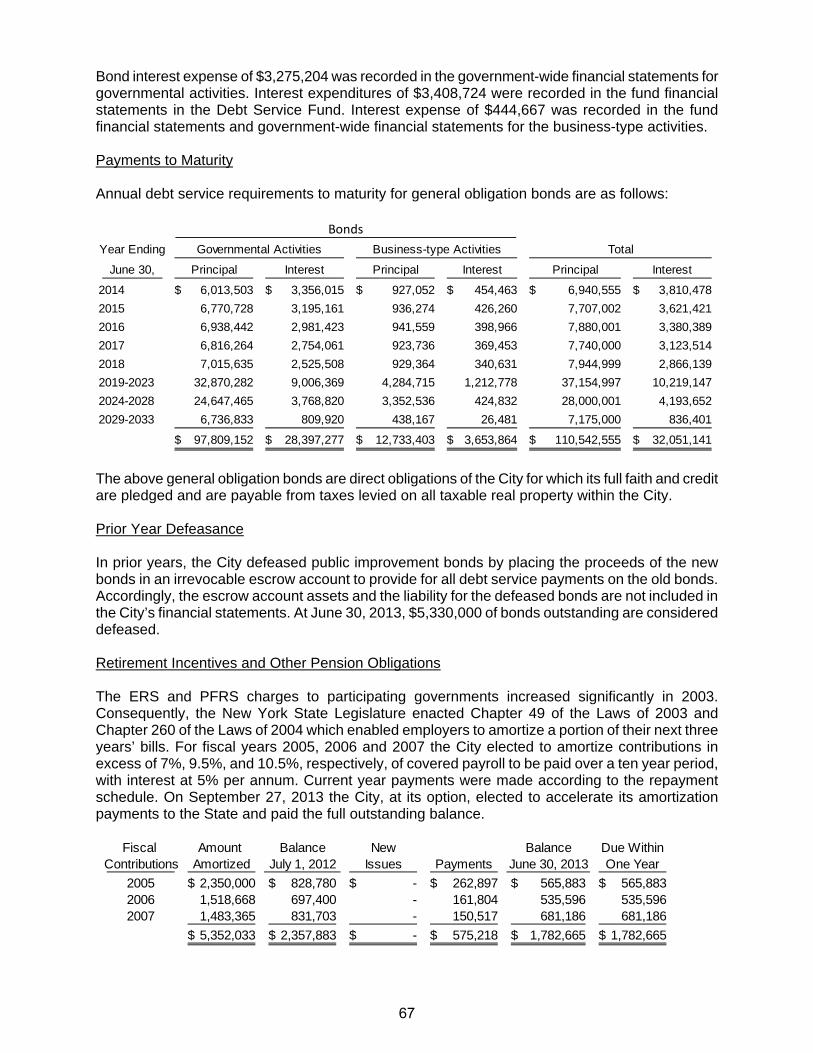
Bond interest expense of $3,275,204 was recorded in the government-wide financial statements for governmental activities. Interest expenditures of $3,408,724 were recorded in the fund financial statements in the Debt Service Fund. Interest expense of $444,667 was recorded in the fund financial statements and government-wide financial statements for the business-type activities. Payments to Maturity Annual debt service requirements to maturity for general obligation bonds are as follows:
Year Ending
June 30, Principal Interest Principal Interest Principal Interest
2014 6,013,503$ 3,356,015$ 927,052$ 454,463$ 6,940,555$ 3,810,478$
2015 6,770,728 3,195,161 936,274 426,260 7,707,002 3,621,421
2016 6,938,442 2,981,423 941,559 398,966 7,880,001 3,380,389
2017 6,816,264 2,754,061 923,736 369,453 7,740,000 3,123,514
2018 7,015,635 2,525,508 929,364 340,631 7,944,999 2,866,139
2019-2023 32,870,282 9,006,369 4,284,715 1,212,778 37,154,997 10,219,147
2024-2028 24,647,465 3,768,820 3,352,536 424,832 28,000,001 4,193,652
2029-2033 6,736,833 809,920 438,167 26,481 7,175,000 836,401
97,809,152$ 28,397,277$ 12,733,403$ 3,653,864$ 110,542,555$ 32,051,141$
TotalGovernmental Activities Business-type Activities
Bonds
The above general obligation bonds are direct obligations of the City for which its full faith and credit are pledged and are payable from taxes levied on all taxable real property within the City. Prior Year Defeasance In prior years, the City defeased public improvement bonds by placing the proceeds of the new bonds in an irrevocable escrow account to provide for all debt service payments on the old bonds. Accordingly, the escrow account assets and the liability for the defeased bonds are not included in the City’s financial statements. At June 30, 2013, $5,330,000 of bonds outstanding are considered defeased. Retirement Incentives and Other Pension Obligations The ERS and PFRS charges to participating governments increased significantly in 2003. Consequently, the New York State Legislature enacted Chapter 49 of the Laws of 2003 and Chapter 260 of the Laws of 2004 which enabled employers to amortize a portion of their next three years’ bills. For fiscal years 2005, 2006 and 2007 the City elected to amortize contributions in excess of 7%, 9.5%, and 10.5%, respectively, of covered payroll to be paid over a ten year period, with interest at 5% per annum. Current year payments were made according to the repayment schedule. On September 27, 2013 the City, at its option, elected to accelerate its amortization payments to the State and paid the full outstanding balance.
Fiscal Amount Balance New Balance Due WithinContributions Amortized July 1, 2012 Issues Payments June 30, 2013 One Year
2005 2,350,000$ 828,780$ -$ 262,897$ 565,883$ 565,883$ 2006 1,518,668 697,400 - 161,804 535,596 535,596 2007 1,483,365 831,703 - 150,517 681,186 681,186
5,352,033$ 2,357,883$ -$ 575,218$ 1,782,665$ 1,782,665$
67
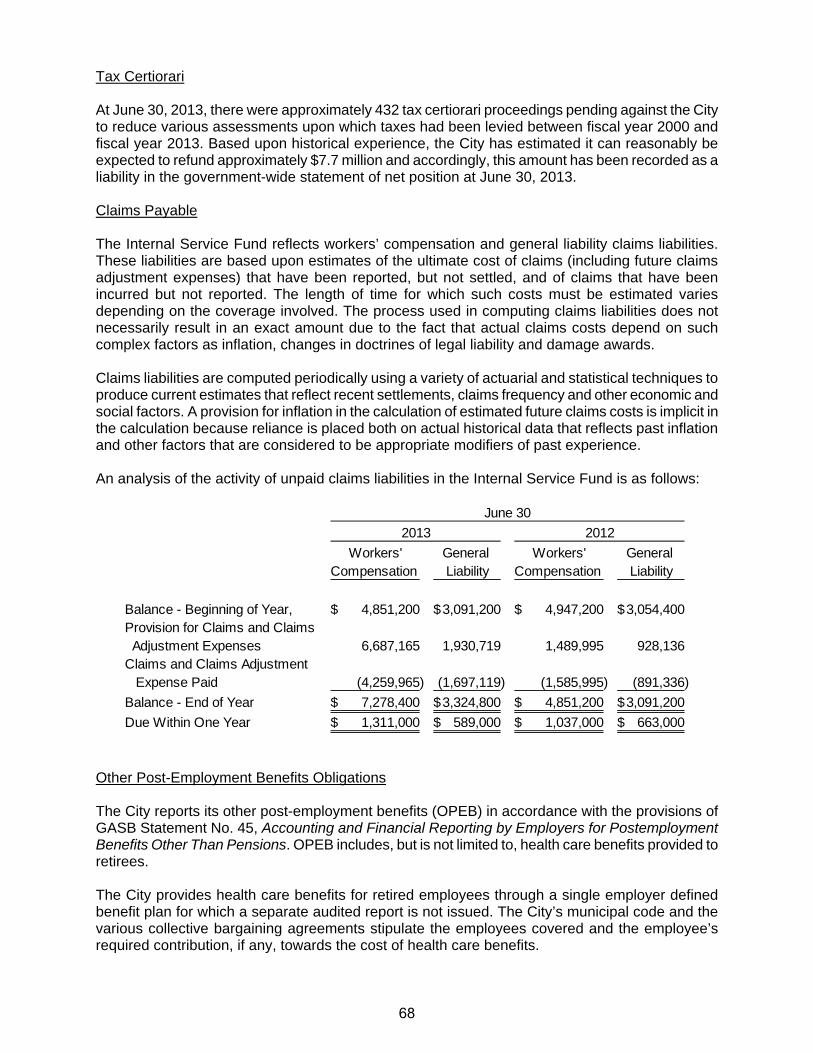
Tax Certiorari At June 30, 2013, there were approximately 432 tax certiorari proceedings pending against the City to reduce various assessments upon which taxes had been levied between fiscal year 2000 and fiscal year 2013. Based upon historical experience, the City has estimated it can reasonably be expected to refund approximately $7.7 million and accordingly, this amount has been recorded as a liability in the government-wide statement of net position at June 30, 2013. Claims Payable The Internal Service Fund reflects workers’ compensation and general liability claims liabilities. These liabilities are based upon estimates of the ultimate cost of claims (including future claims adjustment expenses) that have been reported, but not settled, and of claims that have been incurred but not reported. The length of time for which such costs must be estimated varies depending on the coverage involved. The process used in computing claims liabilities does not necessarily result in an exact amount due to the fact that actual claims costs depend on such complex factors as inflation, changes in doctrines of legal liability and damage awards. Claims liabilities are computed periodically using a variety of actuarial and statistical techniques to produce current estimates that reflect recent settlements, claims frequency and other economic and social factors. A provision for inflation in the calculation of estimated future claims costs is implicit in the calculation because reliance is placed both on actual historical data that reflects past inflation and other factors that are considered to be appropriate modifiers of past experience. An analysis of the activity of unpaid claims liabilities in the Internal Service Fund is as follows:
Workers' General Workers' General Compensation Liability Compensation Liability
Balance - Beginning of Year, 4,851,200$ 3,091,200$ 4,947,200$ 3,054,400$ Provision for Claims and Claims Adjustment Expenses 6,687,165 1,930,719 1,489,995 928,136 Claims and Claims Adjustment Expense Paid (4,259,965) (1,697,119) (1,585,995) (891,336)
Balance - End of Year 7,278,400$ 3,324,800$ 4,851,200$ 3,091,200$
Due Within One Year 1,311,000$ 589,000$ 1,037,000$ 663,000$
June 30
2013 2012
Other Post-Employment Benefits Obligations The City reports its other post-employment benefits (OPEB) in accordance with the provisions of GASB Statement No. 45, Accounting and Financial Reporting by Employers for Postemployment Benefits Other Than Pensions. OPEB includes, but is not limited to, health care benefits provided to retirees. The City provides health care benefits for retired employees through a single employer defined benefit plan for which a separate audited report is not issued. The City’s municipal code and the various collective bargaining agreements stipulate the employees covered and the employee’s required contribution, if any, towards the cost of health care benefits.
68
The City pays some or all of the cost of post-employment health care benefits for retirees, their spouses and their dependents during the life of the retiree. Surviving spouses of retirees may elect to continue health care benefits at their own expense. Substantially all of the City’s employees may become eligible for these benefits if they reach normal retirement age while working for the City and have been credited with at least five years of service to the City. The expense and liability for OPEB is calculated on an actuarial basis. Actuarial valuations for OPEB plans involve estimates of the value of reported amounts and assumptions about the probability of events far into the future. These amounts are subject to continual revisions as results are compared to past expectations and new estimates are made about the future. Calculations are based on the OPEB benefits provided under the terms of the substantive plan in effect at the time of each valuation and on the pattern of sharing costs between employer and plan members to that point. The actuarial calculations of the OPEB plan reflect a long-term perspective. The City is required to accrue on the government-wide and proprietary funds financial statements the amounts necessary to finance the plan as actuarially determined, which is equal to the balance not paid by plan members. The cost of OPEB is recognized as expenditures as claims are paid within the governmental funds. Funding for the plan has been established on a pay-as-you-go basis. The City’s annual cost (expense) is calculated based on the annual required contribution (ARC), an amount actuarially determined in accordance with GASB Statement No. 45. Instead of expensing the current year premiums paid, a per capita claims cost is calculated and used to determine a normal cost, an actuarially accrued liability and ultimately the ARC. The ARC represents a level of funding that, if paid on an ongoing basis, is projected to cover normal cost each year and amortize any unfunded actuarial liabilities over a period not to exceed 30 years. Assumptions used in calculating OPEB are as follows:
Health care costs will increase 10% for the first year, then decrease in years two through seven to 9%, 8%, 7%, 6%, 6% and 5%, respectively, and then continue at 5% thereafter.
The assumed inflation rate is 3% for all years. The discount rate used is 4.5% for all years. The amortization basis is the level percentage of projected payroll over 30 years with an
open amortization approach with 26 years remaining in the amortization period. The actuarial funding method used is the projected unit credit.
The City currently has no assets set aside for the purpose of paying other post-employment benefits. Current New York State law prohibits municipalities from pre-funding retiree health care benefits obligations in an irrevocable trust fund as required by GASB Statement No. 45. If and when New York municipalities are permitted to pre-fund these obligations, the City will have the option of doing so in order to reduce and/or eliminate the accumulated liability. The number of participants and net OPEB obligation as of June 30, 2013 is presented on the following page.
69

Governmental Business-type Total Primary Component Unit-
Activities Activities Government Cable Television
Active Employees 872 28 900 4
Retired Employees 716 12 728 1
Total 1,588 40 1,628 5
Amortization Component:
Actuarial Accrued Liability as of July 1, 2012 345,213,000$ 6,634,000$ 351,847,000$ 623,000$
Assets at Market Value - - - -
Unfunded Actuarial Accrued Liability ("UAAL") 345,213,000$ 6,634,000$ 351,847,000$ 623,000$
Funded Ratio 0.00% 0.00% 0.00% 0.00%
Covered Payroll (active plan members) 72,478,000$ 2,692,000$ 75,170,000$ 370,000$
UAAL as a Percentage of Covered Payroll 476.30% 246.43% 468.07% 168.38%
Annual Required Contribution 31,320,000$ 706,000$ 32,026,000$ 64,000$
Interest on Net OPEB Obligation 2,324,000 67,000 2,391,000 9,000
Adjustment to Annual Required Contribution (3,037,000) (83,000) (3,120,000) (10,000)
Annual OPEB Cost 30,607,000 690,000 31,297,000 63,000
Contributions Made (9,896,000) (118,000) (10,014,000) (6,000)
Increase in Net OPEB Obligation 20,711,000 572,000 21,283,000 57,000
Net OPEB Obligation, Beginning of year 51,545,000 1,507,000 53,052,000 198,000
Net OPEB Obligation, End of year 72,256,000$ 2,079,000$ 74,335,000$ 255,000$
The City’s annual OPEB cost, the percentage of annual OPEB cost contributed to the plan and the net OPEB obligation for the current and two preceding years is as follows:
Fiscal Year Percentage of
Ended Annual OPEB Annual OPEB Net OPEB
June 30, OPEB Cost Cost Contributed Cost Contributed Obligation
Governmental 2013 30,607,000$ 9,896,000$ 32.33% 72,256,000$
Activities 2012 29,251,000 8,075,000 27.61% 51,545,000
2011 18,380,000 8,071,000 43.91% 30,369,000
Business-type 2013 690,000 118,000 17.10% 2,079,000
Activities 2012 650,000 118,000 18.15% 1,507,000
2011 591,000 122,000 20.64% 975,000
Total Primary 2013 31,297,000 10,014,000 32.00% 74,335,000
Government 2012 29,901,000 8,193,000 27.40% 53,052,000
2011 18,971,000 8,193,000 43.19% 31,344,000
Component 2013 63,000 6,000 9.52% 255,000
Unit 2012 59,000 7,000 11.86% 198,000
2011 69,000 7,000 10.14% 146,000 A schedule of funding progress for OPEB is presented as required supplementary information (RSI) immediately following these notes to the financial statements.
70

G. Interfund Transfers Interfund transfers are defined as the flow of assets (such as cash or goods) without equivalent flows of assets in return and without a requirement for repayment. The following have been reported as interfund transfers:
Capital NonmajorGeneral Projects Governmental
Fund Fund Funds Total
Transfers in:General Fund -$ 545$ -$ 545$ Capital Projects Fund 438,000 - 120,000 558,000 Nonmajor Governmental Funds 9,031,972 142,394 355,535 9,529,901
Total 9,469,972$ 142,939$ 475,535$ 10,088,446$
Transfers Out
Transfers are used to 1) move revenues from the fund with collection authorization to the Debt Service Fund as debt service principal and interest payments become due, and 2) move unrestricted General Fund revenues to finance various programs that the government must account for in other funds in accordance with budgetary authorizations, including amounts provided as subsidies or matching funds for various grant programs. H. Lease Agreements Commitments under a lease agreement for a Senior Center facility operated by the City provide for minimum annual rental payments as follows:
Fiscal YearEnded Senior June 30, Center
2014 264,000$ 2015 264,0002016 268,8052017 273,9452018 273,945
2019-2023 1,369,7282024-2027 1,970,009
Rental expenditures charged to operations of the primary government in fiscal year 2013 were $414,372. The City, under various agreements, rents real property for public parking. Rental payments are based on parking income generated or negotiated on a year-to-year basis. The City is responsible for ordinary repairs and maintenance of its leased properties. Rental expense charged to operations aggregated $146,680 in the fiscal year ending June 30, 2013. I. Encumbrances As discussed in Note 1(E)(13) Encumbrances, encumbrance accounting is utilized to the extent necessary to assure effective budgetary control and accountability and to facilitate effective cash planning and control.
71
At year end the amount of encumbrances expected to be honored upon performance by the vendor in the next year were as follows: General Fund $ 1,523,191 Capital Projects Fund 20,017,147 Total $21,540,338 J. Net Position Net position is the difference between (a) assets and deferred outflows of resources and (b) liabilities and deferred inflows of resources. The components of net position are detailed below: The net investment in capital assets component of net position consists of capital assets, net of accumulated depreciation, reduced by the outstanding balances of bonds, mortgages, notes, or other borrowings that are attributable to the acquisition, construction, or improvement of those assets. The restricted component of net position consists of restricted assets reduced by liabilities and deferred inflows of resources related to those assets. Generally, a liability relates to restricted assets if the asset results from a resource flow that also results in the recognition of a liability or if the liability will be liquidated with the restricted assets reported. Specific identification of restricted net position presented in the City’s government-wide financial statements is as follows:
Restricted for Capital Projects – Net position that reports the amounts restricted for capital projects, exclusive of unexpended bond proceeds.
Restricted for Debt Service – Net position that reports the amounts restricted for the payment of debt principal and interest with constraints placed on their use by the New York State Local Finance Law and bond ordinances.
Restricted for Public Safety – Net position that represents funds restricted for public safety activities under Federal or State laws or by external parties and/or statutes.
Restricted for Community Services – Net position of the nonmajor governmental funds, exclusive of the Debt Service Fund, Permanent Fund, and Police Activities Fund, that is legally or administratively restricted for specific purposes under Federal or State laws or by external parties and/or statutes.
Restricted for Nonrecurring Repairs – Net position of the City Center Garage Fund, restricted by ordinance and/or legal agreements to be used for certain repairs to the City Center Garage.
Restricted for Tax Stabilization – Net position that reports the amounts restricted for contingency and tax stabilization, as adopted by Common Council ordinance on May 10, 2010 pursuant to Section 6-e of the General Municipal Law.
Restricted for Permanent Fund – Net position that reports the difference between assets and liabilities of the Goldie Zeitlin Memorial Fund, with $10,000 of this difference representing an endowment amount that must be retained in perpetuity (nonexpendable), and the remaining balance, if any, representing expendable restricted net position that can only be used for the City’s programs related to urban concerns.
The unrestricted component of net position is the net amount of the assets and deferred outflows of resources, less the liabilities and deferred inflows of resources that are not included in the determination of net investment in capital assets or the restricted component of net position.
72
K. Subsequent Events On July 18, 2013 the City issued $10,775,259 of new debt in the form of serial bonds through the New York State Environmental Facilities Corporation (EFC) State Revolving Funds Revenue Bonds, Series 2013 B (2010 Master Financing Program) to finance some of the costs associated with the closure of the Gedney Way Landfill (see Note 4(D) - Other Matters). The bonds have a 20 year maturity with interest rates ranging from 0.2630% to 4.6095% and the EFC provides a 50% subsidy for interest payments. Principal payments are due on November 1 and interest payments due on November 1 and May 1 in each year from the date of the bonds through maturity. The bonds maturing on or after November 15, 2023 are subject to redemption prior to maturity at the option of the EFC in whole or in part at any time on or after May 15, 2023, at par. Annual debt service requirements to maturity for these bonds are as follows:
June 30, Principal Interest
2014 515,000$ 257,363$
2015 490,259 326,033
2016 490,000 322,831
2017 495,000 317,819
2018 500,000 310,923
2019-2023 2,555,000 1,391,305
2024-2028 2,730,000 979,173
2029-2033 3,000,000 402,776
10,775,259$ 4,308,223$
Note 4: Other Information A. Self Insurance Fund The City, including its component units, is self insured for workers’ compensation, general and automobile liability, and unemployment benefits. Insurance policies were purchased for the following exposures with the deductible or self-insured retention indicated in parenthesis: public officials/employment practices liability ($150,000/$150,000 self-insured retention), property ($100,000 deductible), parking garage property/liability ($1,000 deductible/no deductible), workers' compensation excess liability ($750,000 self-insured retention), employers liability ($50,000 self-insured retention), and employee faithful performance/crime ($25,000 deductible). The City self-insures its general liability and automobile liability and purchases an excess umbrella liability insurance policy ($1,000,000 self-insured retention). Unemployment claims are reimbursed to New York State on a pay-as-you-go basis. The Self Insurance Fund (SIF), an internal service fund, is funded by charges to the City’s other funds and component units, and is based primarily upon the contributing funds claims experience. Estimates for incurred but not reported (IBNR) losses and trend and development factors for workers’ compensation, general liability and auto liability claims, as well as administrative costs, are also formulated into the contributions. Each contributing fund, based upon its proportionate share of SIF fund balance, benefits from the investment income earned by the SIF. There were no significant reductions in insurance coverage from fiscal year 2011-2012 to fiscal year 2012-2013. There were no settlements in excess of the insurance coverage in any of the three prior fiscal years.
73
B. Litigation There are claims against the City that have occurred in the normal course of operations for personal injuries, bodily injuries and wrongful death from various alleged causes and litigation is pending with respect to other miscellaneous matters. In the opinion of the management of the City, based on the advice from the Corporation Counsel, the final disposition of these matters will not have a materially adverse effect on the financial condition of the City. C. Contingencies The City participates in various Federal grant programs, principal of which are programs of the United States Department of Housing and Urban Development. These programs are subject to program compliance audits pursuant to the Single Audit Act as amended in 1996. The amount of expenditures which may be disallowed by the granting agencies cannot be determined at this time, although the City anticipates such amounts, if any, will be immaterial. D. Other Matters As discussed in Note 3(F) Long Term Liabilities – Retirement Incentives and Other Pension Obligations, on September 27, 2013, the City paid $1,793,570 in principal and $59,288 in accrued interest as payment in full of the outstanding amounts due for pension contribution loans provided by the State in fiscal years 2005, 2006 and 2007. During fiscal year ended June 30, 2013 the City initiated the closure of the Gedney Way Landfill pursuant to an order on consent issued by the New York State Department of Environmental Conservation. It is anticipated that the closure will be completed in fiscal year ended June 30, 2014.
74
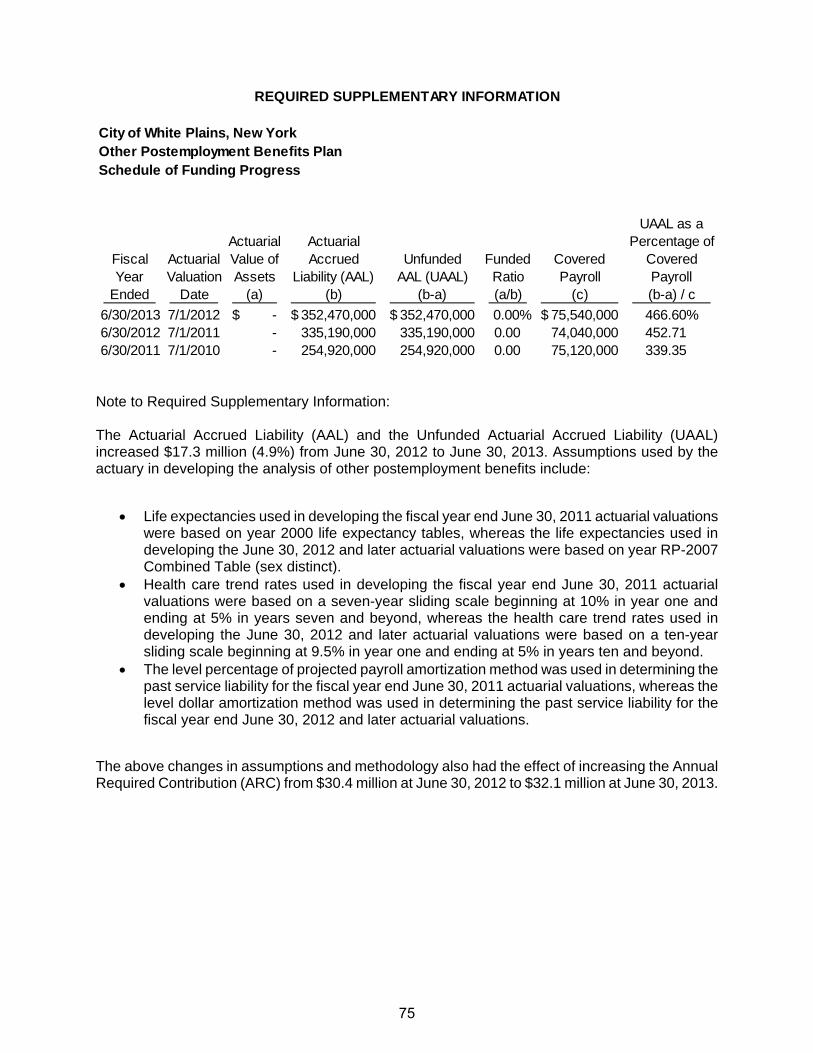
City of White Plains, New YorkOther Postemployment Benefits PlanSchedule of Funding Progress
UAAL as aActuarial Actuarial Percentage of
Fiscal Actuarial Value of Accrued Unfunded Funded Covered CoveredYear Valuation Assets Liability (AAL) AAL (UAAL) Ratio Payroll Payroll
Ended Date (a) (b) (b-a) (a/b) (c) (b-a) / c
6/30/2013 7/1/2012 -$ 352,470,000$ 352,470,000$ 0.00% 75,540,000$ 466.60%6/30/2012 7/1/2011 - 335,190,000 335,190,000 0.00 74,040,000 452.71 6/30/2011 7/1/2010 - 254,920,000 254,920,000 0.00 75,120,000 339.35
REQUIRED SUPPLEMENTARY INFORMATION
Note to Required Supplementary Information: The Actuarial Accrued Liability (AAL) and the Unfunded Actuarial Accrued Liability (UAAL) increased $17.3 million (4.9%) from June 30, 2012 to June 30, 2013. Assumptions used by the actuary in developing the analysis of other postemployment benefits include:
Life expectancies used in developing the fiscal year end June 30, 2011 actuarial valuations were based on year 2000 life expectancy tables, whereas the life expectancies used in developing the June 30, 2012 and later actuarial valuations were based on year RP-2007 Combined Table (sex distinct).
Health care trend rates used in developing the fiscal year end June 30, 2011 actuarial valuations were based on a seven-year sliding scale beginning at 10% in year one and ending at 5% in years seven and beyond, whereas the health care trend rates used in developing the June 30, 2012 and later actuarial valuations were based on a ten-year sliding scale beginning at 9.5% in year one and ending at 5% in years ten and beyond.
The level percentage of projected payroll amortization method was used in determining the past service liability for the fiscal year end June 30, 2011 actuarial valuations, whereas the level dollar amortization method was used in determining the past service liability for the fiscal year end June 30, 2012 and later actuarial valuations.
The above changes in assumptions and methodology also had the effect of increasing the Annual Required Contribution (ARC) from $30.4 million at June 30, 2012 to $32.1 million at June 30, 2013.
75

THIS PAGE INTENTIONALLY LEFT BLANK
76
COMBINING AND INDIVIDUAL FUND FINANCIALSTATEMENTS AND ADDITIONAL SCHEDULES
77

CITY OF WHITE PLAINS, NEW YORKGENERAL FUNDSCHEDULE OF REVENUES AND OTHER FINANCING SOURCES COMPARED TO BUDGET FOR THE FISCAL YEAR ENDED JUNE 30, 2013
Variance withOriginal Final Actual Final Budget
REVENUES Taxes and Related Items: Property taxes 45,998,536$ 45,959,664$ 45,499,875$ (459,789)$ Payments in lieu of taxes 3,312,799 3,312,799 3,469,601 156,802 Interest and lien fees 555,000 555,000 446,548 (108,452) Less allowance for uncollected taxes and tax certiorari (20,000) (20,000) (46,980) (26,980)
49,846,335 49,807,463 49,369,044 (438,419) Sales and use taxes 45,750,000 45,750,000 49,913,997 4,163,997 Hotel occupancy tax 1,030,000 1,030,000 997,932 (32,068) Utility gross receipts tax 1,326,000 1,326,000 1,264,420 (61,580) Total Taxes and Related Items 97,952,335 97,913,463 101,545,393 3,631,930
Intergovernmental: Federal Support: Emergency Management Assistance - 654,545 1,612,590 958,045 Senior Citizens - Title III B 11,048 16,559 16,566 7 Nutrition Program-Title IIIC 34,650 34,650 30,642 (4,008) Commodity funding 12,000 12,000 5,138 (6,862) U.S.-DOJ Bullet Proof Vest Partnership 15,000 15,000 - (15,000) Workforce Investment - 12,635 12,635 - F.B.I. Violent Crime Task Force 17,200 17,200 19,115 1,915
89,898 762,589 1,696,686 934,097 State Support: Aid and Incentives to Municipalities ("AIM") 5,463,256 5,463,256 5,463,256 - Youth programs 52,848 52,848 28,377 (24,471) Buckle Up New York 6,386 6,386 6,386 - Cell Phone Enforcement Grant 16,000 16,000 5,239 (10,761) Pedestrian Safety Grant 10,000 10,000 8,910 (1,090) NYS Criminal Justice Service - - 2,688 2,688 Arterial highway maintenance 28,050 28,050 28,050 - Mental health program 73,700 73,700 69,113 (4,587) Unified court aid 40,000 40,000 43,620 3,620
5,690,240 5,690,240 5,655,639 (34,601)
County and Local Support: Mortgage tax 1,150,000 1,150,000 1,550,411 400,411 Stop DWI programs 8,400 8,400 3,531 (4,869) STEP grant 6,825 6,825 8,671 1,846 Community development grant 39,480 39,480 39,120 (360)
1,204,705 1,204,705 1,601,733 397,028 Total Intergovernmental 6,984,843 7,657,534 8,954,058 1,296,524
Charges for Services: General services 240,421 240,421 168,379 (72,042) Finance department 829,580 829,580 834,217 4,637 City clerk's office 105,550 105,550 108,906 3,356 Public works department 176,025 176,025 186,582 10,557 Parking department 13,367,541 13,367,541 13,392,419 24,878 Public safety department 1,283,304 1,283,304 1,305,084 21,780 Recreation department 1,231,825 1,231,825 1,215,301 (16,524) Youth services bureau 657,595 657,595 619,790 (37,805) Total Charges for Services 17,891,841 17,891,841 17,830,678 (61,163)
Budgeted Amounts
78

CITY OF WHITE PLAINS, NEW YORKGENERAL FUNDSCHEDULE OF REVENUES AND OTHER FINANCING SOURCES COMPARED TO BUDGET FOR THE FISCAL YEAR ENDED JUNE 30, 2013
Variance withOriginal Final Actual Final Budget
Budgeted Amounts
Licenses and Permits: City clerk's office 18,100 18,100 19,921 1,821 Planning department 2,000 2,000 4,125 2,125 Building department: Building permits 1,325,000 1,325,000 1,527,555 202,555 Other 972,700 972,700 1,064,878 92,178 Public works department: Street openings 100,000 100,000 193,574 93,574 Street obstructions 140,000 140,000 198,369 58,369 Other 245,250 245,250 260,868 15,618 Public safety department 919,845 919,845 908,916 (10,929) Recreation department 1,500 1,500 - (1,500) City franchise fees 718,233 718,233 729,899 11,666 Total Licenses and Permits 4,442,628 4,442,628 4,908,105 465,477
Fines and Forfeitures: Parking fines 7,666,000 7,666,000 7,152,587 (513,413) Forfeited deposits 200 200 2,400 2,200 Hazard alarm 200,000 200,000 137,125 (62,875) Fines and bail 990,000 990,000 939,594 (50,406) Total Fines and Forfeitures 8,856,200 8,856,200 8,231,706 (624,494)
Interest 153,000 153,000 88,575 (64,425)
Miscellaneous: Sale of property 158,750 158,750 98,364 (60,386) Insurance recoveries 80,100 80,100 135,706 55,606 Contributions 38,500 1,054,115 4,901,788 3,847,673 Tenant Emergency Protection Act fees 46,525 46,525 42,120 (4,405) Rentals and commissions 1,650,330 1,650,330 1,680,432 30,102 Other 774,931 774,931 1,318,708 543,777 Total Miscellaneous 2,749,136 3,764,751 8,177,118 4,412,367
Total Revenues 139,029,983 140,679,417 149,735,633 9,056,216
OTHER FINANCING SOURCES Transfers In- Capital Projects Fund - - 545 545
Total Revenues and Other Financing Sources 139,029,983 140,679,417 149,736,178 9,056,761
Appropriation of Fund Balance 8,865,357 8,865,357 - (8,865,357)
Total Revenues, Other Financing Sources and Appropriation of Fund Balance 147,895,340$ 149,544,774$ 149,736,178$ 191,404$
79

CITY OF WHITE PLAINS, NEW YORKGENERAL FUNDSCHEDULE OF EXPENDITURES AND OTHER FINANCING USES COMPARED TO BUDGETFOR THE FISCAL YEAR ENDED JUNE 30, 2013
Variance withOriginal Final Actual Final Budget
EXPENDITURESCurrent:
Council and Boards: Common Council: Personal services 221,326$ 220,765$ 220,063$ 702$ Employee benefits 119,582 124,322 122,697 1,625 Materials and supplies 41,400 41,400 41,027 373 Direct costs 800 800 - 800 Contingency 2,463,021 1,324,825 - 1,324,825
2,846,129 1,712,112 383,787 1,328,325 City Court: Employee benefits 2,500 2,500 2,160 340 Materials and supplies 16,125 16,125 13,954 2,171 Direct costs 7,110 7,110 4,147 2,963
25,735 25,735 20,261 5,474 Board of Assessment Review: Personal services 15,175 15,180 15,178 2 Employee benefits 1,992 2,016 2,016 - Materials and supplies 1,085 1,080 810 270 Direct costs 300 300 - 300
18,552 18,576 18,004 572 Zoning Board of Appeals: Personal services 61,109 61,109 61,109 - Employee benefits 37,267 37,992 37,670 322 Materials and supplies 1,130 1,130 613 517
99,506 100,231 99,392 839 Real Estate Committee: Materials and supplies 500 500 - 500 Direct costs 4,500 4,500 - 4,500
5,000 5,000 - 5,000 White Plains Board of Ethics- Direct costs 300 300 - 300
White Plains Housing Authority: Personal services 8,000 8,375 8,375 - Employee benefits 925 1,340 965 375
8,925 9,715 9,340 375
Total Council and Boards 3,004,147 1,871,669 530,784 1,340,885
General Government: Office of the Mayor: Personal services 495,908 476,141 471,070 5,071 Employee benefits 224,001 222,246 215,044 7,202 Materials and supplies 23,665 28,665 17,015 11,650 Direct costs 6,000 6,000 2,136 3,864
749,574 733,052 705,265 27,787 City Clerk: Personal services 363,281 365,308 363,917 1,391 Employee benefits 188,034 190,526 190,127 399 Materials and supplies 19,650 19,650 15,317 4,333 Direct costs 81,784 81,784 67,738 14,046 Equipment 425 425 - 425
653,174 657,693 637,099 20,594
Budgeted Amounts
80

CITY OF WHITE PLAINS, NEW YORKGENERAL FUNDSCHEDULE OF EXPENDITURES AND OTHER FINANCING USES COMPARED TO BUDGETFOR THE FISCAL YEAR ENDED JUNE 30, 2013
Variance withOriginal Final Actual Final Budget
Budgeted Amounts
Law Department: Personal services 1,172,695 1,100,416 1,081,262 19,154 Employee benefits 445,795 426,810 413,409 13,401 Materials and supplies 63,300 63,650 45,735 17,915 Direct costs 690,979 788,629 544,063 244,566
2,372,769 2,379,505 2,084,469 295,036 Assessor: Personal services 428,196 428,197 428,197 - Employee benefits 195,905 201,204 198,331 2,873 Materials and supplies 31,085 31,085 12,834 18,251 Direct costs 4,900 4,900 2,570 2,330 Equipment 2,400 2,400 1,750 650
662,486 667,786 643,682 24,104 Finance Department: Personal services 1,237,869 1,192,539 1,183,876 8,663 Employee benefits 8,984,662 9,052,906 8,576,673 476,233 Materials and supplies 52,425 52,425 44,439 7,986 Direct costs 7,954,525 8,051,525 7,844,893 206,632 Equipment 6,400 9,400 5,162 4,238
18,235,881 18,358,795 17,655,043 703,752 Budget Department: Personal services 250,414 301,167 298,773 2,394 Employee benefits 60,776 65,389 64,713 676 Materials and supplies 13,725 9,225 7,301 1,924 Direct costs 550 550 550 - Equipment 800 800 598 202
326,265 377,131 371,935 5,196 Information Services: Personal services 709,095 688,212 682,068 6,144 Employee benefits 308,088 291,202 287,211 3,991 Materials and supplies 450,163 450,163 230,586 219,577 Direct costs 197,088 197,088 166,720 30,368 Equipment 65,562 65,562 31,429 34,133
1,729,996 1,692,227 1,398,014 294,213 Purchasing Department: Personal services 393,835 395,439 394,925 514 Employee benefits 189,536 195,269 192,782 2,487 Materials and supplies 6,550 6,550 5,598 952
589,921 597,258 593,305 3,953 Planning Department: Personal services 640,826 625,465 579,491 45,974 Employee benefits 264,745 236,445 234,274 2,171 Materials and supplies 11,750 14,562 14,548 14 Direct costs 97,500 92,500 81,568 10,932 Equipment 783 3,371 3,371 -
1,015,604 972,343 913,252 59,091
Continued
81
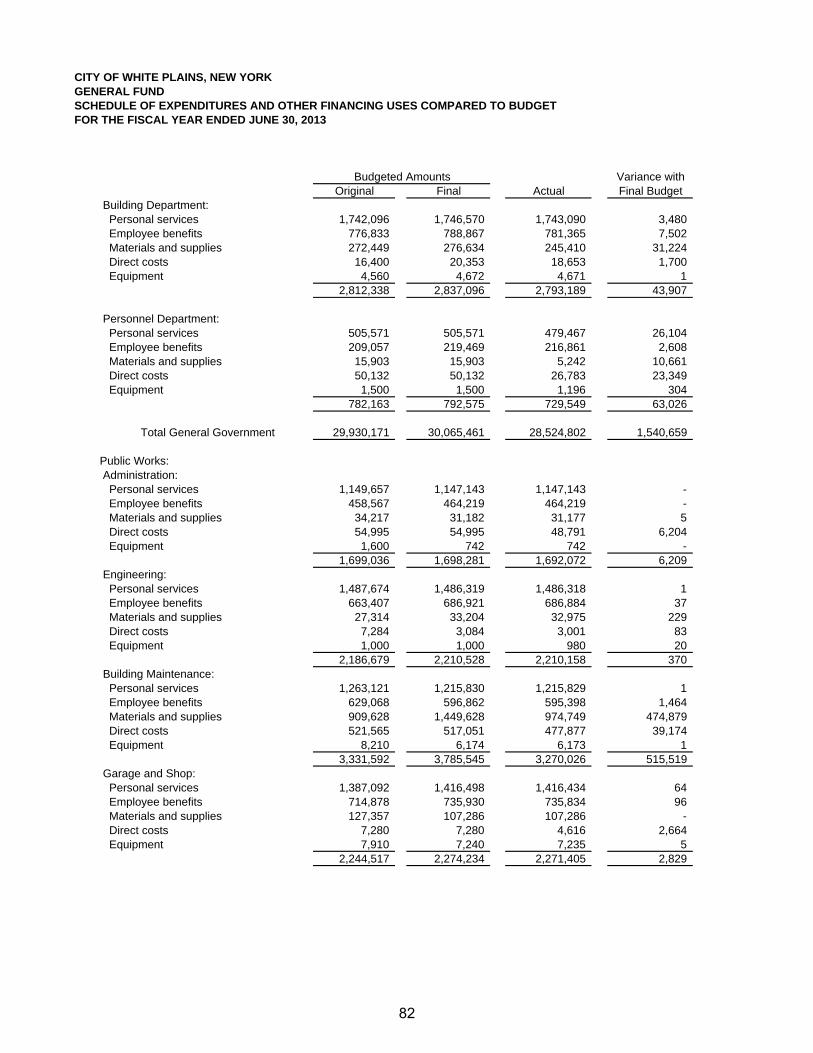
CITY OF WHITE PLAINS, NEW YORKGENERAL FUNDSCHEDULE OF EXPENDITURES AND OTHER FINANCING USES COMPARED TO BUDGETFOR THE FISCAL YEAR ENDED JUNE 30, 2013
Variance withOriginal Final Actual Final Budget
Budgeted Amounts
Building Department: Personal services 1,742,096 1,746,570 1,743,090 3,480 Employee benefits 776,833 788,867 781,365 7,502 Materials and supplies 272,449 276,634 245,410 31,224 Direct costs 16,400 20,353 18,653 1,700 Equipment 4,560 4,672 4,671 1
2,812,338 2,837,096 2,793,189 43,907
Personnel Department: Personal services 505,571 505,571 479,467 26,104 Employee benefits 209,057 219,469 216,861 2,608 Materials and supplies 15,903 15,903 5,242 10,661 Direct costs 50,132 50,132 26,783 23,349 Equipment 1,500 1,500 1,196 304
782,163 792,575 729,549 63,026
Total General Government 29,930,171 30,065,461 28,524,802 1,540,659
Public Works: Administration: Personal services 1,149,657 1,147,143 1,147,143 - Employee benefits 458,567 464,219 464,219 - Materials and supplies 34,217 31,182 31,177 5 Direct costs 54,995 54,995 48,791 6,204 Equipment 1,600 742 742 -
1,699,036 1,698,281 1,692,072 6,209 Engineering: Personal services 1,487,674 1,486,319 1,486,318 1 Employee benefits 663,407 686,921 686,884 37 Materials and supplies 27,314 33,204 32,975 229 Direct costs 7,284 3,084 3,001 83 Equipment 1,000 1,000 980 20
2,186,679 2,210,528 2,210,158 370 Building Maintenance: Personal services 1,263,121 1,215,830 1,215,829 1 Employee benefits 629,068 596,862 595,398 1,464 Materials and supplies 909,628 1,449,628 974,749 474,879 Direct costs 521,565 517,051 477,877 39,174 Equipment 8,210 6,174 6,173 1
3,331,592 3,785,545 3,270,026 515,519 Garage and Shop: Personal services 1,387,092 1,416,498 1,416,434 64 Employee benefits 714,878 735,930 735,834 96 Materials and supplies 127,357 107,286 107,286 - Direct costs 7,280 7,280 4,616 2,664 Equipment 7,910 7,240 7,235 5
2,244,517 2,274,234 2,271,405 2,829
82

CITY OF WHITE PLAINS, NEW YORKGENERAL FUNDSCHEDULE OF EXPENDITURES AND OTHER FINANCING USES COMPARED TO BUDGETFOR THE FISCAL YEAR ENDED JUNE 30, 2013
Variance withOriginal Final Actual Final Budget
Budgeted Amounts
Public Works-Continued: Storm Water: Personal services 103,495 70,488 70,487 1 Employee benefits 56,609 42,853 42,552 301 Materials and supplies 20,915 15,915 8,156 7,759 Direct costs 77,700 76,700 23,941 52,759
258,719 205,956 145,136 60,820 Highway and Bridges: Personal services 3,687,903 3,833,310 3,832,893 417 Employee benefits 1,862,708 1,927,037 1,922,281 4,756 Materials and supplies 3,309,700 3,155,844 3,031,518 124,326 Direct costs 251,238 505,241 505,241 - Equipment 2,248 3,048 3,006 42
9,113,797 9,424,480 9,294,939 129,541 Parks Maintenance: Personal services 939,889 949,509 949,506 3 Employee benefits 443,458 479,870 479,718 152 Materials and supplies 404,520 425,654 422,628 3,026 Direct costs 76,105 80,588 79,292 1,296 Equipment 6,242 7,822 7,821 1 1,870,214 1,943,443 1,938,965 4,478 Sanitation: Personal services 4,129,971 4,138,492 4,137,227 1,265 Employee benefits 2,324,543 2,287,382 2,280,851 6,531 Materials and supplies 319,397 331,626 302,936 28,690 Direct costs 887,320 816,302 812,783 3,519 Equipment 99,416 99,416 99,370 46 7,760,647 7,673,218 7,633,167 40,051
Total Public Works 28,465,201 29,215,685 28,455,868 759,817
Parking: General Operations: Personal services 2,279,709 2,388,479 2,359,273 29,206 Employee benefits 1,148,621 1,189,384 1,185,207 4,177 Materials and supplies 524,919 523,119 458,020 65,099 Direct costs 286,198 333,555 333,548 7 Equipment 29,700 31,750 19,049 12,701
4,269,147 4,466,287 4,355,097 111,190 Garages: Personal services 938,564 914,742 891,735 23,007 Employee benefits 490,734 474,275 474,273 2 Materials and supplies 765,623 765,623 660,135 105,488 Direct costs 326,501 316,207 261,237 54,970
2,521,422 2,470,847 2,287,380 183,467 Parking Lots: Materials and supplies 220,000 220,000 207,406 12,594 Direct costs 27,640 27,640 24,506 3,134
247,640 247,640 231,912 15,728
Continued
83
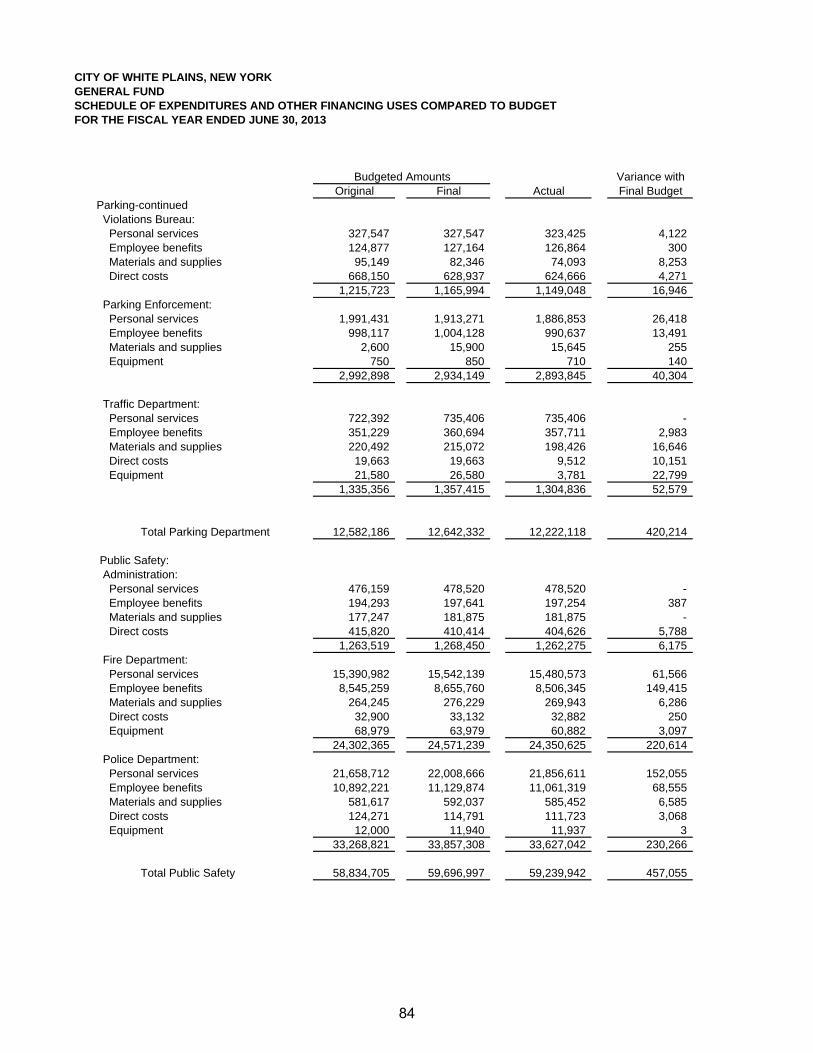
CITY OF WHITE PLAINS, NEW YORKGENERAL FUNDSCHEDULE OF EXPENDITURES AND OTHER FINANCING USES COMPARED TO BUDGETFOR THE FISCAL YEAR ENDED JUNE 30, 2013
Variance withOriginal Final Actual Final Budget
Budgeted Amounts
Parking-continued Violations Bureau: Personal services 327,547 327,547 323,425 4,122 Employee benefits 124,877 127,164 126,864 300 Materials and supplies 95,149 82,346 74,093 8,253 Direct costs 668,150 628,937 624,666 4,271
1,215,723 1,165,994 1,149,048 16,946 Parking Enforcement: Personal services 1,991,431 1,913,271 1,886,853 26,418 Employee benefits 998,117 1,004,128 990,637 13,491 Materials and supplies 2,600 15,900 15,645 255 Equipment 750 850 710 140
2,992,898 2,934,149 2,893,845 40,304
Traffic Department: Personal services 722,392 735,406 735,406 - Employee benefits 351,229 360,694 357,711 2,983 Materials and supplies 220,492 215,072 198,426 16,646 Direct costs 19,663 19,663 9,512 10,151 Equipment 21,580 26,580 3,781 22,799
1,335,356 1,357,415 1,304,836 52,579
Total Parking Department 12,582,186 12,642,332 12,222,118 420,214
Public Safety: Administration: Personal services 476,159 478,520 478,520 - Employee benefits 194,293 197,641 197,254 387 Materials and supplies 177,247 181,875 181,875 - Direct costs 415,820 410,414 404,626 5,788
1,263,519 1,268,450 1,262,275 6,175 Fire Department: Personal services 15,390,982 15,542,139 15,480,573 61,566 Employee benefits 8,545,259 8,655,760 8,506,345 149,415 Materials and supplies 264,245 276,229 269,943 6,286 Direct costs 32,900 33,132 32,882 250 Equipment 68,979 63,979 60,882 3,097
24,302,365 24,571,239 24,350,625 220,614 Police Department: Personal services 21,658,712 22,008,666 21,856,611 152,055 Employee benefits 10,892,221 11,129,874 11,061,319 68,555 Materials and supplies 581,617 592,037 585,452 6,585 Direct costs 124,271 114,791 111,723 3,068 Equipment 12,000 11,940 11,937 3
33,268,821 33,857,308 33,627,042 230,266
Total Public Safety 58,834,705 59,696,997 59,239,942 457,055
84

CITY OF WHITE PLAINS, NEW YORKGENERAL FUNDSCHEDULE OF EXPENDITURES AND OTHER FINANCING USES COMPARED TO BUDGETFOR THE FISCAL YEAR ENDED JUNE 30, 2013
Variance withOriginal Final Actual Final Budget
Budgeted Amounts
Community Services: Recreation and Parks:
Personal services 1,942,526 1,931,698 1,822,705 108,993 Employee benefits 578,928 576,246 564,990 11,256 Materials and supplies 697,438 697,305 630,376 66,929 Direct costs 410,687 417,861 394,000 23,861 Equipment 8,862 13,937 9,421 4,516
3,638,441 3,637,047 3,421,492 215,555
T.H. Slater Center: Materials and supplies 73,026 73,026 53,131 19,895 Direct costs 228,488 228,488 223,777 4,711
301,514 301,514 276,908 24,606 Youth Services: Personal services 1,883,457 1,891,680 1,791,184 100,496 Employee benefits 619,680 609,326 597,563 11,763 Materials and supplies 74,684 77,909 73,189 4,720 Direct costs 66,182 65,182 54,659 10,523
2,644,003 2,644,097 2,516,595 127,502
Total Community Services 6,583,958 6,582,658 6,214,995 367,663
Total Expenditures 139,400,368 140,074,802 135,188,509 4,886,293
OTHER FINANCING USES:Transfers out:
Capital Projects Fund 438,000 438,000 438,000 - Debt Service Fund 8,055,357 9,030,357 9,030,357 - Housing Authority Enhancement Fund 1,615 1,615 1,615 - Total Other Financing Uses 8,494,972 9,469,972 9,469,972 -
Total Expenditures and Other Financing Uses 147,895,340$ 149,544,774$ 144,658,481$ 4,886,293$
85
Community Development Block Grant Fund - to account for Federal CommunityDevelopment Block Grant (CDBG) funds used to provide programs and activities that willbenefit low and moderate income families through the prevention or elimination of slumsand blight.
Section 8 Housing Assistance Program Fund - to account for Federal grants used tosubsidize rental housing for low and moderate income senior citizens and other familiesresiding within the City.
Public Safety Grant Fund - to account for grant monies received from Federal, State andlocal governments for the enhancement of public safety activities.
NONMAJOR GOVERNMENTAL FUNDS
Special Revenue Funds
Special revenue funds are used to account for and report the proceeds of specific revenuesources that are restricted or committed to expenditures for specified purposes other than debtservice or capital projects.
Library Fund - to account for property taxes and other resources used to support theoperation and maintenance of the City library. Section 259(1) of the New York StateEducation Law requires that monies received from taxes and other public sources for thesupport of a public library shall be kept as a separate library fund.
Police Activities Fund - to account for Federal forfeiture proceeds to be used to supportcommunity policing activities, training and law enforcement operations.
Youth Development Fund - to account for grant monies received from Federal, State andlocal governments and private contributions for youth development programs designed tobuild skills and competencies among the City’s youth.
City Center Garage Fund - to account for parking revenues that are restricted for operatingand maintenance costs associated with the City Center Garage.
War Memorial Fund - to account for monies specifically identified by the donors to be usedfor a memorial to those who have perished in wars.
Community Services Fund - to account for monies specifically identified by the donors to beused to send underprivileged and economically disadvantaged children to day camp.
Recreation Parkland Fund - to account for monies specifically identified by the donors to beused in acquiring and/or developing recreational facilities and open space in the City.
RESTORE Grant Fund - to account for a New York State grant that provides assistance tolow income senior citizens for housing repairs.
86

The Debt Service Fund is used to account for and report financial resources that are restricted,committed or assigned to expenditure for principal and interest and for financial resources thatare being accumulated for principal and interest maturing in future years.
Permanent Fund
The Goldie Zeitlin Memorial Permanent Fund is used to account for and report resources thatare restricted to the extent that only earnings, and not principal (an endowment of $10,000), maybe used for purposes that support the City’s programs (for the benefit of the City and its citizens)related to urban concerns.
Mayor’s Youth Council Fund - to account for monies specifically identified by the donors tobenefit the youth of the City.
Housing Authority Enhancement Fund - to account for monies specifically identified by thedonors to be used to enhance public housing occupancy.
Parking Fund - to account for fees received in lieu of providing required off-street parking inthe central parking area, which are used to increase the quantity/quality of parking spacesavailable to serve properties in that area.
Debt Service Fund
87
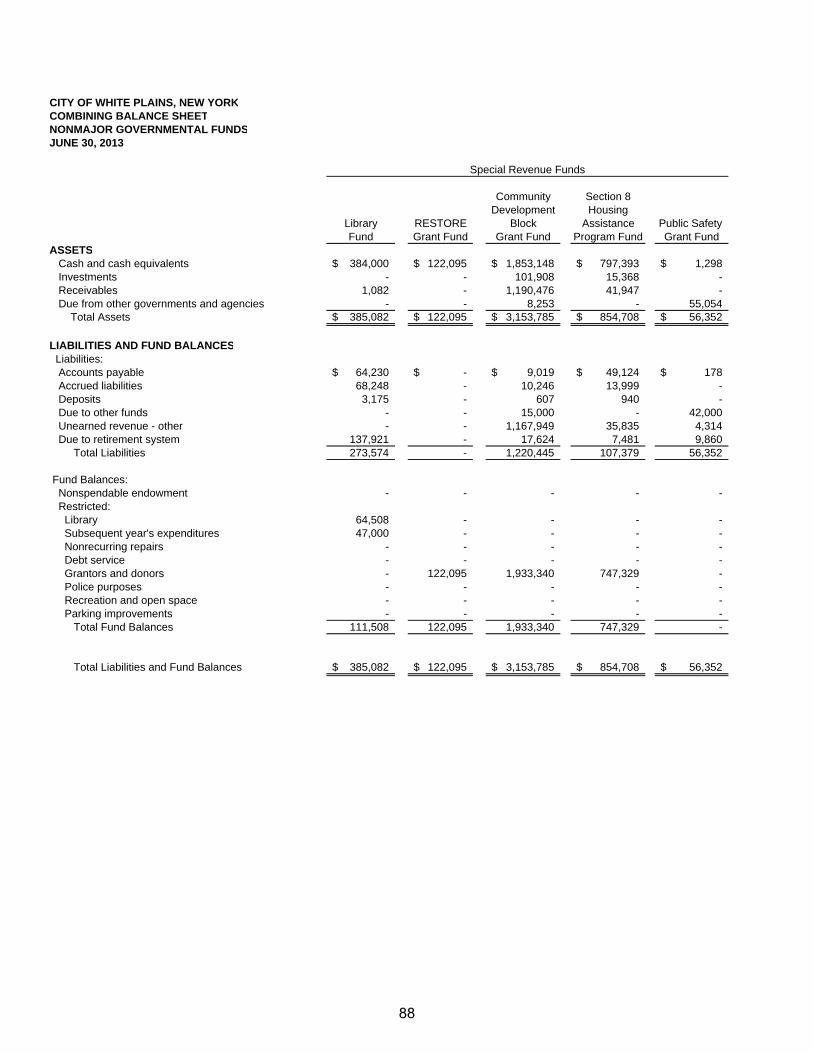
CITY OF WHITE PLAINS, NEW YORKCOMBINING BALANCE SHEETNONMAJOR GOVERNMENTAL FUNDSJUNE 30, 2013
Community Section 8Development Housing
Library RESTORE Block Assistance Public Safety Fund Grant Fund Grant Fund Program Fund Grant Fund
ASSETS Cash and cash equivalents 384,000$ 122,095$ 1,853,148$ 797,393$ 1,298$ Investments - - 101,908 15,368 - Receivables 1,082 - 1,190,476 41,947 - Due from other governments and agencies - - 8,253 - 55,054 Total Assets 385,082$ 122,095$ 3,153,785$ 854,708$ 56,352$
LIABILITIES AND FUND BALANCES Liabilities: Accounts payable 64,230$ -$ 9,019$ 49,124$ 178$ Accrued liabilities 68,248 - 10,246 13,999 - Deposits 3,175 - 607 940 - Due to other funds - - 15,000 - 42,000 Unearned revenue - other - - 1,167,949 35,835 4,314 Due to retirement system 137,921 - 17,624 7,481 9,860 Total Liabilities 273,574 - 1,220,445 107,379 56,352
Fund Balances: Nonspendable endowment - - - - - Restricted: Library 64,508 - - - - Subsequent year's expenditures 47,000 - - - - Nonrecurring repairs - - - - - Debt service - - - - - Grantors and donors - 122,095 1,933,340 747,329 - Police purposes - - - - - Recreation and open space - - - - - Parking improvements - - - - - Total Fund Balances 111,508 122,095 1,933,340 747,329 -
Total Liabilities and Fund Balances 385,082$ 122,095$ 3,153,785$ 854,708$ 56,352$
Special Revenue Funds
88

Mayor'sYouth War Recreation Police Youth
Development City Center Memorial Community Parkland Activities CouncilFund Garage Fund Fund Services Fund Fund Fund Fund
101,084$ 609,694$ 45,287$ 37,569$ 322,826$ 322,792$ 1,404$
- 712,781 - - - - - 2,108 34,200 - - - - -
453,866 - - - - - - 557,058$ 1,356,675$ 45,287$ 37,569$ 322,826$ 322,792$ 1,404$
97,751$ 171,358$ -$ -$ -$ 4,122$ -$ 68,915 240,591 - - - - -
- - - - - - - 334,453 - - - - - -
25,800 284,955 - - - - - 30,139 32,949 - - - - -
557,058 729,853 - - - 4,122 -
- - - - - - -
- - - - - - - - - - - - - - - 626,822 - - - - - - - - - - - - - - 45,287 37,569 - - 1,404- - - - - 318,670 - - - - - 322,826 - - - - - - - - - - 626,822 45,287 37,569 322,826 318,670 1,404
557,058$ 1,356,675$ 45,287$ 37,569$ 322,826$ 322,792$ 1,404$
Continued
Special Revenue Funds
89
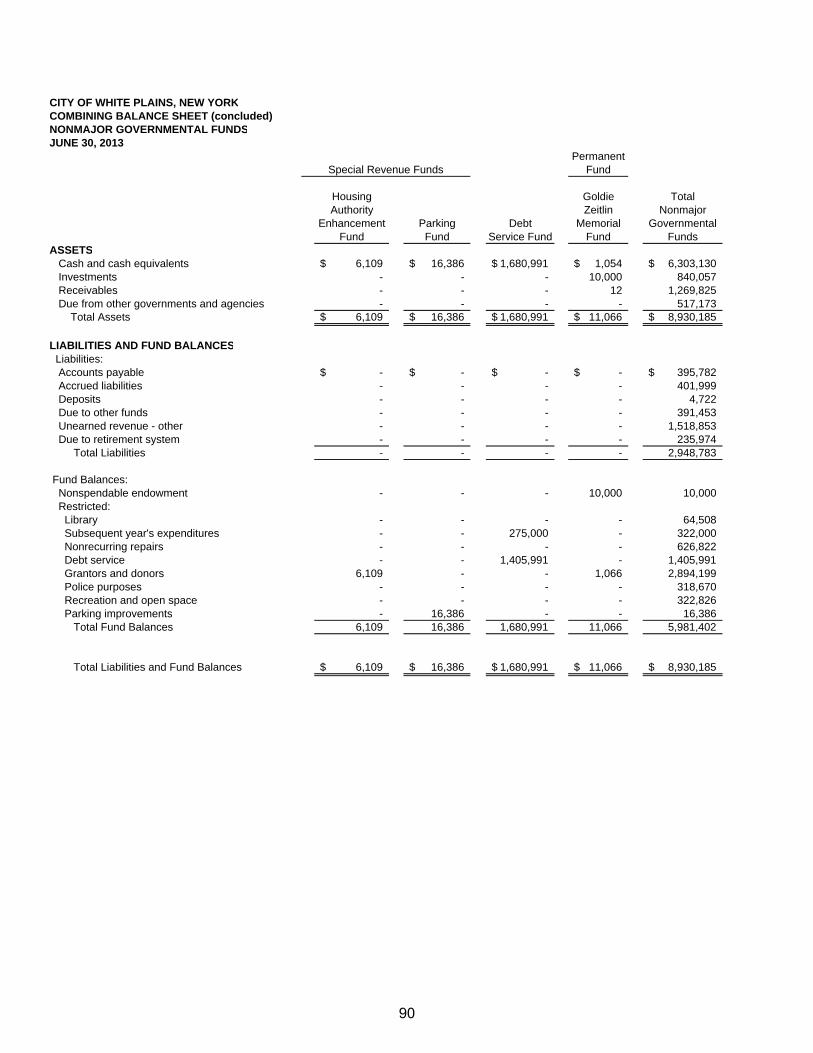
CITY OF WHITE PLAINS, NEW YORKCOMBINING BALANCE SHEET (concluded)NONMAJOR GOVERNMENTAL FUNDSJUNE 30, 2013
PermanentFund
Housing Goldie TotalAuthority Zeitlin Nonmajor
Enhancement Parking Debt Memorial GovernmentalFund Fund Service Fund Fund Funds
ASSETS Cash and cash equivalents 6,109$ 16,386$ 1,680,991$ 1,054$ 6,303,130$ Investments - - - 10,000 840,057 Receivables - - - 12 1,269,825 Due from other governments and agencies - - - - 517,173 Total Assets 6,109$ 16,386$ 1,680,991$ 11,066$ 8,930,185$
LIABILITIES AND FUND BALANCES Liabilities: Accounts payable -$ -$ -$ -$ 395,782$ Accrued liabilities - - - - 401,999 Deposits - - - - 4,722 Due to other funds - - - - 391,453 Unearned revenue - other - - - - 1,518,853 Due to retirement system - - - - 235,974 Total Liabilities - - - - 2,948,783
Fund Balances: Nonspendable endowment - - - 10,000 10,000 Restricted: Library - - - - 64,508 Subsequent year's expenditures - - 275,000 - 322,000 Nonrecurring repairs - - - - 626,822 Debt service - - 1,405,991 - 1,405,991 Grantors and donors 6,109 - - 1,066 2,894,199 Police purposes - - - - 318,670 Recreation and open space - - - - 322,826 Parking improvements - 16,386 - - 16,386 Total Fund Balances 6,109 16,386 1,680,991 11,066 5,981,402
Total Liabilities and Fund Balances 6,109$ 16,386$ 1,680,991$ 11,066$ 8,930,185$
Special Revenue Funds
90

THIS PAGE INTENTIONALLY LEFT BLANK
91

CITY OF WHITE PLAINS, NEW YORKCOMBINING STATEMENT OF REVENUES, EXPENDITURES, AND CHANGES IN FUND BALANCESNONMAJOR GOVERNMENTAL FUNDSFOR THE FISCAL YEAR ENDED JUNE 30, 2013
Community Section 8Development Housing
Library RESTORE Block Assistance Public Safety Fund Grant Fund Grant Fund Program Fund Grant Fund
Revenues: Property taxes 5,625,535$ -$ -$ -$ -$ Intergovernmental 30,501 25,000 930,645 4,680,608 689,744 Interest - - 8 840 - Fees and program income 88,593 25,910 650,130 - - Miscellaneous 55,984 - - 123,110 1,922 Total Revenues 5,800,613 50,910 1,580,783 4,804,558 691,666
Expenditures: Current: Public safety - - - - 691,666 Community services 5,423,083 5,800 1,451,195 4,827,703 - Debt service: Principal - - - - - Interest - - - - - Total Expenditures 5,423,083 5,800 1,451,195 4,827,703 691,666
Excess (Deficiency) of Revenues Over Expenditures 377,530 45,110 129,588 (23,145) -
Other Financing Sources (Uses): Transfers in - - - - - Transfers out (355,535) - - - - Total Other Financing Sources (Uses) (355,535) - - - -
Net Change in Fund Balances 21,995 45,110 129,588 (23,145) -
Fund Balances - Beginning of Year 89,513 76,985 1,803,752 770,474 -
Fund Balances - End of Year 111,508$ 122,095$ 1,933,340$ 747,329$ -$
Special Revenue Funds
92
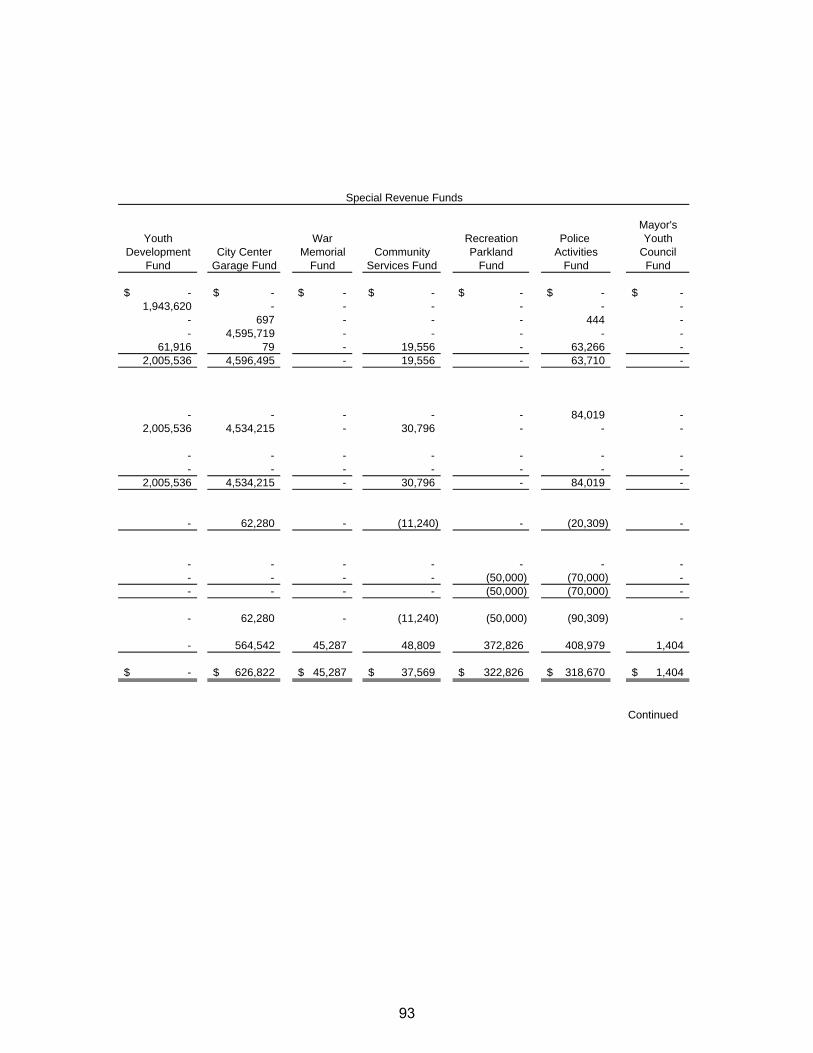
Mayor'sYouth War Recreation Police Youth
Development City Center Memorial Community Parkland Activities CouncilFund Garage Fund Fund Services Fund Fund Fund Fund
-$ -$ -$ -$ -$ -$ -$ 1,943,620 - - - - - -
- 697 - - - 444 - - 4,595,719 - - - - -
61,916 79 - 19,556 - 63,266 - 2,005,536 4,596,495 - 19,556 - 63,710 -
- - - - - 84,019 -
2,005,536 4,534,215 - 30,796 - - -
- - - - - - - - - - - - - -
2,005,536 4,534,215 - 30,796 - 84,019 -
- 62,280 - (11,240) - (20,309) -
- - - - - - - - - - - (50,000) (70,000) - - - - - (50,000) (70,000) -
- 62,280 - (11,240) (50,000) (90,309) -
- 564,542 45,287 48,809 372,826 408,979 1,404
-$ 626,822$ 45,287$ 37,569$ 322,826$ 318,670$ 1,404$
Continued
Special Revenue Funds
93

CITY OF WHITE PLAINS, NEW YORKCOMBINING STATEMENT OF REVENUES, EXPENDITURES, AND CHANGES IN FUND BALANCES (Concluded)NONMAJOR GOVERNMENTAL FUNDSFOR THE FISCAL YEAR ENDED JUNE 30, 2013
PermanentFund
Housing Goldie TotalAuthority Zeitlin Nonmajor
Enhancement Parking Debt Memorial GovernmentalFund Fund Service Fund Fund Funds
Revenues: Property taxes -$ -$ -$ -$ 5,625,535$ Intergovernmental - - - - 8,300,118 Interest - - 684 41 2,714 Fees and program income - - - - 5,360,352 Miscellaneous - - 17,228 - 343,061 Total Revenues - - 17,912 41 19,631,780
Expenditures: Current: Public safety - - - - 775,685 Community services 2,000 - - - 18,280,328 Debt service: Principal - - 5,164,308 - 5,164,308 Interest - - 3,408,724 - 3,408,724 Total Expenditures 2,000 - 8,573,032 - 27,629,045
Excess (Deficiency) of Revenues Over Expenditures (2,000) - (8,555,120) 41 (7,997,265)
Other Financing Sources (Uses): Transfers in 1,615 - 9,528,286 - 9,529,901 Transfers out - - - - (475,535) Total Other Financing Sources 1,615 - 9,528,286 - 9,054,366
Net Change in Fund Balances (385) - 973,166 41 1,057,101
Fund Balances - Beginning of Year 6,494 16,386 707,825 11,025 4,924,301
Fund Balances - End of Year 6,109$ 16,386$ 1,680,991$ 11,066$ 5,981,402$
Special Revenue Funds
94

CITY OF WHITE PLAINS, NEW YORKLIBRARY FUNDSCHEDULE OF REVENUES, EXPENDITURES AND CHANGES IN FUND BALANCE - BUDGET AND ACTUALFOR THE FISCAL YEAR ENDED JUNE 30, 2013
Variance withOriginal Final Actual Final Budget
Revenues: Property taxes 5,701,249$ 5,740,121$ 5,625,535$ (114,586)$ Intergovernmental 14,824 14,824 30,501 15,677 Fees and program income 105,003 105,003 88,593 (16,410) Miscellaneous: Rent and commissions 19,500 19,500 14,132 (5,368) Other 19,750 19,750 41,852 22,102 Total Revenues 5,860,326 5,899,198 5,800,613 (98,585) Appropriation of Fund Balance 30,000 30,000 - (30,000)
Total Revenues and Appropriation of Fund Balance 5,890,326 5,929,198 5,800,613 (128,585)
Expenditures: Current-Community Services: Personal services 2,800,766 2,796,024 2,760,361 35,663 Employee benefits 1,488,481 1,495,901 1,495,901 - Materials and supplies 885,389 885,389 803,791 81,598 Direct costs 360,155 385,155 363,030 22,125 Total Expenditures 5,534,791 5,562,469 5,423,083 139,386
Excess of Revenues and Appropriation of Fund Balance Over Expenditures 355,535 366,729 377,530 10,801
Other Financing Uses- Transfers out (355,535) (366,729) (355,535) 11,194
Net Change in Fund Balance -$ -$ 21,995 21,995$
Fund Balance - Beginning of Year 89,513
Fund Balance - End of Year 111,508$
Budgeted Amounts
95
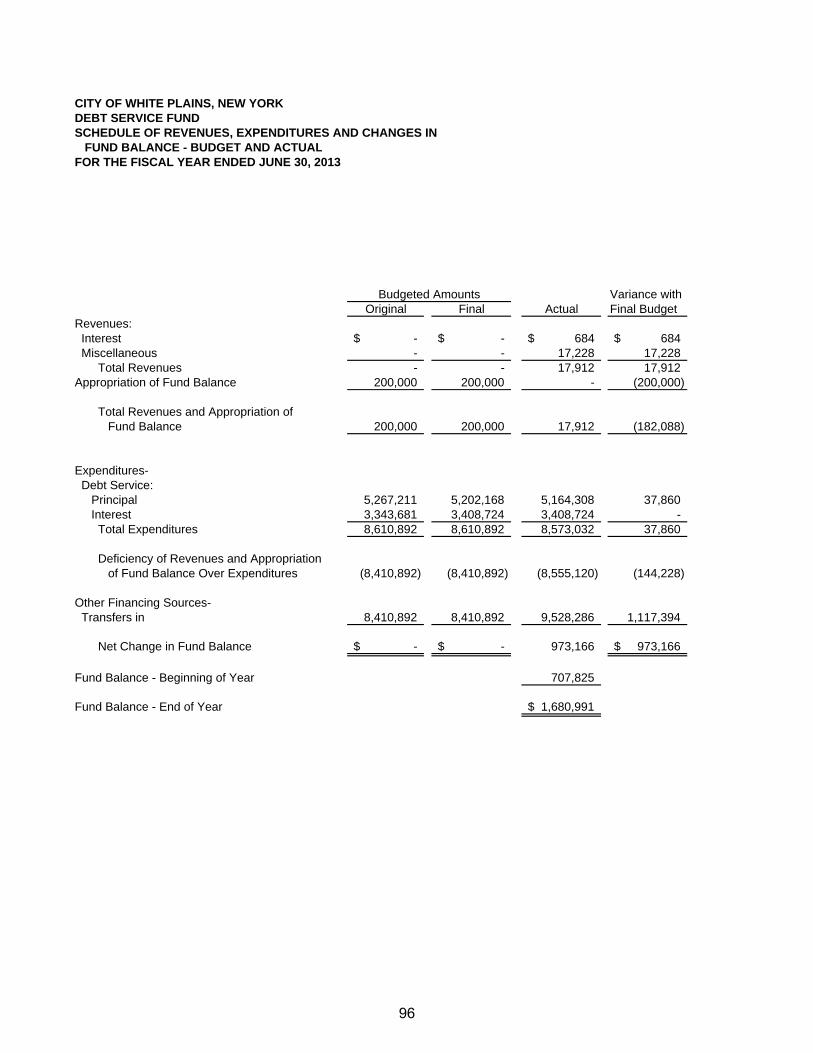
CITY OF WHITE PLAINS, NEW YORKDEBT SERVICE FUNDSCHEDULE OF REVENUES, EXPENDITURES AND CHANGES IN FUND BALANCE - BUDGET AND ACTUALFOR THE FISCAL YEAR ENDED JUNE 30, 2013
Variance withOriginal Final Actual Final Budget
Revenues: Interest -$ -$ 684$ 684$ Miscellaneous - - 17,228 17,228 Total Revenues - - 17,912 17,912Appropriation of Fund Balance 200,000 200,000 - (200,000)
Total Revenues and Appropriation of Fund Balance 200,000 200,000 17,912 (182,088)
Expenditures- Debt Service: Principal 5,267,211 5,202,168 5,164,308 37,860 Interest 3,343,681 3,408,724 3,408,724 - Total Expenditures 8,610,892 8,610,892 8,573,032 37,860
Deficiency of Revenues and Appropriation of Fund Balance Over Expenditures (8,410,892) (8,410,892) (8,555,120) (144,228)
Other Financing Sources- Transfers in 8,410,892 8,410,892 9,528,286 1,117,394
Net Change in Fund Balance -$ -$ 973,166 973,166$
Fund Balance - Beginning of Year 707,825
Fund Balance - End of Year 1,680,991$
Budgeted Amounts
96

THIS PAGE INTENTIONALLY LEFT BLANK
97

CITY OF WHITE PLAINS, NEW YORKCAPITAL PROJECTS FUNDPROJECT- LENGTH SCHEDULEINCEPTION OF PROJECT THROUGH JUNE 30, 2013
Project Year Project Prior Current TotalNumber Description Authorized Budget Years Year ExpendituresActive Capital Projects
546 Old Mamaroneck Road Signalization 98-99 45,000$ 13,779$ -$ 13,779$ 5149 Interoperable Coordinated Signal System 00-01 690,000 665,190 - 665,1905273 City-wide Telephone Upgrade 06-07 404,000 71,879 245,202 317,0815324 Gedney Way Landfill Capping 09-10 12,154,250 539,690 8,183,929 8,723,6195337 Fiber Optic as Built Survey 09-10 45,000 22,995 5,372 28,367 5344 Lexington/Grove Structural Rehabilitation 10-11 606,000 101,986 477,664 579,650 5345 Parking Structure Rehabilitation FY11 10-11 505,000 317,935 31,932 349,867 5346 Chester/Maple Garage Rehabilitation FY11 10-11 757,500 85,269 3,068 88,337 5347 City Hall Rehabilitation-Electrical 10-11 151,500 - - - 5351 Gardella/Kittrell Pools Study 10-11 202,000 21,737 103,930 125,667 5355 Miscellaneous Street Reconstruction FY 11 10-11 3,022,250 542,110 969,493 1,511,603 5356 City Hall Roof 10-11 292,900 23,285 183,611 206,896 5358 Library Service Desk Self-Check 10-11 252,000 - - - 5359 Comprehensive Plan Update Phase I 10-11 363,600 270,756 64,360 335,116 5360 Maple Avenue Storm Water Drain 11-12 454,500 - - - 5366 Public Safety Building Leak Correction 11-12 505,000 34,940 440,410 475,350 5367 Miscellaneous Storm Water Drains FY12 11-12 505,000 63,149 69,229 132,378 5368 Gardella Pool Pump House 11-12 75,000 5,155 3,377 8,532 5369 Renovations to Fire Facilities FY 12 11-12 217,000 - 126,944 126,944 5373 Mobile Data Terminals-Fire Department 11-12 128,646 - 114,185 114,185 5375 Gillie Park Improvements 11-12 70,700 - - - 5376 Lyon Place Garage 11-12 17,520,000 106,763 2,276,935 2,383,698 5378 Municipal Parking Structure Rehabilitation FY 12 11-12 404,000 - - - 5379 Miscellaneous Street Reconstruction FY 12 11-12 450,000 - - - 5380 Rolling Stock Acquisition-Light Duty Vehicles FY 13 12-13 531,594 - 465,816 465,816 5383 Library Plaza Surface Replacement 12-13 101,000 - 2,872 2,872 5385 Rolling Stock Acquisition-Heavy Duty Vehicles FY 13 12-13 616,000 - 323,297 323,297 5390 City-wide IT Infrastructure 12-13 126,250 - 504 504 5391 Ridgeway Nature Trails 12-13 50,000 - 41,550 41,550 5393 Firearms Training Simulator 12-13 70,000 - 6,647 6,647 5394 Miscellaneous Street Reconstruction FY 13 12-13 750,000 - - - 5395 Library Interior Renovations First Floor, Phase I 12-13 1,616,000 - 500 500
Sub-total active projects 43,681,690 2,886,618 14,140,827 17,027,445
Expenditures and Transfers
98
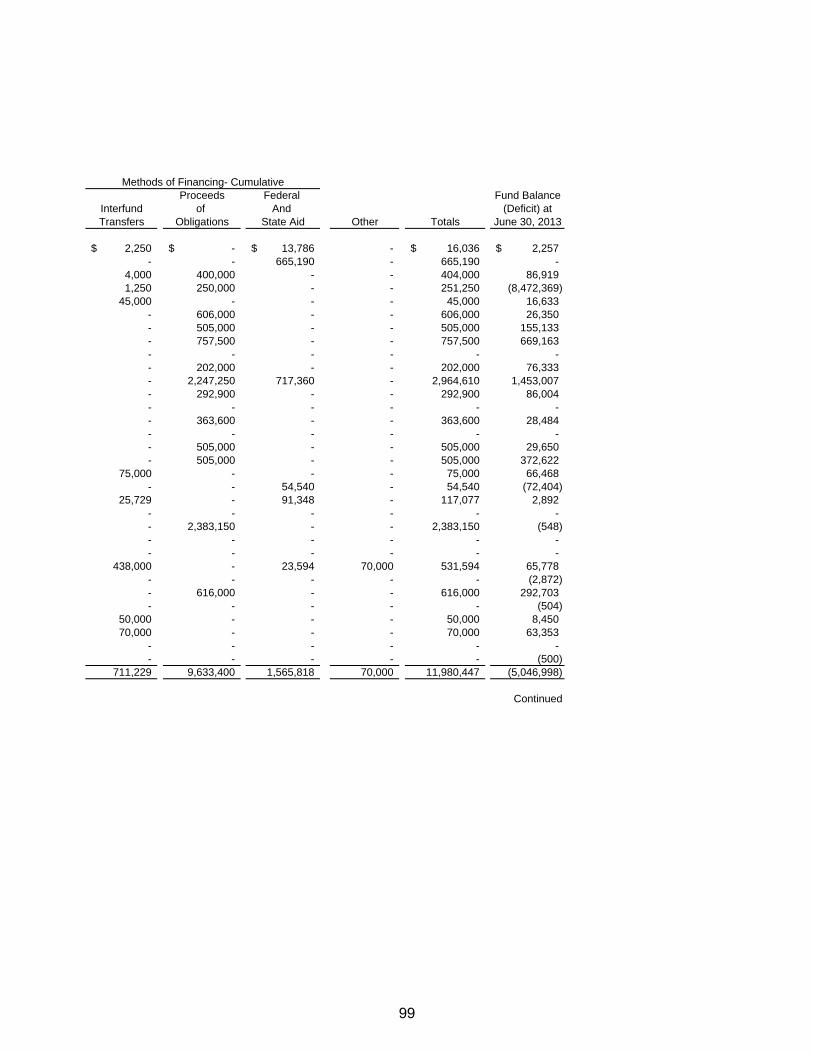
Proceeds Federal Fund BalanceInterfund of And (Deficit) atTransfers Obligations State Aid Other Totals June 30, 2013
2,250$ -$ 13,786$ - 16,036$ 2,257$ - - 665,190 - 665,190 -
4,000 400,000 - - 404,000 86,9191,250 250,000 - - 251,250 (8,472,369)
45,000 - - - 45,000 16,633- 606,000 - - 606,000 26,350 - 505,000 - - 505,000 155,133 - 757,500 - - 757,500 669,163 - - - - - - - 202,000 - - 202,000 76,333 - 2,247,250 717,360 - 2,964,610 1,453,007 - 292,900 - - 292,900 86,004 - - - - - - - 363,600 - - 363,600 28,484 - - - - - - - 505,000 - - 505,000 29,650 - 505,000 - - 505,000 372,622
75,000 - - - 75,000 66,468- - 54,540 - 54,540 (72,404)
25,729 - 91,348 - 117,077 2,892- - - - - - - 2,383,150 - - 2,383,150 (548)- - - - - - - - - - - -
438,000 - 23,594 70,000 531,594 65,778- - - - - (2,872)- 616,000 - - 616,000 292,703- - - - - (504)
50,000 - - - 50,000 8,45070,000 - - - 70,000 63,353
- - - - - - - - - - - (500)
711,229 9,633,400 1,565,818 70,000 11,980,447 (5,046,998)
Continued
Methods of Financing- Cumulative
99

CITY OF WHITE PLAINS, NEW YORKCAPITAL PROJECTS FUNDPROJECT- LENGTH SCHEDULE (Concluded)INCEPTION OF PROJECT THROUGH JUNE 30, 2013
Project Year Project Prior Current TotalNumber Description Authorized Budget Years Year ExpendituresCompleted Capital Projects as of June 30, 2013
5215 140 So. Kensico Ave. Rehabilitation 03-04 805,250$ 703,412$ 101,838$ 805,250$ 5265 Public Library Roof Replacement Phase I 05-06 1,056,000 610,763 445,237 1,056,0005323 GIS System Upgrade 09-10 50,000 47,170 2,830 50,0005326 Library Electrical Upgrade 09-10 502,000 365,138 136,862 502,000 5335 Heavy Duty Vehicles FY 11 10-11 1,927,950 1,456,102 299,848 1,755,950 5336 Fire Station Emergency Generators 10-11 226,125 15,329 210,796 226,125 5338 Renovations to Fire Facilities FY 11 10-11 100,500 - 100,500 100,500 5354 City-wide IT Infrastructure 10-11 116,150 53,650 62,500 116,150 5357 Parking Lot Rehabilitation FY11 10-11 202,000 187,332 14,668 202,000 5361 Rolling Stock Acquisition-Light Duty Vehicles FY 12 11-12 381,300 341,752 39,548 381,300 5362 Rolling Stock Acquisition-Heavy Duty Vehicles FY 12 11-12 1,981,330 994,124 970,863 1,964,987 5365 Transcenter Garage Sprinkler System 11-12 378,750 94,484 284,266 378,750 5371 Library Design First Floor 11-12 227,000 25,224 201,776 227,000 5382 Two-Way Radio Replacement 12-13 282,800 - 282,800 282,800 5384 66-72 Church Street Property Acquisition 12-13 3,980,000 - 3,980,000 3,980,000 5388 Renaissance Fountain Pavers 12-13 50,000 - 50,000 50,000 5389 Renovations to Fire Facilities FY 13 12-13 202,000 - 202,000 202,000
Sub-total completed projects 12,469,155 4,894,480 7,386,332 12,280,812
Total Capital Projects Fund 56,150,845$ 7,781,098$ 21,527,159$ 29,308,257$
Expenditures and Transfers
100

Proceeds Federal Fund BalanceInterfund of And (Deficit) atTransfers Obligations State Aid Other Totals June 30, 2013
4,000$ 801,250$ -$ -$ 805,250$ -$ 2,000 989,000 65,000 - 1,056,000 -
50,000 - - - 50,000 - - 502,000 - - 502,000 - - 1,755,950 - - 1,755,950 - - 226,125 - - 226,125 - - 100,500 - - 100,500 - - 116,150 - - 116,150 - - 202,000 - - 202,000 -
381,300 - - - 381,300 - - 1,844,330 120,657 - 1,964,987 - - 378,750 - - 378,750 - - 162,000 - 65,000 227,000 - - 282,800 - - 282,800 - - 3,980,000 - - 3,980,000 -
50,000 - - - 50,000 - - 202,000 - - 202,000 -
487,300 11,542,855 185,657 65,000 12,280,812 -
1,198,529$ 21,176,255$ 1,751,475$ 135,000$ 24,261,259$ (5,046,998)$
Methods of Financing- Cumulative
101
ENTERPRISE FUND
Enterprise funds are used to report an activity for which a fee is charged predominantly to externalusers of goods or services. The Water Fund is an enterprise fund, charging customers for the supplyand use of City-provided water.
102

CITY OF WHITE PLAINS, NEW YORKWATER FUNDSCHEDULE OF REVENUES AND EXPENSES BY DEPARTMENTFOR THE FISCAL YEAR ENDED JUNE 30, 2013
Administration Supply Distribution Total
Charges for services - Metered water sales -$ -$ 11,981,058$ 11,981,058$ Intergovernmental - - 80,519 80,519 Miscellaneous - - 105,890 105,890
Total Operating Revenues - - 12,167,467 12,167,467
Operating Expenses: General operations: Personal services 678,472 480,259 1,039,138 2,197,869 Employee benefits 437,015 227,745 520,448 1,185,208 Other post employment benefit obligations 416,000 - - 416,000 Materials and supplies: Office operations 26,226 3,325 - 29,551 Land operations - 84,903 36,238 121,141 Building - facility operations - 53,489 495 53,984 Rolling stock operations 3,276 5,822 72,456 81,554 Water operations - 164,393 73,202 237,595 Utilities 4,653 4,915,402 - 4,920,055 Rentals - 4,720 - 4,720 Direct costs- Contractual services 557,467 118,601 213,567 889,635 Equipment - 499 - 499 Depreciation 977,434 - - 977,434
Total Operating Expenses 3,100,543 6,059,158 1,955,544 11,115,245
Operating Income (Loss) (3,100,543) (6,059,158) 10,211,923 1,052,222
Nonoperating Revenues (Expenses): Interest income 5,156 - - 5,156 Interest expense (402,902) - - (402,902)
Total Nonoperating Expenses (397,746) - - (397,746)
Change in Net Position (3,498,289)$ (6,059,158)$ 10,211,923$ 654,476$
Department
103

FIDUCIARY FUND
Fiduciary funds are used to report assets held in a trustee or agency capacity for others and thereforecannot be used to support the City's own programs. The City’s only fiduciary fund is the Agency Fund,which is primarily used to account for employee payroll tax withholdings and various deposits that arepayable to other jurisdictions or individuals.
104
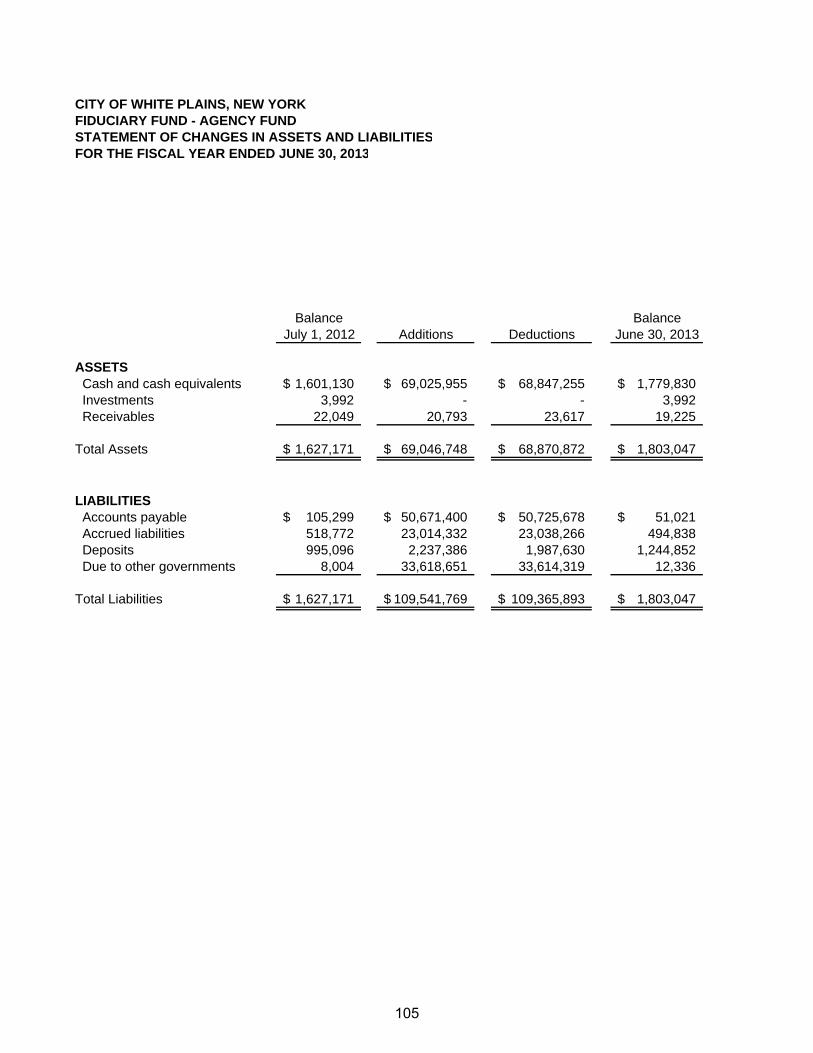
CITY OF WHITE PLAINS, NEW YORKFIDUCIARY FUND - AGENCY FUNDSTATEMENT OF CHANGES IN ASSETS AND LIABILITIESFOR THE FISCAL YEAR ENDED JUNE 30, 2013
Balance BalanceJuly 1, 2012 Additions Deductions June 30, 2013
ASSETS Cash and cash equivalents 1,601,130$ 69,025,955$ 68,847,255$ 1,779,830$ Investments 3,992 - - 3,992 Receivables 22,049 20,793 23,617 19,225
Total Assets 1,627,171$ 69,046,748$ 68,870,872$ 1,803,047$
LIABILITIES Accounts payable 105,299$ 50,671,400$ 50,725,678$ 51,021$ Accrued liabilities 518,772 23,014,332 23,038,266 494,838 Deposits 995,096 2,237,386 1,987,630 1,244,852 Due to other governments 8,004 33,618,651 33,614,319 12,336
Total Liabilities 1,627,171$ 109,541,769$ 109,365,893$ 1,803,047$
105

THIS PAGE INTENTIONALLY LEFT BLANK
106

STATISTICAL
SECTION
UNADUITED
107

108

These schedules contain trend information to help the reader understand howthe City's financial performance and well-being have changed over time.
These schedules include:
Net Position by Component
Changes in Net Position
Fund Balances, Governmental Funds
Changes in Fund Balances, Governmental Funds
Tax Revenues by Source, Governmental Funds
Financial Trends
109
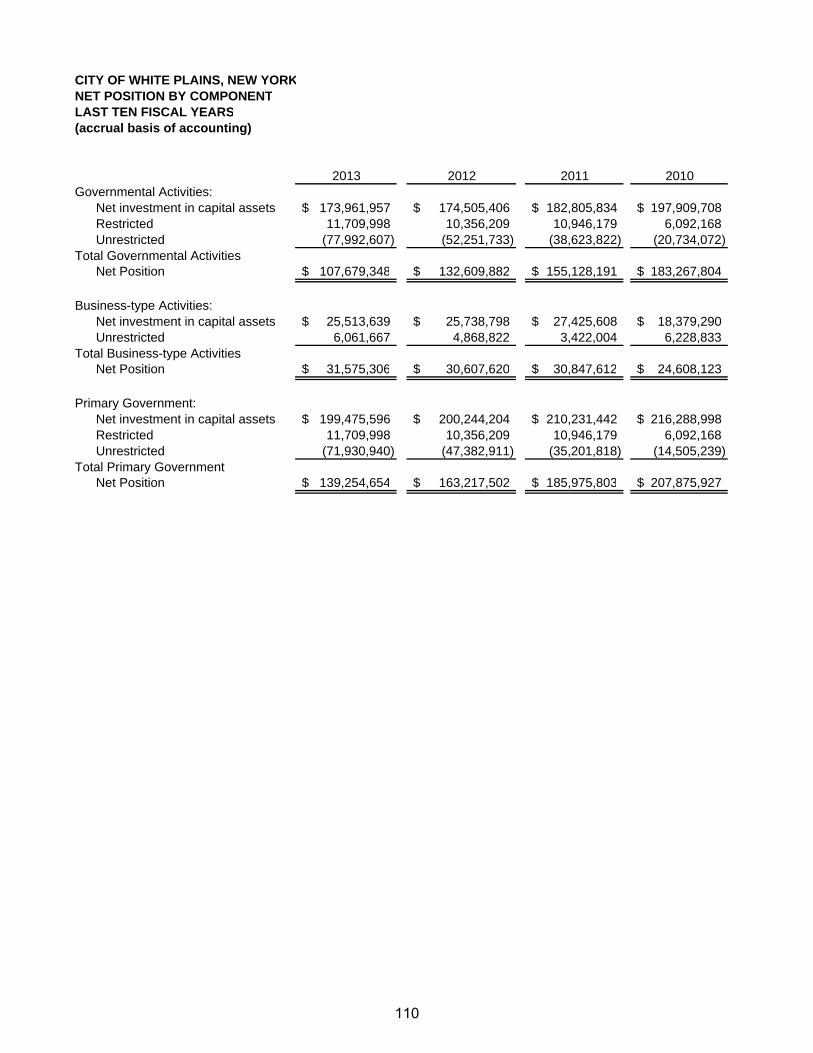
CITY OF WHITE PLAINS, NEW YORKNET POSITION BY COMPONENTLAST TEN FISCAL YEARS(accrual basis of accounting)
2013 2012 2011 2010Governmental Activities:
Net investment in capital assets 173,961,957$ 174,505,406$ 182,805,834$ 197,909,708$ Restricted 11,709,998 10,356,209 10,946,179 6,092,168Unrestricted (77,992,607) (52,251,733) (38,623,822) (20,734,072)
Total Governmental Activities Net Position 107,679,348$ 132,609,882$ 155,128,191$ 183,267,804$
Business-type Activities:Net investment in capital assets 25,513,639$ 25,738,798$ 27,425,608$ 18,379,290$ Unrestricted 6,061,667 4,868,822 3,422,004 6,228,833
Total Business-type ActivitiesNet Position 31,575,306$ 30,607,620$ 30,847,612$ 24,608,123$
Primary Government:Net investment in capital assets 199,475,596$ 200,244,204$ 210,231,442$ 216,288,998$ Restricted 11,709,998 10,356,209 10,946,179 6,092,168Unrestricted (71,930,940) (47,382,911) (35,201,818) (14,505,239)
Total Primary Government Net Position 139,254,654$ 163,217,502$ 185,975,803$ 207,875,927$
110
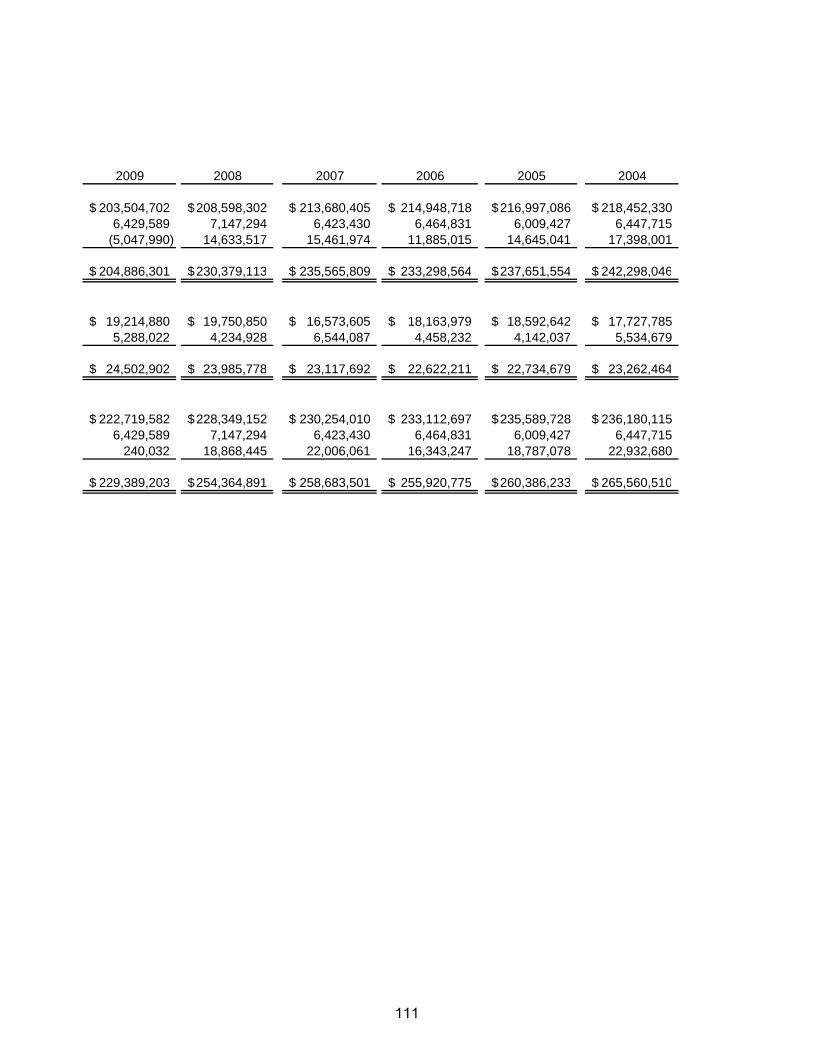
2009 2008 2007 2006 2005 2004
203,504,702$ 208,598,302$ 213,680,405$ 214,948,718$ 216,997,086$ 218,452,330$ 6,429,589 7,147,294 6,423,430 6,464,831 6,009,427 6,447,715
(5,047,990) 14,633,517 15,461,974 11,885,015 14,645,041 17,398,001
204,886,301$ 230,379,113$ 235,565,809$ 233,298,564$ 237,651,554$ 242,298,046$
19,214,880$ 19,750,850$ 16,573,605$ 18,163,979$ 18,592,642$ 17,727,785$ 5,288,022 4,234,928 6,544,087 4,458,232 4,142,037 5,534,679
24,502,902$ 23,985,778$ 23,117,692$ 22,622,211$ 22,734,679$ 23,262,464$
222,719,582$ 228,349,152$ 230,254,010$ 233,112,697$ 235,589,728$ 236,180,115$ 6,429,589 7,147,294 6,423,430 6,464,831 6,009,427 6,447,715
240,032 18,868,445 22,006,061 16,343,247 18,787,078 22,932,680
229,389,203$ 254,364,891$ 258,683,501$ 255,920,775$ 260,386,233$ 265,560,510$
111

CITY OF WHITE PLAINS, NEW YORKCHANGES IN NET POSITIONLAST TEN FISCAL YEARS(accrual basis of accounting)
ExpensesGovernmental Activities: 2013 2012 2011 2010 2009
Council and boards 644,007$ 609,669$ 605,824$ 936,100$ 2,773,252$ General government 28,761,320 29,121,245 28,047,898 28,737,398 26,379,148Public works 43,592,762 40,343,689 39,049,458 37,256,161 38,946,839Parking department 15,140,993 12,404,604 12,591,588 10,979,456 11,668,608Public safety 75,140,524 70,987,760 65,106,355 63,070,957 61,203,429Community services 28,644,014 29,082,143 28,254,133 26,029,490 28,002,894Interest 3,275,204 2,795,816 3,044,565 3,339,275 3,462,914
Total Governmental Activities 195,198,824 185,344,926 176,699,821 170,348,837 172,437,084
Business-type Activities:Water 11,691,872 10,499,382 11,098,116 9,110,935 9,011,557 Sewer 1,942,482 1,891,531 1,727,417 - -
Total Business-type Activities 13,634,354 12,390,913 12,825,533 9,110,935 9,011,557
Total Primary Government Expenses 208,833,178$ 197,735,839$ 189,525,354$ 179,459,772$ 181,448,641$
Program RevenuesGovernmental Activities:
Charges for services: Council and boards -$ -$ -$ -$ -$ General government 3,686,259 3,725,918 3,371,223 3,134,315 2,739,902 Public works 1,593,371 1,441,339 1,291,158 1,199,284 1,341,090 Parking department 21,476,133 21,228,041 20,344,110 19,072,096 19,121,917 Public safety 3,275,538 2,994,667 3,153,886 4,391,545 2,727,619 Community services 7,217,084 7,188,236 6,247,274 6,048,580 6,441,354Operating grants and contributions 15,142,295 9,837,674 9,463,269 9,601,508 7,651,394Capital grants and contributions 879,328 489,980 1,140,431 2,112,478 983,792
Total Governmental Activities 53,270,008 46,905,855 45,011,351 45,559,806 41,007,068
Business-type Activities:Charges for services: Water 11,981,058 10,158,106 9,554,144 9,025,351 9,324,200 Sewer 2,179,960 1,712,431 1,421,998 - - Operating grants and contributions 85,226 - - - -
Total Business-type Activities 14,246,244 11,870,537 10,976,142 9,025,351 9,324,200
Total Primary Government Program Revenues 67,516,252$ 58,776,392$ 55,987,493$ 54,585,157$ 50,331,268$
Net (Expense)/RevenueGovernmental Activities (141,928,816)$ (138,439,071)$ (131,688,470)$ (124,789,031)$ (131,430,016)$ Business-type Activities 611,890 (520,376) (1,849,391) (85,584) 312,643
Total Primary Government Net Expense (141,316,926)$ (138,959,447)$ (133,537,861)$ (124,874,615)$ (131,117,373)$
General RevenuesGovernmental Activities:
Property taxes 55,005,614$ 52,120,683$ 49,884,914$ 47,358,459$ 45,762,390$ Sales taxes 49,913,997 50,972,671 51,503,053 43,533,909 46,368,865Hotel occupancy taxes 997,932 986,735 979,833 688,580 - Utilities gross receipts taxes 1,264,420 1,367,876 1,374,234 1,419,855 1,537,833Intergovernmental-unrestricted 7,013,667 6,728,416 6,981,401 7,268,071 9,310,919Franchise taxes 729,899 687,538 644,691 562,090 321,678Unrestricted investment earnings 120,486 165,094 212,817 455,823 1,302,766Gain on sale of capital assets 47,900 64,254 64,665 66,445 23,121Miscellaneous 1,904,367 2,827,495 1,844,443 1,817,302 1,309,632
Transfers - - (7,959,167) - - Total Governmental Activities 116,998,282 115,920,762 105,530,884 103,170,534 105,937,204
Special Item - - - - - Total Governmental Activities and Special Item 116,998,282 115,920,762 105,530,884 103,170,534 105,937,204
Business-type Activities:Unrestricted investment earnings 20,807 24,658 35,234 49,981 71,058Miscellaneous 334,989 255,726 94,479 140,824 133,423Transfers - - 1,500 - - Capital contributions - - 7,957,667 - -
Total Business-type Activities 355,796 280,384 8,088,880 190,805 204,481
Total General Revenues and Special Item 117,354,078$ 116,201,146$ 113,619,764$ 103,361,339$ 106,141,685$
Change in Net PositionGovernmental Activities (24,930,534)$ (22,518,309)$ (26,157,586)$ (21,618,497)$ (25,492,812)$ Business-type Activities 967,686 (239,992) 6,239,489 105,221 517,124
Total Primary Government Change in Net Position (23,962,848)$ (22,758,301)$ (19,918,097)$ (21,513,276)$ (24,975,688)$
112

2008 2007 2006 2005 2004630,028$ 625,902$ 673,185$ 662,005$ 567,512$
24,555,359 22,637,961 21,977,139 20,402,372 17,993,36537,048,565 35,355,753 33,676,657 31,503,823 30,939,78110,950,845 10,289,385 6,823,792 7,083,831 - 55,284,971 52,266,271 52,758,948 49,500,918 45,147,24128,100,351 24,539,276 23,883,484 22,518,404 20,277,269
2,838,043 2,550,891 2,694,390 2,589,890 2,440,058159,408,162 148,265,439 142,487,595 134,261,243 117,365,226
8,356,237 7,625,604 7,038,281 7,060,813 6,174,790 - - - - -
8,356,237 7,625,604 7,038,281 7,060,813 6,174,790
167,764,399$ 155,891,043$ 149,525,876$ 141,322,056$ 123,540,016$
-$ -$ 29,150$ -$ -$ 4,360,295 5,008,417 5,116,934 2,407,397 2,637,7951,542,842 1,153,199 1,140,480 1,024,905 1,160,234
19,375,312 16,403,669 15,866,013 15,584,702 - 3,604,230 3,180,184 3,734,933 2,955,164 5,851,5786,759,149 5,338,018 5,111,029 4,302,727 2,871,3656,827,195 6,982,551 7,272,199 8,085,497 7,630,6961,876,009 1,602,599 1,334,484 1,423,455 11,508,645
44,345,032 39,668,637 39,605,222 35,783,847 31,660,313
8,535,444 7,836,344 6,560,748 5,946,111 4,984,370 - - - - -
270,202 - - 203,324 39,2688,805,646 7,836,344 6,560,748 6,149,435 5,023,638
53,150,678$ 47,504,981$ 46,165,970$ 41,933,282$ 36,683,951$
(115,063,130)$ (108,596,802)$ (102,882,373)$ (98,477,396)$ (85,704,913)$ 449,409 210,740 (477,533) (911,378) (1,151,152)
(114,613,721)$ (108,386,062)$ (103,359,906)$ (99,388,774)$ (86,856,065)$
43,705,394$ 41,562,032$ 38,677,976$ 37,060,991$ 33,187,978$ 45,462,388 44,853,309 41,886,257 40,929,781 37,698,714
- - - - - 1,524,322 1,393,945 1,490,316 1,373,286 1,365,2719,692,600 11,129,981 9,948,692 9,398,195 7,112,143
311,789 232,280 279,338 373,194 169,4242,314,791 2,603,890 2,128,736 1,135,611 634,723
88,142 - - 47,720 37,1856,299,422 9,088,610 5,373,620 2,056,187 1,616,921
- - - - - 109,398,848 110,864,047 99,784,935 92,374,965 81,822,359
- - - - 6,304,861109,398,848 110,864,047 99,784,935 92,374,965 88,127,220
156,928 172,708 163,298 156,366 120,835261,749 112,033 201,767 227,227 25,119
- - - - - - - - - -
418,677 284,741 365,065 383,593 145,954
109,817,525$ 111,148,788$ 100,150,000$ 92,758,558$ 88,273,174$
(5,664,282)$ 2,267,245$ (3,097,438)$ (6,102,431)$ 2,422,307$ 868,086 495,481 (112,468) (527,785) (1,005,198)
(4,796,196)$ 2,762,726$ (3,209,906)$ (6,630,216)$ 1,417,109$
113

CITY OF WHITE PLAINS, NEW YORKFUND BALANCES, GOVERNMENTAL FUNDSLAST TEN FISCAL YEARS(modified accrual basis of accounting)
2013 2012 2011 2010
General Fund:Nonspendable - not in spendable form: Inventory 842,194$ 866,460$ 854,682$ 825,972$ Prepaid items 64,804 58,057 68,710 36,752 Long-term receivables 768,534 812,913 1,232,043 697,213 Restricted- Tax stabilization 5,048,663 5,105,874 5,008,606 407,377 Tax stabilization-for subsequent year's expenditures 5,100,000 5,000,000 - - Committed- Recreation and open space 689,451 133,498 207,254 279,060 Recreation and open space-for subsequent year's expenditures 37,854 39,708 - - Assigned: Purchases on order 1,523,191 1,075,649 624,810 717,058 Tax certiorari 5,750,000 6,000,000 5,250,000 5,250,000 Retirement system loan 1,273,994 - - - For subsequent year's expenditures 5,150,000 2,750,000 5,198,939 5,043,416 Unassigned 6,134,659 5,463,488 2,677,542 3,689,222 Reserved - - - - Unreserved - - - -
Total General Fund 32,383,344$ 27,305,647$ 21,122,586$ 16,946,070$
All Other Governmental Funds:Nonspendable - not in spendable form- Prepaid items -$ -$ 741$ 492$ Nonspendable endowment 10,000 10,000 10,000 10,000 Restricted: Capital Projects Fund - 5,320,245 - - Library Fund 111,508 89,513 56,186 50,809 Nonrecurring repairs 626,822 564,542 502,982 406,804 Debt Service Fund 1,680,991 707,825 371,663 750,038 Grantors and donors restrictions 2,894,199 2,754,230 2,858,232 2,907,322 Police purposes 318,670 408,979 394,374 393,124 Committed: Capital Projects Fund - - 2,431,418 1,113,395 Recreation and open space 322,826 372,826 372,826 372,802 Parking improvements 16,386 16,386 87,886 87,818 Unassigned- Capital Projects Fund (5,046,998) - (11,650,291) (2,979,126) Reserved - - - - Unreserved, reported in: Capital Projects Fund - - - - Special Revenue Funds - - - - Debt Service Fund - - - - Permanent Fund - - - -
Total All Other Governmental Funds 934,404$ 10,244,546$ (4,563,983)$ 3,113,478$
Total Governmental Funds 33,317,748$ 37,550,193$ 16,558,603$ 20,059,548$
(1) Components of fund balance reclassified with the June 30, 2010 implementation of GASB Statement No. 54,Fund Balance Reporting and Governmental Fund Type Definitions.
1
114

2009 2008 2007 2006 2005 2004
-$ -$ -$ -$ -$ -$ - - - - - - - - - - - -
- - - - - - - - - - - -
- - - - - - - - - - - -
- - - - - - - - - - - - - - - - - - - - - - - - - - - - - -
2,025,252 2,233,825 2,573,565 1,910,655 1,715,779 2,403,527 17,431,582 26,186,916 26,302,351 20,966,814 21,121,017 20,812,805
19,456,834$ 28,420,741$ 28,875,916$ 22,877,469$ 22,836,796$ 23,216,332$
-$ -$ -$ -$ -$ -$ - - - - - -
- - - - - - - - - - - - - - - - - - - - - - - - - - - - - - - - - - - -
- - - - - - - - - - - - - - - - - -
- - - - - - 2,446,235 7,140,025 19,538,546 2,230,175 3,467,413 8,117,203
(6,058,001) (54,841) (14,747,077) (1,735,077) (1,402,520) 1,558,585 3,507,549 4,125,397 4,078,763 4,147,006 2,723,422 3,964,696
458,000 350,000 616,446 351,726 500,413 - 744 590 1,113 1,159 806 614
354,527$ 11,561,171$ 9,487,791$ 4,994,989$ 5,289,534$ 13,641,098$
19,811,361$ 39,981,912$ 38,363,707$ 27,872,458$ 28,126,330$ 36,857,430$
115

CITY OF WHITE PLAINS, NEW YORKCHANGES IN FUND BALANCES, GOVERNMENTAL FUNDSLAST TEN FISCAL YEARS(modified accrual basis of accounting)
2013 2012 2011 2010REVENUES Taxes and related items 107,170,928$ 105,958,940$ 103,538,164$ 92,680,018$ Intergovernmental 18,115,592 16,747,231 17,257,571 17,267,408 Charges for services 17,830,678 17,229,090 16,374,225 16,515,754 Licenses and permits 4,908,105 4,839,640 4,335,782 5,027,042 Fines and forfeitures 8,231,706 8,220,494 8,038,759 6,598,194 Interest 91,289 141,571 183,519 466,402 Fees and program income 5,360,352 5,451,437 4,694,951 4,642,577 Miscellaneous 8,520,179 4,796,487 3,844,370 5,153,444 Total Revenues 170,228,829 163,384,890 158,267,341 148,350,839
EXPENDITURES Current: Council and boards 530,784 508,281 625,384 970,154 General government 28,524,802 29,327,507 29,429,240 29,056,203 Public works 28,455,868 26,396,360 26,314,640 25,510,723 Parking 12,222,118 10,658,942 10,994,527 10,118,846 Public safety 60,015,627 57,391,910 55,960,663 55,196,089 Community services 24,495,323 25,368,006 24,740,440 23,826,050 Debt Service: Principal 5,164,308 5,055,869 4,664,318 5,118,928 Interest 3,408,724 2,900,728 2,997,551 3,357,013 Refunding bond issuance costs - 160,423 - 117,802 Capital Outlay 21,384,220 6,876,090 8,731,581 5,842,075 Total Expenditures 184,201,774 164,644,116 164,458,344 159,113,883
Excess (Deficiency) of Revenues over Expenditures (13,972,945) (1,259,226) (6,191,003) (10,763,044)
OTHER FINANCING SOURCES (USES)New York State loan - - - - Bond anticipation notes issued - - 2,750,000 5,150,000Bonds issued 9,740,500 28,460,055 - 7,010,325Refunding bonds issued - 12,170,598 - 5,595,000Issuance premium - 1,883,875 - 239,917Payment to refunded bond escrow agent - (13,894,050) - (5,717,115)Bond anticipation notes redeemed - (6,945,000) - (750,000)Transfers in 10,088,446 8,775,409 7,698,688 14,268,969Transfers out (10,088,446) (8,775,409) (7,700,188) (14,268,969) Total Other Financing Sources 9,740,500 21,675,478 2,748,500 11,528,127
Net Change in Fund Balances before Special Item (4,232,445) 20,416,252 (3,442,503) 765,083
Special Item - - - -
Net Change in Fund Balances (4,232,445)$ 20,416,252$ (3,442,503)$ 765,083$
Debt Service as a percentage of noncapital expenditures 5.24% 5.04% 4.86% 5.53%
116

2009 2008 2007 2006 2005 2004
93,173,482$ 90,858,965$ 88,365,864$ 82,553,202$ 79,910,187$ 72,346,126$ 17,766,027 18,228,591 19,402,038 18,110,505 18,146,071 16,418,32116,955,893 17,976,903 14,355,680 14,031,230 13,346,928 6,112,0232,649,889 4,253,707 4,714,648 4,947,321 2,461,692 2,319,9376,670,562 7,537,158 7,511,149 7,623,848 6,980,147 1,900,7761,241,167 2,131,464 2,436,139 2,018,885 1,085,579 529,0574,976,526 5,327,040 4,026,579 3,905,891 3,118,156 7,148,0162,909,752 7,306,745 9,951,674 6,444,133 3,425,309 6,451,423
146,343,298 153,620,573 150,763,771 139,635,015 128,474,069 113,225,679
2,492,373 615,676 613,812 659,709 633,424 567,14826,966,651 26,487,929 24,514,136 23,123,447 21,389,560 18,563,69226,993,941 27,295,660 25,662,325 24,453,087 23,710,685 22,713,99510,611,509 10,669,137 9,971,792 6,686,585 6,687,958 - 53,144,364 52,641,804 49,642,916 50,148,293 46,895,801 42,067,71025,202,058 24,853,155 23,325,581 22,835,583 21,082,993 18,968,046
5,191,551 6,324,088 6,577,407 6,449,245 6,060,995 6,852,5693,460,868 2,783,145 2,525,172 2,762,142 2,489,014 2,328,124
- - 138,109 - - 108,27112,450,534 24,644,360 7,567,246 7,863,464 14,989,505 18,934,301
166,513,849 176,314,954 150,538,496 144,981,555 143,939,935 131,103,856
(20,170,551) (22,694,381) 225,275 (5,346,540) (15,465,866) (17,878,177)
- - 1,483,365 1,518,668 2,350,000 - - 1,000,000 - - - - - 22,835,000 8,644,500 3,574,000 6,275,000 9,547,000- - 12,470,000 - - 8,180,946- - 509,521 - - 209,942- - (12,841,412) - - (8,282,617)- - - - - -
15,564,216 17,494,976 17,598,166 16,551,216 12,750,296 7,709,375(15,564,216) (17,494,976) (17,598,166) (16,551,216) (12,750,296) (7,709,375)
- 23,835,000 10,265,974 5,092,668 8,625,000 9,655,271
(20,170,551) 1,140,619 10,491,249 (253,872) (6,840,866) (8,222,906)
- - - - - 6,256,348
(20,170,551)$ 1,140,619$ 10,491,249$ (253,872)$ (6,840,866)$ (1,966,558)$
5.60% 5.92% 6.36% 6.72% 6.68% 8.21%
117

CITY OF WHITE PLAINS, NEW YORKTAX REVENUES BY SOURCE, GENERAL FUNDLAST TEN FISCAL YEARS(modified accrual basis of accounting)
Taxes HotelFiscal and Related Sales and Occupancy Utilities GrossYear Items (1) Use Tax (2) Tax (3) Receipts Tax Total
2013 49,369,044$ 49,913,997$ 997,932$ 1,264,420$ 101,545,393$ 2012 47,129,479 50,972,671 986,735 1,367,876 100,456,7612011 49,681,044 51,503,053 979,833 1,374,234 103,538,1642010 47,037,674 43,533,909 688,580 1,419,855 92,680,018 2009 45,266,784 46,368,865 - 1,537,833 93,173,482 2008 43,872,255 45,462,388 - 1,524,322 90,858,965 2007 42,118,610 44,853,309 - 1,393,945 88,365,864 2006 39,176,629 41,886,257 - 1,490,316 82,553,202 2005 37,607,120 40,929,781 - 1,373,286 79,910,187 2004 33,282,141 37,698,714 - 1,365,271 72,346,126
(1) Taxes and Related Items include real property taxes, payments in lieu of taxes, interest and lien fees and allowance for uncollected taxes and tax certiorari. (2) Components of Sales and Use Tax:
Fiscal New YorkYear State * MTA ** County City *** Total2013 4.00% 0.375% 1.50% 2.50% 8.375%2012 4.00% 0.375% 1.50% 2.50% 8.375%2011 4.00% 0.375% 1.50% 2.50% 8.375%2010 4.00% 0.375% 1.50% 2.50% 8.375%2009 4.00% 0.375% 1.50% 2.25% 8.125%2008 4.00% 0.375% 1.50% 2.25% 8.125%2007 4.00% 0.375% 1.50% 2.00% 7.875%2006 4.00% 0.375% 1.50% 2.00% 7.875%2005 4.00% 0.375% 1.50% 2.00% 7.875%2004 4.25% 0.250% 1.50% 2.00% 8.000%
* Effective June 1, 2005 the NYS rate decreased from 4.25% to 4.00%** Effective June 1, 2005 the MTA rate increased from .250% to .375%*** Effective June 1, 2008 the City rate increased from 2.00% to 2.25% Effective June 1, 2010 the City rate increased from 2.25% to 2.50%(3) Hotel Occupancy Tax was effective as of October 1, 2009 at the rate of 3.00%Source: City of White Plains Finance Department
118

These schedules contain information to help the reader assess the City's mostsignificant local revenue source, the property tax. These schedules include:
Assessed Valuation, State Equalization Rate and Estimated Full Value of Real Property
Property Tax Rates per $1,000 of Assessed Valuation - All Direct and Overlapping Governments
Principal Taxpayers
Property Tax Levies and Collections
Constitutional Tax Limit
Note: Detailed information concerning sales tax revenue is considered confidential information pursuant to New York State law and unavailable for display.
Revenue Capacity
119

CITY OF WHITE PLAINS, NEW YORKASSESSED VALUATION, STATE EQUALIZATION RATE AND ESTIMATED FULL VALUE OF REAL PROPERTYLAST TEN FISCAL YEARS
TotalOne-Three Condo, Less Taxable State
Family Co-ops, Tax-Exempt Assessed Equalization FullTax Year Residences Apartments Commercial Property Valuation Rate Valuation
2012-13 117,125,216$ 71,770,970$ 232,783,592$ 146,107,682$ 275,572,096$ 3.70% 7,447,894,486$ 2011-12 117,302,391 56,293,245 250,035,744 145,476,251 278,155,129 3.48% 7,992,963,4772010-11 118,859,484 57,416,141 251,284,072 146,240,831 281,318,866 3.17% 8,874,412,1772009-10 120,231,089 57,784,386 258,505,307 151,308,436 285,212,346 2.84% 10,042,688,239 2008-09 121,005,719 72,739,746 248,431,682 151,987,770 290,189,377 2.75% 10,552,340,982 2007-08 120,796,989 72,115,083 253,648,541 156,658,202 289,902,411 2.75% 10,541,905,855 2006-07 120,349,269 72,309,698 258,470,800 154,975,203 296,154,564 3.24% 9,140,572,963 2005-06 119,440,434 66,388,333 268,331,520 151,904,088 302,256,199 3.54% 8,538,310,706 2004-05 118,563,640 64,679,083 275,369,362 153,931,776 304,680,309 3.82% 7,975,924,319 2003-04 117,932,903 64,189,864 282,257,581 147,275,814 317,104,534 4.45% 7,125,944,584
Note:Assessed values are established by the City of White Plains Assessor on March 1st of eachyear and include Special Franchise Assessments as established by the New York State Officeof Real Property Services. The 2012-13 tax levy was based upon the list of March 1, 2012.
Source: City of White Plains Assessor's Office
120

CITY OF WHITE PLAINS, NEW YORKPROPERTY TAX RATES PER $1,000 OF ASSESSED VALUATION- ALL DIRECT AND OVERLAPPING GOVERNMENTSLAST TEN FISCAL YEARS
Total CityTotal Assessed
City White City, Valuation New Yorkof Plains Refuse School, Including State
White School Westchester Sewer Disposal Total County Special EqualizationYear Plains District County District District County Tax Rate Franchise Rate
2012-13 184.47$ 565.50$ 106.28$ 16.43$ (1) 10.02$ 132.73$ (1) 882.70$ (1) 275,572,096$ 3.70%18.28 (2) 134.58 (2) 884.55 (2)
2011-12 176.11 548.89 110.59 17.17 (1) 10.51 138.27 (1) 863.27 (1) 278,155,129 3.48%18.82 (2) 139.92 (2) 864.92 (2)
2010-11 167.82 534.63 112.97 17.13 (1) 10.50 140.60 (1) 843.05 (1) 281,318,866 3.17%18.94 (2) 142.41 (2) 844.86 (2)
2009-10 157.06 515.15 110.88 15.95 (1) 10.17 137.00 (1) 809.21 (1) 285,212,346 2.8418.44 (2) 139.49 (2) 811.70 (2)
2008-09 147.47 503.01 102.80 14.51 (1) 9.82 127.13 (1) 777.61 (1) 290,189,377 2.7517.53 (2) 130.15 (2) 780.63 (2)
2007-08 141.93 474.62 93.22 12.96 (1) 10.15 116.33 (1) 732.88 (1) 289,902,411 2.7515.75 (2) 119.12 (2) 735.67 (2)
2006-07 132.64 443.77 88.89 10.32 (1) 10.24 109.45 (1) 685.86 (1) 296,154,564 3.2413.29 (2) 112.42 (2) 688.83 (2)
2005-06 123.05 410.45 86.10 9.82 (1) 10.28 106.20 (1) 639.70 (1) 302,256,199 3.5412.43 (2) 108.81 (2) 642.31 (2)
2004-05 117.61 375.30 82.26 8.73 (1) 9.75 100.74 (1) 593.65 (1) 304,680,309 3.8210.75 (2) 102.76 (2) 595.67 (2)
2003-04 104.31 349.03 62.88 7.80 (1) 8.60 79.28 (1) 532.62 (1) 317,104,534 4.459.39 (2) 80.87 (2) 534.21 (2)
(1) Bronx Valley District(2) Mamaroneck District
Source: City of White Plains Finance Department
121
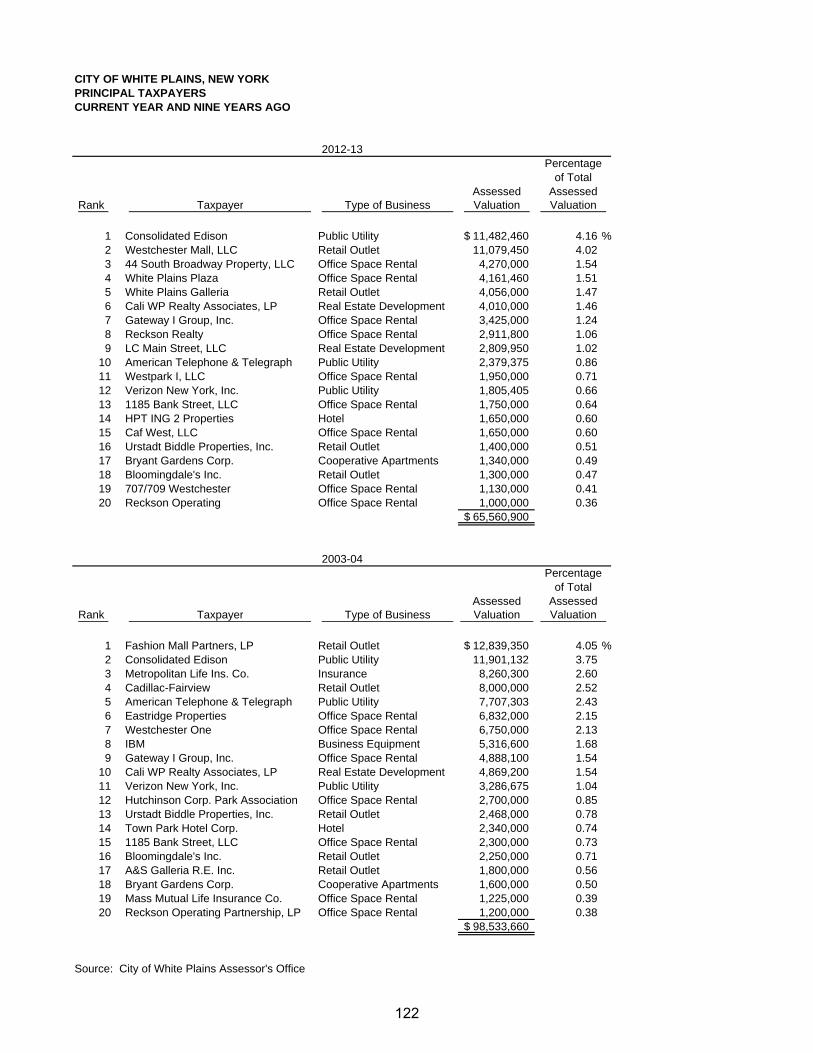
CITY OF WHITE PLAINS, NEW YORKPRINCIPAL TAXPAYERSCURRENT YEAR AND NINE YEARS AGO
AssessedRank Taxpayer Type of Business Valuation
1 Consolidated Edison Public Utility 11,482,460$ 4.16 %2 Westchester Mall, LLC Retail Outlet 11,079,450 4.023 44 South Broadway Property, LLC Office Space Rental 4,270,000 1.544 White Plains Plaza Office Space Rental 4,161,460 1.515 White Plains Galleria Retail Outlet 4,056,000 1.476 Cali WP Realty Associates, LP Real Estate Development 4,010,000 1.467 Gateway I Group, Inc. Office Space Rental 3,425,000 1.248 Reckson Realty Office Space Rental 2,911,800 1.069 LC Main Street, LLC Real Estate Development 2,809,950 1.02
10 American Telephone & Telegraph Public Utility 2,379,375 0.8611 Westpark I, LLC Office Space Rental 1,950,000 0.7112 Verizon New York, Inc. Public Utility 1,805,405 0.6613 1185 Bank Street, LLC Office Space Rental 1,750,000 0.6414 HPT ING 2 Properties Hotel 1,650,000 0.6015 Caf West, LLC Office Space Rental 1,650,000 0.6016 Urstadt Biddle Properties, Inc. Retail Outlet 1,400,000 0.5117 Bryant Gardens Corp. Cooperative Apartments 1,340,000 0.4918 Bloomingdale's Inc. Retail Outlet 1,300,000 0.4719 707/709 Westchester Office Space Rental 1,130,000 0.4120 Reckson Operating Office Space Rental 1,000,000 0.36
65,560,900$
AssessedRank Taxpayer Type of Business Valuation
1 Fashion Mall Partners, LP Retail Outlet 12,839,350$ 4.05 %2 Consolidated Edison Public Utility 11,901,132 3.753 Metropolitan Life Ins. Co. Insurance 8,260,300 2.604 Cadillac-Fairview Retail Outlet 8,000,000 2.525 American Telephone & Telegraph Public Utility 7,707,303 2.436 Eastridge Properties Office Space Rental 6,832,000 2.157 Westchester One Office Space Rental 6,750,000 2.138 IBM Business Equipment 5,316,600 1.689 Gateway I Group, Inc. Office Space Rental 4,888,100 1.54
10 Cali WP Realty Associates, LP Real Estate Development 4,869,200 1.5411 Verizon New York, Inc. Public Utility 3,286,675 1.0412 Hutchinson Corp. Park Association Office Space Rental 2,700,000 0.8513 Urstadt Biddle Properties, Inc. Retail Outlet 2,468,000 0.7814 Town Park Hotel Corp. Hotel 2,340,000 0.7415 1185 Bank Street, LLC Office Space Rental 2,300,000 0.7316 Bloomingdale's Inc. Retail Outlet 2,250,000 0.7117 A&S Galleria R.E. Inc. Retail Outlet 1,800,000 0.5618 Bryant Gardens Corp. Cooperative Apartments 1,600,000 0.5019 Mass Mutual Life Insurance Co. Office Space Rental 1,225,000 0.3920 Reckson Operating Partnership, LP Office Space Rental 1,200,000 0.38
98,533,660$
Source: City of White Plains Assessor's Office
2003-04Percentage
of TotalAssessedValuation
Valuation
Percentageof Total
Assessed
2012-13
122

CITY OF WHITE PLAINS, NEW YORKPROPERTY TAX LEVIES AND COLLECTIONSLAST TEN FISCAL YEARS
Collections in
Fiscal Property Amount SubsequentYear Tax Levy Collected Years
2012-13 $ 50,834,785 $ 50,539,754 99.42 % -$ $ 50,539,754 99.42 %2011-12 48,985,900 48,560,717 99.13 309,525 48,870,242 99.762010-11 47,210,932 46,801,722 99.13 331,426 47,133,148 99.832009-10 44,795,451 44,262,211 98.81 338,294 44,600,505 99.562008-09 42,794,228 42,430,049 99.61 347,529 42,777,578 99.962007-08 41,145,849 40,802,400 99.79 341,110 41,143,510 99.992006-07 39,281,812 39,107,050 99.97 174,762 39,281,812 100.002005-06 37,192,306 36,342,557 99.99 849,749 37,192,306 100.002004-05 35,833,139 35,128,929 99.98 697,286 35,826,215 99.992003-04 33,077,174 32,674,496 99.99 402,536 33,077,032 99.99
(1) Collections in subsequent years are through June 30, 2013
Source: City of White Plains Finance Department
Collected
Collected within the Fiscal Year of the Levy
of LevyPercent Percent
Total Collections to Date
Amountof Levy 1
123

CITY OF WHITE PLAINS, NEW YORKCONSTITUTIONAL TAX LIMIT
Constitutional tax limit calculation, June 30, 2013:Full valuation, last five fiscal years:
2012 7,992,963,477$ 2011 8,874,412,1772010 10,042,688,239 2009 10,552,340,982 2008 10,541,905,854
Total full valuation, last five years 48,004,310,729$
Five-year average full valuation 9,600,862,146$
Two (2%) percent of five-year average full valuation 192,017,243$ Total exclusions 1 10,562,977 Maximum taxing power 202,580,220 Tax levy-general city purposes 50,834,785 Constitutional tax limit 151,745,435$
Available constitutional tax limit 100,910,650$
Percent of constitutional tax limit exhausted 25.09%
Constitutional Tax Limit - Last Ten Fiscal Years:
MaximumTaxing Tax Constitutional Tax Limit
Year Power Levy Tax Limit Available2012-13 202,580,220$ 50,834,785$ 151,745,435$ 100,910,650$ 25.09 %2011-12 207,026,279 48,985,900 158,040,379 109,054,479 23.662010-11 203,514,970 47,210,932 156,304,038 109,093,106 23.202009-10 195,591,771 44,795,451 150,796,320 106,000,869 22.902008-09 182,550,281 42,794,228 139,756,053 96,961,825 23.442007-08 168,203,474 41,145,849 127,057,625 85,911,776 24.462006-07 152,088,226 39,281,812 112,806,414 73,524,602 25.832005-06 134,411,315 37,192,306 97,219,009 60,026,703 27.672004-05 117,547,080 35,833,139 81,713,941 45,880,802 30.482003-04 92,279,012 33,077,174 59,201,838 26,124,664 35.84
1 The constitutional tax limit specifically excludes debt service related to bondsand notes issued for certain specific purposes, and also excludes budgetaryappropriations in the forthcoming year's budget for objects or purposes forwhich a period of probable usefulness is provided for in Section 11 of the NewYork State Local Finance Law.
Source: City of White Plains Finance Department
Percent Exhausted
124

These schedules present information to help the reader assess the affordability of the City's current levels of outstanding debt and the City's ability to issue additionaldebt in the future. These schedules include:
Ratios of Outstanding Debt by Type
Direct and Overlapping Governmental Activities Debt
Computation of Legal Debt Margin
Debt Capacity
125
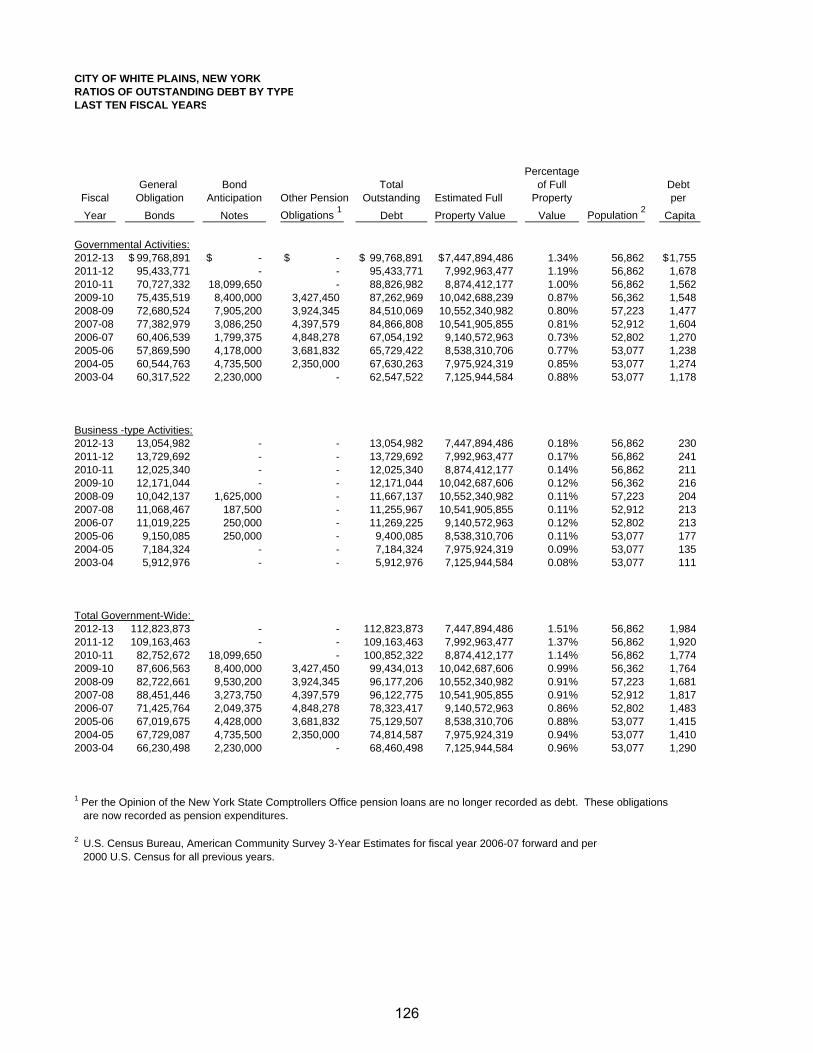
CITY OF WHITE PLAINS, NEW YORKRATIOS OF OUTSTANDING DEBT BY TYPELAST TEN FISCAL YEARS
PercentageGeneral Bond Total of Full Debt
Fiscal Obligation Anticipation Other Pension Outstanding Estimated Full Property per
Year Bonds Notes Obligations 1
Debt Property Value Value Population 2
Capita
Governmental Activities:2012-13 99,768,891$ -$ -$ 99,768,891$ 7,447,894,486$ 1.34% 56,862 1,755$ 2011-12 95,433,771 - - 95,433,771 7,992,963,477 1.19% 56,862 1,6782010-11 70,727,332 18,099,650 - 88,826,982 8,874,412,177 1.00% 56,862 1,5622009-10 75,435,519 8,400,000 3,427,450 87,262,969 10,042,688,239 0.87% 56,362 1,5482008-09 72,680,524 7,905,200 3,924,345 84,510,069 10,552,340,982 0.80% 57,223 1,4772007-08 77,382,979 3,086,250 4,397,579 84,866,808 10,541,905,855 0.81% 52,912 1,6042006-07 60,406,539 1,799,375 4,848,278 67,054,192 9,140,572,963 0.73% 52,802 1,2702005-06 57,869,590 4,178,000 3,681,832 65,729,422 8,538,310,706 0.77% 53,077 1,2382004-05 60,544,763 4,735,500 2,350,000 67,630,263 7,975,924,319 0.85% 53,077 1,2742003-04 60,317,522 2,230,000 - 62,547,522 7,125,944,584 0.88% 53,077 1,178
Business -type Activities:2012-13 13,054,982 - - 13,054,982 7,447,894,486 0.18% 56,862 2302011-12 13,729,692 - - 13,729,692 7,992,963,477 0.17% 56,862 2412010-11 12,025,340 - - 12,025,340 8,874,412,177 0.14% 56,862 2112009-10 12,171,044 - - 12,171,044 10,042,687,606 0.12% 56,362 2162008-09 10,042,137 1,625,000 - 11,667,137 10,552,340,982 0.11% 57,223 2042007-08 11,068,467 187,500 - 11,255,967 10,541,905,855 0.11% 52,912 2132006-07 11,019,225 250,000 - 11,269,225 9,140,572,963 0.12% 52,802 2132005-06 9,150,085 250,000 - 9,400,085 8,538,310,706 0.11% 53,077 1772004-05 7,184,324 - - 7,184,324 7,975,924,319 0.09% 53,077 1352003-04 5,912,976 - - 5,912,976 7,125,944,584 0.08% 53,077 111
Total Government-Wide: 2012-13 112,823,873 - - 112,823,873 7,447,894,486 1.51% 56,862 1,9842011-12 109,163,463 - - 109,163,463 7,992,963,477 1.37% 56,862 1,9202010-11 82,752,672 18,099,650 - 100,852,322 8,874,412,177 1.14% 56,862 1,7742009-10 87,606,563 8,400,000 3,427,450 99,434,013 10,042,687,606 0.99% 56,362 1,7642008-09 82,722,661 9,530,200 3,924,345 96,177,206 10,552,340,982 0.91% 57,223 1,6812007-08 88,451,446 3,273,750 4,397,579 96,122,775 10,541,905,855 0.91% 52,912 1,8172006-07 71,425,764 2,049,375 4,848,278 78,323,417 9,140,572,963 0.86% 52,802 1,4832005-06 67,019,675 4,428,000 3,681,832 75,129,507 8,538,310,706 0.88% 53,077 1,4152004-05 67,729,087 4,735,500 2,350,000 74,814,587 7,975,924,319 0.94% 53,077 1,4102003-04 66,230,498 2,230,000 - 68,460,498 7,125,944,584 0.96% 53,077 1,290
1 Per the Opinion of the New York State Comptrollers Office pension loans are no longer recorded as debt. These obligations are now recorded as pension expenditures.
2 U.S. Census Bureau, American Community Survey 3-Year Estimates for fiscal year 2006-07 forward and per 2000 U.S. Census for all previous years.
126
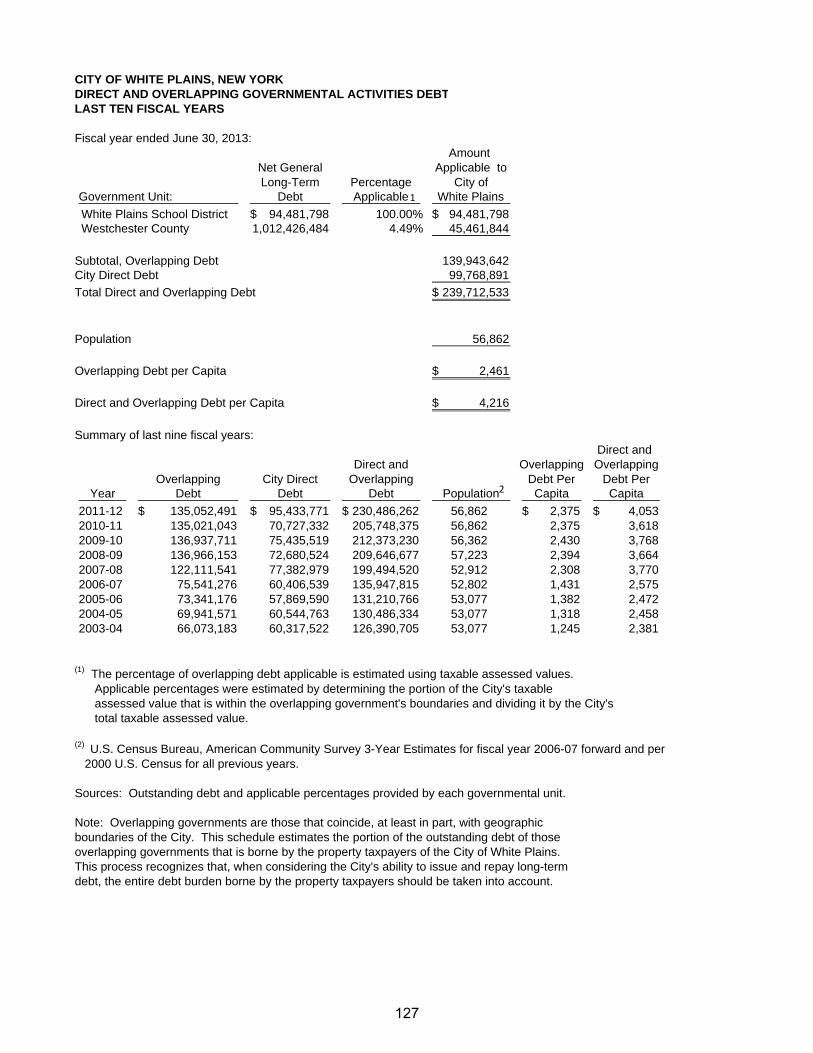
CITY OF WHITE PLAINS, NEW YORKDIRECT AND OVERLAPPING GOVERNMENTAL ACTIVITIES DEBTLAST TEN FISCAL YEARS
Fiscal year ended June 30, 2013:Amount
Net General Applicable toLong-Term Percentage City of
Debt Applicable White Plains
White Plains School District 94,481,798$ 100.00% 94,481,798$ Westchester County 1,012,426,484 4.49% 45,461,844
Subtotal, Overlapping Debt 139,943,642 City Direct Debt 99,768,891
Total Direct and Overlapping Debt 239,712,533$
Population 56,862
Overlapping Debt per Capita 2,461$
Direct and Overlapping Debt per Capita 4,216$
Summary of last nine fiscal years:Direct and
Direct and Overlapping OverlappingOverlapping City Direct Overlapping Debt Per Debt Per
Year Debt Debt Debt Population Capita Capita
2011-12 135,052,491$ 95,433,771$ 230,486,262$ 56,862 2,375$ 4,053$ 2010-11 135,021,043 70,727,332 205,748,375 56,862 2,375 3,6182009-10 136,937,711 75,435,519 212,373,230 56,362 2,430 3,7682008-09 136,966,153 72,680,524 209,646,677 57,223 2,394 3,664 2007-08 122,111,541 77,382,979 199,494,520 52,912 2,308 3,770 2006-07 75,541,276 60,406,539 135,947,815 52,802 1,431 2,575 2005-06 73,341,176 57,869,590 131,210,766 53,077 1,382 2,472 2004-05 69,941,571 60,544,763 130,486,334 53,077 1,318 2,458 2003-04 66,073,183 60,317,522 126,390,705 53,077 1,245 2,381
(1) The percentage of overlapping debt applicable is estimated using taxable assessed values. Applicable percentages were estimated by determining the portion of the City's taxable assessed value that is within the overlapping government's boundaries and dividing it by the City's total taxable assessed value.
(2) U.S. Census Bureau, American Community Survey 3-Year Estimates for fiscal year 2006-07 forward and per 2000 U.S. Census for all previous years.
Sources: Outstanding debt and applicable percentages provided by each governmental unit.
Note: Overlapping governments are those that coincide, at least in part, with geographicboundaries of the City. This schedule estimates the portion of the outstanding debt of thoseoverlapping governments that is borne by the property taxpayers of the City of White Plains.This process recognizes that, when considering the City's ability to issue and repay long-termdebt, the entire debt burden borne by the property taxpayers should be taken into account.
Government Unit: 1
2
127

CITY OF WHITE PLAINS, NEW YORKCOMPUTATION OF LEGAL DEBT MARGINJUNE 30, 2013
Taxable StateFiscal Assessed Equalization Full Year Valuation Rate Valuation
2013 275,572,096$ 3.70% 7,447,894,486$ 2012 278,155,129 3.48 7,992,963,477 2011 281,318,866 3.17 8,874,412,177 2010 285,212,346 2.84 10,042,688,239 2009 290,189,377 2.75 10,552,340,982
Total Five Year Valuation 44,910,299,361$
Five Year Average Full Valuation of Taxable Real Property 8,982,059,872$
Constitutional Debt Limit (7% of Average Full Valuation) 628,744,191$
Outstanding Indebtedness at June 30th 110,542,555$ Less: 2013-14 Appropriations for Debt Service Principal 7,574,875 Water and Sewer Projects 11,806,351 Net Indebtedness subject to debt limit 91,161,329$
Net debt contracting margin 537,582,862$
Percentage of net debt contracting margin available 85.50%
Percentage of net debt contracting power exhausted 14.50%
Last Ten Fiscal YearsPercentage of
Net DebtOutstanding Net Debt Contracting
Fiscal Constitutional Indebtedness Less Contracting Margin Year Debt Limit June 30 Exclusions Margin Available2013 628,744,191$ 110,542,555$ 19,381,226$ 537,582,862$ 85.50%2012 672,060,350 106,606,555 18,537,903 583,991,698 86.90 2011 688,126,883 100,287,650 17,271,378 605,110,611 87.94 2010 683,421,462 96,056,825 16,965,729 604,330,366 88.43 2009 654,486,768 92,345,200 16,746,545 578,888,113 88.45 2008 606,517,218 91,834,750 16,781,762 531,464,230 87.63 2007 553,691,863 73,600,875 15,086,445 495,177,433 89.43 2006 495,927,703 71,487,700 16,716,860 441,156,863 88.96 2005 438,995,374 72,519,200 14,009,643 380,485,817 86.67 2004 386,728,897 68,529,700 11,985,734 330,184,931 85.38
Source: City of White Plains Finance Department
128

These schedules offer demographic and economic indicators to help the readerunderstand the environment within which the City's financial activities take place.These schedules include:
Demographic and Economic Statistics
Principal Employers
Demographic and Economic Information
129

CITY OF WHITE PLAINS, NEW YORKDEMOGRAPIC AND ECONOMIC STATISTICSLAST TEN FISCAL YEARS
Median Median PublicFiscal Median Per Capita Family Household School Unemployment
Year Population (1) Age(1) Income (1) Income (1) Income (1) Enrollment (2) Rate(3)
2012-13 56,862 39.3 43,493$ 91,394$ 75,104$ 7,260 5.7%2011-12 56,862 39.3 43,493 91,394 75,104 7,177 6.7 2010-11 56,862 39.3 43,493 91,394 75,104 7,301 6.3 2009-10 56,362 40.0 42,979 82,116 69,818 7,113 6.7 2008-09 57,223 40.2 44,087 90,838 75,006 7,067 7.1 2007-08 52,912 42.7 45,031 91,450 75,532 7,167 4.5 2006-07 52,802 38.9 42,913 92,215 73,744 6,820 3.5 2005-06 53,077 38.1 33,825 71,891 57,447 6,940 3.7 2004-05 53,077 38.1 33,825 71,891 57,447 6,727 3.6 2003-04 53,077 38.1 33,825 71,891 57,447 6,972 4.2
Sources:
(1) U.S. Census Bureau, American Community Survey 3-Year Estimates for fiscal year 2006-07 forward and per
2000 U.S. Census for all previous years.
(2) Annual School Census of the White Plains Board of Education.
(3) U.S. Bureau of Labor Statistics for the City of White Plains, not seasonally unadjusted, for June of each fiscal year.
130
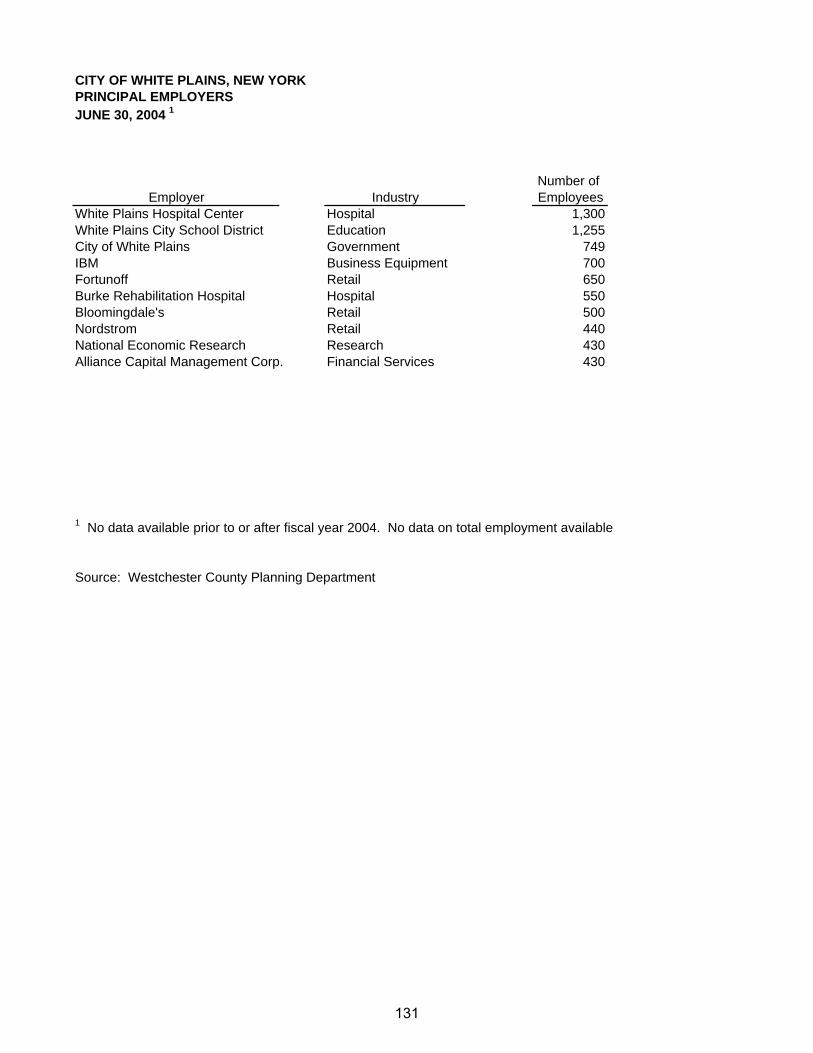
CITY OF WHITE PLAINS, NEW YORKPRINCIPAL EMPLOYERSJUNE 30, 2004 1
Number of Employer Industry Employees
White Plains Hospital Center Hospital 1,300White Plains City School District Education 1,255City of White Plains Government 749IBM Business Equipment 700Fortunoff Retail 650Burke Rehabilitation Hospital Hospital 550Bloomingdale's Retail 500Nordstrom Retail 440National Economic Research Research 430Alliance Capital Management Corp. Financial Services 430
1 No data available prior to or after fiscal year 2004. No data on total employment available
Source: Westchester County Planning Department
131
These schedules contain service and infrastructure data to help the readerunderstand how the information in the City's financial report relates to the servicesthe City provides and the activities it performs. These schedules include:
Full-Time Equivalent Employees by Program
Operating Indicators by Program
Capital Asset Statistics by Program
Operating Information
132
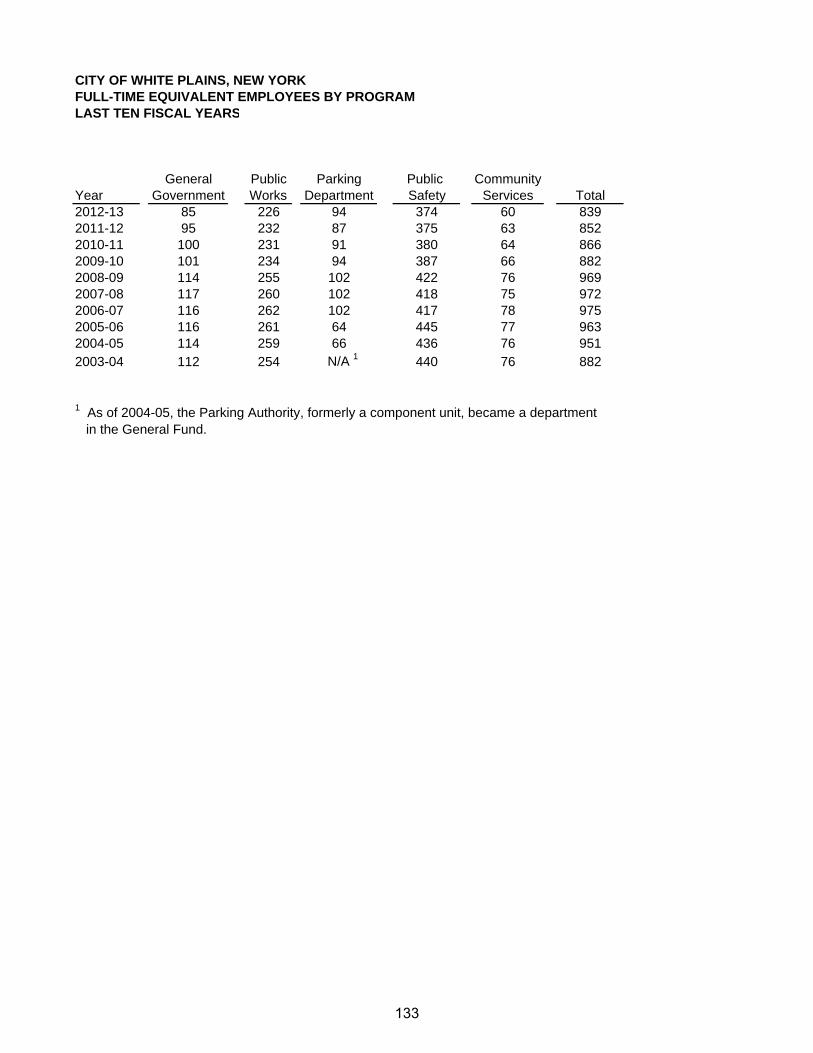
CITY OF WHITE PLAINS, NEW YORKFULL-TIME EQUIVALENT EMPLOYEES BY PROGRAMLAST TEN FISCAL YEARS
General Public Parking Public CommunityYear Government Works Department Safety Services Total2012-13 85 226 94 374 60 8392011-12 95 232 87 375 63 8522010-11 100 231 91 380 64 8662009-10 101 234 94 387 66 8822008-09 114 255 102 422 76 9692007-08 117 260 102 418 75 9722006-07 116 262 102 417 78 9752005-06 116 261 64 445 77 9632004-05 114 259 66 436 76 9512003-04 112 254 N/A 1 440 76 882
1 As of 2004-05, the Parking Authority, formerly a component unit, became a department in the General Fund.
133

CITY OF WHITE PLAINS, NEW YORKOPERATING INDICATORS BY PROGRAMLAST TEN YEARS
2012-13 2011-12 2010-11 2009-10General Government-
Building permits issued 1,670 1,675 1,458 1,197Public Safety:
Number of police personnel and officers 218 224 226 230Number of arrests 2,752 3,679 3,089 4,036Number of traffic violations 14,282 18,679 21,074 19,635Number of parking violations 200,608 225,264 227,088 225,264Number of paid firefighters 151 147 148 151Number of fire emergency responses 4,246 4,446 4,198 3,903Number of fires extinguished 51 69 52 66Number of fire inspections 1,786 1,701 1,881 2,105Number of school crossing guards 20 21 21 24
Public Works: Tons collected and disposed: Solid waste 30,030 31,090 31,845 34,222 Metal 34 28.2 27.5 16.1 Papers 3,391 3,390 3,472 3,835 Recyclable containers 1,750 1,801 1,752 1,752 Leaves (cubic yards) 32,347 33,580 32,723 38,741Number of shade trees: Planted 232 310 165 227 Removed 433 379 333 277 Trimmed 507 472 517 454 Stumps removed 361 448 371 320Wastewater: Catch basins cleaned 80 466 127 439 Emergency calls 150 150 181 194
Recreation and Parks:Field permits issued 275 240 240 240Recreation permits issued 2,375 2,375 2,300 2,320Number of youth programs 462 269 275 324Number of adult programs 160 163 170 190Number for senior citizen programs 623 320 327 356
Library-Volumes in collection 305,338 320,295 315,649 322,105
Water:Average daily consumption (gallons) 7,890,000 7,842,000 8,300,000 7,950,000Number of metered accounts 9,547 9,473 9,458 9,560Number of fire lines 611 707 696 700
Sources: Various city departments
134

2008-09 2007-08 2006-07 2005-06 2004-05 2003-04
1,224 1,751 1,630 1,440 1,622 1,752
249 245 245 245 243 2424,797 4,574 4,227 4,736 4,325 3,545
23,740 25,252 23,138 26,311 20,913 16,693228,113 233,697 244,882 248,030 265,569 235,406
165 165 165 161 158 1623,825 4,197 4,372 4,163 4,106 3,829
76 91 85 87 140 1121,928 1,851 1,822 1,530 1,891 1,686
24 23 23 24 24 23
34,222 38,466 41,731 41,094 42,271 42,91139.3 11.0 35.0 38.5 38.5 24.3
3,835 3,578 3,402 3,381 3,358 3,5571,752 1,292 1,025 1,009 1,032 1,012
47,672 38,564 46,654 56,775 36,175 34,071
130 158 175 158 59 141217 293 712 293 272 272284 374 237 374 326 326280 204 253 204 168 189
110 1,300 1,250 1,200 800 800200 275 253 200 250 125
236 185 230 200 188 1922,314 2,395 2,200 2,500 2,487 4,311
298 238 226 183 211 127165 216 173 259 193 108285 301 410 410 400 400
329,563 328,364 325,813 340,612 331,338 333,535
8,270,000 8,540,000 8,525,000 8,440,000 8,530,000 8,630,0009,541 9,546 9,528 9,527 9,492 9,455
681 673 673 672 672 677
135

CITY OF WHITE PLAINS, NEW YORKCAPITAL ASSET STATISTICS BY PROGRAMLAST TEN YEARS
2012-13 2011-12 2010-11 2009-10General Government-
Number of general government buildings 3 2 2 2Public Safety:
Number of police stations 1 1 1 1Number of fire stations 7 7 7 7
Parking Department-Number of parking garages 7 7 7 7
Public Works:Number of public works buildings 6 6 6 6Miles of streets 150 150 150 150Number of street lights 5,960 5,860 5,825 5,800Miles of sanitary sewers 127.1 127.1 127.1 127.1Miles of storm water drains 83 83 82.9 82.9
Recreation and Parks:Number of parks 23 23 23 23Acres of parks 231 231 231 230.7
Water:Miles of water mains 158.2 158.2 158.2 158.1Number of fire hydrants 2,050 2,050 2,050 2,050
Sources: Various city departments
136

2008-09 2007-08 2006-07 2005-06 2004-05 2003-04
2 2 2 2 2 2
1 1 1 1 1 17 7 7 7 7 7
7 6 6 6 6 6
6 5 5 5 5 5142.2 142 142 140 140 1355,700 5,700 5,700 5,700 6,000 6,000127.1 127.1 127 124.8 124.8 124.882.4 82.2 82 81.5 81.5 81.5
23 23 23 23 23 22230.7 230.7 230.7 230.7 230.7 225.7
158.4 158.2 158.1 158.1 158.1 157.41,772 1,770 1,769 1,767 1,767 1,762
137

THIS PAGE INTENTIONALLY LEFT BLANK
138

SINGLE
AUDIT
SECTION
139

140
O’CONNOR DAVIES, LLP500 Mamaroneck Avenue, Suite 301, Harrison, NY 10528 I Tel: 914.381.8900 I Fax: 914.381.8910 I www.odpkf.com
O’Connor Davies, LLP is a member firm of the PKF International Limited network of legally independent firms and does not accept any responsibility or liability for the actions or inactions on the part of any other individual member firm or firms.
Report on Internal Control Over Financial Reporting and on Compliance and Other Matters Based on an Audit of Financial Statements Performed in Accordance With
Government Auditing Standards
Independent Auditors’ Report
The Honorable Mayor and Common Councilof the City of White Plains, New York
We have audited, in accordance with the auditing standards generally accepted in the United States of America and the standards applicable to financial audits contained in Government Auditing Standards issued by the Comptroller General of the United States, the financial statements of the governmental activities, the business-type activities, the aggregate discretely presented component units, each major fund and the aggregate remaining fund information of the City of White Plains, New York (“City”) as of and for the year ended June 30, 2013, and the related notes to the financial statements, which collectively comprise the City’s basic financial statements, and have issued our report thereon dated October 28, 2013.
Internal Control Over Financial Reporting
In planning and performing our audit of the financial statements, we considered the City's internal control over financial reporting (“internal control”) to determine the audit procedures that are appropriate in the circumstances for the purpose of expressing our opinions on the financial statements, but not for the purpose of expressing an opinion on the effectiveness of the City’s internal control. Accordingly, we do not express an opinion on the effectiveness of the City’s internal control.
A deficiency in internal control exists when the design or operation of a control does not allow management or employees, in the normal course of performing their assigned functions to prevent, or detect and correct, misstatements on a timely basis. A material weakness is a deficiency, or a combination of deficiencies, in internal control, such that there is a reasonable possibility that a material misstatement of the entity’s financial statements will not be prevented, or detected and corrected, on a timely basis. A significant deficiency is a deficiency, or a combination of deficiencies, in internal control that is less severe than a material weakness, yet important enough to merit attention by those charged with governance.
Our consideration of internal control was for the limited purpose described in the first paragraph of this section and was not designed to identify all deficiencies in internal control that might be material weaknesses or significant deficiencies. Given these limitations, during our audit we did not identify any deficiencies in internal control that we consider to be material weaknesses. However, material weaknesses may exist that have not been identified.
141

Compliance and Other Matters
As part of obtaining reasonable assurance about whether the City's financial statements are free from material misstatement, we performed tests of its compliance with certain provisions of laws, regulations, contracts and grant agreements, noncompliance with which could have a direct and material effect on the determination of financial statement amounts. However, providing an opinion on compliance with those provisions was not an objective of our audit, and accordingly, we do not express such an opinion. The results of our tests disclosed no instances of noncompliance or other matters that are required to be reported under Government Auditing Standards.
We noted certain matters that we reported to the management of the City in a separate letter.
Purpose of this Report
The purpose of this report is solely to describe the scope of our testing of internal control and compliance and the results of that testing, and not to provide an opinion on the effectiveness of the City’s internal control or on compliance. This report is an integral part of an audit performed in accordance with Government Auditing Standards in considering the City’s internal control and compliance. Accordingly, this communication is not suitable for any other purpose.
O’Connor Davies, LLPHarrison, New YorkOctober 28, 2013
142

O’CONNOR DAVIES, LLP500 Mamaroneck Avenue, Suite 301, Harrison, NY 10528 I Tel: 914.381.8900 I Fax: 914.381.8910 I www.odpkf.com
O’Connor Davies, LLP is a member firm of the PKF International Limited network of legally independent firms and does not accept any responsibility or liability for the actions or inactions on the part of any other individual member firm or firms.
Report on Compliance For Each Major Federal Program and onInternal Control Over Compliance
Independent Auditors’ Report
The Honorable Mayor and Common Councilof the City of White Plains, New York
Report on Compliance for Each Major Federal Program
We have audited the City of White Plains, New York’s (“City”) compliance with the types of compliance requirements described in the OMB Circular A-133 Compliance Supplement that could have a direct and material effect on each of the City’s major federal programs for the year ended June 30, 2013. TheCity’s major federal programs are identified in the summary of auditors’ results section of the accompanying schedule of findings and questioned costs.
Management’s Responsibility
Management is responsible for compliance with the requirements of laws, regulations, contracts, and grants applicable to its federal programs.
Auditors’ Responsibility
Our responsibility is to express an opinion on compliance for each of the City’s major federal programs based on our audit of the types of compliance requirements referred to above. We conducted our audit of compliance in accordance with auditing standards generally accepted in the United States of America; the standards applicable to financial audits contained in Government Auditing Standards, issued by the Comptroller General of the United States; and OMB Circular A-133, Audits of States, Local Governments and Non-Profit Organizations. Those standards and OMB Circular A-133 require that we plan and perform the audit to obtain reasonable assurance about whether noncompliance with the types of compliance requirements referred to above that could have a direct and material effect on a major federal program occurred. An audit includes examining, on a test basis, evidence about City’s compliance with those requirements and performing such other procedures as we considered necessary in the circumstances.
We believe that our audit provides a reasonable basis for our opinion on compliance for each major federal program. However, our audit does not provide a legal determination of the City’s compliance.
143

Opinion on Each Major Federal Program
In our opinion, the City complied, in all material respects, with the types of compliance requirements referred to above that could have a direct and material effect on each of its major federal programs for the year ended June 30, 2013.
Report on Internal Control Over Compliance
Management of the City is responsible for establishing and maintaining effective internal control over compliance with the types of compliance requirements referred to above. In planning and performing our audit of compliance, we considered the City’s internal control over compliance with the types of requirements that could have a direct and material effect on each major federal program to determine the auditing procedures that are appropriate in the circumstances for the purpose of expressing an opinion on compliance for each major federal program and to test and report on internal control over compliance in accordance with OMB Circular A-133, but not for the purpose of expressing an opinion on the effectiveness of internal control over compliance. Accordingly, we do not express an opinion on the effectiveness of the City’s internal control over compliance.
A deficiency in internal control over compliance exists when the design or operation of a control over compliance does not allow management or employees, in the normal course of performing their assigned functions, to prevent, or detect and correct, noncompliance with a type of compliance requirement of a federal program on a timely basis. A material weakness in internal control over compliance is a deficiency, or combination of deficiencies, in internal control over compliance, such that there is a reasonable possibility that material noncompliance with a type of compliance requirement of a federal program will not be prevented, or detected and corrected, on a timely basis. A significant deficiency in internal control over compliance is a deficiency, or a combination of deficiencies, in internal control over compliance with a type of compliance requirement of a federal program that is less severe than a material weakness in internal control over compliance, yet important enough to merit attention by those charged with governance.
Our consideration of internal control over compliance was for the limited purpose described in the first paragraph of this section and was not designed to identify all deficiencies in internal control over compliance that might be material weaknesses or significant deficiencies. We did not identify any deficiencies in internal control over compliance that we consider to be material weaknesses. However, material weaknesses may exist that have not been identified.
The purpose of this report on internal control over compliance is solely to describe the scope of our testing of internal control over compliance and the results of that testing based on the requirements of OMB Circular A-133. Accordingly, this report is not suitable for any other purpose.
O’Connor Davies, LLPHarrison, New YorkOctober 28, 2013
144

CITY OF WHITE PLAINS, NEW YORK
SCHEDULE OF EXPENDITURES OF FEDERAL AWARDS
YEAR ENDED JUNE 30, 2013
Federal Grantor
Program Title
U.S. Department of Housing
and Urban Development
Direct Programs:
Community Development Block Grants 14.218 $ 805,645
Section 8 Housing Choice Vouchers 14.871 4,680,608
Total U.S. Department of Housing and
Urban Development 5,486,253
U.S. Department of Homeland Security
Direct Programs:
Assistance to Firefighters Grant 97.044 97,693
Staffing for Adequate Fire and Emergency Response (SAFER) 97.083 641,685
Indirect Programs - Passed through
New York State Emergency Management Office:
Disaster Grants - Public Assistance 97.036 1,703,739
Pre-Disaster Mitigation 97.047 54,540
Total U.S. Department of Homeland Security 2,497,657
U.S. Department of Labor
Indirect Program - Passed through
Westchester County -
Workforce Investment Act - Youth Activities 17.259 209,268
Workforce Investment Act - National Emergency Grant 17.277 12,635
Total U.S. Department of Labor 221,903
(Continued)
Number (1) Expenditures
Federal Federal
CFDA Program
145
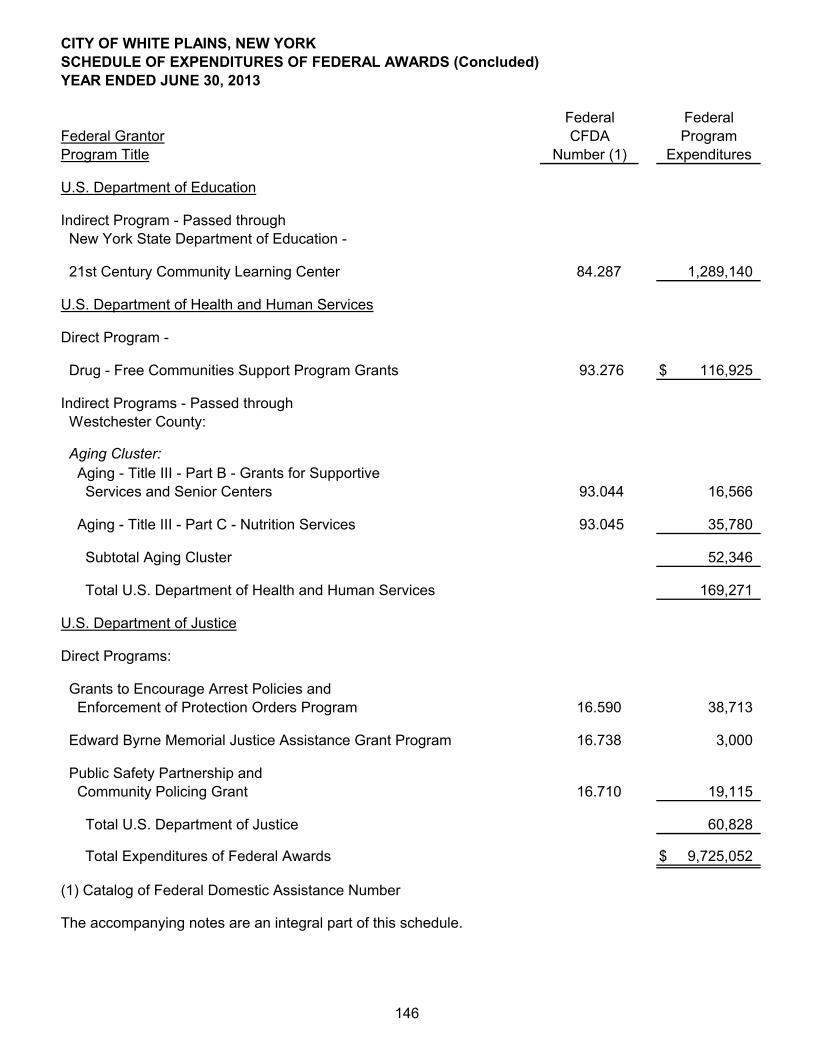
CITY OF WHITE PLAINS, NEW YORK
SCHEDULE OF EXPENDITURES OF FEDERAL AWARDS (Concluded)
YEAR ENDED JUNE 30, 2013
Federal Grantor
Program Title
U.S. Department of Education
Indirect Program - Passed through
New York State Department of Education -
21st Century Community Learning Center 84.287 1,289,140
U.S. Department of Health and Human Services
Direct Program -
Drug - Free Communities Support Program Grants 93.276 $ 116,925
Indirect Programs - Passed through
Westchester County:
Aging Cluster:
Aging - Title III - Part B - Grants for Supportive
Services and Senior Centers 93.044 16,566
Aging - Title III - Part C - Nutrition Services 93.045 35,780
Subtotal Aging Cluster 52,346
Total U.S. Department of Health and Human Services 169,271
U.S. Department of Justice
Direct Programs:
Grants to Encourage Arrest Policies and
Enforcement of Protection Orders Program 16.590 38,713
Edward Byrne Memorial Justice Assistance Grant Program 16.738 3,000
Public Safety Partnership and
Community Policing Grant 16.710 19,115
Total U.S. Department of Justice 60,828
Total Expenditures of Federal Awards $ 9,725,052
(1) Catalog of Federal Domestic Assistance Number
The accompanying notes are an integral part of this schedule.
Number (1) Expenditures
Federal Federal
CFDA Program
146
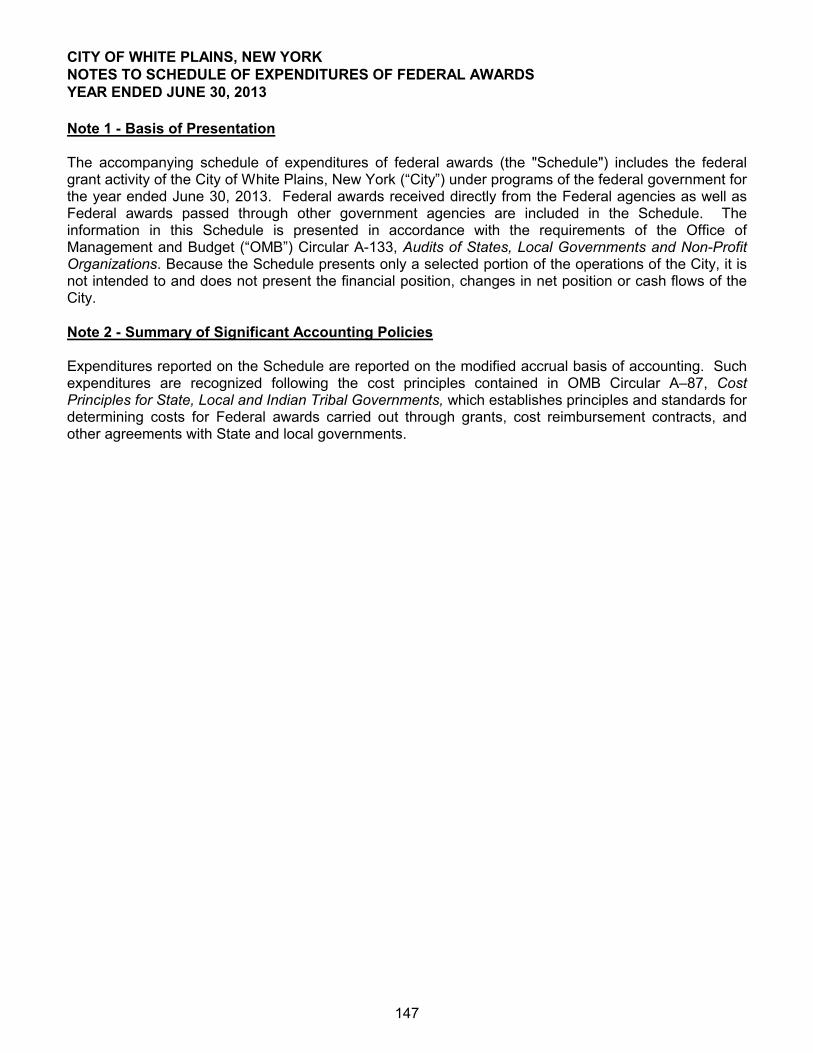
CITY OF WHITE PLAINS, NEW YORKNOTES TO SCHEDULE OF EXPENDITURES OF FEDERAL AWARDSYEAR ENDED JUNE 30, 2013
Note 1 - Basis of Presentation
The accompanying schedule of expenditures of federal awards (the "Schedule") includes the federal grant activity of the City of White Plains, New York (“City”) under programs of the federal government for the year ended June 30, 2013. Federal awards received directly from the Federal agencies as well as Federal awards passed through other government agencies are included in the Schedule. The information in this Schedule is presented in accordance with the requirements of the Office of Management and Budget (“OMB”) Circular A-133, Audits of States, Local Governments and Non-Profit Organizations. Because the Schedule presents only a selected portion of the operations of the City, it is not intended to and does not present the financial position, changes in net position or cash flows of the City.
Note 2 - Summary of Significant Accounting Policies
Expenditures reported on the Schedule are reported on the modified accrual basis of accounting. Such expenditures are recognized following the cost principles contained in OMB Circular A–87, Cost Principles for State, Local and Indian Tribal Governments, which establishes principles and standards for determining costs for Federal awards carried out through grants, cost reimbursement contracts, and other agreements with State and local governments.
147

CITY OF WHITE PLAINS, NEW YORKSUMMARY SCHEDULE OF PRIOR AUDIT FINDINGSYEAR ENDED JUNE 30, 2013
None
148

CITY OF WHITE PLAINS, NEW YORKSCHEDULE OF FINDINGS AND QUESTIONED COSTSYEAR ENDED JUNE 30, 2013
Section I - Summary of Auditors’ Results
Financial Statements
Type of auditors’ report issued Unmodified
Internal control over financial reporting: Material weakness(es) identified Yes X No Significant deficiency(ies) identified? Yes X None reported
Noncompliance material to financialstatements noted? Yes X No
Federal Awards
Internal control over major programs: Material weakness(es) identified? Yes X No Significant deficiency(ies) identified? Yes X None reported
Type of auditors’ report issued on compliance for major programs Unmodified
Any audit findings disclosed that are required to be reported in accordance with Section 510(a) of Circular A-133? Yes X No
Identification of major programs:
CFDA Number(s) Name of Federal Program or Cluster
14.218 Community Development Block Grants97.036 Disaster Grants – Public Assistance
Dollar threshold used to distinguish
between Type A and Type B programs: $300,000
Auditee qualified as low-risk auditee? X Yes No
149
CITY OF WHITE PLAINS, NEW YORKSCHEDULE OF FINDINGS AND QUESTIONED COSTS (CONCLUDED)YEAR ENDED JUNE 30, 2013
Section II - Financial Statement Findings
None
Section III - Federal Award Findings and Questioned Costs
None
150
