the chameleon guitar
TRANSCRIPT
This article appeared in a journal published by Elsevier. The attachedcopy is furnished to the author for internal non-commercial researchand education use, including for instruction at the authors institution
and sharing with colleagues.
Other uses, including reproduction and distribution, or selling orlicensing copies, or posting to personal, institutional or third party
websites are prohibited.
In most cases authors are permitted to post their version of thearticle (e.g. in Word or Tex form) to their personal website orinstitutional repository. Authors requiring further information
regarding Elsevier’s archiving and manuscript policies areencouraged to visit:
http://www.elsevier.com/copyright
Author's personal copy
A platform for manipulation and examination of the acoustic guitar:The Chameleon Guitar
Amit Zoran a,⇑, Stephen Welch b, William D. Hunt c
a MIT Media Lab, Office E14-548, 75 Amherst Street, Cambridge, MA 02139-4307, United Statesb Environmental Engineering, University of California, Berkeley, CA, United Statesc School of Electrical and Computer Engineering, Georgia Institute of Technology, GA, United States
a r t i c l e i n f o
Article history:Received 21 March 2011Received in revised form 10 October 2011Accepted 11 October 2011Available online 5 November 2011
Keyword:Guitar resonator
a b s t r a c t
A platform for manipulation and examination the acoustic guitar is presented, based on a novel guitardesign – the Chameleon Guitar – featuring a replaceable acoustic resonator functioning as the sound-board of the instrument. The goal of the design process is to create a tone as sonically close to that ofa traditional guitar as possible, while maintaining an easily replaceable soundboard. An iterative, datadriven approach was used, each design step coming under examination from one or more measurementtools: finite-element method, acoustic impulse testing, and laser vibrometry. Ideal resonator geometry,bridge location, and piezoelectric sensor positions were determined. The finished instrument was thenexamined with laser vibrometry to confirm earlier results, evaluate the behavior and chosen sensor posi-tions for various tonewoods, and examine the acoustic effects of adding sensors and wax finish. The con-clusions drawn are diverse and point to the significance of attention to detail in each step of instrumentconstruction. For example, when changing instrument material from one softwood to another, ideal loca-tions for piezoelectric sensors are subject to change. We conclude that detailed acoustic analysis can sig-nificantly aid in the construction of new instruments by quantifying the impact of instrument geometryand material properties.
� 2011 Elsevier Ltd. All rights reserved.
1. Introduction
1.1. General: the method
The acoustic guitar is one of the most popular instruments inuse today. While modern acoustic tools and digital technologieshave revolutionized much of the industry surrounding the instru-ment, the design of the acoustic guitar itself has remained largelyunchanged. Today, we can explain much of the acoustic behaviorof guitars [1], create detailed simulations [2], and quantify the var-iability between different models, wood, and construction qualities[3]. Still, little has been done to re-design the instrument in orderto give new scientific tools to the luthier, or new acoustic interfacesto the player.
In this paper, we present a method for manipulation and exam-ination the acoustic behavior of the guitar, implemented and eval-uated on the Chameleon Guitar (currently for research purposesonly). The method presented centers around two fundamental ele-ments: (1) a novel guitar design allowing the fast replacement of asmall acoustic resonator that serves as the soundboard of theinstrument, (2) methods for detecting the resonator’s low fre-
quency modes of vibration and defining ideal location candidatesfor piezoelectric sensors. This two-pronged approach aims to cre-ate a new instruments allowing more flexibility in player tone con-trol and luthier design capability than a traditional acoustic guitarwhile preserving the expressivity and uniqueness of tone of anacoustic instrument. Further, this flexibility becomes a part ofthe design process. The relatively low cost and short time requiredto make substantial variations to the much of the instrumentdesign allows for a design process that is data driven, unlike tradi-tional luthiery. This iterative process will be the focus of much ofthe work presented here: moving sensors, changing soundboardmaterial, adding wax finish, and even swapping between geomet-rically identical resonators cut from the same board result in datathat informs and directs the design process.
Finally, the scope of this work extends beyond acoustics. Thesignal processing of the captured sensor data to achieve the desiredoutput signal, together with a deeper discussion of the conceptualmotivation for the work, and influences from other fields are pre-sented in Zoran and Paradiso [4].
The remainder of this section is devoted the Chameleon Guitardesign, background and related work are discussed in Section 2,details of the design process in Section 3, results from the testingof the completed instrument in Section 4, and we conclude in Sec-tion 5.
0003-682X/$ - see front matter � 2011 Elsevier Ltd. All rights reserved.doi:10.1016/j.apacoust.2011.10.004
⇑ Corresponding author. Tel.: +1 857 445 5179.E-mail address: [email protected] (A. Zoran).
Applied Acoustics 73 (2012) 338–347
Contents lists available at SciVerse ScienceDirect
Applied Acoustics
journal homepage: www.elsevier .com/locate /apacoust
Author's personal copy
1.2. The Chameleon Guitar: a new approach for guitar design
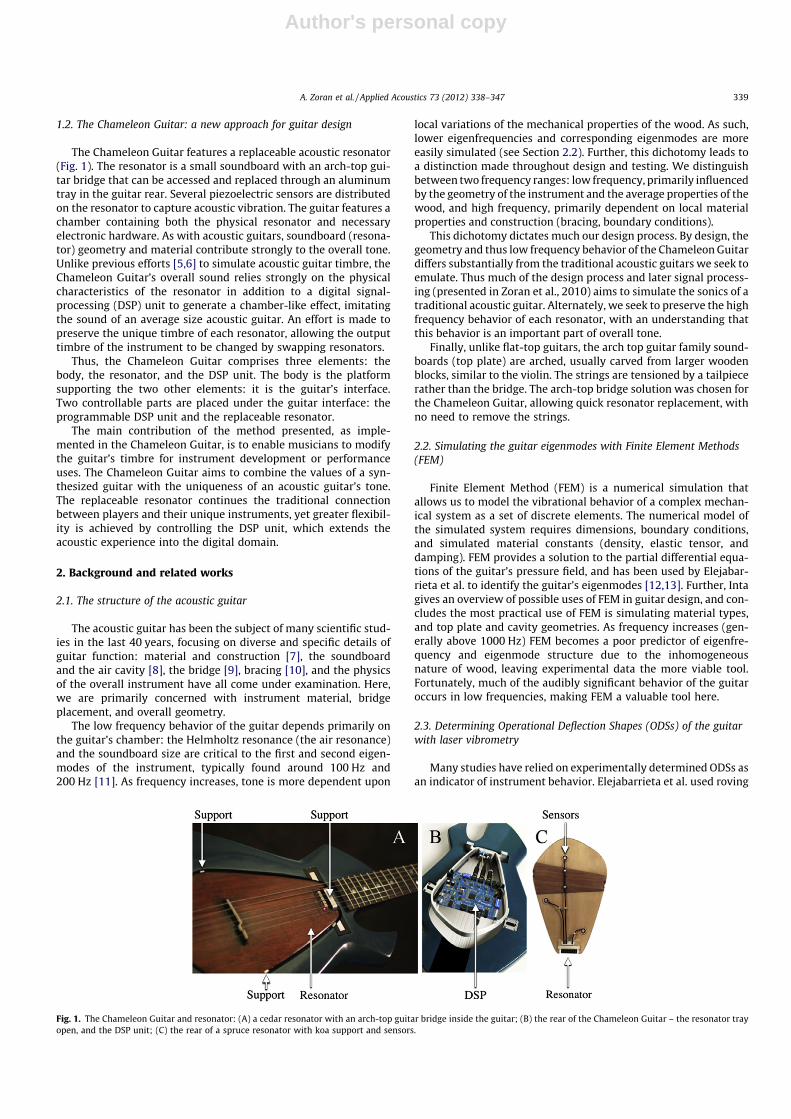
The Chameleon Guitar features a replaceable acoustic resonator(Fig. 1). The resonator is a small soundboard with an arch-top gui-tar bridge that can be accessed and replaced through an aluminumtray in the guitar rear. Several piezoelectric sensors are distributedon the resonator to capture acoustic vibration. The guitar features achamber containing both the physical resonator and necessaryelectronic hardware. As with acoustic guitars, soundboard (resona-tor) geometry and material contribute strongly to the overall tone.Unlike previous efforts [5,6] to simulate acoustic guitar timbre, theChameleon Guitar’s overall sound relies strongly on the physicalcharacteristics of the resonator in addition to a digital signal-processing (DSP) unit to generate a chamber-like effect, imitatingthe sound of an average size acoustic guitar. An effort is made topreserve the unique timbre of each resonator, allowing the outputtimbre of the instrument to be changed by swapping resonators.
Thus, the Chameleon Guitar comprises three elements: thebody, the resonator, and the DSP unit. The body is the platformsupporting the two other elements: it is the guitar’s interface.Two controllable parts are placed under the guitar interface: theprogrammable DSP unit and the replaceable resonator.
The main contribution of the method presented, as imple-mented in the Chameleon Guitar, is to enable musicians to modifythe guitar’s timbre for instrument development or performanceuses. The Chameleon Guitar aims to combine the values of a syn-thesized guitar with the uniqueness of an acoustic guitar’s tone.The replaceable resonator continues the traditional connectionbetween players and their unique instruments, yet greater flexibil-ity is achieved by controlling the DSP unit, which extends theacoustic experience into the digital domain.
2. Background and related works
2.1. The structure of the acoustic guitar
The acoustic guitar has been the subject of many scientific stud-ies in the last 40 years, focusing on diverse and specific details ofguitar function: material and construction [7], the soundboardand the air cavity [8], the bridge [9], bracing [10], and the physicsof the overall instrument have all come under examination. Here,we are primarily concerned with instrument material, bridgeplacement, and overall geometry.
The low frequency behavior of the guitar depends primarily onthe guitar’s chamber: the Helmholtz resonance (the air resonance)and the soundboard size are critical to the first and second eigen-modes of the instrument, typically found around 100 Hz and200 Hz [11]. As frequency increases, tone is more dependent upon
local variations of the mechanical properties of the wood. As such,lower eigenfrequencies and corresponding eigenmodes are moreeasily simulated (see Section 2.2). Further, this dichotomy leads toa distinction made throughout design and testing. We distinguishbetween two frequency ranges: low frequency, primarily influencedby the geometry of the instrument and the average properties of thewood, and high frequency, primarily dependent on local materialproperties and construction (bracing, boundary conditions).
This dichotomy dictates much our design process. By design, thegeometry and thus low frequency behavior of the Chameleon Guitardiffers substantially from the traditional acoustic guitars we seek toemulate. Thus much of the design process and later signal process-ing (presented in Zoran et al., 2010) aims to simulate the sonics of atraditional acoustic guitar. Alternately, we seek to preserve the highfrequency behavior of each resonator, with an understanding thatthis behavior is an important part of overall tone.
Finally, unlike flat-top guitars, the arch top guitar family sound-boards (top plate) are arched, usually carved from larger woodenblocks, similar to the violin. The strings are tensioned by a tailpiecerather than the bridge. The arch-top bridge solution was chosen forthe Chameleon Guitar, allowing quick resonator replacement, withno need to remove the strings.
2.2. Simulating the guitar eigenmodes with Finite Element Methods(FEM)
Finite Element Method (FEM) is a numerical simulation thatallows us to model the vibrational behavior of a complex mechan-ical system as a set of discrete elements. The numerical model ofthe simulated system requires dimensions, boundary conditions,and simulated material constants (density, elastic tensor, anddamping). FEM provides a solution to the partial differential equa-tions of the guitar’s pressure field, and has been used by Elejabar-rieta et al. to identify the guitar’s eigenmodes [12,13]. Further, Intagives an overview of possible uses of FEM in guitar design, and con-cludes the most practical use of FEM is simulating material types,and top plate and cavity geometries. As frequency increases (gen-erally above 1000 Hz) FEM becomes a poor predictor of eigenfre-quency and eigenmode structure due to the inhomogeneousnature of wood, leaving experimental data the more viable tool.Fortunately, much of the audibly significant behavior of the guitaroccurs in low frequencies, making FEM a valuable tool here.
2.3. Determining Operational Deflection Shapes (ODSs) of the guitarwith laser vibrometry
Many studies have relied on experimentally determined ODSs asan indicator of instrument behavior. Elejabarrieta et al. used roving
Fig. 1. The Chameleon Guitar and resonator: (A) a cedar resonator with an arch-top guitar bridge inside the guitar; (B) the rear of the Chameleon Guitar – the resonator trayopen, and the DSP unit; (C) the rear of a spruce resonator with koa support and sensors.
A. Zoran et al. / Applied Acoustics 73 (2012) 338–347 339

Author's personal copy
hammer/accelerometer techniques, Jansson [14] and Rossing [15]used TV holography, and Griffin et al. [16] and Bissinger and Oliver[17] used doppler laser vibrometry in studying guitars and otherstringed instruments. Further, a number of methods of excitationfor the instrument under test have arisen. Much work relies on im-pulse excitation via impact hammer, while electronic methods haveexist including Rossing’s work with acoustic excitation via loud-speaker, and excitation via permanent magnet attached to thesoundboard and driven by electromagnet, and Jansson’s work withmechanical excitation via electromagnetic shaker. Further, severalsignal types have been successfully used to drive electronic formsof excitation including: frequency sweeps, band limited whitenoise, and sinusoidal excitation. Choice of excitation method andsignal varies with the research goals of each work.
Here, in an effort to identify and map the dominant ODSs of theChameleon Guitar while minimally disturbing the instrument, theauthors have elected to use laser vibrometry to record the surfacevibration of the guitar while the instrument is excited acousticallyvia loudspeaker driven by a frequency sweep. The experimentallydetermined ODSs were then used to define the exact sensor loca-tions and analyze variations in resonator behavior.
3. Procedure
3.1. Overall approach
As the implementation of our method proposed, it was impera-tive that the Chameleon Guitar function physically as detailed inSection 1.2, while performing as sonically close to a traditionalacoustic guitar as possible. To meet these design criterion, the Cha-meleon Guitar needed to: allow for the quick replacement of anacoustic resonator, compensate as effectively as possible for itssmall size and lack of cavity, and allow for a minimal number of sen-sors to capture a large amount of low frequency information. Thedesign process and tools needed to achieve these goals are presentedin Fig. 2. As the figure shows, a rather linear approach to design waschosen, informed by the natural signal path of the instrument, andbeginning with an assumed ideal resonator geometry and supportsystem, determined by FEM. The position of the bridge is then takeninto account, as the natural exciter of the resonator.
Following resonator design, the laser vibrometry is used to con-firm FEM results and determine ideal sensor positions. An array of
ceramic piezoelectric sensors, located in various positions on theresonator, capture substantially different combinations of the res-onator’s modes of vibration, therefore we expect the location ofeach sensor to play a role in the overall timbre of the ChameleonGuitar.
3.2. Resonator geometry and boundary conditions
Due to ergonomic constraints (such as the ease of replacing res-onators), the resonator’s surface area (A = 246 cm2), was chosen tobe 25% of Yamaha FG330 acoustic guitar soundboard, 985 cm2. In atypical acoustic guitar the lowest two eigenmodes appear around100 Hz and 200 Hz. The goal in resonator design was to compen-sate for the small resonator size, by lowering the resonator’seigenfrequencies.
Various resonator shapes were simulated, using FEM imple-mented by Comsol Multiphysics software (Solid, Stress–Strainsection of the Structural Mechanics module), assuming a flat2.5 mm Sitka Spruce resonator, with mechanical properties as pre-sented in Table 1, based on Green at el. [18]. The orientation of thewood grain in the simulations conducted and resonators con-structed is always parallel to the length of the instrument and ver-tical as shown in figures. The CAD model of the tested resonatorwas first build in Rhino 3D modeling software, and then importedinto the Comsol Multiphysics environment, where a mesh struc-ture was generated with a normal mesh size (number of elementsvaries from 10,000 to 15,000). The boundary conditions were de-fined as shown in Fig. 3, and the system was solved for eigenvalues.
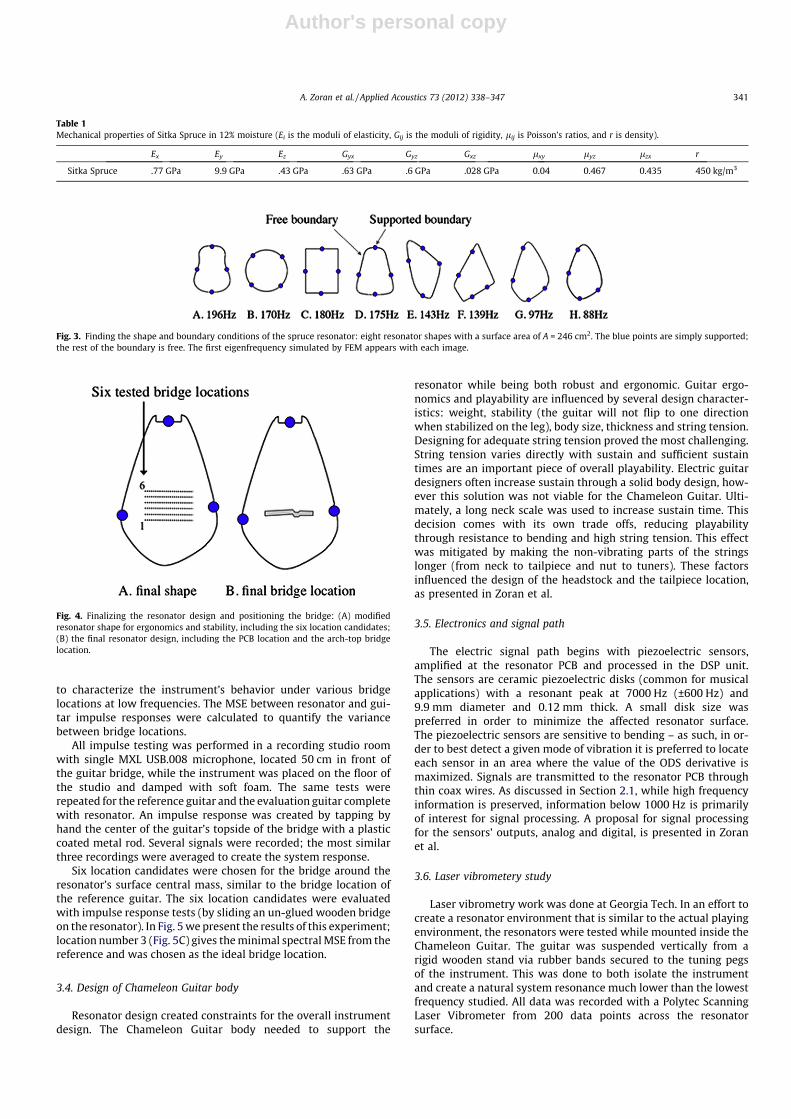
A free boundary condition allows for the lowest possible reso-nant frequency for a given resonator, while a simply supportedboundary and fixed boundary yield respectively higher resonantfrequencies. As such, design steps were taken to maximize thelength of the resonator’s free boundary, and to use simply supportedlegs instead of rigid ones. In order to identify the resonator shape forthe lowest possible eigenfrequencies for a given surface area A, var-ious shapes were simulated (Fig. 3). In the first iteration, the shapecandidates have a mixed boundary condition: a largely free bound-ary with the exception of four support points. The shapes were mod-ified slightly between simulations in the search for a pseudo optimalshape. As part of this iterative, brute-force process, the support loca-tions were moved. Shape H in Fig. 3 was selected due to its lowerfirst simulated eigenfrequency (88 Hz). Note that this value is anevaluation criteria, and not an estimated behavior of the resonatorin real conditions: the described design process assumed a flat,homogenous resonator, with no bridge or string load.
The resonators were built, tested, and embedded into a guitarplatform (an evaluation guitar) with string loading and with thebridge located around the resonator’s center mass. In order tostabilize the resonator and prevent it from twisting under strings’load, the resonator’s shape and support points were modified– resulting in the final shape of the resonator, with only 3 supports(Fig. 4). The resonator PCB, which will be used to pre-amplify thesensors’ signals and as an electrical connection unit, was locatedon the top support. A traditional arch-top guitar bridge was used.Positioning the bridge is discussed in Section 3.3, and the position-ing of the sensors is discussed in Section 3.6.
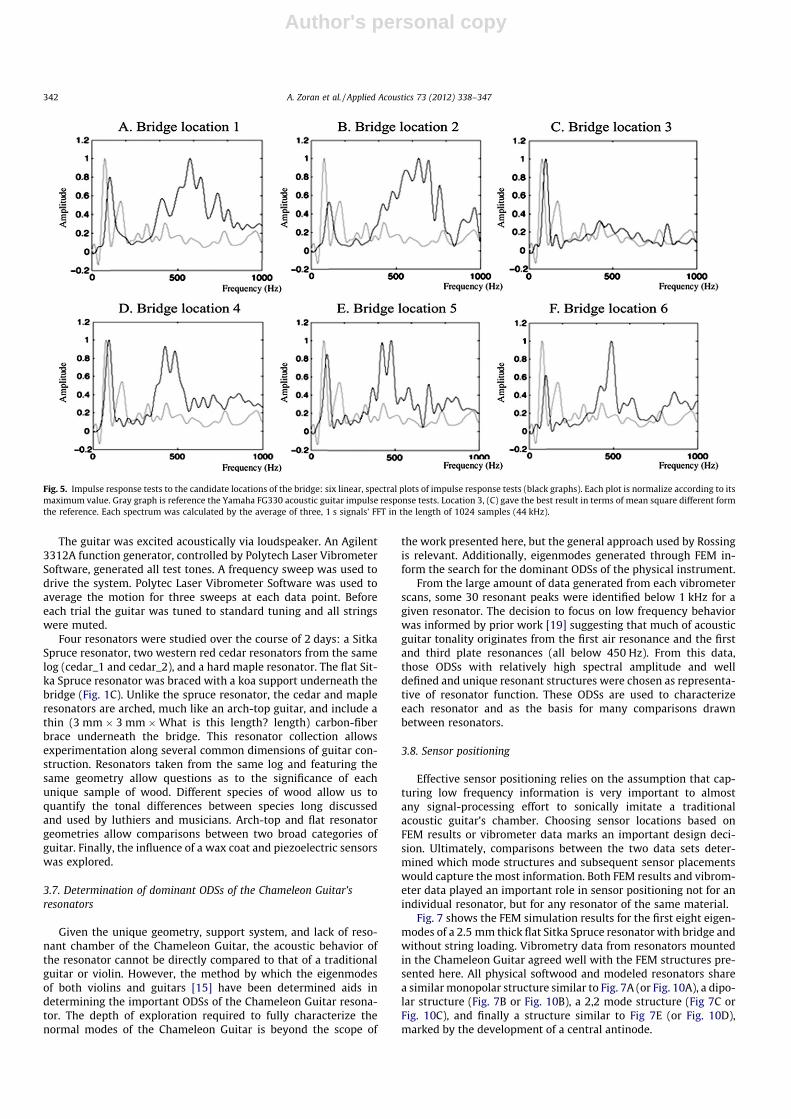
3.3. Positioning the bridge
With the goal of creating an instrument as sonically close to atraditional acoustic guitar as possible, experiments were con-ducted in which the impulse response (below 1000 Hz) of a resona-tor with a given bridge location was compared to the impulseresponse of a reference acoustic guitar, a Yamaha FG330. Asdetailed by Inta, an acoustic guitar can be approximated as a linearsystem at low amplitudes. Impulse testing was deemed acceptable
Fig. 2. The main steps of the research presented and the technology used for eachstep.
340 A. Zoran et al. / Applied Acoustics 73 (2012) 338–347
Author's personal copy
to characterize the instrument’s behavior under various bridgelocations at low frequencies. The MSE between resonator and gui-tar impulse responses were calculated to quantify the variancebetween bridge locations.
All impulse testing was performed in a recording studio roomwith single MXL USB.008 microphone, located 50 cm in front ofthe guitar bridge, while the instrument was placed on the floor ofthe studio and damped with soft foam. The same tests wererepeated for the reference guitar and the evaluation guitar completewith resonator. An impulse response was created by tapping byhand the center of the guitar’s topside of the bridge with a plasticcoated metal rod. Several signals were recorded; the most similarthree recordings were averaged to create the system response.
Six location candidates were chosen for the bridge around theresonator’s surface central mass, similar to the bridge location ofthe reference guitar. The six location candidates were evaluatedwith impulse response tests (by sliding an un-glued wooden bridgeon the resonator). In Fig. 5 we present the results of this experiment;location number 3 (Fig. 5C) gives the minimal spectral MSE from thereference and was chosen as the ideal bridge location.
3.4. Design of Chameleon Guitar body
Resonator design created constraints for the overall instrumentdesign. The Chameleon Guitar body needed to support the
resonator while being both robust and ergonomic. Guitar ergo-nomics and playability are influenced by several design character-istics: weight, stability (the guitar will not flip to one directionwhen stabilized on the leg), body size, thickness and string tension.Designing for adequate string tension proved the most challenging.String tension varies directly with sustain and sufficient sustaintimes are an important piece of overall playability. Electric guitardesigners often increase sustain through a solid body design, how-ever this solution was not viable for the Chameleon Guitar. Ulti-mately, a long neck scale was used to increase sustain time. Thisdecision comes with its own trade offs, reducing playabilitythrough resistance to bending and high string tension. This effectwas mitigated by making the non-vibrating parts of the stringslonger (from neck to tailpiece and nut to tuners). These factorsinfluenced the design of the headstock and the tailpiece location,as presented in Zoran et al.
3.5. Electronics and signal path
The electric signal path begins with piezoelectric sensors,amplified at the resonator PCB and processed in the DSP unit.The sensors are ceramic piezoelectric disks (common for musicalapplications) with a resonant peak at 7000 Hz (±600 Hz) and9.9 mm diameter and 0.12 mm thick. A small disk size waspreferred in order to minimize the affected resonator surface.The piezoelectric sensors are sensitive to bending – as such, in or-der to best detect a given mode of vibration it is preferred to locateeach sensor in an area where the value of the ODS derivative ismaximized. Signals are transmitted to the resonator PCB throughthin coax wires. As discussed in Section 2.1, while high frequencyinformation is preserved, information below 1000 Hz is primarilyof interest for signal processing. A proposal for signal processingfor the sensors’ outputs, analog and digital, is presented in Zoranet al.
3.6. Laser vibrometery study
Laser vibrometry work was done at Georgia Tech. In an effort tocreate a resonator environment that is similar to the actual playingenvironment, the resonators were tested while mounted inside theChameleon Guitar. The guitar was suspended vertically from arigid wooden stand via rubber bands secured to the tuning pegsof the instrument. This was done to both isolate the instrumentand create a natural system resonance much lower than the lowestfrequency studied. All data was recorded with a Polytec ScanningLaser Vibrometer from 200 data points across the resonatorsurface.
Fig. 3. Finding the shape and boundary conditions of the spruce resonator: eight resonator shapes with a surface area of A = 246 cm2. The blue points are simply supported;the rest of the boundary is free. The first eigenfrequency simulated by FEM appears with each image.
Fig. 4. Finalizing the resonator design and positioning the bridge: (A) modifiedresonator shape for ergonomics and stability, including the six location candidates;(B) the final resonator design, including the PCB location and the arch-top bridgelocation.
Table 1Mechanical properties of Sitka Spruce in 12% moisture (Ei is the moduli of elasticity, Gij is the moduli of rigidity, lij is Poisson’s ratios, and r is density).
Ex Ey Ez Gyx Gyz Gxz lxy lyz lzx r
Sitka Spruce .77 GPa 9.9 GPa .43 GPa .63 GPa .6 GPa .028 GPa 0.04 0.467 0.435 450 kg/m3
A. Zoran et al. / Applied Acoustics 73 (2012) 338–347 341
Author's personal copy
The guitar was excited acoustically via loudspeaker. An Agilent3312A function generator, controlled by Polytech Laser VibrometerSoftware, generated all test tones. A frequency sweep was used todrive the system. Polytec Laser Vibrometer Software was used toaverage the motion for three sweeps at each data point. Beforeeach trial the guitar was tuned to standard tuning and all stringswere muted.
Four resonators were studied over the course of 2 days: a SitkaSpruce resonator, two western red cedar resonators from the samelog (cedar_1 and cedar_2), and a hard maple resonator. The flat Sit-ka Spruce resonator was braced with a koa support underneath thebridge (Fig. 1C). Unlike the spruce resonator, the cedar and mapleresonators are arched, much like an arch-top guitar, and include athin (3 mm � 3 mm �What is this length? length) carbon-fiberbrace underneath the bridge. This resonator collection allowsexperimentation along several common dimensions of guitar con-struction. Resonators taken from the same log and featuring thesame geometry allow questions as to the significance of eachunique sample of wood. Different species of wood allow us toquantify the tonal differences between species long discussedand used by luthiers and musicians. Arch-top and flat resonatorgeometries allow comparisons between two broad categories ofguitar. Finally, the influence of a wax coat and piezoelectric sensorswas explored.
3.7. Determination of dominant ODSs of the Chameleon Guitar’sresonators
Given the unique geometry, support system, and lack of reso-nant chamber of the Chameleon Guitar, the acoustic behavior ofthe resonator cannot be directly compared to that of a traditionalguitar or violin. However, the method by which the eigenmodesof both violins and guitars [15] have been determined aids indetermining the important ODSs of the Chameleon Guitar resona-tor. The depth of exploration required to fully characterize thenormal modes of the Chameleon Guitar is beyond the scope of
the work presented here, but the general approach used by Rossingis relevant. Additionally, eigenmodes generated through FEM in-form the search for the dominant ODSs of the physical instrument.
From the large amount of data generated from each vibrometerscans, some 30 resonant peaks were identified below 1 kHz for agiven resonator. The decision to focus on low frequency behaviorwas informed by prior work [19] suggesting that much of acousticguitar tonality originates from the first air resonance and the firstand third plate resonances (all below 450 Hz). From this data,those ODSs with relatively high spectral amplitude and welldefined and unique resonant structures were chosen as representa-tive of resonator function. These ODSs are used to characterizeeach resonator and as the basis for many comparisons drawnbetween resonators.
3.8. Sensor positioning
Effective sensor positioning relies on the assumption that cap-turing low frequency information is very important to almostany signal-processing effort to sonically imitate a traditionalacoustic guitar’s chamber. Choosing sensor locations based onFEM results or vibrometer data marks an important design deci-sion. Ultimately, comparisons between the two data sets deter-mined which mode structures and subsequent sensor placementswould capture the most information. Both FEM results and vibrom-eter data played an important role in sensor positioning not for anindividual resonator, but for any resonator of the same material.
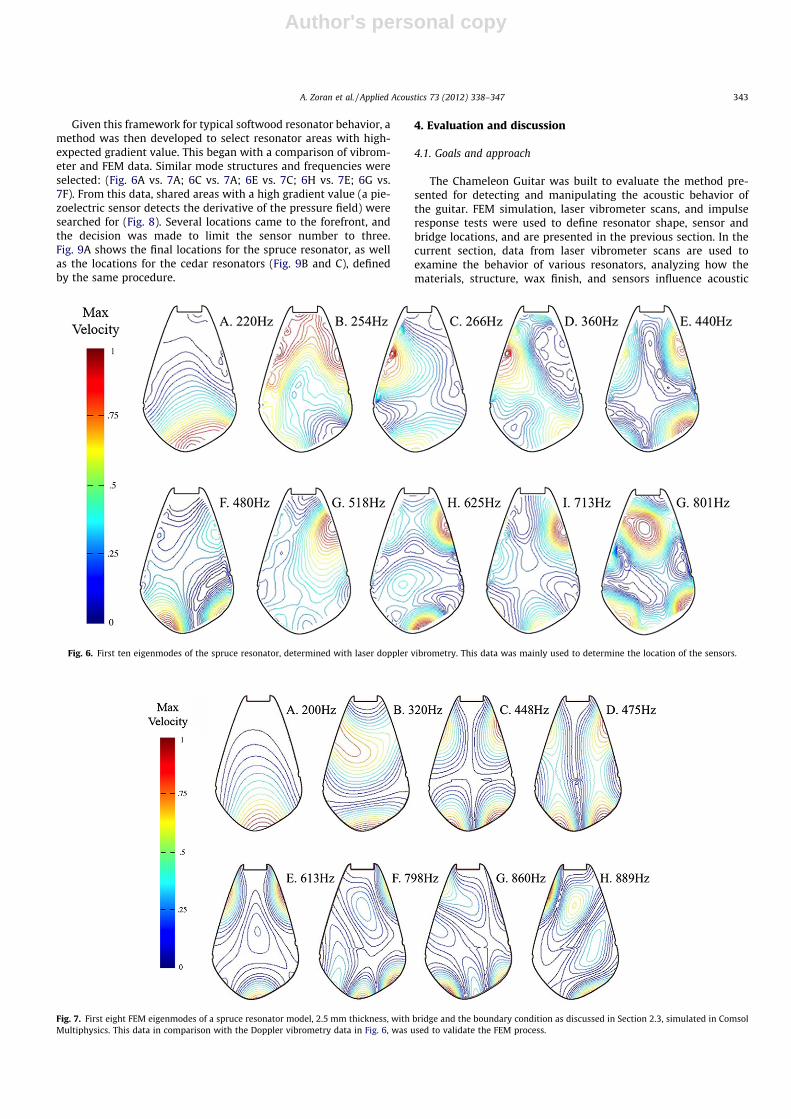
Fig. 7 shows the FEM simulation results for the first eight eigen-modes of a 2.5 mm thick flat Sitka Spruce resonator with bridge andwithout string loading. Vibrometry data from resonators mountedin the Chameleon Guitar agreed well with the FEM structures pre-sented here. All physical softwood and modeled resonators sharea similar monopolar structure similar to Fig. 7A (or Fig. 10A), a dipo-lar structure (Fig. 7B or Fig. 10B), a 2,2 mode structure (Fig 7C orFig. 10C), and finally a structure similar to Fig 7E (or Fig. 10D),marked by the development of a central antinode.
Fig. 5. Impulse response tests to the candidate locations of the bridge: six linear, spectral plots of impulse response tests (black graphs). Each plot is normalize according to itsmaximum value. Gray graph is reference the Yamaha FG330 acoustic guitar impulse response tests. Location 3, (C) gave the best result in terms of mean square different formthe reference. Each spectrum was calculated by the average of three, 1 s signals’ FFT in the length of 1024 samples (44 kHz).
342 A. Zoran et al. / Applied Acoustics 73 (2012) 338–347
Author's personal copy
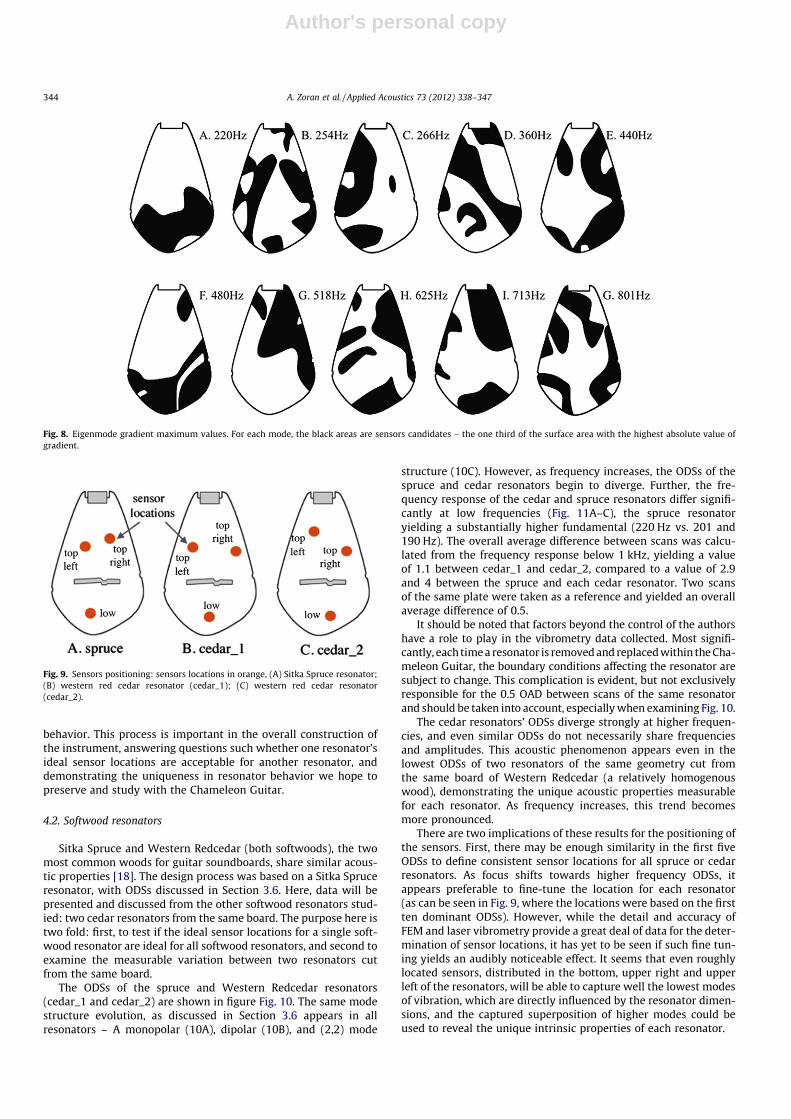
Given this framework for typical softwood resonator behavior, amethod was then developed to select resonator areas with high-expected gradient value. This began with a comparison of vibrom-eter and FEM data. Similar mode structures and frequencies wereselected: (Fig. 6A vs. 7A; 6C vs. 7A; 6E vs. 7C; 6H vs. 7E; 6G vs.7F). From this data, shared areas with a high gradient value (a pie-zoelectric sensor detects the derivative of the pressure field) weresearched for (Fig. 8). Several locations came to the forefront, andthe decision was made to limit the sensor number to three.Fig. 9A shows the final locations for the spruce resonator, as wellas the locations for the cedar resonators (Fig. 9B and C), definedby the same procedure.
4. Evaluation and discussion
4.1. Goals and approach
The Chameleon Guitar was built to evaluate the method pre-sented for detecting and manipulating the acoustic behavior ofthe guitar. FEM simulation, laser vibrometer scans, and impulseresponse tests were used to define resonator shape, sensor andbridge locations, and are presented in the previous section. In thecurrent section, data from laser vibrometer scans are used toexamine the behavior of various resonators, analyzing how thematerials, structure, wax finish, and sensors influence acoustic
Fig. 7. First eight FEM eigenmodes of a spruce resonator model, 2.5 mm thickness, with bridge and the boundary condition as discussed in Section 2.3, simulated in ComsolMultiphysics. This data in comparison with the Doppler vibrometry data in Fig. 6, was used to validate the FEM process.
Fig. 6. First ten eigenmodes of the spruce resonator, determined with laser doppler vibrometry. This data was mainly used to determine the location of the sensors.
A. Zoran et al. / Applied Acoustics 73 (2012) 338–347 343
Author's personal copy
behavior. This process is important in the overall construction ofthe instrument, answering questions such whether one resonator’sideal sensor locations are acceptable for another resonator, anddemonstrating the uniqueness in resonator behavior we hope topreserve and study with the Chameleon Guitar.
4.2. Softwood resonators
Sitka Spruce and Western Redcedar (both softwoods), the twomost common woods for guitar soundboards, share similar acous-tic properties [18]. The design process was based on a Sitka Spruceresonator, with ODSs discussed in Section 3.6. Here, data will bepresented and discussed from the other softwood resonators stud-ied: two cedar resonators from the same board. The purpose here istwo fold: first, to test if the ideal sensor locations for a single soft-wood resonator are ideal for all softwood resonators, and second toexamine the measurable variation between two resonators cutfrom the same board.
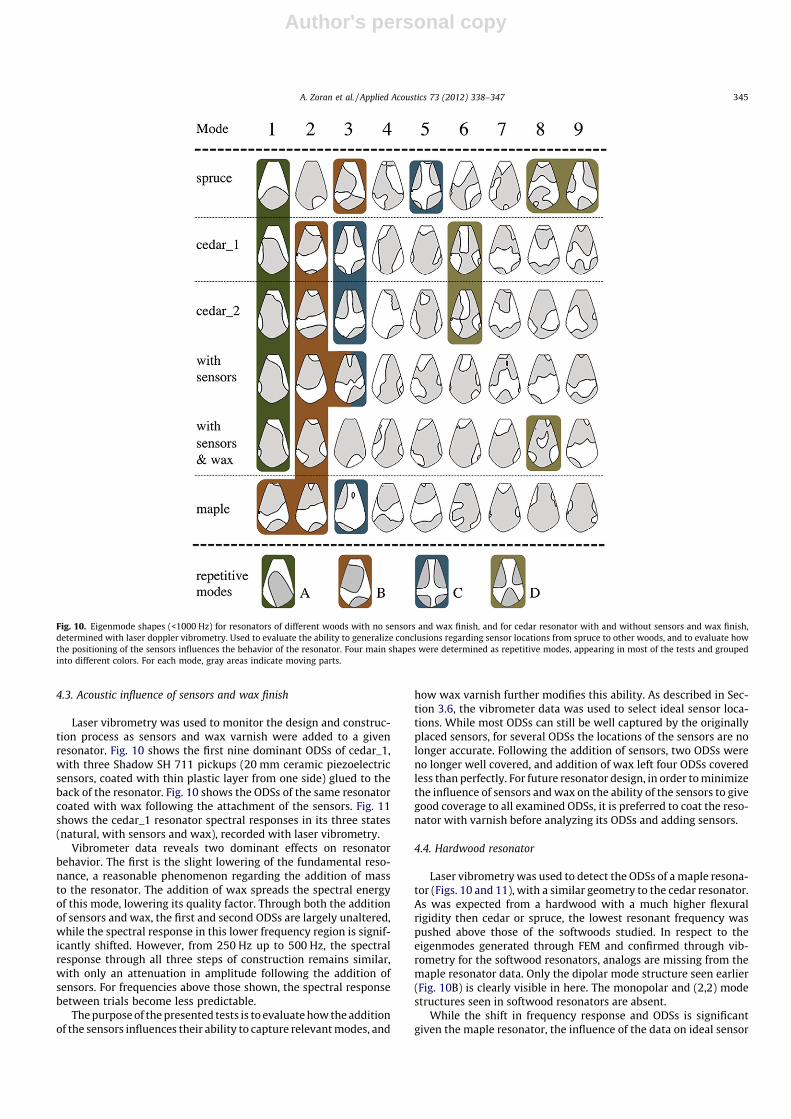
The ODSs of the spruce and Western Redcedar resonators(cedar_1 and cedar_2) are shown in figure Fig. 10. The same modestructure evolution, as discussed in Section 3.6 appears in allresonators – A monopolar (10A), dipolar (10B), and (2,2) mode
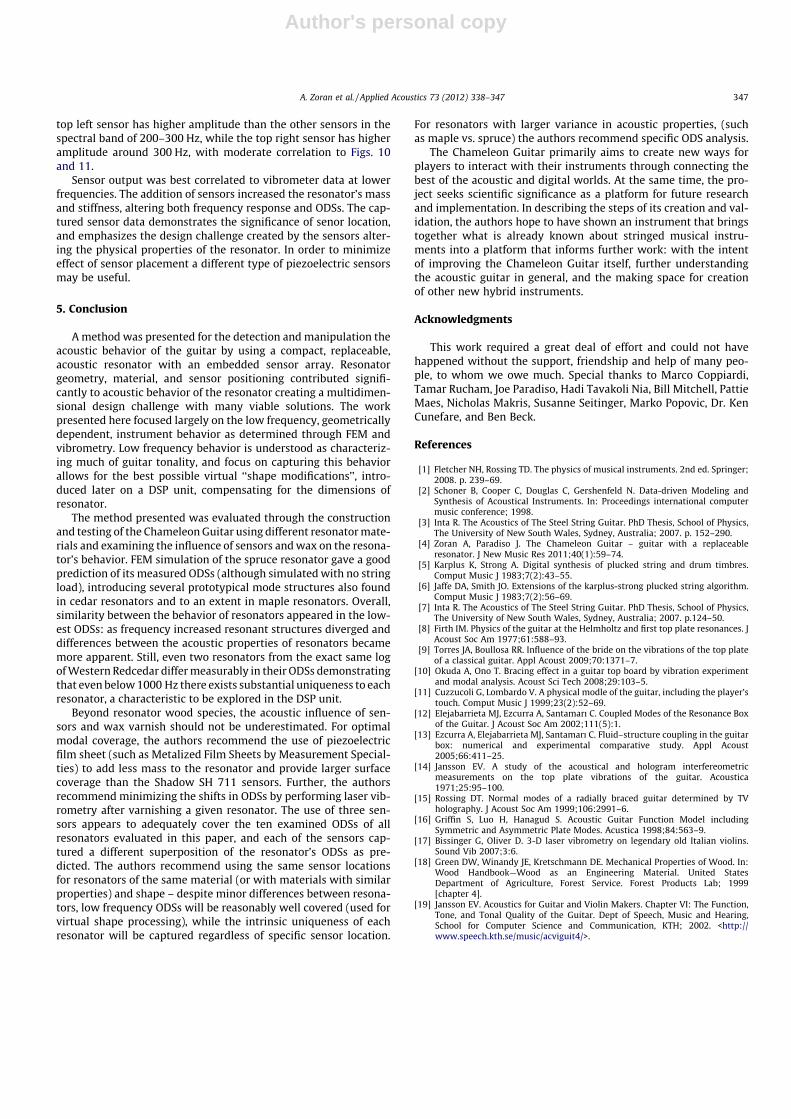
structure (10C). However, as frequency increases, the ODSs of thespruce and cedar resonators begin to diverge. Further, the fre-quency response of the cedar and spruce resonators differ signifi-cantly at low frequencies (Fig. 11A–C), the spruce resonatoryielding a substantially higher fundamental (220 Hz vs. 201 and190 Hz). The overall average difference between scans was calcu-lated from the frequency response below 1 kHz, yielding a valueof 1.1 between cedar_1 and cedar_2, compared to a value of 2.9and 4 between the spruce and each cedar resonator. Two scansof the same plate were taken as a reference and yielded an overallaverage difference of 0.5.
It should be noted that factors beyond the control of the authorshave a role to play in the vibrometry data collected. Most signifi-cantly, each time a resonator is removed and replaced within the Cha-meleon Guitar, the boundary conditions affecting the resonator aresubject to change. This complication is evident, but not exclusivelyresponsible for the 0.5 OAD between scans of the same resonatorand should be taken into account, especially when examining Fig. 10.
The cedar resonators’ ODSs diverge strongly at higher frequen-cies, and even similar ODSs do not necessarily share frequenciesand amplitudes. This acoustic phenomenon appears even in thelowest ODSs of two resonators of the same geometry cut fromthe same board of Western Redcedar (a relatively homogenouswood), demonstrating the unique acoustic properties measurablefor each resonator. As frequency increases, this trend becomesmore pronounced.
There are two implications of these results for the positioning ofthe sensors. First, there may be enough similarity in the first fiveODSs to define consistent sensor locations for all spruce or cedarresonators. As focus shifts towards higher frequency ODSs, itappears preferable to fine-tune the location for each resonator(as can be seen in Fig. 9, where the locations were based on the firstten dominant ODSs). However, while the detail and accuracy ofFEM and laser vibrometry provide a great deal of data for the deter-mination of sensor locations, it has yet to be seen if such fine tun-ing yields an audibly noticeable effect. It seems that even roughlylocated sensors, distributed in the bottom, upper right and upperleft of the resonators, will be able to capture well the lowest modesof vibration, which are directly influenced by the resonator dimen-sions, and the captured superposition of higher modes could beused to reveal the unique intrinsic properties of each resonator.
Fig. 8. Eigenmode gradient maximum values. For each mode, the black areas are sensors candidates – the one third of the surface area with the highest absolute value ofgradient.
Fig. 9. Sensors positioning: sensors locations in orange, (A) Sitka Spruce resonator;(B) western red cedar resonator (cedar_1); (C) western red cedar resonator(cedar_2).
344 A. Zoran et al. / Applied Acoustics 73 (2012) 338–347
Author's personal copy
4.3. Acoustic influence of sensors and wax finish
Laser vibrometry was used to monitor the design and construc-tion process as sensors and wax varnish were added to a givenresonator. Fig. 10 shows the first nine dominant ODSs of cedar_1,with three Shadow SH 711 pickups (20 mm ceramic piezoelectricsensors, coated with thin plastic layer from one side) glued to theback of the resonator. Fig. 10 shows the ODSs of the same resonatorcoated with wax following the attachment of the sensors. Fig. 11shows the cedar_1 resonator spectral responses in its three states(natural, with sensors and wax), recorded with laser vibrometry.
Vibrometer data reveals two dominant effects on resonatorbehavior. The first is the slight lowering of the fundamental reso-nance, a reasonable phenomenon regarding the addition of massto the resonator. The addition of wax spreads the spectral energyof this mode, lowering its quality factor. Through both the additionof sensors and wax, the first and second ODSs are largely unaltered,while the spectral response in this lower frequency region is signif-icantly shifted. However, from 250 Hz up to 500 Hz, the spectralresponse through all three steps of construction remains similar,with only an attenuation in amplitude following the addition ofsensors. For frequencies above those shown, the spectral responsebetween trials become less predictable.
The purpose of the presented tests is to evaluate how the additionof the sensors influences their ability to capture relevant modes, and
how wax varnish further modifies this ability. As described in Sec-tion 3.6, the vibrometer data was used to select ideal sensor loca-tions. While most ODSs can still be well captured by the originallyplaced sensors, for several ODSs the locations of the sensors are nolonger accurate. Following the addition of sensors, two ODSs wereno longer well covered, and addition of wax left four ODSs coveredless than perfectly. For future resonator design, in order to minimizethe influence of sensors and wax on the ability of the sensors to givegood coverage to all examined ODSs, it is preferred to coat the reso-nator with varnish before analyzing its ODSs and adding sensors.
4.4. Hardwood resonator
Laser vibrometry was used to detect the ODSs of a maple resona-tor (Figs. 10 and 11), with a similar geometry to the cedar resonator.As was expected from a hardwood with a much higher flexuralrigidity then cedar or spruce, the lowest resonant frequency waspushed above those of the softwoods studied. In respect to theeigenmodes generated through FEM and confirmed through vib-rometry for the softwood resonators, analogs are missing from themaple resonator data. Only the dipolar mode structure seen earlier(Fig. 10B) is clearly visible in here. The monopolar and (2,2) modestructures seen in softwood resonators are absent.
While the shift in frequency response and ODSs is significantgiven the maple resonator, the influence of the data on ideal sensor
Fig. 10. Eigenmode shapes (<1000 Hz) for resonators of different woods with no sensors and wax finish, and for cedar resonator with and without sensors and wax finish,determined with laser doppler vibrometry. Used to evaluate the ability to generalize conclusions regarding sensor locations from spruce to other woods, and to evaluate howthe positioning of the sensors influences the behavior of the resonator. Four main shapes were determined as repetitive modes, appearing in most of the tests and groupedinto different colors. For each mode, gray areas indicate moving parts.
A. Zoran et al. / Applied Acoustics 73 (2012) 338–347 345
Author's personal copy
placement in far more relevant to the work presented here. Byevaluating the gradients of the ODSs, similar to the process in2.6, less correlation was found in the preferred locations for thesensors than with any softwood resonator or condition test (suchas adding sensors and wax). However, three sensors still give agood coverage of the first ten dominant ODSs, but a separate, spe-cific positioning process is recommended. Overall, the influence ofchanging the resonator material from spruce or cedar to maple wasmuch larger than with any other resonator modification analyzed,not just in the spectral response but also in the ODSs influencingthe positioning of the sensors.
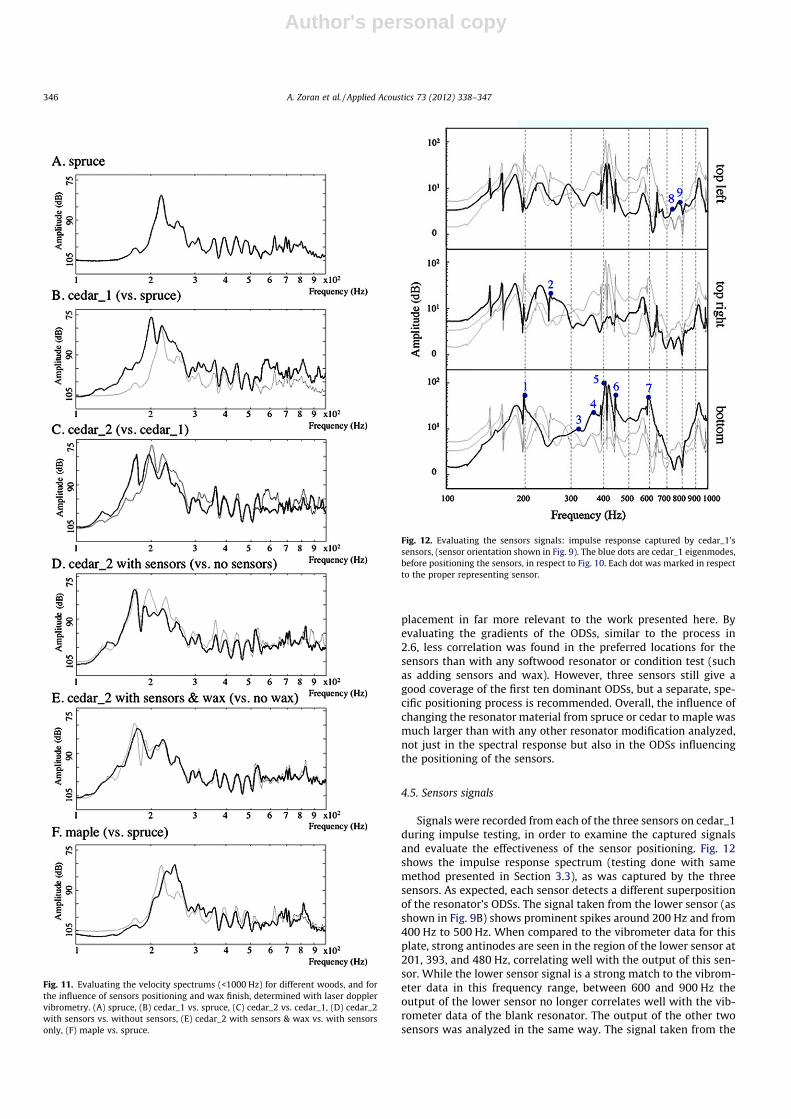
4.5. Sensors signals
Signals were recorded from each of the three sensors on cedar_1during impulse testing, in order to examine the captured signalsand evaluate the effectiveness of the sensor positioning. Fig. 12shows the impulse response spectrum (testing done with samemethod presented in Section 3.3), as was captured by the threesensors. As expected, each sensor detects a different superpositionof the resonator’s ODSs. The signal taken from the lower sensor (asshown in Fig. 9B) shows prominent spikes around 200 Hz and from400 Hz to 500 Hz. When compared to the vibrometer data for thisplate, strong antinodes are seen in the region of the lower sensor at201, 393, and 480 Hz, correlating well with the output of this sen-sor. While the lower sensor signal is a strong match to the vibrom-eter data in this frequency range, between 600 and 900 Hz theoutput of the lower sensor no longer correlates well with the vib-rometer data of the blank resonator. The output of the other twosensors was analyzed in the same way. The signal taken from the
Fig. 11. Evaluating the velocity spectrums (<1000 Hz) for different woods, and forthe influence of sensors positioning and wax finish, determined with laser dopplervibrometry. (A) spruce, (B) cedar_1 vs. spruce, (C) cedar_2 vs. cedar_1, (D) cedar_2with sensors vs. without sensors, (E) cedar_2 with sensors & wax vs. with sensorsonly, (F) maple vs. spruce.
Fig. 12. Evaluating the sensors signals: impulse response captured by cedar_1’ssensors, (sensor orientation shown in Fig. 9). The blue dots are cedar_1 eigenmodes,before positioning the sensors, in respect to Fig. 10. Each dot was marked in respectto the proper representing sensor.
346 A. Zoran et al. / Applied Acoustics 73 (2012) 338–347
Author's personal copy
top left sensor has higher amplitude than the other sensors in thespectral band of 200–300 Hz, while the top right sensor has higheramplitude around 300 Hz, with moderate correlation to Figs. 10and 11.
Sensor output was best correlated to vibrometer data at lowerfrequencies. The addition of sensors increased the resonator’s massand stiffness, altering both frequency response and ODSs. The cap-tured sensor data demonstrates the significance of senor location,and emphasizes the design challenge created by the sensors alter-ing the physical properties of the resonator. In order to minimizeeffect of sensor placement a different type of piezoelectric sensorsmay be useful.
5. Conclusion
A method was presented for the detection and manipulation theacoustic behavior of the guitar by using a compact, replaceable,acoustic resonator with an embedded sensor array. Resonatorgeometry, material, and sensor positioning contributed signifi-cantly to acoustic behavior of the resonator creating a multidimen-sional design challenge with many viable solutions. The workpresented here focused largely on the low frequency, geometricallydependent, instrument behavior as determined through FEM andvibrometry. Low frequency behavior is understood as characteriz-ing much of guitar tonality, and focus on capturing this behaviorallows for the best possible virtual ‘‘shape modifications’’, intro-duced later on a DSP unit, compensating for the dimensions ofresonator.
The method presented was evaluated through the constructionand testing of the Chameleon Guitar using different resonator mate-rials and examining the influence of sensors and wax on the resona-tor’s behavior. FEM simulation of the spruce resonator gave a goodprediction of its measured ODSs (although simulated with no stringload), introducing several prototypical mode structures also foundin cedar resonators and to an extent in maple resonators. Overall,similarity between the behavior of resonators appeared in the low-est ODSs: as frequency increased resonant structures diverged anddifferences between the acoustic properties of resonators becamemore apparent. Still, even two resonators from the exact same logof Western Redcedar differ measurably in their ODSs demonstratingthat even below 1000 Hz there exists substantial uniqueness to eachresonator, a characteristic to be explored in the DSP unit.
Beyond resonator wood species, the acoustic influence of sen-sors and wax varnish should not be underestimated. For optimalmodal coverage, the authors recommend the use of piezoelectricfilm sheet (such as Metalized Film Sheets by Measurement Special-ties) to add less mass to the resonator and provide larger surfacecoverage than the Shadow SH 711 sensors. Further, the authorsrecommend minimizing the shifts in ODSs by performing laser vib-rometry after varnishing a given resonator. The use of three sen-sors appears to adequately cover the ten examined ODSs of allresonators evaluated in this paper, and each of the sensors cap-tured a different superposition of the resonator’s ODSs as pre-dicted. The authors recommend using the same sensor locationsfor resonators of the same material (or with materials with similarproperties) and shape – despite minor differences between resona-tors, low frequency ODSs will be reasonably well covered (used forvirtual shape processing), while the intrinsic uniqueness of eachresonator will be captured regardless of specific sensor location.
For resonators with larger variance in acoustic properties, (suchas maple vs. spruce) the authors recommend specific ODS analysis.
The Chameleon Guitar primarily aims to create new ways forplayers to interact with their instruments through connecting thebest of the acoustic and digital worlds. At the same time, the pro-ject seeks scientific significance as a platform for future researchand implementation. In describing the steps of its creation and val-idation, the authors hope to have shown an instrument that bringstogether what is already known about stringed musical instru-ments into a platform that informs further work: with the intentof improving the Chameleon Guitar itself, further understandingthe acoustic guitar in general, and the making space for creationof other new hybrid instruments.
Acknowledgments
This work required a great deal of effort and could not havehappened without the support, friendship and help of many peo-ple, to whom we owe much. Special thanks to Marco Coppiardi,Tamar Rucham, Joe Paradiso, Hadi Tavakoli Nia, Bill Mitchell, PattieMaes, Nicholas Makris, Susanne Seitinger, Marko Popovic, Dr. KenCunefare, and Ben Beck.
References
[1] Fletcher NH, Rossing TD. The physics of musical instruments. 2nd ed. Springer;2008. p. 239–69.
[2] Schoner B, Cooper C, Douglas C, Gershenfeld N. Data-driven Modeling andSynthesis of Acoustical Instruments. In: Proceedings international computermusic conference; 1998.
[3] Inta R. The Acoustics of The Steel String Guitar. PhD Thesis, School of Physics,The University of New South Wales, Sydney, Australia; 2007. p. 152–290.
[4] Zoran A, Paradiso J. The Chameleon Guitar – guitar with a replaceableresonator. J New Music Res 2011;40(1):59–74.
[5] Karplus K, Strong A. Digital synthesis of plucked string and drum timbres.Comput Music J 1983;7(2):43–55.
[6] Jaffe DA, Smith JO. Extensions of the karplus-strong plucked string algorithm.Comput Music J 1983;7(2):56–69.
[7] Inta R. The Acoustics of The Steel String Guitar. PhD Thesis, School of Physics,The University of New South Wales, Sydney, Australia; 2007. p.124–50.
[8] Firth IM. Physics of the guitar at the Helmholtz and first top plate resonances. JAcoust Soc Am 1977;61:588–93.
[9] Torres JA, Boullosa RR. Influence of the bride on the vibrations of the top plateof a classical guitar. Appl Acoust 2009;70:1371–7.
[10] Okuda A, Ono T. Bracing effect in a guitar top board by vibration experimentand modal analysis. Acoust Sci Tech 2008;29:103–5.
[11] Cuzzucoli G, Lombardo V. A physical modle of the guitar, including the player’stouch. Comput Music J 1999;23(2):52–69.
[12] Elejabarrieta MJ, Ezcurra A, Santamarı C. Coupled Modes of the Resonance Boxof the Guitar. J Acoust Soc Am 2002;111(5):1.
[13] Ezcurra A, Elejabarrieta MJ, Santamarı C. Fluid–structure coupling in the guitarbox: numerical and experimental comparative study. Appl Acoust2005;66:411–25.
[14] Jansson EV. A study of the acoustical and hologram interfereometricmeasurements on the top plate vibrations of the guitar. Acoustica1971;25:95–100.
[15] Rossing DT. Normal modes of a radially braced guitar determined by TVholography. J Acoust Soc Am 1999;106:2991–6.
[16] Griffin S, Luo H, Hanagud S. Acoustic Guitar Function Model includingSymmetric and Asymmetric Plate Modes. Acustica 1998;84:563–9.
[17] Bissinger G, Oliver D. 3-D laser vibrometry on legendary old Italian violins.Sound Vib 2007;3:6.
[18] Green DW, Winandy JE, Kretschmann DE. Mechanical Properties of Wood. In:Wood Handbook—Wood as an Engineering Material. United StatesDepartment of Agriculture, Forest Service. Forest Products Lab; 1999[chapter 4].
[19] Jansson EV. Acoustics for Guitar and Violin Makers. Chapter VI: The Function,Tone, and Tonal Quality of the Guitar. Dept of Speech, Music and Hearing,School for Computer Science and Communication, KTH; 2002. <http://www.speech.kth.se/music/acviguit4/>.
A. Zoran et al. / Applied Acoustics 73 (2012) 338–347 347