the channel lining and pipeline deception …€¦ · 1 of 14 discussion paper version 1.0 7 august...
TRANSCRIPT

1 of 14
DISCUSSION PAPER Version 1.0 7 AUGUST 2009
THE CHANNEL LINING AND PIPELINE DECEPTION
IN VICTORIA’S NORTHERN FOODBOWL PROJECT
By Kevin Long1 & Chris Poynton
2
1 Kevin Long KEV Engineering, Bendigo www.thelongview.com.au [email protected]
2 Chris Poynton CP Research Services, Bendigo www.cp.org.au/research [email protected]
This paper aims to highlight fundamental flaws in the Victorian Government’s Foodbowl Modernisation project, with initial focus on the $270 million Channel Lining component. Channel Lining is an expensive and ineffective attempt to create water savings, and is fundamentally insolvent. Its primary purpose has been to help politically justify the taking of water to Melbourne via the North-South Pipeline.
The Channel Lining Project proposes capital expenditure of $400,000 per km of channel, in order to re-direct seepage flows that can only generate an extra $891 of revenue per km per year for water authorities. Clearly, this project can never pay for itself.
Channel Lining merely re-directs water away from its current use in the environment and local aquifers. Such water is not “saved ” but merely transferred from one use to another. In effect, Channel Lining is one of the most expensive forms of water trade ever devised.
This paper identifies numerous other problems within the Government’s broader $2 billion “Foodbowl Modernisation Project”, including :
(1) the death-trap design of plastic Channel Lining ; (2) much of the new infrastructure is at risk of becoming superfluous “stranded assets” ; (3) the questionable viability of the North-South Pipeline due to reducing water yields ; (4) the breaching of the principles of the Murray-Darling Basin Cap based on the false
definition of “water savings”.
A Royal Commission into the Foodbowl Project and North-South Pipeline is suggested.
Alternative infrastructure projects such as the “Waranga Basin Upgrade” could create “true water savings” that would yield more than twice the volume for less than 10% of the cost of Channel Lining. Any such water efficiencies must be retained in the Murray-Darling Basin to reduce the impact of current over-allocations and reducing water yield due to climate change.
CONTENTS
Section Headings
Appendix & Data Tables
1. Channel Lining Facts at a Glance ……………….
2. Emerging Losers within Foodbowl Modernisation
3. Further points on North South Pipeline …………...
4. Vic Govt has Circumvented the MDB Cap ..……...
5. Alternative Efficiencies – Waranga Basin Upgrade
6. Other Alternatives for Water Efficiencies …..……..
7. Conclusion .…………………………………………
2-3
4
5
6
7
8
9
Request for Assistance with Data ………………….
Table 1 Seepage Loss calculation for lined channels
Table 2 Comparison of overall operational losses
Table 3 “Channel Seepage” as a proportion of total “Operational Losses”
Table 4 Volumes of re-directed water available for North-South Pipeline with reducing long-term irrigation allocations
10
11
12
13
14
Full document can be downloaded from the authors’ websites (see top of page).
NOTE ON DATA CALCULATIONS: Calculations are based on limited official information sources
available at the time of publication, as attributed. Figures are to be cross-referenced as additional
project data is released by Victorian or Federal Governments, Goulburn-Murray Water, NVIRP etc.
Any person with additional or alternative data is encouraged to correspond with the authors.
p.
p.
The Channel Lining and Pipeline Deception by Kevin Long www.thelongview.com.au 2 of 14 in Victoria’s Northern Foodbowl Project Chris Poynton www.cp.org.au/research
Version 1.0 7 Aug 2009
DISCUSSION PAPER Version 1.0 7 AUG 2009
1. “CHANNEL LINING” FACTS AT A GLANCE
a) Project scope
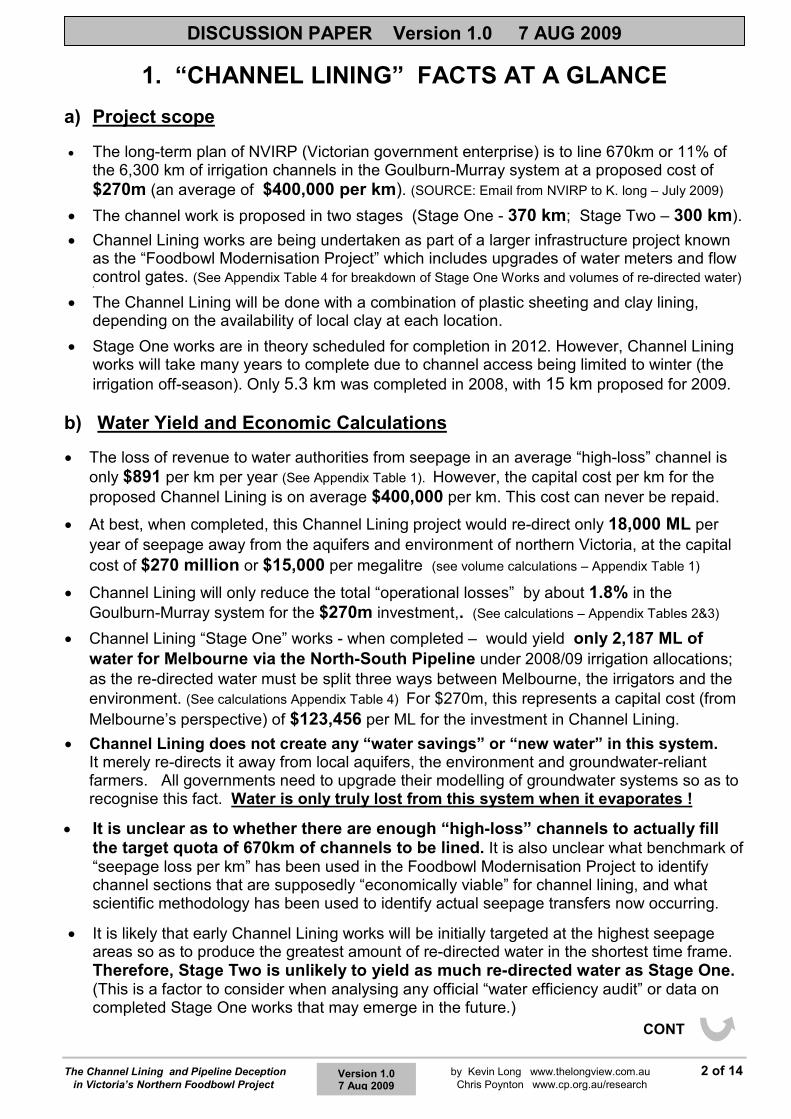
• The long-term plan of NVIRP (Victorian government enterprise) is to line 670km or 11% of the 6,300 km of irrigation channels in the Goulburn-Murray system at a proposed cost of $270m (an average of $400,000 per km). (SOURCE: Email from NVIRP to K. long – July 2009)
• The channel work is proposed in two stages (Stage One - 370 km; Stage Two – 300 km).
• Channel Lining works are being undertaken as part of a larger infrastructure project known as the “Foodbowl Modernisation Project” which includes upgrades of water meters and flow control gates. (See Appendix Table 4 for breakdown of Stage One Works and volumes of re-directed water) 4
• The Channel Lining will be done with a combination of plastic sheeting and clay lining, depending on the availability of local clay at each location.
• Stage One works are in theory scheduled for completion in 2012. However, Channel Lining works will take many years to complete due to channel access being limited to winter (the
irrigation off-season). Only 5.3 km was completed in 2008, with 15 km proposed for 2009.
b) Water Yield and Economic Calculations
• The loss of revenue to water authorities from seepage in an average “high-loss” channel is only $891 per km per year (See Appendix Table 1). However, the capital cost per km for the
proposed Channel Lining is on average $400,000 per km. This cost can never be repaid.
• At best, when completed, this Channel Lining project would re-direct only 18,000 ML per year of seepage away from the aquifers and environment of northern Victoria, at the capital
cost of $270 million or $15,000 per megalitre (see volume calculations – Appendix Table 1)
• Channel Lining will only reduce the total “operational losses” by about 1.8% in the Goulburn-Murray system for the $270m investment,. (See calculations – Appendix Tables 2&3)
• Channel Lining “Stage One” works - when completed – would yield only 2,187 ML of
water for Melbourne via the North-South Pipeline under 2008/09 irrigation allocations; as the re-directed water must be split three ways between Melbourne, the irrigators and the environment. (See calculations Appendix Table 4) For $270m, this represents a capital cost (from
Melbourne’s perspective) of $123,456 per ML for the investment in Channel Lining.
• Channel Lining does not create any “water savings” or “new water” in this system. It merely re-directs it away from local aquifers, the environment and groundwater-reliant farmers. All governments need to upgrade their modelling of groundwater systems so as to recognise this fact. Water is only truly lost from this system when it evaporates !
• It is unclear as to whether there are enough “high-loss” channels to actually fill the target quota of 670km of channels to be lined. It is also unclear what benchmark of “seepage loss per km” has been used in the Foodbowl Modernisation Project to identify channel sections that are supposedly “economically viable” for channel lining, and what scientific methodology has been used to identify actual seepage transfers now occurring.
• It is likely that early Channel Lining works will be initially targeted at the highest seepage areas so as to produce the greatest amount of re-directed water in the shortest time frame. Therefore, Stage Two is unlikely to yield as much re-directed water as Stage One. (This is a factor to consider when analysing any official “water efficiency audit” or data on completed Stage One works that may emerge in the future.)
CONT

The Channel Lining and Pipeline Deception by Kevin Long www.thelongview.com.au 3 of 14 in Victoria’s Northern Foodbowl Project Chris Poynton www.cp.org.au/research
Version 1.0 7 Aug 2009
DISCUSSION PAPER Version 1.0 7 AUG 2009
c) Environmental and design problems
• No environmental or social impact study was undertaken to check the design of the Channel Lining project.
• The loss of seepage supply (already demonstrated in test channel areas) has resulted in the death of adjacent trees and wetlands. Effects on local groundwater supplies have not been quantified.
• The proposed plastic Channel Lining is a proven death trap for wildlife and potentially humans as well due to the inability of most creatures to escape the slippery slopes of the plastic-sided walls. Current fencing systems are only designed to keep out large stock. A fenced 1.3 km plastic lined section (2km south-west of Merrigum) claimed twelve animal lives in just six weeks of winter 2009. (See Figure 1 below) If the same death rate was applied year-round, this would equate to 8,000 animal deaths per 100km of plastic lined channel per year. This is an alarming figure that cannot be condoned.
• NVIRP was forced to commission an independent review of this Channel Lining design. due to the current high animal death rate in completed trial sections and the unfavourable media commentary that resulted. The study, undertaken by La Trobe University, aimed to identify design modifications and improved safety measures to reduce the environmental impact on wildlife. The review was scheduled for completion in April 2009, but has not been finalised as of late July. NVIRP has stated in correspondence that it does not intend to publicly release the review document, despite the importance of the public safety issues involved.
• Despite the clear identification of the death trap design and risks due to inadequate fencing, no design changes have been made in plastic lining sections that are being installed during Winter 2009. There are obvious major unresolved public, environmental and legal risks associated with all of the plastic-lined channels constructed so far.
Fig 1.
“Death Trap” Channel Lining Design (installed 2007)
One of twelve drowned animals observed in a 1.3km plastic-lined channel section, 26 July 2009.
LOCATION: Approx 8m wide delivery channel. 2km south west of Merrigum.
NOTE: Inadequate safety ladder device that does not reach low water level. Ladders spaced only at approximately 200m intervals.
Figure 2.
Same “Death Trap” design - larger scale (under construction July 2009)
LOCATION: A 14m wide backbone channel being plastic-lined, 5 km north of Kyabram at Finlay Rd.
NOTE: Safety measures yet to be installed, possibly to include a modified access ladder design, as yet undisclosed.
1. “CHANNEL LINING” FACTS AT A GLANCE” Cont …

The Channel Lining and Pipeline Deception by Kevin Long www.thelongview.com.au 4 of 14 in Victoria’s Northern Foodbowl Project Chris Poynton www.cp.org.au/research
Version 1.0 7 Aug 2009
DISCUSSION PAPER Version 1.0 7 AUG 2009
2. EMERGING LOSERS IN FOODBOWL MODERNISATION In addition to the Channel Lining issues identified previously, there are many problems emerging in the broader $2 billion Foodbowl Modernisation Project - showing that the project may not be having its intended social, economic and environmental benefits.
COSTS SHIFTED TO CHANNEL IRRIGATORS
• Allocation volumes to irrigators delivered through the newly upgraded water meters have been reduced by an average of 8% (without compensation).
• Additional annual maintenance charges of approximately $1,500 are proposed to be levied on each new high-tech water meter. (Most irrigators will have multiple meters e.g. 3-6).
• The privatisation of small “spur channels” means that the cost burden of channel losses (i.e. evaporation and seepage) is transferred to private farmers. This reduces economic viability and increases the likelihood of farm shut-downs. Some short-term compensation may be provided by the State Government, however the details are not known to the authors.
CREATION OF STRANDED ASSETTS
• The new water meters and lined channel sections are in increasing danger of becoming “stranded assets”, as many farmers sell their water or cease farming operations due to higher costs, climate change, reduced irrigation allocations and decreased farm returns.
FREEDOM OF INFORMATION
• Very little information has been publicly released about the water yield data to back the claims made by the Victorian Government regarding water efficiencies in the Foodbowl Modernisation Project. There is little disclosure as to the detailed expenditure of the works and their scheduled timeframes for completion. For instance, the website for NVIRP (the responsible authority) is limited to basic public relations outlines, rather than operational detail that would inform local communities of the works in progress.
THE NORTH-SOUTH PIPELINE
• The Foodbowl Modernisation project’s primary function is to politically justify the extraction of 75,000 ML per year from the Murray-Darling Basin to Melbourne via the North-South Pipeline. The extraction of this water is a back-door policy forbidden in principal by the 1994 MDB Cap.
(Projected volume as described by Minister for Planning on 21.12.2007 in “Sugarloaf Interconnector: Reasons for Decision under Environmental Effects Act”).
• The proposed volume of 75,000 ML of re-directed water is an optimistic estimate by the State Government based on a foolhardy assumption of continued long-term average inflows and irrigation allocations of 130%.
• However, the current inflow trends for Lake Eildon indicate that less than 33% average allocations can be expected in the foreseeable future due to climate and catchment change. Therefore the proposed water volumes are not available. Furthermore the odds of this system recovering to the original allocation levels in the foreseeable future are very low.
• Based on a continuation of 2008/09 allocations and a possible 15% allocation in 2009/10 …
Melbourne would receive only 11,000 to 21,500 ML via the North-South Pipeline
with expected reducing trends into the future. (See calculations in Appendix Table 4)
DUE TO CLIMATE TRENDS, THIS ENTIRE PROJECT IS INSOLVENT.

The Channel Lining and Pipeline Deception by Kevin Long www.thelongview.com.au 5 of 14 in Victoria’s Northern Foodbowl Project Chris Poynton www.cp.org.au/research
Version 1.0 7 Aug 2009
DISCUSSION PAPER Version 1.0 7 AUG 2009
3. FURTHER POINTS ON NORTH-SOUTH PIPELINE
Because the Channel Lining project has been used as a bargaining chip to justify the main project of taking water to Melbourne by the North-South Pipeline, it is appropriate to comment on the larger impacts and context of the Pipeline – i.e. “the larger deception”.
The North-South Pipeline is inherently an “anti-regional” project with the proposed extraction of 75,000 ML to Melbourne only hastening the demise of agricultural society in northern Victoria. Irrigation and recreation industries in northern Victoria have already suffered a 50% shutdown due to the 75% reduction in water in recent years. (Estimate – K. Long)
Of the water intended for the North-South pipeline from Stage One Foodbowl
Modernisation: 63% is to be taken from the environment by the reduction of channel
through-flow and the use of channel lining. The remaining 37% of the water is to be taken directly from irrigators without compensation via the installation of upgraded water meters.
(See calculations in Appendix Table 4).
Any water taken to Melbourne from Eildon creates a magnified reduction in the allocations for irrigators and the environment.
Lake Eildon is becoming increasingly stressed. Its long-term average inflow is around 50% of its capacity per year. However, in the low-rainfall year of 2006 (a likely indicator of 2009 and future El Nino years) it received inflows of only 4%. Its future inflows will be further reduced by the recent bushfire damage to the majority of the Eildon catchment. Therefore … Lake Eildon is shaping up to join the long list of recently failed reservoirs and lakes in northern Victoria
(e.g. Reservoirs - Grampians, Cairn Curran, Eppalock … Lakes – Charm, Mokoan, Meran, Boga, Boort, Cooper; Marshes – Johnsons, Hirds … Swamps - Tragowel, Murphy, Redgum …etc.)
In the event that the State Government insists on extracting up to 75,000 ML from a failing Lake Eildon, basic concerns are raised as to the ability to supply “Water for Critical Human Needs” in northern Victoria.
This category of emergency water allocation prescribed by federal legislation is required to supply domestic and basic industrial needs (including some component of food production) for all communities in the Murray-Darling Basin. Water for Critical Human Needs will be managed in other states from 2011 by the recently formed Murray Darling Basin Authority, but will remain in the hands of the Victorian government till 2019 as a result of a murky deal Victoria struck with other states in the formation of the Murray-Darling Basin Authority. This is a significant concern, given the Victorian Government’s track record of management of the North-South Pipeline and water resources generally in the northern region of Victoria. A key example of this was the failure to carry out the legislated 15-year review of the disastrously failing Bulk Water Entitlement in 2004, and the postponement of such a review till 2019.
The North-South Pipeline and Foodbowl Project deserve to be the subjects of a major public enquiry such as a Royal Commission.
Areas deserving public investigation include: (a) the due diligence carried out by the project investors (i.e. Melbourne Water, G-M Water, State Government and Federal Government); (b) the environmental approvals process; (c) the circumvention of the principles of the Murray-Darling Basin Cap; (d) the climate models used that failed to heed the declining rainfall trends since the mid-1970’s and the sharper decline in the last 15 years; (e) the State Government’s failure to undertake the scheduled 2004 review of the Bulk Water entitlement (f) the overall sustainability of agriculture and communities in northern Victoria in the short and long term.
Channel Lining has been used to prop up the larger deception of the North-South Pipeline.
The extraction of water from the Murray-Darling Basin must be stopped.

The Channel Lining and Pipeline Deception by Kevin Long www.thelongview.com.au 6 of 14 in Victoria’s Northern Foodbowl Project Chris Poynton www.cp.org.au/research
Version 1.0 7 Aug 2009
DISCUSSION PAPER Version 1.0 7 AUG 2009
4. VICTORIAN GOV’T CIRCUMVENTS “THE MDB CAP”
PRINCIPLES OF THE “MURRAY-DARLING BASIN CAP”
• In 1994/95 the Murray-Darling Basin (MDB) Cap was adopted by the Commonwealth, Victoria, NSW, Queensland, South Australia and the ACT.
• This Cap was essentially and primarily designed to halt the growth in water diversions and to prevent additional over-allocation throughout the MDB.
• The current rules associated with the MDB do not allow any allocated water to be exported out of the MDB.
• The Victorian Government’s supposed commitment to the founding principle of the Cap is stated in its recent “Draft Northern Region Sustainable Water Strategy” (DSE, Oct 2008) …
However … the Victorian Government’s rhetoric does not match its actions !!
THE CAP WAS INTENDED TO STOP PROJECTS LIKE THE NORTH-SOUTH PIPELINE
The extraction of water via North-South Pipeline clearly increases the over-allocation already occurring in the Murray-Darling Basin. Any allocation delivered to Melbourne directly reduces the volume of water available for allocation to irrigators and the environment.
It is beyond the scope of this paper to explain how the Victorian Government has circumvented the enforcement of the MDB Cap and gained permission from other MDB States and the Commonwealth to undertake water extractions from the MDB via the North-South Pipeline.*
* A dangerous precedent for the North-South Pipeline was set when the Goldfields “Superpipe” was extended to Ballarat (outside the MDB) in 2008. In that case, water which was clearly allocated (i.e. purchased from willing sellers) was delivered outside the MDB without the charade of “water savings” being claimed to justify it.
THE FALSE DEFINITION OF “WATER SAVINGS”
In reality, “true water savings” are only achieved by eliminating Evaporation Losses.
The Victorian Government has claimed that it will achieve a total of 225,000 ML of “water savings” with Stage One of the Foodbowl Modernisation Project. However, the project merely “re-directs” water from existing uses by the following methods: (Volume details in Appendix Table 4):
56% by “Reduced Channel Through-flow” ---- taken from environment / river flows 37% by “Water Meter Upgrades” ---- taken directly from irrigators’ volumes 7% by “Channel Lining” ---- taken from environment / ground-water
The Government seems to be operating on the principle that : “If water can be identified that wasn’t previously measured and paid for, then it can be claimed as ‘new water’ – not subject to the 1994 MDB Cap – and therefore available to be taken out of the Murray-Darling Basin.”
The Government’s reasoning and its definition of “water savings” or “new water” is clearly out of step with on-ground realities and community expectations.
“Under [the Murray-Darling Basin Cap] Victoria does not issue any new
entitlements or licenses unless water is created from water savings projects ….
Water recovery initiatives are required to address existing over-allocation.” p. 33

The Channel Lining and Pipeline Deception by Kevin Long www.thelongview.com.au 7 of 14 in Victoria’s Northern Foodbowl Project Chris Poynton www.cp.org.au/research
Version 1.0 7 Aug 2009
DISCUSSION PAPER Version 1.0 7 AUG 2009
5. IMPROVED WATER EFFICIENCIES CAN BE ACHIEVED WITH THE “WARANGA BASIN UPGRADE”
A containment channel around the vast flat expanse of the Waranga Basin would
yield more than twice the water, for less than 10% of the cost of Channel Lining. Summary
The evaporation and seepage losses presently occurring in the operation of Waranga Basin are approximately 50,000 ML per year or 9% of total operational losses in the Goulburn-Murray system (as shown in Appendix Tables 2&3). The vast proportion of this loss is evaporation due to the shallow, wide open expanse of the Waranga Basin..
At recent water-trade prices the water loss from Waranga is valued at $15m per year. An additional $3m of costs is incurred to pump out the last 28% at the end of each season.
The Waranga Upgrade will create “real water savings” by eliminating 40,000ML (i.e 80%) of these losses per year – mostly evaporation (whereas Channel Lining does not reduce evaporation losses and merely re-directs seepage water away from local users).
The Waranga Upgrade could be completed with a few months of simple earthworks – even during the irrigation season - rather than the many years required for the Channel Lining Project.
Basic costing for the Waranga Upgrade is $20-30m -- paying for itself in two dry years.
Design Option (Concept Calculations by K. Long)
The Waranga Upgrade requires a single horseshoe-shaped bank (approx 23km long x 4 m high) to run along a contour line approximately 400 metres inside the high water mark of the Basin. This would create a partition between the upper and the lower levels of the Basin.
The upper level will form a channel reservoir connecting the two eastern inflow channels with the two western outflow channels. The 18,000 ML capacity of the upper level will provide an operational inflow/outflow buffer for the Basin. If large inflows are received, the overflow from the 18,000 ML upper level can be stored as usual in the lower level of the Basin (up to 414,000 ML). This overflow water would be the first water used in the irrigation season, thus eliminating most of the high summer evaporation losses.
This design would also maintain a year-round environmental ecosystem and provide for recreational use in the upper level Basin within 400 metres of the high-water mark.
Project Status and Urgency
Planning for the Waranga Upgrade was commenced by Coliban Water in 2008 – presumably to be implemented as an emergency measure, if and when it becomes clear that a low or zero irrigation allocation is imminent from Lake Eildon. Such a situation of low-allocation would mean the Waranga Basin would not be maintained at a high enough capacity to ensure the necessary delivery of water for the Goldfields Superpipe system.
A Waranga Bypass in some form would therefore be the only efficient method of delivering water for Central Victoria from Eildon. Otherwise, the loss of 50,000 ML from Waranga would have to be incurred, and would in effect reduce future irrigation allocations.
Waranga water savings need to be retained in the Murray-Darling Basin.
These savings are needed to off-set the enormous loss of water yield resulting from recent fire damage to the Eildon catchment.

The Channel Lining and Pipeline Deception by Kevin Long www.thelongview.com.au 8 of 14 in Victoria’s Northern Foodbowl Project Chris Poynton www.cp.org.au/research
Version 1.0 7 Aug 2009
DISCUSSION PAPER Version 1.0 7 AUG 2009
6. OTHER ALTERNATIVE PROJECTS TO ACHIEVE WATER EFFICENCIES ACROSS VICTORIA
Apart from the Waranga Basin Upgrade (described previously), there are other cost-effective water saving methods that can be implemented across the state, such as:
• CHANNEL PIPING RATHER THAN LINING
Underground piping of existing channels would eliminate evaporation losses (which in most channels are greater than seepage losses). Piping eliminates the “death trap risk” of plastic-lined channels, which can otherwise never be satisfactorily eliminated.
Such works have already been undertaken on some channel sections in the Goulburn-Murray system by G-M Water (e.g. approximately 15 km of piping near Katandra).
• PROGRESSIVE ELIMINATION OF SMALL FARM DAMS
(Including installation of piped stock and domestic water supply).
Targeted to properties in upper reaches of reservoir catchments e.g. Eppalock catchment small dams capture approximately 40,000 ML per year. Such piped systems have been installed throughout the north-west of Victoria (Mallee).
• THE SHUTDOWN OF SELECTED IRRIGATION CHANNELS
(Including installation of piped stock and domestic water supply)
This is a method of converting stranded irrigation areas into productive dryland agriculture. e.g pilot project under investigation by NVIRP on shutdown of 16km channel near Lake Tutchewop, proposed to yield 700-1000 ML (North West Farmer, June 2009, p.1)
• THE CAPTURE AND RECYCLING OF URBAN STORMWATER
This could make a number of cities more self-sufficient for their water needs (e.g. Bendigo, Melbourne). See: “Bendigo Storm Water Resource” paper by Kevin Long available from www.thelongview.com.au
• APPLYING EVAPORATION RETARDANTS TO THE SURFACE OF WATER BODIES
This reduces the ongoing evaporation losses, which are increasing due to climate change. e.g. “Aquataine” silicon food-grade liquid product claimed by manufacturers to cost $100 per ML of saved water. (Suitable for small to medium water bodies)
Expenditure on water infrastructure needs to be re-balanced across the state.

The Channel Lining and Pipeline Deception by Kevin Long www.thelongview.com.au 9 of 14 in Victoria’s Northern Foodbowl Project Chris Poynton www.cp.org.au/research
Version 1.0 7 Aug 2009
DISCUSSION PAPER Version 1.0 7 AUG 2009
7. CONCLUSIONS
1. Channel Lining is an enormously expensive and ineffective attempt to improve water efficiencies and does nothing to improve the economic and environmental sustainability of the Goulburn Murray region.
Channel Lining serves only to re-direct water away from existing irrigators and the environment.
2. The $270m expenditure on Channel Lining to re-direct at best 18,000 ML of water per year means that this project can never recover its costs and is insolvent.
The loss of revenue to water authorities from seepage in an average “high-loss” channel is only $891 per km per year. However, the capital cost per km for the proposed Channel Lining is on average $400,000 per km. This cost can never be repaid.
3. Channel Lining has been used for cynical political purposes to help justify the main project of extracting water for Melbourne via North-South Pipeline.
The Pipeline is an “anti-regional” project that increases the stress on the Lake Eildon system which – like many other systems - is in the process of collapsing and can no longer meet the requirements of existing allocations.
4. Claims that the Channel Lining project creates “water savings” or “new water” are entirely false.
These claims have been promoted by the State Government as a technicality and a smokescreen to help it circumvent the principles of the Murray-Darling Basin Cap (the correct enforcement of which would otherwise have prohibited the extraction of water to Melbourne via the North-South Pipeline.)
5. The State Government has a duty of care to respect the Murray-Darling Casin Cap and support by every means possible the agricultural communities in the MDB.
Any water efficiencies that can be achieved must be retained in the Murray-Darling Basin as per the principles of the MDB Cap. Water efficiency improvements are needed to off-set the current over-allocation, compounded by the negative impacts of climate change, catchment change and recent bush-fire damage.
6. There are many other projects that will achieve much greater water efficiencies than Channel Lining – for instance the Waranga Basin upgrade.
The Waranga Upgrade will provide twice the water for 10% of the cost of Channel Lining. Other projects capable of major efficiencies include: piped stock and domestic systems, removal of small farm dams, shutdown of uneconomic irrigation channels, recycling of urban stormwater, and use of evaporation retardants on water bodies.
7. A major public enquiry (including a Royal Commission) is necessary to investigate the climate crisis trends currently unfolding in northern Victoria; including the requirements for short and long-term sustainability of the region’s agriculture and rural communities. [ See suggested terms of reference on p.5 ]
The issues raised in this paper add to the information already in the public domain, illustrating that a major economic and political deception has been played out around the North-South Pipeline, Channel Lining and the Foodbowl Modernisation Project. Greater public awareness is required so as to bring about the policy changes necessary to manage the evolving climate conditions.

The Channel Lining and Pipeline Deception by Kevin Long www.thelongview.com.au 10 of 14 in Victoria’s Northern Foodbowl Project Chris Poynton www.cp.org.au/research
Version 1.0 7 Aug 2009
DISCUSSION PAPER Version 1.0 7 AUG 2009
APPENDIX SECTION
REQUEST FOR ASSISTANCE WITH DATA Very little detailed data has been released by the Victorian Government on the projected volumes of re-directed water that can be achieved with Channel Lining, Foodbowl Modernisation and the North-South Pipeline. The following Appendices use information from a limited number of attributed official sources, as well as some degree of extrapolation and estimation. A detailed information request has been lodged with Goulburn-Murray Water in May 2009 to fine-tune these figures (including a request for the most recent results of channel seepage testing). A delay of some months has been advised by GM-W in responding to the request. It is understood that data on Channel Losses for the proposed 670 km channel sections may have been requested from the Victorian Government / NVIRP by the Federal Minister for Climate Change and Water (Senator Penny Wong) in June 2008 as part of the due diligence required prior for Federal funding of the Foodbowl Modernisation Program Stage Two. It is not known to the authors whether such information will be released publicly as a matter of course.
If and when such official data becomes available, the estimates and calculations in this paper will be reviewed and updated as necessary.
If you, the reader of this document, have any information on the accuracy of these figures or advice on other data sources,
please forward your comments to:
Kevin Long EMAIL: [email protected]
tel (03) 5441 2394 WEBSITE: www.thelongview.com.au

The Channel Lining and Pipeline Deception by Kevin Long www.thelongview.com.au 11 of 14 in Victoria’s Northern Foodbowl Project Chris Poynton www.cp.org.au/research
Version 1.0 7 Aug 2009
DISCUSSION PAPER Version 1.0 7 AUG 2009
TABLE 1 Seepage Loss estimate for 670 km of “high-loss” channels
to be plastic- and clay-lined in the Goulburn-Murray system
These estimates of Seepage Loss for 670 km of Stage One and Two Channel Lining Works have been extrapolated from limited official data available to the authors at time of publication.
This methodology is offered as a way of cross-referencing and comparing any official data on “high seepage loss channels” that may be released in the future.
DATA SOURCES: (a) ANCID Report (Australian National Committee on Irrigation and Drainage, Jan 2003) “Open Channel Seepage and Control Vol 1.4 – Best Practice Guidelines for Channel Seepage Identification and Measurement” p 47 (b) Estimate by K Long, awaiting confirmation in Goulburn-Murray Water data request.
NOTES ON SEEPAGE TEST DATA:
The ANCID Report 2003 (a) provides Seepage Loss data from eleven Goulburn-Murray pondage test sites in the Waranga
Western Channel, as well as 40 other “high loss” channel sections in other Victorian and NSW irrigation districts. These channel test sites were chosen due to their high-loss characteristics.(i.e. “geological indicators of high-seepage”). Seepage for the Waranga Channel sites ranged from 1-13 mm per day, with an average of 5mm per day. “Generally the term Channel Seepage refers to both seeped and leaked water, as the two are not easily separated.” (ANCID Glossary online).
An average of 7mm Seepage per day for “high loss” channels has been applied in the estimation process in the table above, as this provides a 40% buffer above the average recorded by ANCID for the eleven Goulburn-Murray “high loss” channel sections. The figure of 7mm of Seepage Loss per day has also been chosen as it is the average figure recorded in the same ANCID report for 45 “high loss” channel sections tested in a range of irrigation districts (excluding the tests conducted in extremely sandy soil type channels in the Donald/Mallee area.)
Average seepage losses across the 670km of “high loss” G-MW channels may be considerably less than the figure of 7mm per day selected from the ANCID Report. Therefore, the 17,915 ML of seepage loss estimated for the 670km of lined channels may be higher than is actually occurring in the channels. It is unclear what methodology or thresholds of Seepage Loss are being used by the Victorian Government to identify its quota of 670 km of “high-loss” channels to be lined, and whether this data and methodology will be made publicly available.
CALCULATION
DEFINITION
7 mm of water per day
Daily Seepage Loss estimate for “high-loss” G-M Channels, based on “above average” results of ANCID “pondage tests” (a)
x 273 days Number of Days in full irrigation Season
=
1.91 m per year
Average Annual Seepage Loss for “high loss” G-M Channels
14 m Average Channel Width (b)
x 670 km Total Proposed Length of Channel Lining Sections
=
938 hectares
Total Surface Area of 670 km of Channel Lining Sections
1.91 m
Average Annual Seepage Loss for “high-loss” G-M Channels
x
938 hectares
Total Surface Area of 670 km of Channel Lining Sections
= 17,915 ML
TOTAL SEEPAGE FOR 670 km OF AVERAGE “HIGH-LOSS” CHANNELS IN A FULL IRRIGATION SEASON
BREAKDOWN : STAGE 1 (370 km) = 9,853 ML STAGE 2 (300 km) = 8,061 ML
Therefore, an average “high-loss” 14 m wide channel loses 27 ML of seepage per km
in a full irrigation season. This represents just $891 of lost revenue to water authorities
( i.e. based on $33 per ML in service charges and usage fees, as per standard allocated water delivery pricing )
The Channel Lining and Pipeline Deception by Kevin Long www.thelongview.com.au 12 of 14 in Victoria’s Northern Foodbowl Project Chris Poynton www.cp.org.au/research
Version 1.0 7 Aug 2009
DISCUSSION PAPER Version 1.0 7 AUG 2009
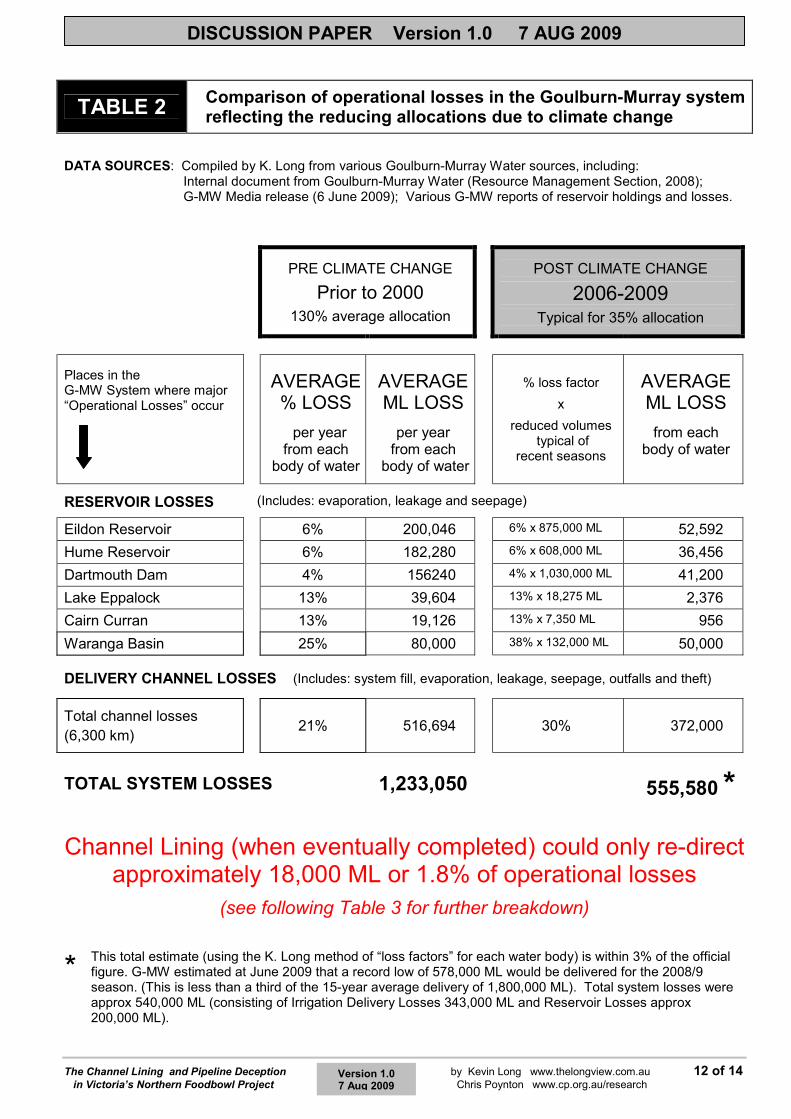
TABLE 2
Comparison of operational losses in the Goulburn-Murray system reflecting the reducing allocations due to climate change
DATA SOURCES: Compiled by K. Long from various Goulburn-Murray Water sources, including: Internal document from Goulburn-Murray Water (Resource Management Section, 2008);
G-MW Media release (6 June 2009); Various G-MW reports of reservoir holdings and losses.
PRE CLIMATE CHANGE
Prior to 2000
130% average allocation
POST CLIMATE CHANGE
2006-2009
Typical for 35% allocation
Places in the G-MW System where major “Operational Losses” occur
AVERAGE % LOSS
per year from each
body of water
AVERAGE ML LOSS
per year from each
body of water
% loss factor
x
reduced volumes typical of
recent seasons
AVERAGE ML LOSS
from each body of water
RESERVOIR LOSSES
Eildon Reservoir 6% 200,046 6% x 875,000 ML 52,592
Hume Reservoir 6% 182,280 6% x 608,000 ML 36,456
Dartmouth Dam 4% 156240 4% x 1,030,000 ML 41,200
Lake Eppalock 13% 39,604 13% x 18,275 ML 2,376
Cairn Curran 13% 19,126 13% x 7,350 ML 956
Waranga Basin 25% 80,000 38% x 132,000 ML 50,000
DELIVERY CHANNEL LOSSES
Total channel losses
(6,300 km)
21% 516,694 30% 372,000
TOTAL SYSTEM LOSSES 1,233,050 555,580 *
Channel Lining (when eventually completed) could only re-direct approximately 18,000 ML or 1.8% of operational losses
(see following Table 3 for further breakdown)
* This total estimate (using the K. Long method of “loss factors” for each water body) is within 3% of the official figure. G-MW estimated at June 2009 that a record low of 578,000 ML would be delivered for the 2008/9 season. (This is less than a third of the 15-year average delivery of 1,800,000 ML). Total system losses were approx 540,000 ML (consisting of Irrigation Delivery Losses 343,000 ML and Reservoir Losses approx 200,000 ML).
(Includes: system fill, evaporation, leakage, seepage, outfalls and theft)
(Includes: evaporation, leakage and seepage)
The Channel Lining and Pipeline Deception by Kevin Long www.thelongview.com.au 13 of 14 in Victoria’s Northern Foodbowl Project Chris Poynton www.cp.org.au/research
Version 1.0 7 Aug 2009
DISCUSSION PAPER Version 1.0 7 AUG 2009
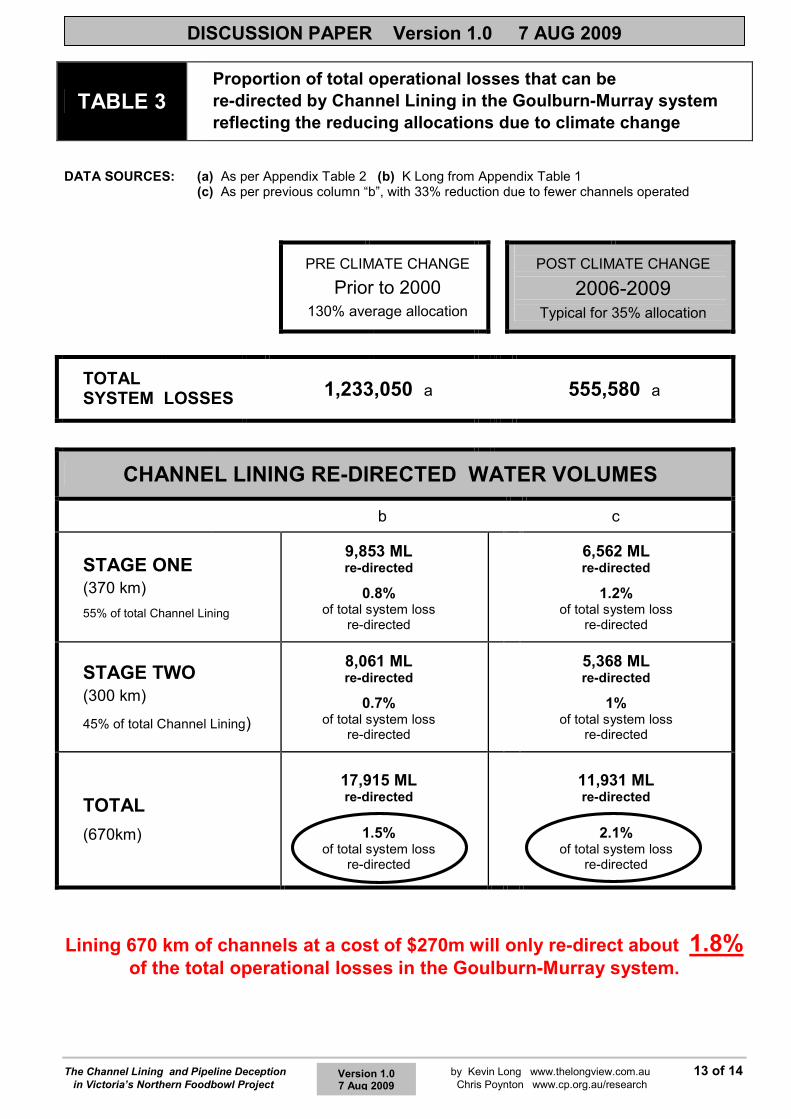
TABLE 3
Proportion of total operational losses that can be
re-directed by Channel Lining in the Goulburn-Murray system
reflecting the reducing allocations due to climate change
DATA SOURCES: (a) As per Appendix Table 2 (b) K Long from Appendix Table 1 (c) As per previous column “b”, with 33% reduction due to fewer channels operated
PRE CLIMATE CHANGE
Prior to 2000
130% average allocation
POST CLIMATE CHANGE
2006-2009
Typical for 35% allocation
TOTAL SYSTEM LOSSES
1,233,050 a 555,580 a
CHANNEL LINING RE-DIRECTED WATER VOLUMES
b c
STAGE ONE
(370 km)
55% of total Channel Lining
9,853 ML re-directed
0.8% of total system loss
re-directed
6,562 ML re-directed
1.2% of total system loss
re-directed
STAGE TWO
(300 km)
45% of total Channel Lining)
8,061 ML re-directed
0.7% of total system loss
re-directed
5,368 ML re-directed
1% of total system loss
re-directed
TOTAL
(670km)
17,915 ML re-directed
1.5% of total system loss
re-directed
11,931 ML re-directed
2.1% of total system loss
re-directed
Lining 670 km of channels at a cost of $270m will only re-direct about 1.8% of the total operational losses in the Goulburn-Murray system.

The Channel Lining and Pipeline Deception by Kevin Long www.thelongview.com.au 14 of 14 in Victoria’s Northern Foodbowl Project Chris Poynton www.cp.org.au/research
Version 1.0 7 Aug 2009
DISCUSSION PAPER Version 1.0 7 AUG 2009
TABLE 4 Volumes of re-directed water available for North-South Pipeline
from Stage One “Foodbowl Modernisation” works reflecting reducing allocations due to climate change
Stage One of the Foodbowl Modernisation Project (proposed for completion by 2012) forms the basis of the water volumes that will be extracted to Melbourne via the North South Pipeline.
Stage One Works are in three categories and consist of: Installation of automated flow gates
across system; Installation of new water meters across 50% of system; 370km of channel lining.
(SOURCE: NVIRP Annual Report 2007/2008; and NVIRP correspondence to K. Long July 2009)
NOTE: This table does not take into account water volumes that may be re-directed from the privatisation or shut-down of irrigation channels, as the role of such water volumes in Stage One was unclear to the authors at time of publication. This data will be integrated if and when appropriate. The authors invite correspondence on this issue.
NOTES ON CALCULATIONS: (a) Extrapolated from “b”. (b) Goulburn-Murray Water Media release (6 June 2009) (c) Water re-direction equivalent to 6% of Total System Allocation Delivered. Assumes that Channel Throughflow has dropped from 7% to 1% across entire system due to 100% installation of automated gates. (d) Water re-direction equivalent to 4% of Total System Allocation Delivered. Assumes 8% reduction in Water Meter Delivery Volume compared to old Dethridge meters, applied across 50% of the system. (e) Seepage estimate for Stage One 370km Channel Lining calculation by K. Long based on data from ANCID Report (See Appendix Table 1 for methodology). (f) A 33% reduction of “e” to reflect reduced channel operations and length of irrigation season. (g) A 66% reduction of “e” to reflect reduced channel operations and length of irrigation season
1. 2. 3. 4.
CLIMATE SCENARIO LONG-TERM
AVERAGE
15 YEAR AVERAGE
CLIMATE CHANGE
INDICATOR
TYPICAL EL NINO YEAR ??
1909 –2009 1994-2009 2008/09 2009/10 ����
% IRRIGATION ALLOCATION FOR SEASON 130 % 106 % 34 % 15%
Total System Allocation Delivered (ML) 2,210,000 a 1,800,000 b 578,000 b 300,000 a
SOURCES OF RE-DIRECTED WATER FROM WITHIN “FOODBOWL PROJECT” – STAGE 1
Reduced Channel Through-flow
Total ML of re-directed water from this source : 132,600 c 108,000 c 34,680 c 18,000 c
Represents % portion of all re-directed water : 57% 57% 54% 54%
One -Third Share for Melbourne : 44,200 36,000 11,559 6,000
Upgrade of Water Meters
Total ML of re-directed water from this source : 88,400 d 72,000 d 23,120 d 12,000 d
Represents % portion of all re-directed water : 38% 38% 36% 36%
One -Third Share for Melbourne : 29,466 24,000 7,707 4,000
Channel Lining
Total ML of re-directed water from this source : 9,853 e 9,853 e 6,569 f 3,284 g
Represents % portion of all re-directed water : 4% 5% 10% 10%
One -Third Share for Melbourne : 3,284 3,284 2,190 1,095
TOTAL OF RE-DIRECTED WATER FROM “STAGE ONE” WORKS
Total ML re-directed water from all sources : 230,853 189,853 64,369 33,284
One -Third Share for Melbourne : 76,951 63,284 21,456 11,095
i.e Water re-directed from irrigators by new water meters
i.e. Channel Seepage and Leakage re-directed from environment (groundwater re-charge)
On current climate scenarios, Melbourne would receive only 11,000 to 21,500 ML of water via the North-South Pipeline … not the 75,000 ML claimed by the State Government.
i.e. Water re-directed from environment by new automated gate control